Embed Size (px)
Citation preview

Towards A Better Understanding of Workload Dynamics on Data-Intensive
Clusters and Grids
Hui Li∗ Lex WoltersLeiden Institute of Advanced Computer Science (LIACS),
Leiden University, PO Box 9512, 2333 CA,Leiden, The Netherlands
Abstract
This paper presents a comprehensive statistical analysis
of workloads collected on data-intensive clusters and Grids.
The analysis is conducted at different levels, including Vir-
tual Organization (VO) and user behavior. The aggregation
procedure and scaling analysis are applied to job arrival
processes, leading to the identification of several basic pat-
terns, namely, pseudo-periodicity, long range dependence
(LRD), and (multi)fractals. It is shown that statistical mea-
sures based on interarrivals are of limited usefulness and
count based measures should be trusted instead when it
comes to correlations. We also study workload characteris-
tics like job run time, memory consumption, and cross cor-
relations between these characteristics. A “bag-of-tasks”
behavior is empirically proved, strongly indicating tempo-
ral locality. We argue that pseudo-periodicity, LRD, and
“bag-of-tasks” behavior are important workload properties
on data-intensive clusters and Grids, which are not present
in traditional parallel workloads. This study has important
implications on workload modeling and performance pre-
dictions in data-intensive Grid environments.
1. Introduction
Grid computing is rapidly evolving as the next-
generation platform for system-level sciences and beyond.
The participating clusters serve as the main horse power in
a data-intensive Grid and performance evaluation studies in
such an environment require better understandings on its
workload dynamics. The goal of this paper is to study the
statistical properties of Grid workloads at different levels,
which serve as the basis for workload modeling and perfor-
mance predictions.
∗Corresponding author. Email address: [email protected]. Web-
page: http://www.liacs.nl/home/hli.
1-4244-0910-1/07/$20.00 c©2007 IEEE.
The contribution of this work is four-folds. Firstly, to
our best knowledge this is the first comprehensive workload
characterization on production clusters and Grids, at differ-
ent levels including VO and user behavior. Secondly, point
processes are introduced to describe job arrivals and several
representations are studied. It is shown that statistical mea-
sures based on interarrivals are of limited usefulness when it
comes to autocorrelations and count based measures should
be trusted instead. Thirdly, the aggregation procedure and
scaling analysis on job count processes enable us to under-
stand the autocorrelation structures better. Together with the
cross-correlations between characteristics, we obtain an im-
proved understanding towards workload dynamics. Last but
not least, we identify several basic patterns, such as pseudo-
periodicity, long range dependence, and “bag-of-tasks” be-
havior. These are important properties which are not present
in previous studies on parallel workloads [7]. Further re-
search on workload modeling on Grids should potentially
capture these salient properties, which could have signifi-
cant implications on performance evaluation studies.
The rest of this paper is organized as follows. Section 2
describes workloads in a broader perspective. Related work
on parallel supercomputer workloads, network traffic, and
cluster workloads are reviewed and discussed. Section 3 in-
troduces the definition and methodology used for the anal-
ysis. Section 4 presents the empirical studies on the real-
world workload data. We analyze a variety of workloads
at the Grid, cluster, and supercomputer level. VO and user
behavior are investigated in depth. In Section 5 the nature
and origin of workload dynamics are explained and impli-
cations on modeling and predictions are discussed. Conclu-
sions and future work are presented in Section 6.
2 Workloads in a Broader Perspective
The most closely related workload studies are from par-
allel supercomputers. On single parallel machines a large

amount of workload data has been collected, character-
ized [18, 25, 7], and modeled [6, 18, 24]. These are solid
research results and they are being used extensively for
performance evaluation on parallel machines [1]. How-
ever, it should be noted that previous work focus mainly
on marginal and first order statistics while correlations and
second order statistics receive far less attention. The rea-
son could be that characteristics on parallel workloads are
inherently weakly-autocorrelated or short range dependent
(SRD). For instance, our analysis is conducted on a rep-
resentative parallel workload and it is shown that the job
arrivals at larger scales are indeed short range dependent.
Data-intensive workloads on clusters and Grids, on the
other hand, exhibit pseudo-periodic and long range depen-
dent behavior. Therefore second order statistics and beyond
are crucial in the analysis and new methodologies should be
investigated for workload analysis/modeling in Grids.
Network traffic studies are reviewed here because it in-
cludes a rich collection of advanced statistic tools for an-
alyzing and modeling self-similar, long range dependent
(LRD), and (multi)fractal behavior. The self-similar nature
of Ethernet traffic is discovered in [12] and consequently a
set of exact self-similar models such as fractional Brown-
ian motion and fractional Gaussian noise are proposed as
traffic models [20, 26]. Network traffic is also shown to
be long range dependent, exhibiting strong temporal bursti-
ness [23, 2]. Both self-similar and LRD processes are most
well-known examples of general scaling processes, charac-
terized by the scaling and power law behavior [3]. Due to
its inherent multi-resolution nature, wavelets is proposed as
an important tool for analysis and synthesis of processes
with scaling behavior [4, 27, 3]. Multifractal models and
binomial cascades are proposed for those processes with
rich fractal behavior beyond second-order statistics [22, 9].
These methodologies enable us to conduct scaling analysis
on Grid job arrivals and identify several important patterns.
Workload characterization on clusters with marginal
statistics can be found in [14, 19]. In [19] an ON-OFF
Markov model is proposed for modeling job arrivals, which
is essentially equivalent to a two-phase hyperexponential
renewal process. The major modeling drawback using re-
newal processes is that the autocorrelation function (ACF)
of the interarrival times vanishes for all non-zero lags so
they cannot capture the temporal dependencies in time se-
ries [11]. A more sophisticated n-state Markov modulated
Poisson process is applied for modeling job arrivals at the
Grid and VO level [16], making a step towards autocorre-
lations and second order statistics. Nevertheless, only lim-
ited success is obtained by MMPP because of the rich be-
havior and patterns hidden in Grid workloads at different
levels. This paper reveals those patterns of job arrivals on
Parallel Workload Archive: http://www.cs.huji.ac.il/
labs/parallel/workload/.
clusters and Grids. Moreover, more workload characteris-
tics are studied and the cross-correlations between them are
further investigated.
3 Definition and Methodology
3.1 Point Processes
Job traffic can be described as a (stochastic) point pro-
cess, which is defined as a mathematical construct that rep-
resents individual events as random points at times {tn}.
There are different representations of a point process. An
interarrival time process {In} is a real-valued random se-
quence with In = tn − tn−1 and it completely describes
the point process. The sequence of counts, or the count pro-
cess, on the other hand, is formed by dividing the time axis
into equally spaced contiguous intervals of T to produce
a sequence of counts {Ck(T )}, where Ck(T ) = N((k +1)T ) − N(kT ) denotes the number of events in the kth in-
terval. This sequence forms a discrete-time random process
of non-negative integers and it is another useful representa-
tion of a point process. A closely related measure is a nor-
malized version of the sequence of counts, called the rate
process Rk(T ), where Rk(T ) = Ck(T )/T .
In general, forming the sequence of counts loses infor-
mation because the interarrival times between events within
interval T are not preserved. Nevertheless, it preserves the
correspondence between its discrete time axis and the abso-
lute “real” time axis of the underlying point process. We
can readily associate correlation in the process {Ck(T )}with correlation in the point process. The interarrival time
process, on the other hand, eliminates the direct corre-
spondence between absolute time and the index number so
it only allows rough comparisons with correlations in the
point process [17]. As we will show later, measures based
on interarrival times are not able to reliably reveal the fractal
nature of the underlying process and count based measures
should be trusted instead.
3.2 Statistical Measures
No single statistic is able to completely characterize a
point process and each provides a different view and high-
lights different properties. A comprehensive analysis to-
wards a better understanding requires many such views.
The marginal properties we study includes the moments
E[Xm] (mean and variance), the probability density, and
the probability distribution. The second order statistics con-
tains the autocorrelation function (ACF) and its Fourier
transform called power spectral density or power spec-
trum. Scatter plot, correlation coefficients, and the cross-
correlation function are used to study correlations between
distinct characteristics. The wavelet-based analysis using
Trace Location Architecture Scheduler #CPUs Period #Jobs
LCG1 Grid wide clusters Grid Broker ∼30k Nov 20-30, 2005 188,041
LCG2 Grid wide clusters Grid Broker ∼30k Dec 19-30, 2005 239,034
NIK05 NIKHEF, NL PC cluster PBS/Maui 288 Sep - Dec, 2005 63,449
RAL05 RAL, UK PC cluster PBS/Maui 1,000 Oct - Nov, 2005 332,662
LPC05 LPC, FR PC cluster PBS/Maui 140 Feb - Apr, 2005 71,271
SBH01 SDSC, US IBM SP LoadLeveler 1152 Jan - Dec, 2001 88,694
Table 1. Summary of workload traces used in the experimental study.
0 1 2 3 4 5 6 7
x 104
0
20
40
60
80
100
120
140
160
Job interarrival time sequence number
Seconds
lhcb, LCG1
0 20 40 60 80 100 120 140 1600
1000
2000
3000
4000
5000
6000
7000
8000
9000
Interarrival time (s)
Count
Histogram
lhcb, LCG1
0 20 40 60 80 100 120 14010
−5
10−4
10−3
10−2
10−1
100
Interarrival time (s)
CC
DF
lhcb, LCG1
0 1000 2000 3000 4000 5000 6000−0.2
0
0.2
0.4
0.6
0.8
Lag
AC
F
Interarrival time
lhcb, LCG1
0
20
40
60 0
20
40
60
0
1000
2000
3000
iat(i)
lhcb, LCG1
iat(i−1)
Count
0 0.005 0.01 0.015 0.020
1
2
3
4
5
6
7
8
9
10x 10
4
Normalized Frequency
DF
T
Job interarrival time
lhcb, LCG1
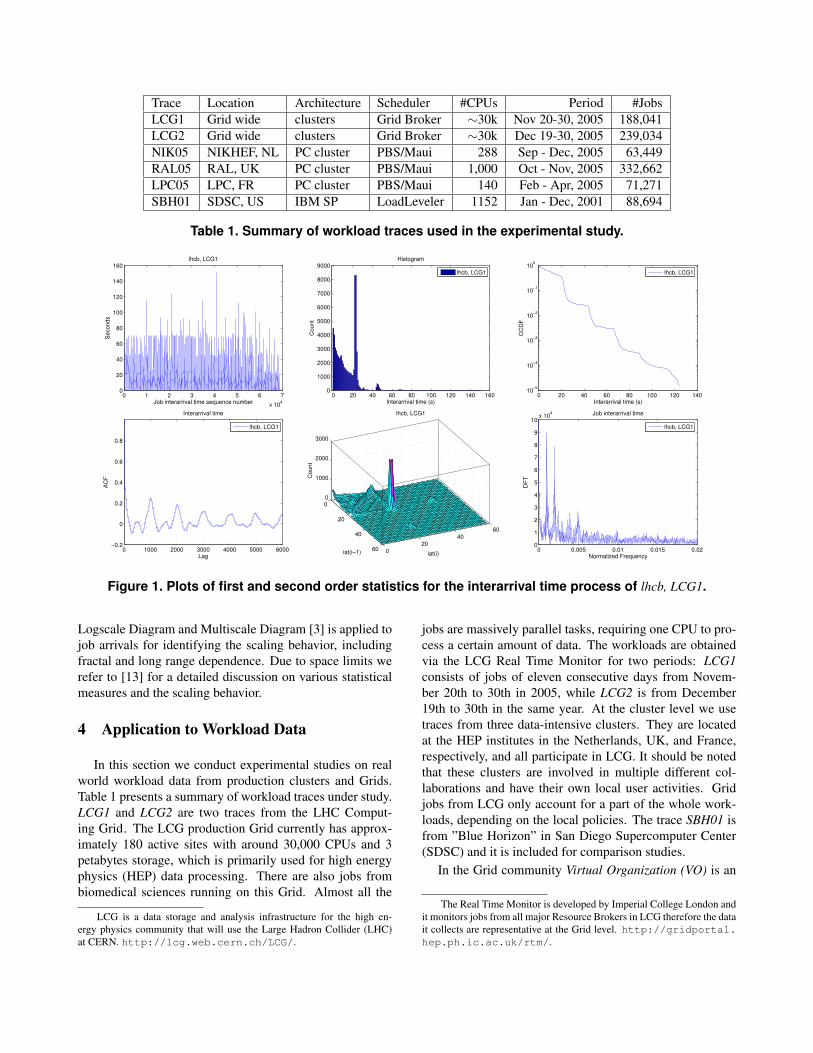
Figure 1. Plots of first and second order statistics for the interarrival time process of lhcb, LCG1.
Logscale Diagram and Multiscale Diagram [3] is applied to
job arrivals for identifying the scaling behavior, including
fractal and long range dependence. Due to space limits we
refer to [13] for a detailed discussion on various statistical
measures and the scaling behavior.
4 Application to Workload Data
In this section we conduct experimental studies on real
world workload data from production clusters and Grids.
Table 1 presents a summary of workload traces under study.
LCG1 and LCG2 are two traces from the LHC Comput-
ing Grid. The LCG production Grid currently has approx-
imately 180 active sites with around 30,000 CPUs and 3
petabytes storage, which is primarily used for high energy
physics (HEP) data processing. There are also jobs from
biomedical sciences running on this Grid. Almost all the
LCG is a data storage and analysis infrastructure for the high en-
ergy physics community that will use the Large Hadron Collider (LHC)
at CERN. http://lcg.web.cern.ch/LCG/.
jobs are massively parallel tasks, requiring one CPU to pro-
cess a certain amount of data. The workloads are obtained
via the LCG Real Time Monitor for two periods: LCG1
consists of jobs of eleven consecutive days from Novem-
ber 20th to 30th in 2005, while LCG2 is from December
19th to 30th in the same year. At the cluster level we use
traces from three data-intensive clusters. They are located
at the HEP institutes in the Netherlands, UK, and France,
respectively, and all participate in LCG. It should be noted
that these clusters are involved in multiple different col-
laborations and have their own local user activities. Grid
jobs from LCG only account for a part of the whole work-
loads, depending on the local policies. The trace SBH01 is
from ”Blue Horizon” in San Diego Supercomputer Center
(SDSC) and it is included for comparison studies.
In the Grid community Virtual Organization (VO) is an
The Real Time Monitor is developed by Imperial College London and
it monitors jobs from all major Resource Brokers in LCG therefore the data
it collects are representative at the Grid level. http://gridportal.
hep.ph.ic.ac.uk/rtm/.

2 4 6 8 105
6
7
8
9
10
11
12
13
Logscale Diagram, N=9, [ (j1,j
2)= (6,9), α−est = 1.73, Q= 0.75], D−init
Octave j
yj
iat − lhcb, LCG1
2 4 6 8 10 12−11
−10
−9
−8
−7
−6
−5
−4Job arrival rate
Scale (dyadic)
log2(V
ariance)
lhcb, LCG1
2 4 6 8 10 12 14
−5
−4
−3
−2
−1
0
1
2
3
Logscale Diagram, N=9, [ (j1,j
2)= (5,12), α−est = 1.23, Q= 0], D−init
Octave j
yj
count − lhcb, LCG1
0 5000 10000 150000
5
10
15
20
25
30
35
Job arrival count interval number
Count
lhcb, LCG1 (scale = 6)
0 200 400 600 800 1000−0.2
0
0.2
0.4
0.6
0.8
Lag
AC
F
Job arrival count process (scale = 6)
lhcb, LCG1
0 0.05 0.1 0.15 0.2 0.25 0.3−40
−30
−20
−10
0
10
20
30
40
50
Normalized Frequency (×π rad/sample)
Pow
er/
frequency (
dB
/rad/s
am
ple
)
Periodogram for job arrival count (scale = 6)
lhcb, LCG1
Figure 2. Plots of the scaling analysis and aggregation procedure for lhcb, LCG1.
important concept [10] and one can consider a VO as a col-
lection of entities (users, resources, etc) that belong to mul-
tiple organizations but have common goals or shared poli-
cies. In the LCG Grid VOs are mostly named after major
HEP experiments, collaborations, or scientific disciplines.
It is shown that the top VOs and users often dominate the
workload, which means analyzing the limited number of top
VOs or users could cover most of the workloads. Moreover,
as we will show later, patterns emerge by simply using the
nominal VO names for categorization without any sophisti-
cated clustering treatment. From a performance evaluation
perspective it is also desirable to include VO or users in the
synthetic traces since most of the policy rules are based on
their names. Given these motivations, our analysis mainly
focuses on the VOs. Some of the VO names appeared in
this paper are briefly explained here. lhcb, atlas, and cms
are major HEP experiments in the LCG Grid. dteam is a VO
mostly consisting of software monitoring and testing jobs in
the Grid. hep1 is a HEP collaboration between institutes in
UK and US, part of which is also involved in LCG. biomed
is the VO with biomedical applications and it contributes to
∼65% of LPC05 jobs.
Our analysis is to apply the statistical measures dis-
cussed in Section 3.2 to each level of workloads for dif-
ferent characteristics. This has generated a large number of
data and figures. Our interest, on the other hand, is to dis-
cover some basic pattern or patterns of the workload char-
acteristics. Therefore the presentation of analytic results
are categorized by the revealed patterns and only represen-
tative figures of each pattern are shown. In the following
sections, we present the job arrival patterns first, followed
by run time, memory and cross-correlations between char-
acteristics. Interesting readers are directed to [13] for the
complete results including different levels on all traces.
4.1 Job Arrivals
There are three basic patterns discovered for job ar-
rivals: pseudo-periodicity, long range dependence (LRD),
and (multi)fractals, which are presented subsequently in the
following sections.
4.1.1 Pseudo-Periodicity
There are a number of VOs at the Grid and the cluster level
which exhibit pseudo-periodic patterns and lhcb on LCG1
is used as the example. Figure 1 shows the first and second
order statistics of job interarrival times of lhcb-LCG1. We
can see that the marginal distribution of interarrival times is
not heavy-tailed, resembling exponential behavior in the y-
log plot. A strong deterministic component of around 20seconds is observed in the histogram plot, which is also
evidenced in the pair-correlation plot. As to the second-
order properties like the ACF and DFT certain periodicity
is detected. Long-lag decaying peaks in the ACF plot cor-
respond to the multimodals in the low frequency domain
of the DFT. Nevertheless, periodicity for interarrival times
does not hold for all processes belonging to this pattern.
This is in accordance with the fact that interarrival based
measures eliminate the direct relation with the real time axis
so count based measures should be examined.

0 1 2 3 4 5
x 104
0
0.5
1
1.5
2
2.5
3
3.5
4
4.5x 10
4
Job interarrival time sequence number
Seconds
biomed, LPC05
100
101
102
103
104
105
10−5
10−4
10−3
10−2
10−1
100
Job interarrival time (s)
CC
DF
biomed, LPC05
0 50 100 150 200−0.2
0
0.2
0.4
0.6
0.8
Lag
AC
F
Job interarrival time
biomed, LPC05
2 4 6 8 10
19
19.5
20
20.5
21
21.5
22
22.5
23
Logscale Diagram, N=9 [ (j1,j
2)= (6,11), α−est = 0.164, Q= 0.95], D−init
Octave j
yj
iat − biomed, LPC05
2 4 6 8 10 12 14−13
−12.5
−12
−11.5
−11
−10.5
−10
−9.5
−9
−8.5
Scale (dyadic)
log2(V
ariance)
Job arrival rate
biomed, LPC05
2 4 6 8 10 12 14
−2
0
2
4
6
8
10
Logscale Diagram, N=9 [(j1,j
2)= (8,14), α−est = 0.96, Q= 0.05], D−init
Octave j
yj
count − biomed, LPC05
0 0.5 1 1.5 2
x 104
0
5
10
15
20
25
30
35
40
Job arrival count interval number
Count
biomed, LPC05 (scale = 8)
0 100 200 300 400 500 600 700 800−0.2
0
0.2
0.4
0.6
0.8
Lag
AC
F
Job arrival count process (scale = 8)
biomed, LPC05
0 0.1 0.2 0.3 0.4 0.5−40
−30
−20
−10
0
10
20
30
40
50
Normalized Frequency (×π rad/sample)
Pow
er/
frequency (
dB
/rad/s
am
ple
)
Periodogram for job arrival count (scale = 8)
biomed, LPC05
Figure 3. Plots of first and second order statistics and scaling analysis for biomed, LPC05.
The next step naturally goes to the aggregation proce-
dure which uses count based measures. Figure 2 plots the
count process together with its ACF and power spectrum
for scale = 6. Periodicity is clearly detected by the equally-
spaced peaks in the ACF plot and the multiple harmonics in
the power spectrum. Stochastic fluctuations (noise) are also
present in the count processes. This pattern holds for all the
VOs in the same category with different base frequencies.
Scaling analysis with the aggregated variance and the
Logscale Diagram are shown in Figure 2. In the variance
plot the slope from scale 6 to 12 is estimated to be β ≈ −0.3(H ≈ 0.85). This corresponds to the Logscale Diagram
with octave j from 5 to 11, showing a scaling alignment
with the estimated exponent α = 1.23 > 1. However, the
scaling analysis in this case proves to be of limited useful-
ness because of the strong deterministic nature of the under-
lying point process.
A dyadic scale is used so scale j means T = 2j seconds in the count
process. This applies to all the scales in the count based measures used
throughout this paper.
4.1.2 Long Range Dependence (LRD)
biomed-LPC05 is used as a representative example for il-
lustrating long range dependence. As is shown in Figure 3,
the interarrival time distribution is heavy-tailed and ampli-
tude burstiness is observed. The ACF of interarrival times,
on the other hand, is short range dependent. This is in ac-
cordance with the scaling exponent estimate α = 0.164in the Logscale Diagram in Figure 3. In the count based
Logscale Diagram the scaling region is from the octave 8
(corresponding to scale 10 in the variance plot) up to the
largest scale with an estimated scaling exponent α = 0.96.
This type of scaling strongly suggests long range depen-
dence behavior [3]. Plotting the count processes from sev-
eral scales and their second order statistics further confirm
LRD. We can see from Figure 3 that the ACF and the spec-
trum of scale 8 decay very slowly. It should be noticed that
the scaling and LRD behavior has a certain lower bound
beyond which scaling is not obeyed.
Data from real production systems is highly complex and
different patterns can be observed within one process. Long
0 2000 4000 6000 8000 10000 12000 14000 160000
2
4
6
8
10
12
14
16
18
Job arrival count interval number
Co
un
tatlas, LCG2 (scale = 6)
0 50 100 150 2000.1
0.2
0.3
0.4
0.5
0.6
0.7
0.8
0.9
1
Lag
AC
F
Job arrival count process (scale = 6)
atlas, LCG2
0 0.2 0.4 0.6 0.8 1−50
−40
−30
−20
−10
0
10
20
30
40
Normalized Frequency (×π rad/sample)
Po
we
r/fr
eq
ue
ncy (
dB
/ra
d/s
am
ple
)
Periodogram for job arrival count (scale = 6)
atlas, LCG2
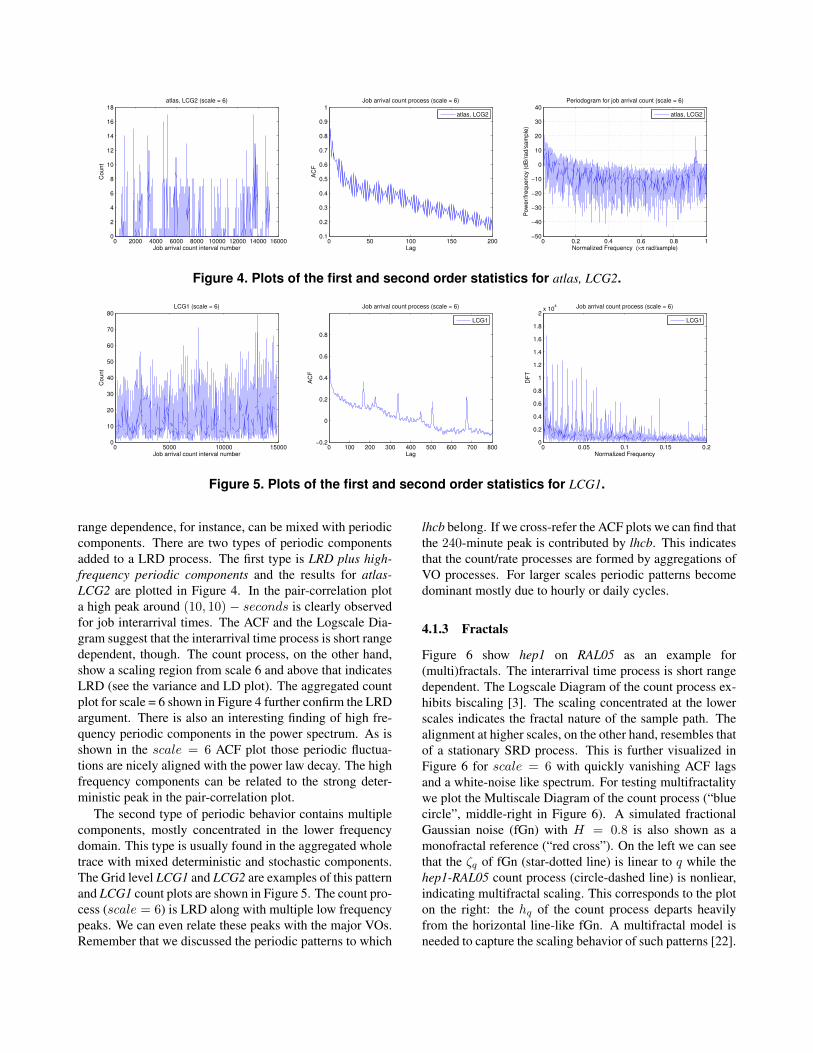
Figure 4. Plots of the first and second order statistics for atlas, LCG2.
0 5000 10000 150000
10
20
30
40
50
60
70
80
Job arrival count interval number
Co
un
t
LCG1 (scale = 6)
0 100 200 300 400 500 600 700 800−0.2
0
0.2
0.4
0.6
0.8
Lag
AC
FJob arrival count process (scale = 6)
LCG1
0 0.05 0.1 0.15 0.20
0.2
0.4
0.6
0.8
1
1.2
1.4
1.6
1.8
2x 10
4
Normalized Frequency
DF
T
Job arrival count process (scale = 6)
LCG1
Figure 5. Plots of the first and second order statistics for LCG1.
range dependence, for instance, can be mixed with periodic
components. There are two types of periodic components
added to a LRD process. The first type is LRD plus high-
frequency periodic components and the results for atlas-
LCG2 are plotted in Figure 4. In the pair-correlation plot
a high peak around (10, 10) − seconds is clearly observed
for job interarrival times. The ACF and the Logscale Dia-
gram suggest that the interarrival time process is short range
dependent, though. The count process, on the other hand,
show a scaling region from scale 6 and above that indicates
LRD (see the variance and LD plot). The aggregated count
plot for scale = 6 shown in Figure 4 further confirm the LRD
argument. There is also an interesting finding of high fre-
quency periodic components in the power spectrum. As is
shown in the scale = 6 ACF plot those periodic fluctua-
tions are nicely aligned with the power law decay. The high
frequency components can be related to the strong deter-
ministic peak in the pair-correlation plot.
The second type of periodic behavior contains multiple
components, mostly concentrated in the lower frequency
domain. This type is usually found in the aggregated whole
trace with mixed deterministic and stochastic components.
The Grid level LCG1 and LCG2 are examples of this pattern
and LCG1 count plots are shown in Figure 5. The count pro-
cess (scale = 6) is LRD along with multiple low frequency
peaks. We can even relate these peaks with the major VOs.
Remember that we discussed the periodic patterns to which
lhcb belong. If we cross-refer the ACF plots we can find that
the 240-minute peak is contributed by lhcb. This indicates
that the count/rate processes are formed by aggregations of
VO processes. For larger scales periodic patterns become
dominant mostly due to hourly or daily cycles.
4.1.3 Fractals
Figure 6 show hep1 on RAL05 as an example for
(multi)fractals. The interarrival time process is short range
dependent. The Logscale Diagram of the count process ex-
hibits biscaling [3]. The scaling concentrated at the lower
scales indicates the fractal nature of the sample path. The
alignment at higher scales, on the other hand, resembles that
of a stationary SRD process. This is further visualized in
Figure 6 for scale = 6 with quickly vanishing ACF lags
and a white-noise like spectrum. For testing multifractality
we plot the Multiscale Diagram of the count process (“blue
circle”, middle-right in Figure 6). A simulated fractional
Gaussian noise (fGn) with H = 0.8 is also shown as a
monofractal reference (“red cross”). On the left we can see
that the ζq of fGn (star-dotted line) is linear to q while the
hep1-RAL05 count process (circle-dashed line) is nonliear,
indicating multifractal scaling. This corresponds to the plot
on the right: the hq of the count process departs heavily
from the horizontal line-like fGn. A multifractal model is
needed to capture the scaling behavior of such patterns [22].

0 2 4 6 8 10 12 14 16
x 104
0
0.5
1
1.5
2
2.5
3
3.5
4x 10
4
Job interarrival time sequence number
Se
co
nd
shep1, RAL05
0 20 40 60 80 100 1200
0.5
1
1.5
2
2.5
3
3.5
4
4.5
5x 10
4
Job interarrival time (s)
Co
un
t
Histogram
hep1, RAL05
0 20 40 60 80 100−0.2
0
0.2
0.4
0.6
0.8
Lag
AC
F
Job interarrival time
hep1, RAL05
2 4 6 8 10 12
17
18
19
20
21
22
23
24
Logscale Diagram, N=9 [(j1,j
2)= (2,11), α−est = 0.21, Q= 0], D−init
Octave j
yj
iat − hep1, RAL05
2 4 6 8 10 12 14 16
−4
−2
0
2
4
6
8
Logscale Diagram, N=9 [(j1,j
2)= (2,7), α−est = 1.11, Q= 0], D−init
Octave j
yj
count − hep1, RAL05
0 2 4
−1.2
−1
−0.8
−0.6
−0.4
−0.2
0
ζq = α
q − q/2
q
ζq
0 2 4
−0.3
−0.25
−0.2
−0.15
−0.1
−0.05
0
0.05
0.1
0.15
hq = ζ
q / q
q
hq
0 1 2 3 4 5 6 7 8
x 104
0
100
200
300
400
500
600
Job arrival count interval number
Co
un
t
hep1, RAL05 (scale = 6)
0 50 100 150 200 250 300−0.2
0
0.2
0.4
0.6
0.8
Lag
AC
F
Job arrival count process (scale = 6)
hep1, RAL05
0 0.2 0.4 0.6 0.8 1−30
−20
−10
0
10
20
30
40
50
Normalized Frequency (×π rad/sample)
Po
we
r/fr
eq
ue
ncy (
dB
/ra
d/s
am
ple
)
Periodogram for job arrival count (scale = 6)
hep1, RAL05
Figure 6. Plots of first and second order statistics and scaling analysis for hep1, RAL05.
4.2 Job Run time, Memory, and CrossCorrelations
In this section we turn our focus into characteristics such
as run time and memory. On one hand, first order statis-
tics is plotted to see how data values are distributed. On the
other hand, autocorrelations are used to examine second or-
der properties in the sequence of data when ordered ascen-
dantly by the arrival times. Figure 7 plots the marginal dis-
tributions and autocorrelations for job run time and memory
of lhcb on NIK05. The distributions of run times are highly
multimodal with specific values, meaning that the applica-
tions within one VO are more similar to each other with
clustered values of running times. Similar results are ob-
served for memory consumption. Physically we can inter-
pret that these jobs belong to multiple applications within a
certain large scale scientific experiment or discipline. Run
times and memories with similar values also turn to appear
subsequently in time, which is evidenced by the fluctuating
horizontal lineups in the sequence plot. It is not surpris-
ing to see the strong autocorrelations in the sequences of
run times or memories. One explanation of these observa-
tions is that the computing environment at the cluster level is
more homogeneous compared to the Grid so less variations
are expected on job run times and memories. The nature of
data-intensive applications (bags of tasks) and similarity re-
sulted by VO categorization should lead to an even stronger
degree of temporal locality [8].
It is also interesting to see how the interarrival times are
jointly distributed with the sequences of similar values. This
helps to correlate arrivals and run times/memories and iden-
tify the ”bag-of-tasks” phenomenon on data-intensive envi-
ronments. Figure 7 shows the scatter plots of run times and
memories against interarrival times for lhcb-NIK05. We can
see that job run times and memories are heavily clustered in
the ranges of small interarrival times. This is to say that not
only similar values appear in a sequence, but also times be-
tween arrivals in a sequence are relatively small, indicating
the “bag-of-tasks” behavior. Figure 7 also contains a scatter

0 2000 4000 6000 8000 10000 12000 14000 160000
0.5
1
1.5
2
2.5
3x 10
5
Job run time sequence number
Se
co
nd
s
lhcb, NIK05
100
102
104
106
0
0.1
0.2
0.3
0.4
0.5
0.6
0.7
0.8
0.9
1
Job run time (s)
CC
DF
lhcb, NIK05
0 200 400 600 800 10000
50
100
150
200
250
300
350
400
Job run time (s)
Co
un
t
Histogram
lhcb, NIK05
0 100 200 300 400 500 600 700 8000.2
0.3
0.4
0.5
0.6
0.7
0.8
0.9
1
Lag
AC
F
Job run time
lhcb, NIK05
0 2000 4000 6000 8000 10000 12000 14000 160000
1
2
3
4
5
6
7
8
9x 10
5
Job memory sequence number
kilo
byte
s
lhcb, NIK05
102
103
104
105
106
0
0.1
0.2
0.3
0.4
0.5
0.6
0.7
0.8
0.9
1
Job memory (kilobytes)
CC
DF
lhcb, NIK05
0 0.5 1 1.5 2 2.5 3 3.5 4
x 105
0
200
400
600
800
1000
1200
1400
Job memory (kilobytes)
Co
un
t
Histogram
lhcb, NIK05
0 100 200 300 400 500 600 700 8000.2
0.3
0.4
0.5
0.6
0.7
0.8
0.9
1
Lag
AC
F
Job memory
lhcb, NIK05
0 2 4 6 8 10 12
x 104
0
2000
4000
6000
8000
10000
12000
14000
16000
Job run time (s)
Jo
b in
tera
rriv
al tim
e (
s)
lhcb, NIK05
0 1 2 3 4 5
x 105
0
2000
4000
6000
8000
10000
12000
14000
16000
Job memory (kbytes)
Jo
b in
tera
rriv
al tim
e (
s)
lhcb, NIK05
0 5 10 15
x 104
0
1
2
3
4
5
6
7
8x 10
5
Job run time (s)
Jo
b m
em
ory
(kb
yte
s)
lhcb, NIK05
−2000 −1500 −1000 −500 0 500 1000 1500 20000.1
0.2
0.3
0.4
0.5
0.6
0.7
0.8
0.9
Lag
xco
rr(r
un
tim
e,
me
mo
ry)
lhcb, NIK05
Figure 7. Plots of the first and second order statistics for run time and memory as well as cross-correlations between them for lhcb, NIK05.
plot of run time against memory and its cross-correlation
function for lhcb-NIK05. Correlation coefficients calcu-
lated by Pearson’s as well as by Spearman’ rank are given
in Table 2. Among the three VOs lhcb-NIK05 shows the
strongest correlation between run time and memory. We
can see it from the clustering in the scatter plot and the
slow-decaying cross-correlation function, confirmed by a
high correlation coefficient. For the other two VOs weak
to moderate correlation coefficients are obtained, however,
correlation coefficients are used only in combination with
other measures due to their inherent limitations (especially
Pearson’s). Referring to the complete results [13] we can
conclude that temporal locality and “bag-of-tasks” behavior
are clearly evidenced for VOs on data-intensive clusters. At
the Grid level this behavior is not clearly observable for all
the VOs due to heterogeneity, but it is present in the work-
loads. For the parallel supercomputer SBH01 no bags of
tasks can be identified, even for uses whose marginal distri-
bution of run times shows strong multimodality.
5 Discussions
In this section we discuss the nature and origin of the dis-
covered patterns. One of the primary purposes for statistical
studies is to inspire and assist workload modeling and per-
Trace Pearson’s Spearman’s Rank
biomed-LPC05 0.173 0.695
lhcb-NIK05 0.756 0.826
hep1-RAL05 0.013 0.456
Table 2. Correlation coefficients (CC) for runtime against memory of VOs on clusters.
formance predictions. We will cover these topics in greater
detail as well.
5.1 The Nature of Workload Dynamics
Our focus in this paper is on data-intensive comput-
ing environments whose workloads consist of flows of
massively-parallel single-CPU tasks. By looking at the cur-
rent workload structure of production clusters and Grids,
together with the booming factor of computing-oriented so-
lutions to system-level sciences such as bioinformatics, we
can envision that data-intensive applications will contribute
to a majority of workloads running on current and future
Grids. This type of applications is also well suited to run on
a heterogeneous Grid environment because of its loosely-

coupled and data-parallel nature. Truly parallel applica-
tions like those on traditional parallel supercomputers, on
the other hand, are more tightly-coupled with inter-process
communications which make them more difficult moving
from one architecture to another. Based on the different na-
ture of applications and domain properties, it is expected
that data-intensive workloads possess structures and pat-
terns which are departed from those based on parallel su-
percomputers. We start our quest on the origin of job arrival
dynamics.
There are three patterns that we discovered for data-
intensive job arrivals. The first one exhibits strong period-
icity, which suggests certain deterministic job submission
mechanisms. lhcb is a large HEP experiment in the LCG
Grid with the largest portion of production jobs. If we take
into account that close to 90% of lhcb jobs (around 60,000)
are from a single “user” during the eleven consecutive days
in LCG1, we can assume that scripts are used to submit
those jobs, which are deterministic in nature. It can also
be interpreted that automated tasks need to be implemented
to process such a huge amount of scientific data. Periodicity
can also be originated from testing and monitoring jobs in
the Grid such as those from dteam. dteam stands for “de-
ployment team” and it is dedicated for a continuously func-
tioning and operating Grid. Mostly testing and monitoring
jobs are initiated automatically by software in a periodic
fashion. The periodic pattern is also observed for VOs at the
cluster level. We consider it as one basic pattern that origi-
nates from automated submission schemes, which is shown
to be present in large-scale data processing environments.
The second pattern is long range dependent (LRD) and it
applies to many production VOs. This can be partially ex-
plained by the repetitive executions of several main applica-
tions from major users in the VO. A typical user would sub-
mit sequences of tasks with a heavy-tailed inter-submission
time. This behavior shows temporal burstiness, which is
argued in [5] that it essentially originates from a priority se-
lection mechanism between tasks and non-tasks waiting for
execution. LRD forms the second basic pattern that char-
acterizes data-intensive job arrivals. If we combine peri-
odicity and LRD, some interesting patterns emerge. The
process can be long range dependent with high frequency
oscillations, rooting from the short-period repetitions of job
arrival rates at small time scales. The process can also be
LRD with multiple lower frequency components, which is
mainly due to the addictive nature of aggregation at the Grid
level. There are limited data-intensive traces that show rich
fractal behavior at small scales and are short range depen-
dent at large scales. Most of the parallel supercomputer
traces belong to this category.
When we take more characteristics like run time and
memory into account, a “bags-of-tasks” behavior is evident
for data-intensive jobs. The marginal distributions for run
time and memory are highly multimodal at the VO level on
clusters. Certain values not only occur subsequently, but
also turn to appear within one burst period. This is again
due to the nature of data-intensive applications. On paral-
lel supercomputers, on the other hand, no such behavior is
observed in the workloads.
5.2 Modeling and Predictions
Effective scheduling algorithm design both at the Grid
and the cluster level requires experimental studies based on
simulations, in which representative workload models play
a crucial role. There are many modeling work being done
for parallel workloads [1], but on Grids it is still emerg-
ing [16]. This paper is particularly useful for the modeling
research because a set of basic patterns are identified for
job arrivals on clusters and Grids, which points out direc-
tions for selecting models to fit distinctive patterns. More-
over, cross correlations between job characteristics are in-
vestigated and illustrated. As we have shown these patterns
and correlation structures on Grids are very different from
those which have been studied and modeled on parallel su-
percomputers. There is a strong need to build models that
are able to capture the dynamics both within and between
job characteristics for data-intensive workloads.
Another important perspective on workload analysis is
how to help the research on performance predictions. Pre-
dictions of performance metrics, such as application run
times and queue wait times on clusters, serve as impor-
tant information for scheduling decision making at the Grid
level. The main patterns that we identify for data-intensive
clusters, namely periodicity, long range dependence, and
temporal locality, suggest that prediction techniques based
on historical data modeling would most likely work on real
production systems [21, 15]. The Grid-level scheduling
strategies can also take advantages of specific VO job ar-
rival patterns. For instance, if periodicity is detected for
a large production VO, scheduling heuristics can be opti-
mized specifically for this strong deterministic behavior.
6 Conclusions and Future Work
In this paper we study comprehensively the first and sec-
ond order statistics of workloads on clusters and Grids at
different levels, including VO and user behavior. We iden-
tify several basic patterns for job arrivals and these pat-
terns provide important clues from a modeling perspective.
The sequences of job run times or memory on clusters are
strongly autocorrelated and their cross-correlations are also
significant. Moreover, sequences of similar values turn to
appear in a burst with small interarrival times, leading to the
observation of “bag-of-tasks” behavior. To sum up, pseudo-
periodicity, long range dependent, and temporal locality

(“bag-of-tasks”) are important characteristic properties of
workloads on data-intensive clusters and Grids, which is not
present in the traditional parallel workloads.
Future work naturally extends to workload modeling that
tries to capture the correlation structures and patterns ob-
tained in this paper. Experimental performance evaluation
studies using simulations are needed to investigate their im-
pact and how to improve scheduling under such workload
patterns.
Acknowledgments
The LCG Grid traces are provided by the HEP e-Science
group at Imperial College London. NIK05 and RAL05
traces are provided by colleagues at NIKHEF (NL) and
RAL (UK), respectively. LPC05 and SBH01 traces are ob-
tained from Parallel Workload Archive. We want to express
our gratitude to all who graciously provide us with the data.
We also want to thank Michael Muskulus, Steven Lowen
(Harvard), and Rudolf Riedi (Rice) for their suggestions and
discussions on point processes and scaling analysis issues.
References
[1] Selected and revised papers: Workshop on job scheduling
strategies for parallel processing. Lecture Notes in Com-
puter Science. Springer, 1995 - 2005.[2] P. Abry, R. Baraniuk, P. Flandrin, R. Riedi, and D. Veitch.
The multiscale nature of network traffic: discovery, anal-
ysis, and modelling. IEEE Signal Processing magazine,
19(3):28–46, May 2002.[3] P. Abry, M. S. Taqqu, P. Flandrin, and D. Veitch. Self-Similar
Network Traffic and Performance Evaluation, K. Park and
W. Willinger, editors, chapter Wavelets for the analysis, es-
timation, and synthesis of scaling data. Wiley, 2000.[4] P. Abry and D. Veitch. Wavelet analysis of long-range de-
pendent traffic. IEEE Trans. on Info. Theory, 44(1):2–15,
January 1998.[5] A.-L. Barabasi. The origin of bursts and heavy tails in hu-
man dynamics. Nature, 435:207–211, 2005.[6] W. Cirne and F. Berman. A comprehensive model of the su-
percomputer workload. In proceedings of IEEE 4th Annual
Workshop on Workload Characterization, 2001.[7] D. G. Feitelson. Workload modeling for performance eval-
uation. LNCS, 2459:114–141, 2002.[8] D. G. Feitelson. Workload Modeling for Computer Systems
Performance Evaluation. draft version 0.7, 2006.[9] A. Feldmann, A. C. Gilbert, and W. Willinger. Data net-
works as cascades: Investigating the multifractal nature of
internet WAN traffic. In SIGCOMM, pages 42–55, 1998.[10] I. Foster, C. Kesselman, and S. Tuecke. The anatomy of the
Grid: Enabling scalable virtual organizations. Lecture Notes
in Computer Science, 2150, 2001.[11] D. L. Jagerman, B. Melamed, and W. Willinger. Stochastic
modeling of traffic processes. Frontiers in Queueing: Mod-
els, Methods and Problems, 1996.
[12] W. Leland, M. Taqqu, W. Willinger, and D. Wilson. On
the self-similar nature of ethernet traffic (extended version).
IEEE/ACM Trans. on Networking, 2(1):1–15, 1994.[13] H. Li. Complete data and results for workload dynamics
on clusters and grids. Technical Report 2006-04, Leiden
Institute of Advanced Computer Science, Leiden University,
2006.[14] H. Li, D. Groep, and L. Wolters. Workload characteristics of
a multi-cluster supercomputer. LNCS, 3277:176–193, 2005.[15] H. Li, D. Groep, and L. Wolters. Mining performance data
for metascheduling decision support in the grid. Future Gen-
eration Computer Systems, 23:92–99, 2007.[16] H. Li and M. Muskulus. Analysis and modeling of job ar-
rivals in a production grid. ACM SIGMETRICS Performance
Evaluation Review, March 2007.[17] S. B. Lowen and M. C. Teich. Fractal-Based Point Pro-
cesses. John Wiley and Sons, Inc., 2005.[18] U. Lublin and D. G. Feitelson. The workload on parallel
supercomputers: modeling the characteristics of rigid jobs.
J. Para. and Dist. Comput., 63(11):1105–1122, 2003.[19] E. Medernach. Workload analysis of a cluster in a grid envi-
ronment. In proceedings of 11th workshop on Job Schedul-
ing Strategies for Parallel processing, 2005.[20] V. Paxson. Fast, approximate synthesis of fractional gaus-
sian noise for generating self-similar network traffic. Com-
puter Communications Review, 27(5):5–18, Oct. 1997.[21] Y. Qiao, J. Skicewicz, and P. Dinda. Multiscale predictabil-
ity of network traffic. Technical Report NWU-CS-02-13,
Department of Computer Science, Northwestern University,
2002.[22] R. H. Riedi, M. S. Crouse, V. J. Ribeiro, and R. G. Bara-
niuk. A multifractal wavelet model with application to net-
work traffic. IEEE Transactions on Information Theory,
45(3):992–1019, April 1999.[23] R. H. Riedi and W. Willinger. Self-Similar Network Traf-
fic and Performance Evaluation, K. Park and W. Willinger,
editors, chapter Toward an Improved Understanding of Net-
work Traffic Dynamics. Wiley, 2000.[24] B. Song, C. Ernemann, and R. Yahyapour. Parallel computer
workload modeling with markov chains. LNCS, 3277:47–
62, 2004.[25] M. S. Squillante, D. D. Yao, and L. Zhang. The impact of job
arrival patterns on parallel scheduling. ACM SIGMETRICS
Performance Evaluation Review, 26(4):52–59, Dec. 1999.[26] J. L. Vehel and R. Riedi. Fractional brownian motion and
data traffic modeling: The other end of the spectrum. Frac-
tals in Engineering, pages 185–202, 1997.[27] D. Veitch and P. Abry. A wavelet based joint estimator of the
parameters of long-range dependence. IEEE Transactions
on Information Theory special issue on ”Multiscale Statis-
tical Signal Analysis and its Applications”, 45(3):878–897,
April 1999.