Embed Size (px)
Citation preview

Toward the first 90: Identifying and testing younger populations for HIV at community outreach events in
Kenya
Background
Data and Analysis
Cause for Concern
Nicollate Okoko, Mary A. Guzé, Samuel Ndolo, George Nyanaro, Elizabeth A. Bukusi, Craig R. Cohen, Jeremy Penner, Jayne Lewis-Kulzer
Methods
Location and Approach
Conclusion
Acknowledgement
University of CaliforniaSan Francisco
CENTER FOR MICROBIOLOGY RESEARCH MINISTRY OF HEALTH
3. Department of Pediatrics, University of Colorado, Aurora, CO, USA4. University of British Columbia, Vancouver Canada
1. Kenya Medical Research Institute (KEMRI), Nairobi, Kenya2. Department of Obstetrics, Gynecology and Reproductive Sciences, University of California, San Francisco (UCSF), CA, USA
receiving antiretroviraltherapy will have viral
suppression
living with HIV will receiveantiretroviral therapy
living with HIV will knowtheir HIV status
of allof allof all
ŸLow HIV status awareness among children and adolescents
Ÿ12,940 new HIV infections among childrenŸRising adolescent AIDS-related deaths in
KenyaŸDelayed HIV identification associated with
poor health outcomes
ŸREDCap databaseo Aggregated HIV testing (number tested)o Yield (number identified HIV positive)o Gender among eligible children (age <15) and
adolescents (age 15-19)
ŸAnalysiso Negative binomial models used to assess age
and gender differences in HIV testing and yield
and generate estimated means
ŸFamily AIDS Care and Education Services (FACES) is a collaborative KEMRI and UCSF comprehensive HIV prevention, care, and treatment program
ŸFACES partners with the Ministry of Health (MOH) for health service delivery and capacity building
Ÿ12 year of experience supporting health facilities across the Nyanza region of western Kenya
This study examined HIV testing outcomes and
characteristics of younger (age <19) populations
attending Targeted Community Outreach Events
(TCOEs)
Context
Photo courtesy of Beth Novey
ŸConducted in Homa Bay, Migori, and
Kisumu counties in KenyaŸCatchment areas surrounding148 health
facilitiesŸ492 Targeted Community Outreach Events
carried out o July – December 2015o HIV testing and identificationo Counselling and education
Figure 1: TCOE frequencies and proportions by age and gender: testing and yield
Figure 2: Negative binomial model generated estimated mean number of individuals tested at Target Community Outreach Events by age and gender
Figure 1 provides frequencies and proportions of testing and yield by age and gender
10
7
12
7
0
2
4
6
8
10
12
14
16
18
20
<15 years 15-19 years
Male Female
ŸTargeted Community Outreach Events reached twice as many children as
adolescents for HIV testing and identification and female HIV testing declined
in adolescence
Ÿ
ŸThe Targeted Community Outreach Event approach appears useful in reaching
children, however a better understanding of what type of community approaches
would draw adolescents, particularly females, is needed
We would like to thank UCSF, KEMRI, FACES, the Kenyan MOH, our staff, and
above all the clients and families served.
We greatly appreciate the Children’s Investment Fund Foundation’s (CIFF) commitment to reach and
serve children and adolescents in need of HIV services and their support through the Accelerating
Children’s HIV/AIDS Treatment (ACT) Initiative, a public-private partnership between CIFF and the
United States President’s Emergency Plan for AIDS Relief (PEPFAR).
Abstract #: TUPED1229
242
2 11 1 1
Results
14,603 individuals tested at TCOEs
Children, age <15)67% (n=9788)
Female54% (n=5291)
HIV positive0.2% (N=10)
Male46% (n=4497)
HIV positive0.2% (N=8)
Adolescents, age 15-1933% (n=4815)
Female51% (n=2457)
HIV positive0.5% (n=13)
Male49% (n=2358)
HIV positive0.2% (N=4)
ŸComparisons by age and gender showed that at TCOEs (Figure 2):ŸAdolescents were less likely to be tested compared to children (IRR:
0.46; 95% CI: 0.34, 62; p<0.01)ŸFewer males than females tested overall (IRR: 0.85; 95% CI: 0.78,
0.93; p<0.01)ŸThe decrease in males testing from the children age group to the
adolescent age group was smaller than in females (IRR: 1.13, 95% CI:
1.02, 1.25, p=0.02)ŸThere was no significant difference in age and gender among those
testing positive
CONTACTS: Nicollate Okoko; Cell No: 0723432100
Presented at the 9th IAS Conference on HIV Science Paris France 23rd - 26th July, 2017
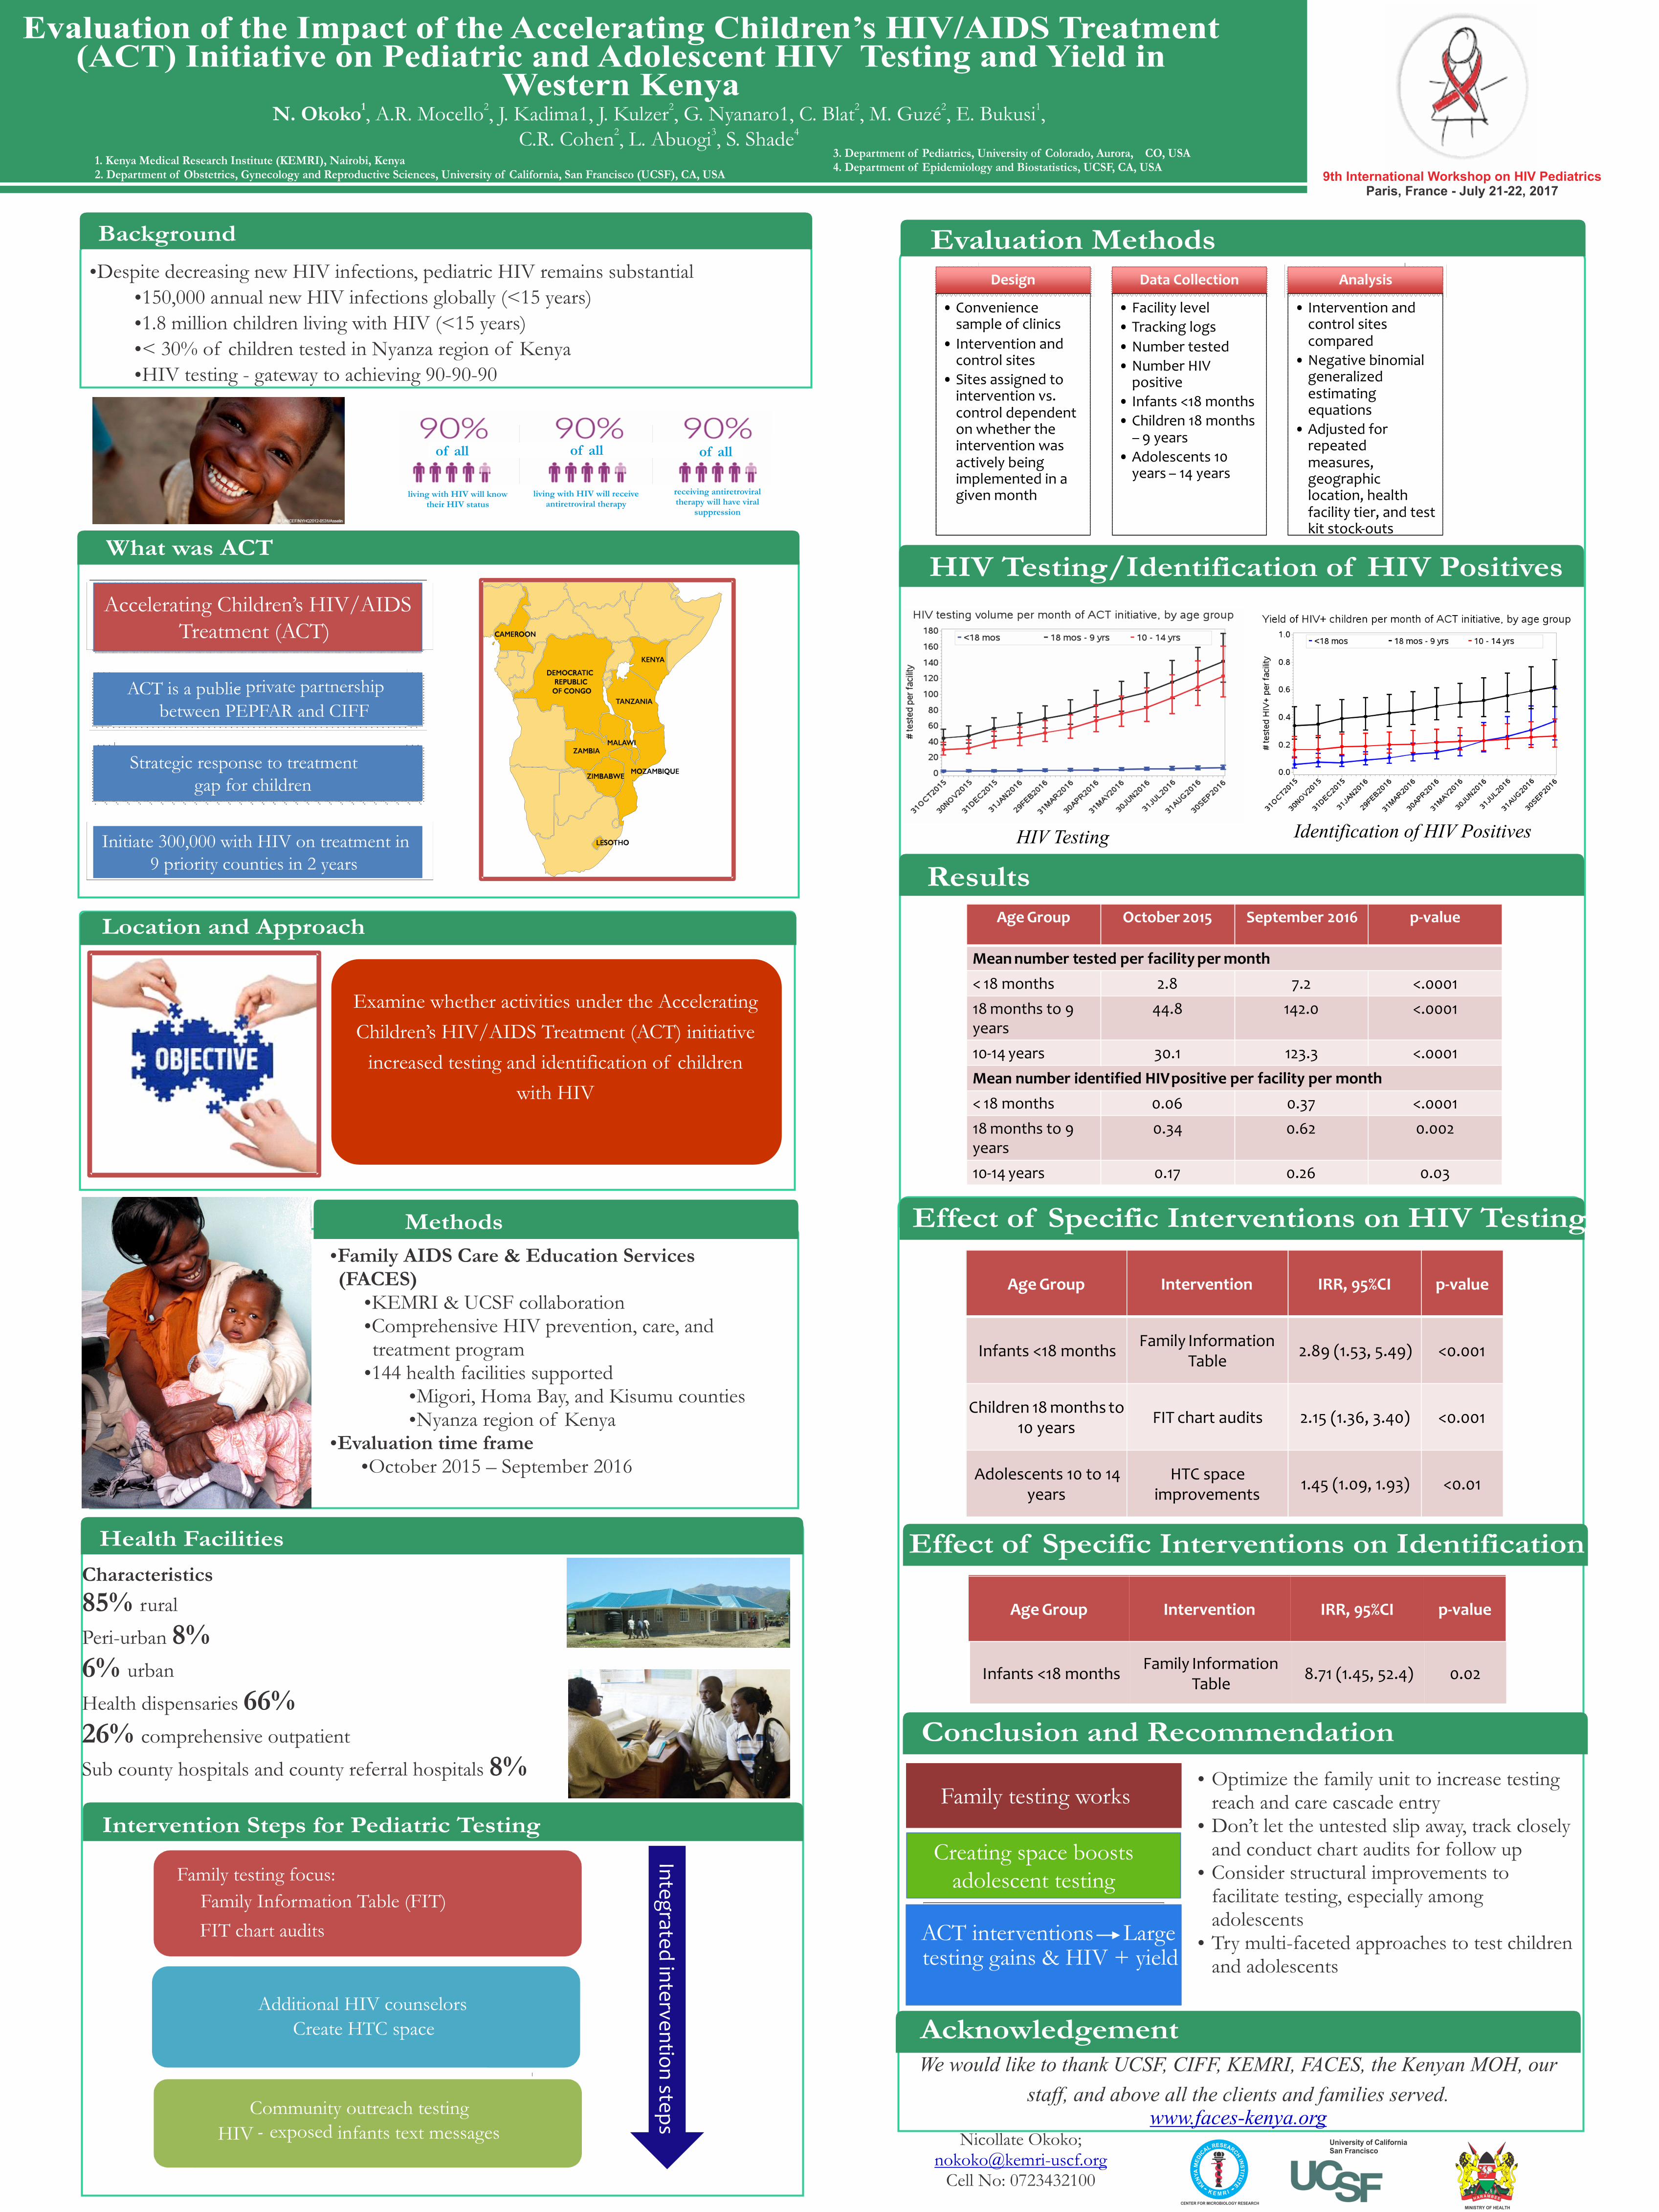
Evaluation of the Impact of the Accelerating Children’s HIV/AIDS Treatment (ACT) Initiative on Pediatric and Adolescent HIV Testing and Yield in
Western Kenya
Methods
Health Facilities
Intervention Steps for Pediatric Testing
Evaluation Methods
HIV Testing/Identification of HIV PositivesWhat was ACT
Location and Approach
Results
Effect of Specific Interventions on HIV Testing
Effect of Specific Interventions on Identification
Conclusion and Recommendation
Acknowledgement
Effect of Specific Intervention Element
3. Department of Pediatrics, University of Colorado, Aurora, CO, USA4. Department of Epidemiology and Biostatistics, UCSF, CA, USA
1. Kenya Medical Research Institute (KEMRI), Nairobi, Kenya2. Department of Obstetrics, Gynecology and Reproductive Sciences, University of California, San Francisco (UCSF), CA, USA
receiving antiretroviraltherapy will have viral
suppression
living with HIV will receiveantiretroviral therapy
living with HIV will knowtheir HIV status
of allof allof all
ŸDespite decreasing new HIV infections, pediatric HIV remains substantial Ÿ150,000 annual new HIV infections globally (<15 years)Ÿ1.8 million children living with HIV (<15 years)Ÿ< 30% of children tested in Nyanza region of Kenya ŸHIV testing - gateway to achieving 90-90-90
ŸFamily AIDS Care & Education Services (FACES)
ŸKEMRI & UCSF collaborationŸComprehensive HIV prevention, care, and treatment programŸ144 health facilities supported
ŸMigori, Homa Bay, and Kisumu countiesŸNyanza region of Kenya
ŸEvaluation time frameŸOctober 2015 – September 2016
Characteristics
85% rural
Peri-urban 8%6% urban
Health dispensaries 66%26% comprehensive outpatient
Sub county hospitals and county referral hospitals 8%
Accelerating Children’s HIV/AIDS Treatment (ACT)
Strategic response to treatment gap for children
Initiate 300,000 with HIV on treatment in 9 priority counties in 2 years
ACT is a public- private partnership
between PEPFAR and CIFF
Examine whether activities under the Accelerating
Children’s HIV/AIDS Treatment (ACT) initiative
increased testing and identification of children
with HIV
Additional HIV counselorsCreate HTC space
Family testing focus:
Family Information Table (FIT)
FIT chart audits
Community outreach testing
HIV - exposed infants text messages
Inte
grate
d in
terve
ntio
n ste
ps
1 2 2 2 2 1N. Okoko , A.R. Mocello , J. Kadima1, J. Kulzer , G. Nyanaro1, C. Blat , M. Guzé , E. Bukusi , 2 3 4
C.R. Cohen , L. Abuogi , S. Shade
Background
9th International Workshop on HIV PediatricsParis, France - July 21-22, 2017
Design
• Convenience sample of clinics
• Intervention and control sites
• Sites assigned to intervention vs. control dependent on whether the intervention was actively being implemented in a given month
Data Collection
• Facility level
• Tracking logs
• Number tested
• Number HIV positive
• Infants <18 months
• Children 18 months – 9 years
• Adolescents 10 years – 14 years
Analysis
• Intervention and control sites compared
• Negative binomial generalized estimating equations
• Adjusted for repeated measures, geographic location, health facility tier, and test kit stock-outs
Age Group October 2015 September 2016 p-value
Mean number tested per facility per month
< 18 months 2.8 7.2 <.0001
18 months to 9 years
44.8 142.0 <.0001
10-14 years 30.1 123.3 <.0001
Mean number identified HIVpositive per facility per month
< 18 months 0.06 0.37 <.0001
18 months to 9 years
0.34 0.62 0.002
10-14 years 0.17 0.26 0.03
Age
Age
Group
Group
Intervention
Intervention
IRR, 95%CI
IRR, 95%CI
p
p
-
-
value
value
Infants <18 monthsFamily Information
Table2.89 (1.53, 5.49) <0.001
10 yearsFIT chart audits 2.15 (1.36, 3.40) <0.001
Adolescents 10 to 14 years
HTC space improvements
1.45 (1.09, 1.93) <0.01
Infants <18 monthsFamily Information
Table8.71 (1.45, 52.4) 0.02
Family testing works
Creating space boosts adolescent testing
ACT interventions Largetesting gains & HIV + yield
HIV Testing Identification of HIV Positives
ŸOptimize the family unit to increase testing reach and care cascade entry
ŸDon’t let the untested slip away, track closely and conduct chart audits for follow up
ŸConsider structural improvements to facilitate testing, especially among adolescents
ŸTry multi-faceted approaches to test children and adolescents
University of CaliforniaSan Francisco
CENTER FOR MICROBIOLOGY RESEARCHMINISTRY OF HEALTH
We would like to thank UCSF, CIFF, KEMRI, FACES, the Kenyan MOH, our
staff, and above all the clients and families served. www.faces-kenya.org
Nicollate Okoko;
Cell No: [email protected]