Embed Size (px)
Citation preview

Prepared by the Cascadia Green Building Council
March 2011
TOWARD NET ZERO WATER: BEST MANAGEMENT PRACTICES FOR DECENTRALIZED SOURCING AND TREATMENT

Toward Net Zero WaterPage 2
ACKNOWLEDGEMENTS
SPONSORED BY
Compton Foundation
PRIMARY AUTHORS
Joel Sisolak, Advocacy and Outreach Director, Cascadia Green Building Council
Kate Spataro, Research Director, Cascadia Green Building Council
CONTRIBUTORS
Jason F. McLennan, CEO, Cascadia Green Building Council
Marin Bjork, Research Manager, Cascadia Green Building Council
Leslie Gia Clark, Cascadia Corps Volunteer
Gia Mugford, Cascadia Corps Volunteer
Samantha Rusek, Cascadia Corps Volunteer
PEER REVIEW
Morgan Brown, President, Whole Water Systems, LLC
Mark Buehrer, P.E., 2020 ENGINEERING
Scott Wolf, AIA, Partner, The Miller/Hull Partnership, LLP
Pete Muñoz, P.E., Natural Systems International
COPYRIGHT INFORMATION
This report is the copyrighted property of the Cascadia Green Building Council, all rights reserved 2011.
This report may be printed, distributed, and posted on websites in its entirety in PDF format only and for

Toward Net Zero Water Page 3
TABLE OF CONTENTS
EXECUTIVE SUMMARY . . . . . . . . . . . . . . . . . . 1
INTRODUCTION . . . . . . . . . . . . . . . . . . . . . . 2
CONTEXT AND BACKGROUND . . . . . . . . . . . . . . 8
History Of Centralized Water Systems
Current Conditions: Environmental, Social & Economic Risks
Moving Forward: A Vision for Net Zero Water
Current Barriers to Net Zero Water
BEST MANAGEMENT PRACTICES . . . . . . . . . . . .30
Integrated water management
Community Involvement
Risk Management
Beauty and Inspiration
RAINWATER HARVESTING . . . . . . . . . . . . . . . .44
System Components
Technology
Fit
Additional Design Considerations
Additional Resources
GREYWATER RECLAMATION & REUSE . . . . . . . . .62
System Components
Technology
Fit
Additional Design Considerations
Additional Resources
WASTEWATER TREATMENT & REUSE. . . . . . . . . .78
Introduction
Composting Toilets. . . . . . . . . . . . . . . . . 80System Components Technology Fit
Additional Design Considerations
Constructed Wetlands . . . . . . . . . . . . . . . 90System Components Technology Fit
Additional Design Considerations
. . . . . . . . . . . . . . 100System ComponentsTechnologyFit
Additional Design Considerations
Membrane Bioreactors . . . . . . . . . . . . . . 106System ComponentsTechnologyFit
Additional Design Considerations
Additional Resources . . . . . . . . . . . . . . . 114
FUTURE RESEARCH . . . . . . . . . . . . . . . . . . . 115
GLOSSARY . . . . . . . . . . . . . . . . . . . . . . . . 119
BIBLIOGRAPHY. . . . . . . . . . . . . . . . . . . . . . 122

Toward Net Zero WaterPage 4

Toward Net Zero Water Page 1
EXECUTIVE SUMMARYToward Net Zero Water is a best management practices manual on decentralized strategies for water
supply, on-site treatment and reuse. It was conceived through an extensive literature review on the topics
of site and district-scale water systems with a focus on best-in-class examples from around the globe.
This manual is intended to assist developers and regulators of water systems to better understand these
strategies and how they might be applied in American cities.
demand expanded water and wastewater services, while aging water supply and wastewater treatment
infrastructure, most of which was designed and built in the late 19th and early 20th centuries, approaches
end-of-life or is in need of major overhaul. This growing crisis is further exacerbated by unsustainable
water use patterns. Every day, we use potable water within our buildings for non-potable functions such
global climate patterns pose additional risks to the health and resilience of our water systems.
In recent years, the green building movement has made strides to change the way people view water
resources, raising awareness and increasing implementation of water conservation techniques. Despite
this progress, green buildings have not come far enough, fast enough to address the challenges that face
our cities’ water infrastructure. A widespread adoption of more integrated systems that include supply,
treatment and reuse of water at the building and neighborhood scale is an important strategy for increasing
the resiliency of our water systems.
The incorporation of decentralized strategies for water supply, on-site treatment and reuse requires a
major shift in the mindset of how buildings are conceived, designed, regulated, built and operated. Insight
into the current conditions of our water systems and their associated environmental, social and economic
risks provides the background and context for why this is a necessary shift. Movement toward a “soft
path” for water management through decentralized and distributed-scaled systems offer alternatives for
communities willing and/or forced to re-think their path forward.
BEST MANAGEMENT PRACTICES FOR DECENTRALIZED WATER SYSTEMS
Best management practices (BMPs) for net zero water buildings emphasize closed-loop systems, ultra-
use and diverse, locally appropriate infrastructure. Establishing a water balance (a numerical account of
how much water enters and leaves the boundaries of a project) is a critical step in understanding water
provide educational opportunities for building occupants.

Toward Net Zero WaterPage 2
This report contains an overview of best practices for decentralized and distributed water strategies
organized by the following subjects:
Rainwater harvesting, including strategies for potable and non-potable uses
Greywater reclamation and reuse
On-site wastewater treatment and reuse, including composting toilets
Best practices for the design and implementation of on-site stormwater management systems and for
achieving net zero water goals.
Each BMP chapter describes major system components, how the systems work and background on
and integration with other building systems. Case studies of innovative projects from around the globe are
highlighted in each chapter. The additional resources section located at the end of the chapter describes
FURTHER RESEARCH
The amount of research and literature available on alternative water systems is staggering. However, more
comprehensive information and design guidance is needed on balancing available on-site water supplies,
including rainwater and recycled water, with occupant demand. More on-the-ground demonstration
projects also are needed to showcase BMPs and inform future net zero water efforts. Additional research
is needed in the following areas to support and empower the next generation of innovative water projects:
Broader evaluation of public health and safety risks
Lifecycle assessment investigating the environmental impacts associated with various strategies
Chlorine disinfection for treatment of on-site rainwater harvesting systems
Climate change and resiliency of fresh water supplies
Occupant behavior related to water use in buildings
Presence of pharmaceuticals and other chemicals found in water supplies
Increasing water demands for urban agriculture
An extensive bibliography of sources uncovered during the literature review is located at the end of the
report and provides a list of references for further research.

INTRODUCTION

Toward Net Zero WaterPage 2
INTRODUCTION
Good, quality water is a diminishing resource. There is growing consensus that the water
1 Already, more than 900 million people on
this planet do not have access to safe drinking water, and 2.6 billion are not using safe
sanitation practices.2 As a species, we must generate a healthy relationship with water if
we want to survive and protect the biodiversity of the planet. Implementation of sustainable
water use will require the combined efforts of regulators, designers and users. This
document is intended to help regulators and designers of urban systems understand best
practices for creating water systems that allow building occupants to reduce the impacts of
their use.
CURRENT CHALLENGES AND OPPORTUNITIES: WATER AND WASTE
Of all the Earth’s water, 97.5 percent is salt and 2.5 percent is fresh water. Of that fresh
water, only 1 percent (.007 percent of the total water) is readily accessible for human use.
Seventy percent of the world’s water is used for agriculture, 22 percent for industry and 8
percent for domestic use. In high-income countries like the United States, approximately
30 percent of our fresh water is used for agriculture, 59 percent for industry and 11 percent
1 Furumai, H. “Rainwater and reclaimed wastewater for sustainable urban water use”. Physics and Chemistry of the Earth, Parts A/B/C, 2008.
2 Corcoran, E., C. Nellemann, E. Baker, R. Bos, D. Osborn, H. Savelli (eds). 2010. Sick Water? The central role of wastewater management in sustainable development. A Rapid Response Assessment. United Nations Environment Programme, UN-‐HABITAT, GRID-‐Arendal.
months in the womb, when we are literally enveloped by it, to life outside the
womb, where we need to be constantly replenished with eight to ten cups of clean
water each day to survive.”
—Jason F. McLennan, CEO, Cascadia Green Building Council

Introduction Page 3
for domestic use.3 Clearly, reducing demand from the agricultural and industrial sector
should be prioritized for addressing the world water crisis. However, urban water issues
time in history, more humans live in cities than outside cities. We are an increasingly urban
species, and our water systems are ever more important as a result.
Here in the United States, we have enjoyed a half-century of nearly universal access to
abundant supplies of potable water. But serious and sustained droughts in the south and
population growth will exert more demand on water systems while climate change is
(GAO) survey found that water managers in 36 states anticipate water shortages by 2020.
These challenges will require a more sustainable approach to using water resources,
looking at not only how much water is used but also the quality of water needed for each
use.4
3 “Ten Things You Should Know About Water.” Circle of Blue WaterNews. N.p., October 2010.
4 Kloss, Christopher, Managing Wet Weather with Green Infrastructure: Rainwater Harvesting Policies: US EPA, 2008.

Toward Net Zero WaterPage 4
57%
33%
10%
FIGURE I-3. TYPICAL DAILY WATER USE FOR HOTELS
Source: Kloss, Christopher. Managing Wet Weather with Green Infrastructure: Rainwater Harvesting Policies: US EPA, 2008.
While potable water is used almost exclusively for domestic uses, Figure I-1 shows
approximately 80 percent of demand for a typical residential building does not require
potable water. Similar trends exist for commercial water use. Figures I-2 and I-3 provide
examples of daily commercial water usage.
FIGURE I-1. TYPICAL DOMESTIC DAILY PER CAPITA WATER USE
Potable Indoor Daily Uses:Showers 11.6 gal.Dishwashers 1.0 gal. Baths 1.2 gal. Faucets 10.9 gal. Other uses, leaks 11.1 gal.
Non-Potable Indoor Daily Uses:Clothes washers 15.0 gal.Toilets 18.5 gal.
58%
21.7%
20.3%
14%
48%
38%
FIGURE I-2. TYPICAL DAILY WATER USE FOR OFFICE BUILDINGS
Potable indoor uses
Non-potable indoor uses
Outdoor uses

Imag
e: Is
land
Woo
d
Students learn about on-site wastewater treatment at IslandWood’s Living Machine®.
Introduction Page 5
majority of water is used in a one-time, pass-through manner with little attempt at reuse.
Our centralized, big-pipe infrastructure relies on an industrial model of specialization
and economies of scale.5 Though designed and managed primarily to protect the public
intensive in their transport and treatment of water and pose serious social, environmental
and economic risks for urban American communities. Further, these systems are riddled
hydrological and ecological regimes. According to the 2009 American Society of Civil
Engineers Report Card, our nation’s water and wastewater infrastructure scored a D- with
In this time of growing water crisis, it is critical that we re-imagine our water systems
in which more environmentally, socially and economically responsible system design
infrastructure with smaller-scale integrated systems that incorporate rainwater capture,
imagination. These systems are the subject of this report, which addresses best practices
for their implementation within U.S. cities that allow or are open to allowing the inclusion of
distributed systems within the water solution for future sustainability.
5 Nelson, Valerie. “New Approaches in Decentralized Water Infrastructure.” Decentralized Water Infrastructure, 2008

Toward Net Zero WaterPage 6
REFERENCES
Corcoran, E., C. Nellemann, E. Baker, R. Bos, D. Osborn, H. Savelli (eds). 2010. Sick Water?
The central role of wastewater management in sustainable development. A Rapid Response
Assessment. United Nations Environment Programme, UN-HABITAT, GRID-Arendal. www.
grida.no.
Furumai, H. “Rainwater and reclaimed wastewater for sustainable urban water use”.
Physics and Chemistry of the Earth, Parts A/B/C (2008): 340-346.
Kloss, Christopher, Managing Wet Weather with Green Infrastructure: Rainwater
Harvesting Policies: US EPA, 2008.
Nelson, Valerie. “New Approaches in Decentralized Water Infrastructure.” Decentralized
Water Infrastructure. (2008): 1-79.
“Ten Things You Should Know About Water.” Circle of Blue WaterNews. N.p., October 2010.
Web. October 2010. (www.circleofblue.org).

CONTEXT AND BACKGROUND
8
11
17
20
SECTIONS
History of Centralized Water Systems
Current Conditions: Environmental, Social & Economic Risks
Moving Forward: A Vision for Net Zero Water
Current Barriers to Net Zero Water

Toward Net Zero WaterPage 8
HISTORY OF CENTRALIZED WATER SYSTEMS
By the mid to late 18th century, most large U.S. municipalities installed underground fresh
water conveyance systems. Basic stormwater systems were installed at the end of the 18th
century, and by the middle of the 19th century, centralized water-carriage sewer systems
became the standard over privy vault-cesspool systems.
The water-carriage system solved some problems and created others, especially in more
densely populated communities. Many city residents accepted the sanitation problems
and foul odor as an unavoidable part of urban life.6 Open sewers lined the streets and
households cast their biological waste products into the streets below. City boosters,
wishing to clean up the urban image and attract both residents and industries, advocated
for centralized waste management and sewer systems.
Opponents to centralized waste management and sewers argued that a source of fertilizer
would be lost, soil and water supplies would be polluted at the system outfalls and that
“modern sewer systems” would create and concentrate “disease-bearing sewer gas”.7
The debate over the design of centralized systems was split between the argument for
combined sewer systems versus separated sewer systems. The combined sewer systems
used a single pipe to transport both stormwater and wastewater to a designated disposal
location, as opposed to the separated sewer systems, which required laying two pipes.
Many cities installed combined systems because they were less expensive to build.
6 Burrian, Steven J., Stephan Nix, Robert E. Pitt, and S. Rocky Durrans. “Urban Wastewater Management in the United States: Past, Present, and Future.” Journal of Urban Technology. 7.3, 2000.
7 Ibid.
CONTEXT AND BACKGROUND

Context and Background Page 9
It wasn’t until late in the 19th century that the relationship between wastewater and
of waterborne illnesses such as cholera and typhoid. Using chlorine to disinfect drinking
water became prevalent in the early 1900s. Treatment of wastewater utilizing tanks and
more common by 1910-1920. Dewatering techniques were also developed, successfully
producing a by-product sold as fertilizer. As systems developed in the 20th century, the
preferred choice for treatment plants. Many cities ended up with “compound systems”
that included a combined sewer system in some districts and a separated sewer system in
newer districts. This is the legacy of our urban water systems.
Wastewater treatment became widespread
after the introduction of federal funding
with the Water Pollution Control Act of
1948. The WPC Act provided planning,
assistance by the federal government to
state and local governments for sanitary
infrastructure. The WPC Act was amended
in 1965, establishing uniform water quality
standards and creating the Federal Water
Pollution Control Administration authorized
to set standards where states failed to do
so. In 1970 the Environmental Protection
Agency (EPA) was created.
In 1972, the Clean Water Act was passed
to limit pollution of freshwater sources.
In 1974, the Safe Drinking Water Act
was adopted to regulate public water
must be closely monitored and reported
to residents should those contaminants
exceed maximum allowable levels. Since
the 1970s, federal, state and municipal
governments have closely monitored
American drinking water systems. For in New York City.

Toward Net Zero WaterPage 10
decades federal funding for water supply and sanitation was provided through grants to
local governments. After 1987, the system was changed to loans through revolving funds
that have favored big-pipe infrastructure.
Increased water quality standards and regulation, coupled with advancements in water
treatment and delivery and wastewater disposal systems, have dramatically improved
human health in American cities. These systems have also altered human settlement
patterns by allowing communities to grow beyond the carrying capacity of their local
eco-systems as “water-on-demand” and “waste-be-gone” systems became standard.
Cities across America must face big decisions about how they will continue to meet the
water and wastewater needs of their growing communities while continuing to protect
public health. The business-as-usual approach is to rebuild and expand the existing
systems without considering alternative solutions. In evaluating alternatives, it is
important to understand the associated environmental, social and economic risks of each
option. As communities risk bankruptcy in order to maintain aging infrastructure, prudent
consideration of decentralized and distributed systems is crucial to help address the
Centralized water treatment facility.

Context and Background Page 11
CURRENT CONDITIONS: ENVIRONMENTAL, SOCIAL & ECONOMIC RISKS Centralized water collection and treatment systems have greatly improved overall public
ENVIRONMENTALDisruption of natural hydrology within the watershed
The ecological impacts of large dams and water treatment projects have become a growing
percolation have far-reaching effects on a watershed’s ecological health. At its healthiest,
a freshwater system maintains a state of dynamic equilibrium, yielding crucial ecological
functions.8 To maintain this equilibrium, “mechanisms allow the ecosystem to control
external stresses or disturbances within a certain range of responses thereby maintaining
a self-sustaining condition”.9 Big pipe systems quickly move large volumes of water from
one watershed to another. This movement can cause the groundwater table to drop at the
source, creating a system imbalance. The disruption of a watershed’s equilibrium can
consequently cause high nutrient and pollutant concentrations in areas previously devoid
of such contaminants, compromising the quality of the ecological services these systems
provide.10 Large water infrastructure projects strain the resilience of these complex
watershed systems, making this very precious resource vulnerable.
Pollution into receiving bodies and vulnerability
Most sewer systems were designed as Combined Sewer Systems, where wastewater and
an economical way to prevent sewage backups into homes and businesses by releasing 11 The CSO is an obvious
8 Federal Interagency Stream Restoration Working Group (FISRWG) Stream Corridor Restoration; Principles, Processes and Practices. Washington, D.C.: FISRWG, 1998.
9 Ibid.
10Dammed.”, 04 Apr 1997. Web. 7 Sep 2010.
1103 Feb 2010. Web. 8 Sep 2010.
Toward Net Zero WaterPage 12
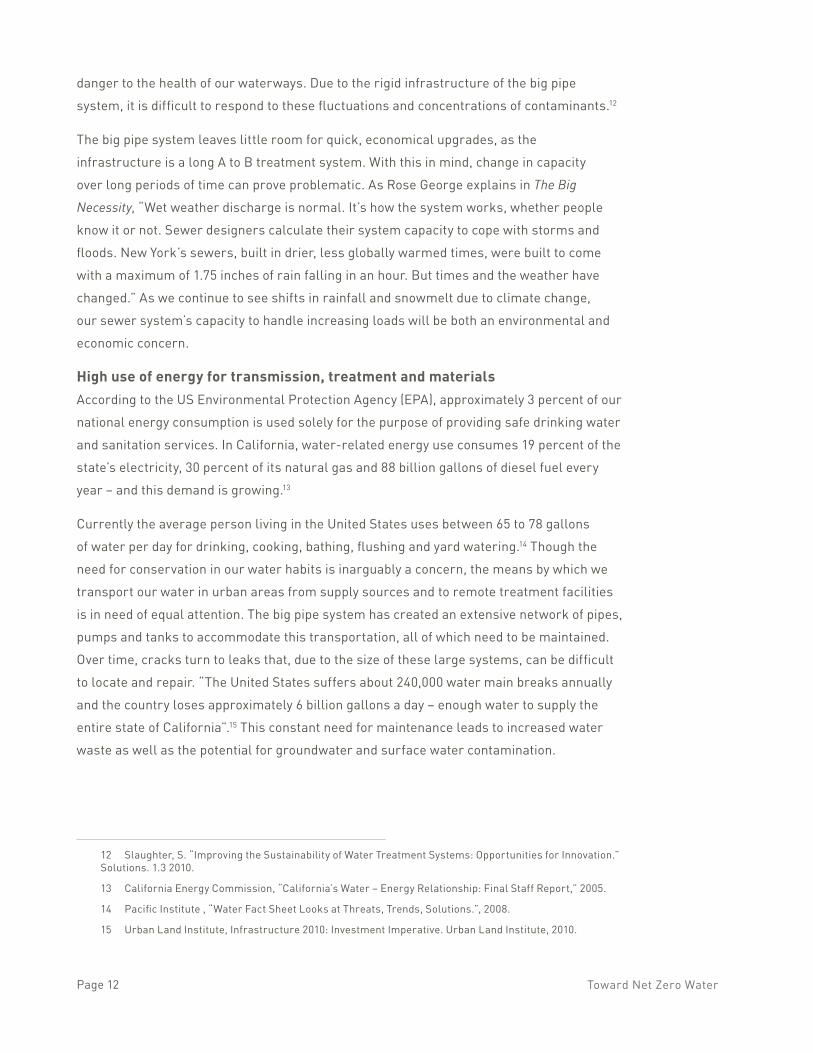
danger to the health of our waterways. Due to the rigid infrastructure of the big pipe 12
The big pipe system leaves little room for quick, economical upgrades, as the
infrastructure is a long A to B treatment system. With this in mind, change in capacity
over long periods of time can prove problematic. As Rose George explains in The Big
Necessity, “Wet weather discharge is normal. It’s how the system works, whether people
know it or not. Sewer designers calculate their system capacity to cope with storms and
with a maximum of 1.75 inches of rain falling in an hour. But times and the weather have
changed.” As we continue to see shifts in rainfall and snowmelt due to climate change,
our sewer system’s capacity to handle increasing loads will be both an environmental and
economic concern.
High use of energy for transmission, treatment and materials
According to the US Environmental Protection Agency (EPA), approximately 3 percent of our
national energy consumption is used solely for the purpose of providing safe drinking water
and sanitation services. In California, water-related energy use consumes 19 percent of the
state’s electricity, 30 percent of its natural gas and 88 billion gallons of diesel fuel every
year – and this demand is growing.13
Currently the average person living in the United States uses between 65 to 78 gallons 14 Though the
need for conservation in our water habits is inarguably a concern, the means by which we
transport our water in urban areas from supply sources and to remote treatment facilities
is in need of equal attention. The big pipe system has created an extensive network of pipes,
pumps and tanks to accommodate this transportation, all of which need to be maintained.
to locate and repair. “The United States suffers about 240,000 water main breaks annually
and the country loses approximately 6 billion gallons a day – enough water to supply the
entire state of California”.15 This constant need for maintenance leads to increased water
waste as well as the potential for groundwater and surface water contamination.
12 Slaughter, S. “Improving the Sustainability of Water Treatment Systems: Opportunities for Innovation.” Solutions. 1.3 2010.
13 California Energy Commission, “California’s Water – Energy Relationship: Final Staff Report,” 2005.
14
15 Urban Land Institute, Infrastructure 2010: Investment Imperative. Urban Land Institute, 2010.

Context and Background Page 13
SOCIAL/HEALTHPotential health risks from chlorination process
For more than a century, cities have treated drinking water with chlorine to prevent
waterborne diseases including cholera, typhoid fever and dysentery.16 Chlorine is now
added to water during the treatment process in order to destroy pathogens and hinder
odors, eliminate mold and algae growth in storage tanks and prevent microbial re-growth
as water is conveyed to its points of use. The Federal Safe Drinking Water Act of 1974
requires States to add chlorine to the water supply to reduce the risks associated with
waterborne illness.
Trihalomethanes (THM) is a group of four chemicals that form along with other disinfection
by-products when chlorine or other disinfectants react with naturally occurring
organic matter in water. The trihalomethanes are chloroform, bromodichloromethane,
dibromochloromethane and bromoform. THM levels tend to increase with pH, temperature,
time, and the level of organic matter present.
THMs are Cancer Group B carcinogens (shown to cause cancer in laboratory
animals). Trichloromethane (chloroform) is the most common in water systems.
Dibromochloromethane is the most serious cancer risk, (0.6 ug/l to cause a 10-6
cancer risk increase) followed in order by Bromoform (4 ug/l), and Chloroform (6 ug/l).
Current regulations limit the concentration of these four chemicals added together (total
trihalomethane or TTHM levels) to 100 ug/l.17
Lab animals exposed to very high levels of THMs have an increased risk of cancer. Several
studies with humans also have found a link between long-term exposure to high levels of
chlorination by-products and an increased risk of cancer. High levels of THMs may also
affect pregnancy. A California study found that pregnant women who drank large amounts
of tap water with high levels of THMs had an increased risk of miscarriage.18
Potential health risks from other chemicals, heavy metals, pharmaceuticals
The Safe Drinking Water Act of 1974 (SDWA) developed an enforceable maximum
contaminant level (MCL) for all regulated contaminants. Currently, 51 organic chemicals,
16 inorganic chemicals, seven disinfectants and disinfection byproducts (DBPs), four
radionuclides and coliform bacteria are monitored for compliance with the SDWA.
Amendments made to SDWA in 1996 added components that addressed source water
16 Health Canada. www.hc-sc.gc.ca/hl-vs/iyh-vsv/environ/chlor-eng.php.
17 “Disinfection By-Products—Trihalomethanes.” Wilkes University Center for Environmental Quality Environmental Engineering and Earth Sciences. Wilkes University, Sep 2010.
18 “Drinking Water Chlorination.” Healthy Living. Health Canada, 14 Dec 2006.

Toward Net Zero WaterPage 14
protection, operator training, funding for water system improvements and public
information requirements, ensuring better water quality.
Contaminants become regulated when they occur in the drinking water supply and are
considered a threat to public health. There are four types of known contaminants that are
tested for which can be broken down into four groups: Microbial Pathogens, Organics,
Inorganics and Radioactive Elements.
Though much has been done to prevent risks of contaminants entering our drinking water,
the size and age of our water infrastructure makes the risk of alternate point contamination
substantial proportion of waterborne disease outbreaks, both microbial and chemical, are
attributable to problems within distribution systems.
In an effort to improve water quality delivery, the National Academies Water Science
contamination of a large water distribution system. These methods include the utilization
of pathogen occurrence data, the surveillance of waterborne disease outbreak, and the
execution of an epidemiology study that isolates the distribution system component.
Increased consumption of pharmaceuticals and hormones has led to the presence of
these chemicals in our water stream. In 2008, the American Associated Press investigated
consume water that tested positive for trace pharmaceuticals. The effects of these trace

Context and Background Page 15
pharmaceuticals are not yet known as water quality standards do not currently test for
them. Research conducted in Europe by poisons expert and biologist Francesco Pomati is
preliminary but warrants further investigation. Pomati exposed developing human kidney
cells to a water mixture containing 13 drugs that mimicked the levels in Italian rivers. He
found that cellular growth was slowed by up to one-third the speed of unexposed cells.19
Testing for the presence of pharmaceuticals and more research on the effects of these
mixtures is needed.
Health risks from catastrophic system failures
Major catastrophe or malfunction of a big pipe system leaves its service population
vulnerable to contamination or without access to potable water. In 1975 a valve failure
townships in New Jersey, leaving residents with a shortage of water for ten days. Though
heavy rains were present, the culprit of the shortage was a simple mechanical failure.
Hurricane Katrina’s disastrous legacy in New Orleans was accelerated due to the
catastrophic failure of the levee system. This severe storm also affected a number of
water systems in cities across the region. The EPA estimated that more than 1,200 drinking
water facilities and 200 wastewater treatment facilities were affected.20
sewage treatment is one of the last services to get back on line, as these plants often exist
in the lowest lying areas. The big pipe system offers large solutions to a large population
but when failure occurs, it is time consuming for the system to become operational. A one-
point source of treatment also offers one point for concentrated contamination in the event
of a catastrophe.
Equity in distribution
into the future is costly to a community. As discussed in the economic section of this
chapter, these high initial costs may result in a disparity in water quality depending on a
recipient’s proximity to the centralized system. This disparity could affect the quality of
community planning and negatively impact development choices.
Disconnect from water source/waste stream
The big pipe paradigm moves our water from tap to treatment to tap again with little
user knowledge of what happens in between. The instant delivery of clean water is a
convenience that we take for granted. This convenience also disconnects us from an
19 Donn, Jeff, “PHARMAWATER-RESEARCH: Research shows pharmaceuticals in water could impact human cells,” Associated Press, n.d. Web. 7 Sep 2010.
20 Copeland, C. “Hurricane-Damaged Drinking Water and Wastewater Facilities: Impacts, Needs, and Response,” Congressional Research Service, Library of Congress, 2005.

Toward Net Zero WaterPage 16
understanding of our watershed system and
where our water comes from, also affecting
our understanding about how to best care of
this resource.
ECONOMICCapital costs of new or replaced
infrastructure
The nature of the big pipe paradigm
necessitates large amounts of
infrastructure, which requires increased
maintenance as the system ages. Population
growth places additional strain on older
systems, with increased density demanding
increased infrastructure in urban and
rural areas. According to John Crittenden
of Georgia Tech University’s Brook Byers
Institute for Sustainable Systems, “We
expect in the next 35 years to double the urban infrastructure, and it took us 5,000 years
to get to this point. So we better do that right. We better have a good blueprint for this as
we move to the future, so that we can use less energy, use less materials, to maintain the
life that we have become used to”.21 The many costs of this increase in infrastructure and
Water Infrastructure Network and others as they project a wastewater funding gap of $350
billion to $500 billion over the next 20 years.
Costs of a combined sewer system
If the average person living in the United States uses between 65 to 78 gallons per day, 22 This means that on a
drain. The big pipe system is designed to combine all grades of water and to treat it to the
same level regardless of how it will be used. This way of piping water creates excessive
waste with economic consequences. With the operational costs for treatment to potable
21Web. 7 Sep 2010.
22 Urban Land Institute, Infrastructure 2010: Investment Imperative. Urban Land Institute, 2010.
Up to 80 percent of system costs can be attributed to collection and conveyance of water.

Context and Background Page 17
standards being on average $2 per 1,000 gallons, both consumers and producers could be
spending much less by reducing potable water demands. 23
Inequity in cost distribution model & price distortion
High initial costs of big pipe systems take into consideration the future capacity of the
treatment facility. Communities that do not have the resources to cover these initial
expenses may opt to connect only certain portions of their community to centralized water,
leaving parts of the population without access to the same standard of clean water. In
addition, the total cost of big pipe systems may not be fully realized in some areas where
local water is scarce, such as the desert southwest. This misrepresentation of the actual
resource.
MOVING FORWARD: A VISION FOR NET ZERO WATER
The gap between projected demand and funding for drinking water infrastructure has been
estimated by the U.S. EPA to be as much as $267 billion over the 20-year span between
2000 and 2020. The situation for wastewater infrastructure is similar and Congress is not 24
In April 1997, the U.S. EPA concluded that “decentralized systems can protect public
health and the environment, typically have lower capital and maintenance costs for rural
communities, are appropriate for varying site conditions and are suitable for ecologically
sensitive areas when adequately managed”.25
Decentralized infrastructure could be second only to improved agricultural use in
forms of decentralized systems have long proved to be effective for improving water (and
energy) system performance, but recognition of this potential has been slow to gain ground.
Distributed systems operate at the margins of engineering practice, and construction of
big-pipe infrastructure continues.26
23 US EPA. Funding Decentralized Wastewater Systems Using the Clean Water State Revolving Fund. Washington, DC: US EPA, June 1999.
24 Etnier, Carl, Richard Pinkham, Ron Crites, D. Scott Johnstone, Mary Clark, Amy Macrellis, Overcoming Barriers to Evaluation and Use of Decentralized Wastewater Technologies and Management. London: IWA Publishing, 2007.
25 US EPA, Decentralized Wastewater Treatment Systems: A Program Strategy. Cincinnati: U.S. EPA Publications Clearinghouse, 2005.
26 Nelson, Valerie. “New Approaches in Decentralized Water Infrastructure.” Decentralized Water Infrastructure. 2008.

Toward Net Zero WaterPage 18
Urban water and waste systems management has been driven by technological, end-of-
pipe problem solving. The current dominant paradigm has evolved in a stepwise fashion,
has locked many communities into an approach with rapidly diminishing returns. The
complexity of challenges and dynamic nature of modern cities requires an integrated
approach that supports adaptability and innovation. Movement toward a “soft path” for
water management with decentralized and integrated technical systems and distributed
communities willing or forced to challenge their status quo.
THE WATER PETAL OF THE LIVING BUILDING CHALLENGEThe ‘soft path’ for water management emphasizes closed-loop
appropriate and commonly decentralized infrastructure.27 This
in the built environment, so that water is respected as a precious resource. Scarcity
of potable water is quickly becoming a serious issue as many countries around the
world face severe shortages and compromised water quality. Even regions that have
avoided the majority of these problems to date due to a historical presence of abundant
fresh water are at risk: the impacts of climate change, highly unsustainable water use
ahead.”
The Living Building Challenge Water Petal includes two imperatives. The primary focus of
this report is on meeting the demands of the Net Zero Water Imperative:
“One hundred percent of occupants’ water use must come from captured precipitation
or closed-loop water systems that account for downstream ecosystem impacts and
This prerequisite requires water systems to be primarily closed-loop, recirculating water
back to its source for eventual re-draw. This report includes best management practices
and technologies for catchment and use of rainwater, on-site reuse of greywater and on-
site treatment of sewage or blackwater. Case studies provide real-world examples of how
these distributed systems have been designed and implemented.
27 Chanan, A., J. Kandasamy, S. Vigneswaran, and D. Sharma. “A Gradualist Approach to Address Australia’s Urban Water Challenge.” Desalination. 249.3. 2009.

Context and Background Page 19
The second imperative under the Living Building Challenge Water Petal focuses on
Ecological Water Flow:
“One hundred percent of storm water and building water discharge must be managed
on-site to feed the project’s internal water demands or released onto adjacent sites
recharge, agricultural use or adjacent building needs.”
This report addresses on-site wastewater treatment but does not provide best
management strategies such as real cost pricing or public education. Other topics not
discussed here but very relevant to the success of these projects include the creation of
regulatory environments that allow and incentivize such systems, and the implementation
of strategies that ensure proper long-term system operation.
tool for campus educational programs. Image: Farshid Assassi courtesy of BNIM Architects

Toward Net Zero WaterPage 20
TOWARD GREATER EMBRACE OF DECENTRALIZED SYSTEMSIn her 2008 article “New Approaches in Decentralized Water Infrastructure,” Valerie
Nelson offers three steps toward greater embrace of decentralized water systems:
1. Incorporation of water concerns into the green building movement and funding of
community demonstration projects.
2. Support for a multi-faceted conversation about sustainable water infrastructure
with public bureaucrats and managers, system designers, entrepreneurs, activists
and the public.
3. Serious restructuring of water institutions and policies, including an integration
water, stormwater and wastewater; an expanded role for the private sector in
professional practice and community participation; and careful management and
stimulus of continuous innovation and reform.
barriers to decentralized systems.
CURRENT BARRIERS TO NET ZERO WATER
A variety of challenges exist for net zero water projects that seek to use best practices
around water conservation, rainwater harvesting, greywater and blackwater reuse in
distributed and on-site systems.
REGULATORY BARRIERSThe complexity of navigating the regulatory system around such systems at the local,
state and national levels presents the largest obstacle for project teams seeking approval
for net zero water projects. Currently, water is regulated across multiple jurisdictions
and agencies: plumbing codes enforced by local or state building departments; local and
state public health agencies regulating water supply and waste treatment; departments
of environmental quality and protection regulating stormwater management, reclaimed
water, and on-site wastewater treatment; and wetland and shoreline protection that may
involve approvals from local, state and national agencies such as the Corps of Engineers.
Some states such as Colorado have water rights laws governing rainwater harvesting,

Context and Background Page 21
Regulatory barriers to net zero water projects stem from the current bias for centralized
water supply and wastewater treatment and the associated lack of an authoritative body
with appropriate powers to operate, manage and regulate decentralized approaches.
Particularly in urban and suburban areas where development codes and public health
regulations require connections to public utilities, small-scale decentralized systems
system. Often, the regulations that do exist at the local, state and national levels overlap
are currently in place. Project teams are tasked with a lengthy or costly variance process to
seek approvals for net zero water strategies, costs that are rarely recoverable to a project
future projects or to guide future code updates.
Often overlooked are the code and regulatory barriers that exist in local land use and
development codes and in covenants, conditions and restrictions (CCR) declarations of
community associations. For instance, cisterns for rainwater collection systems can
with low-impact development strategies. Such was the case in a community in Maryland

Toward Net Zero WaterPage 22
where disconnecting downspouts and creating rain gardens to manage stormwater on-site
28 Other examples include
development codes that require connections to municipal utilities as a condition of building
permit issuance, and neighborhood-scale water systems that cross site boundaries or
public right of ways that are often not supported by any codes.
Many regulatory agencies are responding to net zero water strategies, though often in
disjointed and incremental ways. For example, the International Association of Plumbing
Uniform Plumbing and Mechanical Codes — has released a green supplement outlining
adopt. Additionally, local and state jurisdictions are beginning to open up legal pathways
for using greywater and rainwater for non-potable uses. But despite these and other
efforts, regulatory resistance persists against on-site potable water sources other than
wells, reuse of water for purposes other than subsurface irrigation, non-proprietary on-
composting toilets.
In order to create support for net zero water projects, a major shift from our current
regulatory framework is necessary. A more holistic approach to regulating water and waste
is needed at all agency levels in order to support innovative projects and drive future policies.
State and local building codes, land use codes and development standards must align to
comprehensively address on-site water supply, use, reuse and treatment practices with
systems. Most importantly, water regulations established to protect risks to public health
will need to be assessed and updated to fully account for current environmental, social and
economic risks related to centralized water systems, creating new standards in support of
more integrated water systems at the site and neighborhood scales.
FINANCIAL BARRIERSNet zero water projects rely upon on-site or distributed systems for water supply and
treatment otherwise managed at the municipal level by publicly-owned utilities. As such,
the cost burden for supply and treatment systems — as well as their ongoing operation,
maintenance and replacement needs — are shifted from the utility to the individual project
28 Eisenberg, David, Sonja Persram. Code, Regulatory and Systemic Barriers Affecting Living Building Projects, Seattle: Cascadia Green Building Council, 2009.

Context and Background Page 23
for utilities to develop fee structures and incentives to support the transfer of capital cost,
expense and revenues to offset an owner’s upfront investment in on-site water systems.29
A project owner’s upfront investments in rainwater harvesting systems, water-conserving
periods, since not all utilities use full cost pricing to establish rates for water and
wastewater services.
Full cost pricing factors into account all costs — past and future, operations, maintenance
and capital costs — into utility prices and can encourage conservation and reuse strategies
employed by net zero water projects. Utilities can also utilize alternative pricing structures
to encourage conservation such as block rates that increase the per-unit charge for
services as the amount used or generated increases, or surcharge rates imposed on
above-average water use.30
for net zero water projects. Examples include New York City’s Comprehensive Water Reuse
29 Paladino and Company, Inc. Onsite Wastewater Treatment Systems: A Technical Review. Seattle: Seattle Public Utilities, 2008.
30 US EPA. “About Water & Wastewater Pricing.” Sustainable Infrastructure. US EPA, 08 Apr 2010.
TABLE C-1: TRANSFERRING COSTS AND BENEFITS FROM UTILITY TO OWNERCAPITAL COSTS EXPENSES REVENUE
Utility
New central treatment facilities
Water delivery infrastructure
Operations and maintenance
Insurance
User fees (rates and permits)
System development charges (utility connection fees)
New connections, repairs and rebuilds
Taxes
Costs, Expenses, and Revenue Shifted from the Utility to the Owner
Owner
Onsite treatment system
Dual plumbing
Collection systems
Operations and maintenance
Insurance
Reduced water use and discharge fees,
reduced permitting fees
Reduced connection fees
Repairs and rebuilds Grants/incentives
Source: Onsite Wastewater Treatment Systems: A Technical Review prepared by Paladino & Co. 2008 for Seattle Public Utilities

Toward Net Zero WaterPage 24
Incentive Program, which provides project owners a 25 percent discount on water services
for reducing demand on the city’s infrastructure for water supply and wastewater services. 31
Likewise, some state agencies offer regulatory compliance credits, smaller impact fees
using low-impact development techniques. While many low-impact development projects
have demonstrated 15-80 percent lower capital costs for project owners in comparison
to conventional methods,32
reductions in stormwater discharge fees.
American Recovery and Reinvestment Act of 2009 provided $4 billion for the Clean Water
State Revolving Fund. Of that, 20 percent of each state’s capitalization grant can go toward
describes decentralized wastewater systems as being well positioned for funding under
the Green Reserve projects. In addition, Section 319 of the Clean Water Act provides the
statutory authority for EPA’s Non-point Source Program. According to the U.S. EPA, most
states have non-point source management plans that allow for the use of Section 319
funds for decentralized wastewater system projects and decentralized system technology
demonstration projects.33
Financial barriers for distributed water systems can be directly related to the regulatory
barriers noted above. Backup or redundant connections to municipal water and wastewater
utilities may be required by codes even when a net zero water project is designed
and operated not to use them. Composting toilets sometimes require backup sewer
to even consider their use. Likewise, capacity charges are established by utilities to recoup
sunk costs for large investments in centralized infrastructure projects and are required to
be paid by all building projects located within their service area, regardless of whether or
not on-site systems can be utilized to meet individual supply and treatment needs.
Some municipalities have instituted innovative fee structures, such as the City of Portland’s
Bureau of Environmental Services in Oregon, which allows for emergency-only connections
31 Eisenberg, David, Sonja Persram. Code, Regulatory and Systemic Barriers Affecting Living Building Projects.
32 US EPA. Reducing Stormwater Costs through Low Impact Development (LID) Strategies and Practices. Washington, DC: US EPA, 2007.
33 US EPA. Funding Decentralized Wastewater Systems Using the Clean Water State Revolving Fund. Washington, DC: US EPA, June 1999.

Context and Background Page 25
to their wastewater treatment facilities but charges large use fees in the event that the
utility connection is actually needed.
Removing regulatory barriers to decentralized systems can help spur market innovations
and new products available to designers and homeowners pursuing net zero water
strategies, thus bringing down upfront costs and reducing life cycle cost payback periods.
systems have been accelerating market adoption of lower energy products and strategies.
The energy sector provides a good example of how similar approaches can be used to
accelerate advancements in on-site water systems.
CULTURAL BARRIERS
water projects. Such fears are rooted in our historical management of water and waste
and the resulting public health issues that have surfaced. Previous generations suffered
greatly from typhoid fever, cholera and dysentery until laws and regulations were passed to
support water-carriage removal of waste from urban areas.34 Today, education is needed to
assure the public of the safety of modern decentralized water systems and inform them of
Thanks to a history of disease outbreaks, coupled with marketing efforts by early
advanced than any other solution for dealing with our water and waste. On-site systems
are reminiscent of stepping backwards in time and technology to a less developed
age. Education and awareness building among regulators, designers, engineers and
building occupants is necessary to fully highlight the environmental risks associated
with wasteful practices. Water that has been treated for drinking purposes, requires
large inputs of energy to be conveyed to buildings, contaminated with human excrement,
conveyed away again and treated with energy-intensive processes that release polluted
water back into the environment does not represent our best technological advancements.
Addressing cultural barriers around decentralized water systems requires a shift in the
fundamental ways in which we view water and human waste. Instead of the current “out of
site, out of mind” thinking, we need to take ownership not only of how we use water inside
our buildings and for irrigation, but how we operate, maintain and replace on-site systems
over time. In doing so, we will treat water as the precious resource that it is.
34 Burrian, Steven J., Stephan Nix, Robert E. Pitt, and S. Rocky Durrans. “Urban Wastewater Management in the United States: Past, Present, and Future.” Journal of Urban Technology. 7.3 (2000): 33-62

Toward Net Zero WaterPage 26
REFERENCES
Burrian, Steven J., Stephan Nix, Robert E. Pitt, and S. Rocky Durrans. “Urban Wastewater
Management in the United States: Past, Present, and Future.” Journal of Urban Technology.
7.3 (2000): 33-62.
California Energy Commission, “California’s Water – Energy Relationship: Final Staff
Report,” (2005): 1-180.
Copeland, C. “Hurricane-Damaged Drinking Water and Wastewater Facilities: Impacts,
Needs, and Response,” Congressional Research Service, Library of Congress, 2005: 1-6.
Chanan, A., J. Kandasamy, S. Vigneswaran, and D. Sharma. “A Gradualist Approach to
Address Australia’s Urban Water Challenge.” Desalination. 249.3 (2009): 1012-16.
“Disinfection By-Products—Trihalomethanes.” Wilkes University Center for Environmental
Quality Environmental Engineering and Earth Sciences. Wilkes University, n.d. Web. 7 Sep
2010. http://www.water-research.net/trihalomethanes.htm.
Donn, Jeff, “PHARMAWATER-RESEARCH: Research shows pharmaceuticals in water
could impact human cells,” Associated Press, n.d. Web. 7 Sep 2010. http://hosted.ap.org/
specials/interactives/pharmawater_site/day1_03.html
“Drinking Water Chlorination.” Healthy Living. Health Canada, 14 Dec 2006. Web. 7 Sep
2010. http://www.hc-sc.gc.ca.
Eisenberg, David, Sonja Persram. Code, Regulatory and Systemic Barriers Affecting Living
Building Projects, Seattle: Cascadia Green Building Council, 2009. (2010): 1-90.
Etnier, Carl, Richard Pinkham, Ron Crites, D. Scott Johnstone, Mary Clark, Amy Macrellis,
Overcoming Barriers to Evaluation and Use of Decentralized Wastewater Technologies and
Management. London: IWA Publishing, 2007.
Federal Interagency Stream Restoration Working Group (FISRWG) Stream Corridor
Restoration; Principles, Processes and Practices. Washington, D.C.: FISRWG, 1998.
Health Canada. Drinking Water Chlorination. Website. www.hc-sc.gc.ca/hl-vs/iyh-vsv/
environ/chlor-eng.php.

Context and Background Page 27
resilient.”. Web. 7 Sep 2010. http://spectrum.ieee.org/podcast/green-tech/conservation/
King County, 03 Feb 2010. Web. 8 Sep 2010. http://www.kingcounty.gov/healthservices/
health/ehs/toxic/cso.aspx.
Nelson, Valerie. “New Approaches in Decentralized Water Infrastructure.” Decentralized
Water Infrastructure. (2008): 1-79.
2010 http://www.pacinst.org/reports/water_fact_sheet.
Salmon Are Dammed.”, 04 Apr 1997. Web. 7 Sep 2010. http://www.psmfc.org/habitat/
salmondam.html.
Paladino and Company, Inc. Onsite Wastewater Treatment Systems: A Technical Review.
Seattle: Seattle Public Utilities, 2008.
Slaughter, S. “Improving the Sustainability of Water Treatment Systems: Opportunities for
Innovation.” Solutions. 1.3 (2010): 42-49. http://www.thesolutionsjournal.com/node/652.
Urban Land Institute, Infrastructure 2010: Investment Imperative. Urban Land Institute,
(2010): 1-90.
US EPA. “About Water & Wastewater Pricing.” Sustainable Infrastructure. US EPA, 08 Apr
2010. Web. 8 Sep 2010. http://water.epa.gov/infrastructure/sustain/about.cfm.
US EPA, Decentralized Wastewater Treatment Systems: A Program Strategy. Cincinnati:
U.S. EPA Publications Clearinghouse, 2005.
US EPA. Funding Decentralized Wastewater Systems Using the Clean Water State Revolving
Fund. Washington, DC: US EPA, June 1999.
US EPA. Reducing Stormwater Costs through Low Impact Development (LID) Strategies and
Practices. Washington, DC: US EPA, 2007.

Toward Net Zero WaterPage 28

BEST MANAGEMENT PRACTICES
30
34
36
37
41
SECTIONS
Integrated Water Management
Community Involvement
Risk Management
Beauty and Inspiration

Toward Net Zero WaterPage 30
BEST MANAGEMENT PRACTICES
This document provides guidance for teams pursuing net zero water projects and offers
insight to regulatory bodies seeking to better understand and evaluate the net zero projects
that come across their permitting desks. Central to the success of these systems is an
INTEGRATED WATER MANAGEMENT
In The Logic of Failure: Recognizing and Avoiding Error in Complex Situations, Dietrich Dorner
explains, “. . . in complex situations we cannot do only one thing. Similarly, we cannot
pursue only one goal. If we try to we may unintentionally create new problems.”
In dealing with complex systems, it is important to take an integrated or “systems thinking”
resources and activities within that system. Advantages of decentralized options are often
only apparent when taking a more integrated approach. For example, on-site reuse of
greywater can provide a partially drought-resistant source of landscape irrigation.35
An integrated or systematic approach to water system design gears all water-related
activities to one another, thereby recognizing the interconnected nature of water and
35 Etnier, Carl, Richard Pinkham, Ron Crites, D. Scott Johnstone, Mary Clark, Amy Macrellis, Overcoming Barriers to Evaluation and Use of Decentralized Wastewater Technologies and Management. London: IWA Publishing, 2007.

Best Management Practices Page 31
wastewater systems and allowing a concurrent evaluation of a whole system’s potential
to its release back into a larger system and on-site management of stormwater and other
distinction between them.”36
An integrated approach is necessary when attempting to create net zero water projects
with closed-loop systems where all of the water used on a project is being captured,
treated, used/reused and released on-site. In this report, rainwater harvest and
wastewater treatment and reuse are organized into separate chapters, and stormwater and
other landscape concerns are minimally addressed. This is simply a way to organize the
information and is not intended to imply that the related design processes are separate or
unrelated endeavors. To the contrary, an integrated approach is the single most important
process to be understood when considering the best practices for designing a water system
as part of a larger integrated design or process for an entire project.
ESTABLISHING WATER BALANCEA water balance is a numerical account of how much water enters and leaves a site. A
water balance sheet should contain detailed information about the amount of water used by
each process. The water balance is a crucial instrument to understand and manage water
detect leaks”.37 For a net zero water project, the amount of water entering and leaving a site
Bruggen and Braecken offer a “step-by-step method to optimize the water balance,” in
three steps:
1. Investigate the current water balance in detail.
2. Combine water consuming processes and reuse water where possible for other
purposes requiring a lower water quality.
3. Regenerate partial waste streams and re-introduce them into the process cycle.
Figure B-1 provides an overview of the multiple pathways design teams may choose to take
in establishing a water balance.
36 Buehrer, Mark. 2020 ENGINEERING. Bellingham, Washington. 1996.
37 Van der Bruggen, B., and Braeken L. “The Challenge of Zero Discharge: from Water Balance to Regeneration.” Desalination. 188.1-3, 2006.

Toward Net Zero WaterPage 32
trea
tmen
t + r
euse
USESOURCE
COM
POST
ING
FIX
TUR
ESEX
TER
IOR
USE
TREA
TMEN
T +
REU
SE
2
1
GROUND WATER
RAINWATER
ONSITE RECLAIMED WATER
OFFSITE RECLAIMED WATER
MUNICIPAL WATER
SURFACE WATER / STORM WATER
WATER
WATER
BATH/SHOWER
DRINKING FOUNTAIN
LAVATORY SINK
LAUNDRY
KITCHEN SINK
DISHWASHER
FIRE SUPRESSION
PROCESS WATER/HVAC
HIGH EFFICIENCY TOILET (HET)
TOILET WITH URINE SEPARATION
HIGH EFFICIENCY URINAL
WATERLESS URINAL
MICROFLUSH
COMPOSTING TOILET
EXTERIOR WATER USE/IRRIGATION
HET
PREFERRED
POSSIBLE
QUALITY OF WATER
POTABLE:Water suitable for drinking
NON-POTABLE:co-mingled water from
NON-POTABLE:water from bathroom sinks shower, bathtub, laundry
NON-POTABLE: water from kitchen sinks and dishwashers
NON-POTABLE: urine only, nutrient rich water
NON-POTABLE:
with urine separation
FIGURE B-1. DESIGN PATHWAYS TO NET ZERO WATER

Best Management Practices Page 33
REUSETREATMENT OUTFLOW
MEMBRANEBIOREACTOR
CONSTRUCTED WETLANDS/LIVING MACHINE
POTABLE
NON-POTABLE
INSIDE IRRIGATION
OUTSIDE SUBSURFACE FOOD CROP IRRIGATION
OUTSIDE SUBSURFACE LANDSCAPE IRRIGATION
DRAINFIELD
quality A
quality B
AQUIFER RECHARGE
AGRICULTUREFERTILIZER
COMPOSTING UNIT
RECEIVINGWATER BODY
LIQUID
COMPOST
BIOFILER
OTHER
OFF-SITE TREATMENT

Imag
e: P
erki
ns +
Will
Toward Net Zero WaterPage 34
FIT AND EFFICIENCY
Designers face the challenge of choosing the right water system, at the right place, at the
account for environmental, social and economic risks associated with the system, both
on and offsite. Flows include rainwater, stormwater, groundwater, drinking water and
from cradle to grave or, even better, from cradle to cradle”.38 It is critical to make the
CLIMATERegional climate is a major consideration when choosing and sizing a project’s water
much as 140 inches of precipitation per year. However, those same areas receive nearly
different major climate zones and sizable variability within those zones.39
38 United Nations Environment Programme, Every Drop Counts: Environmentally Sound Technologies for
39 US Energy Information Administration. “U.S. Climate Zones for 2003 CBECS.” Independent Statistics and Analysis. US Energy Information Administration, n.d. Web. 8 Sep 2010
The Center for Urban Waters in Tacoma, WA, harvests rainwater in two 36,000-gallon above ground cisterns.

Best Management Practices Page 35
Further, the warming of the climate due to human and non-human causes is already
progressively alter precipitation patterns across the United States in the coming decades.
An excess or lack of water with the change of precipitation patterns may present the
greatest hazard we face in building durable buildings and communities.
It is also important to consider the microclimatic conditions on the project site itself. The
macroclimate, or long-term weather conditions for a region, is derived from accumulated
day-to-day observations often made at weather stations far away from the towns and
present and likely to evolve on the site when making design decisions. Some of the main
surface (natural or manmade), vegetation and obstructions.40
Finally, it is important to consider that climate not only impacts the availability of
precipitation or groundwater for use. The amount of water required by humans and other
actors within a given climate varies enormously depending on environmental and climatic
conditions such as temperature and humidity.
FIT-FOR-USEThe vast majority of the water used in the U.S. is drawn from freshwater supplies of
Water Act. A large multifamily or commercial building can use more than 120,000 gallons
of potable water in a single day.41 Once used, the water is typically released as wastewater.
a system that utilizes potable water for virtually every end use, even when lesser quality
42
Treatment of water is a collective term for methods of improving the water quality by
physical, chemical and/or biological means. The level of water treatment should be
determined by the intended use or destination of the water. It is wasteful and not necessary
40 Sharples, Stephen, and Hocine Bougdah. Environment, Technology and Sustainability. New York: Taylor & Francis Group, 2010.
41 Yeang, Ken. Ecodesign: A Manual for Ecological Design. London: Brook House, 2008.
42 Kloss, Christopher, Managing Wet Weather with Green Infrastructure: Rainwater Harvesting Policies: US EPA, 2008.

Toward Net Zero WaterPage 36
can be reused directly in the building, often without treatment or with only primary
treatment.
FIT-FOR-SCALE
lend themselves to different scales of use. This report addresses three basic scales in an
urban context: the single family home, multifamily residential or commercial buildings,
and a neighborhood or campus. There is great diversity even within each of these individual
As suggested in the Living Building Challenge, the appropriate scale for a water system
may extend it beyond the boundaries of the project site.
“Depending on the technology, the optimal scale can vary when considering 43
The scale of the system can impact the scope and boundaries of a risk assessment for
the project. Systems that go beyond a project boundary also naturally expand the role of
community involvement during the planning phase.
COMMUNITY INVOLVEMENT
Water system proponents should decide on the appropriate level of community
participation to include in the planning stages of the project. The primary audience
for engagement would logically include community members that are the intended
risk associated with the system or whom might be otherwise impacted.
Multiple models exist for varying levels of community involvement in planning local
projects and infrastructure. These levels range in intensity from “consultation” to
“involvement” to “engagement”. Consultation implies only providing information to
a community and requesting feedback. Involvement implies the need for the water
system to be responsive to the community’s needs, and that the project leaders should
decide on the structures and decision-making processes in which to involve community
members. Engagement, the most intensive form of community participation, builds a fully
collaborative relationship with a community for both governance and system planning. A
43 McLennan, Jason, Eden Brukman. Living Building Challenge 2.0: A Visionary Path to a Restorative Future. Seattle: International Living Building Institute, 2009.

Best Management Practices Page 37
project team will decide on the appropriate level of community participation based on the
scale of the project.
In addition to seeking community input, the project team should communicate early and
design and permitting stages.
RISK MANAGEMENT
The design of a net zero water system is intended to help address and mitigate the large-
scale impacts associated with energy-intensive centralized systems. Of course, net zero
water systems also expose users and communities to potential risks. These risks should
be viewed in a broader sustainability context than that often used by the regulatory
community.
“Many in the building regulatory community continue to view ‘green’ and ‘sustainability’
goals as either trying to maneuver their way around minimum code requirements or as
optional goals that extend beyond their regulatory scope of concern or responsibility.
Meanwhile, the green building movement and . . . the Living Building Challenge
built projects — including all the current regulatory concerns — while simultaneously
seeking to address large, but currently unregulated risks to present and future
generations and to essential ecological integrity”.44
Net zero water projects must address social, environmental and economic risks that are
management framework is the most effective way to assure the appropriate quality of
water for the proposed end use. Decisions concerning the scope and boundaries of the risk
or other criteria. Criteria may also be affected by the perceptions of stakeholders and by
regulatory requirements. It is important to establish appropriate criteria at the outset that
correspond to the type of risks and the way in which risk levels are expressed.
44 Eisenberg, David, Sonja Persram. Code, Regulatory and Systemic Barriers Affecting Living Building Projects, Seattle: Cascadia Green Building Council, 2009.

Toward Net Zero WaterPage 38
the system from source to end use that includes:
All steps of the process, both within and outside the control of the project team
Source(s) of water
Proposed system components
Proposed end uses
Residuals produced from the system
Unintended or unauthorized end uses
Discharges or releases to the environment
Receiving environment and/or routes of exposure
Any additional considerations needed to maintain the quality and/or safety of the water
45
matrices are available for prioritizing hazards and identifying the tolerable level of risk
exposure. Risks to be considered can be grouped under three basic categories: social risk,
SOCIAL RISKThe provision of safe water and sanitation has been more effective than any other public
service in promoting public health. Distributed water systems should be designed and
operated without jeopardizing public health gains achieved historically via the adoption
of centralized delivery and treatment. Of greatest concern with the use of decentralized
systems is the associated health risk, especially the risk of exposure to microbial
pathogens and chemicals-of-concern potentially present in rainwater and recycled water.
Table B-1 lists potential hazards that may be present in water before, during or after
treatment. In addition to those presented in the table, trace constituents including caffeine,
estrogen and other hormones have also been detected in the United States.
Health risks can be mitigated with appropriate preventive measures that place barriers
between the rainwater/recycled water and members of the community. Examples of
preventive measures include water source protection46, water treatment, protection and
45 Adapted from New South Wales, Department of Water and Energy. Interim NSW Guidelines for Management of Private Recycled Water Schemes. 2008.
46 Source protection may include protecting rainwater from animal and human waste and controlling the quality of water discharged into greywater systems.

Best Management Practices Page 39
TABLE B-1: LIST OF POTENTIAL HAZARDS IN RECYCLED WATER
Adapted from the Australian Guidelines for Water Recycling, 2006.
POTENTIAL HAZARD
DESCRIPTION
Biological
Algae Simple chlorophyll-bearing plants, mainly aquatic & microscopic in size. Under suitable conditions, some types of algae may grow in untreated or partially-treated wastewaters, producing algal toxins such as microcyctins, nodularins, cylindropermopsin & saxitoxins.
Bacteria Unicellular micro-organisms typically smaller than 5 microns. Bacteria common to blackwater include pathogens such as Campylobacter, Salmonella, Clostridium, & Legionella.
Helminth An invertebrate that is parasitic to humans & other animals. Helminths include tapeworms, roundworms
Protozoa A phylum of single-celled animals typically ranging in size from around 1 to 300 nanometers.
Viruses Molecules of nucleic acid ranging in size from 20 to 300 nanometers that can enter cells & replicate in them. Some common viruses found in untreated blackwater include norovirus & enterovirus.
Physical
Hypoxia Oxygen depletion brought about by the bacterial breakdown of organic matter in the water.
pH An expression of the intensity of the basic or acid condition of a liquid.
Screenings The solid waste collected in the inlet screens to a treatment process including solids disposed of to wastewater.
Suspended solidsplankton & other microscopic organisms.
Chemical
Ammonia Ammonia dissolves rapidly in water & is a food source for some microorganisms, & can support nuisance growth of bacteria & algae. Ammonia can be a pollution indicator as it can formed as an intermediate product in the breakdown of nitrogen-containing organic compounds, or of urea from human or animal excrement.
Chloride Chloride comes from a variety of salts (including detergents) & is present as an ion (Cl-). Chloride is
to plants, especially if applied directly to foliage or aquatic biota.
Disinfection by-products
Disinfection by-products are formed from the reactions between disinfectants, particularly chlorine, & organic material. Chlorine reacts with naturally occurring organic components or ammonia to product by-products such as dicholoroacetic acid, trichloroacetic acid & THMs & chloramine by-products.
Metals Heavy metals, such as cadmium, chromium, & mercury may be present in raw wastewaters as a result of industrial discharges.
Pesticides Pesticides harmful to humans & a wide range of species may enter water systems by a variety of means including stormwater runoff, personal use & illegal disposal.
Pharmaceuticals Pharmaceuticals & their active metabolites are excreted by humans &/or disposed of directly into water systems.
Total dissolved solids
Total dissolved solids (TDS) include dissolved inorganic salts & small amounts of organic matter. Clay particles, colloidal iron & manganese oxides & silica may also contribute to TDS. Major salts in recycled waters may include sodium, magnesium, calcium, carbonate, bicarbonate, potassium, sulphate & chloride.
Total nitrogen An important nutrient found in high concentrations in recycled waters, originating from human & domestic wastes. In high concentrations can cause off-site problems of eutrophication of receiving bodies.
Total phosphorus Originating mainly from detergents but also from other domestic wastes, in high concentrations can cause eutrophication of receiving bodies.
Toward Net Zero WaterPage 40
maintenance of distribution systems and storages47, restrictions on the distribution and use
of recycled water48, and education of end users.
The most common and effective barrier used is treatment of the captured or recycled water
before use. The level of treatment and disinfection depends on the source of the recycled
water, the potential for fecal contamination and potential for exposure to community
members, which is generally determined by its intended use and release back into the
environment (See “Fit-for-use” above).
Beyond the more immediate health considerations, other social risks to address include
the system’s ease of operation and maintenance over its lifetime.
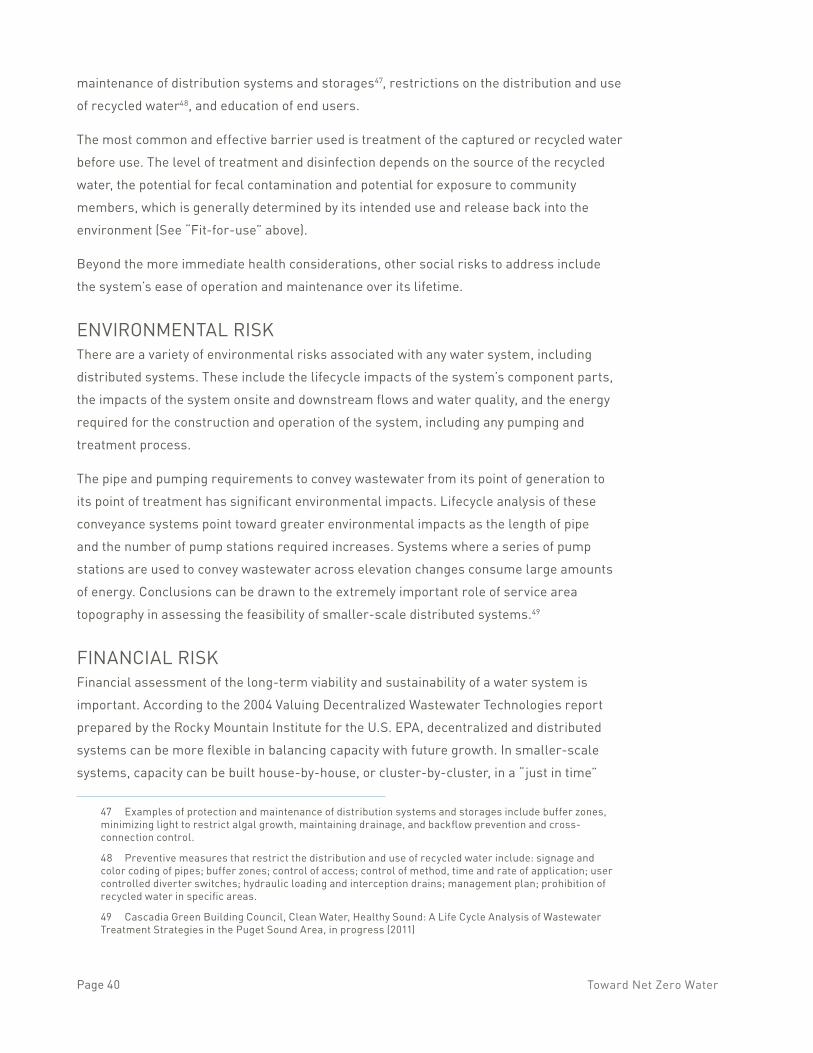
ENVIRONMENTAL RISKThere are a variety of environmental risks associated with any water system, including
distributed systems. These include the lifecycle impacts of the system’s component parts,
required for the construction and operation of the system, including any pumping and
treatment process.
The pipe and pumping requirements to convey wastewater from its point of generation to
conveyance systems point toward greater environmental impacts as the length of pipe
and the number of pump stations required increases. Systems where a series of pump
stations are used to convey wastewater across elevation changes consume large amounts
of energy. Conclusions can be drawn to the extremely important role of service area
topography in assessing the feasibility of smaller-scale distributed systems.49
FINANCIAL RISKFinancial assessment of the long-term viability and sustainability of a water system is
important. According to the 2004 Valuing Decentralized Wastewater Technologies report
prepared by the Rocky Mountain Institute for the U.S. EPA, decentralized and distributed
systems, capacity can be built house-by-house, or cluster-by-cluster, in a “just in time”
47 Examples of protection and maintenance of distribution systems and storages include buffer zones,
connection control.
48 Preventive measures that restrict the distribution and use of recycled water include: signage and color coding of pipes; buffer zones; control of access; control of method, time and rate of application; user controlled diverter switches; hydraulic loading and interception drains; management plan; prohibition of
49 Cascadia Green Building Council, Clean Water, Healthy Sound: A Life Cycle Analysis of Wastewater Treatment Strategies in the Puget Sound Area, in progress (2011)

Best Management Practices Page 41
fashion. This means that the capital costs for building future capacity is spread out over
time, reducing the net present value of a decentralized approach and resulting in less debt
to the community as compared to the borrowing requirements of a large up-front capital
investment. This is especially true in the event that a community sees less growth than
anticipated in their initial planning, leaving them with overbuilt capacity and a large debt to
be shared by fewer than expected residents.50
Larger centralized systems can realize economies of scale from a capital investment and
ongoing operations standpoint. Likewise, lenders perceive these types of systems as less
of a borrowing risk than smaller-scale or individual systems. Decentralization concentrates
contrast to the insurance-like spreading of risks of failure across large numbers of users.51
owners and the community in determining the best scale for water infrastructure.
BEAUTY AND INSPIRATION
The ultimate goal of a net-zero water building is to function like a natural ecological system,
and process accessible in the design will reinforce the positive contributions of the building
and remind users of the greater ecological water system that is being emulated. The
possibilities of water as an aesthetic and visceral force are obvious in the myriad uses such
mesmerize and calm us. Rainwater is a manifestation of the power of nature seen even in the
city, and celebrating this is an inspiring function of a living building.
50and economic analysis technique, 2004.
51 Ibid.

Toward Net Zero WaterPage 42
REFERENCES
Buehrer, Mark. 2020 ENGINEERING. Bellingham, Washington. 1996.
Eisenberg, David, Sonja Persram. Code, Regulatory and Systemic Barriers Affecting
Living Building Projects, Seattle: Cascadia Green Building Council, 2009.
Etnier, Carl, Richard Pinkham, Ron Crites, D. Scott Johnstone, Mary Clark, Amy
Macrellis, Overcoming Barriers to Evaluation and Use of Decentralized Wastewater
Technologies and Management. London: IWA Publishing, 2007.
Kloss, Christopher, Managing Wet Weather with Green Infrastructure: Rainwater
Harvesting Policies: US EPA, 2008.
McLennan, Jason, Eden Brukman. Living Building Challenge 2.0: A Visionary Path to a
Restorative Future. Seattle: International Living Building Institute, 2009.
Natural Resource Management Ministerial Council, Environment Protection and
heritage Council, and Australian Health Ministers’ Conference. Australian Guidelines
for Water Recycling: Managing Health and Environmental Risks 2006.
New South Whales Government Department of Water and Energy. Interim NSW
Guidelines for Management of Private Recycled Water Schemes. Sydney NSW.
Rocky Mountain Institute. Valuing Decentralized Wastewater Technologies: A catalog of
benefits, costs and economic analysis technique, 2004.
Sharples, Stephen, and Hocine Bougdah. Environment, Technology and Sustainability.
New York: Taylor & Francis Group, 2010.
United Nations Environment Programme, Every Drop Counts: Environmentally Sound
Technologies for Urban and Domestic Water Use Efficiency. Delft: UNEP, 2008.
US Energy Information Administration. “U.S. Climate Zones for 2003 CBECS.”
Independent Statistics and Analysis. US Energy Information Administration, n.d. Web. 8
Sep 2010. http://www.eia.doe.gov/emeu/cbecs/climate_zones.html.
Van der Bruggen, B., and Braeken L. “The Challenge of Zero Discharge: from Water
Balance to Regeneration.” Desalination. 188.1-3 (2006): 177-183.
Yeang, Ken. Ecodesign: A Manual for Ecological Design. London: Brook House, 2008.

RAINWATER HARVESTING
44
44
49
49
50
51
58
SECTIONS
System Components
Technology
Fit
Additional Design Considerations
Additional Resources

Toward Net Zero WaterPage 44
DEFINITION
reaches the ground is typically considered stormwater because its quality is often lower
due to greater potential for contamination. On-site management of stormwater has unique
opportunities for collection and reuse, but is outside the scope of this report.
There are three primary considerations when harvesting rainwater at any scale. First, the
SYSTEM COMPONENTS
ROOFSCAPEThe rainwater catchment area is equal to the roof footprint area as opposed to the
surface area of the roof (see Figure R-1). Any catchment surface must be kept clean and
free of debris. This includes cutting back any vegetation overhanging roof structures
and periodic washing of the roof to reduce pollen, leaves, animal droppings and other
particulates. During roof washing, downspouts should be directed away from the storage
tank to keep the stored water clean. If the catchment is meant for potable uses, the roof
should be clad in a nonreactive material such as enameled or painted metal, water-safe
elastomeric coatings, and most ceramic tiles and glass.52
53
52 Oasis Design. “Rainwater Harvesting.” N.p., October 2009. Web. October 2010.
53 Cunliffe, D. A. and National Environmental Health Forum. Guidance on the use of rainwater tanks. Adelaide: National Environmental Health Forum, 1998.
RAINWATER HARVESTING
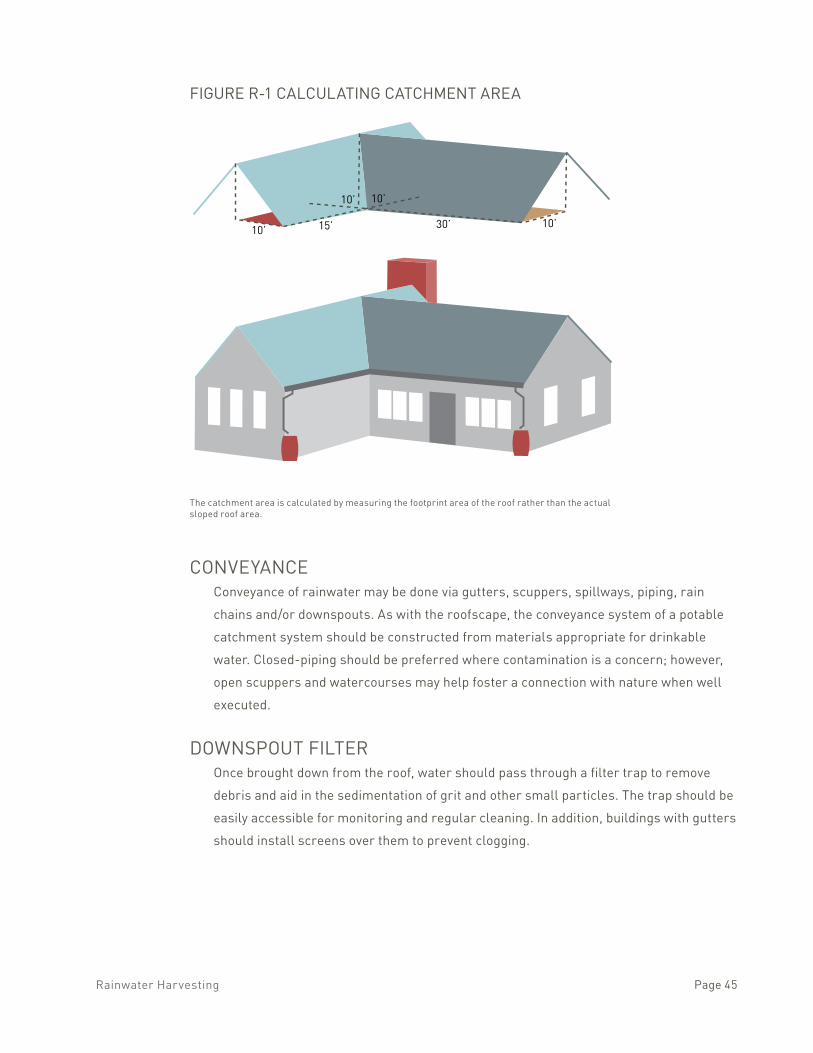
Rainwater Harvesting Page 45
FIGURE R-1 CALCULATING CATCHMENT AREA
CONVEYANCEConveyance of rainwater may be done via gutters, scuppers, spillways, piping, rain
chains and/or downspouts. As with the roofscape, the conveyance system of a potable
catchment system should be constructed from materials appropriate for drinkable
water. Closed-piping should be preferred where contamination is a concern; however,
open scuppers and watercourses may help foster a connection with nature when well
executed.
DOWNSPOUT FILTER
debris and aid in the sedimentation of grit and other small particles. The trap should be
easily accessible for monitoring and regular cleaning. In addition, buildings with gutters
should install screens over them to prevent clogging.
10’
10’
15’
10’
30’ 10’
The catchment area is calculated by measuring the footprint area of the roof rather than the actual sloped roof area.

Toward Net Zero WaterPage 46
FIRST FLUSH DIVERTER
accumulated on the roof between rainfalls. Many systems include a small side-pipe
that slowly drains this water to a soak-away area. Others choose to convey this water
into the water recycling system, recapturing it for use in the building. This optional
component should be considered by the designer based on location and local climate
conditions.
FIGURE R-2: FIRST FLUSH DIVERTER
3
5
SYSTEM COMPONENTS
1
2
3
Water from Roof Catchment
Diverter Chamber
Sealing Ball
4
5 Screened Flow Control Valve
42
1

Rainwater Harvesting Page 47
STORAGE
galvanized steel, plastic or concrete. Concrete cisterns will leach lime into the water 54 Such
cisterns should not be constructed from concrete mixes in which the lime is produced
by incinerating toxic waste.55
Rainwater cisterns may be located either above or below ground. For systems that will
store a large water volume, the lack of available surface space may dictate a below-
ground cistern. However, above-grade storage avoids excavation costs and allows for
more convenient monitoring and maintenance.
overall design for managing stormwater on-site.
54 Cunliffe, D. A. and National Environmental Health Forum. Guidance on the use of rainwater tanks. Adelaide: National Environmental Health Forum, 1998.
55 Oasis Design. “Rainwater Harvesting.” N.p., October 2009. Web. October 2010.
FIGURE R-3: RAINWATER HARVESTING SYSTEM
2
35
4
8
7
6
1
SYSTEM COMPONENTS
4
5
6
7
1
2
3
8
Catchment Area
Conveyance
Downspout Filter
Storage
Outlet
Pump and Filter
Distribution System

Toward Net Zero WaterPage 48
PUMPWater is often pressurized for use in plumbing and irrigation. On sites that allow for
gravity-fed systems, 2.3 ft of elevation can provide 1.0 psi of pressure. A number of
mechanical pumps are also available when gravity-fed systems are not plausible.
These pumps pressurize water as it is withdrawn from the tank and operate whenever
there is a water demand. Alternatively, a lower power pump may be used to lift the
provide pressurization.
TREATMENT SYSTEMRainwater is typically treated after storage and before use. Treatment for non-potable
from obstructing conveyance pipes and pumps.
Rainwater for potable use requires much higher levels of treatment to remove possible
pathogens as well as organic and chemical compounds. These types of uses require
ranging from 20 micron down to 1 micron prior to disinfection in order to remove
particulates.
method of sterilization to remove microorganisms from rainwater. While this process
is free of chemicals, it does require energy to power the UV lamps. Sterilization may
but some components must be replaced regularly.
MONITORING SYSTEM The last component of a rainwater harvesting system is a monitoring plan. Water levels
periodically. Some tanks will gather more sediment than others and may require
good maintenance, a rainwater harvesting system can insure quality water at the site
for decades before replacement is needed.

Rainwater Harvesting Page 49
TECHNOLOGY
Best practices for designing rainwater harvesting systems utilize relatively simple, low
technology methods for collection and storage of rainwater. Water should enter the cistern
near the bottom of the tank where it is calmed by means of a U-tube or diffuser to avoid
disturbing sediment in the tank. The supply outlet is typically located just below the water
adjacent buildings and properties. The tanks require regular monitoring and cleaning and
are best located in an area that is protected from light, debris and animals.
micro-organisms in the sediment form an ecologic system that ‘conditions’ water in the
tank. Care should be taken not to disturb these systems, which protect the tank walls and
prevent the intrusion of harmful bacteria.56
FIT
Given the generally high quality of rainwater, its best use in buildings will be for potable
and human contact uses like bathing 57,58. Freshly captured rainwater will generally not
recycling to meet non-potable needs and other water conservation measures, it has
potential to function as the sole source under many conditions.59 Water balance — equality
between supply volume and building demand — is necessary to maintain a net zero building.
In climates with fewer than 20 inches of rain per year, or in cases where the catchment
area or storage potential is outpaced by demand, this balance may not be possible at the
site scale and further sources such as recycling and offsite rainwater harvesting may be
necessary.
56 Cunliffe, D. A. and National Environmental Health Forum. Guidance on the use of rainwater tanks. Adelaide: National Environmental Health Forum, 1998.
57 Krishna, J. H. The Texas manual on rainwater harvesting. 3rd ed. Austin, Tex.: Texas Water Development Board, 2005.
58 Dugan, Cornelius J., and Donald A. Dolske. “A Twelve Year Study of Precipitation Chemistry in Philadelphia.” APT Bulletin Historic Structures in Contemporary Atmospheres 23. 1991.
59 Ghisi, Enedir, and Daniel F. Ferreira. “Potential for potable water savings by using rainwater and greywater in a multi-storey residential building in southern Brazil.” Building and Environment 42. 2007.

Toward Net Zero WaterPage 50
A well-sized and functioning residential rainwater system produces the highest quality
of water at a volume appropriate to its intended use at the lowest cost to the owner,
municipality and environment. Uses might be potable or non-potable, depending on
the constraints of the climate and site and the availability of other potable sources. The
for potable water.
At the commercial and multifamily scale, best practices for rainwater catchment view
be piped offsite. At this scale, rainwater provides an ecosystem service and catchment
building becomes an entity that diverts this resource for other uses before returning it
downstream.
At the campus or neighborhood scale, the design, construction and maintenance of a
rainwater harvesting system might be shared by the owner and operators of the municipal
investment in infrastructure. The community of owners, residents and users is responsible
for maintaining and operating the system, resulting in the community’s knowledge of and
connection to the greater water cycle.
EFFICIENCY
Rainwater harvesting shows great potential to reduce municipal water supply costs and
protect adjacent ecosystems. The U.S. EPA reports that “reducing [municipal] potable
water demand by 10 percent could save approximately 300 billion kilowatt-hours of
energy each year” in the U.S. alone.60 According to the University of Washington, “current
over the next decade”.61 Rainwater harvest and stormwater management in urban areas
stormwater management systems. Using rainwater as a water source has additional
potential to reduce the consumer’s water bills, and may result in savings in sewerage
charges in some municipalities.
60 Kloss, Christopher, Managing Wet Weather with Green Infrastructure: Rainwater Harvesting Policies: US EPA, 2008.
61 Booth, Derek. “Coping with stormwater—how much does it cost?” The Water Center Fact Sheets (2007). The Water Center. Jan. 2007. University of Washington.

Rainwater Harvesting Page 51
The largest cost of a rainwater harvesting systems is the storage tank(s). Therefore, the
the overall cost of the system. Under current practices in the U.S. where rainwater is used
harvesting system ranges from 10 to 15 years. Areas with higher municipal water costs
will see a faster payback.62 In Australia, where rainwater is used for a wider range of uses,
payback times in some households were calculated at fewer than seven years. However,
the Australian study found that in some arid cities with low-cost municipal water, rainwater
tank sizes were prohibitively expensive.63
ADDITIONAL DESIGN CONSIDERATIONS
SIZINGThe concept of water balance is key to the success of a rainwater harvesting system. Water
balance means that the volume of water needed is met by the amount of water collected.
1. Monthly rainfall amounts (historic data)
2. Estimated water demands
3. Size of catchment areas
Water conservation is an important part of any rainwater harvesting system design. If the
use volume is high but the catchment area and annual rainfall are low, rainwater harvesting
may not be feasible.
Many calculators exist to aid in determining water balance. The Washington State
Department of Ecology has produced a Rainwater Harvesting Calculator to help residents
size their system based on local climate conditions. Many municipalities also have simple
calculators for sizing residential systems. The more detailed the climate data, the more
accurate the results. The ideal data set provides daily rainfall totals collected at or close
62 Gray, Jonathan, and Jerry Yudelson. Rainwater Harvesting Becomes a Mainstream Sustainable Practice. Issue brief. Portland, OR: Interface Engineering.
63 Tama, Vivian W.Y. Leona Tam, S.X. Zeng “Cost effectiveness and tradeoff on the use of rainwater tank: An empirical study in Australian residential decision-making.” Resources, Conservation and Recycling 54. 2010.

Toward Net Zero WaterPage 52
to the site. More precise calculators will also include a reduction in total catchment due to
system losses such as evaporation.64
SYSTEM LOCATIONLocation of the catchment area away from contamination by leaves, pollen, animals or
industrial pollution is tantamount in the design of a harvesting system.
must be allocated for these functions. Careful consideration should be given to provide
easy access to these systems for maintenance.
Cisterns may be located above or below ground outside of the building footprint or
located within the basement of a building. Installation of above-ground tanks avoids
excavation costs, and access may prove easier than buried tanks. Above-ground systems
aesthetics more important. Below-ground tanks can allow greater capacity while freeing
up surface space; however, increased installation costs associated with excavation will
be incurred.
groundwater and recharges local aquifers. Proper planning and design integrates cistern
64 Roebuck, R.M., Ashley, R.M. “Predicting the hydraulic and life-cycle cost performance of rainwater harvesting systems using a computer based modelling tool” 7th International Conference on Urban Drainage Modeling 4th-6th April 2006 Melbourne, Australia.

Rainwater Harvesting Page 53
Cisterns should be located for easy
the site’s stormwater management strategy.
SYSTEM INTEGRATIONRainwater harvesting systems have the potential for integration into a wide number of
other building systems. They are ideally suited for incorporation into on-site stormwater
management strategies, allowing temporary storage after storm events and helping to
reduce runoff. They are also ideal for use in landscape irrigation, offsetting the need for
potable water. Further opportunities may exist to integrate rainwater cisterns into both
active and passive solar systems by providing a potential location for storage of thermal
energy prior to its use. Large storage tanks may both provide or require additional
structural support so careful attention is needed when designing them either on or near
other structures. Finally, catchment and conveyance systems may be integrated into
both interior and exterior spaces of a building in such a way that they provide a valuable
connection between occupants and the natural water cycles outside the building.

Toward Net Zero WaterPage 54
CASE STUDYDI DIEGO + FERRIS RESIDENCE
The Di Diego + Ferris residence is located on Lopez
Island in San Juan County, WA. In November of
2006 the owners began collecting rainwater from
a metal roof above their barn. The 3,000-sf roof
captures 1,800 gallons of rainwater for every inch
that falls. The 20,000-gallon steel storage tank,
three months of a heavy winter rainfall.
Though Di Diego + Ferris initially intended to use
the rainwater for irrigation purposes, they decided
early on to use rainwater for all of their household
and landscaping needs.
Location: Lopez Island, WA
Architect: INCLINEDESIGN
Engineer: Rainbank
Owner: C. Di Diego + J. Ferris
Scale: Residential
Filtration is essential for systems supplying potable
water for household use. The Di Diego + Ferris
rainwater catchment system was custom designed
an ARCSA (American Rain Catchment Systems
Association) accredited designer. San Juan County
also requires a building permit and inspections
to ensure that the foundation and structure meet
county regulations.
Rainwater is channeled through custom gutters
to two rainbarrels located at the base of each
Imag
es: C
arol
ine
Di D
iego

Rainwater Harvesting Page 55
downspout. Hidden from view,
inside the rainbarrels are baskets
holding a mesh liner and Chemex
passes though the barrel pre-
changed frequently to minimize
the organic matter entering
the tank. Because misty rain is
is not used and all rainwater is
collected from the roof.
The water is diverted from both
barrels to a sump box where it
is pumped into the storage tank. The sump box is
kept clean with frequent vacuuming & wiped down
inside with a bleach solution.
the water is drawn from the middle of the tank
where it is the cleanest, as heavy particles sink
to the bottom while lighter ones rise to the top.
sends excess water into the landscape. The tank is
low in the fall.
When water is needed the MQ pump pulls the
water to a small insulated room in the barn for
three times a year, and the ultraviolet bulb once
a year. There is an additional 1-micron absolute
in the house 100’ away from the barn. A 50-gallon
pressure tank at the house temporarily stores
household water and, when low, is pumped full by
the MQ pump in the barn.
Rainbank recommends testing at least once a
year, especially with a system like this which was
recharged with well water in a year of diminished
rainfall.
In many ways, the homeowners found that the
switch to using rainwater over well water was
dishes were no longer spotted by mineral residue
from the well water and they were able to eliminate
their water softener since there was no longer any
hard well water to treat. The use of rainwater also
other household appliances.
Di Diego + Ferris have altered their water
consumption patterns to be in sync with the
availability of rainwater. For instance, they schedule
power-washing and other high-water use activities
during the rainy season when the cistern will be

Toward Net Zero WaterPage 56
CASE STUDYURBAN WATERSCAPE, POTZDAMER PLATZ
Location: Berlin, Germany
Designer: Atelier Dreiseitl, Peter Hausdorf
Owner: City of Berlin
Scale: District
Built in 1998, Urban Waterscape showcases
rainwater harvesting at the urban redevelopment
scale as part of DaimlerChrysler Potzdamer
Platz. The project was designed to address
conservation and urban heat islands.
Rainwater is harvested from the rooftops of 19
buildings with a total catchment area of 50,000-m2.
A little more than half of the 23,000-m3 (approx.
6 million gallons) of rainwater harvested annually
is used for landscape irrigation and for the pools
and canals at the development site. The remainder
average, 80 percent of the annual water usage
rainwater.
underground cisterns sized to provide additional
storage in the event of extremely heavy rainfall.
From the cisterns, water is fed into a network
of canals built on the south side of the building
complex.
Green roofs located on approximately 60 percent
of the catchment rooftops serve multiple
functions. Water evaporating off the roofs creates

Rainwater Harvesting Page 57
microclimates that reduce urban heat islands,
lowering temperatures by a measured 2 degrees
C during summer months and reducing the overall
cooling demands of the buildings.
The canal installation at Potsdamer Platz has
helped to make the square one of Berlin’s greatest
tourist attractions, highlighting sustainable water
use and creating a recreational waterscape for the
city’s citizens and visitors. Vegetation in the canals
released to an adjacent river.
Imag
e: A
telie
r D
reis
eitl

Toward Net Zero WaterPage 58
ADDITIONAL RESOURCES
American Rainwater Catchment Systems Association
www.arcsa.org
Arizona Cooperative Extension - Rainwater Harvesting
http://ag.arizona.edu/pubs/water/az1052/harvest.html
Harvest H2O - Online Rainwater Harvesting Community
HarvestH2O.com
Managing Wet Weather with Green Infrastructure - Municipal Handbook
Rainwater Harvesting Policies
www.epa.gov/npdes/pubs/gi_munichandbook_harvesting.pdf
Oregon Smart Guide, Building Codes Division. Rainwater Harvesting
www.oregonbcd.org/pdf/3660.pdf
Rainwater Collection in Washington State
www.ecy.wa.gov/programs/wr/hq/rwh.html
The Texas Manual on Rainwater Harvesting
www.twdb.state.tx.us/publications/reports/rainwaterharvestingmanual_3rdedition.pdf
US Average Annual Precipitation Maps
www.wrcc.dri.edu/precip.htm
Rainwater Harvesting Page 59
REFERENCES
Bisbort, Alan “Kroon Hall Rainwater Harvesting System to Save Half-Million Gallons a
Year”.
Booth, Derek. “Coping with stormwater—how much does it cost?” The Water Center
Fact Sheets (2007). The Water Center. Jan. 2007. University of Washington. http://water.
washington.edu/Outreach/Publications/factsheets.html.
Correljé, Aad, and Thorsten Schuetze. Every drop counts: environmentally sound
of Technology, Industry and Economics, International Environmental Technology Centre,
2008.
Cunliffe, D. A. and National Environmental Health Forum. Guidance on the use of rainwater
tanks. Adelaide: National Environmental Health Forum, 1998.
Dugan, Cornelius J., and Donald A. Dolske. “A Twelve Year Study of Precipitation Chemistry
in Philadelphia.” APT Bulletin Historic Structures in Contemporary Atmospheres 23 (1991):
33-36.
Dupont, Patrick and Steve Shackel “7.3: Rainwater” Your Home Technical Manual Edition
4, Australia’s Guide to environmentally sustainable homes http://www.yourhome.gov.au/
technical/index.html.
Fagan, J. E., and Et al. “Dynamic performance metrics to assess sustainability and cost
effectiveness of integrated urban water systems.” Resources, Conservation and Recycling
In press (2010).
Ghisi, Enedir, and Daniel F. Ferreira. “Potential for potable water savings by using rainwater
and greywater in a multi-storey residential building in southern Brazil.” Building and
Environment 42 (2007): 2512-522.
Gray, Jonathan, and Jerry Yudelson. Rainwater Harvesting Becomes a Mainstream
Sustainable Practice. Issue brief. Portland, OR: Interface Engineering. http://www.
starkenvironmental.com/a-7-resources.html.

Toward Net Zero WaterPage 60
Haas-Arndt, Doris. Water cycles. Basel: Birkhäuser, 2009.
Kloss, Christopher, Managing Wet Weather with Green Infrastructure: Rainwater
Harvesting Policies: US EPA, 2008.
Krishna, J. H. The Texas manual on rainwater harvesting. 3rd ed. Austin, Tex.: Texas Water
Development Board, 2005.
Oasis Design. “Rainwater Harvesting.” N.p., October 2009. Web. October 2010. http://www.
oasisdesign.net/water/rainharvesting/index
Pickering, Phil, and Kym Whiteoak. “The economics of rainwater tanks and alternative
water supply options.” Marsden Jacobs Associates prepared for the Australian
Conservation Foundation, Nature Conservation Council (NSW) and Environment Victoria
(2007).
Purdue University. “Treatment Devices.” Water Quality Problems and Typical Solutions. 27
July 2010. http://www.purdue.edu/envirosoft/private/src/treat.htm.
Roebuck, R.M., Ashley, R.M. “Predicting the hydraulic and life-cycle cost performance of
rainwater harvesting systems using a computer based modelling tool” 7th International
Conference on Urban Drainage Modeling 4th-6th April 2006 Melbourne, Australia 546-53.
Tama, Vivian W.Y. Leona Tam, S.X. Zeng “Cost effectiveness and tradeoff on the use of
rainwater tank: An empirical study in Australian residential decision-making.” Resources,
Conservation and Recycling 54 (2010) 178–186.

GREYWATER RECLAMATION & REUSE
62
63
66
67
68
68
76
SECTIONS
System Components
Technology
Fit
Additional Design Considerations
Additional Resources

Page 62 Toward Net Zero Water
DEFINITION
Greywater systems involve on-site capture and reuse of water that would otherwise be
comingled with wastewater and conveyed offsite for treatment. The technologies and
systems described in this chapter include those that capture greywater on-site without the
need for extensive treatment prior to its reuse. In contrast, best management practices
for combined wastewater requiring treatment prior to reuse is covered in the following
chapter: Wastewater Treatment and Reuse.
There are many different ways to classify and
as light greywater from lavatory sinks, showers,
bathtubs, laundry and other process-related
water that does not come into contact with human
waste. Water from toilets and urinals is excluded.
Water from kitchen sinks and dishwashers is
called dark greywater due to its higher potential
for contamination with grease, fats and animal
products.
of contamination. This is often done in order to
evaluate the best opportunities for reclaiming and
treatment needed before reuse will vary based on
the “shade” or strength of the particular greywater
and the intended reuse application. Best practices
GREYWATER RECLAMATION & REUSE
COMMON CLASSIFICATIONS OF GREYWATER
Light Greywater: water from bathroom sinks,
shower, bathtub, laundry, drinking fountain,
and equipment condensate
Dark Greywater: water from kitchen sinks
and dishwashers
Combined Wastewater: co-mingled greywater
and blackwater from toilets and urinals
Note that the term reclaimed water is different
from greywater in that it is generally used to
describe municipal wastewater that has been
treated offsite and conveyed back to the building
for reuse, irrigation or wetland mitigation.

Page 63Greywater Reclamation & Reuse
supply source to offset potable water use in locations within the building where potable
water is unnecessary.
Obstacles to wide adoption of greywater reclamation and reuse systems stem from the lack
greywater and in the agencies responsible for regulating these systems. Further
complications exist when greywater is reused inside buildings which triggers building and
plumbing codes issues, as well as reuse that occurs outside of buildings triggering public
health and development code issues.
Greywater reclamation and reuse systems can be off-the-shelf, proprietary systems or
treatment, in HVAC and process equipment. The technologies and systems presented
below provide a general overview of greywater systems with a focus on those designed for
SYSTEM COMPONENTS
Components of a greywater reclamation and reuse system will vary widely based on the
type of system and the reuse application. Common system components include those
represented in Figure G-1.
COLLECTION AND DISTRIBUTION PIPINGDedicated plumbing drain lines carry greywater either to a surge tank for treatment
and temporary storage or directly outside to landscape areas. Conventional plumbing
pipes are typically 2”– 4” in residential systems, and 4”– 6” for commercial systems.
Distribution piping is typically between 1/2” and 1-1/2” diameter for all systems. Three-
way diverter valves allow for manual or automated remote activation to divert water

Page 64 Toward Net Zero Water
SYSTEM COMPONENTS
4
1
2
3
Collection and Distribution Pipes
Reservoir
Filter and Pump
Subsurface Irrigation
FIGURE G-1: GREYWATER FOR IRRIGATION OR TOILET FLUSHING
into traditional wastewater sewer lines as needed, particularly when the greywater
system is subject to overloading due to periods of increased occupancy in the building.
as toilets or urinals, a dual-piping system is needed for the return pressurized supply
lines. Traditionally, purple pipes have been used to indicate municipally-supplied
reclaimed water sources. Green-colored piping is recommended for identifying
plumbing pipes containing treated greywater.65 In addition, distribution piping should
be clearly labeled with “Non-potable Water – Do Not Drink” along with arrows showing
65 Recommendations to IAMPO on Pipe Color Code to Convey Onsite Alternative Waters. White paper submitted by Alan Rimer (Chair, AWWA Water Reuse Committee) and Don Vandertulip (Chair, WEF Water Reuse Committee and WRA Board of Directors Member).
1
3
4
2

Page 65Greywater Reclamation & Reuse
RESERVOIRSome but not all greywater reuse
systems rely on temporary storage
of the water prior to its reuse
application. Systems used for
reservoir located directly under
a lavatory sink or in a basement
or other centralized location for
collection of greywater.
It is crucial to take into account that greywater degrades in less than 24 hours.
Therefore, reservoirs are designed to store water only temporarily and will have an
backup or pooling occurs.
Sizing of the reservoir will vary based on the amount of greywater it is designed to hold
and the level of treatment provided. Reservoirs may be made of concrete, plastic or
other watertight materials. If they are located outside of the building footprint, they can
be buried below grade, partially buried or secured to a foundation pad above grade.
Regular maintenance and cleaning is required.
FILTER AND PUMPFor greywater reuse systems that include storage for longer than 24 hours, a
recirculating aeration pump must be used to prevent harmful bacteria growth.
Filtration of the greywater is essential to avoid clogging pumps. Regular maintenance
Gravity-fed irrigation systems utilize greywater down slope, eliminating the need for
greywater do not clog irrigation distribution lines and emitters.
IRRIGATION SYSTEMSystems designed to reuse greywater for irrigation can vary widely depending on
and type of vegetation. At the residential scale, subsurface drip irrigation is used to
irrigate plants with excess greywater. Water not taken up by the vegetation percolates
into the ground. Landscaped areas designed with appropriate soils and vegetation
deliver greywater to the root zone of the plants, typically 4”- 8” below grade to prevent
Source: www.watersavertech.com

Page 66 Toward Net Zero Water
contamination of stormwater runoff and prevent direct contact between the greywater
and humans or other animals.
Non-vegetated mulch basins are shallow depressions that receive incoming greywater
direct contact with greywater. Branched drain systems disperse greywater to multiple
irrigation zones and allow the system to handle larger volumes of greywater.
For commercial applications and locations with site constraints, greywater can be used
for indoor irrigation. Interior planter boxes and vertical living walls are two possible
strategies. Greywater is delivered to the root zone where it is allowed to evapo-
TECHNOLOGY
Greywater reclamation and reuse systems utilize fairly standard materials and simple
technologies. Gravity-fed systems eliminate the need for pumping and the associated
energy and maintenance requirements, simplifying these systems even further.
Greywater contains fewer pathogens and up to 90 percent less nitrogen than
blackwater.66 However, greywater can contain high concentrations of easily degradable
organic materials such as residues from soaps and detergents. Because the water is
favorable for bacterial growth, it must be used within 24 hours or treated to avoid turning
anaerobic and producing odors.
treatment (e.g. chlorine) prior to
harmful bacteria from growing
and potentially clogging system
components. Irrigation systems
introduce the greywater directly
to the biologically active topsoil
layer where soil bacteria can
quickly break it down and make the
nutrients in the water available to
plants.
66 National Association of Home Builders Research Center.” Greywater Reuse.” Toolbase Resources. National Association of Home Builders Research Center, n.d. Web. October 2010.

Page 67Greywater Reclamation & Reuse
FIT
residential buildings based on the volume of greywater generated from sinks, showers,
and laundry from these building types. For commercial buildings, the amount of
be very costly.
integrated during other remodeling activities where plumbing will be exposed. Existing
existing plumbing provide the user with the option of selecting when to divert greywater for
reuse and when it should be discharged to the existing sewer drain.
Greywater irrigation systems must be designed to address a site’s seasonal weather
for the greywater. Seasonal greywater irrigation systems are designed to divert greywater
only during dry months to outdoor landscapes. However, greywater can be accommodated
within greenhouses or in semi-arid climate regions year-round.
In urban locations where site constraints are a limiting factor, greywater can be used to
irrigate green roofs or supply an indoor greenhouse.
In most jurisdictions, greywater reclamation and reuse systems are either not allowed by
In fact, it has been estimated that fewer than two percent of greywater systems are legally
installed.67
Regulations around greywater, however, are changing quickly. The city of Santa Fe, New
Mexico has developed a “permit by rule” provision that allows building owners to install
greywater systems without a permit as long as they are under 250 gallons/day.
New construction projects can rough-in plumbing for greywater systems to facilitate
For example, the cities of Tucson, Cottonwood, and Chino Valley, Arizona have mandated
greywater stub-outs in new residential construction permitted after June 1, 2010.68
67 Bahman Sheikh, PhD, PE. White Paper on Greywater. American Water Works Association, Water Environment Federation, and the WateReuse Association, 2010.
68 Ibid.

Page 68 Toward Net Zero Water
EFFICIENCY
the storage capacity of the system, the intended reuse application and the system’s water
demands. Potable water use offset by residential greywater systems can vary from fewer
than 40 and up to 100 gallons per day.
Depending on a community’s water and wastewater utility fees, potable water savings
from greywater reuse systems can be substantial. Manufacturers of proprietary systems
annually,69 and a 35 to 40 percent reduction in annual water utility bills.70
System costs including materials and labor can vary widely, with do-it-yourself kits for
single family homes for under $1,000 to more sophisticated, proprietary systems that can
range from $2,500-$8,000.71
Incentives from water and wastewater utilities can help decrease the payback period for
investment in greywater reclamation and reuse systems. For instance, the City of Tucson
promotes a State of Arizona tax credit to greywater users as an incentive to encourage this
practice.72
ADDITIONAL DESIGN CONSIDERATIONS
SYSTEM LOCATIONGreywater reclamation and reuse systems may be located adjacent to the point of use such
as those that collect water from lavatory sinks in a small reservoir directly connected to
a nearby toilet tank or planter box. Greywater collection systems may also be located in
for irrigation. “Laundry to landscape” type systems divert greywater directly from an
appliance (e.g. a washing machine) outdoors to mulch basins via hoses or other pipe
materials.
69 According to manufacturer’s website: www.watersavertech.com
70 According to manufacturer’s website: www.bracsystems.com
71 Bahman Sheikh, 2010.
72 Ibid.

Page 69Greywater Reclamation & Reuse
SYSTEM SIZING AND INTEGRATIONNet zero water projects should carefully evaluate how to best integrate a greywater reuse
system into a building’s overall stormwater and wastewater management plan, and look for
opportunities to complement the landscape design with all available water resources.
Budgeting for water use with a greywater system requires careful consideration as
storage require more intensive treatment). Often there is more supply than demand or,
conversely, peak demand periods may outweigh the availability of greywater for immediate
use. Combining a greywater system with a rainwater harvesting system allows for the use
of rainwater as a backup when greywater supplies are low. Also, since rainwater is typically
stored and used for drinking water, the reuse of non-potable greywater can help minimize
the size of the storage system.
The pH of greywater can range between 6.5-8.7 and is best suited for irrigating well-
established plants rather than more fragile, young plants. Greywater can be used to water
food crops but must be delivered below the surface to the plant’s root zone and not used
on root crops that are intended to be eaten raw. Greywater irrigation systems should not
be used with chemically softened water as the dissolved salts can be harmful to plants,
though small quantities of lightly softened backwash may not be detrimental.

Page 70 Toward Net Zero Water
CASE STUDYAUSTRALIA GREEN DEVELOPMENT FORUM (AGDF)
A 2004 design workshop hosted by the Australian
Green Development Forum and the Brisbane City
Council produced the seed ideas that gave rise to
Sustainable Home Brisbane. This modern, four-
bedroom demonstration project was designed
to minimize its total ecological footprint while
respecting the site’s existing vegetation and wildlife
habitats. The project operates within a closed-
loop water cycle by sourcing all of its water supply
through harvested precipitation, utilizing water
of its greywater on-site.
Located in an area that receives an average of
47 inches of annual rainfall, the project team
recognized opportunities for sourcing 100
percent of the occupant’s water needs through
rainwater harvesting. Four above-ground steel
cisterns were installed to store 22,000-liters
(approx. 5,800-gallons) of water for all potable
Location: Brisbane, Australia
Architect: Bligh Voller Neild
Developer: Pandanus Projects
Scale: Residential

Page 71Greywater Reclamation & Reuse
and non-potable uses inside the home. The
system is designed with enough storage capacity
to compensate for lower rainfall during the drier
months of the year. The captured rainwater is
laundry, showers, bath, basins and kitchen sink.
trenches in the rear garden area.
The home’s greywater reuse system collects
water from sinks, bath and laundry for subsurface
irrigation. The system is designed to process a
minimum of 500-liters (approx. 132-gallons) per
day. Greywater irrigation pipes are located 100-mm
(approx. 4 inches) below the surface and consist
of 50-mm diameter slotted, corrugated drain
from clogging the pipe. Greywater is pumped to
designated landscape areas in the front and rear
of the property. An alarm alerts homeowners in
the event of saturation, allowing them to divert
Imag
es: A
GD
F

Page 72 Toward Net Zero Water
CASE STUDYCENTER FOR URBAN WATERS
Completed in 2010, the Center for Urban Waters is
a 51,000-sf environmental services and research
laboratory located in Tacoma, Washington. The
facility was constructed as a public-private
partnership to house the City of Tacoma’s
University of Washington-Tacoma research labs
and staff from the Puget Sound Partnership.
The Center brings together researchers and
policymakers under one roof to develop and
apply the best possible science to restoring and
protecting water quality in Puget Sound.
Location: Tacoma, Washington
Architect: Perkins + Will
Landscape Architect: Swift & Co.
Civil Engineer: AHBL
Owner: City of Tacoma
Scale: Commercial

Page 73Greywater Reclamation & Reuse
The project includes a rainwater harvesting system
coupled with captured greywater from the building
to achieve an estimated 46 percent reduction in
potable water use. Rainwater is collected in two
36,000-gallon above-ground cisterns and combined
with rejected, clean process-water from laboratory
sources. The resulting greywater is used for toilet
irrigation. An alarm alerts building operators to
capacity falls below 10 percent.
In addition to the greywater reuse system,
the Center will showcase a laboratory for
collecting, monitoring, and assessing water
quality effectiveness of low impact development
stormwater strategies. A 12,000-sf green roof
The majority of the green roof area will be used
to collect water for offsetting potable water use
inside the building and for irrigation, while some
area will be reserved for testing the green roof’s
effectiveness for reducing stormwater runoff rates.
Rain gardens located in parking areas will also be
Imag
es: P
erki
ns +
Will

Page 74 Toward Net Zero Water
CASE STUDYONE BRYANT PARK
Completed in 2009, One Bryant Park (OBP) was
in the world. The 54-story, 2,200,000-sf urban
redevelopment project sits on a two-acre site in
Midtown Manhattan. The building’s integrated
water management system is impressive due to the
scale at which these systems are applied. Water
conservation along with rainwater harvesting and
greywater reuse systems reduce the building’s
internal demand for domestic water supply by
roughly 50 percent.
Conservation is an essential component of the
nearly 6 million gallons of domestic water annually.
Location: New York City, NY
Architect: Cook + Fox Architects, LLP
Engineer: Jaros, Baum & Bolles
Water System: Alliance Environmental and Natural
Systems Utilities
Owner: Bank of America
Scale: Commercial

Page 75Greywater Reclamation & Reuse
These measures not only conserve water, they also
reduce C02 emissions associated with water and
wastewater distribution, collection and treatment.
With an annual rainfall of 48 inches, the building
captures rainwater from its rooftops where it
is stored along with condensate collected from
air-conditioning coils and light greywater from
sinks. Collection tanks have the capacity to
store up to 69,000 gallons of combined rainwater
and greywater and are distributed strategically
throughout the building to enable a gravity feed
the building’s upper levels. The uppermost tank
stores only rainwater while the tanks on the lower
from lavatory sinks.
A larger, separate, 35,000-gallon rainwater cistern
for the building’s cooling towers. Domestic water is
stored in two additional tanks on the 53rd and 30th
greywater storage tanks when they are low.
Greywater is collected from all lavatory sinks and
is treated to the water quality necessary for its
subsequent use. The initial greywater treatment
design employed ultraviolet disinfection with
monitoring, the system has been upgraded and
disinfection and continuous on-line monitoring and
controls. Mechanical equipment can often require
a higher quality water source to help maintain
mechanical system health.
The comprehensive water management practices
at OBP also help reduce negative impacts to New
York City’s combined sewer system by capturing
and reusing water on-site. During heavy rains,
as the sewers reach capacity. OBP’s rainwater
harvesting system reduces stormwater runoff
system reduces the generation of wastewater
by an estimated 40-50 percent compared to a
conventional building.
Imag
es: C
ook
+ Fo
x A
rchi
tect
s
5

Page 76 Toward Net Zero Water
ADDITIONAL RESOURCES
Brac Systems
www.bracsystems.com
Greywater Alliance
www.greywateralliance.org
Greywater Action
www.greywateraction.org
Oasis Design
www.oasisdesign.net
Watersaver Technologies
www.watersavertech.com
REFERENCES
Bahman Sheikh, PhD, PE. White Paper on Greywater. American Water Works Association,
Water Environment Federation, and the WateReuse Association, 2010.
National Association of Home Builders Research Center. ”Greywater Reuse.” Toolbase
Resources. National Association of Home Builders Research Center, n.d. Web. October
2010. (http://www.toolbase.org/Technology-Inventory/Sitework/greywater-reuse).
Recommendations to IAMPO on Pipe Color Code to Convey Onsite Alternative Waters.
White paper submitted by Alan Rimer (Chair, AWWA Water Reuse Committee) and Don
Vandertulip (Chair, WEF Water Reuse Committee and WRA Board of Directors Member).

WASTEWATER TREATMENT & REUSE
Introduction
Composting Toilets
Constructed Wetlands
Membrane Bioreactors
Additional Resources
78
80
90
100
106
114
SECTIONS
Imag
e: F
arsh
id A
ssas
si c
ourt
esy
of B
NIM
Arc
hite
cts

Page 78 Toward Net Zero Water
INTRODUCTION
A wide range of proprietary and non-proprietary distributed technologies is currently
used to manage water and waste in the built environment. These range from simple,
passive systems that mimic the biological, chemical and physical processes occurring
in natural wetlands to more energy-intensive activated sludge technologies. Table W-1
provides a snapshot of the various distributed technologies used to treat water and
wastes.
conditions, capacity needs, desired inputs and outputs as it relates to a building’s overall
water use and reuse goals, the chosen treatment technology (e.g. suspended vs. attached
growth) and economic considerations. System selection is frequently evaluated based on
its applicability to various building scales — single-family residential to commercial and
neighborhood-level scales — as well as its required energy input and overall footprint size.
Additional considerations for system selection include:
Use of chemicals
Treatment capabilities: ability to treat trace constituents
Capital and operating costs
Ongoing maintenance requirements
Availability of technology and its performance track record
WASTEWATER TREATMENT & REUSE

Page 79Wastewater Treatment & Reuse
TABLE W-1: OVERVIEW OF TREATMENT TECHNOLOGIES
TECHNOLOGY DESCRIPTION EXAMPLES
Non-water discharging containment systems
Collection and processing of human wastes without the use of water
Composting toiletsIncinerating toiletsEvaporation systems
Primary treatment systems Pretreatment and settling of particulate materials
Usually coupled with more advanced treatment technologies or with a
Septic tanks
Suspended growth Treats water through active microorganisms suspended in aerated environments. Also known as activated sludge process
Sequencing batch reactorsMembrane bioreactors
Attached growth Treats water through active microorganisms attached to granule, organic or synthetic media. Also
Hybrid Utilize both suspended and attached growth processes to treat water
Natural Treats water by mimicking the biological, chemical and physical processes occurring in natural wetlands
Constructed wetlands
Various treatment options can achieve different qualities of water based on their design
suspended solids and organic materials from wastewater. Secondary levels of treatment
include removal of biodegradable organic matter and suspended solids and nutrients such
as nitrogen and phosphorous. Tertiary treatment systems include disinfection of treated

Page 80 Toward Net Zero Water
This chapter includes sample technologies that are capable of achieving an advanced
secondary level of treatment or greater to support water reuse or the release of less
appropriate handling of nutrients. Table W-2 provides a brief summary of four sample
technologies included in this chapter.
TABLE W-2: SAMPLE WASTE AND WASTEWATER TREATMENT TECHNOLOGIES
FOOTPRINT OPERATING ENERGY TECHNOLOGY
Composting toilets Small – Large* Zero – Low Non-water discharging containment system Nutrient recovery
Constructed wetland Small – Large Zero – Low Attached growth aerobic treatment
Medium Low – Medium Attached growth aerobic treatment
Membrane bioreactor Small – Medium
High Suspended growth aerobic treatment with synthetic membrane ultra-
* Typically coupled with a greywater system to manage water from sinks, baths/showers and laundry. Wetland and soil dispersal area for greywater can have large space requirements. See Greywater and Reuse Chapter.
COMPOSTING TOILETSComposting toilets are non-water discharging systems. The processing of human waste is
achieved with zero or minimal use of water to convey waste. This has the potential to greatly
reduce a building’s overall demand for wastewater handling as no blackwater is generated.
Composting toilets rely upon biological and physical decomposition to turn excrement into
valuable, nutrient-rich end products that can be used on- or off-site as a fertilizer or soil
amendment. Composting toilets are typically paired with a greywater system to handle

Page 81Wastewater Treatment & Reuse
SYSTEM COMPONENTS
TOILET
mounted either directly above the composting chamber or located several stories above
centralized chamber.
FIGURE W-1: COMPOSTING TOILET
1
2
3
SYSTEM COMPONENTS
1
2
3
Toilet Fixture
Composting Chamber
Ventilation

Page 82 Toward Net Zero Water
COMPOSTING CHAMBERIn many composting units, decomposition takes place in a tightly sealed plastic,
to separate urine from feces. Others use electric or solar heat to ensure optimal
temperatures for the composting process. Drums or mechanical stirring provide
mixing and aeration.
All chambers include an access door for removal of composted end products and
designs feature dedicated urine collecting chambers that allow for the collection and
processing of urine separately from solid wastes.
VENTILATIONVentilation ensures adequate oxygen and the proper moisture and temperature levels
necessary for the composting process. A ventilation system includes an air inlet and
exhaust vent for removing odors, excess heat, carbon dioxide, water vapor and other
byproducts of aerobic decomposition. Passive systems require little or no energy
input while more intensive systems require electricity (typically 12 volts or less) for air
circulation and mixing of the composting material. Solar-powered fans can be used to
drive the ventilation system.
TECHNOLOGY
Composting toilets use an aerobic decomposition process to slowly break down human
excrement to 10 to 30 percent of its original volume into a soil-like material called humus.73
Organisms that occur naturally in the waste material, such as bacteria and fungi, perform
the work of breaking it down. Compost worms may be added to accelerate the process.
During the composting process, optimal moisture content of the waste should be
maintained at around 40 to 70 percent.74 Additionally, excess water vapor and carbon
dioxide produced in the process are mechanically vented to the outside through the unit’s
exhaust system. This venting also prevents the occurrence of strong odors. Mechanical or
manual mixing of the waste improves aeration, and bulking agents such as wood chips, saw
dust or other carbon sources can be added to provide space for microbial colonization.
73
74 Ibid.

Page 83Wastewater Treatment & Reuse
that utilize a continuous process deposit new waste materials on top of the composting
risk of contamination in composted end products is a concern and proper maintenance and
oversight is essential. In a batch process, excrement is collected for a certain period of
time and is then set aside for months or years while the composting process occurs.
Some composting toilets use no water or other liquids to carry waste to the collection
foam blanket that transports waste to the composting unit. With any of these technologies,
the end products are either used on-site as fertilizers or hauled offsite to an appropriate
handling facility. Depending on the size of the system, the time required for the composting
process might range from three months to several years.
Composting toilets address potential pathogens found in human waste through the process
of composting or through the natural production of predatory organisms toxic to most
pathogens. One key advantage to composting toilets is that they keep valuable nutrients
such as nitrogen and phosphorous in tight biological cycles without causing potential
environmental risks to receiving water bodies, which occurs in conventional wastewater
treatment plant operations.75
FIT
geographic locations with limited water resources, such as areas affected by drought.
Likewise, because they are non-water discharging systems, locations where on-site
wastewater management options are limited due to site constraints, high water tables or
shallow soils make composting toilets a feasible alternative. In cold climates, composting
chambers might need to be heated and/or insulated to ensure optimal temperatures for
decomposition and pathogen removal.
as they eliminate the need for extensive infrastructure brought in to service a building or
neighborhood development. Utilization in urban locations presents opportunities to reduce
demand on existing municipal wastewater treatment infrastructure and extend the life
of these systems, which are often maintained and updated through costly public funding.
75

Page 84 Toward Net Zero Water
chamber located outside the building envelope.
Composting toilets are suitable for any building typology and successful examples exist at
EFFICIENCY
Costs for composting toilets can range from $1,000-$5,000 for individual, self-contained
units.76 Larger-scale centralized systems can require a substantial investment on the
part of the building owner or developer, though there is great opportunity for considerable
savings on water and wastewater utility fees over the life of the system. The payback period
on any scale system is highly dependent on water and wastewater rates, with higher rates
as those used at the Chesapeake Bay Foundation Headquarters’ in Annapolis, Maryland,
calculated a payback in less than 10 years.77
Lifecycle costs and paybacks for utilizing composting toilets on a neighborhood scale
must take on to install infrastructure needed to convey wastewater from individual
buildings to sewer mains, and sometimes to supply the sewer mains to the development
altogether.
Composting toilets, like all decentralized water systems, require a commitment by building
owners and maintenance staff to provide management and oversight of the system to
ensure proper performance.
76 California State Water Resources Control Board. Review of Technologies for the Onsite Treatment of Wastewater in California. 2002.
77 WERF. Modeling Onsite Wastewater Systems at that Watershed Scale: A User’s Guide. 2009.

Page 85Wastewater Treatment & Reuse
ADDITIONAL DESIGN CONSIDERATIONS
SIZINGSizing of a system will depend on building use, occupancy and the type of composting
systems while commercial or multifamily buildings will use multi-toilet centralized
composting systems.
SYSTEM LOCATION
building. Larger, centralized systems commonly locate composting units in the bottom
and electricity.
SYSTEM INTEGRATIONComposting toilets can be integrated into a building’s net zero water strategies with
opportunities for maximizing water conservation and reuse. Utilizing composting toilets
can result in reduced systems needed for managing a building’s remaining wastewater,
including fewer pipes and smaller areas needed for on-site treatment.
Likewise, rainwater or greywater can be
used for diluting stabilized urine from urine-
diverting models to be used as a fertilizer
on-site.
Systems can be designed to also accept food
waste from the home or building, allowing a
net zero water project to handle all organic
waste materials on-site. End products
from the composting process can provide
fertilize landscapes.
Composting toilet at University of British Columbia’s C.K. Choi building.

Page 86 Toward Net Zero Water
CASE STUDYBAIRD RESIDENCE
The Baird residence, completed in 2008, is an
excellent example of affordable, sustainable single-
family housing. The seismically reinforced cob
home was built for just under $150/sf. The extended
family of six has greatly reduced its need for
potable water by installing a rainwater collection
system and a composting toilet, and reusing
greywater on-site for irrigation.
The house includes a 2,500-sf green roof that
collects 1,300 gallons of rainwater for every inch
of rainfall. Four cisterns with a total capacity of
10,000 gallons store the water during the four to
six months of summer drought. While the water
is currently used primarily for irrigation, the
rainwater system is designed for possible future
between the green roof and the cisterns and adding
The Bairds spend about 10 minutes every four days
attending to their composting toilet. They based
their “bucket-and-chuck-it toilet” on a system
from Joseph Jenkins’ The Humanure Handbook.
Human waste is collected in a bucket boxed into the
family’s bathroom. Odors are avoided by ventilating
the box using a small fan, and the contents of the
bucket are kept dry by periodically sprinkling of
wood shavings. The contents of the bucket are
Location: Victoria, British Columbia
Designer and Builder: Ann & Gord Baird
Owner: Ann & Gord Baird
Scale: Residential

Page 87Wastewater Treatment & Reuse
then dumped into a hot compost area in the yard
to engage in an aerobic thermophillic composting
process. Once the waste is fully decomposed, the
nutrient-rich compost is dispersed around the
garden and vegetated portions of the property.
During construction of the Baird residence,
higher-than-expected costs were accrued when
they realized that their municipality’s building
toilet. Once they demonstrated to the plumbing
inspector that their toilet functioned and received
their permit, they removed the toilet and resumed
utilizing their composting toilet.
Imag
es: E
co-S
ense

Page 88 Toward Net Zero Water
CASE STUDYC.K. CHOI BUILDING FOR THE INSTITUTE OF ASIAN RESEARCH
The C.K. Choi Building is a 35,000-sf state-
of-the-art research facility at the University
of British Columbia, known for its pioneering
accomplishments in sustainable design. Completed
install composting toilets in North America,
eliminating the need to connect to the campus
sewer system and reducing potable water demands
by over 375,000 liters (99,000 gallons) per year.
The three-story building has ten composting toilets
and three trapless ventilated urinals that require
Multrum Model M28 composting units located
system allows maintenance staff to add wood chips
and red wiggle worms that facilitate the process of
turning solid waste into a humus-like topsoil rich in
Location: Vancouver, British Columbia
Designer: Matsuzaki Wright Architects, Inc.
Owner: University of British Columbia
Engineer: Keen Engineering
Scale: Campus
Copyright © Jim Burns / Denise Tade

Page 89Wastewater Treatment & Reuse
nitrogen and other useful elements. The units are
well ventilated, eliminating potential odors.
The combination of aerobic composting with the
addition of worms reduces the overall volume of
waste by 90 percent. The resulting compost is
then applied to planting beds to improve depleted
“tea” from the composting units is directed to a
runs along the front of the building. The trench
functions like a subsurface biological marsh
where microorganisms on the roots of the marsh
plants naturally purify the water before it enters
an 8,000-gallon underground cistern. The cistern,
which also collects rainwater from the roof, stores
water for landscape irrigation during the dry
summer months.
One of the project challenges was convincing the
Vancouver Health Department that the composting
toilet and greywater system would work properly
and safely. At the time, Vancouver’s plumbing code
did not address a process for regulatory approvals,
and there were no North American precedents
to illustrate how the system would perform. The
design team spent hundreds of hours researching
approval for the alternative wastewater system.
Testing performed by the Vancouver Health
Department to this day has found that the fecal
coliform of the water is well below acceptable
levels.
Imag
es: C
livu
s M
ultr
um, I
nc.

Page 90 Toward Net Zero Water
CONSTRUCTED WETLANDSConstructed wetlands treat wastewater by mimicking the biological, chemical and physical
processes that occur in natural wetlands. Some systems can require little or no operating
Constructed wetlands can stand alone as treatment systems or be utilized as a polishing
to treat wastes. In these systems, the water surface is exposed to the atmosphere and
carries the risk of odors, mosquitoes and potential human contact with wastewater. By
as coarse sand or gravel. The water surface is maintained below the top of this medium,
The following section highlights components and technologies associated with subsurface
SYSTEM COMPONENTS
PRIMARY CLARIFICATION TANK
PLANTING MEDIUM
that supports wetland vegetation. Gravel and coarse sand is most often used as the
rock (typically less than 1 inch). The depth of the planting medium ranges from 1-3 feet
deep.
Water level is controlled by the outlet structure. It is typically maintained between
4 inches - 2 feet below the top of the planting medium. While the top of this porous
material is typically at that same level as the surrounding terrain, the top of the
material is kept dry to control odor, insects and the potential for human contact with
the water during the treatment process.

Page 91Wastewater Treatment & Reuse
WETLAND VEGETATION
watershed, climate and altitude. While the planting medium provides the primary
substrate for microbial growth, the vegetation provides additional surface area and
supplies oxygen to the root zone.
In addition, the vegetation stabilizes the planting bed, provides a thermal barrier
against freezing in cold climates and improves the wetland aesthetic.78 Constructed
wetlands are typically planted with a variety of species to provide a resilient and
effective treatment process.
Typical species include bulrush and reeds. Cattails, while often found in wetlands, are
sometimes labeled as a noxious weed because they crowd out more desirable species.
78 California State Water Resources Control Board. Review of Technologies for the Onsite Treatment of Wastewater in California. 2002.
FIGURE W-2: CONSTRUCTED WETLAND
31
4
2
5
6
SYSTEM COMPONENTS
4
5
6
1
2
3
Inlet
Impermeable Liner
Planting Medium
Wetland Vegetation
Outlet
Page 92 Toward Net Zero Water
In addition, they do not have a favorable root structure for oxygen transfer or ideal root
surface area for microbial growth.
INLET/OUTLET DEVICESInlet and outlet devices and earth berms are used to control water depth in the wetland.
planting medium, and maintain the water level below the surface.
IMPERMEABLE LINERAn impermeable liner provides a separation between the wastewater treated in
the bed of the wetlands and the surrounding area. The liner prevents leakage and
contamination of groundwater. The impermeable layer may consist of an on-site or
imported clay layer. In areas with permeable soils, a synthetic membrane or concrete
liner is used.
DISINFECTIONConstructed wetlands are adept at nutrient removal and suspended solids reduction.
considered disinfected. Depending on the intended reuse application, additional
disinfection by ozone, ultra-violet light or chlorine may follow constructed wetlands as
TECHNOLOGY
same way as natural wetlands. As wastewater enters into the constructed wetland,
it is treated both aerobically and anaerobically. The submerged plant roots combined
with the surfaces of the gravel particles or other planting medium provide a substrate
for the microbial processes necessary for treatment. The level and rate of treatment is
proportional to the size of microbe populations and the contact time within the system.
The combination of aerobic and anaerobic environments within a constructed wetland
provides comprehensive treatment of wastewater, including removal of nitrogen and
biological oxygen demand (BOD). These systems are typically designed to handle
ultraviolet disinfection to allow for water reuse applications.

Page 93Wastewater Treatment & Reuse
recirculating manner.
wetlands can be deeper and therefore require less land area than conventional systems.
accumulates in the basin, another wetland recirculation cycle begins. Recirculating vertical
over 80 percent of other wastewater constituents prior to discharge.79
FIT
Constructed wetlands are appropriate for projects at various scales and within a variety
of climates. According to the U.S. EPA, constructed wetlands are best suited for upland 80 However,
is treated to high levels and used to recharge these ecosystems.
While space constraints can limit the application of constructed wetlands, subsurface
in a minimum amount of space — an essential component for utilizing them in more
urban applications. Wetlands can also be constructed in multiple cells to allow for site
constraints.
Research shows that these systems operate well even in cold climate conditions, though
cold climate systems may require larger surface areas. Flexibility in their design allows
pollutant loads. Research has shown that wetlands are also known to sequester metals and
79 Garcia-Perez, Alfredo, Don Jones, William Grant, and Mark Harrison. “Recirculating Vertical Flow Constructed Wetlands for Treating Residential Wastewater.” Rural Wastewater. 8 Sep 2010.
80 US EPA. Wastewater Technology Fact Sheet. Wetlands: Subsurface Flow. 2000.

Page 94 Toward Net Zero Water
are an effective means of removing pharmaceutical compounds, making them an interesting
option for hospitals and other sites where these substances are most prevalent. 81
EFFICIENCY
Constructed wetlands are often less expensive to build than other wastewater treatment
options because they are primarily passive systems. In addition, they also have lower
operating and maintenance costs. Total expenses for subsurface systems can range
from $10,000-$15,000 for an individual home. This cost can be lowered when coupled
with composting toilets as the volume of wastewater generated is reduced by roughly
50 percent, thereby shrinking the required area of the constructed wetland. Costs often
differ based on soil conditions, system loading and regulatory requirements.82 Larger
community-scale systems can realize lower costs based on economies of scale such as the
residential cluster system installed at Lake Elmo, Minnesota, which costs approximately
$5,700 per home.
Because it has no or few moving parts, constructed wetlands can be more durable than
other mechanized systems used to treat wastewater, allowing for longer lifecycles and
ADDITIONAL DESIGN CONSIDERATIONS
SIZINGSubsurface constructed wetlands can range in size from small on-site units to treat
waste from individual homes or commercial buildings, to large community-scale
systems serving entire neighborhoods. There are more than 100 such systems in
the U.S. that treat municipal wastewater, the majority of which treat less than one
million gallons per day.83 Smaller-scale systems typically treat anywhere from several
hundred up to 40,000 gallons per day. A typical residential single-family household
system is roughly 300-400 feet2 in size.
81 California State Water Resources Control Board. Review of Technologies for the Onsite Treatment of Wastewater in California. 2002.
82 Ibid.
83 US EPA. Wastewater Technology Fact Sheet. Wetlands: Subsurface Flow. 2000.

Page 95Wastewater Treatment & Reuse
SYSTEM LOCATIONDepending on the size of the system, constructed wetlands can be located on a building
site or in a centralized location serving multiple buildings. Where elevation allows, they
wetland cells.
In cold climates, constructed wetlands may sometimes be enclosed in a greenhouse;
however, it is not a requirement with properly designed systems such as those utilizing
in locations which receive no direct sunlight in winter and with temperatures routinely
dropping to 40 degrees below zero for multiple days in a row.84
SYSTEM INTEGRATIONConstructed wetlands have the advantage of being a potential amenity on a project
site by integrating the treatment system into the surrounding landscape design.
Constructed wetlands can also be used to treat on-site stormwater runoff, improving
water quality and protecting downstream receiving water bodies.
84 Communication with Whole Water Systems, LLC. www.wholewatersystems.com. October 2010.
designed into the site landscape at Sidwell Friends School.
Imag
es: N
atur
al S
yste
ms
Inte
rnat
iona
l

Page 96 Toward Net Zero Water
CASE STUDYEVA-LAXMEER HOUSING DEVELOPMENT
The EVA-Lanxmeer project is a mixed-use housing
development that includes 250 residential units,
40,000-m2
farm and other community amenities such as
restaurants and a hotel. Completed in 2009, the
project is an international example of sustainable
community planning. The project’s design approach
was strongly based on permaculture principles,
demonstrating decentralized technologies for
energy and water management and emphasizing
resource recovery.
The community’s integrated water management
approach involves harvesting and storing rainwater
and treating water and organic waste on-site
and washing machines to offset potable water
demand. Household wastewater from kitchens and
Location: Culemborg, The Netherlands
Designers: Atelier 2T Architects, Hospitality
Concepts, V&L Consultants
Owner: Ecological Centre for Education,
Information and Advice (EVA)
Scale: Neighborhood

Page 97Wastewater Treatment & Reuse
laundry is routed through a series of on-site reed
biological processes. Human waste from toilets is
dewatered and the solids are harvested for biogas
production on-site.
The on-site biogas plant provides a source of
energy and eliminates the development’s need
for a connection to the public sewage system.
To increase the amount of solid substance in the
fermenter, it was decided to combine green waste
from the kitchen and sometimes from the garden
with the solids. The output from the fermentation
can be used immediately in the garden as compost.
then combined with greywater and stormwater and
ditches that provide open space and habitat on the
site. The water is withdrawn for crop and landscape
irrigation, and all water eventually returns to the
city aquifer.
Occupants residing in the development are
responsible for maintaining the health and
performance of the integrated water management
system. Regular meetings and information
exchanges for residents are held to provide
education on the system and the types of household
products that can harm its biological balance. The
system relies on a high level of commitment from
residents for ongoing maintenance and long-term
success.

Page 98 Toward Net Zero Water
CASE STUDYSIDWELL FRIENDS SCHOOL
The Sidwell Friends School, located in the historic
Tenleytown section of northwest Washington, D.C.,
in the United States. Completed in 2006, the project
included a 39,000-sf addition and partial renovation
of the existing school building. The school is
committed to fostering an ethic of social and
environmental responsibility in all students and
demonstrating a thoughtful relationship between
the built environment and the natural world.
Rainwater falling on the site is collected and
channeled through a constructed wetland where
Location: Washington, D.C., USA
Architect: Kieran Timberlake Associates, LLP
Engineer: Natural Systems International
Landscape Architect: Andropogon Associates
Owner: Sidwell Friends School
Scale: Commercial
Imag
es: A
ndro
pogo
n A
ssoc
iate
s

Page 99Wastewater Treatment & Reuse
waterfalls aerate the rainwater before it enters the
allow ground water recharge.
In addition, 100 percent of the wastewater from the
building is routed through a terraced, subsurface-
site landscape. The system includes a primary
treatment tank for anaerobic breakdown of solids,
constructed wetland cells where microorganisms
and wetland plants help break down contaminants
in the water. It then re-enters the building and is
disinfected using ultraviolet light prior to reuse.
Water from cisterns is used to replenish water
levels in the wetland during dry spells to ensure
optimal performance.
It takes approximately four days for the wastewater
to navigate through the constructed wetland
before entering an underground storage tank.
The naturally-treated water is then reused on-
reducing the building’s use of potable water by
93 percent. Local authorities require regular
water quality monitoring of the wastewater
system and less frequent groundwater testing to
ensure that the system is functioning as planned.
Sidwell’s students and faculty conduct most of
the monitoring and testing, hiring consultants as
needed.

Page 100 Toward Net Zero Water
RECIRCULATING BIOFILTERS
wastewater.85 These systems consist of chambers packed with highly porous materials
such as plastics or rock. The media in the chamber provides growth surfaces for an
SYSTEM COMPONENTS
CONTAINERA container is used to house the support medium necessary for the attached growth
treatment process. These containers are typically made from concrete, plastics or
SUPPORT MEDIUM
organic, granular or synthetic materials can be used, such as sand, gravel, crushed
glass, expanded aggregates, slag, peat moss, wood chips, rubber, fabric or open-
microbial community within the treatment system.
DISTRIBUTION SYSTEM
support optimal performance of the system. Several distribution methods can be
support medium. For pressure-driven distribution, pumps or dosing syphons may be
demand basis as wastewater is generated.
85 California State Water Resources Control Board. Review of Technologies for the Onsite Treatment of Wastewater in California. 2002.

Page 101Wastewater Treatment & Reuse
COLLECTION SYSTEMThe collection system harvests the treated water and either recirculates it back into the
TECHNOLOGY
the wastewater percolates through the media. This simple process effectively oxidizes and
reduces harmful chemical wastewater constituents. Oxidative reactions generally take
FIGURE W-3: RECIRCULATING BIOFILTER
SYSTEM COMPONENTS
4
5
6
1
2
3
Container
Distribution System
Support Medium
Pump
Treated Water
Recirculation
AIRINFLUENT
SLUDGE
CLARIFIER
AIR
1
3
2
5
6
4

Page 102 Toward Net Zero Water
base of the chamber provide effective reductive conditions.
these systems are generally low and their modular designs make system expansion or
Disadvantages include the land area required and the potential for odor from the open-air
tanks.86
system after an upset or overload and extensive maintenance requirements. In response,
proprietary systems have been developed to minimize plugging tendencies and simplify
maintenance efforts.
pass system, the wastewater is applied only once before being collected and conveyed to
other treatment tanks or dispersal systems. Recirculating systems are designed to repeat
be smaller in size as compared to single pass systems due to the increased hydraulic
loading rate. They also require more energy for pumping and controls, whereas single pass
performance testing has shown they can handle overloading conditions (up to double
design capacity) for several months before water quality begins to degrade. These systems
are typically controlled remotely by telephone/internet, making remote monitoring and
adjustment possible. They are capable of attaining an advanced secondary and tertiary
wastewater standard that is upgradable to a water reuse standard by the addition of a
dissolved oxygen concentration is enhanced in the recirculation process.
FIT
scale. Proprietary models are engineered for commercial and industrial applications. Due
86 US EPA. Wastewater Technology Fact Sheet: Intermittent Sand Filters. 1999.

Page 103Wastewater Treatment & Reuse
to their reduced footprint size and ability to provide a reliable and high level of treatment,
EFFICIENCY
septic settling tank and dispersal systems adding additional costs.87 Pumps and electrical
components can be assumed to have at least a 10-year life span. Ongoing maintenance of
effort required varies greatly across systems.
ADDITIONAL DESIGN CONSIDERATIONS
SIZING
Recirculating systems have a typical surface area footprint of 100 square feet for
an individual home, while proprietary models such as the Advantex system can be
as small as 3 feet x 7.5 feet.88 Larger systems require approximately one square
foot of land for every 25 gallons treated per day, making them more compact in size
membrane bioreactors.
SYSTEM LOCATION
ground, partially buried or fully buried. High groundwater, setbacks for open-air tanks and
within a community. Self-contained units can also be located within the building envelope.
SYSTEM INTEGRATION
being truly integrated into landscape features.
87 California State Water Resources Control Board. Review of Technologies for the Onsite Treatment of Wastewater in California. 2002.
88 Ibid.

CASE STUDYROCKY BAY
Residents of Rocky Bay, an affordable housing
project in Friday Harbor on San Juan Island,
moved in after spending more than a year
contributing sweat equity to build their homes
in 2007. Eight homes are thoughtfully clustered
on this 4.87-acre property. They share a well for
potable water and a compact, on-site wastewater
that occur with a varying number of users. The
system users to be thoughtful about what they
contribute to the system. No toxics of any sort are
to be dumped down the drain.
The AdvanTex®
was sized for a 26-bedroom development with 120
in to more accurately model real use. Grossly over-
Location: San Juan Island, WA
Engineer: Orcas Sewage Design
Owner: Homes for Islanders
Scale: Residential
Orcas Sewage Design Company designed a
waste treatment system for Rocky Bay that ®-
AX20 Treatment System selected is known for
its ability to handle excessive loads for short
durations, making it a good choice for a cluster-
housing development. The potential for occasional
increased loads did require an additional 48-LF of
Household wastewater is sent to eight septic
collection tanks located just outside each home.
with 1,500-gallon tanks and the six three-
bedroom homes received 1,000-gallon tanks.
are broken down by micro-organisms in the
tank substantially reducing volume. The system
operator annually monitors the accumulated solids
Page 104 Toward Net Zero Water

and has them pumped as needed, about once every
8-10 years.
The AdvanTex®-AX20 system is a secondary
similar to municipal treatment levels. At Rocky
recirculation tank which is calibrated to pass the
trenches 54-ft. long by 3-ft. wide.
Vericomm, a web-based monitoring system,
tracks each home in Rocky Bay and watches for
strengths were to exceed those listed in the plan,
efforts would need to be made to reduce the input
strength or expand the system to increase capacity.
Imag
es: R
ick
Pet
ro, O
rcas
Sew
age
Des
ign
Page 105Wastewater Treatment & Reuse

Page 106 Toward Net Zero Water
MEMBRANE BIOREACTORSThe suspension of wastewater and the organisms used to treat the water in an aerated tank
is referred to as an activated sludge process. Membrane bioreactors (MBRs) are packaged
downstream tertiary treatment systems.
SYSTEM COMPONENTS
PRETREATMENT AND AERATION CONTAINERSProcessing tank containers typically include a primary separation chamber for
pretreatment/settling and an aeration chamber. Aeration chambers are sized to provide
systems do not require a separate pretreatment tank. Fine screens, typically 1-3mm,
are located in the containers after primary settling and before the membranes to
prevent clogging.
MEMBRANEMBR membranes are porous and typically consist of cellulose or other polymer
plates and designed to be easily removed for servicing and replacement. Pumps are
used to force wastewater through the membrane.
TECHNOLOGY
systems to maintain a higher concentration of bacteria compared to conventional activated sludge
conventional treatment technologies.
The process consists of a conventional extended aeration activated sludge process in which

Page 107Wastewater Treatment & Reuse
pores are typically 0.1 to 0.5 microns in size to inhibit bacteria, micro-orgasms and other
still required.
ease of automation. The primary disadvantages of MBR processes are the high cost of
membranes, high energy demand, solids management, and the potential for membrane
FIGURE W-4: MEMBRANE BIOREACTOR
25
3 4
1
SYSTEM COMPONENTS
4
5
1
2
3
Collection System
Pretreatment
Aeration
Membrane
Distribution System

Page 108 Toward Net Zero Water
fouling. Membrane manufacturers use several techniques to prevent fouling, including
coarse air scrubbing and chemical treatment.
FIT
MBRs have a small footprint in comparison with other distributed technologies, making
them an alternative for both building and campus-scale treatment systems. Because MBRs
water will be reused on-site. However, projects pursuing high performance energy use
EFFICIENCY
Initial capital costs as well as ongoing operations and maintenance costs for MBR systems
are typically much higher than for other wastewater treatment options. Installed costs can
range from $7 - $20 per gallon treated.89 The expected life of a membrane is typically only 7
89 US EPA. Wastewater Management Fact Sheet. Membrane Bioreactors. 2007.
The Convention Center in downtown Vancouver, British Columbia, houses a membrane bioreactor designed to treat 20,000 gallons of wastewater

Imag
e: 2
010
Gen
eral
Ele
ctri
c C
ompa
ny
Page 109Wastewater Treatment & Reuse
to 8 years, and may be considerably shorter depending on the propensity of the wastewater
to produce fouling conditions.
MBRs require greater operator attention as compared with other distributed treatment
options, and have considerably higher energy costs. Where these systems are used to treat
water for reuse applications within buildings or at the community scale, their lifecycle costs
may be offset by the reduction in potable water.
ADDITIONAL DESIGN CONSIDERATIONS
SYSTEM LOCATION
on a project site. Their need for frequent inspection and maintenance requires that they
be located for easy access.
The GE ZeeWeed membrane bioreactor treats wastewater to high quality standards for reuse.

Page 110 Toward Net Zero Water
CASE STUDYCOUNCIL HOUSE TWO
Completed in 2006, Council House Two (CH2)
is a 10-story, 12,500-m2
City of Melbourne staff. The building features
design strategies through a variety of integrated
systems, and demonstrates innovative ways in
which buildings can achieve the City’s goals set
forth by their Total Watermark Policy. This policy
calls for aggressive targets for water conservation,
alternative water supplies and wastewater
reductions to reduce the community’s potable
water use by 40 percent per capita by 2020.
CH2 is designed to offset potable water use by more
and the use of recycled water. Additionally, a total
of 25 percent of the overall potable water demand
is provided by capturing, storing and reusing clean
pumps. This water, traditionally sent to the sewer,
is instead reused at sinks and showers.
Wastewater from the building is treated for reuse
on-site in a Multi-Water Treatment Plant, owned
and operated by the City of Melbourne and located
in the building’s basement. The system treats
both greywater and blackwater generated by the
building’s sinks, showers and toilets, in addition
to sewerage that is mined from a municipal sewer
adjacent to the CH2 site. Sewerage is typically
made up of 95 percent water. By capturing and
treating this water, CH2 is demonstrating that
Location: Melbourne, Australia
Designer: Design Inc., City of Melbourne
Scale: Commercial

Page 111Wastewater Treatment & Reuse
municipal sewers can be a valuable source of
nonpotable water.
The Multi-Water Treatment Plant includes three
through a micron-sized screen and the solids are
sent to the city’s sewer system. The remaining
osmosis process. The cleansed water is dosed
reclaimed water. The recycled water is used for
towers.
The treatment system has the capacity to process
100,000 liters per day. CH2 uses approximately
45 percent of the on-site treated water, while the
remainder is used by Council House 1 for street
cleaning and landscape irrigation. The system
the amount extracted and processed to meet
system payback is estimated at 15-20 years.
Rainwater is harvested from the roof and stored in
a 15-kiloliter (approx. 4,000-gallon) cistern, also
located in the basement. The rainwater is used
in conjunction with the treated wastewater for
irrigating green roof and living walls.

CASE STUDYOREGON HEALTH AND SCIENCE UNIVERSITYCENTER FOR HEALTH AND HEALING
Imag
e: IN
TER
FAC
E E
NG
INE
ER
ING
Imag
e: W
alke
r M
acy
Page 112 Toward Net Zero Water
Location: Portland, OR
Architect: GBD Architects
Owner: RIMCO LLC
Engineer: INTERFACE ENGINEERING
Scale: Commercial

The Center for Health and Healing was developed
as a “spec med science facility” and was one of the
largest LEED NC-Platinum projects in the nation
in 2006. The 398,000-sf facility covers 20 blocks
of Portland’s South Waterfront neighborhood.
The structure hosts a wide range of uses, from
lot of water.
This OHSU building reduces, reuses and recycles
in sinks, toilets/urinals and showers throughout the
building. A 22,000-gallon cistern below the building
Nearly one-half million gallons of rainwater
are collected from the roof annually. Recovered
groundwater due to a high water table provides
radiant cooling in certain portions of the building.
Greenroofs and the on-site membrane bioreactor
process all water that moves through the site.
The Enviroquip, Inc MBR, located on the ground
nearly Class 4 (drinking water) standards. This mini
sewage treatment plant provides both anaerobic
ultraviolet disinfection. The system is connected to
the local sanitary sewer for emergency discharge
purposes only. Sewage solids are sent to the city
sewage system as needed through a batch release
system. Membranes should be cleaned out about
twice a year. The system can handle 35,000 gpd or
an average of 1,600 daily users.
Treated water is combined with rainwater for use in
tower makeup water or irrigation. Excess treated
water is discharged through a bioswale that drains
to the Willamette River. The complex water system
reduces potable water use by more than 49 percent
— a savings of roughly 5.5 million gallons annually
and a cost savings of $27,000 per year compared
to a similarly sized conventional building. OHSU
estimates the system will pay back its initial costs
in about 10 years.
OHSU contracts Vision Engineering to operate the
plant. i.Water Services, Inc. was hired to obtain,
hold and maintain the State DEQ permit plus a
Federal NPDS permit for discharging 15,000 gpd to
a federal waterway.
Imag
e: K
imbe
rly
Mat
his
Page 113Wastewater Treatment & Reuse

Page 114 Toward Net Zero Water
ADDITIONAL RESOURCES
Landcom. Wastewater Reuse in the Urban Environment: Selection of Technologies. 2006
Metcalf and Eddy. Wastewater Engineering, Treatment and Reuse. 2003
Nelson, Valerie. Coalition for Alternative Wastewater Treatment. New Approaches in
Decentralized Water Infrastructure. 2008
Rocky Mountain Institute. Valuing Decentralized Wastewater Technologies: A catalog of
US EPA. Wastewater Technology Fact Sheets.
http://water.epa.gov/scitech/wastetech/mtbfact.cfm
REFERENCES
California State Water Resources Control Board. Review of Technologies for the Onsite
Treatment of Wastewater in California. 2002.
Garcia-Perez, Alfredo, Don Jones, William Grant, and Mark Harrison. “Recirculating
Vertical Flow Constructed Wetlands for Treating Residential Wastewater.” Rural
Wastewater. 8 Sep 2010. http://www.ces.purdue.edu/extmedia/AY/RW-4-W_08.pdf.
US EPA. Wastewater Management Fact Sheet. Membrane Bioreactors. 2007.
US EPA. Wastewater Technology Fact Sheet. Wetlands: Subsurface Flow. 2000.
US EPA. Wastewater Technology Fact Sheet. Wetlands: Intermittent Sand Filters. 1999.
US EPA. Wastewater Technology Fact Sheet. Wetlands: Subsurface Flow. 2000. Water
Environment Research Foundation. Modeling Onsite Wastewater Systems at that Watershed
Scale: A User’s Guide. 2009.

Toward Net Zero Water Page 115
FUTURE RESEARCH
During the process of researching and compiling this report, the Cascadia Green Building
Council uncovered extraordinary amounts of useful information and sources of data on
topics related to best practices for water systems in buildings and neighborhoods. Much of
the groundbreaking research comes from countries such as Australia, where diminishing
water resources has been at the forefront of political and cultural conversations.
The concept of net zero water buildings requires a major shift in the mindset of how
buildings are conceived, designed, built, regulated and operated. Despite the wealth
of existing research, it is evident that much more information and on-the-ground
demonstrations are needed to help shift conventional practices toward a more sustainable
future with respect to our water resources. Additionally, the research needs to be credible
and accessible to project design teams, regulatory agencies and policy makers to support
and empower the next generation of innovate water projects.
Additional research is needed in the following areas.
PUBLIC HEALTH AND SAFETYCurrent codes and regulations exist to safeguard human health and welfare and to ensure
access and availability of clean water supply and wastewater treatment to all people.
currently supported by regulations — lack the same level of institutional consideration for
their impact on safety and welfare. Opportunities exist for regulatory agencies at all levels
to evaluate risks to public health and safety beyond what is currently mandated by codes,
including risks associated with climate change, resource depletion, diminishing water
quality and pollution prevention. Additional research is needed to evaluate public health
and safety risks so that agencies can assess smaller-scale, distributed water systems

Toward Net Zero WaterPage 116
as they relate to improved resiliency and economic sustainability of existing centralized
systems.
LIFECYCLE ASSESSMENTLifecycle assessment investigates the environmental impacts of a product or system
throughout its life, including those associated with raw material extraction, manufacturing,
transportation, construction, operations, maintenance and repair, and ultimately end-of-
life disposal. Lifecycle assessments can provide valuable data when applied to net zero
water systems. Environmental impacts associated with supplying fresh water to a building
because the process of doing so is complex and time consuming for project teams. As
a result, the design and building industry often lacks a comprehensive understanding
of water supply and treatment systems of the community in which they are building.
Accessible data on lifecycle impacts would help project teams make more informed
decisions when determining the most appropriate water systems for the project.
Cascadia is currently working on a lifecycle assessment of centralized wastewater
treatment and its associated conveyance requirements versus various small-scale,
distributed treatment technologies. This research will provide valuable missing data on
how decentralized and centralized systems compare to each other when considering the
environmental impacts of the manufacturing, construction and operations phase of each
system. Research results are anticipated to be published in April 2011, and will ultimately
be used to develop a guidance document for policy makers and water utilities making
decisions about infrastructure.
CHLORINE DISINFECTIONResearch has shown links between chlorine disinfection byproducts and cancer,
particularly bladder cancer. Currently, water regulations place greater emphasis on the
public health risks associated with microbial presence in our drinking water than the
risks associated with chlorine and the harmful byproducts it produces when it reacts with
organic matter found in water.
While it is understood that chlorine disinfection plays an important role in our current
centralized water supply paradigm, net zero water projects seeks to source their water
supply from on-site sources through captured precipitation, groundwater or on-site
reclaimed water. As such, residual chlorine necessary for conveyance in centralized
systems can be replaced by alternative disinfection methods. Best practices for disinfection
of on-site water sources, such as ozone and ultraviolet radiation, may be more appropriate
and less harmful to people than chlorine. However, federal regulations currently do not

Toward Net Zero Water Page 117
allow these. Further research is needed on evaluating the health risks associated with
chlorine disinfection within the context of on-site water supply.
CLIMATE CHANGE AND RESILIENCY OF WATER SUPPLYAccording to the International Panel on Climate Change (IPCC), all regions of the world
show an overall net negative impact of climate change on water resources and freshwater
ecosystems.90 Awareness around the risks associated with climate change and the
uncertainty it poses to the resiliency of future water resources is growing. Yet water
consumption in the United States remains at unsustainable levels, regulations impede
innovative water reuse strategies in buildings and the market has been slow to introduce
new technologies aimed at aggressive conservation.
Further information and education is needed to better understand the impacts of climate
change on our water resources. A better understanding of how net zero water design
strategies help address resiliency and passive survivability will likely result in more
support for these types of systems from a regulatory standpoint.
BEHAVIORAL WATER USEPer capita water use in the United States is extraordinarily high compared to use in other
and a lack of education related to global water issues. Accessible information and greater
awareness on the amount of water needed for our everyday needs, such as energy or food
Net zero water projects are designed based on assumptions about how building occupants
will use water. Changes in building occupancy, temporary or long term, or adaptive reuse
water budget. Because of this, regulatory agencies tend to caution against the variability
associated with on-site water capture to meet 100 percent of a building’s water and waste
treatment needs, and backup or redundancy of these systems is typically required. Further
research and understanding of occupant water use behaviors in net zero water buildings
can help shed light on how to best address design and regulatory considerations related to
90 Intergovernmental Panel on Climate Change, 2007

Toward Net Zero WaterPage 118
WATER QUALITYCurrent regulatory and cultural barriers to widespread acceptance of smaller-scale,
distributed water and wastewater systems stem from the perception that these systems
have inferior capabilities for meeting water quality standards. The perception is that control
of water and waste systems by centralized utilities reduces public health risks and that
oversight of decentralized systems, when left to homeowners or building maintenance
staff, will inevitably fail. Poorly designed, operated and maintained septic systems are
largely to blame. However, there is rising concern about public and environmental health
risks associated with aging centralized infrastructure, leaky pipes, combined sewer
showing up in our water.
Increasingly and throughout the country, the media report on drugs such as
antidepressants, hormones and other chemicals found in local drinking water supplies
downstream of wastewater treatment facilities. Research has both highlighted the potential
dangers of these chemicals in our water supply on humans and wildlife, and disregarded
research is critical to understanding how these chemicals impact water quality and health.
Research data on the effectiveness of small-scale, distributed wastewater systems in
handling pharmaceuticals, hormones and other chemicals should be increased and made
available to policy-makers and water utilities around the country.
URBAN AGRICULTURERoughly 40 percent of the U.S. fresh water supply is used for agriculture. Traditionally, the
availability of fresh water sources piped in for irrigation has provided a means to support
large-scale agricultural production in areas with low rainfall. For multiple sustainability
reasons, there has been a recent shift toward smaller-scale, local agricultural practices
and weaving agriculture into urban planning. As a result, the need for agricultural irrigation
changes in several ways: how it is supplied, from what sources and in what quantity.
As project design teams consider urban agriculture at the building, campus or
neighborhood scales, balancing available water sources and water demand budgets
become increasingly important. Additional research is needed to fully understand the
impacts of water use and opportunities for water reuse in urban agriculture settings.

Toward Net Zero Water Page 119
GLOSSARY
Biophilic is used to describe human preferences toward the natural world.
Blackwater is water containing solid and liquid wastes from toilets and urinals.
Closed-loop water systems are systems in which all water used on a project is captured,
treated, used/reused and released within the boundaries of the project site.
Coliform is a commonly-used bacterial indicator of sanitary quality of water.
Decentralized or distributed water systems are on-site or neighborhood-scale systems
used to collect, treat, and disperse or reclaim water from a small service area.
Disinfection byproducts are formed when disinfectants used in water treatment plants
react with bromide and/or natural organic matter (e.g. decaying vegetation) present in the
source water. Different disinfectants produce different types or amounts of disinfection
byproducts. Disinfection byproducts for which regulations have been established have
chlorite.
water body.
Evapotranspiration is the process by which water evaporates into the atmosphere from
plants and ground surfaces.
Full cost pricing
operating and maintaining a water system.

Toward Net Zero WaterPage 120
Greywater is wastewater discharged from sinks, showers, laundry,
drinking fountains, etc., but not including toilets and urinals. Light
Greywater is water from bathroom sinks, shower, bathtub, laundry,
drinking fountains and equipment condensate. Dark Greywater is water
from kitchen sinks and dishwashers.
Groundwater is a fresh water supply that is located beneath the surface of
the ground and is suitable quality for all types of uses.
is the process by which precipitation or irrigation water
groundwater sources.
Potable water meets the U.S. EPA’s drinking water quality standards and
Rainwater is precipitation harvested from roof areas that is collected and
stored on-site. With appropriate levels of treatment, rainwater can be
reused for a variety of nonpotable and potable purposes including drinking,
Reclaimed water is wastewater that has been treated to a standard at
Stormwater is precipitation that falls on the ground surfaces of a property.
systems or receiving water bodies.
Water balance is a numerical account of how much water enters and
leaves the boundaries of a project. Water balance seeks equality between
supply volume and building demand, and is a key aspect in designing a net
zero water project.

Toward Net Zero Water Page 121
Wastewater is water that has been tainted by human activities during
residential, commercial or industrial uses.
Wastewater treatment is the process of removing or reducing hazards in
water and typically includes some of all of the following steps:
Primary treatment – physical treatment process, with or without
chemical assistance; some heavy metals removed
Secondary treatment – a process that removes dissolved and
suspended solids by biological treatment and sedimentation;
biodegradable organics, volatile organics, some nitrogen and
phosphorus removed
Tertiary treatment
and detention in lagoons or wetlands; usually combined with
of nitrogen and phosphorus, dissolved solids and heavy metals.

Toward Net Zero WaterPage 122
BIBLIOGRAPHY
Bahman Sheikh, PhD, PE. White Paper on Greywater. American Water Works Association,
Water Environment Federation, and the WateReuse Association, 2010.
Bisbort, Alan “Kroon Hall Rainwater Harvesting System to Save Half-Million Gallons a
Year” http://environment.yale.edu/news/5508
Environment: Yale magazine. Fall 2007 http://environment.yale.edu/news/5508
Booth, Derek. “Coping with stormwater—how much does it cost?” The Water Center
Fact Sheets (2007). The Water Center. Jan. 2007. University of Washington. http://water.
washington.edu/Outreach/Publications/factsheets.html.
Buehrer, Mark. 2020 ENGINEERING. Bellingham, Washington. 1996.
Burrian, Steven J., Stephan Nix, Robert E. Pitt, and S. Rocky Durrans. “Urban Wastewater
Management in the United States: Past, Present, and Future.” Journal of Urban Technology.
7.3 (2000): 33-62.
California Energy Commission, “California’s Water – Energy Relationship: Final Staff
Report,” (2005): 1-180.
California State Water Resources Control Board. Review of Technologies for the Onsite
Treatment of Wastewater in California. 2002.
Cascadia Green Building Council, Clean Water, Healthy Sound: A Life Cycle Analysis of
Wastewater Treatment Strategies in the Puget Sound Area, in progress (2011).
Chanan, A., J. Kandasamy, S. Vigneswaran, and D. Sharma. “A Gradualist Approach to
Address Australia’s Urban Water Challenge.” Desalination. 249.3 (2009): 1012-16.
Toward Net Zero Water Page 123
Copeland, C. “Hurricane-Damaged Drinking Water and Wastewater Facilities: Impacts,
Needs, and Response,” Congressional Research Service, Library of Congress, 2005: 1-6.
Corcoran, E., C. Nellemann, E. Baker, R. Bos, D. Osborn, H. Savelli (eds). 2010. Sick Water?
The central role of wastewater management in sustainable development. A Rapid Response
Assessment. United Nations Environment Programme, UN-HABITAT, GRID-Arendal. www.
grida.no.
Cunliffe, D. A. and National Environmental Health Forum. Guidance on the use of rainwater
tanks. Adelaide: National Environmental Health Forum, 1998.
Podcasts. Web. 7 Sep 2010. http://spectrum.ieee.org/podcast/green-tech/conservation/
“Disinfection By-Products—Trihalomethanes.” Wilkes University Center for Environmental
Quality Environmental Engineering and Earth Sciences. Wilkes University, n.d. Web. 7 Sep
2010. http://www.water-research.net/trihalomethanes.htm.
Donn, Jeff, “PHARMAWATER-RESEARCH: Research shows pharmaceuticals in water
could impact human cells,” Associated Press, n.d. Web. 7 Sep 2010. http://hosted.ap.org/
specials/interactives/pharmawater_site/day1_03.html
Dorner, Dietrich. The Logic of Failure: Recognizing and Avoiding Error in Complex
Situations. Cambridge, Massachusetts: Metropolitan Books, 1996.
“Drinking Water Chlorination.” Healthy Living. Health Canada, 14 Dec 2006. Web. 7 Sep
2010. http://www.hc-sc.gc.ca.
“Drugs in the Drinking Water.” An AP Investigation: Pharmaceuticals Found in Drinking
Water. Associated Press, n.d. Web. 7 Sep 2010. http://hosted.ap.org/specials/interactives/
pharmawater_site/day1_01.html.
Dugan, Cornelius J., and Donald A. Dolske. “A Twelve Year Study of Precipitation Chemistry
in Philadelphia.” APT Bulletin Historic Structures in Contemporary Atmospheres 23 (1991):
33-36.

Toward Net Zero WaterPage 124
Dupont, Patrick and Steve Shackel “7.3: Rainwater” Your Home Technical Manual Edition
4, Australia’s Guide to environmentally sustainable homes. http://www.yourhome.gov.au/
technical/index.html.
Eisenberg, David, Sonja Persram. Code, Regulatory and Systemic Barriers Affecting Living
Building Projects, Seattle: Cascadia Green Building Council, 2009.
Etnier, Carl, Richard Pinkham, Ron Crites, D. Scott Johnstone, Mary Clark, Amy Macrellis,
Overcoming Barriers to Evaluation and Use of Decentralized Wastewater Technologies and
Management. London: IWA Publishing, 2007.
Fagan, J. E., and Et al. “Dynamic performance metrics to assess sustainability and cost
effectiveness of integrated urban water systems.” Resources, Conservation and Recycling
In press (2010).
Federal Interagency Stream Restoration Working Group Stream Corridor Restoration;
Principles, Processes and Practices. Washington, D.C.: FISRWG, 1998.
Furumai, H. “Rainwater and reclaimed wastewater for sustainable urban water use”.
Physics and Chemistry of the Earth, Parts A/B/C (2008): 340-346.
Garcia-Perez, Alfredo, Don Jones, William Grant, and Mark Harrison. “Recirculating
Vertical Flow Constructed Wetlands for Treating Residential Wastewater.” Rural
Wastewater. 8 Sep 2010. http://www.ces.purdue.edu/extmedia/AY/RW-4-W_08.pdf.
George, R. The Big Necessity: The Unmentionable World of Human Waste and Why It
Matters. New York: Metropolitan Books, 2008.
Ghisi, Enedir, and Daniel F. Ferreira. “Potential for potable water savings by using rainwater
and greywater in a multi-storey residential building in southern Brazil.” Building and
Environment 42 (2007): 2512-522.
Gray, Jonathan, and Jerry Yudelson. Rainwater Harvesting Becomes a Mainstream
Sustainable Practice. Issue brief. Portland, OR: Interface Engineering. http://www.
starkenvironmental.com/a-7-resources.html.

Toward Net Zero Water Page 125
“Greywater Reuse.” Toolbase Resources. National Association of Home Builders Research
Center, n.d. Web. October 2010. http://www.toolbase.org/Technology-Inventory/Sitework/
greywater-reuse.
Haas-Arndt, Doris. Water cycles. Basel: Birkhäuser, 2009.
Health Canada. Drinking Water Chlorination. Website. www.hc-sc.gc.ca/hl-vs/iyh-vsv/
environ/chlor-eng.php.
King County, 03 Feb 2010. Web. 8 Sep 2010. http://www.kingcounty.gov/healthservices/
health/ehs/toxic/cso.aspx.
Kloss, Christopher, Managing Wet Weather with Green Infrastructure: Rainwater
Harvesting Policies: US EPA, 2008.
Krishna, J. H. The Texas manual on rainwater harvesting. 3rd ed. Austin, Tex.: Texas Water
Development Board, 2005.
Landcom. Wastewater Reuse in the Urban Environment: Selection of Technologies. 2006
“Rainwater Harvesting.” Oasis Design. N.p., October 2009. Web. October 2010. http://www.
oasisdesign.net/water/rainharvesting/index
Lukes, Robb, and Kloss, Christopher. Managing wet weather with green infrastructure
municipal handbook [electronic resource]: green streets / prepared by Robb Lukes,
Christopher Kloss. Washington, D.C: U.S. Environmental Protection Agency, 2008.
McLennan, J. “Water 2.0: Aquatic Dysfunctions.” ARCADE Magazine 28.2 (2009): 16-17.
McLennan, Jason, Eden Brukman. Living Building Challenge 2.0: A Visionary Path to a
Restorative Future. Seattle: International Living Building Institute, 2009.
Metcalf and Eddy. Wastewater Engineering, Treatment and Reuse. 2003
National Onsite Wastewater Recycling Association. Model Code Framework for the
Decentralized Wastewater Infrastructure. 2007.

Toward Net Zero WaterPage 126
Natural Resource Management Ministerial Council, Environment Protection and heritage
Council, and Australian Health Ministers’ Conference. Australian Guidelines for Water
Recycling: Managing Health and Environmental Risks 2006. Canberra: Environment
Protection and heritage Council, the Natural Resource Ministerial Council and the
Australian Health Ministers’ Conference, 2008.
Nelson, Valerie. “New Approaches in Decentralized Water Infrastructure.” Decentralized
Water Infrastructure. (2008): 1-79.
NSW Government Department of Water and Energy. Interim NSW Guidelines for
Management of Private Recycled Water Schemes. Sydney NSW: NSW Government, 2008.
Paladino and Company, Inc. Onsite Wastewater Treatment Systems: A Technical Review.
Seattle: Seattle Public Utilities, 2008.
Pickering, Phil, and Kym Whiteoak. “The economics of rainwater tanks and alternative
water supply options.” Marsden Jacobs Associates prepared for the Australian
Conservation Foundation, Nature Conservation Council (NSW) and Environment Victoria
(2007).
Recommendations to IAMPO on Pipe Color Code to Convey Onsite Alternative Waters.
White paper submitted by Alan Rimer (Chair, AWWA Water Reuse Committee) and Don
Vandertulip (Chair, WEF Water Reuse Committee and WRA Board of Directors Member).
Rocky Mountain Institute. Valuing Decentralized Wastewater Technologies: A catalog of
Roebuck, R.M., Ashley, R.M. “Predicting the hydraulic and life-cycle cost performance of
rainwater harvesting systems using a computer based modeling tool” 7th International
Conference on Urban Drainage Modeling 4th-6th April 2006 Melbourne, Australia 546-53.
Sharples, Stephen, and Hocine Bougdah. Environment, Technology and Sustainability. New
York: Taylor & Francis Group, 2010.
Slaughter, S. “Improving the Sustainability of Water Treatment Systems: Opportunities for
Innovation.” Solutions. 1.3 (2010): 42-49. http://www.thesolutionsjournal.com/node/652.

Toward Net Zero Water Page 127
Tama, Vivian W.Y. Leona Tam, S.X. Zeng “Cost effectiveness and tradeoff on the use of
rainwater tank: An empirical study in Australian residential decision-making. ”Resources,
Conservation and Recycling 54 (2010) 178–186.
“Ten Things You Should Know About Water.” Circle of Blue WaterNews. N.p., October 2010.
Web. October 2010. www.circleofblue.org.
“Treatment Devices.” Water Quality Problems and Typical Solutions. Purdue University. 27
July 2010. http://www.purdue.edu/envirosoft/private/src/treat.htm.
United Nations Environment Programme, Every Drop Counts: Environmentally Sound
Urban Land Institute, Infrastructure 2010: Investment Imperative. Urban Land Institute,
(2010): 1-90.
US EPA. “About Water & Wastewater Pricing.” Sustainable Infrastructure. US EPA, 08 Apr
2010. Web. 8 Sep 2010. http://water.epa.gov/infrastructure/sustain/about.cfm.
US EPA, Decentralized Wastewater Treatment Systems: A Program Strategy. Cincinnati:
U.S. EPA Publications Clearinghouse, 2005.
US Energy Information Administration. “U.S. Climate Zones for 2003 CBECS.” Independent
Statistics and Analysis. US Energy Information Administration, n.d. Web. 8 Sep 2010. http://
www.eia.doe.gov/emeu/cbecs/climate_zones.html.
US EPA. Reducing Stormwater Costs through Low Impact Development (LID) Strategies and
Practices. Washington, DC: US EPA, 2007.
US EPA. Funding Decentralized Wastewater Systems Using the Clean Water State Revolving
Fund. Washington, DC: US EPA, June 1999.
US EPA. Wastewater Management Fact Sheet. Membrane Bioreactors. 2007
US EPA. Wastewater Technology Fact Sheet. Wetlands: Subsurface Flow. 2000

Toward Net Zero WaterPage 128
Van der Bruggen, B., and Braeken L. “The Challenge of Zero Discharge: from Water
Balance to Regeneration.” Desalination. 188.1-3 (2006): 177-183.
Water Environment Research Foundation. Modeling Onsite Wastewater Systems at that
Watershed Scale: A User’s Guide. 2009
2010 http://www.pacinst.org/reports/water_fact_sheet.
Oregon Fisheries Congress, 04 Apr 1997. Web. 7 Sep 2010. http://www.psmfc.org/habitat/
salmondam.html.
Yeang, Ken. Ecodesign: A Manual for Ecological Design. London: Brook House, 2008.