Embed Size (px)
Citation preview

Iranian Journal of Oil & Gas Science and Technology, Vol. 4 (2015), No. 3, pp. 18-36
http://ijogst.put.ac.ir
Toward a Thorough Approach to Predicting Klinkenberg Permeability
in a Tight Gas Reservoir: A Comparative Study
Sadegh Baziar1, Mohammad Mobin Gafoori2, Seyed Mehdi Mohaimenian Pour3, Majid Nabi-
Bidhendi4*, and Reza Hajiani1
1 M.S. Student, Department of Petroleum Engineering, Amirkabir University of Technology, Tehran, Iran 2 M.S. Student, Persian Gulf Science and Technology Park, Bushehr, Iran
3 B.S., Student Department of Mathematics and Computer Science, Amirkabir University of Technology,
Tehran, Iran 4 Professor, Institute of Geophysics, University of Tehran, Tehran, Iran
Received: January 14, 2015; revised: May 26, 2015; accepted: June 20, 2015
Abstract
Klinkenberg permeability is an important parameter in tight gas reservoirs. There are conventional
methods for determining it, but these methods depend on core permeability. Cores are few in number,
but well logs are usually accessible for all wells and provide continuous information. In this regard,
regression methods have been used to achieve reliable relations between log readings and
Klinkenberg permeability. In this work, multiple linear regression, tree boost, general regression
neural network, and support vector machines have been used to predict the Klinkenberg permeability
of Mesaverde tight gas sandstones located in Washakie basin. The results show that all the four
methods have the acceptable capability to predict Klinkenberg permeability, but support vector
machine models exhibit better results. The errors of models were measured by calculating three error
indexes, namely the correlation coefficient, the average absolute error, and the standard error of the
mean. The analyses of errors show that support vector machine models perform better than the other
models, but there are some exceptions. Support vector machine is a relatively new intelligence
method with great capabilities in regression and classification tasks. Herein, support vector machine
was used to predict the Klinkenberg permeability of a tight gas reservoir and the performances of four
regression techniques were compared.
Keywords: Klinkenberg Permeability, Tight Gas Reservoir, Multiple Linear Regression, General
Regression Neural Network, Support Vector Machine
1. Introduction
Recently, unconventional reservoirs have gained popularity in oil and gas production. The criteria for
unconventional hydrocarbon reservoirs are identical to their lithological, reservoir, and production
characteristics in terms of (Aguilera and Harding, 2008):
Low permeability of untypical reservoir lithology;
Over pressure or extensive over pressure;
Gas saturation and/or light oil condensate;
* Corresponding Author:
Email: [email protected]

S. Baziar et al./ Toward a Thorough Approach to Predicting Klinkenberg Permeability … 19
Absence of water in the production process.
Tight gas reservoir is one of these resources. Tight gas is the term commonly used to refer to low
permeability reservoirs, which produce mainly dry natural gas. Tight gas reservoir is often defined as
a gas bearing sandstone or carbonate matrix, which exhibits in situ permeability to gas less than 0.10
millidarcys. Many “ultra tight” gas reservoirs may have in situ permeability down to 0.0010
millidarcys (Naik, 2003).
The large volume and long-term potential, attractive gas prices, and unprecedented interest in the
world’s markets, bring the tight gas reservoirs in the forefront of energy in the future (Arevalo-
Villagran et al., 2002).
It is intransitive to obtain petrophysical parameters such as permeability to model these reservoirs.
The reservoir description of these low permeability tight gas reservoirs is credible, when laboratory
permeability data are reliable. Permeability is a principal parameter to control the fluid flow. The
permeability measurement at a high confining pressure in a laboratory is a common way to estimate
the permeability structure at depths (Tadayoni and Valadkhani). A method for permeability
measurement is a steady state method using gas as pore fluid. In this procedure, the pressure gradient
is constant and is proportional to the fluid velocity.
xvdp
dx k (1)
where, k is the absolute core permeability and is the viscosity. For the cores, which have
permeabilities less than 0.1 md, a steady state flow is not valid, when the flowing fluid is liquid.
Hence gas is used for determining the permeability in these low permeability cores. However, in
experience, the value of permeability determined with this method is higher than the real value of
permeability. Klinkenberg in the 1940’s presented the explanation of this treatment. He introduced the
phenomenon of gas slippage as the reason (Tadayoni and Valadkhani). Klinkenberg found that the
permeability of gas is a function of the mean core pressure and the type of gas.
a
bk k a
p
(2)
where, ka, k, b, and p represent the apparent permeability, liquid permeability, slippage factor, and
pore pressure respectively. Gas flow in tight gas sands is mostly affected by some phenomena, which
make deviations from Darcy’s law. Gas slippage is a non-Darcy effect associated with a non-laminar
gas flow in porous media. These effects happen when the size of the medium rock pore throat radius
approaches the size of the mean free path of the gas molecules, and thereby causing the velocity of
single gas molecules to accelerate or “slip”, when contacting rock surfaces.
Coring and core analysis are very expensive and time consuming and there are few numbers of drilled
cores in each field. Hence measuring Klinkenberg permeability in laboratory will be limited and
cannot be applied to the whole sections of the field. On the other hand, well log measurements are
usually available for all drilled wells and provide continuous information about reservoir rock and
fluid properties across the well. Therefore, finding methods which can create proper relations between
well log measurements and core-based Klinkenberg permeability and have good generalization
capability in predicting unseen data can be a good way to predict Klinkenberg permeability.
One method to predict Klinkenberg effect is using regression methods. Multiple linear regression

20 Iranian Journal of Oil & Gas Science and Technology, Vol. 4 (2015), No. 3
(MLR) is one of the primary regression methods, which exhibits acceptable results in predicting target
variable from several predictive variables. Moreover, single tree and tree boost techniques are
powerful tools for regression tasks. Tree boost models often can provide more accurate results
compared to single tree models. Over the past few years, this technique has emerged as one of the
most powerful methods for predictive data mining.
Artificial intelligence methods like artificial neural network (ANN) and support vector machine
(SVM) have shown superior capability in classification and regression tasks. Usage of these methods
reduces obstacles associated with costs and the generalization of the developed models for the
prediction of permeability (Baziar et al., 2014; Al Anazi et al., 2009; Al Bulushi et al., 2007; Amari
and Wu, 1999; Aminian and Ameri 2005; Aminian et al., 2001; Anifowose and Abdulraheem, 2010;
Anifowose et al., 2011; Asadisaghandi and Tahmasebi, 2011; Bhatt, 2002; Carrasquilla et al., 2008;
Chang et al., 1997; Goda et al., 2007; Huang et al., 1996; Ibrahim and Potter, 2004; Karimpouli et
al.,2010; Mollajan and Memarian, 2013; Saffarzadeh and Shadizadeh, 2012; Shokir 2004; Sun et al.,
2001; Wiener et al., 1995; Wong et al., 1995; Wong et al., 2000). Furthermore, Anifowose et al., in a
comprehensive study, employed adaptive neuro-fuzzy inference system hybrid models to predict
reservoir properties including Klinkenberg permeability.
An artificial neural network (ANN) is a hugely parallel distributed processor including neurons
capable of doing mathematical computations by using aviation functions via a learning algorithm. The
knowledge is encoded in the interconnection weights between input, hidden, and output layers
(Haykin, 1994).
Recently, support vector machines (SVM’s) have gained popularity in regression and classification
because of their privileged generalization performance (Kecman, 2005; Cristianini and Shawe-Taylor,
2000; Smola and Schölkopf, 2004). The formulation of SVM is based on the structural risk
minimization (SRM) inductive principle, where the empirical risk minimization (ERM) inductive
principle and the Vapnik-Chervonenkis (VC) confidence interval are simultaneously minimized
(Vapnik, 1982; Vapnik, 2000; Vapnik and Chervonenkis, 1974).
In this study, four methods including multiple linear regression, tree boost, general regression neural
network (GRNN), and support vector machine have been used to predict Klinkenberg permeability in
Mesaverde tight gas reservoir located in Washakie basin, USA and the results obtained from all the
methods have been compared.
1.1. Multiple linear regressions
A regression with two or more explanatory variables is called a multiple linear regression (MLR).
Rather than modeling the mean response as a straight line, as in a simple regression, modeling is
conducted as a function of several explanatory variables, in MLR. Multiple linear regression can be
thought of as an extension of simple linear regression, where there are p explanatory variables, or
simple linear regression can be thought of as a special case of multiple linear regression, where p=1.
The term “linear” is used, because in multiple linear regression, it can be assumed that the output is
directly related to a linear combination of the explanatory variables.
1.2. Tree boost
“Boosting” is a technique for improving the accuracy of a predictive function by applying the function
repeatedly in a series and combining the output of each function with weighting so that the total error
of the prediction is minimized. In many cases, the predictive accuracy of such a series greatly exceeds

S. Baziar et al./ Toward a Thorough Approach to Predicting Klinkenberg Permeability … 21
the accuracy of the base function used alone. The tree boost algorithm is functionally similar to
decision tree forests, because it creates a tree ensemble; however, a tree boost model consists of a
series of trees, whereas a decision tree forest consists of a collection of trees grown in parallel. Tree
boost is also known as “stochastic gradient boosting” and “multiple additive regression trees”
(MART).
The tree boost algorithm used herein was developed by Friedman (Friedman, 1999) and is optimized
for improving the accuracy of models built on decision trees. Graphically, a tree boost model can be
represented as shown in Figure 1:
Figure 1
A schematic of tree boost model.
The first tree is fitted to the data. The residuals (error values) from the first tree are then fed into the
second tree, which attempts to reduce the error. This process is repeated through a series of successive
trees. The final predicted value is formed by adding the weighted contribution of each tree.
Usually, the individual trees are fairly small (typically 3 levels deep with 8 terminal nodes), but the
full tree boost additive series may consist of hundreds of these small trees. Tree boost models often
have a degree of accuracy which cannot be obtained using a large, single-tree model. Tree boost
models can handle hundreds or thousands of potential predictor variables. Irrelevant predictor
variables are identified automatically and do not affect the predictive model. Tree boost uses the
Huber M-regression loss function (Huber, 1964), which makes it highly resistant to outliers and
misclassified cases. The randomization element in the tree boost algorithm makes it highly resistant to
over fitting. Tree boost can be applied to regression models and k-class classification problems.
The primary disadvantage of tree boost is that the model is complex and cannot be visualized like a
single tree. It is more of a “black box” like a neural network.
1.3. General regression neural network
General regression neural network (GRNN), as proposed by Specht (Specht, 1991), falls into the
category of probabilistic neural networks. This neural network like other probabilistic neural networks
needs only a fraction of the training samples which a back-propagation neural network would need
(Specht, 1991). The data available from the measurements of an operating system is generally never
enough for a back-propagation neural network (Specht, 1990). Therefore, the use of a GRNN is
especially advantageous due to its ability to converge to the underlying function of the data with only
few training samples available. The additional knowledge needed to get the fit in a satisfying way is
relatively small and can be done without additional input by the user. This makes GRNN a very useful
tool to perform predictions and comparisons of system performance in practice. Figure 2 depicts the
diagram of a GRNN. There is one neuron in the input layer for each predictor variable; the hidden
layer has one neuron for each case in the training data set and the neuron stores the values of the
predictor variables for the case along with the target value. In the next layer, there are two neurons;
one neuron is the denominator summation unit and the other is the numerator summation unit. The

22 Iranian Journal of Oil & Gas Science and Technology, Vol. 4 (2015), No. 3
decision layer divides the value accumulated in the numerator summation unit by the value in the
denominator summation unit and uses the result as the predicted target value.
Figure 2
Structure of GRNN.
1.4. Support vector machine
Support vector machines (SVM’s) are learning machines implementing the structural risk
minimization inductive principle to obtain good generalization on a limited number of learning
patterns (Vapnik, 2000; Al-Anazi and Gates, 2010b). Support vector machines are characterized by
the usage of kernels, the absence of local minima, the sparseness of the solution, and the capacity
control obtained by acting on the margin or on the number of support vectors. SVM uses kernel
functions, which enable them to operate in a high dimensional, implicit feature space without ever
computing the coordinates of the data in that space by simply computing the inner products between
the images of all the pairs of the data in the feature space. A version of a SVM for regression has been
proposed (Vapnik et al., 1997), which is called support vector regression (SVR).
In the parlance of SVM literature, a predictor variable is called an attribute and a transformed
attribute, which is used to define the hyperplane, is called a feature. The task of choosing the most
suitable representation is known as feature selection. A set of features describing one case (i.e. a row
of predictor values) is called a vector. Thus the goal of SVM modeling is to find the optimal
hyperplane, which separates clusters of vector in such a way that the cases with one category of the
target variable are on the one side of the plane and the cases with the other category are on the other
size of the plane. The vectors near the hyperplane are the support vectors. SVM method has been used
in many research field and exhibited reliable performance.
A common disadvantage of non-parametric techniques such as SVM’s is the lack of transparency of
the results. The lack of transparency in these methods is inevitable and is due to the nature of these
techniques. There is no way to clear the procedure of SVM in obtaining the best regression function.

S. Baziar et al./ Toward a Thorough Approach to Predicting Klinkenberg Permeability … 23
Support vector machine has two common moduli, namely support vector classifier (SVC) and support
vector regression (SVR). In this study, SVR has been employed to predict Klinkenberg permeability.
2. Geological background
The data set for this study are obtained from Measverde tight gas sandstones located in Unita basin in
the U.S.A. Mesaverde Group sandstones represent the principal gas productive sandstone unit in the
largest Western U.S. tight gas sandstone basins including Washakie, Uinta, Piceance, northern Greater
Green River, Wind River, and Powder River. Figure 3represents the location map of Washakie basin.
Figure 3
Location map of Washakie basin.
The Mesaverde group is divided into the regressive deposits of Iles formation and the overlying
massively stacked, lenticular non-marine Williams Fork formation. The Iles formation comprises the
lower part of the Mesaverde. It contains three marine sandstone intervals, namely the Corcoran,
Cozzette, and Rollins. The Williams Fork formation extends from the top of the Rollins to the top of
the Mesaverde. The lower part of the Williams Fork contains coals and is commonly referred to as the
Cameo coal interval. Most of the sandstones in the Williams Fork are discontinuous fluvial sands. The
stratigraphy of the Mesaverde group is shown in Figure 4.

24 Iranian Journal of Oil & Gas Science and Technology, Vol. 4 (2015), No. 3
3. Experimental method
To have a robust and accurate model, log information from two wells, A1 and A2 were used. Well A1
has a total of 120 data points and well A2 has 180 data points. One of characteristics of this research is
the small number of training data points, which can be a proper index to evaluate the generalization
capability of the methods in the presence of small training dataset. To evaluate the accuracy of the
models, the wells were subdivided as shown in Table 1.
Figure 4
Cross section showing the stratigraphy of the Mesaverde group (Cumella and Scheevel, 2008).
Table 1
Different datasets arranged to evaluate the accuracy of models.
Dataset number Training well(s) Testing well
1 1 2
2 2 1
3 1 and 2 1
4 1 and 2 2
5 1 1 and 2
6 2 1 and 2
Each training pattern consists of log data, including a gamma ray log (GR), a bulk density log
(RHOB), a neutron porosity log (NPHI), a photoelectric factor log (PEF), a resistivity log (RT), and a
sonic travel-time log (DT) as the input vectors, and core-based Klinkenberg permeability as a scalar
output. DTREG software was used to evaluate the effects of various logs in predicting Klinkenberg
permeability and the mentioned logs were qualified as the most effective well logs. It was notable that
S. Baziar et al./ Toward a Thorough Approach to Predicting Klinkenberg Permeability … 25
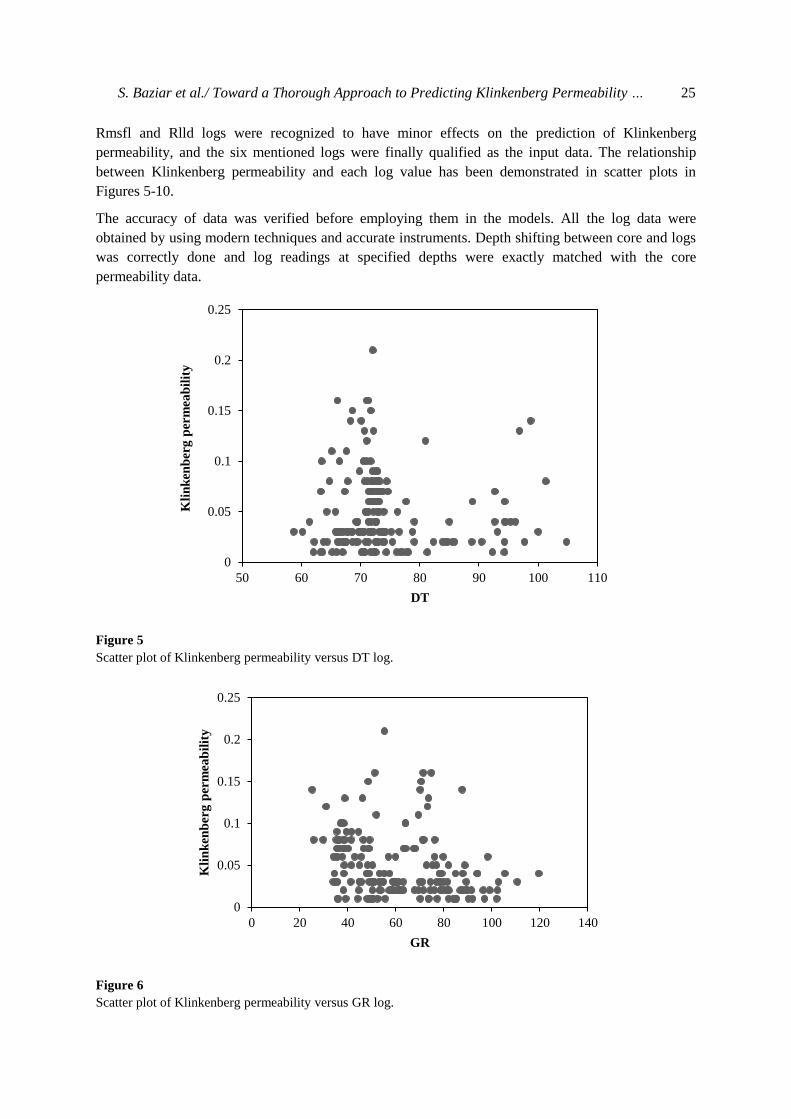
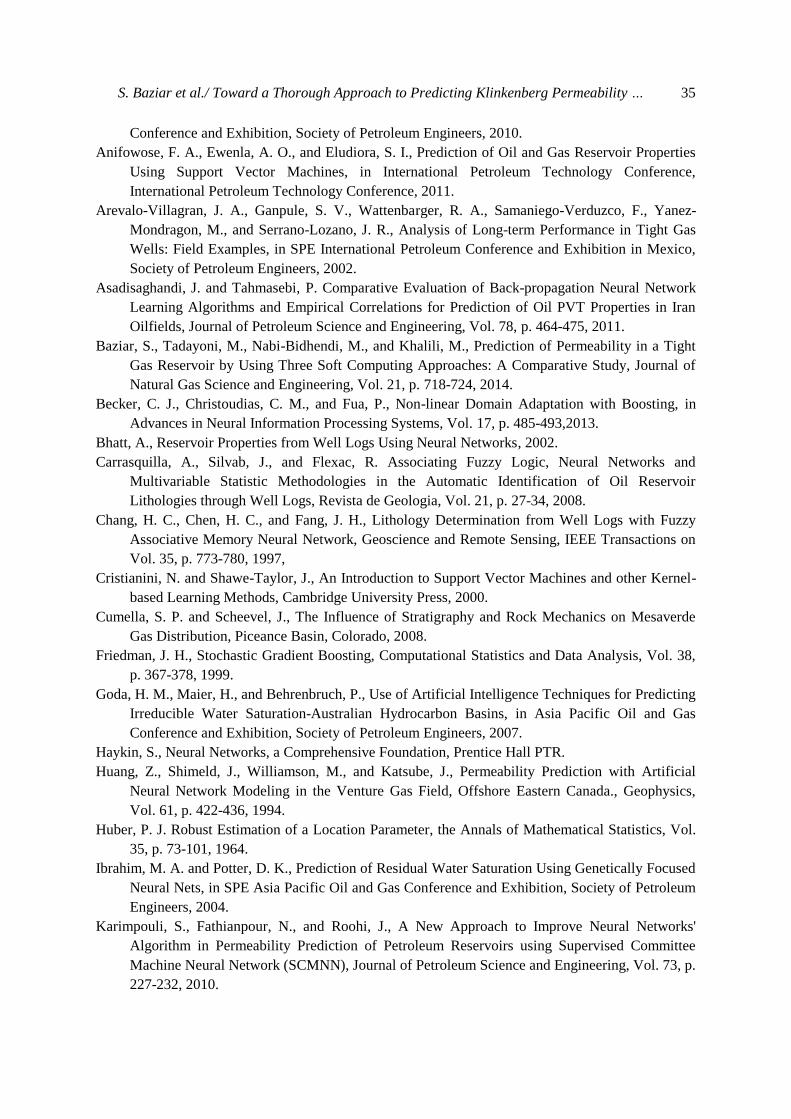
Rmsfl and Rlld logs were recognized to have minor effects on the prediction of Klinkenberg
permeability, and the six mentioned logs were finally qualified as the input data. The relationship
between Klinkenberg permeability and each log value has been demonstrated in scatter plots in
Figures 5-10.
The accuracy of data was verified before employing them in the models. All the log data were
obtained by using modern techniques and accurate instruments. Depth shifting between core and logs
was correctly done and log readings at specified depths were exactly matched with the core
permeability data.
Figure 5
Scatter plot of Klinkenberg permeability versus DT log.
Figure 6
Scatter plot of Klinkenberg permeability versus GR log.
0
0.05
0.1
0.15
0.2
0.25
50 60 70 80 90 100 110
Kli
nk
enb
erg
per
mea
bil
ity
DT
0
0.05
0.1
0.15
0.2
0.25
0 20 40 60 80 100 120 140
Kli
nk
enb
erg
per
mea
bil
ity
GR

26 Iranian Journal of Oil & Gas Science and Technology, Vol. 4 (2015), No. 3
Figure 7
Scatter plot of Klinkenberg permeability versus NPHI log.
Figure 8
Scatter plot of Klinkenberg permeability versus PEF log.
0
0.05
0.1
0.15
0.2
0.25
0 0.1 0.2 0.3 0.4 0.5 0.6 0.7 0.8
Kli
nk
enb
erg
per
mea
bil
ity
NPHI
0
0.05
0.1
0.15
0.2
0.25
1.9 2.1 2.3 2.5 2.7 2.9 3.1
Kli
nk
enb
erg
per
mea
bil
ity
PEF

S. Baziar et al./ Toward a Thorough Approach to Predicting Klinkenberg Permeability … 27
Figure 9
Scatter plot of Klinkenberg permeability versus RHOB log.
Figure 10
Scatter plot of Klinkenberg permeability versus RT log.
As it can be understood from the above figures, generally Klinkenberg permeability increases as DT
log value rises. GR, RT, and NPHI logs relatively represent an inverse relationship with Klinkenberg
permeability. PEF log has an irregular relation with Klinkenberg permeability and RHOB log is
directly proportional to Klinkenberg permeability.
0
0.05
0.1
0.15
0.2
0.25
1.9 2.1 2.3 2.5 2.7 2.9
Kli
nk
enb
erg
per
mea
bil
ity
RHOB
0
0.05
0.1
0.15
0.2
0.25
0 20 40 60 80 100 120 140
Kli
nk
enb
erg
per
mea
bil
ity
RT

28 Iranian Journal of Oil & Gas Science and Technology, Vol. 4 (2015), No. 3
Regression models (MLR, tree boost, GRNN, and SVM) were constructed. Multiple linear regression
was performed by using Microsoft Excel data analysis tool package.
SQBlib open source code was used to build tree boost models (Becker et al., 2013). 600 trees were
generated in tree boost series. Each tree in the tree boost series had 10 levels of splits. The tree boost
algorithm uses Huber’s M-regression loss function to evaluate error measurements for the regression
models (Huber, 1964). This loss function is a hybrid of ordinary least-squares (OLS) and least
absolute deviation (LAD). For residuals less than a cutoff point, the squared error values are used; for
residuals greater than the cutoff point, the absolute values are used. Huber’s cutoff point was chosen
0.1. A 10-fold cross-validation resampling technique was used to strike the right trade-off between
over-fitting and under-fitting.
STATISTICA software was used to construct GRNN models (StatSoft, 1998); GRNN models
constructed herein had 4 layers (one input, one hidden, one class, and one decision layer). An
optimization algorithm was used to automatically determine the number of neurons in the hidden
layer. This algorithm tries building multiple networks with different numbers of neurons in hidden
layers and evaluates how well they fit by using cross validation. 12 neurons were selected for the
hidden layer. The primary work of training a GRNN network is selecting the optimal sigma values to
control the spread of the radial basis function (RBF). The sigma values control the radius of the
influence of each point in the model.The conjugate gradient algorithm was used herein to compute the
optimal sigma values. In addition, a 10-fold cross validation method was used for the validation.
The online SVR software (Parrella) was utilized to procreate the SVM model. For SVM, the sigmoid
kernel function was used, because it has already proved its better performance in comparison with
other kernel functions (Al-Anazi and Gates, 2010a; Al-Anazi and Gates, 2010b; Saffarzadeh and
Shadizadeh, 2012; Baziar et al., 2014). A 10-fold cross validation method was also used for the
validation. The accuracy of an SVM model depends on a true setting of the parameters C, ε, and the
kernel parameters. The problem of optimal parameter selection is more complicated by the principle
that the complexity of an SVM model depends on all the three parameters. While designing an SVM,
the user is confronted with the choice of which kernel to use, and for a given kernel, how to adjust the
parameter(s). Two methods were used for finding the optimal parameter values, namely a grid search
and a pattern search. A grid search tries values of each parameter across the specified search range
using geometric steps. A pattern search (also known as a “compass search” or a “line search”) starts at
the center of the search range and makes trial steps in each direction for each parameter. If the fit of
the model improves, the search center moves to the new point and the process is repeated; if no
improvement is found, the step size is reduced and the search is tried again. The pattern search stops,
when the search step size is reduced to a specified tolerance. When using both grid search and pattern
search, the grid search is performed first. Once the grid search finishes, a pattern search is performed
over a narrow search range surrounding the best point found by the grid search. Hopefully, the grid
search will find a region near the global optimum point and the pattern search will then find the global
optimum by starting in the right region.
To compare methods, each one was used to create a predicted value of the Klinkenberg permeability
and the difference between each predicted and real value was assessed by the correlation coefficient
(r), the average absolute error (AAE), and the standard error of the mean (SEM) as defined in Table 2.

S. Baziar et al./ Toward a Thorough Approach to Predicting Klinkenberg Permeability … 29
Table 2
Error formulas for comparing methods.
Accuracy Measure Mathematical Expression
Correlation Coefficient (r)
1
2 2
1 1
p
l
i i i ii
l N
i i i ii i
ˆ ˆy y y y
ˆ ˆy y y y
Average Absolute Error (AAE)
1
1l
i i
i
ˆy yl
Standard Error of the Mean (SEM) 2
1
1
1
l
iiy y
l
l
4. Results and discussion
At first, about 200 data points from two wells were selected to primarily evaluate the capability of
SVM in predicting Klinkenberg permeability. In this regard, logistic regression as a traditional
approach was selected to be compared with SVM. 150 data points were selected as the training data
and 50 data points were considered for the testing procedure. Table 3tabulates the error indexes
measured in predicting Klinkenberg permeability by SVM and logistic regression. The scatter plots of
the predictions made by each method are demonstrated in Figures 11 and 12.
Table 3
Comparison of the error measured between SVM and logistic regression.
r SEM AAE
SVM 61% 0.028 0.033
Logistic regression 47% 0.044 0.054
Figure 11
Scatter plot of predicting Klinkenberg permeability by SVM.
0
0.02
0.04
0.06
0.08
0.1
0.12
0.14
0.16
0.18
0.2
0 0.05 0.1 0.15 0.2
Pre
dic
ted
Kli
nk
enb
erg
perm
ea
bil
ity
Core- based Klinkenberg permeability

30 Iranian Journal of Oil & Gas Science and Technology, Vol. 4 (2015), No. 3
Figure 12
Scatter plot of predicting Klinkenberg permeability by logistic regression.
The correlation coefficient of the predictions from the MLR, tree boost, GRNN, and SVM are
depicted in Figure 13.
Figure 13
Comparison between the correlation coefficient of different methods in six datasets.
It can be understood from Figure 13that all the methods used have similar results and exhibit reliable
performance. SVM overly performs better in predicting Klinkenberg rather than MLR, tree boost, and
0
0.02
0.04
0.06
0.08
0.1
0.12
0.14
0.16
0.18
0.2
0 0.05 0.1 0.15 0.2
Pre
dic
ted
Kli
nk
enb
erg
per
mea
bil
ity
Core -based Klinkenberg permeability
0
0.1
0.2
0.3
0.4
0.5
0.6
0.7
0.8
1 2 3 4 5 6 7 8 9
Co
rrel
ati
on
co
effi
cien
t
Dataset number
MLR GRNN SVM Tree Boost

S. Baziar et al./ Toward a Thorough Approach to Predicting Klinkenberg Permeability … 31
GRNN. It is also notable that GRNN has acceptable performance and predict Klinkenberg
permeability better than MLR and tree boost techniques. Figures 14-17 displays the scatter plots of the
predicted and core-based Klinkenberg permeability in dataset number 6.
Figure 14
Scatter plot of core-based and Klinkenberg permeability predicted by GRNN.
Figure 15
Scatter plot of core-based and Klinkenberg permeability predicted by MLR.
0
0.02
0.04
0.06
0.08
0.1
0.12
0 0.02 0.04 0.06 0.08 0.1
Pre
dic
ted
Kli
nk
enb
erg
per
mea
bil
ity
Core- based Klinkenberg permeability
0
0.02
0.04
0.06
0.08
0.1
0.12
0.14
0 0.02 0.04 0.06 0.08 0.1
Pre
dic
ted
Kli
nk
enb
erg
per
mea
bil
ity
Core- based Klinkenberg permeability

32 Iranian Journal of Oil & Gas Science and Technology, Vol. 4 (2015), No. 3
Figure 16
Scatter plot of core-based and Klinkenberg permeability predicted by SVM.
Figure 17
Scatter plot of core-based and Klinkenberg permeability predicted by tree boost.
Correlation coefficient is not a reliable index to evaluate the accuracy of predictions. In this regard,
some other measures of error were employed. To compare the models, the average percentage
difference in error between each technique and the actual data was computed through the analysis of
AAE and SEM error measurements. Table 4shows the average errors (AAE and SEM) of MLR, tree
boost, GRNN, and SVM models. As it can be seen, SVM and GRNN have similar performance in
0
0.01
0.02
0.03
0.04
0.05
0.06
0.07
0.08
0.09
0.1
0 0.02 0.04 0.06 0.08 0.1
Pre
dic
ted
Kli
nk
enb
erg
per
mea
bil
ity
Core- based Klinkenberg permeability
0
0.02
0.04
0.06
0.08
0.1
0.12
0 0.02 0.04 0.06 0.08 0.1
Pre
dic
ted
Kli
nk
enb
erg
per
mea
bil
ity
Core- based Klinkenberg permeability

S. Baziar et al./ Toward a Thorough Approach to Predicting Klinkenberg Permeability … 33
predicting Klinkenberg permeability and exhibit better results compared with the two other
techniques. The results show that the SVM method has obtained the lowest average error values
compared to MLR, tree boost, and GRNN techniques, except for the AAE error measured for GRNN
in dataset 5 and SEM error measured for GRNN in datasets 1 and 6 (see Table 4). Furthermore, it is
notable that simpler methods like MLR often present reliable results as advanced methods such as
SVM and neural networks. The analysis of these error statistics reveals that SVM and GRNN are
proper approaches to the prediction of Klinkenberg permeability.
Table 4
Measures of AAE and SEM obtained from the prediction of Klinkenberg permeability by MLR, tree boost,
SVM, and GRNN.
Dataset
Number
MLR Tree boost SVM GRNN
AAE SEM AAE SEM AAE SEM AAE SEM
1 0.073 0.057 0.084 0.051 0.045 0.037 0.054 0.034
2 0.055 0.045 0.048 0.052 0.039 0.031 0.042 0.041
3 0.034 0.029 0.046 0.039 0.028 0.016 0.037 0.020
4 0.025 0.032 0.043 0.027 0.019 0.14 0.022 0.015
5 0.034 0.036 0.041 0.034 0.027 0.018 0.025 0.024
6 0.030 0.028 0.044 0.036 0.027 0.019 0.031 0.019
5. Conclusions
In this study, support vector machine, general regression neural network, tree boost, and multiple
linear regression methods were used to predict Klinkenberg permeability in Mesaverde tight gas
sandstones located in Washakie basin, the USA. Moreover, the performance of these methods in
regression tasks and predicting Klinkenberg permeability was compared. The following main
conclusions can be drawn in this study:
Multiple linear regression, tree boost, support vector machine, and general regression neural
network are accurate methods to predict Klinkenberg permeability in the tight gas reservoirs;
Support vector machine outperforms general regression neural network, tree boost, and
multiple linear regression methods in predicting the Klinkenberg permeability of the tight gas
reservoir;
General regression neural network model exhibits better efficiency than tree boost and
multiple linear regression methods in the prediction of Klinkenberg permeability;
Support vector machine presents a great generalization capability in the presence of a small
number of training data points;
In comparison to the advanced methods such as SVM and neural networks, simple regression
methods like MLR can also lead to reliable results.
Nomenclature
AAE : Average absolute error
ANN : Artificial neural network

34 Iranian Journal of Oil & Gas Science and Technology, Vol. 4 (2015), No. 3
DT : Sonic travel-time log
ERM : Empirical risk minimization
GR : Gamma ray log
k : Absolute permeability, kernel function
ka : Apparent permeability
md : Millidarcy
MLR : Multi linear regression
NPHI : Neutron porosity log
p : Pore pressure
PEF : Photoelectric factor log
r : Correlation coefficient
RBF : Radial basis function
RHOB : Bulk density log
RT : Resistivity log
SEM : Standard error of the mean
SRM : Structural risk minimization
SV : Support vector
SVM : Support vector machine
SVR : Support vector regression
VC : Vapnik-Chervonenkis
References
Aguilera, R. and Harding, T., State-of-the-art Tight Gas Sands Characterization and Production
Technology, Journal of Canadian Petroleum Technology, Vol. 47, p. 37-41, 2008.
Al-Anazi, A. and Gates, I., Support Vector Regression for Porosity Prediction in a Heterogeneous
Reservoir: a Comparative Study, Computers and Geosciences, Vol. 36, p. 1494-1503, 2010.
Al-Anazi, A. and Gates, I., Support Vector Regression to Predict Porosity and Permeability, Effect of
Sample Size, Computers and Geosciences, Vol. 39, p. 64-76, 2010.
Al-Anazi, A. F., Gates, I. D., and Azaiez, J., Innovative Data-driven Permeability Prediction in a
Heterogeneous Reservoir, in EUROPEC/EAGE Conference and Exhibition, Society of
Petroleum Engineers, 2009.
Al-Bulushi, N., Araujo, M., and Kraaijveld, M., Predicting Water Saturation Using Artificial Neural
Networks (ANNS), Neural Networks, Vol. 549, No. 57, p. 57-62, 2007.
Amari, S. I. and Wu, S., Improving Support Vector Machine Classifiers by Modifying Kernel
Functions, Neural Networks, Vol. 12, No. 12, p. 783-789, 1999.
Aminian, K. and Ameri, S., Application of Artificial Neural Networks for Reservoir Characterization
with Limited Data, Journal of Petroleum Science and Engineering, Vol. 3, No. 49, p. 212-222,
2005.
Aminian, K., Thomas, B., Bilgesu, H., Ameri, S., and Oyerokun, A., Permeability Distribution
Prediction, in Proceeding of SPE Eastern Regional Conference, SPE Paper, October, 2001.
Anifowose, F. A. and Abdulraheem, A., Prediction of Porosity and Permeability of Oil and Gas
Reservoirs Using Hybrid Computational Intelligence Models, in North Africa Technical
S. Baziar et al./ Toward a Thorough Approach to Predicting Klinkenberg Permeability … 35
Conference and Exhibition, Society of Petroleum Engineers, 2010.
Anifowose, F. A., Ewenla, A. O., and Eludiora, S. I., Prediction of Oil and Gas Reservoir Properties
Using Support Vector Machines, in International Petroleum Technology Conference,
International Petroleum Technology Conference, 2011.
Arevalo-Villagran, J. A., Ganpule, S. V., Wattenbarger, R. A., Samaniego-Verduzco, F., Yanez-
Mondragon, M., and Serrano-Lozano, J. R., Analysis of Long-term Performance in Tight Gas
Wells: Field Examples, in SPE International Petroleum Conference and Exhibition in Mexico,
Society of Petroleum Engineers, 2002.
Asadisaghandi, J. and Tahmasebi, P. Comparative Evaluation of Back-propagation Neural Network
Learning Algorithms and Empirical Correlations for Prediction of Oil PVT Properties in Iran
Oilfields, Journal of Petroleum Science and Engineering, Vol. 78, p. 464-475, 2011.
Baziar, S., Tadayoni, M., Nabi-Bidhendi, M., and Khalili, M., Prediction of Permeability in a Tight
Gas Reservoir by Using Three Soft Computing Approaches: A Comparative Study, Journal of
Natural Gas Science and Engineering, Vol. 21, p. 718-724, 2014.
Becker, C. J., Christoudias, C. M., and Fua, P., Non-linear Domain Adaptation with Boosting, in
Advances in Neural Information Processing Systems, Vol. 17, p. 485-493,2013.
Bhatt, A., Reservoir Properties from Well Logs Using Neural Networks, 2002.
Carrasquilla, A., Silvab, J., and Flexac, R. Associating Fuzzy Logic, Neural Networks and
Multivariable Statistic Methodologies in the Automatic Identification of Oil Reservoir
Lithologies through Well Logs, Revista de Geologia, Vol. 21, p. 27-34, 2008.
Chang, H. C., Chen, H. C., and Fang, J. H., Lithology Determination from Well Logs with Fuzzy
Associative Memory Neural Network, Geoscience and Remote Sensing, IEEE Transactions on
Vol. 35, p. 773-780, 1997,
Cristianini, N. and Shawe-Taylor, J., An Introduction to Support Vector Machines and other Kernel-
based Learning Methods, Cambridge University Press, 2000.
Cumella, S. P. and Scheevel, J., The Influence of Stratigraphy and Rock Mechanics on Mesaverde
Gas Distribution, Piceance Basin, Colorado, 2008.
Friedman, J. H., Stochastic Gradient Boosting, Computational Statistics and Data Analysis, Vol. 38,
p. 367-378, 1999.
Goda, H. M., Maier, H., and Behrenbruch, P., Use of Artificial Intelligence Techniques for Predicting
Irreducible Water Saturation-Australian Hydrocarbon Basins, in Asia Pacific Oil and Gas
Conference and Exhibition, Society of Petroleum Engineers, 2007.
Haykin, S., Neural Networks, a Comprehensive Foundation, Prentice Hall PTR.
Huang, Z., Shimeld, J., Williamson, M., and Katsube, J., Permeability Prediction with Artificial
Neural Network Modeling in the Venture Gas Field, Offshore Eastern Canada., Geophysics,
Vol. 61, p. 422-436, 1994.
Huber, P. J. Robust Estimation of a Location Parameter, the Annals of Mathematical Statistics, Vol.
35, p. 73-101, 1964.
Ibrahim, M. A. and Potter, D. K., Prediction of Residual Water Saturation Using Genetically Focused
Neural Nets, in SPE Asia Pacific Oil and Gas Conference and Exhibition, Society of Petroleum
Engineers, 2004.
Karimpouli, S., Fathianpour, N., and Roohi, J., A New Approach to Improve Neural Networks'
Algorithm in Permeability Prediction of Petroleum Reservoirs using Supervised Committee
Machine Neural Network (SCMNN), Journal of Petroleum Science and Engineering, Vol. 73, p.
227-232, 2010.

36 Iranian Journal of Oil & Gas Science and Technology, Vol. 4 (2015), No. 3
Kecman, V., Support Vector Machines–an Introduction, in Support Vector Machines, Theory and
Applications, Springer, 2005.
Mollajan, A. and Memarian, H., Estimation of Water Saturation from Petrophysical Logs Using
Radial basis Function Neural Network, Journal of Tethys, Vol. 1, p. 156-163, 2013.
Naik, G., Tight Gas Reservoirs–an Unconventional Natural Energy Source for the Future, www.
Sublette-se. org/files/tight_gas. pdf. Accessado em, Vol. 1, p. 1-7, 2008.
Parrella, F., Online Support Vector Regression, Master's Degree Thesis, Department of Information
Science, University of Genoa, Italy, 2007.
Saffarzadeh, S. and Shadizadeh, S. R., Reservoir Rock Permeability Prediction Using Support Vector
Regression in an Iranian Oil Field, Journal of Geophysics and Engineering, Vol. 9, No. 336, p.
336-344, 2012.
Shokir, E. E. M., Prediction of the Hydrocarbon Saturation in Low Resistivity Formation via Artificial
Neural Network, in SPE Asia Pacific Conference on Integrated Modeling for Asset
Management. Society of Petroleum Engineers, 2004.
Smola, A. J. and Schölkopf, B., A Tutorial on Support Vector Regression, Statistics and Computing,
14, 2004.
Specht, D. F. Probabilistic Neural Networks, Neural Networks, Vol. 3, p. 109-118, 1990.
Specht, D. F., A General Regression Neural Network, Neural Networks, IEEE Transactions on, Vol.
2, p. 568-576, 1991.
StatSoft, S. N. N., StatSoft Inc. USA, 1998.
Sun, Q., Eissa, M., Castagna, J., Cersosimo, S., Sun, S. and Decker, C., Porosity from Artificial
Neural Network Inversion for Bermejo Field, Ecuador, in SEG Expanded Abstracts, Vol. 734, p.
734-741, 2001.
Tadayoni, M. and Valadkhani, M., New Approach for the Prediction of Klinkenberg Permeability In
situ for Low Permeability Sandstone in Tight Gas Reservoir, in SPE Middle East
Unconventional Gas Conference and Exhibition, Society of Petroleum Engineers, 2012.
Vapnik, V. Estimation of Dependences based on Empirical Data, N.Y., Springer-Verlag, 1982.
Vapnik, V. The Nature of Statistical Learning Theory, Springer, 2000.
Vapnik, V., Golowich, S. E., and Smola, A., Support Vector Method for Function Approximation,
Regression Estimation, and Signal Processing, Advances in Neural Information Processing
Systems 1997.
Vapnik, V. N. and Chervonenkis, A. J., Theory of Pattern Recognition, 1974.
Wiener, J., Rogers, J., and Moll, B., Predict Permeability from Wireline Logs Using Neural Networks.
Petroleum Engineer International, Vol. 68, p. 68-75, 1995.
Wong, P., Jian, F., and Taggart, I., A Critical Comparison of Neural Networks and Discriminant
Analysis in Lithofacies, Porosity and Permeability Predictions, Journal of Petroleum Geology,
Vol. 18, p. 191-206, 1995.
Wong, P. M., Jang, M., Cho, S., and Gedeon, T. D., Multiple Permeability Predictions Using an
Observational Learning Algorithm, Computers and Geosciences, Vol. 26, p. 907-913, 2000.