Embed Size (px)
Citation preview

ARTICLE IN PRESS
1071-5819/$ - se
doi:10.1016/j.ijh
�CorrespondE-mail addr
(W. Zhang), zh
(W.D. Gray).
Int. J. Human-Computer Studies 64 (2006) 847–873
www.elsevier.com/locate/ijhcs
Toward a decision-theoretic framework for affect recognitionand user assistance
Wenhui Liaoa, Weihong Zhanga, Zhiwei Zhua, Qiang Jia,�, Wayne D. Grayb
aDepartment of Electrical, Computer and Systems Engineering, Rensselaer Polytechnic Institute, Troy, NY 12180-3590, USAbDepartment of Cognitive Science, Rensselaer Polytechnic Institute, Troy, NY 12180-3590, USA
Received 13 May 2005; received in revised form 23 March 2006; accepted 2 April 2006
Communicated by S. Brave
Available online 19 May 2006
Abstract
There is an increasing interest in developing intelligent human–computer interaction systems that can fulfill two functions—
recognizing user affective states and providing the user with timely and appropriate assistance. In this paper, we present a general unified
decision-theoretic framework based on influence diagrams for simultaneously modeling user affect recognition and assistance. Affective
state recognition is achieved through active probabilistic inference from the available multi modality sensory data. User assistance is
automatically accomplished through a decision-making process that balances the benefits of keeping the user in productive affective
states and the costs of performing user assistance. We discuss three theoretical issues within the framework, namely, user affect
recognition, active sensory action selection, and user assistance. Validation of the proposed framework via a simulation study
demonstrates its capability in efficient user affect recognition as well as timely and appropriate user assistance. Besides the theoretical
contributions, we build a non-invasive real-time prototype system to recognize different user affective states (stress and fatigue) from
four-modality user measurements, namely physical appearance features, physiological measures, user performance, and behavioral data.
The affect recognition component of the prototype system is subsequently validated through a real-world study involving human
subjects.
r 2006 Elsevier Ltd. All rights reserved.
Keywords: Affective computing; Human–computer interaction; Influence diagrams; Active sensing; Stress modeling; Fatigue recognition
1. Introduction
The field of human–computer interaction (HCI) hasmoved from a focus on user-friendly graphical userinterfaces (GUIs) to systems that bring to bear powerfulrepresentations and inferential machinery (Maes andSchneiderman, 1997) in understanding, explaining, justify-ing, or augmenting user actions. An important example ofthis new wave in HCI is the design of user assistancesystems that enhance users’ daily performance (Horvitz,1999). Although progress is being made in user-modeling(Bauer et al., 2001), augmented cognition, and adaptive
e front matter r 2006 Elsevier Ltd. All rights reserved.
cs.2006.04.001
ing author. Tel.: +1518 276 6440; fax: +1 518 276 6261.
esses: [email protected] (W. Liao), [email protected]
[email protected] (Z. Zhu), [email protected] (Q. Ji), [email protected]
user interfaces (Hass and Hettinger, 2001), the majority ofexisting systems continue to assume normative perfor-mance, and all existing systems fail to adapt to user affect.A constellation of recent findings, from neuroscience,psychology, and cognitive science, suggests that emotionplays surprisingly critical roles in users’ rational, func-tional, and intelligent behaviors (Picard et al., 2001). Infact, the situations where affective considerations are mostcritical are precisely the types of situations where theconsequences of the human–machine interaction failuresare most severe. It is especially important to recognizedangerous affect in the increasing numbers of HCI systemsin critical, typically high-stress, applications such as airtraffic control, process control in nuclear power plants,emergency vehicle dispatchers, pilots and drivers, and avariety of military operational contexts. In fact, theincreasing frequency of accidents and incidents attributed

ARTICLE IN PRESSW. Liao et al. / Int. J. Human-Computer Studies 64 (2006) 847–873848
to the broad area of ‘‘human error’’ in a variety of settingscould be reduced by considering the user affective states insystem design, particularly such negative states as stress,fatigue, anxiety, and frustration. Therefore, recognizingsuch negative user affect and providing appropriateinterventions to mitigate their effects is critical for thesuccessful completion of a task, for avoiding (oftendisastrous) errors, for achieving optimal performance, forimproving HCI experience, and for improving learning anddecision-making capability.
The causes and manifesting features of various useraffective states have been extensively investigated inpsychology, computer vision, physiology, behavioralscience, ergonomics and human factor engineering (Beatty,1982; Gardell, 1982; Ortony et al., 1988; Breazeal, 1999;Mindtools, 2004). In spite of the findings from diversedisciplines, it is still a rather challenging task to develop anintelligent user affect recognition and assistance system.First, the expression and the measurements of user affectare very much person-dependent and even time or contextdependent for the same person. Second, the sensoryobservations are often ambiguous, uncertain, and incom-plete. Third, users’ affective states are dynamic and evolveover time. Fourth, both affect recognition and userassistance must be accomplished in a timely and appro-priate manner. Finally, lack of a clear criterion for ground-truthing affective states greatly increases the difficulty ofvalidating affect recognition approaches and user assis-tance systems.
In this paper, we propose a general dynamic probabil-istic decision-theoretic model based on Influence Diagrams(IDs) (Howard and Matheson, 1981) for unifying affectrecognition with user assistance. We are interested inrecognizing negative task-dependent affective states (e.g.stress, fatigue, anxiety, confusion, frustration, etc.) andproviding assistance to mitigate their effects in order tomaintain user in a productive state. Such an ID explicitlyincludes random variables that represent affective statesand sensory observations, decision variables that representuser assistance and sensory actions, and utility functionsthat represent the benefits and costs associated with userassistance. Within the proposed framework, efficient useraffect recognition can be achieved by an active inferencebased on selecting and integrating a subset of mostinformative observations; meanwhile, timely and appro-priate assistance can be achieved by a decision choicebalancing between the benefit of the assistance and theiroperational and interruption costs. Compared with otherexisting mathematical tools, ID enjoys several uniqueadvantages. First, it provides a coherent and fully unifiedhierarchical probabilistic framework for representing andmodeling the uncertain knowledge about user affect andassistance determination at different levels of abstraction.Second, within the unified framework, affect recognition iscast as a standard probabilistic inference procedure, whileuser assistance is formulated as a decision-making proce-dure. Third, it naturally incorporates the evolution of user
affect and accounts for the temporal aspect of decision-making with the dynamic structure. Thus, such a model isan ideal candidate to accommodate the aforementionedchallenges.This paper intends to make contributions in both theory
and applications. Theoretically, we provide a formaltreatment of ID-based user modeling that addresses thetheoretical foundations of affect recognition and automaticuser assistance determination within a unified framework.In addition, an active sensing strategy is proposed to decidean optimal sensory action set to collect the best usermeasurements for efficient affect recognition and for timelydecision-making for user assistance. Practically, based onthe theoretical model, we develop a non-invasive and real-
time prototype system that monitors two affective states—stress and fatigue. The system collects sensory data fromfour modalities: physical appearance, behavior, physiolo-gical measures, and performance. The system is non-
invasive in that all the measurements are collected in anon-intrusive manner without interrupting the user.The remainder of this paper is organized as follows. A
brief literature review is presented in Section 2. Section 3proposes the dynamic ID framework and Section 4describes how this framework enables us to bridge betweeninferring affective states and deciding appropriate userassistance. Section 5 illustrates a simulation system tovalidate the proposed framework and Section 6 discusses areal-world user affect monitoring system and its validation.Finally, Section 7 concludes the paper with several futureresearch directions.
2. Related work
In this section, we first review the related work in useraffect modeling and recognition. This is then followed by areview of current work in user assistance.
2.1. User affect modeling and recognition
2.1.1. General approaches
In predicting and recognizing user affect, the methodscan be classified as predictive inference (top-down),diagnostic inference (bottom-up), or a hybrid combiningboth predictive and diagnostic inference. For predictiveinference, affect is recognized based on prediction usingfactors that influence or cause affect. A predictiveapproach usually rests itself on the established psycholo-gical theories. For instance, Ortony et al. (1988) definesemotions as valenced (positive or negative) reaction tosituations consisting of events, actors, and objects. Thevalence of one’s emotional reaction depends on thedesirability of the situation, which, in turn, is defined byone’s goals and preferences. The theory defines 22emotions as a result of situation appraisal. If a person’sgoals and perception of relevant events are known, they areused to predict the person’s emotions.

ARTICLE IN PRESSW. Liao et al. / Int. J. Human-Computer Studies 64 (2006) 847–873 849
In contrast to a predictive approach, diagnosticapproaches infer affect from physiological or behavioralmeasurements of the user. A rich body of literature hasrevealed the use of various features to infer user affect. InKaapor et al. (2001), the authors discuss how to monitoreyebrow movements and body posture to provide evidenceof students’ engagement while interacting with a computer-based tutor. Heishman et al. (2004) propose to use eyeregion biometrics (including eyebrow, pupil, iris, upper/lower fold, and upper/lower eyelid) to reveal user affective(fatigue) and cognitive (engagement) states. In Ji et al.(2004), physical appearance features extracted from real-time videos are used to assess users’ fatigue status. Thework by Berthold and Jameson (1999) studies the effects ofcognitive workload on two speech symptoms—sentencefragments and articulation rate. Cowie and co-workers(Cowie et al., 2001) develop a hybrid system capable ofusing information from faces and voices to recognizepeople’s emotions.
To improve recognition accuracy, diagnostic and pre-dictive methods may be combined. For example, affect-influencing factors such as task, environment, time of day,or user traits or physical conditions are often combinedwith physiological or behavioral data to provide a moreconsistent and accurate affect characterization. Mostprobabilistic approaches, to be surveyed later, belong tohybrid ones (Conati, 2002; Ji et al., 2004).
We can also classify the approaches in affect recognitionbased on the mathematical tools they used. The first groupuses traditional classification methods in pattern recogni-tion. The approaches include rule-based systems (Pantic etal., 2002), discriminate analysis (Ark et al., 1999), fuzzyrules (Elliott et al., 1999; Massaro, 2000; Hudlicka andMcNeese, 2002), case-based and instance-based learning(Scherer, 1993; Petrushin, 2000), linear and nonlinearregression (Moriyama et al., 1997), neural networks(Petrushin, 1999), Bayesian learning (Qi et al., 2001; Qiand Picard, 2002; Kapoor et al., 2004) and other learningtechniques (Heishman et al., 2004). Most of these researchefforts focus on the low-level mapping between certainsensory data and the underlying affect. The mapping isoften performed statically and independently, ignoring thehistory or current context that might influence theinterpretation of user affective states. In fact, a commoncriticism of these approaches is their inadequacy insystematically representing prior knowledge, the depen-dencies among affect variables, the dynamics of affect, andin accounting for the uncertainties in both user affect andits measurements.
To overcome these limitations, the second group ofapproaches uses probabilistic graphical models such asHidden Markov Models (HMMs), Bayesian networks(BNs), etc. With the aid of causal and uncertaintyrepresentation structure, these methods maintain abalance between global and local representations aswell as provide powerful capabilities for handlingcomplex situations in practical systems. HMMs have been
used as a framework for recognizing the affective states(hidden) from observational data. For example, Picard(1997) uses HMMs to model the transitions amongthree affective states, namely, interest, joy, and distress.She also discusses the utility of HMMs for capturingenvironmental, cultural, or social context. Cohen et al.(2000) propose an HMM approach to recognize facialexpressions and then classify user affect based on therecognized expressions. For each of the affective statesstudied, an HMM corresponding to an affective state isconstructed. The features, based on the Facial ActionCoding System (Ekman and Friesen, 1978), are extractedfrom the real-time videos. These measures are used tocompute the posterior probability of a particular useraffect. One problematic assumption made in the paper isthat facial expression always reflects emotion. Thisassumption is unrealistic as facial expressions are ambig-uous, therefore unable to uniquely characterize emotions.Yeasin et al. (2004) exploits HMMs to learn the underlyingmodels for each universal expression. It is shown thatHMMs can be used to accurately recognize six basicemotional facial expressions—surprise, happiness, sadness,fear, anger and disgust. The average recognition rate of theproposed facial expression classifier is 90.9%. The assump-tion behind this work is that facial expressions have asystematic, coherent, and meaningful structure that can bemapped to affective dimensions (Breazeal, 1999; Machleitand Enoglu, 2000). HMMs, however, lack the capability torepresent dependencies and semantics at different levels ofabstraction between emotion and the factors that causeemotion as well as the various observations that reflectemotion.As a generalization to HMMs, BNs use graphical models
to represent, at different levels of abstraction, the priorknowledge of affective states and the dependencies amonguser affect, the factors influencing affect and the observa-tions reflecting affect. In Ball and Breeze (2000), a two-layer BN is created to model valence and arousal of users’affect during the interaction with an embodied conversa-tional agent. The model uses measurements from linguisticbehavior, vocal expression, posture and body movements.HMMs and BNs can be also combined within oneframework. For example, Kaliouby and Robinson (2004)develop a real-time system for inferring six mental states,including agreement, concentrating, disagreement, inter-ested, thinking, and unsure, from facial expressions andhead gestures. The system consists of three levels: actionunit analysis, facial and head display recognition, andmental state inference. The first two levels are implementedvia an HMM approach. The output of HMMs is fed to adynamic Bayesian network (DBN) for inferring usermental states. In summary, BNs are expressive in modelingconditional dependency and have been used for affectrecognition. However, they do not explicitly modeldecisional choices and their utilities. Within the BNframework, decisions must be made separately and oftenin an ad hoc manner.

ARTICLE IN PRESSW. Liao et al. / Int. J. Human-Computer Studies 64 (2006) 847–873850
2.1.2. User stress and fatigue recognition
In this section, we especially review related work inrecognizing human stress and fatigue since they are usuallythe significant factors causing a variety of human–machineinteraction failures. Especially, these are the two affectivestates that we have experimented in our real-world system.
Human stress is a state of tension that is created when aperson responds to the demands and pressures that arisefrom work, family, and other external sources, as well asthose that are internally generated from self-imposeddemands, obligations, and self-criticism. Although somestress is beneficial in certain circumstances, due to theadverse effects of excessive stress in our daily life, it isimportant to detect stress in a timely manner and treat itproperly. In the past, researchers from different disciplineshave developed inference approaches or pragmatic systemsto recognize user stress level. The approaches or systemsdiffer from each other in either the sensory modalities, orinference techniques, or both. In Healy and Picard (2000),a sequential forward floating algorithm (SFFS) is used tofind an optimal set of features from the physiologicalmeasures (electrocardiogram, electromyogram, respiration,and skin conductance) and then the k-NN (nearestneighbor) classifier is applied to classify the stress intofour levels. In Rani et al. (2003), after extractingphysiological parameters from the measures of cardiacactivity, electrodermal activity, electromyographic activity,and temperature, regression tree and fuzzy logic methodol-ogies are used to classify human anxiety into 10 levels. Anon-contact skin temperature measuring system is devel-oped to evaluate stress in Kataoka et al. (1998), where onlythe skin temperatures on nose and forehead are measured.Rimini-Doering et al. (2001) combines several physiologi-cal signals and visual features (eye closure, head move-ment) to monitor driver drowsiness and stress in a driversimulator.
Over the years, many efforts have been made in the fieldof fatigue modeling and monitoring and the results arereviewed by Ji (2002) and Hartley et al. (2000). Tradition-ally, physiological measures have been widely used forfatigue detection. The popular physiological measuresinclude the electroencephalograph (EEG) (Empson, 1986)and the multiple sleep latency test (MSLT) (Carskadon andDement, 1982). EEG is found to be useful in determiningthe presence of ongoing brain activity and its measureshave been used as the reference point for calibrating othermeasures of sleep and fatigue. MSLT measures the amountof time a test subject falls asleep in a comfortable sleep-inducing environment. Unfortunately, most of thesephysiological parameters are obtained intrusively, makingthem unacceptable in real-world applications. Thus, inrecent years, there has been increasing research activityfocused on developing systems that detect the visual facialfeature changes associated with fatigue using a videocamera. These facial features include eyes, head position,face or mouth. This approach is non-intrusive and becomesmore and more practical with the rapid development of
camera and computer vision technology. Several studieshave demonstrated their feasibility and some of themclaimed that their systems perform as effectively as thesystems detecting physiological signals do (Saito et al.,1994; Ueno et al., 1994; Boverie et al., 1998; Grace, 2001).However, efforts in this direction are often directed todetecting a single visual cue such as eyelid movement. Sincea single visual cue is often ambiguous, varies with time,environment or subjects, its validity is questioned (Heit-mann et al., 2001). To overcome this limitation, it isnecessary to combine multiple measures to produce moreaccurate fatigue-related performance estimation. Our real-world system works towards this goal as will be detailedlater.
2.2. User assistance
Appropriate and timely user assistance is crucial for aHCI system. Ensuring that the intervention will be aswelcomed as it will be valuable and timely is an importantresearch issue. Here, we briefly review current methodol-ogies in user assistance.In Li and Ji (2004), a DBN is proposed to recognize user
affect by modeling multiple visual appearance variables. Ifthe user affect level exceeds a pre-determined threshold,certain assistance is provided. The reported experimentsshow that the framework works well with synthetic data.Unfortunately, a limitation of this approach is that thethreshold is manually set and therefore needs humanintervention. This is different from the proposed workwhere the user assistance is automatically generated, basedon the utility of assistance.Murray et al. (2004) describe a decision-theoretical
approach based on dynamic decision network for selectingtutorial actions while helping a student with a task. Thetheoretical schema is specifically designed for two applica-tion domains: calculus-related rate problems and elemen-tary reading. These applications exploit a rich model of thetutorial state, including attributes such as the students’knowledge, focus of attention, affective state, and nextaction(s), along with task progress and the discourse state.Via an extensive simulation, their work focuses onevaluating whether the selected tutorial action is rationaland fast enough under a variety of tutorial situations. BothMurray’s and our work decide optimal actions with themaximal expected utility and exploit the temporal proper-ties, although Murray’s work looks multiple steps aheadwhile ours looks one step ahead. Murray’s work and oursare different in several ways. First, Murray’s work is moreconcerned with how an optimal tutorial action can beselected given the tutorial state instead of studying how torecognize the tutorial state, such as the student’s affectivestates, focus of attention, etc.; while our work focuses onboth how to automatically and efficiently recognize users’affective states from multiple-modality measurements andon how user assistance can be timely and appropriatelyapplied within the integrated framework. More specifically,

ARTICLE IN PRESS
E1 En
S1 Sn
U1 Un
Dt
UD
Precedence link
Hidden nodes
Θ t
Fig. 1. An ID example. Chance nodes are represented by ellipse, decision
nodes are represented by rectangles, and utility nodes are represented by
diamonds.
W. Liao et al. / Int. J. Human-Computer Studies 64 (2006) 847–873 851
instead of developing a component of user affect recogni-tion system, we develop an integrated system. This involvesdevelopment of both the sensing system and the inferenceengine as well as their systematic integration into aprototype system. Second, Murray et al. systematicallyevaluate the effectiveness of the selected tutorial actionsthrough simulations; we also evaluate the effectiveness ofthe user assistance through simulations, but the evaluationis limited to the effect of the assistance on the users’affective states. For our studies, a real-time and non-invasive prototype system is built based on the proposedframework for, respectively, recognizing human fatigueand stress using sensors of different modalities. In addition,real-world experiments are conducted to validate the affectrecognition part of the system.
In Conati (2002), a dynamic decision network based onID is used in pedagogical agents to monitor a user’semotions and to generate interventions aimed at achievingthe best tradeoff between the user’s learning and engage-ment during their interaction with educational games. Likeours, in inferring user affective states, the work accountsfor both the possible causes of the user’s emotional arousaland its effects such as bodily expressions. Also, theintervention is decided by maximizing expected utility.However, there are apparent differences between theirwork and ours. First, our method integrates affectrecognition and intervention in a unified framework,allowing affect recognition and intervention to be per-formed simultaneously. Second, we consider a largerevidence set. Their work uses only bodily expression-related features, while our work utilizes physical appear-ance, physiological, behavioral measures, and performancedata. Third, their work assumes user measurements thatare already provided (such as facial expressions, etc.), whilewe develop methods to obtain various measurements in oursystem.
In Horvitz et al. (2003), a decision-theoretic model isproposed to help a user in choosing actions by inferringher/his attention, a concept closely related to user affectivestates. The attention focus is inferred from the observedstates of several sensors such as microphones, cameras,accelerometers and location sensing facilities. The atten-tional focus is also reflected by the user’s interactions withsoftware and devices, background information about thehistory of the user’s interests, and prior patterns ofactivities. The work differs from our work in that itemphasizes performing attention inference mostly fromdesktop activities, while ours emphasizes performing affectinference from sensory evidence of different modalities.
In summary, there are numerous efforts in developingsystems for user affect recognition and for user assistance.They tend to focus on either affect recognition or userassistance. In addition, the sensory modality that is usedfor user state measurements is often limited and the sensorymeasurement acquisition is often intrusive. Our researchintends to build an integrated system that can simulta-neously fulfill the two functions: affect recognition and user
assistance. Compared with the cited ones, the significanceof our framework is that it employs dynamic inference andsequential decision-making techniques to unify affectrecognition with user assistance, utilizes evidence frommultiple modalities and acquires them in real-time and in anon-intrusive manner, and applies active sensing strategiesfor selecting most informative measurements for efficientand timely affect recognition. In addition to validating theproposed framework with a simulation system, the affectrecognition component is validated with a real-worldstudy.
3. A unified framework for modeling affect and user
assistance
3.1. Influence diagrams
Since IDs were introduced by Howard and Matheson in1981 (Howard and Matheson, 1981), it has been widelyused as a knowledge representation framework to facilitatedecision and probabilistic inference problems underuncertainty. An ID is a directed acyclic graph consistingof nodes and the directed links between nodes. Nodes aregrouped into decision nodes, chance (random) nodes, andutility nodes. Decision nodes, usually drawn as rectangles,indicate the decisions to be made and their set of possiblealternatives. Chance nodes, usually drawn as circles,represent uncertain variables that are relevant to thedecision problem. Utility nodes, usually drawn as dia-monds, are associated with utility functions to representthe utility of each decision. The arcs connecting differenttypes of nodes have different meanings, based on theirdestinations. Arcs among chance nodes represent theprobabilistic dependencies among the connected nodeswhile arcs between decision nodes represent time prece-dence. Arcs connecting to utility nodes represent the valueinfluence. Fig. 1 gives an ID example.The top node Y indicates the target hypothesis variable,
for example, it could be affective states. Each bottom node,E1; . . . ; En, indicates the possible observations of the target

ARTICLE IN PRESS
affectivestates
physiologicalphysical
affectivestates
behavioral
assistance
context
evidenceevidenceevidence
UUU
goalprofile
pred
ictiv
e
diagnostic
workload
performance
Usa
evidence
U
time t-1 time t
sensor sensor sensorsensor
assistance
temporalUa
Fig. 2. A generic influence diagram for user assistance and affective state
recognition. For simplicity, we show the dynamic ID at time t but only
draw the ‘‘affective states’’ and ‘‘assistance’’ nodes at time t� 1. Ellipses
denote chance nodes, rectangles denote decision nodes, and diamonds
denote utility nodes.
W. Liao et al. / Int. J. Human-Computer Studies 64 (2006) 847–873852
variable. The big ellipse indicates all the chance nodesbetween the E nodes and Y node. These nodes arecollectively called hidden nodes. They model the probabil-istic relationships between the Y node and Ei nodes withdifferent abstraction levels. The decision node D indicatesthe possible actions associated with the hypothesis node Ywhile each decision node Si controls whether to obtainobservations from an information source or not. Eachutility node U connected with Si defines the cost ofobtaining data from the information source. The utilitynode connected with both nodes Y and D indicates thebenefit (penalty) of taking appropriate (inappropriate)actions with respect to a particular target hypothesis state.In addition to the semantic relationships, an ID need beparameterized. This involves quantifying each chance nodewith a probability matrix describing the conditionalprobability of the node given all possible outcomes for itsparent(s), and each utility node a utility function. Overall,such an ID can be used to decide a best evidence set toreduce the uncertainty of the hypothesis Y as well as todecide a best decision D associated with such a hypothesis.
In summary, IDs use an acyclic directed graph repre-sentation to capture the three diverse sources of knowledgein decision-making: conditional relationships about howevents influence each other in the decision domain,informational relationship about what action sequencesare feasible in any given set of circumstances, andfunctional relationships about how desirable the conse-quences are (Pearl, 1988). The goal of ID modeling is tochoose a decision alternative maximizing the expectedutilities. We call this decision alternative as an optimalpolicy and call the maximized utility as optimal expectedutility. Evaluating an ID is to find such an optimal policyas well as compute the optimal expected utility (Shachter,1986).
3.2. Modeling affect recognition and user assistance with
influence diagrams
In this section, we present our framework based on IDfor simultaneously modeling affective states and userassistance. The framework actually has a similar structureto the example ID in Fig. 1. We discuss the details of theproposed framework in both qualitative part (the structure,the various nodes and their links) and quantitativepart (conditional probability distributions and utilityfunctions).
Central to user affect modeling are affective states, themeasurements used to infer user affect, and the userassistance that can be provided. In addition, a completemodel ought to include the factors that influence useraffect, and the sensory nodes that enable evidencecollection. In our model, the following componentsconstitute the affect detection and the user assistancesystem: a set of user affective states, a set of externalassistance that may alter user affective states, a set of userstate measurements (also called evidence), a set of
conditional probability distributions that characterize theconditional dependencies among related variables, and aset of utility functions that characterize the benefits or costsof performing assistance/sensory actions. An ID imple-mentation of these components is shown in Fig. 2.The schematic diagram captures the information neces-
sary for two purposes: providing user assistance andrecognizing affective states. The upper, predictive portion,of the diagram depicts contextual factors that can alteraffective states. Such elements include environmentalcontext, user profile, goal that the user is pursuing,workload, etc. The lower, diagnostic portion, depicts theobservable features that reflect user affective states. Thesefeatures may include quantifiable measures on physicalappearance, physiology, behaviors, and performance. Theleft, temporal portion, models the temporal evolution ofuser affect and sequential decision-makings on userassistance. The inference of user affect and the determina-tion of the appropriate assistance based on integrating thepredictive, diagnostic, and temporal inference is moreaccurate and consistent than any of them alone.
3.3. Model description
This subsection describes the qualitative part of themodel, namely the affective states, evidence, actions andutilities.
3.3.1. Affective states
An affective state is an integration of subjectiveexperience, expressive behavior, and neurochemical activ-ity. We focus on negative affective states such as stress,fatigue, and confusion since they can adversely alter users’productivity and negatively affect their decision-makingand learning abilities. An affective state has a set ofpossible values. For instance, stress may vary from low tonormal and to high. Naturally, affective states are not

ARTICLE IN PRESSW. Liao et al. / Int. J. Human-Computer Studies 64 (2006) 847–873 853
mutually exclusive. For example, a subject can be bothfatigued and stressed. Accordingly, if multiple affectivestates are of interest, each of them needs to be representedby a separate random node in the model.
3.3.2. Factors influencing affective states
User affective states could be affected by a variety offactors. These factors may include the environmentalcontext, the user profile (or personal traits), the workload,and importance of the goal the user is pursuing. Theenvironmental context reflects the exterior impact from theoutside situation on user affective states. The workload andthe importance of the goal lead to interior influence on auser (Karasek, 1979; Ortony et al., 1988; Jones and Bright,2001). And the profile information may include age,experience, skills, health, etc., which plays an importantrole in adapting the model to individual differences amongusers. Thus, these factors are represented as parentvariables of the ‘‘affective states’’ node and form thepredictive portion of the model.
3.3.3. Sensory measurements
An evidence is an observable feature that is capable ofproviding clues about the user’s internal affective state. Weconsider four classes of measurable evidence: the user’sphysical appearance features, physiological measures,behavioral characteristics, and performance measures.
physical
affectivestates
eyelidmovement
facialexpression
headmovementpupil
E
S
UE
S
UE
S
UE
S
U
Fig. 3. ID modeling for physical appearance evidence. E represents an
evidence node; S represents a sensor node or a sensing algorithm; and U
represents a utility node.
physiologi
ECG GSREEG EMG
affectivestates
E
S
U E
S
U E
S
U E
S
U
Fig. 4. ID modeling for p
Physical appearance evidence includes the visual featuresthat characterize user’s eyelid movement, pupil movement(eye gaze movement, pupillary response, etc.), facialexpression, and head movement. These features have asystematic, coherent, and meaningful structure that can bemapped to affective states (Beatty, 1982; Breazeal, 1999;Machleit and Enoglu, 2000; Partala and Surakka, 2003).Specifically, eyelid movement can be characterized byaverage eye closure speed, blinking frequency, etc.; pupilmovement can be characterized by gaze spatial distributionand fixation, pupil dilation, pupil size variation, etc.; facialexpression can be happy, sad, angry, scary, etc.; and headmovement can be characterized by head pose, tiltingfrequency, etc. The importance of these features may varywith different affective states. For example, head tiltingfrequency is a useful feature for identifying fatigue, while itmay not be effective for recognizing stress. An ID diagrammodeling the physical appearance evidence for estimatinghuman affective states is shown in Fig. 3. In the figure, the‘‘physical’’ node is added as an intermediate node between‘‘affective states’’ and the physical appearance evidence inorder to model the correlations among the evidence. Theintuition is that the user affect influences his physicalstatus, which, in turn, influences the physical appearancessuch as eyelid, gaze, etc. The ‘‘physiological’’ and‘‘behavioral;; nodes are added in Figs. 4 and 5, respectively,for similar reasons.
cal
GSAblood
pressurerespiration
E
S
U E
S
U E
S
U
hysiological evidence.
behavioral
mousemovement
mousepressure
characterinput speed
affectivestates
E
S
U E
S
U E
S
U
Fig. 5. ID modeling for behavioral evidence.

ARTICLE IN PRESSW. Liao et al. / Int. J. Human-Computer Studies 64 (2006) 847–873854
The physiological variables provide physiological evi-dence about user affect (Gardell, 1982; Picard, 1997; Jonesand Bright, 2001). The physiological evidence can beelectromyography (EMG) measures that assess the elec-trical signal generated by muscles when they are beingcontracted, electrocardiograph (ECG) measures that assessthe electrical pulse of the heart, galvanic skin response(GSR) measures that assess the electrical properties of theskin in response to different kinds of stimuli, generalsomatic activity (GSA) measures that assess the minutemovement of human body, electroencephalography (EEG)measures that assess the electrical activity produced by thebrain and many others such as respiration and bloodpressure. A typical approach to modeling the physiologicalevidence is shown in Fig. 4.
User behavior may be influenced by user affective states.For example, an emotional user might press the keyboardheavily and irrationally. The behaviors in question may bepatterns of interaction between user and computer, e.g. theinteraction between user and the mouse or the keyboard.For this research, we monitor several user behaviorsincluding mouse/keyboard pressing pressure, mouse clickfrequency and speed, character input speed from thekeyboard, and cursor movement speed and pattern, etc.An ID that models behavioral evidence is shown in Fig. 5.
Performance can vary with user affective states andtherefore may indicate user affect. In a task specificenvironment, the performance may be accuracy rate, userresponse time, or other measures derived from these two.As an instance of affective state influencing user perfor-mance, Karasek (1979) demonstrated that occupationalstress was affected by the tasks presented to a user.
3.3.4. Assistance, sensory actions, and utilities
In addition to random nodes, an ID has decision nodesand utility nodes. Two types of decision nodes areembedded in the proposed framework. The first type isthe assistance node associated with the affective state node.Assistance actions may have different degrees of intrusive-ness to a user. For example, in one extreme, the assistancecan be null if the user is at positive affective states; in theother extreme, the user may be interrupted and forced toquit if he is in a dangerous level of negative affective states.Some typical assistance could be ‘‘warning’’ (friendlyinform the user his negative affective states), ‘‘alleviating’’(simplify user interface, decrease task difficulty, etc.),‘‘intervening’’ (stop user from work), and etc. How todesign appropriate assistance should depend on theapplications. Another type of decision node is the sensoryaction node. It controls whether to activate a sensor forcollecting evidence or not.
Corresponding to the decision nodes, there are threetypes of utility nodes. The utility node associated with theassistance node denotes the physical cost of performingassistance. The utility node associated with both affectivestates and assistance node indicates the benefit (penalty) oftaking appropriate (inappropriate) assistance with respect
to a particular user state with respect to a particular userstate. The utility node associated with a sensory nodedenotes the cost of operating the sensor for evidencecollection. More details will be given in Section 3.4.
3.3.5. Dynamics
While a static ID only models the static aspect of affectstates and user affect evolves over time, it is important tomodel the temporal evolution of affect and the sequentialdecision-making on user assistance with a dynamic ID. Ingeneral, a dynamic ID is made up of interconnected timeslices of static IDs, and the relationships between twoneighboring time slices are modeled by an HMM, i.e.random variables at time t are affected by variables at timet, as well as by the corresponding random variables at timet� 1. Each time slice is used to represent the snapshot ofan evolving temporal process at a time instant. These timeslices are interconnected by the arcs joining particulartemporal variables from two consecutive slices.For modeling affect and assistance, the temporal nodes
include the affect node and the assistance node. Thetemporal links between the temporal affect nodes in twoconsecutive slices represent temporal evolution of the userstate over time, with the nodes at time t� 1 providing adiagnostic support for the corresponding nodes at time t.Specifically, the temporal state node Yt�1 at time t� 1provides a diagnostic support for the affect node Yt at timet. And the temporal link from the assistance node at t� 1,Dt�1, to current state Yt indicates the assistance applied inthe previous step may influence affective state in thecurrent step.
3.3.6. The complete model
We are now ready to combine the above componentsinto a complete model for affect recognition and userassistance. Combining physical appearance (Fig. 3),physiological features (Fig. 4), behavioral features(Fig. 5), performance features, and the dynamic, and thedynamics into the schematic graph (Fig. 2), we obtain acomplete graph in Fig. 6. Overall, the complete modelconsists of the predictive portion that models the con-textual factors that can alter/cause user affective states, thediagnostic portion that models the observable features thatreflect user affective states, and the temporal portion thatmodels the evolution of affective states and sequentialdecision-making on user assistance. In addition, it consistsof two types of decision nodes, the assistance node forproviding appropriate assistance to maintain user inpositive affective states, and the sensory action nodes forcontrolling whether to activate sensors for collectingvaluable evidence. Such a model demonstrates a coherentand fully unified hierarchical structure for representing andintegrating various variables that are closely related withuser affective states and assistance.In addition, the generic model is flexible to allow
variables to be inserted and modified. For example, therandom variables under the behavioral node may vary with

ARTICLE IN PRESS
affectivestates
affectivestates
assistance
context
Usa
goalprofile
pred
ictiv
e
diagnosticworkload
physical
eyelidmovement
facialexpression
headmovement
E
pupil
EE
S
E
physiological
ECG
GSR
GSA
EEG
S
E E E E
S S S
performance
S S
...
behavioral
mousemovement
mousepressure
char. inputspeed
E E E
S S S S
response
accuracy
S
E E
S
U
assistance
time ttime t-1
temporal
U UUUUUUUUU U U
Ua
Fig. 6. The complete influence diagram for modeling user assistance and affect. Note that some physiological features are omitted due to space limit.
W. Liao et al. / Int. J. Human-Computer Studies 64 (2006) 847–873 855
different applications, the random variables under thephysiological node may change, depending on the avail-ability of the required measuring devices. Furthermore,variables can be inserted between the evidence ðEÞ nodesand their parent nodes to model the reliability of thecorresponding sensors. Fig. 7 summarizes some of thediscrete variables and their states in the model.
3.4. Model parameterization
This subsection introduces the quantitative part of themodel, namely the conditional probability tables (CPTs)and utility functions.
3.4.1. CPTs
Once the topology of the dynamic ID is specified, thenext step is to quantify the relationships between connectednodes—this is done by specifying a conditional probabilitydistribution for each chance node and a utility function foreach utility node. As we are only considering discretevariables, the conditional dependencies among the vari-ables are characterized by CPTs. For each random node,given a value assignment of its parents, a CPT is aprobability distribution over all possible values of therandom node. If the node has no parents, a CPTdegenerates to a priori distribution. For example, for thenode ‘‘workload’’, pðworkloadÞ denotes the prior distribu-tion of the variable ‘‘workload’’ over the values ‘‘low’’,‘‘normal’’, and ‘‘high’’. For an evidence node (say E linkingto EEG), the CPT pðEjEEG;Sensor ¼ onÞ is a distributionof the variable E over the measurable range of EEG giventhe EEG and that sensor is turned on.
Similarly, if a node has a temporal link, its CPTcharacterizes the conditional dependence of the node onits parent nodes, some of which come from the previous timestep. Let us take the affective state node as an example. ItsCPT pðaffectjprevious_affect, previous_assistance, context,profile, goal, workloadÞ denotes a probability distributionover the current affective states for each value assignmentof the parent nodes. In particular, if the assistance is null,the CPT describes how the affective state evolves overtime given the values of other parent variables; if theuser is provided with an assistance, the CPT describeshow the assistance alters the user affective state given thevalues of other parent variables. Fig. 8 gives some CPTexamples.In general, CPTs are obtained from statistical analysis of
a large amount of training data. For this research, the CPTparameters come from two sources. First, we refer toseveral large-scale subjective surveys and domain experts(Ortony et al., 1988; Picard, 1997; Rosekind et al., 2000;Sherry, 2000; Picard et al., 2001; Zhang and Ji, 2005a) toobtain initial CPTs. An experienced expert can oftenproduce rather accurate estimates of local probabilities.For the case of a random node that has multiple parentnodes, certain causal-independence assumptions (e.g.noisy-or or generalized noisy-or principle, Diez, 1993;Zhang and Poole, 1996; Lemmer and Gossink, 2004) maybe used to simplify the parameterization. Second, weobtain training data from the human subjects study weconducted. These data are then used to train the ID modelwith the existing learning algorithms (Buntine, 1994;Lauritzen, 1995; Jordan, 1999) such as the EM method(Lauritzen, 1995). With the learning algorithm, the initial

ARTICLE IN PRESS
Fig. 7. Some variables and their states in the ID model.
W. Liao et al. / Int. J. Human-Computer Studies 64 (2006) 847–873856
CPTs are automatically refined to match each individualsubject.
3.4.2. Utility
When deciding upon the user assistance and sensoryactions, we need to consider our preferences among thedifferent possible outcomes of the available actions. TheID uses utility functions associated with utility nodes toprovide a way for representing and reasoning withpreferences. A utility function quantifies preferences,reflecting the ‘‘usefulness’’ (or ‘‘desirability’’) of theoutcomes, by mapping them to real numbers (Kevin andAnn, 2003). Specifically, for the proposed framework,utility functions are defined according to the three types ofutility nodes. A utility node associated with the assistancenode only denotes the physical and interruption cost ofperforming that assistance. We would assign a higher costto actions that require more resources and time, orinterrupt the user more. The cost would map to negativevalues in the utility function. A utility node associated withboth assistance and affective state nodes denotes the benefit(penalty) of providing appropriate (inappropriate) assis-tance with respect to user affective state. For example, if auser is very stressed, an appropriate assistance may be to
reduce workload, while an inappropriate assistance wouldbe to let the user continue his work or increase taskdifficulty. Thus the former should be assigned a highpositive value while the latter should be given a lownegative value in the utility function. A utility nodeassociated with a sensory node denotes the cost ofoperating the sensor for evidence collection. The costincludes the computational cost, physical cost, etc. Forexample, when a device is used to measure EEG, there is acost for operating the device as well as analysing the data.We want to emphasize that all the utilities need to becalibrated with a certain calibration standard so that theycan be appropriately used in the same ID framework.
4. Affect recognition and user assistance
Given the parameterized dynamic ID framework, thissection focuses on the techniques for recognizing affectivestates and determining user assistance.
4.1. Overview
Fig. 9 outlines the main steps in applying the dynamic IDto affect recognition and user assistance. This is achieved

ARTICLE IN PRESS
Fig. 8. Some examples of CPTs. Note for different subjects, the CPTs may be different.
W. Liao et al. / Int. J. Human-Computer Studies 64 (2006) 847–873 857
through ID evaluation. ID evaluation starts from thecurrent user affect, which is influenced by three streams ofinformation: one from the previous user state estimate, onefrom the available contextual information, and one fromthe performed user assistance at the previous step. Then, anactive sensing strategy is employed to decide an optimalsensor set S�t as well as whether the sensors in S�t are worthactivating or not. If the sensors in S�t will benefit thedecision-making on user assistance and affect recognition,these sensors are activated and new evidence E�t arecollected. The collected evidence is then propagated toupdate user affect and the posterior probabilities of userstress pt is computed with the dynamic inference technique.If no new sensors are activated, the user affect is updatedwith only the temporal information from the affectivestates at the previous time step. Based on the updatedestimate of user state, the system determines the optimalassistance d�t that maximizes the overall expected utility.After the assistance is performed, the user state may changeand new evidence may need to be collected. Thus thesystem goes to the next step and repeats the ID evaluationprocedure. With this systematic procedure, our model is
capable of deliberately choosing optimal sensors andavoiding unnecessary sensory actions, efficiently recogniz-ing user affective states, and providing timely andappropriate assistance.The procedure of deciding optimal sensors and user
assistance is actually to find an optimal policy for the IDmodel. A policy in the model is D ¼ ðs1; . . . ; sn; dÞ consist-ing of one rule (value) for each decision node, where si is avalue for each sensory node Si, and d is a value for theassistance node. An optimal policy D� is the one that canmaximize the overall expected utility EU:
D� ¼ argmaxd
EUD, (1)
EUD ¼Xaff
PDðaffÞgusaðaff ; dÞ þ PDðdÞgua
ðdÞ
þX
i
PDðsiÞguiðsiÞ, ð2Þ
where aff indicates the affective state node, gua, gusa
, gui
are the utility functions for the utility nodes associatedwith the assistance node, both the affective state and
ARTICLE IN PRESS
Active Sensing:determine optimal sensor set St*
Collect Evidence Et* from St*
Affect Recognition:compute pt
User Assistance:decide dt*
t=t+1
Activate St*?
User State Update through Belief Propagation
yes
ContextualInformation
no
Perform
Assistance d
t *
User A
ffect Temporal E
volvement
no
User Affect
Fig. 9. The flowchart for affect recognition and user assistance.
W. Liao et al. / Int. J. Human-Computer Studies 64 (2006) 847–873858
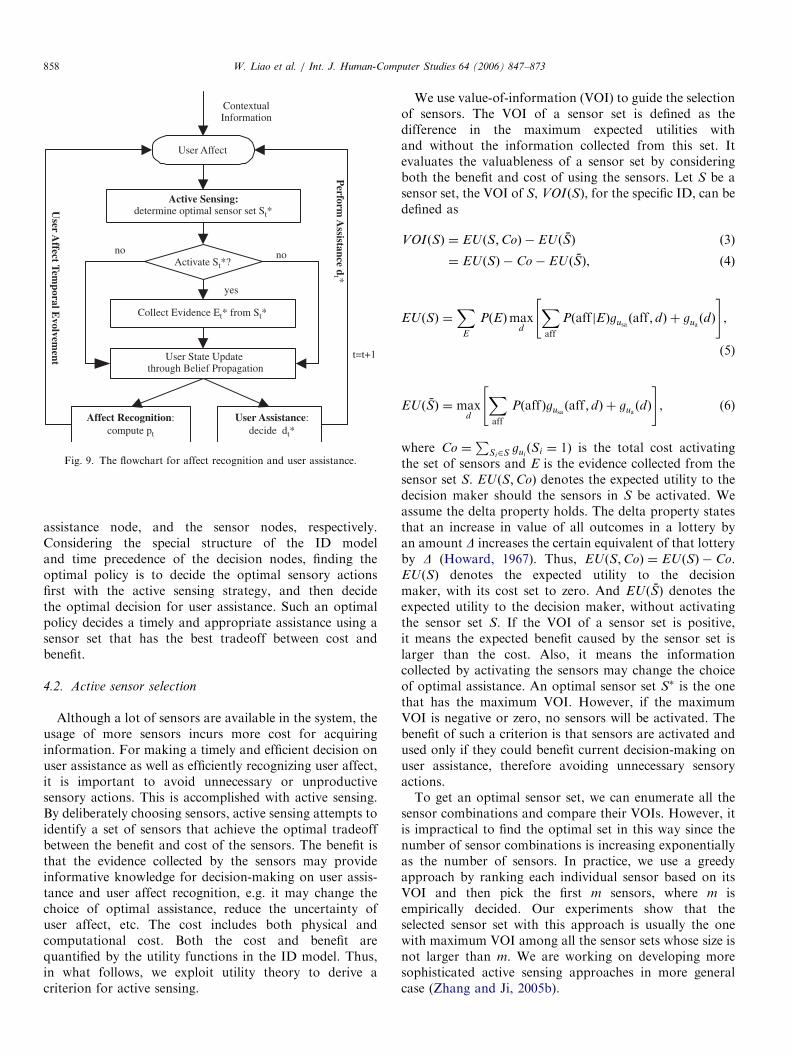
assistance node, and the sensor nodes, respectively.Considering the special structure of the ID modeland time precedence of the decision nodes, finding theoptimal policy is to decide the optimal sensory actionsfirst with the active sensing strategy, and then decidethe optimal decision for user assistance. Such an optimalpolicy decides a timely and appropriate assistance using asensor set that has the best tradeoff between cost andbenefit.
4.2. Active sensor selection
Although a lot of sensors are available in the system, theusage of more sensors incurs more cost for acquiringinformation. For making a timely and efficient decision onuser assistance as well as efficiently recognizing user affect,it is important to avoid unnecessary or unproductivesensory actions. This is accomplished with active sensing.By deliberately choosing sensors, active sensing attempts toidentify a set of sensors that achieve the optimal tradeoffbetween the benefit and cost of the sensors. The benefit isthat the evidence collected by the sensors may provideinformative knowledge for decision-making on user assis-tance and user affect recognition, e.g. it may change thechoice of optimal assistance, reduce the uncertainty ofuser affect, etc. The cost includes both physical andcomputational cost. Both the cost and benefit arequantified by the utility functions in the ID model. Thus,in what follows, we exploit utility theory to derive acriterion for active sensing.
We use value-of-information (VOI) to guide the selectionof sensors. The VOI of a sensor set is defined as thedifference in the maximum expected utilities withand without the information collected from this set. Itevaluates the valuableness of a sensor set by consideringboth the benefit and cost of using the sensors. Let S be asensor set, the VOI of S, VOIðSÞ, for the specific ID, can bedefined as
VOIðSÞ ¼ EU ðS;CoÞ � EUðSÞ ð3Þ
¼ EU ðSÞ � Co� EU ðSÞ, ð4Þ
EUðSÞ ¼X
E
PðEÞmaxd
Xaff
Pðaff jEÞgusaðaff ; dÞ þ gua
ðdÞ
" #,
(5)
EUðSÞ ¼ maxd
Xaff
PðaffÞgusaðaff ; dÞ þ gua
ðdÞ
" #, (6)
where Co ¼P
Si2S guiðSi ¼ 1Þ is the total cost activating
the set of sensors and E is the evidence collected from thesensor set S. EUðS;CoÞ denotes the expected utility to thedecision maker should the sensors in S be activated. Weassume the delta property holds. The delta property statesthat an increase in value of all outcomes in a lottery byan amount D increases the certain equivalent of that lotteryby D (Howard, 1967). Thus, EU ðS;CoÞ ¼ EUðSÞ � Co.EUðSÞ denotes the expected utility to the decisionmaker, with its cost set to zero. And EU ðSÞ denotes theexpected utility to the decision maker, without activatingthe sensor set S. If the VOI of a sensor set is positive,it means the expected benefit caused by the sensor set islarger than the cost. Also, it means the informationcollected by activating the sensors may change the choiceof optimal assistance. An optimal sensor set S� is the onethat has the maximum VOI. However, if the maximumVOI is negative or zero, no sensors will be activated. Thebenefit of such a criterion is that sensors are activated andused only if they could benefit current decision-making onuser assistance, therefore avoiding unnecessary sensoryactions.To get an optimal sensor set, we can enumerate all the
sensor combinations and compare their VOIs. However, itis impractical to find the optimal set in this way since thenumber of sensor combinations is increasing exponentiallyas the number of sensors. In practice, we use a greedyapproach by ranking each individual sensor based on itsVOI and then pick the first m sensors, where m isempirically decided. Our experiments show that theselected sensor set with this approach is usually the onewith maximum VOI among all the sensor sets whose size isnot larger than m. We are working on developing moresophisticated active sensing approaches in more generalcase (Zhang and Ji, 2005b).

ARTICLE IN PRESSW. Liao et al. / Int. J. Human-Computer Studies 64 (2006) 847–873 859
4.3. Optimal user assistance
After deciding the optimal sensor set, the values of thepolicy D ¼ ðs1; . . . ; sn; dÞ are fixed except the d part.Deciding the optimal user assistance is to find d�t achievingthe optimal tradeoff between the cost and benefit ofthe assistance given the evidence collected from theoptimal sensor set S�t . The cost of an assistance mayinclude operational cost, interruption cost, and the costof delaying or not providing the assistance. The benefit ofan assistance is characterized by its potential to returnthe user to a productive affect state. Let e�t be theevidence collected after activating the sensors in theoptimal sensor set, the optimal assistance d�t can be decidedas follows:
d�t ¼ argmaxd
EUdt, (7)
EUdt¼Xaff t
Pðaff tje�t ; d�t�1Þgusa
ðaff t; dtÞ þ guaðdtÞ, (8)
where the sum is taken over every possible value aff of theuser state. The quantity EUdt
balances the benefit/cost oftaking appropriate/inappropriate assistance (the firstterm), and the cost (the second term) of performingassistance. The optimal assistance d�t is the one thatmaximizes EUdt
among all available assistance. Please notethat one of alternatives of d is null assistance. Hence noassistance will be provided if the null assistance alternativehas the maximum expected utility.
Once d�t is performed, it will alter user affect state unlessd�t ¼ Null; in this case, the user affective state will evolvenaturally. The steps repeat as shown in Fig. 9.
4.4. Affect recognition
Affect recognition is to estimate user affect from theevidence collected from the selected sensor sets using thedynamic inference technique. The system tries to estimatethe user affect at each time step t. We first introduce thenotations and then define the problem. We shall use thefirst one or several characters of a node name to refer to thenode, i.e. w referring to workload, aff referring to affective
states. In addition, we subscript a variable by a step t torefer to the variable at time t, i.e. aff t for affective statesnode at time t. Under these notations, the ID modelspecifies two probabilistic relationships: the user affecttransition model pðaff tjaff t�1;wt; ct; prot; gt; d
�t�1Þ (d
�t�1 de-
notes the assistance at time t� 1) and the evidencegeneration model pðe�t jaff tÞ, where e�t is the set of evidenceobserved at step t. The inference at step t is to calculate theprobability pðaff tje
�1:t; d
�t�1Þ. In case t ¼ 0, pðaff tje
�1:t; d
�t�1Þ
degenerates to the prior pðaff0Þ.From a Bayesian point of view, the task is to compute
pðaff tje�1:t; d
�t�1Þ from pðaff t�1je
�1:t�1; d
�t�2Þ recursively. The
task can be accomplished in two stages: prediction usingthe predictive portion of the ID and correction using the
diagnostic portion. In the prediction stage, the priorprobability pðaff tje
�1:t�1; d
�t�1Þ of user affect at step t is
calculated as follows:
pðaff tje�1:t�1; d
�t�1Þ ¼
Xaff t�1;wt;ct;prot;gt
fpðwtÞpðctÞpðprotÞpðgtÞ
�pðaff t�1je�1:t�1; d
�t�2Þ
�pðaff tjaff t�1;wt; ct; prot; gt; d�t�1Þg ð9Þ
In the correction stage, the evidence set e�t is used to updatethe prior pðaff tje
�1:t�1; d
�t�1Þ by Bayes’ rule:
pðaff tje�1:t; d
�t�1Þ ¼
pðe�t jaff tÞpðaff tje�1:t�1; d
�t�1Þ
pðe�t je�1:t�1; d
�t�1Þ
¼pðe�t jaff tÞpðaff tje
�1:t�1; d
�t�1ÞP
aff tpðe�t jaff tÞpðaff tje
�1:t�1; d
�t�1Þ
. ð10Þ
5. Experiments with synthetic data
In order to validate the proposed framework, we havebuilt a simulation system. We first report experiments withthe focus on one affective state, and then extend it to themultiple affective states case.
5.1. Simulation system
We develop a simulation system that simulates a so-called truthful user, represented by a source model, and anobserved user, represented by a working model. Boththe working model and the source model have thesame structure and parameters as the ID model in Fig. 6,while they perform different functions. The sourcemodel produces evidence reflecting the true affective statesand accepts user assistance, whereas the working modelaccepts the perturbed evidence, uses the evidence toestimate user affect, and determines what assistance toprovide.Fig. 10 illustrates how the simulator works. Initially, the
source model begins with a probability distribution for theaffective state representing true user affect. Next, the sourcemodel generates a set of evidence through a top-downinference. Based on the VOI criterion (Section 4.2), theworking model determines a set of sensors, collects a set ofperturbed evidence generated from the source model,decides optimal user assistance d� (Section 4.3), andestimates the observed user affect (Section 4.4). In themeanwhile, the source model performs the user assistanced� to update the true affective state. The simulationprocedure repeats at the next time step.Actually, the relationship between the source model and
working model is similar to the relationship between apatient and a doctor. A doctor (a working model) decideswhat tests (sensors) to perform on a patient, makes adiagnosis (estimates user affect), and treats the patient(decides user assistance). A patient (a source model) showssymptoms (evidence) because of some illness (true useraffect), and accepts treatment (receives user assistance).

ARTICLE IN PRESS
Produce Evidence E*
Perform d*
Collect Evidence E'*
Source Model Working Model
Decide Optimal Sensor Set S*S*
Estimate User Affect
True User Affect
Update U
ser Affect
ObservedUser Affect
E*
d*Decide Optimal d*
Fig. 10. A simulation system to validate the ID framework.
0 50 100 1500
0.1
0.2
0.3
0.4
0.5
0.6
0.7
0.8
0.9
1Appropriate assistances
Time steps
Str
ess
leve
l
0 50 100 1500
0.1
0.2
0.3
0.4
0.5
0.6
0.7
0.8
0.9
1No assistances
Time steps
Str
ess
leve
l
SourceEstimationAssistance
SourceEstimationAssistance
Fig. 11. Appropriate and timely user assistance vs. no assistance. In the left chart, the system provides timely and appropriate assistance. In the right, the
system does not perform any assistance and degenerates to a recognizer of affective states. Solid (dashed) curve indicates the true (estimated) stress level
from the source (working) model; triangle denotes assistance. The initial stress level in both the source model and working model is .5.
W. Liao et al. / Int. J. Human-Computer Studies 64 (2006) 847–873860
A good doctor should make correct diagnosis and treat apatient correctly; thus a working model should estimateuser affect correctly and provide appropriate and timelyuser assistance, which is also the criterion we will use toevaluate our framework.
1We refer any stress level that is greater than .8 as high.
5.2. Simulation results
We have conducted experiments to show that the IDframework is capable of providing accurate estimation ofaffective states as well as offering timely and appropriateassistance. The experiments were conducted with the IDmodel shown in Fig. 6. First, the ‘‘affective states’’ nodeonly models one affective state as stress, and it will beextended to the multiple affective states case later. We notethat the specific design of assistance may vary with theapplications. In the experiments, four types of assistanceare designed: null, warning, alleviating, and intervening.Null means there is no assistance; warning is conveyed byplaying stirring music or displaying an exhilarating scene;alleviating is to reduce workload on the user; andintervening may entail removing the user from control.
5.2.1. Appropriate and timely user assistance
The goal of our system is to provide timely andappropriate user assistance. Timely assistance means thatthe assistance is provided at time that the user is in anegative emotional state. Appropriate assistance optimizesthe tradeoff between the benefits of bringing the user to aproductive state and the cost of performing an assistanceand interrupting the user.Fig. 11 compares changes in the user’s simulated
emotional state when no assistance vs. appropriateassistance is provided. The left chart confirms that thesystem provides assistance only when the stress level isrelatively high; at most times the system does not provideassistance since the user can maintain a productive state.Moreover, the performed assistance effectively reduces userstress level. Consequently, over all steps, the user maintainsa reasonable stress level in the source model. Although wehave designed four kinds of assistance in the system, onlythe first two (null, warning) are performed because the usernever has a chance to reach a high stress level1 due to thetimely and appropriate assistance.
ARTICLE IN PRESSW. Liao et al. / Int. J. Human-Computer Studies 64 (2006) 847–873 861
In contrast, as shown by the right chart in Fig. 11, theuser assistance system degenerates to an affect recognizer ifwe set the costs of performing user assistance to be infinite.In this case, the system will never provide any assistance.Without any assistance, user stress level increases as timegoes on. However, as shown by the chart, the system canstill recognize user affect. Note that the estimated stresslevel from the working model is quite close to the stresslevel in the source model. The two curves track each othervery well.
5.2.2. Affective states recognition
This subsection shows that the working model canrecognize the affective states even without knowing theinitial state precisely. The results are demonstrated inFig. 12. The two charts show that the system is effective inrecognizing affective states when the working model has noprior knowledge of the user affective states at all. The leftchart is the recognition results for the case in which thesource model starts with a highly stressed state, whereas theright chart is the recognition results for the case in whichthe source model starts with non-stressed state.
5.2.3. Active sensor selection
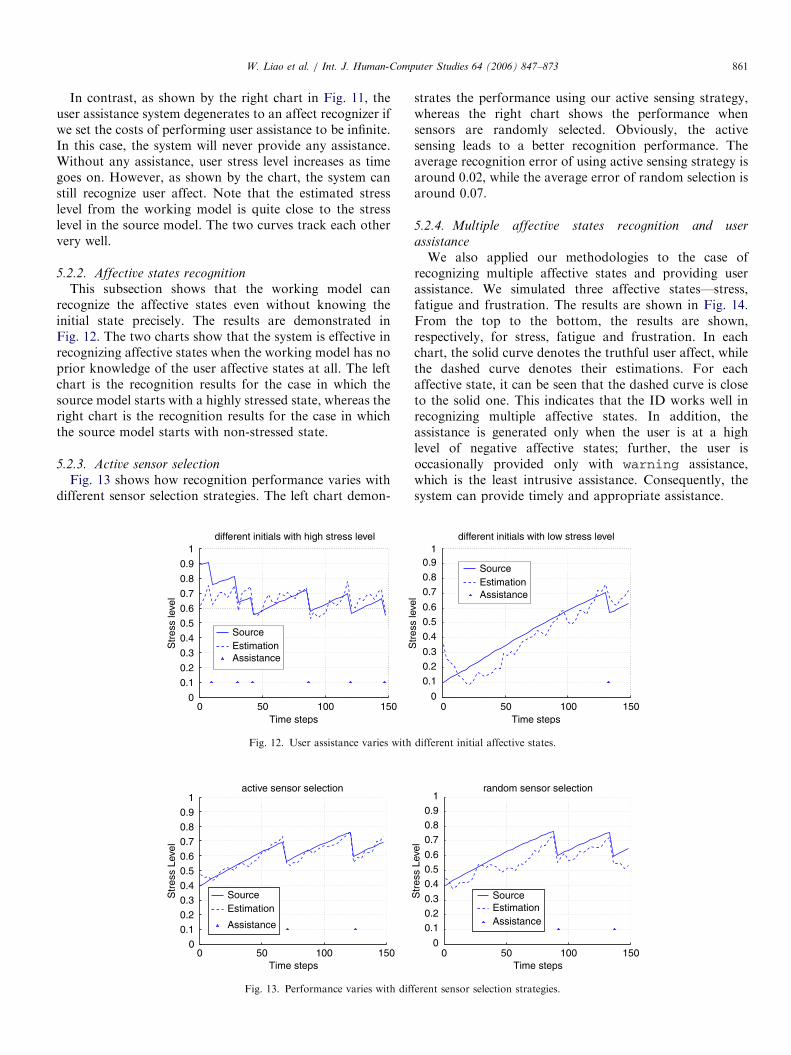
Fig. 13 shows how recognition performance varies withdifferent sensor selection strategies. The left chart demon-
0 50 100 1500
0.1
0.2
0.3
0.4
0.5
0.6
0.7
0.8
0.9
1different initials with high stress level
Time steps
Str
ess
leve
l
SourceEstimationAssistance
Fig. 12. User assistance varies with
0 50 100 1500
0.1
0.2
0.3
0.4
0.5
0.6
0.7
0.8
0.9
1active sensor selection
Time steps
Str
ess
Leve
l
SourceEstimation
Assistance
Fig. 13. Performance varies with dif
strates the performance using our active sensing strategy,whereas the right chart shows the performance whensensors are randomly selected. Obviously, the activesensing leads to a better recognition performance. Theaverage recognition error of using active sensing strategy isaround 0.02, while the average error of random selection isaround 0.07.
5.2.4. Multiple affective states recognition and user
assistance
We also applied our methodologies to the case ofrecognizing multiple affective states and providing userassistance. We simulated three affective states—stress,fatigue and frustration. The results are shown in Fig. 14.From the top to the bottom, the results are shown,respectively, for stress, fatigue and frustration. In eachchart, the solid curve denotes the truthful user affect, whilethe dashed curve denotes their estimations. For eachaffective state, it can be seen that the dashed curve is closeto the solid one. This indicates that the ID works well inrecognizing multiple affective states. In addition, theassistance is generated only when the user is at a highlevel of negative affective states; further, the user isoccasionally provided only with warning assistance,which is the least intrusive assistance. Consequently, thesystem can provide timely and appropriate assistance.
0 50 100 1500
0.1
0.2
0.3
0.4
0.5
0.6
0.7
0.8
0.91
different initials with low stress level
Time steps
Str
ess
leve
l
SourceEstimationAssistance
different initial affective states.
0 50 100 1500
0.10.20.3
0.40.50.6
0.70.80.9
1random sensor selection
Time steps
Str
ess
Leve
l
SourceEstimationAssistance
ferent sensor selection strategies.

ARTICLE IN PRESS
0 50 100 1500
0.2
0.4
0.6
0.8
Str
ess
Leve
l
0 50 100 1500
0.2
0.4
0.6
0.8
Fatig
ue L
evel
0 50 100 1500.10.20.30.40.50.6
Frus
trat
ion
Leve
l
Time steps
Fig. 14. Recognizing multiple affective states and user assistance.
Fig. 15. The human–computer interaction environment: (a) overall hardware set-up; (b) emotional mouse; (c) visual sensor.
W. Liao et al. / Int. J. Human-Computer Studies 64 (2006) 847–873862
6. Human affect recognition validation with real data
6.1. System overview
We present our experimental results for recognition oftwo affective states—stress and fatigue. We begin byintroducing our implemented system, the experimentalenvironments, as well as the protocol to validate ourframework. This is then followed by a report of ouranalysis results.
The HCI environment is shown in Fig. 15. Duringexperiments, a user sits in front of a computer screen andresponds to the tasks presented in the screen. A visual sensorsuite, which is shown in Fig. 15(c), is used to monitor theuser in real-time. It consists of three cameras: one wide-anglecamera focusing on the face and two narrow-angle camerasfocusing on the eyes. In addition, an emotional mouse (see
Fig. 15(b)), which is built from a regular tracking-ball mouseby equipping it with physiological sensors, is used to collectphysiological and behavioral data. Furthermore, a log file iscreated in the computer to record the user’s performancedata on the tasks that the user is working on. Under such asystem set-up, various user state measurements characteriz-ing the user can be extracted simultaneously and non-intrusively in real-time.Fig. 16 gives an overview of the user affect monitoring
system. It consists of three conceptual components. First,visual, physiological, behavioral and performance mea-sures are extracted from corresponding sensors. Second,two statistical methods—correlation analysis and analysisof variance (ANOVA), are used to select the mostdiscriminative features regarding user affect. Third, adynamic influence diagram (DID) is constructed to inferuser affect, which consists of a parameterization procedure

ARTICLE IN PRESS
Visual Sensors
PerformanceRecorder
BehavioralSensors
SignalProcessing(denoising,
thresholding, etc. )
Visual Features
PhysiologicalFeatures
BehavioralFeatures
Feature ExtractionFeaturesSensors
ANOVAAnalysis
User Affect Index
PhysiologicalSensors
CorrelationAnalysis
Feature Selection Highly DiscriminativeFeatures
Input variables forDID
DID Parameterization
InferredUser Affect
Active Sensing
Inference Engine
PerformanceFeatures
DID Model
UserDatabase
Fig. 16. The conceptual components of the user affect monitoring system.
W. Liao et al. / Int. J. Human-Computer Studies 64 (2006) 847–873 863
to customize the DID to individual users with machinelearning techniques, an active sensing strategy to select anoptimal set of features for purposive and sufficinginformation integration, and a dynamic inference techni-que for efficient user affect recognition.
6.2. Feature extraction
6.2.1. Physical appearance features
We have developed a set of non-intrusive computervision techniques for monitoring eyelid movement, eyegaze, head movement and facial expression in real-time(Gu et al., 2002; Ji, 2002; Zhu et al., 2002; Ji et al., 2004;Zhu and Ji, 2004, 2005). A number of visual features thatcan characterize a person’s affective states are extracted.Our visual measurements consist of 10 features extractedfrom the real-time video: Blinking Frequency (BF),Average Eye Closure Speed (AECS), Percentage ofSaccadic Eye Movement (PerSac), Gaze Spatial Distribu-tion (GazeDis), Percentage of Large Pupil Dilation(PerLPD), Pupil Ratio Variation (PRV), Head Movement(HeadMove), Tilting Frequency (TiltFreq), Yawning Fre-quency (YawnFreq), and Mouth Openness (MouthOpen).The entire extraction procedure is divided into fourrelatively separate components—eye detection and track-ing (extracting BF and AECS), gaze estimation (extractingPerSac, GazeDis, PerLPD and PRV), facial featuretracking (extracting Mouth Openness, Yawning Fre-quency) and face-pose estimation (extracting Head Move-ment and Tilting Frequency).
Visual feature extraction starts with eye detection andtracking, which serves as the basis for subsequent eyelidmovement monitoring, gaze determination, face orienta-tion estimation and facial expression analysis. A robust eyedetection and tracking approach is developed via thecombination of the appearance-based mean-shift tracking
technique and bright-pupil effect under infrared lightillumination (Zhu et al., 2002). Thanks to this combina-tion, the eyes can be tracked under various face orienta-tions and variable lighting conditions. Even though theeyes are completely closed or partially occluded due to theoblique face orientations, our eye tracker can still trackthem accurately. After tracking the eyes successfully, theeyelid movement can be subsequently monitored and therelevant eyelid movement parameters can be computedaccurately.In order to estimate the eye gaze under natural head
movement and minimize the personal calibration, acomputational dynamic head compensation model isdeveloped (Zhang and Ji, 2005). The model can auto-matically update the gaze mapping function to accommo-date the 3D head position changes when the head moves.Consequently, the gaze tracking technique allows free headmovements in front of the camera but still achieves highgaze accuracy; meanwhile, the technique reduces thenumber of gaze calibration procedure to one time for eachuser. After estimating the eye gaze successfully, the gazemovement can be monitored and the relevant gazeparameters can be computed accurately.To analyse the facial expressions, 28 facial features
around eyes and mouth are selected for tracking (Zhangand Ji, 2005a). Each facial feature is represented by a set ofmulti scale and multi orientation Gabor wavelet. At eachframe, based on the possible region for each facial featureas constrained by the detected pupils, the initial positionsof each facial feature can be located via Gabor waveletmatching. In order to achieve a robust and accuratedetection, the initial feature positions are then refined by aflexible global shape model based on active shape model(ASM) that constrains the spatial relationships between thedetected facial features. To account for face poses, theglobal face shape model, which is learned under frontal

ARTICLE IN PRESS
Fig. 17. A sample screen showing the measured physiological signals.
W. Liao et al. / Int. J. Human-Computer Studies 64 (2006) 847–873864
faces, is dynamically deformed via the previously estimatedface-pose parameters to accommodate the face geometrychanges. Thus, the correct global spatial constraints canalways be imposed over the facial features so that they canbe still tracked robustly under varying face orientations.Moreover, we also introduce a multi state face shape modelin order to handle different facial expressions. Finally, aconfidence verification procedure is carried out as apost-processing to handle cases of mis-tracking or self-occlusion. As a result, our technique is robust andinsensitive to the variations in lighting, head motion, andfacial expression.
Given the tracked facial features, the 3D non-rigid facialmotion caused by the facial expression is estimated using aproposed motion extraction method. It will automaticallyeliminate the 3D head motion from the tracked facialfeatures, therefore, the 3D non-rigid facial motion causedby the facial expression can be extracted under arbitraryface orientations. Then based on the extracted 3D non-rigid facial motion, a probabilistic framework is utilized torecognize the facial expressions by integrating the DBNswith the facial action units (AUs) from psychological view.Because of the successful modeling of the spatial andtemporal behaviors of the facial expression via theproposed framework, the facial expressions can berecognized robustly and accurately under various faceorientations. Six standard facial expressions can berecognized in the system (Zhang and Ji, 2005a).
In the face-pose estimation, we developed a techniquethat automatically estimates the 3D face pose based on thediscovered facial features (Zhu and Ji, 2004). First, in orderto minimize the effect of the facial expressions, ourapproach only chooses a set of rigid facial features thatwill not move, or move slightly, under various facialexpressions for the face-pose estimation. Second, theserigid facial features are used to build a face shape model,whose 3D information is first initialized from a 3D genericface model. With the use of a frontal face image, the
generic 3D face shape model is individualized automati-cally for each person. Third, based on the personalized 3Dface shape model and its corresponding tracked facialfeatures, our approach exploits a robust random sampleconsensus (RANSAC)-based method to estimate the face-pose parameters. Since this method automatically removesthe inaccurate facial features, face-pose parameters can bealways estimated from a set of facial features that areaccurately detected in the face image.
6.2.2. Physiological, behavioral and performance evidence
To collect physiological features, an emotional mousewas built from a regular tracking-ball mouse by equippingit with physiological sensors. The emotional mousemeasures heart rate, skin temperature, GSR and fingerpressure. The mouse is designed to be non-intrusive. Onesample measuring screen is shown in Fig. 17.For behavioral evidence, we monitor a user’s interac-
tions with the computer, e.g. the mouse pressure from thefinger (MousePre) each time when the user clicks theemotional mouse. Performance data is extracted from a logfile that keeps track of user’s response to the tasks, e.g. forthe tasks in stress recognition, math/audio error rate(MathError, AudioError) and math/audio response time(MathRes, AudioRes) are extracted; for the tasks in fatiguerecognition, response time, omission errors, and commis-sion errors are extracted.
6.3. Stress recognition
6.3.1. Experiment design
Although the system is flexible enough to recognizemultiple affective states, currently, we use the system torecognize only stress and fatigue. One fundamentaldifficulty in validating a stress monitoring system is theabsence of ground-truth stress data. Some experimentshave shown that even user self-reports are erroneousand unreliable. Fortunately, the existing results from

ARTICLE IN PRESSW. Liao et al. / Int. J. Human-Computer Studies 64 (2006) 847–873 865
psychological studies show that occupational stress isaffected by two job characteristics: demand and control(Karasek, 1979; Searle et al., 1999). Demand refers to theamount of attention and effort required for a user to carryout a job. We will interchangeably use demand andworkload. Control primarily refers to the decision-makingfreedom presented in a job. It is predicted and confirmedthat a user becomes more stressed when workload is highor when control is low (Searle et al., 1999).
In our study, we work on designing the experiments thatare able to manipulate a subject’s stress level by deliber-ately varying the task workload while fixing the controlduring the task trials. While task workload causes stress,they are not the same. To model their relationships and toinfer stress from workload, we construct a BN as shown inFig. 18. The directed links in the BN represent the casualrelationships between the connected nodes. Specifically, forthe stress study, the subject performs math and audio tasks.
time t-1 t
p
stress
eyelidmove
blinkingferequency
context
physical
pupillaryresponsegaze
headmove
AECS
GazeDis
PerSAC PerLP
pupil
pupil ratiovariation
behavioral
pressure
assistance
Fig. 19. Dynamic ID model for recognizing human stress. Due to space limit
evidence (leaf) nodes.
math task audio task
workload
stress
Fig. 18. A Bayesian network model for inferring the ground-truth stress
from the task workload.
Varying the pace of the two tasks causes a change inworkload, which, in turn, causes a change in subject’sstress. After parameterizing the model with training data,the subject stress can then be inferred from the task levels.Since each person relates stress and workload differently,the model can be individualized to each subject.During the experiments, the user is required to perform
two different tasks: a math task that requires the additionor subtraction of two two-digit integers, and an audio taskin which single letters of the alphabet are presented. Forthe math task, the user has to decide whether the answerpresented on the screen is correct or not; for the audio task,the user has to either indicate whether the current letterprecedes or follows the prior letter in the alphabet, or,determines whether the current letter ðtÞ is equal to ordifferent from the letter that was two back ðt� 2Þ. Twotypes of task trials are arranged: single-task trial, whereuser performs only math or audio task; and dual-task trial,where user performs both math and audio tasks simulta-neously. Each experiment session consists of approximatelyeight 10-min blocks. For the single-task trial, each blockconsists of eight intervals of 72 s (seconds) and the tasks arepresented at the speed of 1, 2, 4, or 6 s. While for the dual-task trial, each block consists of 16 intervals of 36 s and thetasks are presented at the speed of 2, 4, or 6 s in each block.
6.3.2. Stress modeling
The structure of the dynamic ID for user stress ispresented in Fig. 19. We set the cost of performing userassistance to be extremely high. Under this setting, themodel degenerates to a stress monitor.
ime t
rofile
stress
goal
performance
maths audio
errorrate
responsetime
errorrate
responsetime
physiological
heart rate
skintemperature
GSR
D
mouthopenness
facialexpression
eyebrowmove
assistance
, we skip the sensory nodes and utility nodes that are associated with the

ARTICLE IN PRESSW. Liao et al. / Int. J. Human-Computer Studies 64 (2006) 847–873866
6.3.3. Results
Multiple subjects of different ages, genders and raceshave been tested in the system. Each subject attends oneexperiment session (eight blocks, around 80min). For eachsubject, the data from five blocks are used for learning withthe EM learning algorithm (Lauritzen, 1995), while thedata from other three blocks are used for testing. In thefollowing, we only report the results from six subjects,where three of them (A, B, C) perform the single-task trial,and the other three (D, E, F) perform the dual-task trial.
6.3.3.1. Stress vs. individual features. To demonstrate therelationship between each individual feature and stress, wecarried out three types of statistical analysis—cumulativeanalysis, correlation analysis, and ANOVA test, wherecumulative and correlation analysis are performed on thedual-task trial, and the ANOVA test is performed onthe single-task trial. These analysis will help parameterizethe DBN model.
In the cumulative analysis, we try to analyse thesensitivity and robustness of each feature to stress inaverage. The stress is divided into three levels and thefeature values are grouped by each stress level. Then, themean and standard deviation of individual feature in eachgroup are computed. If a feature is sensitive to stress, themean values vary with different stress levels; and if afeature is robust to stress changes, the standard deviationsare small. Fig. 20 illustrates the results of 11 features forthree subjects in the dual-task trial. It demonstrates thatmost features are sensitive and robust to the stress. Asstress increases, a participant blinks less frequently, closesthe eyes faster, dilates the pupils more often, focuses theeye gaze more on the screen, moves the head and opens themouth less frequently, and clicks the mouse button harder.In the meantime, the heart rate increases, and GSRdecreases. However, for different subjects, the same featuremay have different levels of sensitivity to stress. Forexample, blinking frequency is a very good feature forsubject D and F, while its mean values for subject E varylittle as stress level changes. Thus, it is necessary to trainthe DID model for each subject.
In the correlation analysis, we study how feature valueschange as the stress changes over time. Fig. 21 illustratesthe correlation curve between stress and three features inthe dual-task trial for subject E. For charts (a) and (b), asstress level increases, the subject’s pupil dilation is largerand his gaze focuses more on the central region of thecomputer screen where the math tasks are displayed. Bycontrast, chart (c) represents a negatively correlatedrelationship between AECS and stress: as stress levelincreases, the subject’s average eye closure speed becomesslower. These observations are consistent with those in thecumulative analysis.
However, in real-time, individual features are not alwaysreliable. Let us take the coefficients between stress andPerLPD as an example (Fig. 21(a)). Although it isapproximately positively correlated to stress, negative
coefficients occur in a time period; in addition, at sometime steps, the coefficients fall below .3, thereby indicatingthat the correlation between stress and PerLPD is some-how weak. However, by combining the individual featureswith the DBN model, the inferred stress level has a veryhigh correlation with the ground-truth stress, as will beshown later.ANOVA is another statistical analysis to quantitatively
determine the sensitivity of each feature to user stress.Table 1 displays the ANOVA test results for subjects A, Band C in the single-task trial. The data in each cell indicatesthe p-value. If the p-value is less than 0.05, it is believed thetest result is statistically significant, which means thefeature is sensitive to stress. The table shows most featuresare sensitive to stress. Similar to cumulative analysis,it shows that, for different subjects, the same featuremay have different degrees of sensitivity to stress.For example, AECS is sensitive to stress for subjectsA and B, while it is insensitive for subject C. Also, somefeatures, e.g. AudioError, are almost not sensitive for allthe subjects.
6.3.3.2. Stress inference with single-modality features vs.
multiple-modality features. Our system has extractedfour-modality features for stress recognition. One questionis whether all these features are necessary or not. Theexperimental results demonstrate that single-modalityfeatures are not sufficiently precise for stress recognition,while multiple-modality features integrated by the DIDmodel are very helpful for accurate stress inference.Fig. 22 shows the results for the single-task trial. The x-
coordinate indicates the ground-truth stress level from 1 to4, and the y-coordinate indicates the means (the medianpoints of the bars) and standard deviations (the heights ofthe bars) of the inferred stress levels. Ideally, the meanvalues should be very close to 1, 2, 3, and 4; the standarddeviation should be quite small. However, as shown in Fig.22(a)–(c), the results are not good enough when only usingsingle-modality features. The mean values are not veryclose to 1, 2, 3, 4, and the standard deviation is not small.The inference result from the performance-modalityfeature is the worst. One possible explanation is that usermay make more efforts to maintain his performance whenstress level increases. Thus, the performance does notcorrelate well with stress. The inference result from thephysiological features is better. However, sometimes thephysiological signals may not be accurate enough sincethe user may move his hand irregularly while using theemotional mouse. Compared to other single-modalityfeatures, the visual features bring better inference result,which is contributed by our robust computer visiontechniques in the system.In summary, single modality alone cannot infer the stress
reliably because it cannot provide enough features to inferthe stress. Therefore, we tried to combine all these fourmodalities together to infer the stress. Fig. 22(d) displaysthe inferred stress results with multiple-modality features

ARTICLE IN PRESS
Low Normal High
-1.5
-1
-0.5
0
0.5
1
1.5
PupDiff vs Stress
Low Normal High
-1.5
-1
-0.5
0
0.5
1
1.5
PerLPD vs Stress
Low Normal High
-1.5
-1
-0.5
0
0.5
1
1.5
Blinking Frequency vs Stress
(a) (b) (c)
Low Normal High
-1.5
-1
-0.5
0
0.5
1
1.5
AECS vs Stress
Low Normal High
-1.5
-1
-0.5
0
0.5
1
1.5
PerSac vs Stress
Low Normal High
-1.5
-1
-0.5
0
0.5
1
1.5
GazeDis vs Stress
(d) (e) (f)
Low Normal High
-1.5
-1
-0.5
0
0.5
1
1.5
HeadMove vs Stress
Low Normal High
-1.5
-1
-0.5
0
0.5
1
1.5
MouthOpen vs Stress
Low Normal High
-1.5
-1
-0.5
0
0.5
1
1.5
Heart Rate vs Stress
(g) (h) (i)
Low Normal High
-1.5
-1
-0.5
0
0.5
1
1.5
GSR vs Stress
Low Normal High
-1.5
-1
-0.5
0
0.5
1
1.5
Finger Pressure vs Stress
(j) (k)
Fig. 20. The relationship between individual features and stress in the dual-task trial: (a) PupDiff; (b) PerLPD; (c) BF; (d) AECS; (e) PerSac; (f) GazeDis;
(g) HeadMove; (h) MouthOpen; (i) heart rate; (j) GSR; (k) finger pressure. Vertical bar denotes standard deviation, and the median point denotes mean
value. Each chart plots individual data for three subjects (subject D—solid line, subject E—dashed line, and subject F—dotted line) for the dual-task trial.
All the feature values are normalized to zero mean and unit standard deviation. GSR feature for subject E was not available.
W. Liao et al. / Int. J. Human-Computer Studies 64 (2006) 847–873 867

ARTICLE IN PRESS
0 100 200 300 400 500 600 700 800 900 1000-1
-0.8
-0.6
-0.4
-0.2
0
0.2
0.4
0.6
0.8
1
Time steps
Correlation Coefficient
0 100 200 300 400 500 600 700 800 900 1000-1
-0.8
-0.6
-0.4
-0.2
0
0.2
0.4
0.6
0.8
1
Time steps
Correlation Coefficient
0 100 200 300 400 500 600 700 800 900 1000-1
-0.8
-0.6
-0.4
-0.2
0
0.2
0.4
0.6
0.8
1
Time steps
Correlation Coefficient
(a) (b) (c)
Fig. 21. The correlation curve (running average correlation coefficients) between individual visual features and stress for subject E in the dual-task trial:
(a) PerLPD vs. stress; (b) GazeDis vs. stress; (c) AECS vs. stress. In the x-coordinate, the time unit is second.
Table 1
Summary of sensitivity results with ANOVA test in the single-task trial
Features Subject A Subject B Subject C
HeartRate .0001 .0026 .0040
GSR .0019 .2289a .0324
FingerPressure .0000 .0013 .0009
AECS .0062 .0001 .0557a
BF .0000 .0000 .0070
GazeDis .0000 .0036 .0723a
PerSac .0000 .0002 .0318
PerLPD .0000 .0204 .0747a
PupDiff .0002 .0001 .0510a
MouthOpen .0036 .0163 .1440a
HeadMove .0000 .0094 .1841a
MathError .0004 .0009 .0377
MathRes .0000 .0000 .0141
AudioError .0846a .0918a .3285a
AudioRes .1684a .1979a .0000
The data denote the p-values.aThe values denote that the feature is not sensitive to stress changes for
the corresponding subject.
W. Liao et al. / Int. J. Human-Computer Studies 64 (2006) 847–873868
using the DID model. The mean values of the stress indexesare close to the desired values. Quantitatively speaking, theaverage mean values for the three subjects are 1.18, 2, 2.98,and 3.93, which are much more closer to the desired valuescompared to charts (a)–(c) in Fig. 22. The standarddeviations are also smaller (.08, .08, .1, .06), which meansthe inferred results from multi modality evidence are moreconsistent, accurate, and robust than those from single-modality evidence.
6.3.3.3. Stress recognition. Since single-modality featuresare not capable of recognizing user affect very well, oursystem integrates the multi modality features and performsefficient stress inference with the active sensing strategyproposed in Section 4.2. The experiments prove that oursystem can successfully monitor human stress in anefficient and timely manner. We show the inference resultsfor the dual-task trial as an example.
The results for subject D are shown in the top two chartsin Fig. 23. For each chart, the solid curve denotes theground-truth stress and the dashed curve denotes theinferred stress levels. The top-left chart shows inferredstress based on six types of evidence. The top-right showsinferred stress based on 10 types of evidence. In both cases,the evidence selected is dynamically determined by theactive sensing strategy. We see that inferred stress curvesroughly trace the stress curves. In addition, we see that atmost time steps the stress inferred from 10 pieces ofevidence is more correlated to the actual stress than thatinferred from six pieces of evidence.
6.3.3.4. Active sensing. The remaining charts in Fig. 23demonstrate that the active sensing approach outperformsa passive (random selection) approach. The middle twocharts show the inference performances for the randomselection strategy, where the left selects six features and theright selects 10 features. To quantitatively show how muchthe active sensing approach outperforms, we conductedstatistic correlation analysis. In both charts, the solid(dashed) curve denotes the correlation coefficients alongtime steps between ground-truth and inferred stress withthe active (passive) sensing approach. In general, the solidcurve lies above the dashed curve. This implies that theinferred stress is more correlated to ground-truth in theactive sensing case. Consequently, the active sensingapproach is effective in improving the inference perfor-mance in efficiently estimating stress.
6.4. Fatigue recognition
In addition to stress recognition, the system has alsobeen tested in fatigue recognition on human subjects. Thestudy includes a total of eight subjects. Two test bouts areperformed for each subject. The first test is done when theyfirst arrive in the lab at 9 p.m. and are fully alert. Thesecond test is performed early around 7 p.m. in thefollowing day, after the subjects have been deprived ofsleep for a total of 25 h. During the study, the subjects are

ARTICLE IN PRESS
Level 1 Level 2 Level 3 Level 4
0.5
1
1.5
2
2.5
3
3.5
4
4.5
Infe
rred
Str
ess
Leve
l
← subject A
← subject C
Level 1 Level 2 Level 3 Level 4
0.5
1
1.5
2
2.5
3
3.5
4
4.5
Infe
rred
Str
ess
Leve
l
← subject A
← subject C
(a) (b)
Level 1 Level 2 Level 3 Level 4
0.5
1
1.5
2
2.5
3
3.5
4
4.5
Infe
rred
Str
ess
Leve
l
← subject A
← subject B
Level 1 Level 2 Level 3 Level 40
0.5
1
1.5
2
2.5
3
3.5
4
4.5
← subject A
← subject B
← subject C
(c) (d)
← subject B
← subject B
← subject C
Fig. 22. Inferred stress level with DID for three subjects in the single-task trial: (a) with physiological and behavioral features only; (b) with visual features
only; (c) with performance features only; (d) with multiple-modality features. The x-coordinate denotes the ground-truth stress level and the y-coordinate
denotes the mean inferred stress levels and standard deviations. Inference results with multi modality features are better than the results with single-
modality features.
0 200 400 600 800 1000 1200 1400 1600 18000
0.20.40.60.8
1
With active sensing
0 200 400 600 800 1000 1200 1400 1600 18000
0.20.40.60.8
1
Without active sensing
0 200 400 600 800 1000 1200 1400 1600 1800
-1
-0.5
0
0.5
1
Time (seconds)
0 200 400 600 800 1000 1200 1400 1600 18000
0.20.40.60.8
1
With active sensing
0 200 400 600 800 1000 1200 1400 1600 18000
0.20.40.60.8
1
Without active sensing
0 200 400 600 800 1000 1200 1400 1600 1800
-1
-0.5
0
0.5
1
Time (seconds)(a) (b)
Fig. 23. Actual stress vs. inferred stress level with and without active sensing: (a) select six pieces of evidence in each time step; (b) select 10 pieces of
evidence in each time step.
W. Liao et al. / Int. J. Human-Computer Studies 64 (2006) 847–873 869
asked to perform a test of variables of attention (TOVA)test. The TOVA test consists of a 20-min psychomotot test,which requires the subject to sustain attention and respond
to a randomly appearing light on a computer screen bypressing a button. The TOVA test keeps record of severalmeasures related to the subject’s behavior: the person’s

ARTICLE IN PRESS
time t-1 time t
profile
fatigue fatigue
goal
performance
commissionerrors
omissionerrors
tiltfreq.
eyelidmove
blinkingferequency
context
physical physiological
heart rate
skintemperature
GSR
pupillaryresponsegaze
headmove
AECS
GazeDis
PerSAC PerLPD
YawnFreq
facialexpression
facialmuscle
pupil
pupil ratiovariation
behavioral
pressure
assistanceassistance
Fig. 24. Dynamic ID model for recognizing human fatigue. Due to space limit, we skip the sensory nodes and utility nodes that are associated with the
evidence (leaf) nodes.
0 5 10 15 200
0.1
0.2
0.3
0.4
0.5
0.6
0.7
0.8
0.9
1
Time Index
Fatigue LevelGround Truth
0 5 10 15 200
0.1
0.2
0.3
0.4
0.5
0.6
0.7
0.8
0.9
1
Time Index0 5 10 15 20
0
0.1
0.2
0.3
0.4
0.5
0.6
0.7
0.8
0.9
1
Time Index(a) (b) (c)
Fatigue Level
Ground Truth
Fatigue LevelGround Truth
Fig. 25. Inferred fatigue vs. actual fatigue for: (a) subject 1; (b) subject 2; (c) subject 3.
W. Liao et al. / Int. J. Human-Computer Studies 64 (2006) 847–873870
response time when clicking the button, whether the personcorrectly responds to the symbols, and if not, what kind ofmistakes the person makes. The response time is selected asa metric to quantify a person’s performance so as to reflectthe ground-truth fatigue (Dinges et al., 1998).
6.4.1. Fatigue modeling
The structure of the dynamic ID for user fatigue ispresented in Fig. 24. We set the cost of performing userassistance to be extremely high. Under this setting, themodel degenerates to a fatigue monitor.
6.4.2. Results
We have collected data from eight subjects of differentages, genders and races. For each subject, part of the datais used for learning with the EM algorithm (Lauritzen,
1995), while part of the data is used to validate the model.Fig. 25 plots the estimated fatigue level vs. the actualfatigue over time for three subjects. In each chart, it is clearthat the two curves’ fluctuation match well, qualitativelyproving their correlation and co-variation. The correlationcoefficients of the two curves for the three subjects are 0.89,0.91 and 0.88, respectively, therefore quantitatively provingthe good performance of the fatigue monitoring system.
7. Conclusions and future work
This paper presents a dynamic decision framework basedon IDA for simultaneously modeling affective staterecognition and user assistance. The technical issuesinvolve user affect recognition, active sensing and userassistance determination. The proposed framework can be

ARTICLE IN PRESSW. Liao et al. / Int. J. Human-Computer Studies 64 (2006) 847–873 871
used to unify the three tasks: (1) user affect recognition byprobabilistic inference from the dynamically generatedevidence of different modalities, (2) active sensor selectionby selectively combining the most effective sensor measure-ments for efficient and timely user state recognition, and (3)automated user assistance by balancing the benefits ofimproving user productivity in affective states and the costsof performing possible user assistance. To validate theproposed framework, we design a simulation system toemulate user behavior in order to validate the modelcorrectness and effectiveness. The simulation results showthat the framework successfully realizes the two centralfunctions in intelligent user assistance systems. Further-more, a non-invasive real-world human affect monitoringsystem is built to demonstrate the user affect recognitioncapability on real human subjects. Such a systemnon-intrusively collects the four-modality evidence includ-ing physical appearance, physiological, behavioral, andperformance measures. To our knowledge, this integrationfrom four-modality evidence, together with the probabil-istic approach, is unique in user affect research.
Several directions deserve further investigations in thefuture. First, although the proposed decision-theoreticwork has been validated in a simulation system, thecurrent real-time system does not fully integrate theassistance function yet. We would like to work on it inthe future. Second, it would be interesting to integratemore contextual information and observable evidence inaffect recognition. The contextual information such asuser’s age, physical fitness, and user’s skill level can furtherimprove the recognition accuracy and robustness. Inaddition, the evidence from other modalities mayalso embody user affect. For example, user acousticfeatures have proven useful as reported in linguisticresearch work (Ball and Breeze, 2000). The contextualinformation and additional evidence can be integrated intothe proposed framework and further improve the accuracyof user affect recognition. Third, our study reveals that asimple model cannot be generalized well to each individualsince different persons may have different symptomseven under the same affect. Instead, under the sameframework, an individual model should be constructedfor each person. One possible future research is to improvethe model learning algorithms so that the frameworkcan be better individualized. Finally, it would be interestingand also necessary to integrate a computationalaffect model with a cognitive user model in order toidentify the causes for certain user states and to provideappropriate assistance. Our current work mainly focuseson recognizing human affect from the external symptomsand providing user assistance accordingly. Like other userassistance systems, the user assistance is only superficialsince the current system does not really understand thecauses of the user affect. For example, the affective statecould be stressed; the cognitive steps that lead to user’sstress may be numerous. The probabilistic user modelcannot figure out why the user is stressed. Understanding
the cause for user’s affect is crucial to offering correctaugmentation and appropriate assistance. In this regard,we are investigating the integration of a cognitive modelbased on ACT-R (Anderson and Lebiere, 1998) into theloop so that it is feasible to analyse the sub symbolicparameters in cognitive side and explain the identified useraffect. The ongoing research in this lab is pursuing in thisdirection.
Acknowledgments
The research described in the paper is supported in partby a grant from the Defense Advanced Research ProjectsAgency (DARPA) under the Grant number N00014-03-01-1003 and in part by a grant from the Air Force Office ofScientific Research under Grant number F49620-03-1-0160.
References
Anderson, J.R., Lebiere, C., 1998. The Atomic Components of Thought.
Lawrence Erlbaum Associates, Mahwah, NJ.
Ark, W.S., Dryer, D.C., Lu, D.J., 1999. The emotion mouse. The Eighth
International Conference on Human–Computer Interaction: Ergo-
nomics and User Interfaces, vol. I, pp. 818–823.
Ball, G., Breeze, J., 2000. Emotion and personality in a conversational
agent. In: Cassel, J., Sullivan, J., Prevost, S., Churchill, E. (Eds.),
Embodies Conversational Agents. MIT Press, Cambridge, MA,
pp. 189–219.
Bauer, M., Gymtrasiewicz, P.J., Vassileva, J., 2001. User Modeling.
Springer, New York.
Beatty, J., 1982. Task-evoked pupillary responses, processing load, and
the structure of processing resources. Psychological Bulletin 91,
276–292.
Berthold, A., Jameson, A., 1999. Interpreting symptoms of cognitive load
in speech input. In: Proceedings of the Seventh International
Conference on User Modeling, pp. 235–244.
Boverie, S., Leqellec, J.M., Hirl, A., 1998. Intelligent systems for video
monitoring of vehicle cockpit. In: International Congress and
Exposition ITS. Advanced Controls and Vehicle Navigation Systems,
pp. 1–5.
Breazeal, C., 1999. Robot in society: friend or appliance? Workshop on
Emotion-based Agent Architectures, pp. 18–26.
Buntine, W., 1994. Operations for learning with graphical models. Journal
of AI Research 159–225.
Carskadon, M.A., Dement, W.C., 1982. The multiple sleep latency test:
what does it measure? Sleep 5, 67–72.
Cohen, I., Grag, A., Huang, T.S., 2000. Emotion recognition using
multilevel-HMM. NIPS Workshop in Affective Computing.
Conati, C., 2002. Probabilistic assessment of user’s emotions in educa-
tional games. Journal of Applied Artificial Intelligence, Special Issue
on Merging Cognition and Affect in HCI 16, 555–575.
Cowie, R., Douglas-Cowie, E., Tsapatsoulis, N., Votsis, G., Kollias, S.,
Fellenz, W., Taylor, J.G., 2001. Emotion recognition in human–com-
puter interaction. IEEE Signal Processing Magazine 18, 32–80.
Diez, F.J., 1993. Parameter adjustment in Bayes networks: the generalized
noisy or-gate. In: Proceedings of the Ninth Annual Conference on
Uncertainty in Artificial Intelligence (UAI93), pp. 99–105.
Dinges, D.F., Mallis, M.M., Maislin, G.M., Powell, J.W., 1998.
Evaluation of techniques for ocular measurement as an index of
fatigue and the basis for alertness management. NHTSA Report No.
DOT HS 808 762, April.

ARTICLE IN PRESSW. Liao et al. / Int. J. Human-Computer Studies 64 (2006) 847–873872
Ekman, P., Friesen, W., 1978. Facial Action Coding System: A Technique
for the Measurement of Facial Movement. Consulting Psychologists
Press.
Elliott, C., Rickel, J., Lester, J.C., 1999. Lifelike pedagogical agents and
affective computing: an exploratory synthesis. Artificial Intelligence
Today 195–211.
Empson, J., 1986. Human Brainwaves: The Psychological Significance of
the Electroencephalogram. The Macmillan Press Ltd, New York.
Gardell, B., 1982. Worker participation and autonomy: a multilevel
approach to democracy at the workplace. International Journal of
Health Services 4, 527–558.
Grace, R., 2001. Drowsy driver monitor and warning system. Interna-
tional Driving Symposium on Human Factors in Driver Assessment,
Training and Vehicle Design, August.
Gu, H., Ji, Q., Zhu, Z., 2002. Active facial tracking for fatigue detection.
IEEE Workshop on Applications of Computer Vision.
Hartley, L., Horberry, T., Mabbott, N., Krueger, G.P., 2000. Review of
Fatigue Detection and Prediction Technologies. National Road
Transport Commission, ISBN 0 642 54469 7.
Hass, M.W., Hettinger, L., 2001. Adaptive User Interface. Lawrence
Erlbaum Associates, Mahwah, NJ.
Healy, J., Picard, R., 2000. Smartcar: detecting driver stress. The 15th
International Conference on Pattern Recognition, pp. 4218–4221.
Heishman, R., Duric, Z., Wechsler, H., 2004. Using eye region biometrics
to reveal affective and cognitive states. CVPR Workshop on Face
Processing in Video.
Heitmann, A., Guttkuhn, R., Trutschel, U., Moore-Ede, M., 2001.
Technologies for the monitoring and prevention of driver fatigue. In:
Proceedings of the First International Driving Symposium on Human
Factors in Driving, Assessment, Training and Vehicle Design, pp.
81–86.
Horvitz, E., 1999. Uncertainty, action, and interaction: in pursuit of
mixed-initiative computing. IEEE Intelligent Systems September Issue,
17–20.
Horvitz, E., Kadie, C.M., Paek, T., Hovel, D., 2003. Models of attention
in computing and communications: from principles to applications.
Communications of the ACM 46, 52–59.
Howard, R., 1967. Value of information lotteries. IEEE Transactions of
Systems Science and Cybernetics 3 (1), 54–60.
Howard, R., Matheson, J., 1981. Influence diagrams. Readings on the
Principles and Applications of Decision Analysis 2, 721–762.
Hudlicka, E., McNeese, M.D., 2002. Assessment of user affective and
belief states for interface adaptation: application to an air force pilot
task. User Modeling and User Adapted Interaction 12, 1–47.
Ji, Q., 2002. 3D face pose estimation and tracking from a monocular
camera. Image and Vision Computing 20, 499–511.
Ji, Q., Zhu, Z., Lan, P., 2004. Real time non-intrusive monitoring and
prediction of driver fatigue. IEEE Transactions on Vehicle Technology
53 (4), 1052–1068.
Jones, F., Bright, J., 2001. Stress: Myth, Theory and Research. Prentice-
Hall, Englewood Cliffs, NJ.
Jordan, M.I. (Ed.), 1999. Learning in Graphical Models. MIT Press,
Cambridge, MA.
Kaapor, A., Mota, S., Picard, R., 2001. Toward a learning companion
that recognizes affect. AAAI Fall Symposium: Emotional and
Intelligent, North Falmouth, MA, November 2–4.
Kaliouby, R.E., Robinson, P., 2004. Real-time inference of complex
mental states from facial expressions and head gestures. IEEE
Workshop on Real-time Vision for Human–Computer Interaction in
Conjunction with IEEE CVPR, Washington, DC, July.
Kapoor, A., Picard, R., Ivanov, Y., 2004. Probabilistic combination of
multiple modalities to detect interest. IEEE International Conference
on Pattern Recognition 3, 969–972.
Karasek, R.A., 1979. Job demands, job decision latitude and mental
strain: implications for job design. Administrative Science Quarterly
24, 285–308.
Kataoka, H., Yoshida, H., Saijo, A., Yasuda, M., Osumi, M., 1998.
Development of a skin temperature measuring system for non-contact
stress evaluation. In: Proceedings of the 20th Annual International
Conference of the IEEE Engineering in Medicine and Biology Society,
vol. 2, pp. 940–943.
Kevin, B., Ann, E., 2003. Bayesian Artificial Intelligence. Chapman &
Hall/CRC, London, Boca Raton, FL.
Lauritzen, S.T., 1995. The EM algorithm for graphical association models
with missing data. Computational Statistics and Data Analysis 19,
191–201.
Lemmer, J.F., Gossink, D., 2004. Recursive noisy-or: a rule for estimating
complex probabilistic causal interactions. IEEE Transactions on
Systems, Man, and Cybernetics 34 (6), 2252–2261.
Li, X., Ji, Q., 2004. Active affective state detection and user assistance with
dynamic Bayesian networks. IEEE Transactions on Systems, Man,
and Cybernetics, Part A: Systems and Humans 35 (1), 93–105.
Machleit, K., Enoglu, S., 2000. Describing and measuring emotional
response to shopping experience. Journal of Business Research 49,
101–111.
Maes, P., Schneiderman, B., 1997. Direct manipulation vs. interface
agents: a debate. Interactions IV (6).
Massaro, D.W., 2000. Multimodal emotion perception: analogous to
speech processes. ISCA Workshop on Speech and Emotion.
Mindtools, 2004. hhttp://www.mindtools.com/stress/understandstress/
stressperformance.htmi.
Moriyama, T., Saito, H., Ozawa, S., 1997. Evaluation of the relation
between emotional concepts and emotional parameters on speech.
IEEE International Conference on Acoustic, Speech, and Signal
Processing 2, 1431–1434.
Murray, R.C., VanLehn, K., Mostow, J., 2004. Looking ahead to select
tutorial actions: a decision-theoretic approach. International Journal
of Artificial Intelligence in Education 14, 235–278.
Ortony, A., Clore, G.L., Collins, A., 1988. The Cognitive Structure of
Emotions. Cambridge University Press, Cambridge, England.
Pantic, M., Patras, I., Rothkrantz, L. M., 2002. Facial mimics recognition
from face profile image sequences. Data and Knowledge Systems
Group, Delft University of Technology, Netherlands.
Partala, T., Surakka, V., 2003. Pupil size variation as an indication of
affective processing. International Journal of Human–Computer
Studies 59, 185–198.
Pearl, J., 1988. Probabilistic Reasoning in Intelligent Systems: Networks
of Plausible Inferences. Morgan Kaufmann Publishers, Los Altos, CA.
Petrushin, V.A., 1999. Emotion in speech: recognition and application to
call centers. Conference on Artificial Neural Networks in Engineering
(ANNIE’99), St. Louis, November 7–10.
Petrushin, V.A., 2000. Emotion recognition in speech signal: experimental
study, development, and application. The Sixth International Con-
ference on Spoken Language Processing.
Picard, R., 1997. Affective Computing. Cambridge University Press,
Cambridge, England.
Picard, R., Vyzas, E., Healey, J., 2001. Toward machine emotional
intelligence: analysis of affective physiological state. IEEE Transac-
tions on Patter Analysis and Machine Intelligence 23 (10), 1175–1191.
Qi, Y., Picard, R.W., 2002. Context-sensitive Bayesian classifiers and
application to mouse pressure pattern classification. The Proceedings
of International Conference on Pattern Recognition, Que., City,
Canada, August.
Qi, Y., Reynolds, C., Picard, R.W., 2001. The Bayes point machine for
computer–user frustration detection via pressure mouse. The Proceed-
ings of the 2001 Workshop on Perceptive User Interfaces, vol. 15, pp.
1–5.
Rani, P., Sarkar, N., Smith, C.A., 2003. Anxiety detection for implicit
human–robot collaboration. IEEE International Conference on
Systems, Man and Cybernetics 4896–4903.
Rimini-Doering, M., Manstetten, D., Altmueller, T., Ladstaetter, U.,
Mahler, M., 2001. Monitoring driver drowsiness and stress in a driving
simulator. First International Driving Symposium on Human Factors
in Driver Assessment, Training and Vehicle Design, pp. 58–63.
Rosekind, M.R., Co, E.L., Gregory, K.B., Miller, D.L., 2000. Crew
factors in flight operations XIII: a survey of fatigue factors in
ARTICLE IN PRESSW. Liao et al. / Int. J. Human-Computer Studies 64 (2006) 847–873 873
corporate/executive aviation operations. National Aeronautics and
Space Administration NASA/TM-2000-209610.
Saito, H., Ishiwaka, T., Sakata, M., Okabayashi, S., 1994. Applications of
driver’s line of sight to automobiles—what can driver’s eye tell.
Proceedings of 1994 Vehicle Navigation and Information Systems
Conference, Yokohama, Japan, pp. 21–26.
Scherer, K.R., 1993. Studying the emotion-antecedent appraisal process:
an expert system approach. Cognition and Emotion 7, 325–355.
Searle, B.J., Bright, J.E., Bochner, S., 1999. Testing the three-factor model
of occupational stress: the impacts of demands, control and social
support on a mail sorting task. Work and Stress 13, 268–279.
Shachter, R., 1986. Evaluating influence diagrams. Operations Research
34 (6), 871–882.
Sherry, P., 2000. Fatigue countermeasures in the railroad industry—past
and current developments. Counseling Psychology Program, Inter-
modal Transportation Institute, University of Denver.
Ueno, H., Kaneda, M., Tsukino, M., 1994. Development of drowsiness
detection system. Proceedings of 1994 Vehicle Navigation and
Information Systems Conference, Yokohama, Japan, August 1994,
pp. 15–20.
Yeasin, M., Bullot, B., Sharma, R., 2004. From facial expression to level
of interest: a spatial-temporal approach. In: Proceedings of the IEEE
Computer Society Conference on Computer Vision and Pattern
Recognition, vol. 2, pp. 922–927.
Zhang, N.L., Poole, D., 1996. Exploiting causal independence in Bayesian
network inference. Journal of Artificial Intelligence Research 5, 301–328.
Zhang, Y., Ji, Q., 2005a. Active and dynamic information fusion for facial
expression understanding from image sequence. IEEE Transactions on
Pattern Analysis and Machine Intelligence (PAMI) 27 (5), 699–714.
Zhang, Y., Ji, Q., 2005b. Sensor selection for active information fusion.
The 20th National Conference on Artificial Intelligence (AAAI-05).
Zhu, Z., Ji, Q., 2004. 3D face pose tracking from an uncalibrated
monocular camera. IEEE International Conference on Pattern
Recognition.
Zhu, Z., Ji, Q., 2005. Eye gaze tracking under natural head movements.
IEEE International Conference on Computer Vision and Pattern
Recognition (CVPR05), San Diego, CA, June 2005.
Zhu, Z., Ji, Q., Fujimura, K., Lee, K., 2002. Combining Kalman filtering and
mean shift for real time eye tracking under active IR illumination. IEEE
International Conference on Pattern Recognition, Que., Canada.