Embed Size (px)
Citation preview

Toughness of Glass FiberReinforced Concrete Panels
Subjected toAccelerated Aging
Surendra P. ShahProfessor of Civil Engineering
and DirectorCenter for Concrete and
GeomaterialsNorthwestern UniversityEvanston, Illinois
James I. DanielSenior Structural EngineerConstruction Technology
Laboratories, Inc.Skokie, Illinois
UtDarmawan LudirdjaGraduate StudentDepartment of Civil EngineeringNorthwestern UniversityEvanston, Illinois
G lass fiber reinforced concrete(GFRC) is a cement based com-
posite product which is reinforced withglass fibers. GFRC cladding panels areincreasingly being used in the UnitedStates and other countries. These panelsare generally produced by simultane-ously spraying a portland cement mortarslurry and alkali resistant (AR) choppedglass fibers onto molds. The size ofproperly designed panels with appro-priate configuration can he as large as 8x 30 ft (2.4 x 9.1 m) with only Vz in, (1.27cm) skin thicknesses. GFRC panels are
relatively light in weight facilitatingtheir handling, transporting and erec-tion. GFRC cladding panels are pro-duced as wall units, window units,spandrels, mullions, and column covers.In 1985, more than 5.5 million sq ft(511,600 m 2) of cladding panels wereproduced in the United States at an ap-proximate total cost of $100 million.
The expanding use of GFRC panelsshould be supported with sufficient in-formation on short-term and long-termmechanical properties. The mechanicalproperties of GFRC depend on the type,
82

length, and volume of glass fibers, ma-trix composition, fabrication method,curing regime, and storage conditions. Ithas been established that after pro-longed exposure to wet climates, thestrength of a GFRC composite may bereduced to nearly that of the unrein-forced matrix. To account for this even-tual potential strength loss, the Recom-mended Practice for GFRC Panels, de-veloped by the PCI Committee onGFRC Panels,' assumes that the agedflexural strength of GFRC is equal to its28-day proportional elastic limit value(which is essentially equal to the 28-daystrength of the unreinforced matrix).
In addition to the reduction instrength, GFRC composites also exhibita dramatic reduction in ductilit y (frac-ture toughness, strain capacity) whenaged in wet conditions. Although con-siderable information on long-termstrength of GFRC products exists, rela-tively little data on long-term ductilityare available. The ability of the panel towithstand forces and deformations maydepend not only on its strength but alsoon its ductility.
Improvements are being sought to in-crease the long-term durability ofGFRC.) These include modifying theportland cement mortar with a polymerlatex, modifying the portland cementmatrix with pozzolanic additions, mod-ifying glass composition, coating theglass fibers, and development of alime-tree cement. z The results of theseimprovements should be quantifiedthrough a better understanding oftoughness of the GFRC composite. Thismay require the development of newand more appropriate definitions fortoughness.
Tests were conducted at the Con-struction Technology Laboratories(CTL) to evaluate long-term propertiesof three different GFRC composites.'The results of these tests were reviewedand evaluated with an emphasis onquantifying toughness. The results andanalyses are described in this paper.
SynopsisGlass fiber reinforced concrete
(GFRC) is a cement based compositeproduct which is reinforced with glassfibers. GFRC cladding panels are in-creasingly being used in the UnitedStates and other countries. The ex-panding use of GFRC panels shouldbe supported with sufficient informa-tion on long-term properties. Althoughinformation on long-term strength isavailable, relatively little data onlong-term ductility are available. Theability of the panel to withstand forcesand deformations may depend on itsstrength but also on its ductility.
Tests were conducted to evaluatelong-term properties of three differentGFRC composites. The results ofthese tests are evaluated with an em-phasis on quantifying toughness. Theresults of these tests and analyses aredescribed in this paper. Two tough-ness indices: TI (aging) and TI (im-provement) are proposed as methodsto quantify the ductility of GFRCpanels. Both of these indices can beevaluated from flexural tests currentlybeing performed for quality control ofGFRC.
EXPERIMENTALINVESTIGATION
Three types of GFRC compositionswere tested. They consisted of panelsmade with alkali resistant glass fibers(AR-GFRC) and panels made with E--glass fibers (horosilicate glass fibers) inwhich the matrix was modified with twodifferent amounts of polymer latex(E-PGFRC-1 and E-PGFRC-2). AR-CFRC and companion unreinforcedspecimens were tested in flexure, whileE-PGFRC specimens were tested in flex-ure and tension.
PCI JCURNAUSeptember-October 198/83

Table 1. Mix design of AR-GFRC.
Specificgravity
Ingre-dients*
Weight,(lb)
Percentby weight
Volume(cu ft)
Percentby volume
3.15 Cement 94.0 51.3 0.478 35.52.64 Sand 47.0 25.7 0.285 21.21.00 Water 33.0 18.0 0.529 39.32.78 Glass 9.2 5.0 0,053 3.9
Totals 183.2 100.0 1.345 100.0
'Also, 13 m1/lb of cement oi water rrdneer was added. This equaled 122ml (4 fl oz) of water reducer.
Characteristics:Cement/sand ratio = 211 by weight.Water/cement ratio = 0.3.5 by weight.
Table 2. E-PGFRC Composition 1.
Specificgravity
Ingre-dients i
Weight,(]b)
Percentby weight
Volume(cu ft)
Percentby volume
3,15 Cement 94.0 60.6 0.478 41.22.65 Sand 18.8 12.1 0.114 9.81.00 Water* 20.9 13.5 0.335 28.91.12 Polymer
solids+ 12.2 7.9 0.174 15.02.55 E-glass 9.2 5.9 0.058 5.0
Totals 155.1 100.0 1.159 100.0
*Total water = Batch water plus water contained in polymer latexcompound.
tPolymer solids = 48 percent by weight of the polymer latex compound.$Also, I.3 ml/lb of cement of water reducer was added. This equaled 122ml (4 fl oz) of water reducer,
Characteristics:Cement/sand ratio = 511 by weight.Waterlcement ratio = 0.22 by weight.Percent polymer solids = 15 percent by volume of total mix.
= 13 percent by weight of cement.Percent E-glass = 5 percent by volume of total mix.
Mix DesignMix properties for AR-CFRC panels
are given in Table 1. Mix properties forE-PGFRC-1 and E-PGFRC-2 panels aregiven in Tables 2 and 3, respectively.
MaterialsThe following materials were used:(a) Owens Corning AR-glass fiber
(minimum of 16 percent zirconia andmanufactured under license to Cem-
FIL*) and PPG* E-glass fiber; both fibertypes were chopped to about 1.5 in.(3.81 cm) in length.
(b) Type I portland cement.(c) Washed silica sand with a maxi-
mum particle size of 0.02 in. (0.05 mm).(d) Pozzolith 322-N* water reducing
agent for AR-GFRC and unreinforcedpanels. Melment L-10A* superplas-ticizer for E -PGFRC panels.
(e) Forton* polymer latex (48 percentsolids) used for E-PGFRC compositions,
84

Table 3. E-PGFRC Composition 2.
Specificgravity
Ingre-dientst
Weight,(lb)
Percentby weight
Volume(cu ft)
Percentby volume
3.15 Cement 94.0 51.6 0.478 36.32.65 Sand 47.0 25.8 0.284 21.61.00 Water* 22.8 12.5 0.365 27.71.12 Polymer
solidst 9.2 5.1 0.132 10.02.55 E-glass 9.1 5.0 0.057 4.3
Totals 182.1 100.0 1.316 100,0
*Total water = Batch water plus water contained in polymer latexcompound.
tPolymer solids = 48 percent by weight of the polymer latex compound.*Also, 1.3 mi/lb of cement of water reducer was added. This equaled 122ml (4 fl oz) of water reducer.
Characteristics:Cementisend ratio = 2/1 by weight.Water/cement ratio = 0.24 by weight.Percent polymer solids = 10 percent by volume of total mix.
= 9.8 percent by weight of cement.Percent E-glass = 5 percent by volume of total mix.
FabricationFabrication of GFRC composites was
performed by the hand-sprayed, non-dewatered method. A thin "mist coat" ofslurry was first sprayed onto the moldsurface followed by a thin glass fiberlayer applied over the mist coat. Thiswas then rolled to ensure that the fiberswere as close to the outer surface as pos-sible, Layers of fresh GFRC were thendeposited by simultaneously sprayingslurry and chopped glass fibers. Ap-proximately three layers were requiredto build a % in. thick specimen. Thecomposite was rolled between layers.The board size was 36 x 48 x % in. (91 x122 x 1 cm).
CuringFor AR-GFRC and the unreinforced
companion specimens, the curing re-gime was divided into three periods:
1. After spray-up, the composites
Use of trade names does not constitute an en-dorsement of the product.
were covered with a plastic sheet andstored overnight at 73°F (23°C).
2. The next day, the composites weredemolddd and placed in a moist room at73°F (23°C) and 100 percent relativehumidity for 6 days.
3. After moist curing, the specimenswere stored at 50 percent relativehumidity and 73°F (23°C) for 20 days.
For E-PGFRC and the correspondingunreinforced matrix, the curing regimewas divided into two periods:
1. After spray-up, composites wereleft uncovered overnight at 50 percentrelative humidity and 73°F (23°C).
2. The next day, composites weredemolded and stored at 50 percent rela-tive humidity and 73°F (23°C) for 26days.
Note that a dry environment is helpfulfor the polymer latex modified mortarcompositions.' Polymer particles formfilms during drying. These polymerfilms reinforce the matrix as well as pro-vide possible protection for the glassfiber strands.
After the 27-day curing period, speci-
PCI JOURNAL' September-October 1987 85

mens were saw-cut. The dimensions forflexural specimens were 12 x 2 x % in.(30.5 x 5.0 x I cm) while those for tensilespecimens were 12 x I x % in. (30.5 x 2.5x 1 cm). The cut specimens were keptimmersed in water at 73°F (23°C) untilthe 28th day.
Accelerated AgingOn the 28th day after spray-up,
specimens were either tested (0-weekaging) or placed into an acceleratedaging environment. Accelerated agingwas accomplished by immersing speci-mens in lime-saturated water at 122°F(50°C). Specimens were tested afterstoring in the accelerated environmentfor time periods ranging from 0 to 52weeks. The complete test program isshown in Table 4.
Note that it has been reported that ac-celerated aging can simulate a naturalweathering exposure.'-' For example,Litherland, et al. e have shown that aone-day immersion in water at 122°F
(50°C) is equivalent to 101 days of natu-ral weathering exposure in the UnitedKingdom (mean annual temperature50.7°F (10.4°C),
The concept behind the acceleratedaging test is based on many assumptionsand has been established based on cor-relation with strength results fromspecimens exposed to actual long-termaging in an outdoor environment. It ispossible that loss in strength involvesdifferent mechanisms than those for re-duction in ductility. As a result, thetime-temperature equivalence quotedearlier may not be applicable to tough-ness estimations.'
Test ProcedureFor each age of storage, six flexural
specimens were subjected to a third-point bending test (Fig. 1a). A constantcrosshead speed was maintained at arate of 0.9 in /min (2.3 mm/mm) using aclosed-loop servo-controlled hydraulictesting machine. The average deflection
Table 4. Test program.
Glasstype
Mixdesign*
Curingtype
Accelerated aging at 50°C Typeoftest
No. ofspecimens
0 1 4 8 12 17 26 39 52
AR C A X X X Ft 54None C A X X F 12
E CP1 B X X X X F 36None CPI B X F 6
E CP2 B X X X X X X F 36None CP2 B X F 6
E CP1 B X X X X X T 30E CP2 1i X X X X X T 30
• Mix design C is shown in Table 1.Mix design CPI is shown in Table 2.Mix design CP2 is shown in Table 3.
tCuring type A: 1 day covered by plastic.6 days moist curing at 100 percent RH, 73°F.20 days air stored at 50 percent RI t, 73°F.I day soaked in water at 73°F.
Curing type B: 1 day left uncovered at 50 percent RH, 73°F.26 days stored at 50 percent RH, 73°F.I day soaked in water at 73°F.
#Six specimens were tested for each test type, three with smooth surface up and three with smooth surfacedown.
86

(a) Flexural test (b) Tensile testFig. 1. Flexural test set-up (left) and uniaxial tensile test set up (right).
under loading points was recordedusing a linear potentiometer.
Tensile tests were conducted at a con-stant elongation rate of 0.5 percentminimum, using a closed-loop servo-controlled hydraulic testing machine(Fig. lb). Elongation was measuredbetween the grips. The gage length was8 in. (20.3 cm).
TEST RESULTSA summary of the test results are
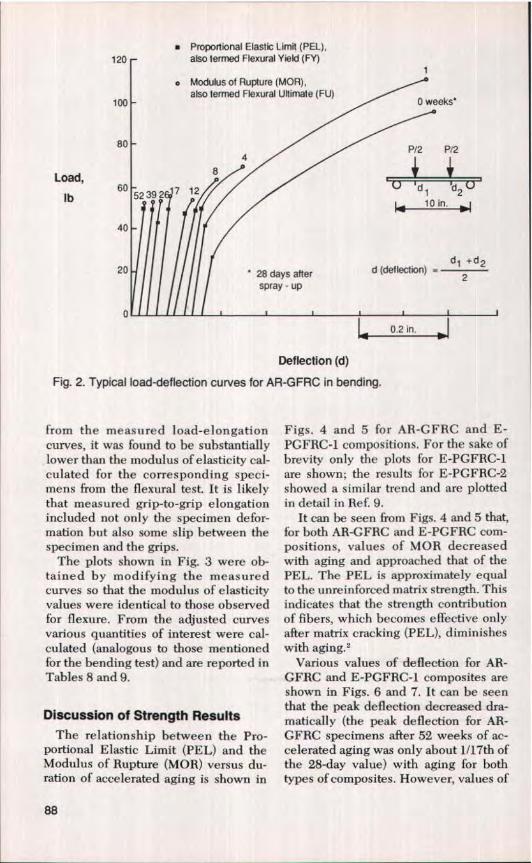
given in Tables 5 through 9. A set of loadvs. load-point deflection curves forAR-GFRC specimens stored under ac-celerated aging conditions for differenttime periods are shown in Fig. 2.Flexural stress at the extreme tensilefiber (for the section between the loadpoints) was calculated, assuming elasticbeam theory, for the load where thecurve deviated from linearity (Propor-tional Elastic Limit — PEL also referredto as Flexural Yield, FY,' and for the
maximum load (Modulus of Rup-ture — MOR also referred to as FlexuralUltimate, FU).
The calculation of MOR based onelastic beam theory is questionable forspecimens tested at early ages. The av-erage values of MOR and PEL for allthree compositions are reported in Ta-bles 5 through 7. "The correspondingvalues of deflections are labeled the firstcrack deflection and peak deflection andare reported in Tables 5 through 7.
The value of deflection when thespecimen finally fractures into twohalves (that is, the deflection when theload becomes zero in the post-peak re-gime) is termed total deflection. Thesevalues are also shown in Tables 5through 7. From the initial slope of theload-deflection curves, the modulus ofelasticity was calculated and is reportedin Tables 5 through 7.
A set of tensile load-elongation curvesfor E-PGFRC-1 is shown in Fig. 3. Whenthe modulus of elasticity was calculated
PCI JOURNAL/September-October 1987 87
■ Proportional Elastic Limit (PEL),120 also termed Flexural Yield (FY)
Modulus of Rupture (MOR),also termed Flexural Ultimate (FU)
100 Q weeks'
804
P/2 P12
Load, ^
lb 60 52392 17 12 d1 d210 in. ^I
40 7/20 28 days after
d1 2+d2d (deflection)
spray - up
0 1 i i r r r IF I I I I
0.2 in. IDeflection (d)
Fig. 2. Typical load-deflection curves for AR-GFRC in bending.
from the measured load-elongationcurves, it was found to be substantiallylower than the modulus of elasticity cal-culated for the corresponding speci-mens from the flexural test. It is likelythat measured grip-to-grip elongationincluded not only the specimen defor-mation but also some slip between thespecimen and the grips.
The plots shown in Fig. 3 were ob-tained by modifying the measuredcurves so that the modulus of elasticityvalues were identical to those observedfor flexure. From the adjusted curvesvarious quantities of interest were cal-culated (analogous to those mentionedfor the bending test) and are reported inTables 8 and 9.
Discussion of Strength ResultsThe relationship between the Pro-
portional Elastic Limit (PEL) and theModulus of Rupture (MOR) versus du-ration of accelerated aging is shown in
Figs. 4 and 5 for AR-GFRC and E-PGFRC-1 compositions. For the sake ofbrevity only the plots for E-PGFRC-1are shown; the results for E-PGFRC-2showed a similar trend and are plottedin detail in Ref. 9.
It can be seen from Figs. 4 and 5 that,for both AR-GFRC and E-PGFRC com-positions, values of MOR decreasedwith aging and approached that of thePEL. The PEL is approximately equalto the unreinforced matrix strength. Thisindicates that the strength contributionof fibers, which becomes effective onlyafter matrix cracking (PEL), diminisheswith aging.2
Various values of deflection for AR-GFRC and E-PGFRC-1 composites areshown in Figs. 6 and 7. It can be seenthat the peak deflection decreased dra-matically (the peak deflection for AR-GFRC specimens after 52 weeks of ac-celerated aging was only about 1117th ofthe 28-day value) with aging for bothtypes of composites. However, values of
88

Table 5. Summary of experimental results for AR-GFRC in bending.
Property
Accelerated aging period (weeks)
0 1 4 8 12 17 26 39 52
Proportional elastic limit (PEL),psi 1040 1405 1660 1730 1700 1640 1640 1735 1690
Relative value of PEL, percent 100.0 135,1 159.6 166.3 163.5 157.7 157.7 166.8 162.5Modulus of rupture (MOR), psi 3500 3760 2330 2390 2060 1865 1945 1900 1840Relative value of MOR, percent 100.0 107.4 66.6 68.3 58.9 53.3 55.6 54.3 52.6Modulus of elasticity, ksi 2800 2700 2230 234() 2910 3400 3940 3420 3180Toughness/cross-sectional area,
lb/in. 63.04 44.14 10.93 6.57 3.49 1.07 1.37 1.65 1.15First crack deflection, in. 0.019 0.025 0.036 0.037 0,031 0.021 0.021 0.025 0.026Peak deflection, in. 0.505 0.347 0.129 0.091 0.055 0.026 0.026 0.028 0.029Total deflection, in. 1.038 0.669 0.276 0.205 0.129 0.086 0.031 0.038 0.033Relative value of total
deflection, percent 100.0 64.53 26.68 19.75 12.43 8.29 3.02 3.69 3.22
Table 6. Summary of experimental results for E-PGFRC Composition 1 in bending.
Property
Accelerated aging period (weeks)
0 1 4 17 26 52
Proportional elastic limit (PEL), psi 1900 1765 1960 2140 1975 1770Relative value of PEL, percent 100.0 92.9 103.1 112.6 103.8 93.1Modulus of rupture (MOR), psi 4115 2950 2600 2845 2995 2625Relative value of MOR, percent 100.0 71.7 63.2 69.1 72.8 63.7Modulus of elasticity, ksi 1365 1645 1865 2225 2300 2560Toughness/cross-sectional area, lb/in. 53.49 11.75 4.66 4.86 5.42 3.71First crack deflection, in. 0.071 0.054 0.054 0.048 0.042 0.034Peak deflection, in. 0.461 0.140 0.082 0,069 0.072 0.057Total deflection, in. 0.531 0.149 0.082 0.078 0.078 0.062Relative value of total deflection, percent 100.00 28.11 15.46 14.67 14.61 11.80
Table 7. Summary of experimental results for E-PGFRC Composition 2 in bending.
Property
Accelerated aging period (weeks)
0 1 4 17 26 52
Proportional elastic limit (PEL), psi 1700 1700 1660 2025 1725 1911)Relative value of PEL, percent 100.0 100.3 97.8 119.2 101.5 112.4Modulus of rupture (MOR), psi 3680 2495 2365 2540 2560 2540Relative value of MOB, percent 100.0 67.8 64.3 69.1 69.6 69.0-Modulus of elasticity, ksi 1820 1975 2090 2530 2720 3420Toughness/cross-sectional area, lb/in. 47.87 7,96 4.21 3.64 3.39 2.75First crack deflection, in. 0.050 0.043 0.405 0.044 0.032 0.029Peak deflection, in. 0.432 0.102 0.067 0.061 0.056 0.043Total deflection, in. 0.532 0.112 0.083 0.071 0.060 0.049Relative value of total deflection, percent 100.00 20.99 15.69 13.34 11.25 9.29
PCI JOURNAL/September- October 1987 89

• 6endover Point (BOP),also termed Tensile Yield (TV)
700
60026
52500
Load, 400lb
300
200
100
0
o Ultimate Tensile Strength (UTS), 0 weeks'also termed Tensile Ultimate (TU)
P
8 in.Gage Length
P = Load
• 28 days after spray-up
0.02 in.
Elongation
Fig. 3. Typical load-elongation curves for E-PGFRC-1 tension.
MOB as well as peak deflection for agedspecimens for E-PGFRC composites aresomewhat higher than those for AR-CFRC specimens (see also Tables 5through 7).
Tensile strength results for the E-PGFRC compositions are plotted in Fig.8. Both the ultimate tensile strength
(UTS or tensile ultimate-TU) and valuesof stress at the proportional elastic limit(referred to as the Bend Over Point—BOP, or tensile yield—TX) are shownfor the specimens subjected to variousaccelerated aging periods. It appearsfrom this figure that neither the UTS northe BOP is significantly altered by ac-
Table B. Summary of experimental results for E-PGFRC Composition 1 in tension.
Property
Bend over point (BOP), psiRelative value of BOP, percentUltimate tensile strength (UTS), psiRelative value of (UTS), percentModulus of' elasticity, ksiFirst crack elongation, in.Peak elongation, in.Total elongation, in.Relative value of total elongation, percent
Accelerated aging period (weeks)
0 4 17 26 52
445 560 315 510 335100.0 125.6 70.2 114.4 75.31740 1650 1510 1640 1355100.0 94.7 86.9 94.1 78.01365 1865 2225 2300 2560
0.003 0.002 0.001 0.002 0.0010.066 0.013 0.011 0.012 0.0070.068 0.013 0.012 0.011 0.007
100.00 18.92 18.04 16.28 9.68
90

Property
Accelerated aging period (weeks)
0 4 17 26 52
Bend over point (BOP), psi 485 530 515 330 360Relative value of BOP, percent 100.0 109.3 106.2 68.1 73.9Ultimate tensile strength (UTS), psi 1080 1050 1270 1335 1430Relative value of (UTS), percent 100.0 97.0 117.4 123.5 132,2Modulus of elasticity, ksi 1820 2090 2530 2720 3420First crack elongation, in. 0.002 0.002 0.002 0.001 0.001Peak elongation, in, 0.033 0.008 0.008 0.007 0.006Total elongation, in. 0.032 0.014 0.010 0.008 0.007Relative value of total elongation, percent 100.00 42.63 29.47 26.02 20.69
0 -0 20 40 60
Accelerated Aging Period, weeks
Fig. 4. PEL and MOR of AR-GFRC versus accelerated aging period at 122°F (50°C).
celerated aging. This is in contrast withthe flexural response where there is asignificant reduction in values of theMOR with aging (see Fig. 5).
This apparent contradiction can beunderstood by observing that althoughthe peak tensile stress is not substan-tially reduced with aging, the peak ten-sile strain is reduced with aging (seeFigs. 3 and 9). The MOR depends on notonly the tensile strength but also on thetensile stress-strain curve. Therefore,the effect of a reduction in tensile straincapacity is a direct reduction in MOR.
To confirm this conclusion, theoreti-cal MOR values were calculated fromthe observed tensile response. The ob- -served tensile stress-strain curves (seeFig. 3) were approximated by twostraight lines (from zero stress to BOPand from BOP to UTS). (The post-peak -response was not included in theanalysis for simplicity.) It was assumedthat during bending, plane sections re-main plane and that the compressivestress-strain curve is linear with thesame modulus of elasticity as in tension. -A comparison between the theoretically
PCI JOURNALSeplember-October 1987 91

5
4
PEL and MOR, 3
psi x 10002
1
00 20 40 60
Accelerated Aging Period, weeks
Fig. 5. PEL and MOR of E-PGFRC-1 versus accelerated aging period at 122°F (50°C).
1.2
1.0
0.8
Deflection,
inches 0.6
0.4
0.2
0_U__ - -
0 20 40 60
Accelerated Aging Period, weeks
Fig. 6. Deflection of AR-GFRC in bending versus accelerated aging time at 122°F (50°C).
predicted maximum flexural load andthe experimentally measured ones areshown in Fig. 10.
It can be seen that the theoretical val-ues correlate quite well with the mea-sured data. It should be noted that theassumption that only small deflectionsoccur becomes less accurate at earlyages, especially for unaged specimens
which can exhibit quite large deflec-tions. In addition, the assumption that,during a tensile test, strain is uniformlydistributed over the 8 in. (20 cm) gagelength is also questionable" However,the principal point that the MOR valuesdepend on both the tensile strength aswell as the corresponding tensile strainis certainly valid.
92

1.2
1.0
0.8
Deflection, 0.6inches
0.4
0.2
0.00 20 40 60
Accelerated Aging Period, weeks
Fig. 7. Deflection of E-PGFRC-1 in bending versus accelerated aging period at 122°F(50°C).
2.0
iL.
BOP and UTS,1.2
psi X 1000
0.8
0.4
0.00 20 40 60
Accelerated Aging Period, weeks
Fig. 8. BOP and UTS of E-PGFRC-1 and E-PGFRC-2 versus accelerated aging period at122°F (50°C).
FLEXURAL TOUGHNESSINDICES
The preceding presentation haspointed out that to evaluate the effect ofaging, one must consider not onlystrength but also ductility. Aging ofGFRC panels in a moist environmentcauses them to become less ductile.
One common method to assess duc-tility (or brittleness) is evaluation oftoughness. Flexural toughness is gener-ally defined as area under the load-deflection curve observed during abending test. The area under the load-deflection curve from the initial zeroload to the final zero load (that is, up tothe total deflection value) represents the
PCI JOURNALJSeptember- October 1987 93

120
100
80
Flexural Load,lb 60
40
20
00 6020 40
0.10
13 First Crack Elongation
0.08 • Peak Elongation
• Total Elongation
Elongation, 0 of)
inches0 04
002
0000 20 40 60
Accelerated Aging Period, weeks
Fig. 9. Elongation of E-PGFRC-1 in tension versus accelerated aging period at 122°F(50°C).
Accelerated Aging Period, weeks
Fig. 10. Flexural load prediction (using tensile data) and experimentally measuredflexural load for E-PGFRC-1 at different aging periods at 122°F (50°C).
external work done. This total area di-vided by the cross-sectional area of thebeam is a measure (assuming a singlefracture plane) of fracture toughness ofthe material.
Values of flexural toughness are re-ported in Tables 5 through 7 for theflexural specimens. Since the bending
test is recommended for quality controlof GFRC panels,' only flexural tough-ness is discussed here.
The relationships between toughnessand aging for AR-GFRC composites,companion unreinforced matrix, andE-PGFRC composites are plotted inFig. 11. It can be seen that the tough-
94

Toughness/CrossSectional Area,
lb/in.
20 40 60
Accelerated Aging Period, weeks
Fig. 11. Toughness/cross-sectional area of AR-GFRC and companion unreinforcedmatrix, E-PGFRC-1, and E-PGFRC-2 versus accelerated aging period at 122°F (50°C).
ness of AR-GFRC composites after 28days of curing (before accelerated aging)is about 65 times that of unreinforcedmatrix. In contrast, after 52 weeks ofaging the toughness drops to a valueequal to nearly that of unreinforced mat-rix. It is clear that this dramatic (aboutlleoth of the unaged value) drop intoughness is at least as important an in-dicator of aging as the reduction instrength (about one-half the unagedvalue).
ASTM Toughness Indices for SteelFiber Reinforced Concrete
The flexural toughness value deter-mined as defined above may be depen-dent on the type of test (center-point vs.third-point bending test), type and di-mensions of specimen, and type oftesting system. Thus, it is desirable tonormalize the toughness value. Basedon needs for steel fiber reinforced con-crete, ASTM Designation: C1018-85 hasadopted a set of toughness indices basedon work by Johnston." The ASTM def-inition of toughness index can be illus-trated by considering toughness index 15
which is defined as follows (see Fig. 12):
load-deflection area up to three_ times the deflection at first cracking
IS area up to deflection at first cracking
If the load-deflection curve wereelastic-perfectly plastic, then I S = 5, asshown in Fig. 12. Similarly, I,,, and Igoare calculated using the area up to 5.5times and 15.5 times the first crackdeflection, respectively, in the numer-ator. For the ASTM adopted toughnessindex, the toughness is normalized withrespect to the toughness value approxi-inatety corresponding to that of the plainmatrix (area up to the first crack deflec-tion). Therefore, the effects of specimentype and dimensions are minimized.
These three toughness indices areplotted for AR-GFRC tested after vari-ous aging periods in Fig. 13. It can beseen that toughness indices I, and I to arenot as meaningful as I. in showing theextent of property degradation due toaccelerated aging. A toughness indexbased on a higher deflection value suchas I, would have been better than 19,since, for the unaged AR-GFRC speci-
PCI JOURNAL/September-October 1987 95

1+2 1+2+3 1+2+3+4
r 5 —_ 110 — 1301 1 1
----------- - ----------'---'----------------- i --Load I I
1
I ! 11 1 11 1 1
I 1 I1 1
Steel Fiber Reinforced Concrete(frorn Johnston)
I II 1
I I I
0 2 I 3 1 4
afc 3 dic 5.5 d fc 15.5 dfc
DeflectionFig. 12. Toughness indices according to ASTM Designation: 01018-85 adopted fromJohnston (base unity system).
60
50
40
Toughness30
Index
20
10
00 20 40 60
Accelerated Aging Period, weeks
Fig. 13. Is, I,o, and 1 30 for AR-GFRC in bending versus accelerated aging period at 122°F(50°C).
mens, the peak deflection was approxi-mately 25 times the first crack deflection(see Table 5).
It should be noted that the ASTMtoughness indices I s, I lo, and I,, weredeveloped for cases where the area be-
yond the peak load provides the majorcontribution to the toughness value (seeFig. 12). For the unaged GFRC com-posites, in contrast, the area prior to thepeak load provides the greatest contri-bution.
96

00 r Area of GFRC at Various AgesIII TI (Aging)
Area of GFRC at 0 weeks (28 days)
so } Toughness (area) of GFRC at 0 weeks
Up To Total Deflection = 63.04 Ibin.
TI (Aging), 60 Up to Peak Deflection = 46.53 lb/in.
40
20 I Calculated Up To Total Deflection
-----Calculated UP To Peak Deflection
00 20 40 60
Accelerated Aging Period, weeks
Fig. 14. TI (aging) for AR-GFRC in bending versus accelerated aging period at 122°F(50°C).
Two Proposed Toughness Indicesfor GFRC
Two toughness indices which seemmore appropriate for GFRC are pro-posed. They are TI (aging) and TI (im-provement).
The value for TI (aging) is defined asthe area under the complete loaddeflection curve for GFRC at a given ac-celerated aging period divided by thecomplete area for the unaged (28 (laysafter spraying) GFRC specimen. Valuesof TI (aging) at various accelerated agingperiods for AR-GFRC and E-PGFRC-1are plotted as a solid line in Figs. 14 and15, respectively. The plot indicates thatTI (aging) decreased from 100 percent toas low as 2 percent as a result of acceler-ated aging.
Note that since the denominator isconstant for a given composition, if thatvalue is reported, then the absolutevalue of the toughness can be easily cal-culated from the proposed toughnessindex values. For GFRC composites(especially at early ages) the area up tothe peak deflection offers the majorcontribution to the toughness value.
Therefore, this area can be used in cal-culating the proposed toughness indexrather than the total area. Values of TI(aging), calculated using the area up tothe peak deflection (for both numeratorand denominator), are plotted as adashed line in Figs. 14 and 15. The twoplots (solid lines and dashed lines) com-pare very closely.
The value for TI (improvement) isdefined as the area under the completeload-deflection curve of GFRC at agiven accelerated aging period dividedby the area under the complete load-de-flection curve of the unreinforced matrixat zero accelerated aging (that is, 28 daysafter spraying). Values of TI (improve-ment) are shown in Fig. 16 for AR-GFRC and E-PGFRC-1.
Note that TI (improvement) repre;sents the relative toughness improve-ment for GFRC over that for the un-reinforced matrix.
If the value for the unreinforced mat-rix is unavailable, then one could sub-stitute the area up to the first crackingdeflection obtained from the load-deflection curve of the unaged GFRCcomposite.
PCI JOURNAL/Septernber-October 1987 97

100
Toughness (area) of GFRC at 0 weeks:
80 Up To Total Deflection = 53.49 lb/in.
Up To Peak Deflection 50.77 lb/in.
TI (Aging), 60
40Calculated Up To Total Deflection
Calculated Up To Peak Deflection
20
00 20 40 60
Accelerated Aging Period, weeksFig. 15. TI (aging) for E-PGFRC -1 in bending versus accelerated aging period at 122°F(50°C).
70Area of GFRC at Various Ages
TI (improvement)
60 Area of Matrix at 0 weeks (28 days)
50
Toughness (area) of Matrix at 0 Weeks (28 days)
40AR-GFRC = 1.0 Ibfn.
(improvement) 30 E-PGFRC-1 = 5.206 Ibfin.
20
10 • ARE-PGFRC
-GFRC -1
a
0
0 20 40 60
Accelerated Aging Period, weeks
Fig. 16. TI (improvement) for AR-GFRC and E-PGFRC-1 in bending versus acceleratedaging period at 122°F (50°C).
CONCLUSIONS E-glass fibers in combination with apolymer latex modified matrix show a
1. GFRC composites fabricated with reduction in flexural strength andcommonly used alkali resistant glass fi- toughness when exposed to an acceler-bers and composites fabricated with ated aging environment.
98 1

2. Modulus of rupture for GFRC com-posites after 52 weeks of acceleratedaging (fully aged) is about one-half ofthe corresponding value for unagedcomposites. The toughness value for thefully aged composite is as small as 'ieothof that for the unaged composite. Thisindicates that any possible improvementin long-term performance of GFRCshould be based on both strength andtoughness measurements of compositessubjected to an accelerated aging en-vironment.
3. To properly and rationally evaluatethe toughness (that is, ductility or brit-tleness) of GFRC, two toughness indi-ces are proposed. TI (aging) is a tough-ness index representing the toughness
of an aged composite relative to an un-aged composite. TI (improvement) is atoughness index representing thetoughness improvement provided bythe fibers after a specified aging period.
4. Both of these toughness indices canbe easily evaluated from flexural testscurrently being performed for qualitycontrol of GFRC panels.
ACKNOWLEDGMENT
The support of the National ScienceFoundation through a grant to North-western University (Grant No. ECE-8520361, Program Manager: Dr. JohnScalzi) is gratefully appreciated.
REFERENCES
1. PCI Committee on Glass Fiber Rein-forced Concrete Panels, "RecommendedPractice for Class Fiber Reinforced Con-crete Panels," PCI JOURNAL, V. 26, No.1, January-February 1981, pp. 25-93.
2. Proceedings — Durability of Glass FiberReinforced Concrete Symposium,Edited by Sidney Diamond, PrestressedConcrete Institute, Chicago, Illinois,November 1985.
3. Daniel, J. I., "Long-Term Strength Dur-ability of Forton Polymer Modified GlassFiber Reinforced Concete," Report toForton, Inc., Submitted by ConstructionTechnology Laboratories, A Division ofthe Portland Cement Association,Skokie, Illinois, May 1984.
4. Daniel, J. I., and Schultz, D. M., "Dura-bility of Class Fiber Reinforced ConcreteSystem," Proceedings — Durability ofGlass Fiber Reinforced Concete Sym-posium, Prestressed Concrete Institute,Chicago, Illinois, November 1985, pp.174-198.
5. Yannas, S., and Shah, S. P., "PolymerLatex Modified Mortar," AC! Jou rnal, V.69, No. 1, January 1972, pp. 61-65.
6. Litherland, K. L. Oakley, D. R., andProctor, B. A., "The Use of AcceleratedAging Procedures to Predict the Long-Term Strength of GRC Composites,"
Journal Cement and Concrete Research,V. 11, 1981, pp. 455-466.
7. Proctor, B. A., Oakley, D. R., andLitherland, K. L., "Development in theAssessment and Performance of GRCover 10 Years," Journal of Composites,April 1982, pp. 173-179.
8. Litherland, K. L., "Test Methods ofEvaluating Long Term Behavior ofGFRC," Proceedings — Durability ofClass Fiber Reinforced Concrete Sym-posium, Edited by Sidney Diamond,Prestressed Concrete Institute, Chicago,Illinois, November 1985.
9. Ludirdja, D., "Durability and FiberOrientation Effect of Class Fiber Rein-forced Concrete," MS Thesis, North-western University, Evanston, Illinois,1986 (under the supervision of Prof. S. P.Shah).
10. Gopalaratnam, V. S., and Shah, S. P.,"Tensile Failure of Steel Fiber Rein-forced Mortar," to he published in jour-nal of Engineering Mechanics Division,ASCE.
11, Johnston, C. D., "Definition and Mea-surement of Flexural ToughnessParameter for Steel Fiber ReinforcedConcrete" Cement, Concrete, andAggregates, CCAGDP, V. 4, No. 2,Winter 1982, pp. 53-60.
PCI JOl1RNAL/September-October 1987 99