Embed Size (px)
Citation preview

Bazrkar et al., Cogent Business & Management (2017), 4: 1390818https://doi.org/10.1080/23311975.2017.1390818
OPERATIONS, INFORMATION & TECHNOLOGY | RESEARCH ARTICLE
Total quality model for aligning organization strategy, improving performance, and improving customer satisfaction by using an approach based on combination of balanced scorecard and lean six sigmaArdeshir Bazrkar1, Soleyman Iranzadeh1* and Naser Feghhi Farahmand1
Abstract: Considering the importance of the service quality and the position of banks in the global and national economy, the main objective of this study was to design a total quality model in Qavamin Bank to align the organization’s strategies, improve performance, and improve customer satisfaction. In the first step, after reviewing various groups of the Qavamin Bank processes, accounting processes were selected by the managers of the bank as sample processes. Then, using the six dimensions of the balanced scorecard, some indicators were defined for selecting the strategic pro-cess. After collecting data of indicators using cross-efficiency model in data envelop-ment analysis, “replacing the customer account book” was selected as the strategic process. In the next step, using the five phases of the DMAIC cycle in the lean six sigma methodology, the sigma level of the process was measured. After implement-ing the six sigma methodology, the process sigma level was increased from 2.84 to 2.88 and the average process time was reduced from 3 to 2 min and 40 s. The results showed the successful design and implementation of the total quality model in Ghavamin Bank for the process of “replacing the customer’s account book”. Finally,
*Corresponding author: Soleyman Iranzadeh, Department of Industrial Management, Tabriz Branch, Islamic Azad University, Tabriz, IranE-mail: [email protected]
Reviewing editor:Shaofeng Liu, University of Plymouth, UK
Additional information is available at the end of the article
ABOUT THE AUTHORSArdeshir Bazrkar is a PhD candidate in industrial management at Tabriz Islamic Azad University. His research interests include quality management and production management. He is a university lecturer at Islamic Azad University of north Tehran branch.
Solyeman iranzadeh is an associate professor of industrial management at Tabriz Islamic Azad University. His research interests include production management, quality management, and knowledge management. His article has been published in International journals. He has run a lot of projects in Iranian companies in the field of production and operation management.
Naser Feghhi Farahmand is an associate professor of industrial management at Tabriz Islamic Azad University. His research interests include: strategic Management, production management, and knowledge management. His article has been published in International journals. He has run a lot of projects in Iranian companies in the field of production and operation management.
PUBLIC INTEREST STATEMENTThe main goal of the research was to provide a comprehensive quality model to align the strategy, improve performance and customer satisfaction. With regard to the status of service organizations in the national and global economy, the promotion of the performance of service organizations in general and banks in a specific way can increase Efficiency and productivity, and ultimately economic growth at the national and global levels. To achieve this, in this research, three goals were defined as a comprehensive quality model, and these goals were achieved with the help of a balanced score card and a lean six sigma methodology.
Received: 21 August 2017Accepted: 07 October 2017First Published: 12 October 2017
© 2017 The Author(s). This open access article is distributed under a Creative Commons Attribution (CC-BY) 4.0 license.
Page 1 of 16

Page 2 of 16
Bazrkar et al., Cogent Business & Management (2017), 4: 1390818https://doi.org/10.1080/23311975.2017.1390818
to measure the level of realization of the designed model’s objectives, the research hypotheses were tested using one-sample t-test. The results of the hypothesis test showed that all three objectives of the total quality model were met.
Subjects: Production, Operations & Information Management; Operational Research/ Management Science; Operations Management
Keywords: total quality model; aligning the strategy; performance improvement; customer satisfaction; lean six sigma
1. IntroductionTotal Quality Management (TQM) focuses on a set of methods including continuous improvement, fulfilling customer needs, reducing labor re-work, improving long-term thinking, increasing team-work, improving process design, competitive modeling, and solving issues by teamwork (Arawati & Zafaran, 2011). It can be said that TQM is an approach focused on continuous improvement of the quality of goods and services that is realized with the participation of all members of the organiza-tion (Burli, Kotturshettar, & Dalmia, 2012). Total quality management is a coherent approach to ful-fill the customer’s needs, which is done with participation of all employees in continuous improvement of processes and cost-effectiveness (Jain, 2000). In strategic planning, it is necessary to investigate the short-term business plan and quality improvement program (Das, Paul, & Swierczek, 2008). The plans should be clear and qualitative objectives should be considered in preparing the plans (Jun, Cai, & Peterson, 2004). Strategies should always be updated and the organization’s strategies should always be considered in the overall quality management program (Llusar, Tena, Puig, & Martín, 2009). Organizations spend a lot of time and resources to plan and develop their own strategies but most of them fail in the strategy implementation phase (Kaplan & Norton, 2001). We know that a strategy is a major and important program, and it will only be implemented when defined and pur-sued in the form of several different projects. On the one hand, in recent years, organizations in-creasingly have turned to lean six sigma approach and have solved their problems with this approach. In today’s competitive world, the six sigma methodology is very applicable for organizations.
The six sigma approach is primarily a way to improve capabilities of the business processes using statistical tools and its goal is to reduce defects, improve profitability, increase employee satisfac-tion, enhance product quality, and ultimately increase customer satisfaction. It also reduces costs and eliminates losses and activities that do not add value to the organization (Wang & Chen, 2010).
Considering the importance of implementing total quality management in service organizations to pursuit organizational goals such as continuous improvement of services and processes in order to satisfy customers and ultimately enhance the profitability of the organization, the main objective of this study is to provide a total quality model for achieving three goals: aligning strategy, improving process performance, and improving customer satisfaction in the banking industry. In order to achieve these goals, we used a combination of balanced scorecard and lean six sigma methodology.
2. Thematic literature of study
2.1. Total quality managementTotal quality management has been accepted as a management paradigm by many organizations around the world (Antony, Leung, Knowles, & Gosh, 2002). Total quality management is an approach to meeting the needs of both internal and external customers, in which the customer is considered as the most important factor in any process (Baidoun, 2010). A review of the three terms used in the “total quality management” helps to better understand this statement. The term “management” refers to the fact that quality is managed in the organization, rather than only maintaining it by in-spection and control. The term “quality” refers to providing what is needed and expected by custom-ers and managers. The term “total” refers to the fact that it involves all members and sectors of the organization (Sahney, Banwet, & Karunes, 2004).

Page 3 of 16
Bazrkar et al., Cogent Business & Management (2017), 4: 1390818https://doi.org/10.1080/23311975.2017.1390818
2.2. Balanced scorecardThe balanced scorecard or BSC was developed by Kaplan and Norton in 1990. The balanced score-card which is increasingly being considered today is not only a comprehensive and integrated per-formance measurement tool, but it is also a management system with a new strategic management approach that was introduced in the 1990s. Norton and Kaplan, by proposing their performance evaluation system, drew managers’ attention to the point that it would be better to evaluate em-ployee performance with a more general approach. Kaplan and Norton said that in order to perform a complete evaluation of performance, it should be assessed from four perspectives: finance, cus-tomer, internal processes, and learning and growth perspectives (Niven, 2002). Norton and Kaplan’s other research, called the Strategy Map, deals with the importance of employee satisfaction and satisfaction of the society (communications). The last two perspectives are important in integrating the main factors in the balanced scorecard (Rezaee & AghaSeyedHosseini, 2011).
2.3. Lean six sigmaSix sigma was introduced for the first time in the mid-1980s as a business process improvement model by Bill Smith, an engineer of reliability at Motorola (Brady & Allen, 2006). Six sigma is a power-ful business strategy that enhances service efficiency and significantly reduces defects in the provi-sion of services (Antony, 2005). In fact, six sigma is an effective methodology to accelerate the improvement of the quality of products and services, along with the elimination of activities and processes without value added (Kwak & Anbari, 2004). The fundamental concept of lean thinking lies in eliminating losses and creating value in the organization. Lean thinking is an attitude to increase productivity and continuous value creation and to minimize costs and losses. Thus, it can be said that the purpose of using the sigma method is to reduce defects, losses, and evident errors through quick methods and techniques such as lean thinking (Shah, Chandrasekaran, & Linderman, 2008). The goal of the six sigma is to grow, and this growth is achieved not only by reducing costs but also by increasing productivity (Byrne, Lubowe, & Blitz, 2007). Hes and Benjamin (2014) in a study entitled “Applying Lean Six Sigma within the university: opportunities for process improvement and cultural change”, used a combined six sigma approach to improve cultural change at a university. The study findings showed that if the goal is to change the cultural and behavioral patterns of staff and stu-dents, it is necessary to use lean methodology and lean thinking in combination with six sigma. The DMAIC cycle is the most common methodology in lean six sigma to improve organizational pro-cesses. Bhat and Jnanesh (2013) in a study entitled “Enhancing performance of the health informa-tion department of a hospital using lean Six Sigma methodology”, used a combined approach of lean six sigma to improve the performance of a hospital’s information system. Shanmugaraja and Nataraj (2012) in a study entitled “Total performance excellence—a model to implement six sigma in service organizations” used a combination of six sigma and QFD approaches to improve organiza-tional processes. The result showed that the customer satisfaction increased due to correct identifi-cation of modified processes. Heavey and Murphy conducted a study entitled “Integrating of Balanced Scorecard with Six Sigma”. The ultimate goal of the researchers was to know whether the combination of the two approaches would be useful to measure and improve the performance or not. In that study, the Balanced Scorecard was introduced as a prerequisite for selecting six sigma improvement projects.
3. MethodologyThe present study is a practical study in terms of the purpose and it is a descriptive survey study in terms of method. In the first step, the strategic indicators of the Ghavamin Bank are identified and examined by the developed balanced scorecard (6 perspectives). In the second step, the processes are prioritized with considering the strategic indicators and the combination of the balanced score-card and data envelopment analysis. In Step 3, after selecting the process that needs to be im-proved, the selected process will be analyzed using the six sigma combined approach based on the DMAIC methodology. In Step 4 and after receiving feedback, fulfillment of the following three objec-tives will be assessed using balanced scorecard approach: strategy alignment, performance im-provement, and customer satisfaction.

Page 4 of 16
Bazrkar et al., Cogent Business & Management (2017), 4: 1390818https://doi.org/10.1080/23311975.2017.1390818
3.1. Conceptual modelConsidering the main purpose of the research, in this section, the conceptual model of the research is presented to achieve the triple goals of research: aligning strategy, improving performance, and increasing customer satisfaction. This model shows how the research objectives can be achieved. This model is shown in Figure 1.
4. Data analysis
4.1. Selection of the strategic processFirst, the strategic areas of the Ghavamin Bank were studied which were taken from the strategic plan of the organization. Investigations showed that choosing a strategic process to improve performance with the goals of reducing customer expectations and reducing the time of the process is completely in line with the approach of accelerating the provision of services in the strategic plan of Ghavamin Bank. In this research, balanced scorecard was used to align the strategy. For this purpose, using, the main criteria for selecting a strategic process were identified using six aspects of balanced scorecard. Interviews and nom-inal group techniques were used to define the subcriteria related to the processes of the accounting de-partment of the Ghavamin Bank. Finally, 12 sub criteria were defined for choosing the strategic process.
After introducing the main and secondary criteria, given that the cross-efficiency model was used to evaluate and prioritize the processes of the accounting department of Ghavamin Bank, it was necessary to analyze these processes with respect to specific inputs and outputs. These outputs and the inputs of the criteria taken from six measures of balanced scorecard were defined using the previous studies and the opinions of the experts of the bank. Definitions of Inputs and outputs of key indicators of Ghavamin Bank are provided in Table 1.
The accounting group processes, which were in total 25 processes, were evaluated by 12 criteria. After collecting information through the organization database and questionnaire, data were evalu-ated by the cross-performance model in the data envelopment analysis. Finally, 25 processes were ranked based on the obtained score of the performance. The results are presented in Table 2.
• Cross-efficiency ranking model: assume that we have n DMUs that by getting m inputs produce s outputs. Also assume that ith input and rth output of DMUj are xij and yrj, respectively. Charnes, Cooper, and Rhodes (1978) proposed the following multiplier CCR model for performance evaluation.
S.t
(1)E∗dd = max
s∑
r=1
uryrd
m∑
i=1
vixid
s∑
r=1
uryrj
m∑
i=1
vixij
≤ 1, j = 1,… ,n
Figure 1. Conceptual model of research.
Identification of strategic key indicators of
Ghavamin Bank using balanced scorecard
Selecting the strategic process using the BSC -
DEA combined approach
Implementation of Six Sigma Methodology
DMAIC
Fulfillment of the goals:Sterategy alignment
Performance improvementCustomer satisfaction
Examining fulfillment of thegoals using BSC

Page 5 of 16
Bazrkar et al., Cogent Business & Management (2017), 4: 1390818https://doi.org/10.1080/23311975.2017.1390818
Table 1. Types of inputs and outputs of key indicators of Ghavamin BankAspect of balanced scorecard Key indicator TypeFinancial aspect Direct cost Input
Direct income Output
Customer aspect Number of customers Output
Repeat rate of serving customers Input
Internal processes aspect Rate of labor engagement Output
Response time to customer requests Input
Learning and growth aspect Staff training hours Input
Number of staff with high academic degree Output
Employee satisfaction aspect Staff turnover rate Output
Number of employee complaints Input
Environment and society aspect Alignment with society macro strategies Input
Compliance with environmental laws Output
Table 2. Ranking of accounting group processes using cross-efficiency scoreProcesses (DMUs) Cross-efficiency score Rank of the
process1 Opening a Ghavamin card account 0.4376 172 Opening a current check book 0.3752 203 Opening the current account of the
facility0.3328 24
4 Opening a long-term investment deposit account
0.26864 25
5 Close check current account 0.43328 186 Closing a short-term investment
deposit account0.37132 22
7 Transferring a long-term deposit to another person by the account holder
0.69788 3
8 Closing long-term deposit account 0.3716 219 Depositing the interests of the deposits
to customer accounts0.542 9
10 Clearing checks of other banks 0.4856 1311 Clearing the bank checks 0.524 1012 Issuing a coded check, Santa, Paya,
and Sahab0.4668 14
13 Issuing an installment book 0.4868 1214 Issuing a draft 0.56528 615 Issuing a check book 0.4148 1916 Issue of billing for customers 0.61788 517 Taking money out of customer
account by the bank0.55224 7
18 Replacing customer account book 0.896 119 Deposit to customer account 0.6676 420 Taking money out of account by
customer0.46 15
21 Blocking the accounts by customer 0.698 222 Request a gift card 0.3572 2323 Payment to the customer via pos 0.55 824 Controlling the opening of accounts
and provide report for the head of the branch
0.44292 16
25 Putting money inside ATM 0.4908 11

Page 6 of 16
Bazrkar et al., Cogent Business & Management (2017), 4: 1390818https://doi.org/10.1080/23311975.2017.1390818
The optimum value of the model (1) is smaller or equal to 1. The model is efficient if its optimal value is equal to 1, otherwise the unit is inefficient. Suppose that (ud, vd) are optimal weights for DMUd using the CRR model. Then, cross-efficiency of DMUj will be calculated with regard to the optimum weights DMUd.
The cross-over efficiency index of each unit is obtained using the following equation:
According to the results, the process of “replacing the customer account book” was identified as the first process in the ranking. A remarkable advantage of this method compared to the traditional methods of data envelopment analysis was that all processes were ranked without any problem. In the traditional models, if the efficiency index of all processes is equal to 1, ranking is not possible and we should use other methods of ranking such as the Anderson-Patterson (AP) method. With regard to the fact that the process of “replacing customer account book” has been identified as the most efficient process in the group of accounting processes of Ghavamin Bank, and due to the fact that the selection of this process is based on the strategic indicators of the balanced scorecard, this pro-cess can be considered as the strategic process for use in lean six sigma methodology.
4.2. Implementation of lean six sigmaThe technique used in six sigma to improve the problem-solving process is based on five phases: definition, measurement, analysis, improvement, and control. Each phase is logically related to the next and previous phases.
4.2.1. Definition phaseIn this phase, the goal and scope of the project are defined and the existing information about the process is gathered. The title of the project was “the length of time of replacing the customer ac-count book” in the central branch of the Ghavamin Bank and the main goal of the project was “re-ducing the time needed for replacing the customer account book” from 3 to 2:35 min.
4.2.2. Measurement phaseIn this phase, the goal was to accurately determine the location or origin of problems by making a real understanding of the problems and conditions of the existing processes, and to determine ca-pability of the process and the sigma level. Initially, by considering the previous phase information, a table of critical indicators whose qualities are important from the perspective of the customer, was prepared. This table helped to review the indicators in terms of unit of measurement and defect criteria (Table 3).
ur ≥ ◦, vi ≥ ◦, ∀r, i
Edj =
s∑
r=1
udr yrj
m∑
i=1
vdi xij
Ed =
∑
j=1
Ejd
n
Table 3. Characteristics of critical quality indicatorsCritical quality indicator Unit of measurement Defect criteria
1 Time of request for replacing the account book Time (s) T > 7
2 Time of entering the information into the system Time (s) T > 89
3 Time of writing the account balance in the account book Time (s) T > 16
4 Time of revocation and archiving the account book Time (s) T > 43
5 Total process time Time (s) T > 2.35

Page 7 of 16
Bazrkar et al., Cogent Business & Management (2017), 4: 1390818https://doi.org/10.1080/23311975.2017.1390818
Data on the time spent on these processes was collected (in terms of minutes) over a period of 15 days for 5 randomly selected customers in each day. After collecting time data using a timer, the normality of the data was tested. The sample size of this test was 75, and the mean and standard deviation of the sample were calculated for the total time of the process cycle. The results showed that the p-value in this test was more than 1% and the collected data followed the normal distribution.
Before drawing the control chart, we should examine the randomness of the data using run chart and eliminate non-random data. If the p-value for each of them is less than 0.05, then there is a non-random data in the process and should be eliminate. The test results show that the p-values for all tests are greater than 0.05 and there is no non-random data in the process. Subsequently, to as-sess the controllability of “replacing the customer account book” process, control charts are used based on the data obtained from the process, so that, while calculating the control limits for com-puting process capability, a common language is developed for discussing process performance and identification of specific or general causes of “replacing the customer account book”. In order to obtain the process voice in the examined branch of the bank, the control chart (X − R) for the con-tinuous time data is drawn at this stage (Figure 2).
The mean of the sample population is X = 2.867 and the average variability of the sample is R = 1.043. Also UCL = 3.468 and LCL = 2.265. For the process to be controlled, all points in the graph must be placed between the control limits. In this section, the process capability is first examined using the control charts, and then indicators such as the efficiency index and process sigma level are calculated (Figure 3).
After calculating the process capability, we calculate efficiency index, DMPO indeed, and process sigma level:
P = Pr(Z > (3.468 − 2.867)∕0.448) = 1.34
P = Pr(Z > 1.34)
Figure 2. Calculation of process voice using the control chart (X − R).

Page 8 of 16
Bazrkar et al., Cogent Business & Management (2017), 4: 1390818https://doi.org/10.1080/23311975.2017.1390818
The DPMO index (number of defects per one million opportunities) and process efficiency are derived from the following relationships:
Given the DPMO value and performance index, the sigma level was calculated using the six sigma table, and the results showed that the current sigma level of “replacing the customer account book” process is equal to:
4.2.3. Analysis phaseIn the analysis phase of the six sigma approach and the DMAIC methodology, we seek to identify and analyze the critical stages affecting the “time needed to replace the customer account book”. This is well illustrated in Pareto chart which is based on the process steps and the amount of time spent on each stage (activity) of the process (Figure 4).
With regard to the results of the Pareto chart, taking into account the importance of each stage in the process of “replacing the customer account book”, it can be concluded that the two stages “en-try of information into the system” and the “revocating and archiving of the old account book” are the most critical stages in the process. The data normality test was performed to check the normal distribution of the data of each stage of the process. The results showed that the distribution of the data related to the critical process stages was normal due to having p-values greater than 0.01. The critical variables that had the greatest impact on the length of the time of the process of “replacing
Pr = 1 − P(Z < 1.34)
Pr = 1 − 0.9099 = 0.0901
DPMO = DPU × 106
DPMO = Pr × 106 =
number of defects
number of oppo
Yield = (1 − Pr) × 100
DPMO = 90, 100
Yield = 90.99%
Sigma Level = 2.84
Figure 3. Capability of the process “replacing the customer account book”.

Page 9 of 16
Bazrkar et al., Cogent Business & Management (2017), 4: 1390818https://doi.org/10.1080/23311975.2017.1390818
the customer account book” were identified by the experts of Ghavamin Bank central branch with the help of the cause and effect graph (Figure 5).
Among the 11 variables presented in the cause and effect graph, 5 variables were identified as the main variables using the brainstorming technique:
First variable (x1): defect in the bank system.
Second variable (x2): failure in the bank system.
Third variable (x3): failure of the necessary tools and devices.
Fourth variable (x4): lack of necessary tools and equipment’s.
Fifth variable (x5): inadequate personnel skills.
In the present study, these five variables are considered as the independent variables (x) and the time taken to perform the process of “replacing the customer account book” is considered as the dependent variable (Y). After identifying the variables affecting the length of the process time, the fuzzy regression technique was used to analyze these variables.
Figure 4. Critical stages affecting the process.
Figure 5. Identifying the critical variables.

Page 10 of 16
Bazrkar et al., Cogent Business & Management (2017), 4: 1390818https://doi.org/10.1080/23311975.2017.1390818
4.2.3.1. Results of fuzzy regression analysis. In order to apply the fuzzy regression technique, first, data related to independent and dependent variables were collected from the statistical population using a questionnaire based on a five-point likert scale. In this regression model, the goal is to find fuzzy coefficients that minimize the fuzzy output range for all data values:
Because there are two types of restrictions for each observation, the total number of restrictions is 2n. In this research, i is the number of independent variables and j is the number of respondents. Also h = 0.5.
After implementing the linear programming model of fuzzy regression in Lingo software, the opti-mal response of the model was calculated as follows (assuming h = 0.5):
s1 = 0.7427, s2 = 0.2313, s3 = −0.1476, s4 = −0.0510, s5 = −0.4655
a1 = 0.0240, a2 = 0.1238, a3 = 0.3654, a4 = 0.2295, a5 = 0.5801
Also, the minimum value of the objective function, namely O, is 33.391 and the fuzzy coefficients are as follows:
With regard to the software outputs, the fuzzy regression model is as follows:
After obtaining fuzzy coefficients, we used the defuzzification of fuzzy weighted average method to obtain the definitive data of the regression model.
In the fuzzy weighted average method, Defuzzification of triangular fuzzy numbers (xl, xm, xu) is performed as follows (Radfar, Hossein, Lotfi, & Khalillo, 2011):
Since the fuzzy numbers in the model of this study are symmetric triangular numbers, then:
O = min
{
p∑
i=1
n∑
j=1
sixij
}
Yj ≥
p∑
i=1
aixij − (1 − h)
p∑
i=1
sixij
Yj ≤
p∑
i=1
aixij + (1 − h)
p∑
i=1
sixij
A1 = (0.0240, 0.7427)
A2 = (0.1238, 0.2313)
A3 = (0.3654,−0.1476)
A4 = (0.2295,−0.0210)
A5 = (0.5801,−0.4655)
Y =(0.0240, 0.7427)x1+ (0.1238, 0.2313)x
2+ (0.3654,−0.1476)x
3
+ (0.2295,−0.0210)x4+ (0.5801,−0.4655)x
5
Xmax =xl + 2xm + xu
4

Page 11 of 16
Bazrkar et al., Cogent Business & Management (2017), 4: 1390818https://doi.org/10.1080/23311975.2017.1390818
As a result, xmax is equal to the value of a, which is the median value in regression fuzzy coefficients. Finally, according to the above relations, the definitive regression model is as follows:
Here, we set y-intercept A0 to zero and it is not used in analysis of the regression results. In fact we want the regression equation to pass the origin. The results obtained from the fuzzy regression model show that all five variables identified by the bank experts affect the process time but three variables (x3, x4, x5) have greater impact. The effect of each independent variable on the dependent variable is provided in Table 4.
4.2.4. Improvement phaseIn the first stage, with regard to the results of the analysis phase, and in order to improve the perfor-mance and increase customer satisfaction by considering the effective variables, using the 12 solu-tions (improvement projects) were proposed using brainstorm technique in order to reduce the process time. Then, in order to select the best improvement project to reduce the process time, im-prove process performance, and improve customer satisfaction, the cross-efficiency model in the data envelopment analysis technique was used. In order to select lean six sigma improvement pro-ject, the appropriate criteria were identified and defined based on the strategic plan of the Ghavamin Bank and the study of previous researches. After reviewing all the criteria, considering the opinions of the experts of the bank, and using the nominal group technique, five criteria were selected:
(1) Cost of improvement project
(2) Project duration (in terms of days)
(3) Cost of low quality service
(4) Customer satisfaction
(5) Sigma level.
In the second stage, after selecting the appropriate criteria, in order to use the cross-efficiency model in the data envelopment analysis technique, the criteria were divided into two groups of in-puts and outputs. Information about the improvement projects was collected in the quarterly ac-counting department of Ghavamin Bank, based on expert opinion (through interviews with the bank’s experts) and database of the organization, within three months after the execution of each project.
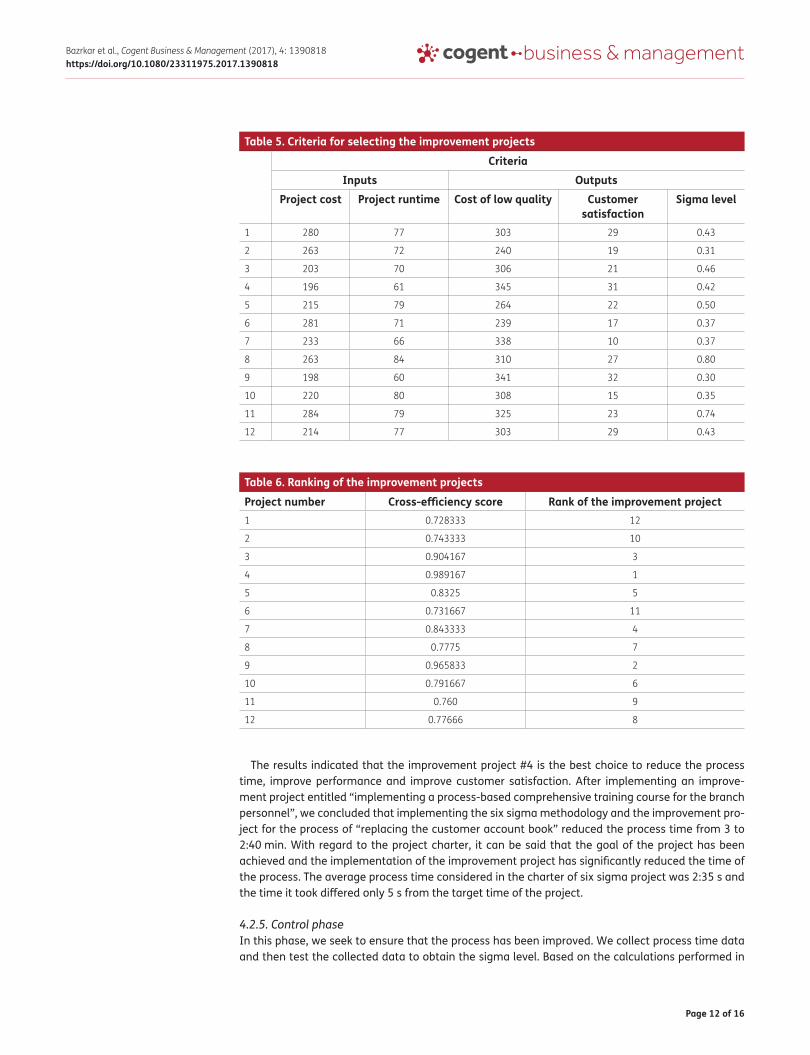
These criteria along with the information collected for each of them are presented in Table 5.
In the third stage, after collecting information about the criteria based on the improvement pro-jects, data analysis was performed using the cross-efficiency model used earlier for selecting the strategic process. The results of the improvement projects’ ranking are presented in Table 6.
xmax =(a − s) + a + (a + s)
4= a
Y = (0.0240)x1 + (0.1238)x2 + (0.3654)x3 + (0.2295)x4 + (0.5801)x5
Table 4. Effect of each independent variable on the dependent variableIndependent variable Effect on the dependent variable RankFirst variable (x1): Defect in the bank system 0.0240 5
Second variable (x2): Failure in the system of the bank 0.1238 4
Third variable (x3): Failure of required tools and devices 0.3654 2
Fourth variable (x4): lack of necessary tools and equipment’s 0.2295 3
Fifth variable (x5): Inadequate personnel skills 0.5801 1
Page 12 of 16
Bazrkar et al., Cogent Business & Management (2017), 4: 1390818https://doi.org/10.1080/23311975.2017.1390818
The results indicated that the improvement project #4 is the best choice to reduce the process time, improve performance and improve customer satisfaction. After implementing an improve-ment project entitled “implementing a process-based comprehensive training course for the branch personnel”, we concluded that implementing the six sigma methodology and the improvement pro-ject for the process of “replacing the customer account book” reduced the process time from 3 to 2:40 min. With regard to the project charter, it can be said that the goal of the project has been achieved and the implementation of the improvement project has significantly reduced the time of the process. The average process time considered in the charter of six sigma project was 2:35 s and the time it took differed only 5 s from the target time of the project.
4.2.5. Control phaseIn this phase, we seek to ensure that the process has been improved. We collect process time data and then test the collected data to obtain the sigma level. Based on the calculations performed in
Table 5. Criteria for selecting the improvement projectsCriteria
Inputs OutputsProject cost Project runtime Cost of low quality Customer
satisfactionSigma level
1 280 77 303 29 0.43
2 263 72 240 19 0.31
3 203 70 306 21 0.46
4 196 61 345 31 0.42
5 215 79 264 22 0.50
6 281 71 239 17 0.37
7 233 66 338 10 0.37
8 263 84 310 27 0.80
9 198 60 341 32 0.30
10 220 80 308 15 0.35
11 284 79 325 23 0.74
12 214 77 303 29 0.43
Table 6. Ranking of the improvement projectsProject number Cross-efficiency score Rank of the improvement project1 0.728333 12
2 0.743333 10
3 0.904167 3
4 0.989167 1
5 0.8325 5
6 0.731667 11
7 0.843333 4
8 0.7775 7
9 0.965833 2
10 0.791667 6
11 0.760 9
12 0.77666 8

Page 13 of 16
Bazrkar et al., Cogent Business & Management (2017), 4: 1390818https://doi.org/10.1080/23311975.2017.1390818
the control phase, the following results were obtained for DPMO index, efficiency, and sigma level of the process of “replacing the customer account book”:
As the results of the control phase show, it can be concluded that the implementation of the project has improved the sigma level of the process of “replacing the customer account book”. In order to document the activities related to the improvement of supervisory, educational, and standardiza-tion activities, the control phase was developed as shown in Table 7. This table, as a process control document, shows how the process can be controlled and improved. For example, organizing an an-nual process-based learning course in relation to the accounting department processes that had not previously been in the bank’s education system will be considered after the implementation of the improvement project as a regulatory standard in the bank’s training system.
4.3. Assessment of the study objectives using BSCThe main objective of this research was to design a total quality model to align strategy, improve performance, and customer satisfaction in Qavamin Bank using a combination of six sigma and bal-anced scorecard approaches. In order to accurately measure the objectives of the model, three hy-potheses were proposed.
4.3.1. Hypothesis’s
• Using the combination of lean six sigma and balanced scorecard approaches in Ghavamin Bank will lead to strategy alignment.
• Using the combination of lean six sigma and balanced scorecard approaches in Ghavamin Bank will improve performance of processes.
• Using the combination of lean six sigma and balanced scorecard approaches in Ghavamin Bank will improve customer satisfaction.
4.3.2. Assessment of the research hypothesisThirty two individuals from the managers and experts of the bank were selected as sample from the statistical population and a questionnaire was distributed among them. The reliability of the ques-tionnaire was measured by Cronbach’s test. The result of this test is presented in Table 8.
DPMO = 83, 800
Yield = 91.62%
SigmaLevel = 2.88
Table 8. Cronbach’s alpha testCornbrash’s alpha N of items0.795 18
Table 7. Documenting the improvement activitiesCharacteristic under control The standard of supervision Data recording methodsTraining the staff of the bank branch Organizing an annual process-based
learning courseControl and registration in the educa-tion system
Controlling the improvement paths and skills of personnel
Time to complete the process Maximum 2:40 s after customer acceptance
Control in the bank queue system

Page 14 of 16
Bazrkar et al., Cogent Business & Management (2017), 4: 1390818https://doi.org/10.1080/23311975.2017.1390818
One-sample t test was performed using SPSS software to analyze data. The one-sample t test, which is the simplest type of t test, is performed to answer the question whether the observed mean of a sample randomly selected from the population is equal to the assumed mean. The Kolmogorov–Simonov test (K-S) was used to measure the normality of the data. In this test, if the decision crite-rion (p-value) is more than 5%, the distribution of data is normal. Regarding the obtained values, the normality of the data was confirmed. The result of this test is presented in Table 9.
After assessing the normality of the data, one-sample t test was used to measure the research hypotheses. Here, the main purpose of measuring the research hypotheses is to answer the main research question, namely whether the combined approach of the six sigma methodology and the balanced scorecard has been able to achieve strategic alignment, improve process performance, and increase customer satisfaction. The results of the test are presented in Table 10.
T test calculated values for these hypothesis’s are 3.53, 3.48, and 3.66, respectively, which are greater than the values calculated in test 3. With regard to the fact that the calculated value of t is greater than the value presented in the table and the test significance (0.000) is less than 0.05, we can say that, with a probability of 0.95, all three research hypotheses are accepted. The results of the hypothesis test showed that the model designed in this study achieved all three of its objectives, namely, strategic alignment, performance improvement, and customer satisfaction.
5. Research suggestionsConsidering that the concepts of process structure and reducing customer waiting time were used in the present study for strategic alignment, it is suggested that the managers of the bank use the results of this research. Managers can enhance the performance and improve the process of “replac-ing the customer account book” by implementing a comprehensive lean six sigma and applying designed total quality model. The result of the implementation of the six sigma methodology and the use of the comprehensive quality model is the same as the study of the use of six sigma in the hospital information department by Bhat and Jnanesh (2013) the use of this methodology has led to a reduction in the process time and improvement of the process sigma level.
Table 9. One-sample Kolmogorov–Smirnov test
aTest distribution is Normal.bCalculated from data.cLilliefors significance correction.
Strategic alignment
Improve the process
performance
Enhance customer satisfaction
N 32 32 32
Normal Parametersa,b Mean 3.5321 3.3818 3.2625
Std. deviation 0.60715 0.51524 0.61612
Test statistic 0.163 0.228 0.184
Asymp. sig. (2-tailed) 0.189c 0.167c 0.103c
Table 10. One-sample t test results for assessing the hypothesisHypothesis’s T Degree of
freedomSignificance Mean
difference from test
value
95% Confidence interval for mean difference
Lower limit Upper limit
Hypothesis 1 32.868 31 0.000 3.53125 3.3121 3.7504
Hypothesis 2 37.099 31 0.000 3.48281 3.1968 3.5668
Hypothesis 3 28.479 31 0.000 3.66677 3.4041 3.9293

Page 15 of 16
Bazrkar et al., Cogent Business & Management (2017), 4: 1390818https://doi.org/10.1080/23311975.2017.1390818
They can also achieve other goals in this trend. In this research, in order to select the strategic process and select the improvement project of the DMAIC cycle, the data envelopment analysis technique and the cross-efficiency model were used. In the first selection, the process of “replacing the customer account book” was identified as the first process in the ranking of the accounting pro-cesses of Ghavamin Bank. In the second selection, the improvement project of “Implementing a comprehensive process-based training course for the bank branch personnel” was identified to im-prove process performance. The key point of this model was that all processes influence each other in the ranking and calculation of the efficiency score in the ranking of processes and all processes are ranked. In fact, the weakness of traditional models of data envelopment analysis, which shows the simultaneous feasibility of several processes, is resolved in this model. Applying the technique of data envelopment analysis and its results is similar to the application of this technique in the study of selecting six sigma projects: MCDM or DEA? by Yousefi and Vencheh (2016). The results of this study showed that the use of cross-efficiency model can overcome the weakness of the data envel-opment analysis technique in choosing the strategic process and the six sigma improvement pro-ject. It is suggested that managers of organizations and management analysts use this model in their decisions. Using this model, managers can accurately rank the decision-making units without any restrictions. In this study, the convergence of the organization’s strategies in the six sigma methodology was based on a balanced scorecard approach, resulting in the use of a balanced score-card led to the integration of the balanced scorecard and six sigma cards, the results of which were similar to the integrating balanced scorecard with six sigma, which was performed by Heavey and Murphy (2012), showed that using these two approaches would simultaneously bring the organiza-tion into strategic alignment.
FundingThe authors received no direct funding for this research.
Author detailsArdeshir Bazrkar1
E-mail: [email protected] Iranzadeh1
E-mail: [email protected] ID: http://orcid.org/0000-0001-8533-2810Naser Feghhi Farahmand1
E-mail: [email protected] Department of Industrial Management, Islamic Azad
University, Tabriz Branch, Tabriz, Iran.
Citation informationCite this article as: Total quality model for aligning organization strategy, improving performance, and improving customer satisfaction by using an approach based on combination of balanced scorecard and lean six sigma, Ardeshir Bazrkar, Soleyman Iranzadeh & Naser Feghhi Farahmand, Cogent Business & Management (2017), 4: 1390818.
ReferencesAntony, J. (2005). Six sigma for service processes. Business
Process Management Journal, 12(2), 234–248. doi:10.1108/14637150610657558
Antony, J., Leung, K., Knowles, G., & Gosh, S. (2002). Critical success factors of TQM implementation in Hong Kong industries. International Journal of Quality and Reliability Management, 19(5), 551–566. doi:10.1108/02656710210427520
Arawati, A., & Zafaran, H. (2011). Enhancing production performance and customer performance through total quality management (TQM): Strategies for competitive advantage. Procedia Social and Behavioral Sciences, 24, 1650–1662. doi:10.1016/j.sbspro.2011.09.019
Baidoun, S. (2010). Towards an index of comparative criticality: An empirical study of TQM implementation in Palestinian industry. Total Quality Management, 15(1), 127–144. doi:10.1080/1478336032000149144
Bhat, Sh., & Jnanesh, N. A. (2013). Enhancing performance of the health information department of a hospital using lean Six Sigma methodology. International Journal of Six Sigma and Competitive Advantage, 8(1), 34–50. https://doi.org/10.1504/IJSSCA.2013.059776
Brady, J. E., & Allen, T. T. (2006). Six sigma literature: A review and agenda for future research. Quality and Reliability Engineering International, 22(3), 335–367. doi:10.1002/qre.769
Burli, S. B., Kotturshettar, B. B., & Dalmia, R. V. (2012). Multiple performance measures: Six TQM practices. SCMS Journal of Indian Management, January –March, 69–79. doi:10.21474/IJAR01/2248
Byrne, G., Lubowe, D., & Blitz, A. (2007). Using a lean six sigma approach to drive innovation. Journal of Strategy and Leadership, 35(2), 5–10. doi:10.1108/10878570710734480
Charnes, A., Cooper, W., & Rhodes, E. (1978). Measuring the efficiency of decision making units. European Journal of Operational Research, 2(6), 429–444. doi:10.1118.1c367a5c.1503553238.11d40cbb
Das, A., Paul, H., & Swierczek, F. W. (2008). Developing and validating total quality management (TQM) constructs in the context of Thailand’s manufacturing industry. Benchmarking: An International Journal, 15(1), 52–72. doi:10.1108/14635770810854344
Heavey, C., & Murphy, E. (2012). Integrating the balanced scorecard with six sigma. The TQM Journal, 24(2), 108–122. doi:10.1108/17542731211215062
Hes, D. J., & Benjamin, A. B. (2014). Applying lean six sigma within the university: Opportunities for process improvement and cultural change. International Journal of Lean Six Sigma, 6(3), 249–262. doi:10.1108/IJLSS-12-2014-0036
Jain, K. C. (2000). Quality assurance and TQM. Dehli, Khanna, 203–210.
Jun, M., Cai, S., & Peterson, R. T. (2004). Obstacles to TQM implementation in Mexico’s Maquiladora industry. Total Quality Management, 15(1), 59–72. doi:10.5430/ijba.v5n3p117
Kaplan, R. S., & Norton, D. P. (2001). The strategy focused organizations: How balanced scorecard companies thrive in the new business environment (pp. 145–151). Boston, MA: Harvard University Press.

Page 16 of 16
Bazrkar et al., Cogent Business & Management (2017), 4: 1390818https://doi.org/10.1080/23311975.2017.1390818
© 2017 The Author(s). This open access article is distributed under a Creative Commons Attribution (CC-BY) 4.0 license.
Kwak, Y. H., & Anbari, F. T. (2004). Benefits, obstacles and future of six sigma approach. Tec Novation, 20, 1–8. doi:10.1016/j.technovation.2004.10.003
Llusar, J. C. B., Tena, A. B. E., Puig, V. R., & Martín, I. B. (2009). An empirical assessment of the EFQM excellence model: Evaluation as a TQM framework relative to the MBNQA model. Journal of Operations Management, 27, 1–22. doi:10.1016/j.jom.2008.04.001
Niven, P. R. (2002). Balanced scorecard step-by-step: Maximizing performance and maintaining results (pp. 47–51). New York, NY: John Wiley & Sons.
Radfar, R., Hossein, Z., Lotfi, F., & Khalillo, A. (2011). Measuring customer satisfaction using fuzzy logic (Case study: ATMs bank Saderat Iran in Tehran). Marketing Management Journal, 1(2), 25.
Rezaee, G., & AghaSeyedHosseini, S. M. (2011). Twelve steps to develop and implement balanced scorecard and determining the performance indicators (1st ed.). Tehran: Bergapublication.
Sahney, S., Banwet, D. K., & Karunes, S. (2004). Conceptualizing total quality management in higher education. The TQM
Magazine, 16(2), 145–159. doi:10.1108/09544780410523044
Shah, R., Chandrasekaran, A., & Linderman, K. (2008). In pursuit of implementation patterns: The context of lean and six sigma. International Journal of Production Research, 46(23), 6679–6699. doi:10.1080/00207540802230504
Shanmugaraja, M., & Nataraj, M. (2012). Total performance excellence – a model to implement six sigma in service organizations. International Journal of Six Sigma and Competitive Advantage, 7(2–4), 209–242. doi:10.1504/IJSSCA.2012.053471
Wang, F. K., & Chen, K. S. H. (2010). Applying lean six sigma and TRIZ methodology in banking services. Total Quality Management, 21(3), 301–315. doi:10.1080/14783360903553248
Yousefi, A., & Vencheh, A. H. (2016). Selecting six sigma projects: MCDM or DEA? Journal of Modelling in Management, 11(1), 309–325. doi:10.1108/JM2-05-2014-0036