Embed Size (px)
Citation preview

Total Factor Productivity Growth and the Productivity
Slowdown in the West German Industrial Sector,
1970-1981
By
Douglas Todd
C o n t e n t s : I. Introduction. - II. The Approach . - I I I . Data and Definitions. - IV. Results. - V. Comment s on Capital Productivity. - VI. Concluding Comments . - Appendix.
I. Introduction
I n an earlier paper [Todd, 1985b] a series of annual static productive efficiency indices were estimated for the West Geman manufacturing sector over the 1970-1980 period. Most attention was focused on comparisons
provided by the end years of this particular sample period. However, it was noted that the static productive efficiency frontier for the post oil shock year 1975, when output fell dramatically, had moved outwards to a marked extent and this was another way of illustrating the sharp jolt which the German manufacturing sector had to contend with.
The series of cross-section snapshots yielded by the frontier technique suggested that it would be interesting to look at the German industrial and manufacturing sectors in a more dynamic setting. Thus, the following is an extension of that work, being concerned with the evolution of output, labour and capital over the past decade.
The statistical basis for the exercise again is that provided by the Deutsches Institut ffir Wirtschaftsforschung (DIW) in their detailed publica- tion [Krengel, 1982]. The period covered is 1970-1981 and related to thirty-five industries of the manufacturing and mining sectors.
II. The Approach
The analysis here is set in the familiar growth accounting framework which places emphasis on the relative contributions of factor inputs to total
Remark: The author is a Senior Economic Adviser in H.M. Treasury, London, on special leave as Economic Adviser in the Directorate-General for Economic and Financial Affairs, European Commission, Brussels. The views expressed are his alone and are not necessarily those of the two institutions mentioned. He is indebted to Aristotelis Margos for providing computational and programming assistance, also to an anonymous referee for helpful comments.
For a comparative analysis at the broad sectoral level for France, West Germany, Italy and the United Kingdom [see Todd, 1985a].

Total Factor Productivity Growth 109
(1) (2)
Hence:
VFPg = Vg - Kg - s , (Lg - Kg) (3)
or alternatively
TFPg = Vg - Lg - s n (Kg - Lg) (4)
where TFPg = growth of total factor productivity, TFIg = growth of total factor input, Vg = growth of output, Lg = growth of labour input, Kg - growth of capital input, sw = share of labour income, sr~ = share of profits.
output growth with reference to a base year ~. Any differences or "residual" factors not accounted for are usually referred to as total factor productivity (TFP). This can be expressed in numerous ways as is well known but a convenient summary description is provided by the following:
TFPg = Vg - TFIg
TFIg = Sw Lg + (1 - Sw) Kg
The basis for the above being a Solow-type production function with Hicks-neutral technical progress of the form V = A (t) F (L, K).
One can have different views about approaches to problems of this kind. In particular, some may hold a preference for a direct production function approach, and which might be regarded as a more conventional methodology. Of course, within the growth accouhting framework, although there is an underlying function which relates output to inputs, one does not have to set this out explicitly. In place of formal statistical estimation of parameters, the exercise becomes one of the appropriate arithmetic. Recent advances in the theory and estimation of production functions have yielded highly flexible forms which in principle at least, can encompass a wide range of production technologies. On the other hand, there remains a serious problem of how inherently awkward and rather complicated a priori notions of technology might be written down and this problem is present at both aggregated and disaggregated levels. One can pose the two questions: what is an aggregate technology and how can disaggregated technologies be specified in detail?
Such points as these apply equally to the growth accounting approach and it is largely because of this and the fact that eleven annual observations only are available which has tipped the balance of judgement in favour of the route chosenL
As noted, the method summarised in (1)-(4) implies that the TFP term is
The author is influenced also by a series of highly perceptive points in Varian /1978, pp. 118-1281.
110 D o u g l a s Todd
in the nature of a residual item which has given cause for much controversy. It can be argued that this residual arises from the fact that the labour and capital inputs may not be correctly specified, or that other inputs are omitted. On the first of these, once this is done, the technical knowledge or progress interpretation of the residual can be greatly reduced and indeed, can come close to disappearing, which implies that advances in knowledge become embodied in the factor inputs. A view to the contrary would be that events such as educational improvements, inventions and so on are not part of standard factor inputs and are properly a part of total factor productivity a. On the second point, the importance of energy as a factor input has been stressed recently and whilst the two-factor approach does not accommodate this, more is said on the matter at a later stage.
In summary, the interpretation of TFP, rather like the production function issue discussed above, rests partly on the taste of the researcher and reader. Those who prefer to call TFP the effects of omitted elements will no doubt continue to do so.
IIl. Data and Definitions
The basic data are extracted from the DIW publication as stated earlier. Here, output volume is defined as gross value added. The labour input is numbers employed with the volume of capital defined as gross fixed assets. The price base is that at 1976. 4
Factor shares present a problem. Since 1976 is the price base, that year gives an estimate of the share of wages and salaries in gross value added. This does not, however, include all labour costs such as social security payments and so on. In order to come closer to an acceptable figure for s,, the wage and salary share was grossed up by 25 per cent to take some account of these other costs 5. This procedure certainly is arbitrary and cannot be expected to hold for all sectors in the sample. Thus it is at best something of a gesture, the absence of which would lead to unrealistically high measured profit shares in the total product.
The factor share base therefore is that in the mid-year of the sample period. Thus the implicit question posed in this procedure is what evolution of total factor productivity, total factor input and factor substitution emerges if both labour and capital are assumed to have received payments in relation to their relative marginal products in the base year 1976.
a The literature here is huge but a good presentation of what might be termed crudely the ]orgenson and Griliches, and Denison views are presented fully in Kennedy and Thirlwall [1972].
4 A full discussion on definitions of factor inputs is in Todd [1985b].
5 The author here followed a suggestion from Prof. Rolf Krengel made in private correspondence and which was offered as an indicator only.
Total Factor Productivity Growth 111
The sectors of German industry to which the analysis applies are three industries in mining, together with thirty-two industries in manufacturing, that is thirty-five in all. The broad groups can be summarised:
Sector
Mining Manufacture of basic products Manufacture of capital goods Manufacture of consumer goods Food, drink and tobacco Manufacturing total Mining plus manufacturing
Number of Industries
3 11 10 10
1 32 35
IV. Results
1. A g g r e g a t e d S e c t o r s
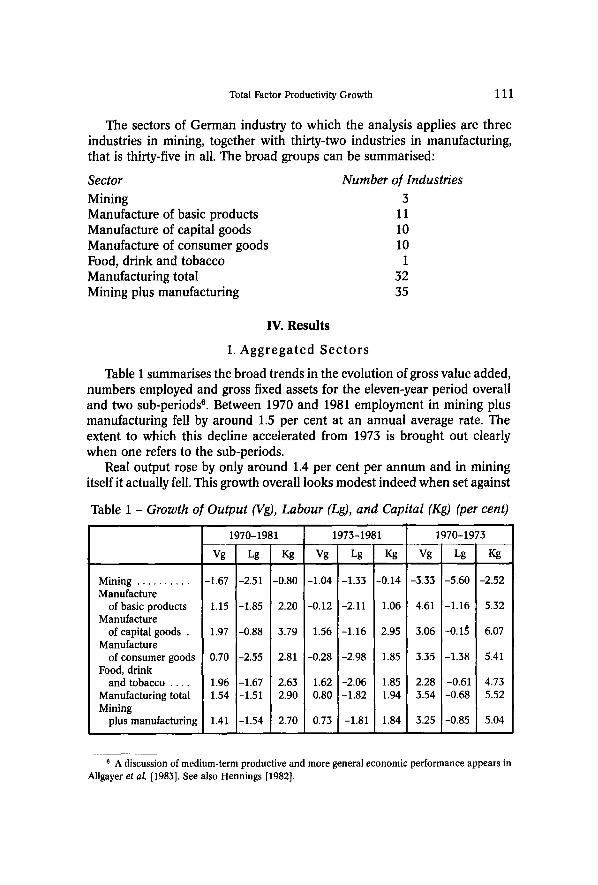
Table 1 summarises the broad trends in the evolution of gross value added, numbers employed and gross fixed assets for the eleven-year period overall and two sub-periods 8. Between 1970 and 1981 employment in mining plus manufacturing fell by around 1.5 per cent at an annual average rate. The extent to which this decline accelerated from 1973 is brought out clearly when one refers to the sub-periods.
Real output rose by only around 1.4 per cent per annum and in mining itself it actually fell. This growth overall looks modest indeed when set against
Table 1 - Growth o
Mining Manufacture
of basic products Manufacture
of capital goods . Manufacture
of consumer goods Food, drink
and tobacco Manufacturing total Mining
plus manufacturing
Output (Vg), Labour (Lg), and Capital (Kg) (per cent)
1970-1981
Vg Lg Kg
-1.67 -2.51 -0.80
1.15 -1.85 2.20
1.97 -0.88 3.79
0.70 -2.55 2.81
1.96 -1.67 2.63 1.54 -1.51 2.90
1.41 -1.54 2.70
1973-1981
Vg Lg Kg
-1.04 -1.33 -0.14
-0.12 -2.11 1.06
1.56 -1.16 2.95
-0.28 -2.98 1.85
1.62 -2.06 1.85 0.80 -1.82 1.94
0.73 -1.81 1.84
1970-1973
Vg Lg Kg
-3.33 -5.60 -2.52
4.61 -1.16 5.32
3.06 -0.1~ 6.07
3.35 -1.38 5.41
2.28 -0.61 4.73 3.54 -0.68 5.52
3.25 -0.85 5.04
6 A discussion of medium-term productive and more general economic performance appears in Allgayer et al. [1983]. See also Hennings [1982].

112 Douglas Todd
the 1960-1973 period, for example, when manufacturing output rose by over 5 per cent at an annual rate. Between the first three years of the last decade, the figure still averaged some 3.5 per cent per annum. Again, the sub-periods indicate the weakening of industrial output growth through the 1970s.
Turning to productivity growth, one can deduce from Table 1 that the growth of output per head averaged around 3 per cent for manufacturing as a whole over the complete period but fell by around one half a per cent on average from 1973 onwards. The biggest reductions in both output and output per head took place in manufacture of basic products.
Throughout the sample period, the capital stock rose at a marked rate. This is particularly noticeable in the early years, 1970-1973, with mining being the only exception. It is therefore not surprising to observe that output per unit of capital fell over the decade. There was, however, a moderation in this rate of decline from 1973 onwards due to the much depressed growth of output volume. By the same token, we observe relatively large increases in capital per man with the same general sort of slowing down in the rate of increase after 1973. Even so, the capital and consumer goods sectors still experienced annual increases in capital per head in excess of 4 per cent.
The summary picture presented therefore is one where following two oil price shocks and depressed conditions in the world economy, both output and employment growth decelerated, presumably leaving increasing propor- tions of the capital stock as conventionally measured unutilised. Thus the capital/output ratio rose. What is interesting to note also is that throughout this period, the stock of fixed assets continued to grow at a rate of around 1.8 per cent per annum and this point will be taken up later.
In Table 2, the identity expressed in (1) is given with output growth decomposed into total factor input and the residual term which is here termed total factor productivity. The 1976 factor share weights used in the construction of the TFI and TFP indices are:
Mining Manufacture of basic products Manufacture of capital goods Manufacture of consumer goods Food, drink and tobacco Manufacturing total Mining plus manufacturing
Sw Sn
0.69 0.31 0.56 0.44 0.76 0.24 0.74 0.26 0.40 0.60 0.66 0.54 0.66 0.34
What the figures in Table 2 suggest is that on average, the factor share weighted fall in employment over the decade has been sufficient to outweigh the growth of capital and output such that in all but two of the groupings, total factor input is negative. In the capital goods industries, labour and capital growth explains 12 per cent of total output growth. It is in the food

Total Factor Product iv i ty G r o w t h 113
Table 2 - Growth of Output (Vg), Total Factor Input (TFIg), Labor Productivity ((V/L)g), Total Factor Productivity (TFPg), and Capital~Labour
Substitution (So(K/L)g) (per cent)
Mining Manufacture of basic products
Manufacture of capital goods
Manufacture of consumer goods
Food, drink and tobacco
Manufacturing tota Mining plus manufacturing
1970-1981
Vg TVlg TVPg (V/L)I S n K/L)
-1.67 -1.98 0.31 0.84 0.53
1.15 -0.07 1.22 3.00 1.78
1.97 0.23 1.74 2.85 ! 1.11
0.70 -1.13 1.83 3.25 1.42
1.96 0.91 1.05 3.20 2.58
1.54 -0.02 1.56 3.05 1.49
1.41 -0.13 1.54 2.96 1.42
1973-1981
Vg TFlg TFPg IV/L)~ S n ~K/L)
-1.04 -1.12 -0.08 0.29 0.37
-0.12 -0.71 0.59 1.99 1.40
1.56 -0.18 t.74 2.72 0.98
-0.28 -1.71 i 1.43 2.70 1.27
1.62 0.28 1.34 3.68 2.34
0.80 -0.55 1.35 2.62 1.27
0.73 -0.59 1.32 2.54 1.22
1970-1973
Vg TFlg TFPg (V/L)g S n K/L)g
3 33 ~[..64 1.31 2.27 0.96
4.61 1.69 2.92 5.76 2.84
3.06 2.32 1.74 3.21 1.47
3.35 0.42 2.93 4.73 1.80
2.88 2.59 0.29 3,49 3.20
3.54 1.40 2.14 4.22 2.08
3.25 1.13 2.12 4.09 1.97
industries only that these conventional inputs account for a significant proportion of total output over the period, the figure being 46 per cent. For manufacturing taken as a whole, total factor productivity growth as measured, accounts for the whole of the recorded increase in output.
In the sub-period 1973-1981, this picture is emphasised even more with three groups recording declines in total factor input which exceed the fall in growth of real output. However, in both capital goods and food sectors, total factor productivity growth increased or was maintained as compared with the total sample period.
In sharp contrast, the earlier period 1970-1973 presents a picture in which all sectors but mining registered a positive growth of total factor input. In addition, with the same exception of mining as before, the growth of total factor productivity was below that of output as a whole, the total industry average contribution being of the order of 65 per cent. The range, however, is considerable.
Table 2 also breaks down the contribution to the growth of output per head into the two components, total factor productivity growth and the growth of factor substitution (see (4)). For manufacturing and all industry over the whole period, factor substitution in favour of capital (capital deepening) accounted on average for about one half of the increase in real output per employee. That is to say within this particular scheme of thinking, movements around the implied production function occurred at about the same rate as shifts in this function. This is true also of the 1970-1973 sub-period.
The summary figures in Table 3 below show the relative contribution of Weltwirtschaftliches Archiv Bd. CXXIV. 8

114 Douglas Todd
Table 3 - Growth in Output per Head (per cent)
(V/L)g S.(K/L)g TFPg
(V/L)g S.(K/L)g TFPg
1970-1973 1975-1981 Difference
4.09 1.97 2.12
4.22 2.08 2.14
mining plus manufacturing 2.54 1.22 1.32
manufacturing 2.62 1.27 1.55
1.55 0.75 0.80
1.60 0.81 0,79
total factor productivity growth and capital deepening to this decline between the two sub-periods. We see that in both instances the simple growth accounting computations suggest a comparable contribution from the two components.
Within the manufacturing sector, there is a good deal of variability. In capital goods, for example, comparing the sub-periods, changes in output growth are closely matched by changes in factor substitution so leaving total factor productivity growth unchanged. In the food industries, on the other hand, comparing 1970-1981, output growth remained unchanged, whereas factor substitution fell which increased total factor productivity growth in the 1973-1981 period.
Thus, what Tables 1, 2 and 3 indicate is that although output per head rose on average by around 3 per cent between 1970 and 1981, the rise in the capital/labour ratio, or fall in capital productivity was such that total factor productivity as represented here, rose at about one half of this rate, that is around 1.5 per cent per annum. From 1973 onwards, this rate of increase began to slacken in nearly all sectors, although as stated already, there was a lot of variation.
2. Disaggrega ted Resul t s
The major series together with calculations of total factor productivity and total factor input growth for each of the 55 industry groups are set out in the detailed Appendix Tables A1-A4. Table A4 is analogous to the aggregated Table 3 in the main text with the difference between growth of output per head in the 1970-1973 and 1973-1981 periods divided into that part associated with changes in total factor productivity and that part associated with changes in capital deepeningL
Further tables concerning the sub-periods can be obtained from the author.

Total Factor Productivity Growth 115
Looking at Tables A1, A2 and A3, we see that 19 out of 35 industries recorded output growth of below 1 per cent per annum over the whole period, this became 22 when the sub-period 1973-1981 is considered and 12 for 1970-1973. Some sectors, however, aerospace, office machinery, plastics and cellulose, for example, continued to maintain high growth rates of net output. Employment growth was negative in the great majority of industries throughout, whereas the capital stock tended to expand rapidly in virtually all sectors. Thus, the steady fall in output per unit of capital was widespread. In some industries the decline was dramatic.
The tables display a variable pattern of growth in total factor productivity. Although average growth of total factor productivity between 1970 and 1981 was around 1.5 per cent as we have seen, the range varied from 5.6 per cent per annum in timber industries to minus 2 per cent in leather goods manu- facture. This is reflected in part in the equally variable pattern which emerges in the annual growth of output per head. One can see, however, that from 1973 onwards, the rate of growth of TFP slowed down.
Taking the Appendix Tables together, the clear impression is that increases in output per head through the decade which have tended to average around 3 per cent per annum, have been offset largely by relatively sharp reductions in output per unit of capital such that total factor productivity growth has been either limited or negative. In other words, for many industries, the measured contribution of total factor input over the whole period apparently was negative. The reduction in employment, together with the increase in the capital stock when weighted together produce the effect:
TFIg=SnKg+ ( 1 - S ) L g < 0
This is in contrast with the first three years of the period when one third of the sample industries registered this characteristic. Nevertheless, with the single exception of electrical equipment, the eight industries which show the fastest growth in output per head for example in the 1970-1981 period show the most rapid growth of total factor productivity.
The differences in growth of output per head shown in Table A4 illustrate this general tendency in somewhat more detail. These industries which register the biggest reductions in growth of labour productivity, oil and natural gas, chemicals, iron and steel, cellulose, for example, experienced the biggest reductions in total factor productivity growth. In symmetrical fashion, stone, rubber, engineering, office machinery for example, which performed well in terms of output per head, had relatively high total factor productivity growth. Capital deepening, on the other hand, tends to be distributed more unevenly across the various sectors.
8*

116 Douglas Todd
V. Comments on Capital Productivity
One of the more interesting features which has emerged in the above concerns the observed fall in gross value added per unit of capital in all but a small number of the 35 sectors. This has worked in the opposite direction to the recorded increases in output per head, so pulling down the growth of total factor productivity. In turn, this focuses attention on the fact that the gross capital stock has continued to increase at an average compound rate of around 2.75 per cent over the decade. In the post-1973 slowdown, as indicated earlier, the rate of increase was about 1.8 per cent. Indeed, it appears that with the exception of the United Kingdom, the decline in capital productivity in the West German economy has proceeded at a more rapid rate than that in other Community countries [see European Economy, 1981]. Whether this decline is due primarily to depressed demand conditions and a much slower growth of real output, coupled with poor profit expectations or under-utilisation of the existing stock of capital is difficult to say with any degree of certainty. Several points can be made, however.
The very fixity of the capital stock will, in itself, tend to lower average measured capital productivity as the growth of real output declines. But, as lower rates of utilisation continue, the expectation would be that the rate of gross capital accumulation should begin to ease. The figures in Table 2 suggest that the growth of the average capital/output ratio has declined; the industry figure for 1970-1973 being 1.79 as against 1.10 for 1973-1981. Thus some adjustment has occurred a.
The problem arises, however, in the fact that the stock of fixed assets as recorded may not take into account fully changes in economic factors which have occurred through the decade. Two of these are, firstly, the influence of technical progress and, secondly, the possible effects of changes in relative factor prices.
On the first, a crude and approximate indicator of quality of vintage is provided by the DIW "Modernit~itsgrad" variable [Krengel et al., 1982, p. 40] which is the ratio of net fixed to gross fixed volume of capital stock. Thus if net investment is proceeding at a faster rate than is capital consumption, the ratio is increasing in value. If one assumes that technical progress is embodied in new net accumulation, a rise in the stock ratio would indicate an improvement in vintage or quality of the stock available. It need not, however, say anything about the age or time dimension of this stock. To take a much exaggerated and extreme case, if capital consumption and replacement are identical but replacement is literally what it means, then any age structure would be consistent with a stable ratio of net to gross stock. But, if one follows the line of reasoning argued forcibly by, say, Scott [1976], all physical
o See Allgayer et al. [1983, p. 37] for further comments on this.

Total Factor Productivity Growth 117
replacement should be assumed to embody new technology. In this situation, one could find replacement investment or capital consumption exceeding the rate of net new formation (the ratio falling), but quality of the stock improving. The implications one draws from the behaviour of such an indicator are therefore not entirely unambiguous.
What we find is that over the eleven-year sample period, all 32 sectors of manufacturing show a decline in the ratio of net to gross fixed stock capital. But this decline occours for the main part from 1973 onwards. In the remaining three sectors of industry, only two, coal mining and natural gas extraction show an increase. If the more up-to-date methods are thought to be embodied in net accumulation, the inference is that quality of the stock is declining. To the extent that replacement investment has an embodiment dimension also, this will, to some extent, modify such a conclusion.
The following figure graphs the two frequency distributions of the ratio and it can be seen that the profile of "quality" has moved some way towards the 50 per cent level which could correspond to a steady state condition in the particular sense that net and replacement changes are exactly matched. The average for industry as a whole in 1970 was 62.3, 62.1 in 1973 and 56.8 in 1981.
Frequency Distribution of Net~Gross Capital Stock Ratio
198
/ .
t t 1970
/ / ' , I I \ ~
/ k ~ 0.5 Ratio of net to gross
capital stock
One might wish to hypothesise that those sectors which experience the most rapid decline in the value of the ratio would have relatively lower growth of both output and total factor productivity. That is to say, those industries which maintain a more favourable quality structure of equipment will, on average, tend to be the most efficient. A simple scatter diagram relating changes in the ratio and total factor productivity growth revealed no clear average association between the two variables. Nevertheless, having said this, in the manufacturing sector, the extreme cases of those few
118 Douglas Todd
industries which experienced very substantial increases in both output and total factor productivity, experienced also only modest reductions in the above ratio.
Turning next to the time dimension, in the German case, estimates of service life are for the most part calculated from Ministry of Finance published information on tax conventions. Within any feasible administrative framework, however, tax life of asset types must be simplified in structure and this material tends in practice to be supplemented with survey information [Liitzel, 1977].
The average service life of plant and machinery in the German manufac- turing sector as estimated by DIW appears to be about 20 years [Paccoud, 1983], with the range varying from 17 years in metal products to 25 years in the case of food, drink and tobacco. In all sectors, buildings have commonly assumed life of 40 years.
There is some evidence that service lines of productive assets in Germany are being revised downwards [see Paccoud, 1983; Blades, 1983]. If statistical and accounting methods have not incorporated an adjustment for this, the size of the capital stock is likely to be overestimated. In this event, for given output, the decline in capital productivity will, in turn, tend to be overstated. Using the DIW methodology, Paccoud [1983], for example, shows that if capital spending grows at a constant rate of 5 per cent per annum, a shortening of asset life from 30 to 20 years will reduce the existing capital stock by some 18 per cent.
Some simple interpolation based on Paccoud's tables suggest that a shortening of average service life by, say 3 years, reduces the 1981 end-year stock of capital by 9 per cent. Assuming somewhat unrealistically that both output growth and the 1976 profit share remain unchanged, this yields over the sample period a growth of capital productivity in total manufacturing of 0.46 per cent (compared with -1.36 per cent). Total factor productivity growth in 1970-1981 now becomes 2.12 per cent as compared with 1.56 per cent.
Collecting this part of the discussion together, the suggestion is that although the average quality of capital may have been falling, the service life has been falling also. One would expect the former to lower measured capital productivity and hence total factor productivity, whereas for the reasons mentioned above, the latter will work in the opposite direction.
The first effect in several respects is the more awkward one. A decline in quality can be expected to affect the flow of services from the existing stock. However, this sidesteps the question of why such a decline might have occurred. A potentially fruitful approach is that suggested by Baily [1981; 1982]. The degree of shorter-run complementarity between energy inputs and capital is such that the sharp rise in the relative price of energy reduced the worth of the capital asset via the diminished flow in capital services. This in

Total Factor Productivity Growth 119
turn affected both output and productivity growth adversely. The more usual capital stock accounting methods follow some variant of the perpetual inventory method which cannot take adequate account of relative price changes. It calls for caution in interpreting the more common two-factor aggregate production function forms which underlie the growth accounting and other formulations used here.
As to the role and significance of the capital stock in affecting the behaviour of factor productivity it seems clear that both official data and other information point to a substantial fall in capital productivity and a rise in capital per head.It must be presumed that underutilisation of the existing stock has increased, which in a putty-clay scenario one would expect. The net effect has been to reduce total factor productivity growth and the growth of output per head also.
VI. Concluding Comments
The present work looks at the evaluation of both factor and total factor productivity over the past decade. The estimates highlight the significant slowdown in the growth of both output per head and total factor productivity in the post-1973 period and the simple and well-used growth accounting framework produces a broadly even split between capital deepening and total factor productivity growth in explaining the slowdown.
Because the growth accounting approach has embodied in it a Cobb- Douglas type technology and in the exercise here, with factor shares constrained to equal unity, it may be argued that this is unrealistic. In some respects it is. However, the alternative of varying the factor share weights or producing separate and perhaps rather "mysterious" scale contributions to total factor productivity growth has its own disadvantages also. Turner [1983], for example, suggests that in German manufacturing, constant returns to scale offers a reasonable description of production possibilities.
Although output per head has continued to grow at a rate of around 2.5 percent per annum since 1973, capital productivity has declined steadily, albeit at a slower rate than in the years 1970-1973. There are some particular difficulties to be faced when attempting to account for the behaviour of capital productivity growth. Some evidence suggests that actual service lives of assets may be shortening. To the extent that these are not incorporated fully into official estimates of the capital stock, this would reduce the decline in capital productivity. On the other hand, sharp increases in energy prices in an energy/capital specific framework will reduce the flow of capital services and weaken capital productivity growth. The precise balance of argument is difficult to assess although it is hard to avoid the conclusion that some considerable and protracted decline in capital productivity has occurred and this has retarded the evolution of total factor gr6wth.

120 Douglas Todd
Turning to more practical matters, it can be argued that this apparent characteristic of productive behaviour is of some importance. The German economy, like almost all other advanced industrialised nations, has over a long period of time tended to levy taxes on labour but at the same time attempts to subsidise the capital input. Over the recent past, subsidies to particular kinds of investment have risen substantially. There is thus a built-in relative price policy bias in favour of capital deepening or labour saving.
The motives for this are both deep rooted and understandable. There is an almost intuitive belief that new capital automatically embodies the latest knowledge and techniques. Such embodied technical advance contributes automatically to the growth of national output and productivity. In other words, the perception is that normalised future output gains exceed the cost of any subsidy. Whether this really is true or not is extremely difficult to say. Theories abound on the nature of technical progress but whilst there is no shortage of applied work it is fair to say that the importance embodiment as such is by no means a proven case. Indeed, it is well known that a significant part of R and D spending is accounted for by new product innovation which affects the output side of the production relationship.
If one goes back to Table 3 we find that capital deepening accounts for about one half of the decline in output per head. What this really means is that despite the substantial fall in labour productivity, capital/labour substitu- tion has continued to occur at around 50 per cent of its previous rate. Moreover and probably the most important telling point of all, is that the alleged benefits of this have not spilled over into employment; the decline in employment accelerated greatly as Table 1 shows. (One can of course always argue that in the absence of capital deepening, employment would have been even lower.)
The figures in the tables do not prove the particular point of view expressed here, but at a time when all economies in the Western world are seeking an improved growth performance, it is better to have as background those relative price conditions which make for a more appropriate allocation of resources and assist the expansionary phase. It goes almost without saying that such a movement is not an easy thing to achieve.

Total Factor Productivity Growth 121
Appendix Tab le A1 - Growth of Factor Inputs and Factor Productivity,
1970-1981 (per cent)
Vg Lg Kg TFIg TFPg S.(K/L)g
1. Coal mining -2.03 -2.48 -1.22 1 .95 -0.08 0.53 2. Oil and natural gas extraction . . . 0.80 0.55 1 . 6 7 0.85 -0.50 0.74 3. Other mining 0.85 -3.77 -1.42 -3.32 4.17 0.44 4. Oil refineries -0.42 -0.58 1 . 4 8 1 .29 -1.71 1.87 5. Stone, clay, sand etc. 0.00 -2.95 2.20 -1.15 1.15 1.79 6. Iron and steel industries 0.00! -2.28 1 .52 -1.28 1.28 1.01 7. Non-ferrous metals 2.74 -1.62 3.25 -0.3z 3+08 1.28 8. Iron and steel foundries -2.70 -3.97 0.40 -3.00 0.30 0.97 9. Non-ferrous metals foundries . . . . 0.11 -1.09 1 .23 -0.86 0.97 i 0.24
10. Steel drawing and cold rolling mills -0.16 -2.97 0.92 -1.35 1.19 1.62 11. Chemical industry 3.04 -0.47 2.72 0.90 2.14 1.37 12. Sawmills and timber 0.90 -2.76 2.42 -6.53 5.63 -1.97 13. Cellulose, paper and board industry 3.56 -3.40 1 .87 -1.69 5.25 1.71 14. Rubber and asbestos 0.47 -2.47 3.04 -0.81 1.28 1.66 15. Steel forging 0.53 -1.25 2.95 -0.51 1.04 0.74 16. Steel construction 0.49 -0.94 3.25 -1.47 1.96 -0.53 17. Engineering 0.54 -1.11 3.14 -0.13 0.67 0.98 18. Vehicle building and repairs . . . . . 2.17 0.84 3.99 1 . 6 7 0.50 0.83 19. Shipbuilding 0.13 -2.94 1 .88 -2.77 2.90 0.17 20. Aircraft and aerospace 7.35 2.51 9.53 2.34 5.01 -0.17 21. Electrical equipment 2.73 -1.48 4.14 0.07 2.66 1.55 22. Precision engineering -0.27 -1.48 3.85 -1.10 0.83 0.38 23. Metal products 1.25 -1.77 3 .61 -1.44 1.69 1.33 24. Office and data processing
machinery 9.40 -0.97 7 . 5 1 4.10 5.30 5.07 25. Musical instruments, toys, games . -0.97 -1.57 5.22 0.81 -1.78 2.37 26. Fine ceramics -0.67 -1.73 1 .81 -0.76 0.09 0.97 27. Glass industries 2.84 -2.35 4.42 -0.51 3.35 1.84 28. Wood processing 1.63 -0.46 4.42 0.44 1.19 0.90 29. Paper and board 1.94 -1.67 4.19 0.25 1.69 1.92 30. Printing 2.02 -1.27 3.83 0.22 1.80 1.48 31. Plastics manufacturing 6.09 1 . 8 9 7.63 3.19 2.90 1.29 32. Leather and leather products . . . . -3.70 -4.84 -0.53 -1.70 -2.00 3.15 33. Textiles -1.11 5.00 -0.02 -3.61 2.50 1.38 34. Clothing industry -2.29 --4.53 1 .18 -3.11 0.82 1.43 35. Food, drink and tobacco 1.96 -1.67 2.63 0.91 1.05 2.58

122 Douglas Todd
Table A2 - Growth of Factor Inputs and Factor Productivity, 1973-1981 (per'cent)
Vg Lg Kg TFIg TFPg Sn(K/L)g
1. Coal mining -1.21 -1.23 -0.41 0.98 -0.23 0.24 2. Oil and natural gas extraction . . . -1.44 1 . 4 7 1 . 9 3 1 .77 -3.21 0.30 3. Other mining 1.32 -3.33 -1.32 -2.95 ! 4.27 0.38 4. Oil refineries -1.82 -1.32 0.34 0.18 -2.00 1.50 5. Stone, clay, sand etc. -1.17 -4.32 0.75 -2.56 1.39 1.77 6. Iron and steel industries -1.44 -2.41 0.18 -1.73 0.29 0.68 7. Non-ferrous metals 1.61 -2.05 1 .43 -1.14 2.75 0.91 8. Iron and steel foundries -2.44 -3.70 -0.52 -2.99 0.55 0.71 9. Non-ferrous metals foundries -0.02 -0.98 0.68 -0.81 0.79 0.17
10. Steel drawing and cold rolling mills -1.48 -3.47 -0.33 -2.16 0.68 1.31 11. Chemical industry 1.33 -0.46 1 . 8 1 0.51 0.82 0.98 12. Sawmills and timber -0.26 -3.40 1.40 -5.22 4.96 -1.83 13. Cellulose, paper and board industry 3.22 -2.37 1 .62 -1.08 4.30 1.29 14. Rubber and asbestos 0.09 -2.99 0.62 -1.92 2.01 1.08 15. Steel forging 0.82 -1.52 1 .91 -0.91 1.73 0.61 16. Steel construction -0.54 -1.93 2.27 -2.46 1 . 9 2 -0.53 17. Engineering 0.65 -1.15 2.26 -0.36 1.01 0.79 18. Vehicle building and repairs . . . . . 1.67 0.63 3.17 1 . 2 8 0.39 0.66 19. Shipbuilding -0.11 -3.09 1.92 -2.91 2.80 0.19 20. Aircraft and aerospace 7.24 3.61 9.10 3.47 3.77 -0.14 21. Electrical equipment 1.48 -1.97 3.31 -0.51 1.99 1.45 22. Precision engineering -0.25 -1.17 3.61 -0.83 0.58 0.34 23. Metal products 0.77 -2.47 2.49 j -1.26 2.03 1.22 24. Office and data processing
machinery 9.38 -1.14 6.07 3.17 6.21 4.31 25. Musical instruments, toys, games . -1.37 -1.21 4.61 0.83 -2.20 2.04 26. Fine ceramics -1.12 -1.96 1.20 -1.09 -0.03 0.87 27. Glass industries 1.52 -3.05 3.08 ! -1.39 2.91 1.67 28. Wood processing -0.93 -1.71 3.00 -0.84 -0.09 0.87 29. Paper and board 1.06 -1.90 2.65 -0.41 1.47 1.49 30. Printing 1.83 -1.45 3.37 -0.05 1.88 1.41 31. Plastics manufacturing 3.59 0.80 5.90 1 . 9 5 1.64 1.15 32. Leather and leather products . . . . -2.73 -4.10 -1.15 -3.17 0.44 0.92 33. Textiles -2.17 -5.16 J-1.01 --4.00 1.83 1.16 34. Clothing industry. -3.18 -5.53 0.49 ! -4.03 0.85 1.50 35. Food, drink and tobacco 1.62 -2.06 1 . 8 5 0.28 1.34 2.43

Total Factor Productivity Growth 123
Table A3 - Growth of Factor Inputs and Factor Productivity, 1970-1973 (per cent)
Vg Lg Kg TFIg TFPg S,(K/L)g
1. Coal mining -4.19 -5.76 -3.37 -5.06 0.87 0.70 2. Oil and natural gas extraction . . . 7.02 -1.85 1 . 0 0 0.04 6.98 1.88 3. Other mining 1.71 -4.93 -0.41 -5.61 3.90 1.61 4. Oil refineries 3.40 1 . 4 0 4.58 4.28 -0.88 2.88 5. Stone, clay, sand etc. 3.15 0.80 6.17 2.68 0.47 1.88 6. Iron and steel industries 3.97 1 . 9 2 5.22 -0.04 4.01 1.89 7. Non-ferrous metals 5.83 -0.44 8.29 1 . 8 6 3.97 2.30 8. Iron and steel foundries -3.39 -4.70 2.88 -3.01 -0.38 1.69 9. Non-ferrous metals foundries 0.48 -1.39 2.71 0.98 1.46 0.41
10. Steel drawing and cold rolling mills 3.42 -1.64 4.35 0.84 2.58 2.48 11. Chemical industry 7.73 -0.49 5.20 1 . 9 5 5.78 2.44 12. Sawmills and timber 4.08 -1.04 5.19 -3.41 7.49 -2.37 13. Cellulose, paper and board industry 4.47 -6.09 2.54 -3.28 7.75 2.81 14. Rubber and asbestos 1.46 -1.07 9 . 8 1 2.19 -0.73 3.26 15. Steel forging -0.24 -0.54 5.75 0.58 -0.82 1.11 16. Steel construction 3.30 1 . 7 6 5.90 1 . 2 3 2.07 -0.52 17. Engineering 0.26 1 . 0 0 5 . 5 1 0.50 -0.24 1.51 18. Vehicle building and repairs . . 3.49 1.41 6.22 2.66 0.83 1.26 19. Shipbuilding 0.76 -2.55 1 .78 -2.40 3.16 0.15 20. Aircraft and aerospace 7.64 -0.37 10.67 -0.64 8.28 -0.28 21. Electrical equipment 6.16 -0.16 6.42 1 . 6 5 4.51 1.81 22. Precision engineering :-0.33 -2.31 4.52 -1.82 1.49 0.49 23. Metal products 2.50 0.12 6.64 1 . 7 3 0.77 1.61 24. Office and data processing
machinery 9.46 -0.51 11.44 6.63 2.83 7.14 25. Musical instruments, toys, games . 0.10 -2.50 6.87 0.78 -0.68 3.27 26. Fine ceramics 0.56 -1.11 3.46 0.14 0.42 1.25 27. Glass industries 6.43 -0.45 8.06 1 . 9 6 4.57 2.32 28. Wood processing 8.81 2.97 8.29 3.95 4.86 0.98 29. Paper and board 4.34 -1.02 8.41 2.06 2.28 3.09 30. Printing 2.50 -0.76 5.07 0.93 1.57 1.70 31. Plastics manufacturing 13.04 i 4.87 12.40 6.56 6.48 1.69 32. Leather and leather products -6.21 -6.80 1 .16 -4.31 -1.90 2.49 33. Textiles 1.76 -4.54 2.67 -2.54 4.30 2.01 34. Clothing industry. 0.13 -1.83 3 .61 -0.61 0.74 1.22 35. Food, drink and tobacco 2.88 -0.61 4.73 2.59 0.29 3.20

124 Douglas Todd
Table A4 - Differences in Growth of Output per Head ((V/L)g), Capital~Labour Substitution (S,(K/L)g) and Total Factor Productivity (TFPg)
between 1970-1973 and 1973-1981
1. Coal mining 2. Oil and natural gas extraction 3. Other mining 4. Oil refineries 5. Stone, clay, sand etc. 6. Iron and steel industries 7. Non-ferrous metals 8. Iron and steel foundries 9. Non-ferrous metals foundries
10. Steel drawing and cold rolling mills .. 11. Chemical industry 12. Sawmills and timber 13. Cellulose, paper and board industry . 14. Rubber and asbestos 15. Steel forging 16. Steel construction 17. Engineering 18. Vehicle building and repairs 19. Shipbuilding.. 20. Aircraft and aerospace 21. Electrical equipment 22. Precision engineering 23. Metal products 24. Office and data processing machinery 25. Musical instruments, toys, games . . . . 26. Fine ceramics 27. Glass industries 28. Wood processing 29. Paper and board 30. Printing 31. Plastics manufacturing 32. Leather and leather products 33. Textiles 34. Clothing industry 35. Food, drink and tobacco
(V/L)g So(K/L)g TFPg
1.56 11.77
0.86 2.50
-0.81 4.93 2.61 0.05 0.91 3.07 6.42 1.99 4.97
-0.56 -2.05
0.16 -0.53
1.04 0.32 4.37 2.88 1.06
-0.87 -0.55
2.75 0.83 2.31 5.06 2.41
-0.02 0.38
-0.77 3.32
-0.39 -0.19
0.46 1.58 1.23 1.38 0.11 1.21 1.39 0.98 0.24 1.17 1.46
-0.54 1.52 2.18 0.50 0.01 0.72 0.60
-0.04 -0.14
2.52 0.15 0.59 2.83 1.23 0.38 0.65 0.11 1.60 0.29 0.54 1.57 0.85
-0.28 0.86
1.10 10.19 -0.37
1.12 -0.92
3.72 1.22
-0.93 0.67 1.90 4.96 2.53 3.45
-2.74 -2.55
0.15 -1.25
0.44 0.36 4.51 0.36 4.91
-1.26 -3.38
1.52 0.45 1.66 4.95 1.81 0.31 4.84
-2.34 2.47
-0.11 -1.05
R e f e r e n c e s
AIIgayer, Friedemann, et al., Federal Republic of Germany: Medium Term Economic Trends and Problems. Commission of the European Communities, Directorate-General for Econo- mic and Financial Affairs, Economic Papers No. 16. Brussels, June 1983.
Total Factor Productivity Growth 125
Baily, Martin N., "Productivity and the Services of Capital and Labour". Brookings Papers on Economic Activity, Vol. 1, 1981, pp. 1-50.
-, The Productivity Growth Slowdown by Industry. The Brookings Institution, Working Paper. Washington, D.C., October 1982.
Blades, Derek, Service Lives of Fixed Assets. OECD Working Paper No. 4. Paris, March 1983.
Boltho, Andrea (Ed.), The European Economy. Oxford 1982.
Hennings , Klaus, "West Germany". In: Andrea Boltho (Ed.), The European Economy. Oxford 1982, pp. 472-501.
Kennedy, Charles, Anthony P. Thirlwall, "Surveys in Applied Economics: Technical Progress". The Economic Journal, Vol. 82, 1972, pp. 11-72.
Krengel, Roll, et al., Produktionsvolumen und -potential. DIW, Berlin, October 1982.
Liitzel, Heinrieh, "Estimates of Capital Stocks by Industries in the Federal Republic of Germany". The Review of Income and Wealth, Series 23, March 1977, pp. 63-78.
Paeeoud, Thierry, First Report on Fixed Capital Stock. Statistical Office of the European Communities, Working Paper. Luxembourg, December 1983.
Scott, Maurice Fg., "Investment and Growth". Oxford Economic Papers, Vol. 28, 1976, pp. 317-363.
Todd, Douglas [1985a], "Factor Productivity Growth in Four EEC Countries, 1960-1981". Cahiers Economiques de Bruxelles, No. 107, 1985, pp. 279-325.
- [1985b], "Productive Performance in West German Manufacturing Industry, 1970-80: A Farrell Frontier Characterisation". Journal of Industrial Economics, Vol. 33, 1985, pp. 295-316.
Turner, ILE., "A Re-Examination of Verdoorn's Law and its Application to the Manufacturing Industries of the UK, West Germany and the USA". European Economic Review, Vol. 23, 1983, pp. 141-148.
Varian, Hal, Microeconomic Analysis. New York 1978.
Zusammenfas sung : Das Wachstum der Totalfaktorproduktivit~t und die Produktivi- t~itsverlangsamung in der westdeutschen Industrie 1970-1981. - Die Produktivit~itsentwick- lung der westdeutschen Industrie in den 70er Jahren wird im Rahmen einer einfachen Wachstumszerlegung untersucht. F/Jr das Jahrzehnt insgesamt zeigt sich, da8 die Totalfaktor- produktivit~it oder das ,,Residual"-Wachstum und die Substitution zwischen Kapital und Arbeit zu ungef~/hr gleichen Teilen zur Erh6hung der Pro-Kopf-Produktion beigetragen haben. W/ihrend die Totalfaktorproduktivit~it mit einer durchschnittlichen ]ahresrate yon 2,5 vH zunahm, verringerte sieh die Kapitalproduktivit~t im Laufe der gesamten Periode. Hinzu kommt, da]~ die Kapitalausstattung pro Kopf weiterhin anstieg, w/ibrend die Beschfiftigung im Industriesektor zurtickging. Mit anderen Worten: Die Faktorsubstitution hat keine Gewinne in Form zus~itzlicher Besch/iftigung erbracht.

126 Douglas Todd Total Factor Productivity Growth
R6sum6: Croissance de la productivit6 totale des facteurs et l'affaiblissement de la productivit6 dans le secteur industriel ouest-allemand dans la p6riode 1970-1981. - La performance productive du secteur industriel ouest-allemand pendant les ann6es soixante-dix est analys6e dans le cadre simple de r162 accountings,. Pour la d6cade entibre, l'auteur argue que la productivit6 totale des facteurs ou la croissance ,,r6siduelle,, et la substitution capital/main-d'oeuvre expliquent la croissance d'output par tSte plus ou moins h parts 6gales. Pendant que la productivit6 totale des facteurs s'augmenta au taux annuel de 2,5 p.c., la productivit6 du capital tomba pendant la p6riode enti~re. De plus, le capital par t~te continua d'augmenter pendant que l'emploi industriel tomba. En d'autres mots, la substitution des facteurs n'a pas g6n6r6 des gains mesur6s en termes d'emploi additionnel.
Resumen : El crecimiento de la productividad total de los factores y la aminoraci6n de la productividad en el sector industrial de Alemania Occidental, 1970- 1981. - El rendimiento productivo del sector industrial de Alemania Occidental en los afios setenta es analizado en el marco de ,,growth accounting,,. Tomando la d6cada entera la sugerencia que se deriva es que a la productividad total de los factores o crecimiento ,~residual,, y a la sustituci6n de capital y trabajo se les atribuye el crecimiento per c~ipita en proporciones casi iguales. Mientras que la productividad total de los factores aument6 a una tasa anual media del 2,5 %, la productividad del capital disminuy6 durante todo el perfodo. Adem~is, el capttal per c~ipita continu6 aumentando mientras que el empleo industrial disminuy6. En otras palabras, la sustituci6n de factores no gener6 beneficios en t6rminos de empleo adicional.