Embed Size (px)
Citation preview
TORSIONAL VIBRATION OF MACHINE SYSTEMS
by
Ronald L. Eshleman, Ph.D., P.E. Director
Vibration Institute
Clarendon Hills, Illinois
Ronald L. Eshleman is director of the Vibration Institute and a vibration
. con
sultant to industry. His areas of expertise include the design and development of machinery and fault diagnosis and correction. He has published experimental and analytical work in the fields of torsional vibrations, rotor dynamics, shock isolation, and vehicle dynamics. Dr. Eshleman is the technical editor of the Shock and Vibration Digest - a monthly jour
nal containing abstracts of published articles and reports, review articles, and news. He is active in the Acoustical Society of America and the American Society of Mechanical Engineers and serves as chairman of American National Standards Institute Committee S2 and as vice chairman of International Standards Organization Committee TC 108.
ABSTRACT
This paper is concerned with torsional vibration in the design, development, and fault diagnosis and correction of machine systems. The physical behavior of torsional vibrations in shafting systems and sources of torsional excitation are reviewed. The concepts of torsional natural frequencies, critical speeds, resonance, and response (fiJrces, stresses, and motions) are explained. The following methods for modeling and calculating natural frequencies and responses are described: lumped and continuous parameter models, the Holzer method, the modal response method, and direct integration of equations of motion. The solution of a transient torsional vibration problem of a synchronous motor drive system is explained. The measurement of torsional vibration in both the field and the laboratory is described; monitoring and problem correction are emphasized. Systems subjected to torsional vibrations are used to illustrate measuring techniques.
INTRODUCTION
All rotating machinery undergoes some form of torsional vibration. In some cases the vibration cannot be detected without special measuring equipment - even when the level is close to destructive amplitude. Many aspects of torsional vibration are analogous to shaft vibration after the. twisting stiffness and polar moment of inertia have been subs�ituted for the shaft bending stiffness and diametral moment of inertia, respectively. Torsional vibration can be sensed by noise level and vibration (perceptible to touch) when something mediates interaction of the vibration with the ground or gear teeth or coupling jaws unload. Gear sets that are used to alter speeds of power transmission systems allow the interaction of torsional vibration with the ground; slider crank mechanisms in engines and compressors provide the path to the ground in reciprocating machines. If gear boxes and/or reciprocating machines are
13
part of a drive train, therefore, excess noise and vibration can indicate trouble.
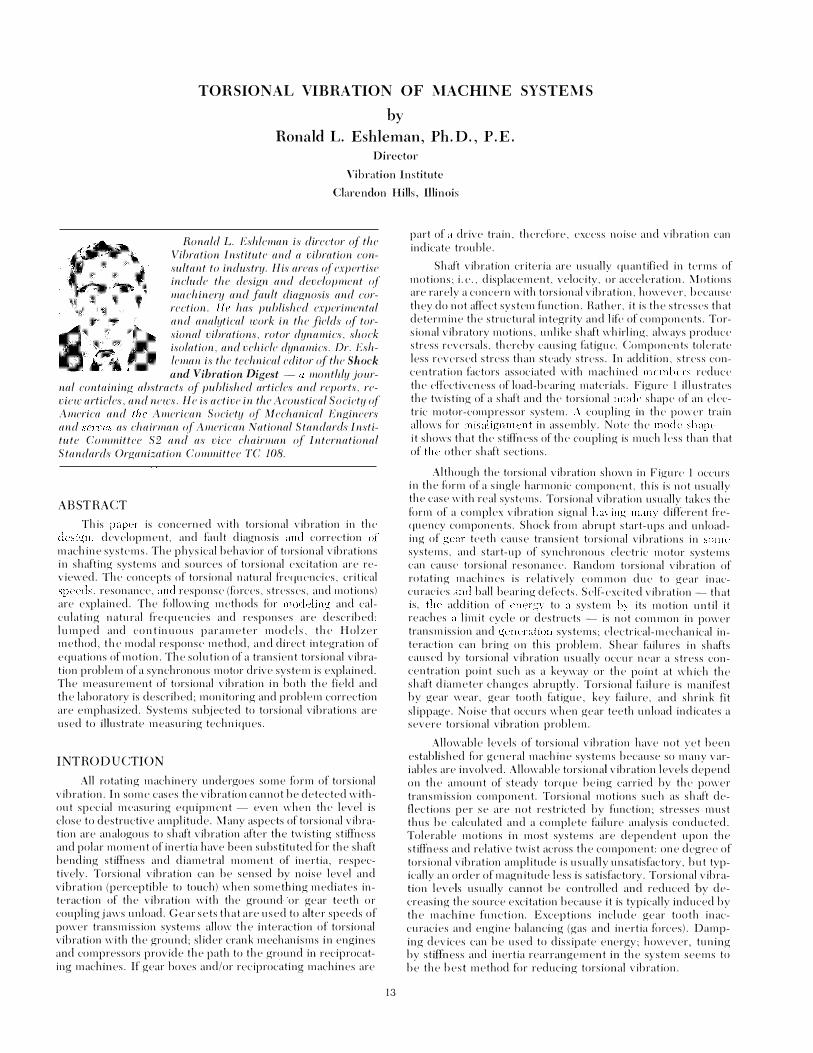
Shaft vibration criteria are usually quantified in terms of motions; i.e., displacement, velocity, or acceleration. Motions are rarely a concern with torsional vibration, however, because they do not affect system function. Rather, it is the stresses that determine the structural integrity and life of components. Torsional vibratory motions, unlike shaft whirling, always produce stress reversals, thereby causing fatigue. Components tolerate less reversed stress than steady stress. In addition, stress concentration factors associated with machined members reduce the effectiveness of load-bearing materials. Figure l illustrates the twisting of a shaft and the torsional mode shape of an electric motor-compressor system. A coupling in the power train allows fi>r misalignment in assembly. Note the mode shape it shows that the stillness of the coupling is much less than that of the other shaft sections.
Although the torsional vibration shown in Figure 1 occurs in the form of a single harmonic component, this is not usually the case with real systems. Torsional vibration usually takes the form of a complex vibration signal having many different frequency components. Shock from abrupt start-ups and unloading of gear teeth cause transient torsional vibrations in some systems, and start-up of synchronous electric motor systems can cause torsional resonanee. Random torsional vibration of rotating machines is relatively common due to gear inaccuracies and ball bearing defects. Self�exeited vibration- that is, the addition of energy to a system by its motion until it reaches a limit cycle or destructs - is not common in power transmission and generation systems; eleetrical-mechanical interaction can bring on this problem. Shear failures in shafts caused by torsional vibration usually occur near a stress concentration point such as a keyway or the point at which the shaft diameter changes abruptly. Torsional failure is manifest by gear wear, gear tooth fatigue, key failure, and shrink fit slippage. Noise that occurs when gear teeth unload indicates a severe torsional vibration problem.
Allowable levels of torsional vibration have not yet been established for general machine systems because so many variables are involved. Allowable torsional vibration levels depend on the amount of steady torque being carried by the power transmission component. Torsional motions such as shaft deflections per se are not restricted by function; stresses must thus be calculated and a complete failure analysis conducted. Tolerable motions in most systems are dependent upon the stiffness and relative twist across the component: one degree of torsional vibration amplitude is usually unsatisfactory, but typically an order of magnitude less is satisfactory. Torsional vibration levels usually cannot be controlled and reduced by decreasing the source excitation because it is typically induced by the machine function. Exceptions include gear tooth inaccuracies and engine balancing (gas and inertia forces). Damping devices can be used to dissipate energy; however, tuning by stiffness and inertia rearrangement in the system seems to be the best method for reducing torsional vibration.
14 PROCEEDINGS OF THE SIXTH TURBOMACHINERY SYMPOSIUM
MODEL
MODE SHAPE
!1 I I PUMP OR COMPRESSOR
Figure 1. Torsional Vibration of an Electric Motor -Compressor Unit.
This paper is an overview of torsional vibration technology and includes engineering guidelines for applying the technology to solving problems. The physical nature of torsional vibration is described, as well as methods for calculation and measurerpent, techniques for measurement and analysis, fault diagnosis and correction, and important design considerations. Practical cases involving electric motors, engines, and compressors are reviewed.
PHYSICAL ASPECTS
Physically, torsional vibration is similar to lateral vibration, after shaft twist has been substituted for shaft bending. Torsional excitations and stress and motion mechanisms, including critical speeds, simple and complex harmonic motions, transient and self-excited motions are described in this section.
Torsional Excitations
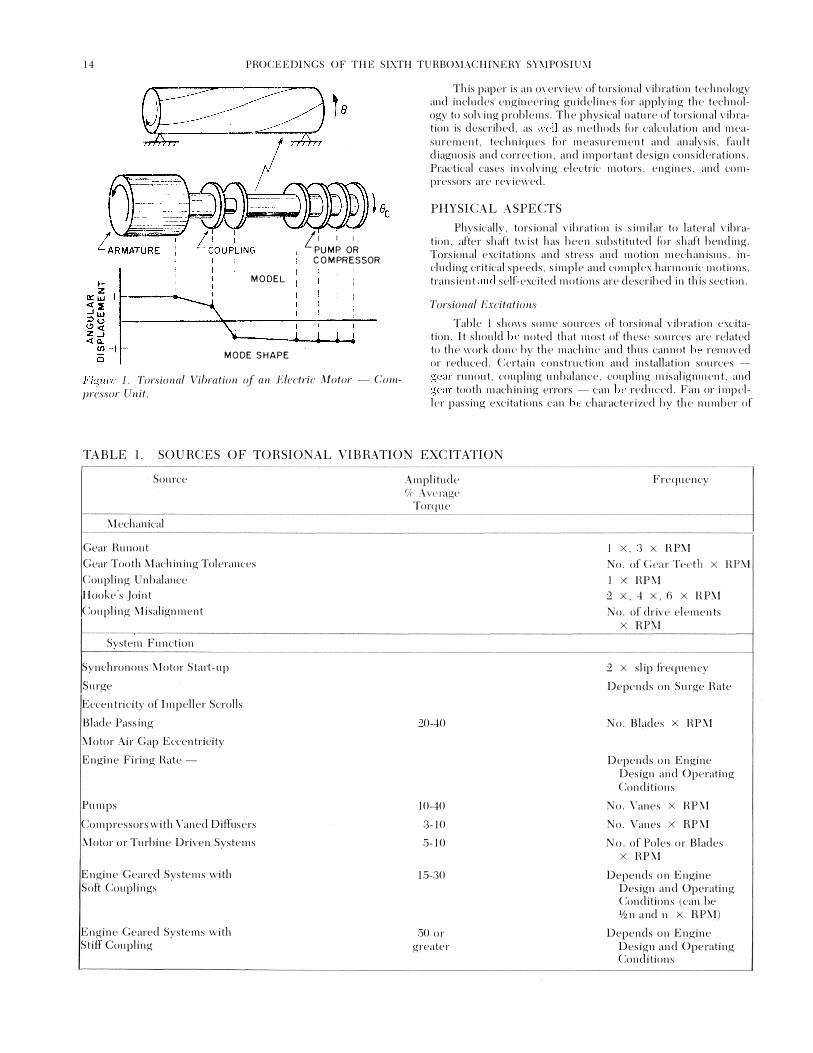
Table l shows some sources of torsional vibration excitation. It should be noted that most of these sources are related to the work done by the machine and thus cannot be removed or reduced. Certain construction and installation sources -gear runout, coupling unbalance, coupling misalignment, and gear tooth machining errors - can be reduced. Fan or impeller passing excitations can be characterized by the number of
TABLE 1. SOURCES OF TORSIONAL VIBRATION EXCITATION
Source
Mechanical
Gear Runout
Gear Tooth Machining Tolerances
Coupling Unbalance !Hooke's Joint
Coupling Misalignment
System Function
Synchronous Motor Sta1t-up
Surge
Eccenhicity of Impeller Scrolls
Blade Passing
Motor Air Gap Eccentricity
Engine Firing Rate -
Pumps
Compressors with Vaned Diffusers
Motor or Turbine Driven Systems
Engine Geared Systems with Soft Couplings
Engine Geared Systems with Stiff Coupling
Amplitude % Average
Torque
20-40
10-40
3-10
5-10
15-30
50 or greater
Frequency
l X, 3 X R PM
No. of Gear Teeth X RPM
I x RPM
2 X, 4 X, 6 X R PM
No. of drive elements x R PM
2 X slip frequency
Depends on Surge Rate
No. Blades X RPM
Depends on Engine Design and Operating Conditions
No. Vanes X RPM
No. Vanes x RPM
No. of Poles or Blades x RPM
Depends on Engine Design and Operating Conditions (can be %n and n X RPM)
Depends on Engine Design and Operating Conditions

TORSIONAL VIBRATION OF MACHINE SYSTE.MS 15
blades or vanes on the wheel: the frequency of excitation equals the number of blades times shaft speed. The amplitude of pulsating torque is often given in terms of percentage of average torque generated in the systems . In more complex cases, engines, for example, the multiple frequency components depend on engine design and power output . The relationship behveen gas harmonics and inertia torque harmonics has a bearing on the level of torsional excitation. Pressure unbalance excitation is a function of inlet pressure sources and extent of casing distortion. The harmonics of torsional excitation from surge (a shock condition) arc dependent on higher than normal pressure for a short time and rate of pressure increase and decrease.
Torsional Response
The components of a typical rotating machine are connected either directly by couplings and shafts or indirectly by gears, belts, and/or other speed-changing devices. When subjected to excitation sources, these massive (polar moment of inertia) and flexible components absorb and dissipate energy and produce a unique pattern of torsional motion called response . Response is rdated to the design of the machine; i. e. , it is an indication of the deflel'lions and stresses to which the system is subjected. Harmonic analysis ean be used to break down response into a group of individual sine curves. Each sine eurve has the following properties: amplitude, phase with respel'l to the response curve, and frequency. These properties allow the curves to be reformed to the original response curve. Phase angles, often not obtained in harmonic analysis, are necessary to reconstruct the response curve .
As with other f{mns of vibration, torsional vibration in machines occurs in characteristic patterns called modes (Figure l). The mode shape is dependent on torsional stiffm·ss (lhin. /rad), polar moment of inertia (lb-in. -see2), and damping (lb-in.-sec/rad) of the various components comprising the system. The vibration frequency at which the mode shape occurs is called the natural frequency. When a natural frequency coincides with an excitation frequency, a state of resonance exists. At resonance the system damping alone controls the motions and stresses in the system.
It has been noted that components of rotating machines cause excitations (Table l) at fi-cquencies that are multiples of shaft speed; it is for this reason that vibration modes can be Pxcitcd by frequencies other than the frequency of the shaft speed. When a shaft-induced excitation corresponds to the fi·equency of any mode of vibration, a special condition of resonance called a critical speed exists. Figure 2 illustrates the critical speed of a machine . Depending on· the excitation sources (Table l), critical speeds can occur at many shaft speeds, particularly in reciprocating machines. The combination of multiple excitations and multiple natural frequenciesthree frequencies are shown in Figure 2 - produce so many critical speeds that it is often difficult to find a safe operational speed range. Note, however, that not all critical speeds are "critical" because of inherent system damping and the level of excitation. Although experience with specific machines enables the engineer to identify important critical speeds, it is best to check the response (stresses) to determine whether or not a machine must be redesigned for safe operation. Note also that the natural frequencies shown for the system in Figure 2 do not change with machine speed. This is unlike lateral vibration.
The torsional vibration response of machine systems is usually complicated by a large number of critical speeds. Unlike lateral motions, however, instabilities and self-excited vibrations are rare with torsional vibration. In some cases the
� u z w :::> 0 w a: LL z Q 1-<t a: Q) >
CRITICAL SPEED
3rdNATURAL FREQUENCY
2nd NATURAL
FREQUENCY
--------- -_,P 1st NATURAL
FREQUENCY
SHAFT ROTATING SPEED (RPM)
Figure 2. Torsional Critical Speeds of Shafting Systems.
coupling of electromechanical components- such as induction motor driven systems - can cause sdf-excited vibrations.
Torsional systems arc susceptib\t> to failures as a result of transient excitation. A rapid starting frequency (often required to prevent overheating eh•ctric motor windings) induces large stn·sscs. In addition, start-ups with synchronous speed motor drives can be disastrous if a torsional resonance is excited. The resonanee is the result of a matching of the synchronous motor excitation and the system torsional natural frequency. The synchronous motor has a large pulsating torque during start-up. The frequency of this pulsation is equal to twice the slip fi·equency, and it varies from twice the line frequency at start-up to zero at synchronous speed. Any torsional critical speeds within this frequency range may be excited during the start-up cycle . Even though the excitation is transient, the pulsating torque may lw strong enough to cause shaft failures after several start-up cycles. In extremely critical situations failure can occur during a single start-up. Sohrc [ l] has analyzed such a failure and documented the corrective action taken. A transient response analysis, conducted prior to equipment installation, allows determination of required system fatigue life. Doughty [2] has published a technique to determine the speed at which a system must be accelerated through critical speed to avoid unacceptable stresses.
CALCULATIONS
Calculations based on mathematical models, whether complex or simple, can be of value in design, development, and fault diagnosis of machines . It has been shown that vibration is dependent on the mass, elastic, and damping properties of the machine. Sources of vibration, called a forcing function, include reciprocating mass and blade passing. The mass and elastic properties determine the natural frequencies of the system and thus the critical speeds. Damping in the form of heat dissipation con trois the vibration levels. Damping is usually most effective at resonance - the level at which a forcing function equals a natural frequency. Table 2 and Figure 3 show some of the nomenclature used in torsional vibration calculations. ] 2 is assumed to be much larger than] 1 that is] 2 is stationary and] 1 vibrates.
16 PROCEEDINGS OF THE SIXTH TURBOMACHINERY SYMPOSIU�1
Jo
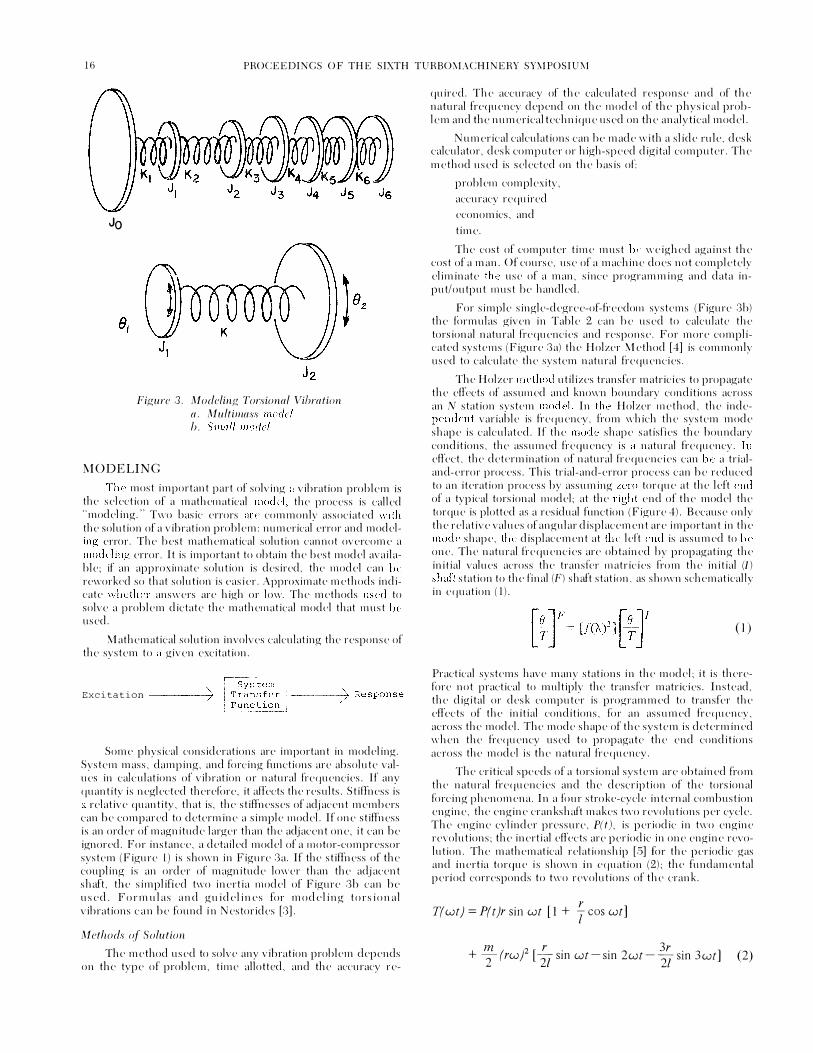
Figure 3. Modeling Torsional Vibration a. Multimass model b. Small model
MODELING
The most important part of solving a vibration problem is the selection of a mathematical model; the process is called "modeling." Two basic errors are commonly associated with the solution of a vibration problem: numerical error and modeling error. The best mathematical solution cannot overcome a modeling error. It is important to obtain the best model available; if an approximate solution is desired, the model can be reworked so that solution is easier. Approximate methods indicate whether answers are high or low. The methods used to solve a problem dictate the mathematical model that must he used.
Mathematical solution involves calculating the response of the system to a given excitation.
Excitation ------7
Some physical considerations are important in modeling. System mass, clamping, and forcing functions are absolute values in calculations of vibration or natural frequencies. If any quantity is neglected therefore, it affects the results. Stiffness is a relative quantity, that is, the stiffnesses of adjacent members can be compared to determine a simple model. If one stiffness is an order of magnitude larger than the adjacent one, it can be ignored. For instance, a detailed model of a motor-compressor system (Figure l) is shown in Figure 3a. If the stiffness of the coupling is an order of magnitude lower than the adjacent shaft, the simplified two inertia model of Figure 3b can be used. Formulas and guidelines for modeling torsional vibrations can be found in Nestorides [3].
Methods of Solution
The method used to solve any vibration problem depends on the type of problem, time allotted, and the accuracy re-
quirecl. The accuracy of the calculated response and of the natural frequency depend on the model of the physical problem and the numerical technique used on the analytical model.
Numerical calculations can be made with a slide rule, desk calculator, desk computer or high-speed digital computer. The method used is selected on the basis of:
problem complexity,
accuracy required
economics, and
time.
The cost of computer time must be weighed against the cost of a man. Of course, use of a machine does not completely eliminate the use of a man, since programming and data input/output must be handled.
For simple single-degree-of-freedom systems (Figure 3b) the formulas given in Table 2 can be used to calculate the torsional natural frequencies and response. For more complicated systems (Figure 3a) the Holzer Method [4] is commonly used to calculate the system natural frequencies.
The Holzer method utilizes transfer matricies to propagate the effects of assumed and known boundary conditions across an N station system model. In the Holzer method, the independent variable is frequency, from which the system mode shape is calculated. If the mode shape satisfies the boundary conditions, the assumed frequency is a natural frequency. In effect, the determination of natural frequeneies can be a trialand-error process. This trial-and-error process can be reduced to an iteration process by assuming zero torque at the left end of a typical torsional model; at the right end of the model the torque is plotted as a residual function (Figure 4). Because only the relative values of angular displacement are important in the mode shape, the displacement at the left end is assumed to be one. The natural frequencies are obtained by propagating the initial values across the transfer matricies from the initial (I) shaft station to the final (F) shaft station, as shown schematically in equation (1).
(I)
Practical systems have many stations in the model; it is theref(>re not practical to multiply the transfer matricies. Instead, the digital or desk computer is programmed to transfer the effects of the initial conditions, for an assumed frequency, across the model. The mode shape of the system is determined when the frequency used to propagate the end conditions across the model is the natural frequency.
The critical speeds of a torsional system are obtained from the natural frequencies and the description of the torsional forcing phenomena. In a four stroke-cycle internal combustion engine, the engine crankshaft makes two revolutions per cycle. The engine cylinder pressure, P(t), is periodic in two engine revolutions; the inertial effects are periodic in one engine revolution. The mathematical relationship [.5] for the periodic gas and inertia torque is shown in equation (2); the fundamental period corresponds to two revolutions of the crank.
T(wt}=P(t)rsinwt [1 + y coswt]
+ m (
)2 [
r . . 3r . 2 rw 2zsm wt-sm 2wt-21sm 3wt] (2)

TORSIONAL VIBRATION OF MACHINE SYSTEMS 17
TABLE 2. NOMENCLATURE F OR TORSIONAL VIBRATIONS
Symbol Unit
frime t sec
Displacement 01 rad
Velocity 01 rad/sec
Acceleration (jl rad/sec'
Spring constant K in-lbh·ad
Damping factor ' dimensionless
Mass 11 lb-in-sec'/rad
Force or torque T = fJ01 in-lb
Momentum f101 in-lb-sec
Impulse Tt in-lb-sec
Kinetic energy V2]10f lb-in
Potential energy V2KO[ lb-in
Work lb-in fTd(J I Natural frequency w,=� rad/sec
Equation of motion Initial conditions Transient responses
Steady state responses
where;
T(wt) P(t)
r =
w
engine crank torque
cylinder pressure
crank radius
connecting rod length
engine speed
m piston mass
time
wt engine crank angle
The cylinder pressure-time values for two engine cycles, wt = 720 deg, are substituted into equation (2); discrete numerical values are obtained for the crank torque as a function of crank angle. A Fourier series expansion, shown in equation (3) is used to generate a mathematical description of the torque vs. crank angle exjJression.
'T''( )
. wt + . + . 3 11 wt = a112 sm 2 a1 sm wt a312 sm 2 wt .... (3)
The constants, a112 , a1, a312, . . . , are determined by a Fourier analysis [6] of the preceding numerical data. This expression represents the engine crankshaft torsional forcing function. The arguments of the harmonic functions indicate that the crankshaft will be forced at frequencies which are multiples (112, 1, 3/2, ... ) in equation (3) are called order numbers. If a natural frequen�y of the system corresponds to any of the forcing frequencies, w/2, w, 3!2w, ... , the engine speed, w, may be a critical speed if insufficient damping is inherent in the system. Equation (4) describes the relationship between engine system natural frequencies, order numbers, and critical speeds.
natural frequency Critical speed = ==..=..:=-=-l:C==-'
order no. (4)
JJ� + 1)� + K� = T0 sin wt 0(0) = 01, 0(0) = Bo
Oc = Ae - ,w,t sin (w,rt + c/J) w,r = Vl- ''w,
e, = <Psin(wt - t/J) To
<P= V(K - ]1 w')' + (1)w)'
There are many critical speeds due to the multiple natural frequencies and order numbers. Because critical speeds are important only when they coincide with engine running speed, only those natural frequencies and order numbers that yield pertinent critical speeds need be considered. In practice the first four natural frequencies are used for the response analysis; it is simple to examine them for critical speeds.
Modal Analysis
Modal analysis [7] is a technique for determining the torsional response of machine systems. The natural frequencies and mode shapes obtained by the Holzer method are used to determine the forced response. Periodic forcing phenomena such as gas and inertia torques of engines and end item pulsating torque are not harmonic and therefore must be changed from periodic to harmonic form.
Modal analysis is applied to torsional models; modal damping and synchronous and nonsynchronous speed forcing phenomena (gas, inertia, and end item torques) are used. The number of natural frequencies (determined by the Holzer method) that are selected depend on the range of forcing frequencies of the problem. A function consisting of a weighted average of the mode shapes (Figure l) is shown in Equation (5).
N 6(x,t) = � fn(x)gn(t)
n=J where:
(J = torsional response
fn normal modes obtained from Holzer method
gn periodic time varying weighting factors
N number of modes
(5)
The periodic time varying weighting factors, gn, are a function of the system forcing functions, the modal damping factors,

18 PROCEEDINGS OF THE SIXTH TURBOMACHINERY SY!vtPOSIU!\1
1-w :J 0 a:: :? ..J <t :J 0 (/) w cr NATURAL
FREQUENCIES
FREQUENCY, W
Figure 4. Schematic Determination of Natural FrecJuencies from a Residual TorcJUe-FrecJuency Diagram.
rotor speed, and system mode shapes. The modal damping values used in this analysis are a function of the mode shapes of the system. !'.1odal analysis is shown schematically in Figure .'5. The modes are uncoupled and the vibration contrib
uted from each mode is calculated as if it were a single
degree-of-freedom system. At <:'ach frequency the results are
sm�med (assuming a linear system) to obtain the system re
sponse.
Pollard [8] has used impedance techniques to solve steady-state and transient torsional vibration problems. Electrical-mechanical analogies are used to develop equations that are solved on the digital computer. Direct integration techniques for determining the transient torsional response of a machine system have been developed by Smalky [9]. Although expensive, direct integration can be used on nonlinear systems; the other methods apply only to linear models. Smalley uses the Newmark 2nd order implicit method because it is cost effective when the system to be analyzed has a wide spread of natural frequencies. The high costs of direct integration force the analyst to minimize the number of degrees of freedom used in the model. Smalley [9] has analyzed the stresses of a large synchronous motor-driven compressor system using direct integration. During start-up the drive torque was found to be about three times normal full-load torque. Reduction of the starting voltage to 84% reduced the maximum torque by more than 20%, and the introduction of a rubber black coupling further reduced the start-up torque to almost full-load torque. A torsional response analysis was used to determine the operating conditions and design changes necessary to achieve reasonable start-up torques in a synchronous motor-driven compressor system.
MEASUREMENT AND ANALYSIS
Torsional vibration is more difficult to measure than lateral vibration because the shaft is rotating. Analytic procedures are similar to those used for lateral vibration. In torsional vibration work the experimentalist is limited to where measurements can be made. Until the past few years the torsiograph had to be connected to the end of a shaft to make measurements. Today torsional response can be measured at intermediate points in a system. Both strains and motions can be measured.
RESPONSE
FREQUENCY
Figure .5. Modal Analysis of the Torsional Vibration of a Machine System.
A test facility, such as that shown in Figure 6, and the instrument panel associated with it (see Figure 7), can be used to measure torsional vibration. This facility is used to measure dynamic stiffness and damping of flexible shaft couplings. A fou r-cylinder gasoline engine is loaded with a bra ke dynamometer and generates the torsional excitation required to obtain the vibration charaeteristics of couplings. The engine speed and dynamometer loads are controlled fi:om the panel with closed loop controllers.
Strain gages are used to measure instantaneous torque on the drive shaft near the engine flywheel and on the dynamometer shaft. The strain gages in this test facility were calibrated to read instantaneous torque from static torque loads. If calibration is not possible, the stresses and/or torques can be calculated from strength of materials theory. Strain gages can be mounted at 45° angles so that shaft bending does not influence torque measurement. In addition, the strain gage bridge can be arranged to compensate for temperature. It is difficult to take a strain gage signal from a rotating shaft. In the facility shown in Figure 6 slip rings are used to obtain the vibration signal from the shaft; wireless telemetry is also available. A small transmitter, mounted on the rotating shaft at a convenient location, broadcasts its signal to a nearby receiver. Strain gages are available in a variety of sizes and sensitivities and can be placed almost anywhere on a shaft. The strain gage signal is processed by the bridge-amplifier unit shown in Figure 7. Test results indicate directly the damage potential of torsional vibration, but cannot be considered a diagnostic method that is easy to use or quick to apply.
Only peak angular vibration is obtained from external torsional vibration measurement, unlike the analog signal ob-

TORSIONAL VIBRATION OF MACHINE SYSTEMS 19
Figure 6. Torsional Vibration Test Facility (Courtesy of Lovejoy, Inc.).
tained from strain gages. The rate of angular motion is measured and integrated by the unit shown in Figure 7. The angular displacement can be measured at the end of a shaft with encoders and at intermediate points with a gear-magnetic pickup arrangement, shown in Figure 6 on either side of the coupling. In faet, the nodal point of a torsional vibration mode is often at the coupling; coupling hubs therefore are excellent locations for measuring torsional vibration. Natural frequency and mode shape calculations should be made before sensors are mounted to avoid placing the pickup at a node. Torsional vibration can be measured at many intermediate points in a system so long as a sensor can he placed on a gear or some other protruding dement. One engineer wrapped a hacksaw blade around a shaft collar.
The broad band torsional vibration signal must be analyzed for individual harmonic components. Waveform
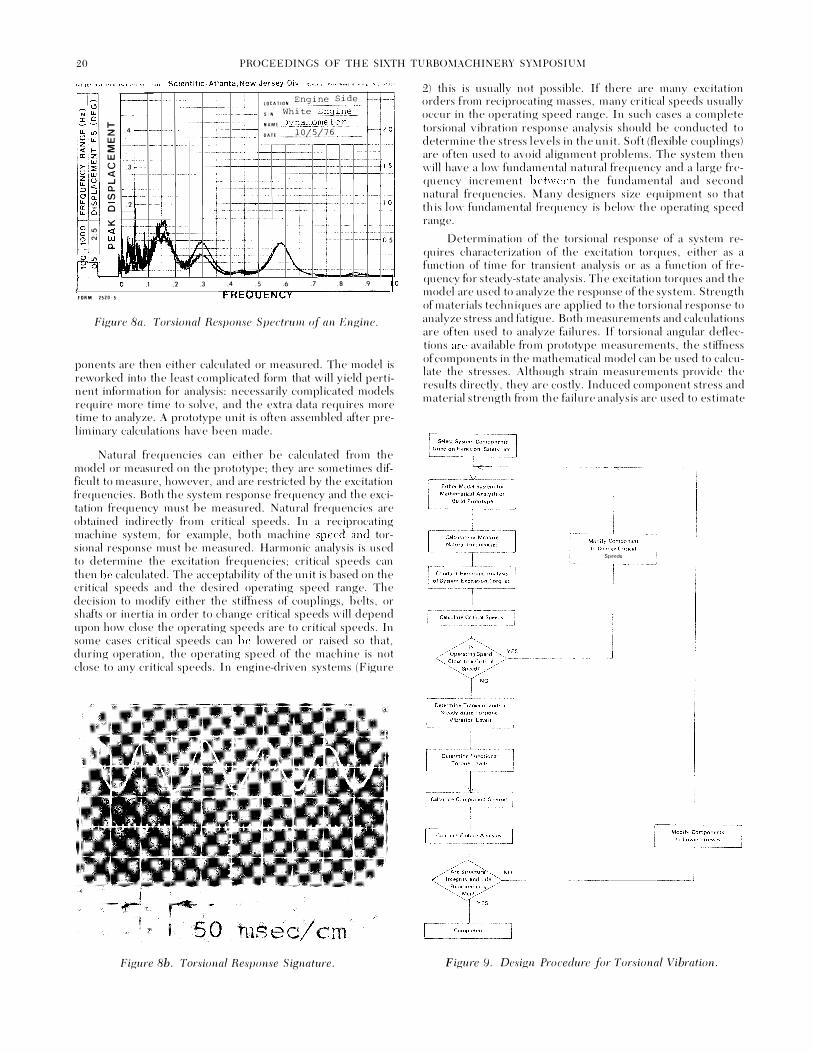
analysis for torsional vibration problems is more difficult than for lateral vibration problems. In fact, a wave analyzer is necessary for diagnostic work on torsional vibration problems. Figure Sa shows a torsional response signature of the test facility (Figure 6). The engine was running at 2, 000 rpm under minimum load. The vibration responses to the one-half order and second order engine excitations are evident at frequencies of 16 .. 5 Hz and 66.6 Hz respectively. The 33 Hz first order signal is due to mass unbalance in the system. The analog signal in Figure Sb is an instantaneous torque measurement. The complex signature reflects the difficult waveform analysis. This signal can be processed in a torsional vibration analyzer unit shown (see Figure 7) to obtain its harmonic content.
DESIGN CONSIDERATIONS
The following criteria are usually considered in the design of power transmission systems: function, structural integrity, safety, life, cost, and maintainability. Torsional vibration is a factor in structural integrity (peak-load capability), life (fatigue due to torsional stress reversals), and cost. Complex vibration dampers or absorbers can be costly. Design criteria for torsional vibration are quantified in terms of stresses: both the stresses attributable to normal peak-load machine function and the stresses arising from torsional vibration must be considered.
Procedures
A design procedure fc>r torsional vibration analysis can be based on measurements or mathematics (see Figure 9). The system components - i.e., motor (drive element) and compressor, pump, or vehicle (driven element)- are selected on the basis of function. The selection of intermediate components such as couplings, belts, and gear boxes is based on normal load capacity (depending on the type of equipment, a service factor is included).
If the system is to be analyzed mathematically, a model is prepared (see Figure 3). The inertias and stiffnesses of all com-
Figure 7. Torsional Vibration Facility Control and Instrumentation Panel (Courtesy of Lovejoy, Inc.).
20 PROCEEDINGS OF THE SIXTH TURBOMACHINERY SYMPOSIUM
-.-1-
��� 1-��� z .4 w ��� � w
Iii� u .3 <( ..J c. I � � en
.2 I U: � c
�- :.0::: �
�-""'
fr- ...
�� .,.
0 .1 .2 fORM l!i20-!i
,
.3
·----
.4
--
LocAtiON Engine Side
SiN l'lhi te Engine NAMf Dynamometer OAT! _ __l_QL�_7 ____ 6 __
·-
� \
1.1
.5 .6 .7 .8 1-l'lt:I..IUt:NI.,;Y
� �
r-r-r-r-
1-
.9
Figure 8a. Torsional Response Spectrum of an Engine.
r-r-r-
[;-a �--
fu
t-ILO
Jo 5
fo
ponents are then either calculated or measured. The model is reworked into the least complicated form that will yield pertinent information for analysis: necessarily complicated models require more time to solve, and the extra data requires more time to analyze. A prototype unit is often assembled after preliminary calculations have been made.
Natural frequencies can either be calculated from the model or measured on the prototype; they are sometimes difficult to measure, however, and are restricted by the excitation frequencies. Both the system response frequency and the excitation frequency must be measured. Natural frequencies are obtained indirectly from critical speeds. In a reciprocating machine system, for example, both machine speed and torsional response must be measured. Harmonic analysis is used to determine the excitation frequencies; critical speeds can then be calculated. The acceptability of the unit is based on the critical speeds and the desired operating speed range. The decision to modify either the stiffness of couplings, belts, or shafts or inertia in order to change critical speeds will depend upon how close the operating speeds are to critical speeds. In some cases critical speeds can be lowered or raised so that, during operation, the operating speed of the machine is not close to any critical speeds. In engine-driven systems (Figure
50 ec/cm Figure 8b. Torsional Response Signature.
2) this is usually not possible. If there are many excitation orders from reciprocating masses, many critical speeds usually occur in the operating speed range. In such cases a complete torsional vibration response analysis should be conducted to determine the stress levels in the unit. Soft (flexible couplings) are often used to avoid alignment problems. The system then will have a low fundamental natural frequency and a large frequency increment between the fundamental and second natural frequencies. rv1any designers size equipment so that this low fundamental frequency is below the operating speed range.
Determination of the torsional response of a system requires characterization of the excitation torques, either as a function of time for transient analysis or as a function of frequency for steady-state analysis. The excitation torques and the model are used to analyze the response of the system. Strength of materials techniques are applied to the torsional response to analyze stress and fatigue. Both measurements and calculations are often used to analyze failures. If torsional angular deflections are available from prototype measurements, the stiffness of components in the mathematical model can be used to calculate the stresses. Although strain measurements provide the results directly, they are costly. Induced component stress and material strength from the failure analysis are used to estimate
Ll Modify Component . toChangi!Crnic�l
Speed' -- �·-
Figure 9. Design Procedure for Torsional Vibration.
TORSIONAL VIBRATION OF MACHINE SYSTEMS 21
component life. If necessary, components are modified to
lower stresses. Such modification can be simple or complicated
- depending on the design constraints. It is not always possi
ble to add inertia or change the stiffness of a component to
correct a problem; in such cases, either a damper, which dissi
pates energy as heat, or an absorber, which manages or rear
ranges the application of energy, must be added to the system.
These procedures are usually costly but often necessary.
Case History of a Motor-Driven Compressor
An induction-motor driven reciprocating compressor sys
tem was to be designed to operate at three speeds: 1,170 rpm,
1, 470 rpm, and 1, 7.50 rpm. Significant excitation occurred in
the reciprocating compressor (Table 3) at 2, 4, and 8 times
running speed. Table 4 shows data for the model in Figure 3a.
The stiffness of the original coupling is very much lower than
anv other stiffness value in the system. It is for this reason that
th� model can be simplified as shown in Figure 3b; the first
natural frequency can be calculated using equation (6). The
inertia values for the model arc the sum of all inertias on each
side of the flexible element, the coupling. The simplified
model has the following characteristics:
] 1 30.1 lb-in. -sec" (motor) k 6.5, 000 lb-in./rad (eoupling)
] 2 1. 09 lb-in. -sec2 (compressor)
fn = 39.6 Hz
(6)
The natural fi·equency of 39.6 Hz is dose to the 39 Hz ex
citation obtained from the second order vibration excitation at
1,170 rpm (Table 3). The relative torsional vibration measured
across this coupling dming operation of the unit at 1, 170 rpm
was 2. 26 degrees. Multiplication of the torsional vibration by
the coupling stiffness gave a value f(Jr vibratory torque of2,.560
lb-in. The peak load torque requirement was about 4,000 lh-in.
f(Jr this unit and the coupling load rating was 7, 000 !b-in.; both
the natural frequency calculation and the response measure
ment showed that the coupling would filii.
A stiffer coupling (k = 349, 370 lb-in./rad) with a slightly larger rating (8400 !b-in.) was used. Note that the simple natural frequency formula is still valid because the coupling stiffness is an order of magnitude less than any other stiffness in
TABLE 3. MOTOR-CO MPRESSOR F ORCING FREQUENCIES
Forcing Speed Frequency (rpm) Order (Hz)
1, 7.50 8 233
4 117
2 58
1, 470 8 196
4 98
2 49
1,170 8 156
4 78
2 39
the system. This coupling had a half inertia value of .47 lb-in.see. The calculated natural frequency was 91. Hz - close to the 98 Hz excitation obtained from the fourth order at 1,470 rpm. Measurements revealed .15 degree relative torsional vibration across the coupling, which corresponds to a vibratory torque of 914 lb-in. The peak torque was thus reduced to 4, 914 !b-in., which proved to be satisfactory for machine operation. It is often difficult to select a coupling having both the proper load rating and a stiffness that permits operation at a number of speeds or for a range of speeds.
FAULT DIAGNOSIS AND CORRECTION
The solution of a torsional vibration problem is sometimes obvious- more often, it is not. This section describes methods used to diagnose and correct torsional vibration problems.
Diagnosis
The fault diagnosis techniques used to study torsional vibration problems are not unlike those employed in lateral vibration. Some understanding of the phenomena associated with torsional vibration is essential. A model such as that shown in Figure 3 often provides insight into a problem. Knowledge of excitation frequencies, natural frequencies, and mode shapes can be applied to the diagnosis, and are especially helpful in locating sensors when measurements are necessary to obtain data. In many cases torsional vibration must be measured at a point remote from where the failure occurred. It is theref(Jre useful to know the mode shape so that the test values can be used to analyze the failure mode of the unit.
Correction
Most torsional vibrations arise because the system has a large number of critical speeds. Problems are corrected by changing the critical speeds of the system so as to alter its torsional response. Critical speeds are changed- a procedure called tuning- by altering stiffness or inertia. It is occasionally necessary to add damping and absorption devices to the system to reduce torsional stresses. Damping devices alleviate stress by their motion and are thus more effective when used in systems that operate near or at critical speeds. Damping devices should be used sparingly, however, because they are costly. Correction by reducing excitation is probably the best correction method in general, but is the least effective for torsional vibration problems. The reason is that most torsional vibration originates in machine function. Torsional vibration correction therefore involves modification of the system rather than reduction of excitation.
Case History of an Engine Crankshaft Failure
A small gasoline engine was directly connected to a reciprocating compressor. Whenever two reciprocating machines are connected, more-than-usual attention should be paid to torsional vibrations! In this case random crankshaft failures were occurring in the engine. A critical speed analysis of the system before it was assembled had indicated that the engine was not running near a critical speed. No response analysis had been conducted at that time, however, so it was the first step in the diagnosis of the vibration problem. A modal analysis of the system was conducted using a model of the engine-compressor system [7]. Analysis of the stresses in the crankshaft revealed that nominal stress levels (Figure 10) could vary as much as 25% depending on the orientation of the angle between the engine and the compressor crankshafts. Random angular orientation occurred because a friction collar had been used to connect the units; this was the source of the random crankshaft failures. The problem was solved by placing the shafts during

22 PROCEEDINGS OF THE SIXTH TURBOMACHINERY SYMPOSIUM
TABLE 4. MOTOR-COMPRESSOR MODEL
Component Component No. Description
0 Motor Armature 1 Coupling-Half 2 Coupling-Half 3 Compressor Cylinder 4 Compressor Cylinder .5 Compressor Cylinder 6 Compressor Cylinder
20000
iii � 19000 "' "' UJ a: 1-"' 16000 __J <( z :; 0 z 17000 " :::> ;;; )( <( "
15000
0 45 90 135 160 225 270 315 360 ATIACHMENT PHASE ANGLE ( OEG I
Figure 10. The Relationship Between Attachment Phase and Maximum Stress for the 3BHP Gasoline Military Engine with Three Phase Air Compressor Attached.
assembly so as to insure a proper phase relationship between the two units. The problem would not have occurred if a torsional vibration analysis had been part of the design process.
Case History of Engine Flywheel Gear Failure
The failure occurred on a large diesel-powered tractor seraper. The internal fiber gear attaehment between the engine flywheel and transmission failed. In addition, crankshafts were failing in an engine known to be reliable. Torsiograph measurements were made on the front of the engine at various operating speeds and loads. The torsiograph records were analyzed and used in eonjunction with a mathematieal model to obtain stresses in the gear and
Polar Moment Stiffness of Ine1tia (lb-in./rad
(!b-in. -sec') X 10-6)
29.6 .45 .6 .45 .065 .16 2.8 . 16 3 . . 16 3 . . 16 3 .
crankshaft. It was found that, at a no-load idling condition, excessive stress levels occurred in the unit. High torsional vibration exeitation at idling speed is common in engines because of the lack of balance between gas and inertia forees. In this case the simple solution to this problem was to increase the engine idling speed by 100 rpm.
REFERENCES
l. Sohre, J. S., "Transient Torsional Criticals of Synehronous Motor-Driven, High-Speed Compressor Units," ASME Paper No. 6.5-FE-22 (196.5).
2. Doughty, S., "Torsional Amplitude Growth with Resonant Forcing," J. Engr. Indus., Trans. ASME, 99 (1), pp. 1.51-1.52 (Feb. 1977).
3. Nestorides, E. J., A Handbook on Torsional Vibration, Cambridge University Press (19.58).
4. Thompson, W. T., Vibration Theory and Applications, Prentice-Hall, Inc., Englewood Cliffs, NJ (196.5).
.5. Shigley, J. E., Dynamic Analysis of Machines, McGrawHill, NY (1961).
6. MacDuff, J. N. and Curreri, J . R., Vibration Control, McGraw-Hill, NY (19.58).
7. Eshlcmann, R. L., "Torsional Response of Internal Combustion Engines," Trans. ASME, 96 (2), pp. 441-449 (May 1974).
8. Pollard, E. I., "Torsional Response of Systems," J. Engr. Power, Trans. ASME, 89 (3), pp. 316-324 (July 1967).
9. Smalley, A. J., "Transient Torsional Vibrations," Vibration Institute Seminar Proc., Torsional Vibration of Machine Systems (July 1976).