Embed Size (px)
Citation preview

Tornadoes and Severe Convective Events:
Insurance Trends and Challenges in an Era of Climate Volatility
National Tornado SummitOklahoma City, OKFebruary 11, 2014
Robert P. Hartwig, Ph.D., CPCU, President & EconomistInsurance Information Institute 110 William Street New York, NY 10038
Tel: 212.346.5520 Cell: 917.453.1885 [email protected] www.iii.org
2
U.S. Insured Catastrophe Loss Update
Tornadoes Are Among the Top Causes of Catastrophic Claims
The Toll of Tornadoes in Increasing2

3
$1
2.6
$1
1.0
$3
.8
$1
4.3
$1
1.6
$6
.1
$3
4.7
$7
.6
$1
6.3
$3
3.7
$7
3.4
$1
0.5
$7
.5
$2
9.2
$1
1.5
$1
4.4
$3
3.6
$3
5.0
$1
2.9
$1
4.0
$4
.8
$8
.0
$3
7.8
$8
.8
$2
6.4
$0
$10
$20
$30
$40
$50
$60
$70
$80
89 90 91 92 93 94 95 96 97 98 99 00 01 02 03 04 05 06 07 08 09 10 11 12 13*
U.S. Insured Catastrophe Losses
*Through 12/31/13.Note: 2001 figure includes $20.3B for 9/11 losses reported through 12/31/01 ($25.9B 2011 dollars). Includes only business and personal property claims, business interruption and auto claims. Non-prop/BI losses = $12.2B ($15.6B in 2011 dollars.) Sources: Property Claims Service/ISO; Insurance Information Institute.
Tornadoes are among the largest causes of insured losses (claims) in any given year, accounting for
36% of all insured losses since 1983.
2011 was the costliest year ever for tornado and t-storm events at
$26 billion
Overall CAT losses eased in
2013. The Moore, OK, event was the costliest of 2013.
($ Billions, $ 2012)
3

As of December 31, 2013
Number of Events Fatalities
Estimated Overall Losses (US $m)
Estimated Insured Losses (US $m)
SevereThunderstorm
69 110 16,341 10,274
Winter Storm 11 43 2,935 1,895
Flood 19 23 1,929 240
Earthquake & Geophysical
6 1 Minor Minor
Tropical Cyclone 1 1 Minor Minor
Wildfire, Heat, & Drought
22 29 620 385
Totals 128 207 21,825 12,794
Natural Disaster Losses in the United States, by Type, 2013
4Source: Munich Re NatCatSERVICE 4
Date EventEstimated Economic Losses (US $m)
Estimated Insured Losses (US $m)
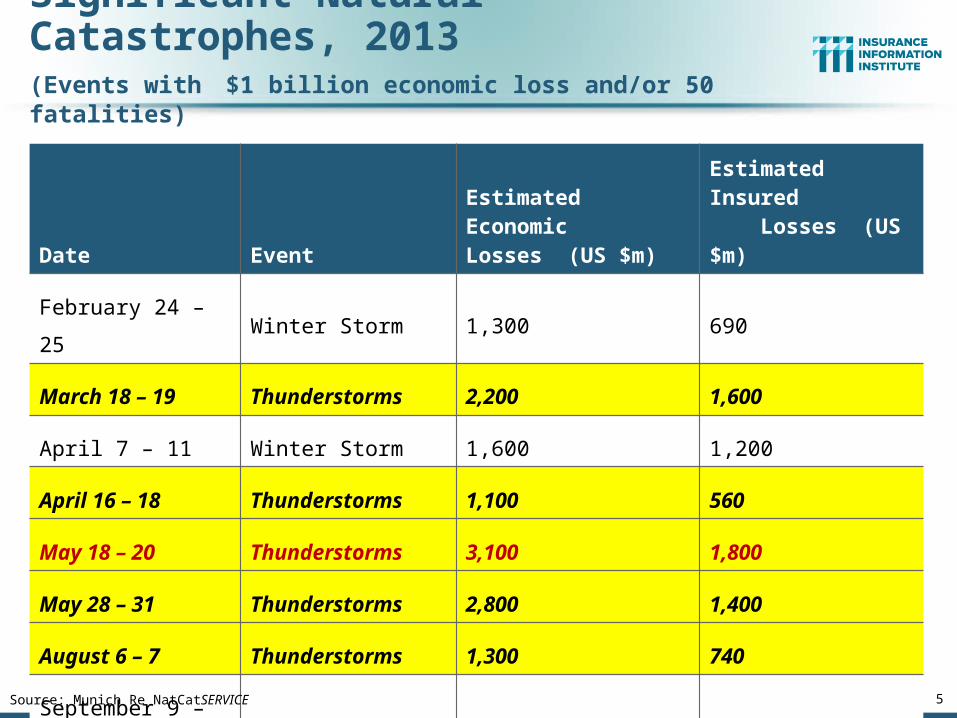
February 24 – 25 Winter Storm 1,300 690
March 18 – 19 Thunderstorms 2,200 1,600
April 7 – 11 Winter Storm 1,600 1,200
April 16 – 18 Thunderstorms 1,100 560
May 18 – 20 Thunderstorms 3,100 1,800
May 28 – 31 Thunderstorms 2,800 1,400
August 6 – 7 Thunderstorms 1,300 740
September 9 – 16 Flooding 1,500 160
November 17 - 18 Thunderstorms 1,300 931
Source: Munich Re NatCatSERVICE 5
Significant Natural Catastrophes, 2013(Events with $1 billion economic loss and/or 50 fatalities)
6
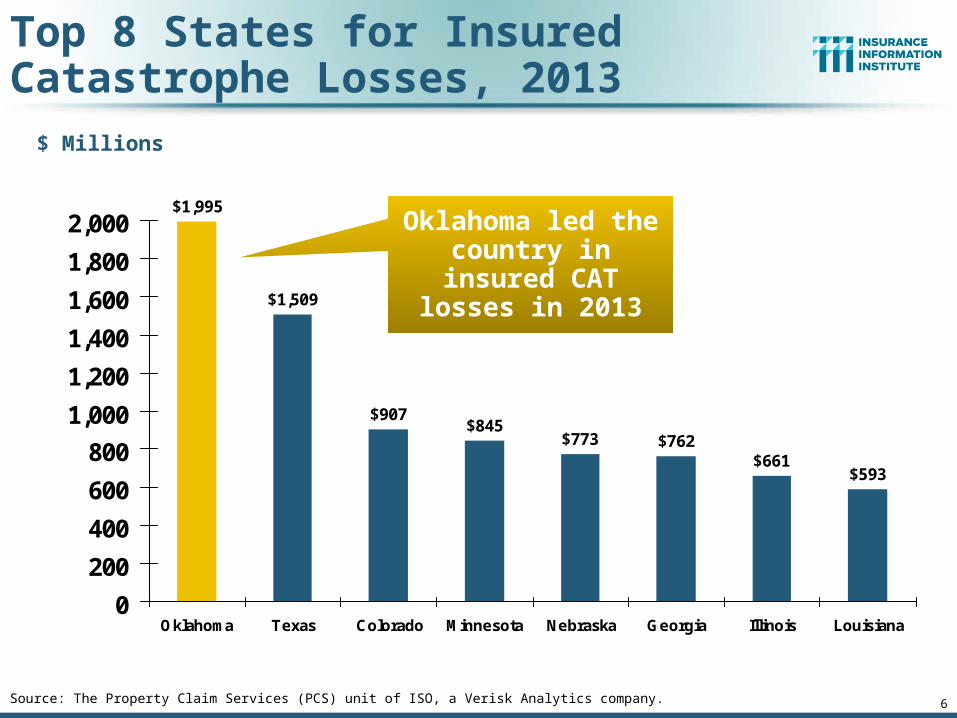
Top 8 States for InsuredCatastrophe Losses, 2013
$1,995
$1,509
$907$845
$773 $762$661
$593
0
200
400
600
800
1,000
1,200
1,400
1,600
1,800
2,000
Oklahoma Texas Colorado Minnesota Nebraska Georgia Illinois Louisiana
Source: The Property Claim Services (PCS) unit of ISO, a Verisk Analytics company.
$ Millions
Oklahoma led the country in insured CAT losses in 2013

8
$3,643
$3,187 $3,077 $3,041
$2,199
$1,000
$1,500
$2,000
$2,500
$3,000
$3,500
$4,000
Texas Alabama Missouri Tennessee N. Carolina
*Includes catastrophe losses of at least $25 million.Sources: PCS unit of ISO; Insurance Information Institute.
Top 5 States by Insured Catastrophe Losses in 2011*
2011 experienced record claims from tornadoes.
Insured losses from thunderstorms (including
tornadoes) totaled $26 Bill.
(2012, $ Millions)
9
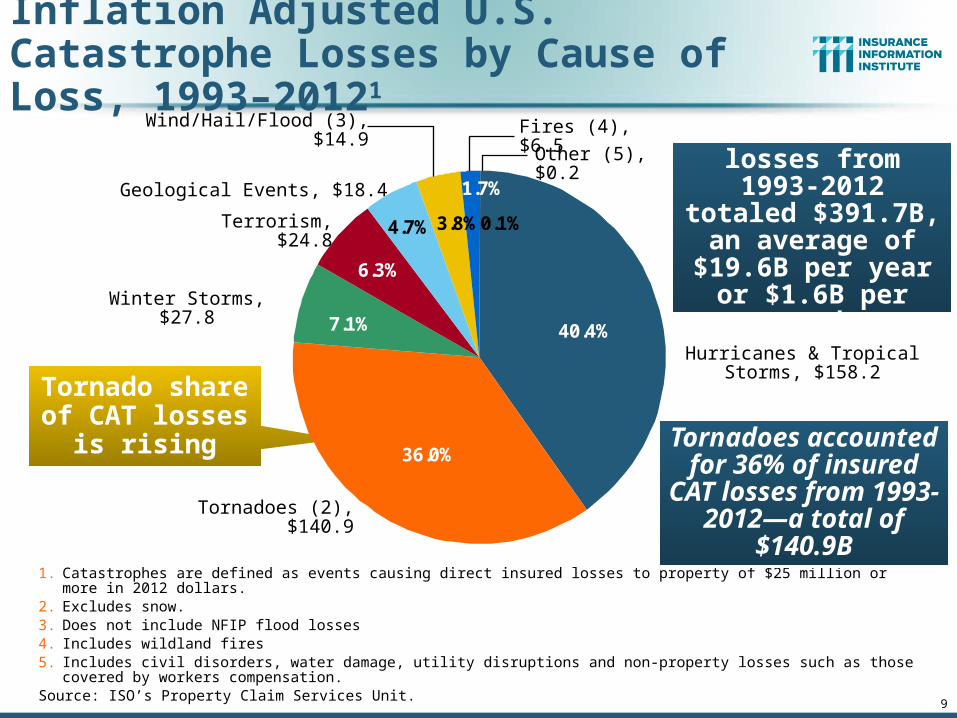
Inflation Adjusted U.S. Catastrophe Losses by Cause of Loss, 1993–20121
0.1%
1.7%
3.8%4.7%
6.3%
7.1%
36.0%
40.4%
1. Catastrophes are defined as events causing direct insured losses to property of $25 million or more in 2012 dollars.2. Excludes snow.3. Does not include NFIP flood losses4. Includes wildland fires5. Includes civil disorders, water damage, utility disruptions and non-property losses such as those covered by workers compensation.Source: ISO’s Property Claim Services Unit.
Hurricanes & Tropical Storms, $158.2
Fires (4), $6.5
Tornadoes (2), $140.9
Winter Storms, $27.8
Terrorism, $24.8
Geological Events, $18.4
Wind/Hail/Flood (3), $14.9
Other (5), $0.2
Tornadoes accounted for 36% of insured CAT losses from 1993-2012—a
total of $140.9B
Tornado share of CAT losses is
rising
Insured cat losses from 1993-2012
totaled $391.7B, an average of $19.6B per year or $1.6B
per month

10
Top States by Inflation-Adjusted Insured Catastrophe Losses, 1983–2012
9.0%
10.4%
14.3%66.3%
Source: PCS unit of ISO, Verisk Company.; Insurance Information Institute.
Over the Past 30 Years Florida Has Accounted for the Largest Share of Catastrophe Losses in the U.S., Followed by Texas and Louisiana
Rest of the U.S.$309.9B
Florida$66.7B
Texas$48.8B
Louisiana$42.0B
Total: $467.5 Billion, an average of
$16.6B per year or $1.3B per month
TX is the second costliest state for CATs, with nearly $49B in insured losses
over the past 30 years—
tornadoes are a significant share
of the total

11
Top 16 Most Costly Disastersin U.S. History
(Insured Losses, 2012 Dollars, $ Billions)
$7.8 $8.7 $9.2 $11.1$13.4$18.8
$23.9 $24.6$25.6
$48.7
$7.5$7.1$6.7$5.6$5.6$4.4
$0
$10
$20
$30
$40
$50
$60
Irene (2011) Jeanne(2004)
Frances(2004)
Rita (2005)
Tornadoes/T-Storms
(2011)
Tornadoes/T-Storms
(2011)
Hugo (1989)
Ivan (2004)
Charley(2004)
Wilma(2005)
Ike (2008)
Sandy(2012)
Northridge(1994)
9/11 Attack(2001)
Andrew(1992)
Katrina(2005)
Hurricane Sandy became the 5th
costliest event in US insurance history
Hurricane Irene became the 12th most expense hurricane
in US history in 2011
Includes Tuscaloosa, AL,
tornado
Includes Joplin, MO, tornado
12 of the 16 Most Expensive Events in US History Have
Occurred Since 2004
Sources: PCS; Insurance Information Institute inflation adjustments to 2012 dollars using the CPI.

Nu
mb
er
Geophysical (earthquake, tsunami, volcanic activity)
Climatological (temperature extremes, drought, wildfire)
Meteorological (storm)
Hydrological (flood, mass movement)
Natural Disasters in the United States, 1980 – 2013Number of Events (Annual Totals 1980 – 2013)
Source: MR NatCatSERVICE 12
22
19
81
6
50
100
150
200
250
1980 1982 1984 1986 1988 1990 1992 1994 1996 1998 2000 2002 2004 2006 2008 2010 2012
There were 128 natural disaster events in 2013

Losses Due to Natural Disasters in the US, 1980–2013
13
Overall losses (in 2012 values) Insured losses (in 2013 values)
Source: MR NatCatSERVICE
(2013 Dollars, $ Billions) (Overall and Insured Losses)
50
100
150
200
1980 1982 1984 1986 1988 1990 1992 1994 1996 1998 2000 2002 2004 2006 2008 2010 2012
2013 CAT Losses
Overall : $21.8B
Insured: $12.8B
Indicates a great deal of losses are uninsured (~40%-50% in the US) =
Growth Opportunity
2013 losses were far below 2011 and 2012 and were 44% lower
than the average from 2000-2012
14
The Terrible and Costly Toll of Tornadoes
Tornadoes Cause Billions in Insured Losses Each Year
Costs Are Increasing14

15
1,1
33
1,1
32 1
,29
7
1,1
73
1,0
82 1,2
34
1,1
73
1,1
48
1,4
24
1,3
45
1,0
71 1,2
16
94
1
1,3
76
1,2
64
1,1
03
1,0
98
1,6
92
1,1
46 1,2
82
93
9
89
8
1,819
1,6
91
553
0
200
400
600
800
1,000
1,200
1,400
1,600
1,800
2,000
90 91 92 93 94 95 96 97 98 99 00 01 02 03 04 05 06 07 08 09 10 11 12 13
Nu
mb
er
of
To
rna
do
es
0
100
200
300
400
500
600
Nu
mb
er o
f De
ath
s
Number of Tornadoes
Number of Deaths
*Through Dec. 31, 2013.Source: U.S. Department of Commerce, Storm Prediction Center, National Weather Service at http://www.spc.noaa.gov/climo/online/monthly/newm.html
Number of Tornadoes and Related Deaths, 1990 – 2013*
Tornadoes claimed 553 lives in 2011, the most since 1925
898 tornadoes were recorded in 2013 and 55 deaths*
2013 tornado activity was below average despite major storms in Oklahoma. Since 1990, 1,859 people have been killed in tornado events.
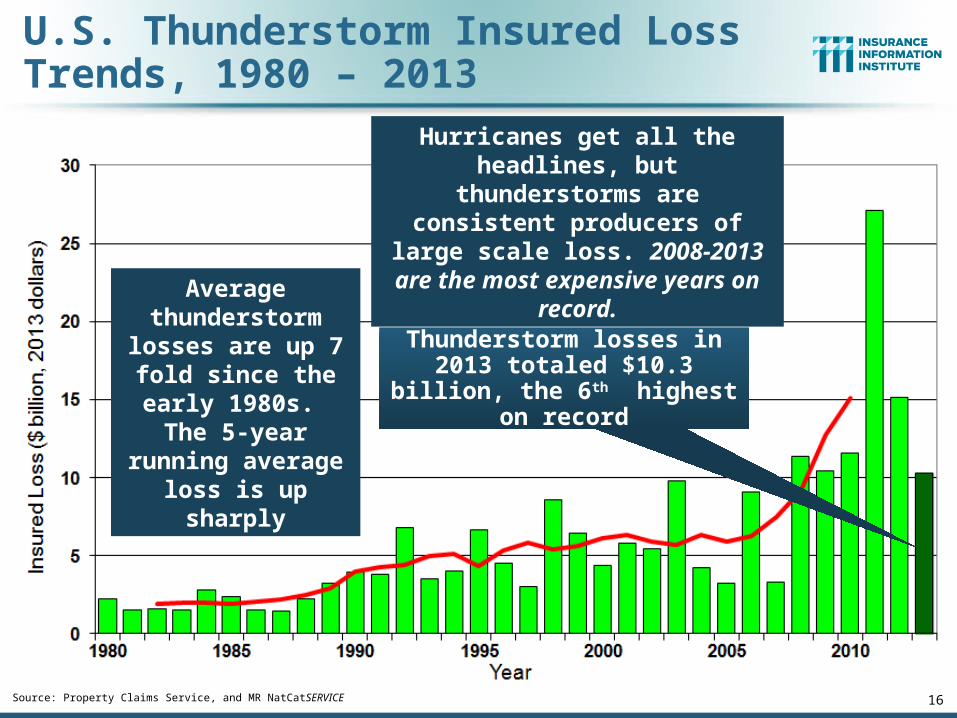
U.S. Thunderstorm Insured Loss Trends, 1980 – 2013
16Source: Property Claims Service, and MR NatCatSERVICE
Thunderstorm losses in 2013 totaled $10.3 billion, the 6th
highest on record
Average thunderstorm
losses are up 7 fold since the early
1980s. The 5-year running average
loss is up sharply
Hurricanes get all the headlines, but thunderstorms are consistent
producers of large scale loss. 2008-2013 are the most expensive
years on record.

18
Insured Losses from Tornado/Thunderstorm/Hail Catastrophes, 2000-2013, (Top 25 States)
$1
6,8
70
$9
,77
2
$9
,39
2
$8
,68
5
$7
,58
7
$6
,72
9
$5
,83
4
$5
,78
6
$5
,78
3
$5
,64
9
$5
,50
4
$4
,68
8
$4
,63
3
$3
,39
4
$3
,01
7
$2
,69
6
$2
,62
4
$2
,45
2
$2
,29
6
$2
,29
4
$2
,00
3
$1
,94
2
$1
,80
6
$1
,80
6
$1
,53
9
$1
,40
7
$0
$2,000
$4,000
$6,000
$8,000
$10,000
$12,000
$14,000
$16,000
$18,000
TX
OK
MO
TN IL
MN
KS
OH IN AL
CO
GA
KY WI
AZ IA
NC
NE
AR
PA
MS
NY MI
VA
MD
SC
Sources: Property Claims Service, a Division of Verisk Analytics; Insurance Information Institute.
Texas leads the US by a wide margin in
insured losses from convective
events
Oklahoma has the second highest insured losses in the US from tornado/thunderstorm and
hail events
Insured Losses (in Millions of 2013 Dollars)Insurers paid $134.6 billion to
policyholders in claims associated with severe convective events from 2000-2013 (in 2013 dollars)—or $9.6
billion per year, on average
19
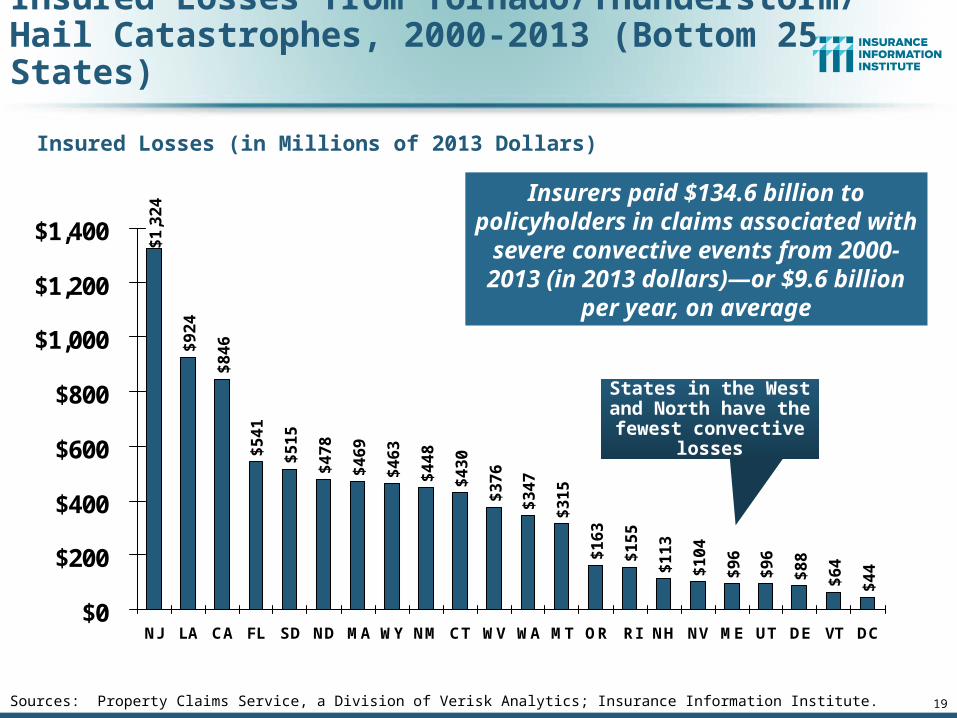
Insured Losses from Tornado/Thunderstorm/Hail Catastrophes, 2000-2013 (Bottom 25 States)
$1
,32
4
$9
24
$8
46
$5
41
$5
15
$4
78
$4
69
$4
63
$4
48
$4
30
$3
76
$3
47
$3
15
$1
63
$1
55
$1
13
$1
04
$9
6
$9
6
$8
8
$6
4
$4
4
$0
$200
$400
$600
$800
$1,000
$1,200
$1,400
NJ LA CA FL SD ND MA WY NM CT WV WA MT OR RI NH NV ME UT DE VT DC
States in the West and North have the fewest
convective losses
Sources: Property Claims Service, a Division of Verisk Analytics; Insurance Information Institute.
Insured Losses (in Millions of 2013 Dollars)
Insurers paid $134.6 billion to policyholders in claims associated with severe convective events from 2000-2013 (in 2013 dollars)—or $9.6
billion per year, on average

20
$41$197
$6
$1,407
$9
$554$650
$2,338
$859
$1,269
$1,988
$82$78
$296
$0
$500
$1,000
$1,500
$2,000
$2,500
00 01 02 03 04 05 06 07 08 09 10 11 12 13
Oklahoma: Insured Losses from Tornado/ Thunderstorm/Hail Catastrophes, 2000-2013
Sources: Property Claims Service, a Division of Verisk Analytics; Insurance Information Institute.
Oklahoma sustained $9.8 billion in insured losses from convective events from 2000-2013, second only to $16.9 billion in Texas over the same period
Insured Losses (in Millions of 2013 Dollars)
21
$1,617
$618$816
$298
$586
$1,465
$2,669
$272
$2,603
$2,352
$1,365
$794$996
$419
$0
$500
$1,000
$1,500
$2,000
$2,500
$3,000
00 01 02 03 04 05 06 07 08 09 10 11 12 13
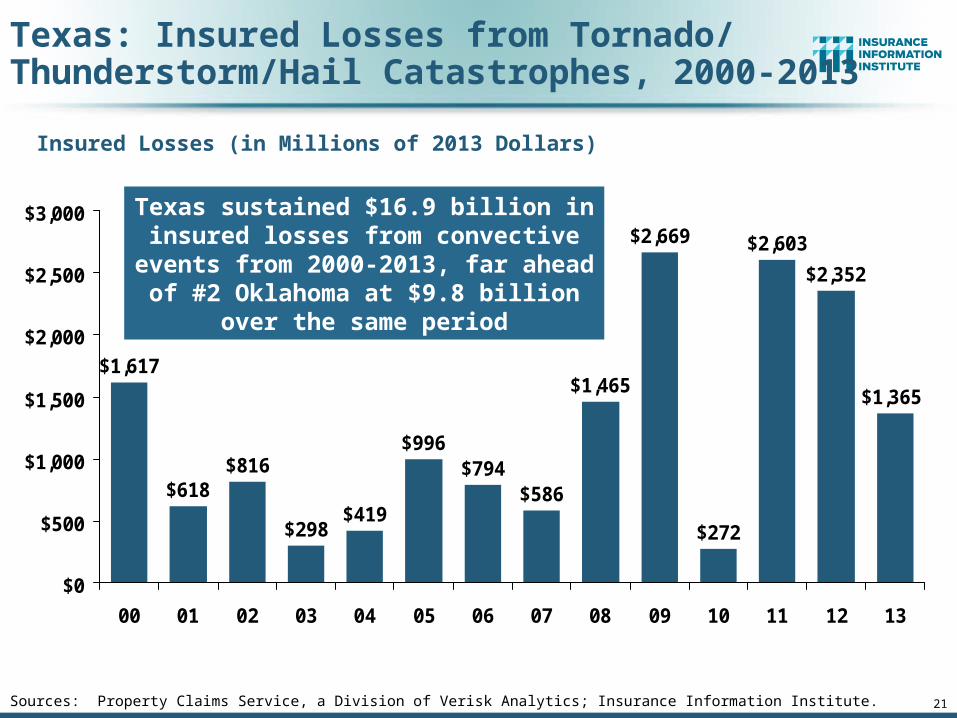
Texas: Insured Losses from Tornado/ Thunderstorm/Hail Catastrophes, 2000-2013
Sources: Property Claims Service, a Division of Verisk Analytics; Insurance Information Institute.
Texas sustained $16.9 billion in insured losses from convective events from
2000-2013, far ahead of #2 Oklahoma at $9.8 billion over the same period
Insured Losses (in Millions of 2013 Dollars)

22
$53
$1,888
$142$396
$28$281 $352
$202
$3,187
$1,331
$272
$910
$42
$308
$0
$500
$1,000
$1,500
$2,000
$2,500
$3,000
$3,500
00 01 02 03 04 05 06 07 08 09 10 11 12 13
Missouri: Insured Losses from Tornado/ Thunderstorm/Hail Catastrophes, 2000-2013
Insured Losses (in Millions of 2013 Dollars)
Sources: Property Claims Service, a Division of Verisk Analytics; Insurance Information Institute.
Missouri sustained $9.4 billion in insured losses from convective events
from 2000-2013, ranking third in the country behind only Texas ($16.9B) and
Oklahoma ($9.8B)

23
$1,617
$1,888
$1,140
$1,505
$839
$1,713
$2,669
$2,338
$3,239
$2,352
$1,988
$1,698
$996$882
$0
$500
$1,000
$1,500
$2,000
$2,500
$3,000
$3,500
00 01 02 03 04 05 06 07 08 09 10 11 12 13
States with Highest Insured Losses from Tornado/ Thunderstorm/Hail Catastrophes, 2000-2013
Insured Losses (in Millions of 2013 Dollars)
Sources: Insurance Information Institute based on data from Property Claims Service, a Division of Verisk Analytics.
8 different states have led the country in insured losses from severe convective events from 2000-2013. The average
peak state loss is $1.78 billion.
TX
TX TX TX
MO
KY
TN
CO
IN MN
MN
OK
AL
OK
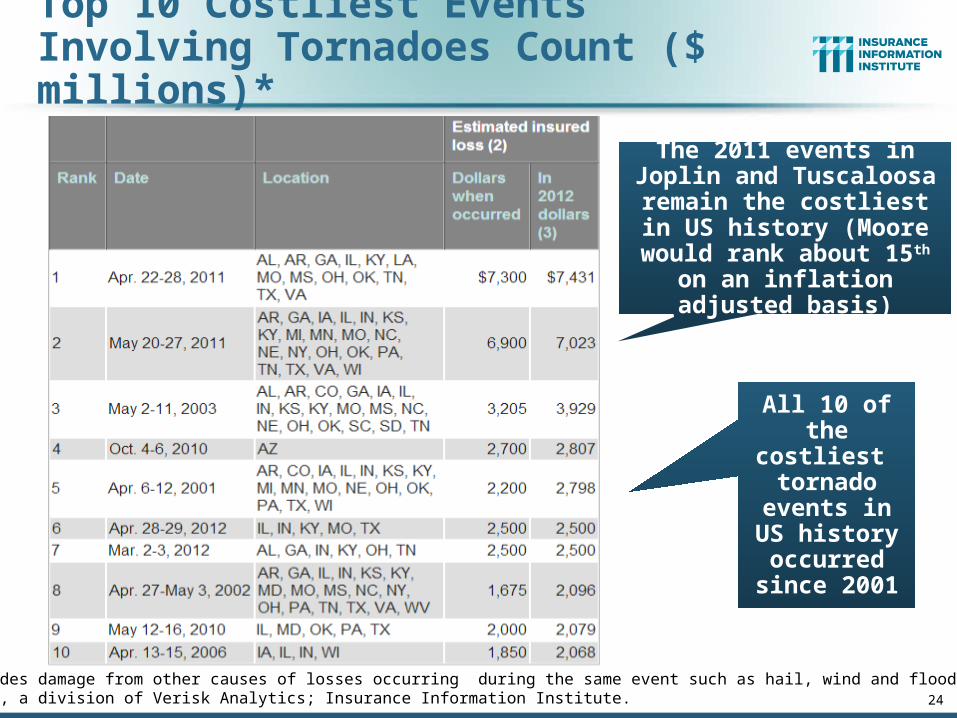
Top 10 Costliest Events Involving Tornadoes Count ($ millions)*
24
All 10 of the costliest tornado
events in US history
occurred since 2001
*Also includes damage from other causes of losses occurring during the same event such as hail, wind and flood.Source: PCS, a division of Verisk Analytics; Insurance Information Institute.
The 2011 events in Joplin and Tuscaloosa remain the
costliest in US history (Moore would rank about
15th on an inflation adjusted basis)

25
Insurance Industry Financial Impacts of Tornadoes and
Convective Events
Convective Events Are a Major Driver of Higher Property Insurance Premiums
25

Homeowners Insurance Catastrophe-Related Claim Frequency and Severity, 1997—2012*
*All policy forms combined, countrywide.Source: Insurance Research Council, Trends in Homeowners Insurance Claims, Sept. 2012 from ISO Fast Track data. 26
Avg. catastrophe claim cost rose
approximately 200% from 1997-2011
Cat claim frequency in 2011 was at historic highs and more than
double the rate in 1997

27
Combined Ratio Points Associated with Catastrophe Losses: 1960 – 2013*
*2010s represent 2010-2013.Notes: Private carrier losses only. Excludes loss adjustment expenses and reinsurance reinstatement premiums. Figures are adjusted for losses ultimately paid by foreign insurers and reinsurers.Source: ISO (1960-2011); A.M. Best (2012E) Insurance Information Institute.
0.4
1.2
0.4 0.
8 1.3
0.3
0.4 0.
71.
51.
00.
40.
4 0.7
1.8
1.1
0.6
1.4 2.
01.
3 2.0
0.5
0.5 0.7
3.0
1.2
2.1
8.8
2.3
5.9
3.3
2.8
1.0
3.6
2.9
1.6
5.4
1.6
3.3
3.3
8.1
2.7
1.6
5.0
2.6
3.4
8.7 8.9
3.43.6
0.9
0.1
1.1
1.1
0.8
0
1
2
3
4
5
6
7
8
9
10
1960
1962
1964
1966
1968
1970
1972
1974
1976
1978
1980
1982
1984
1986
1988
1990
1992
1994
1996
1998
2000
2002
2004
2006
2008
2010
2012
The Catastrophe Loss Component of Private Insurer Losses Has Increased Sharply in Recent Decades
Avg. CAT Loss Component of the Combined Ratio
by Decade
1960s: 1.04 1970s: 0.85 1980s: 1.31 1990s: 3.39 2000s: 3.52 2010s: 6.1E*
Combined Ratio Points Catastrophe losses as a share of all losses reached
a record high in 2012
28
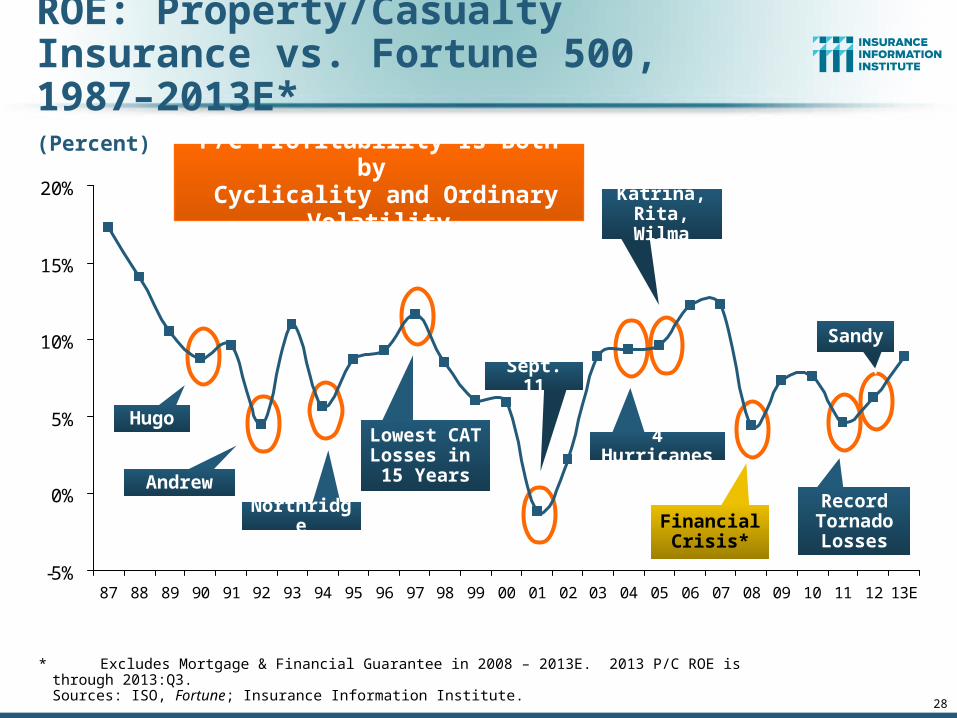
ROE: Property/Casualty Insurance vs. Fortune 500, 1987–2013E*
* Excludes Mortgage & Financial Guarantee in 2008 – 2013E. 2013 P/C ROE is through 2013:Q3. Sources: ISO, Fortune; Insurance Information Institute.
-5%
0%
5%
10%
15%
20%
87 88 89 90 91 92 93 94 95 96 97 98 99 00 01 02 03 04 05 06 07 08 09 10 11 12 13E
P/C Profitability Is Both by Cyclicality and Ordinary Volatility
Hugo
Andrew
Northridge
Lowest CAT Losses in 15 Years
Sept. 11
Katrina, Rita, Wilma
4 Hurricanes
Financial Crisis*
(Percent)
Record Tornado Losses
Sandy
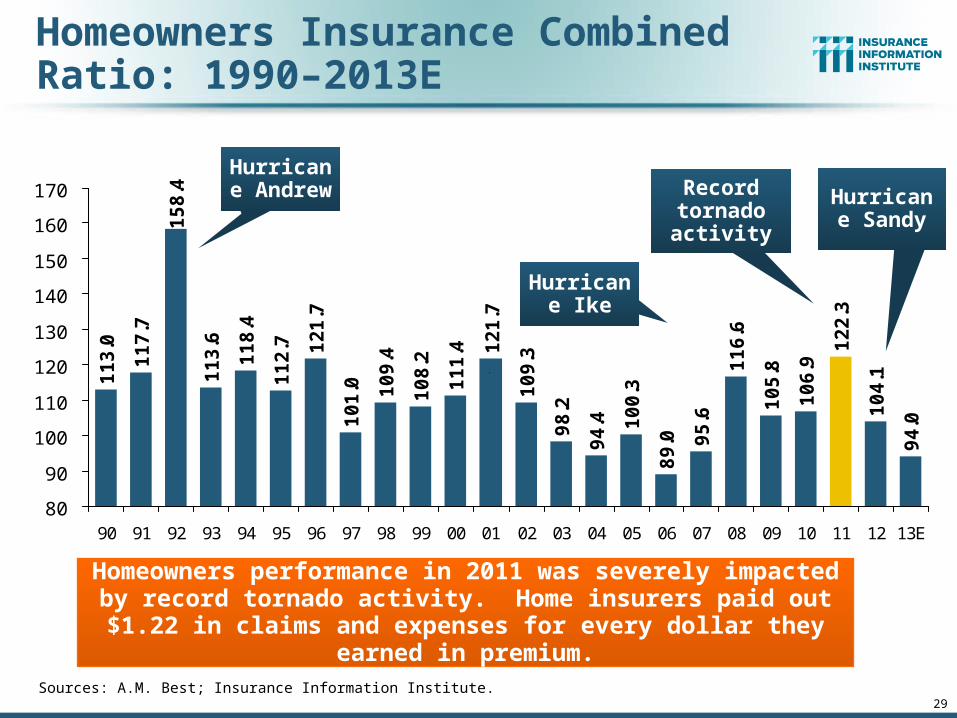
Homeowners Insurance Combined Ratio: 1990–2013E
11
3.0
11
7.7
15
8.4
11
3.6
10
1.0 10
9.4
10
8.2
11
1.4 1
21
.7
10
9.3
98
.2
94
.4 10
0.3
89
.0 95
.6
11
6.6
10
5.8
10
6.9
12
2.3
10
4.1
94
.0
11
8.4
11
2.7 12
1.7
80
90
100
110
120
130
140
150
160
170
90 91 92 93 94 95 96 97 98 99 00 01 02 03 04 05 06 07 08 09 10 11 12 13E
1
Homeowners performance in 2011 was severely impacted by record tornado activity. Home insurers paid out $1.22 in claims
and expenses for every dollar they earned in premium.
29
Hurricane Ike
Hurricane Sandy
Record tornado activity
Hurricane Andrew
Sources: A.M. Best; Insurance Information Institute.

30
Top Ten Most Expensive And Least Expensive States For Homeowners Insurance, 2011 (1)
Rank Most
expensive statesHO average
premium RankLeast
expensive statesHO average premium
1 Florida $1,933 1 Idaho $518
2 Louisiana 1,672 2 Oregon 559
3 Texas (2) 1,578 3 Utah 563
4 Mississippi 1,409 4 Wisconsin 592
5 Oklahoma 1,386 5 Washington 626
6 Alabama 1,163 6 Ohio 644
7 Rhode Island 1,139 7 Delaware 664
8 Kansas 1,103 8 Arizona 675
9 New York 1,097 9 Nevada 689
10 Connecticut 1,096 10 Iowa 713
(1) Includes policies written by Citizens Property Insurance Corp. (Florida) and Citizens Property Insurance Corp. (Louisiana), Alabama Insurance Underwriting Association, Mississippi Windstorm Underwriting Association, North Carolina Joint Underwriting Association and South Carolina Wind and Hail Underwriting Association. Other southeastern states have wind pools in operation and their data may not be included in this chart. Based on the HO-3 homeowner package policy for owner-occupied dwellings, 1 to 4 family units. Provides “all risks” coverage (except those specifically excluded in the policy) on buildings and broad named-peril coverage on personal property, and is the most common package written.
(2) The Texas Department of Insurance developed home insurance policy forms that are similar but not identical to the standard forms. In addition, due to the Texas Windstorm Association (which writes wind-only policies) classifying HO-1, 2 and 5 premiums as HO-3, the average premium for homeowners insurance is artificially high.
Note: Average premium=Premiums/exposure per house years. A house year is equal to 365 days of insured coverage for a single dwelling. The NAIC does not rank state average expenditures and does not endorse any conclusions drawn from this data.Source: ©2013 National Association of Insurance Commissioners (NAIC). Reprinted with permission. Further reprint or distribution strictly prohibited without written permission of NAIC.
Texas ranked as the 3rd most expensive state for homeowners insurance in 2011, with an average expenditure of $1,578.

31
Federal Disaster Declarations Patterns:
1953-2014
31
Disaster Declarations Set New Records in Recent Years
Hundreds of Declarations Involved Tornadoes
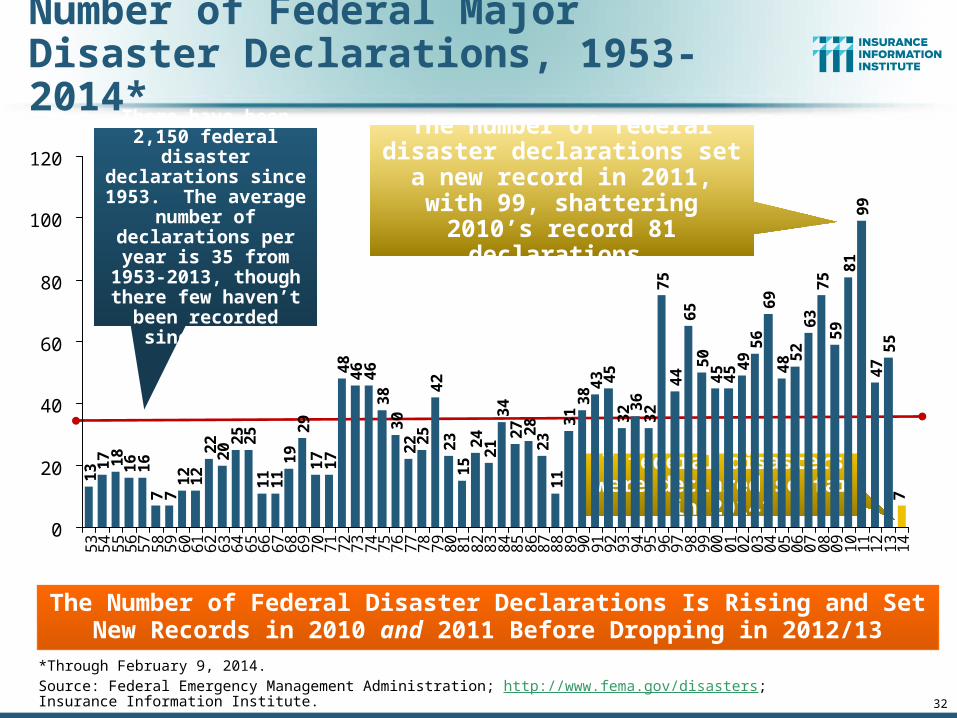
Number of Federal Major Disaster Declarations, 1953-2014*
13 1
7 18
16
16
7 71
21
22
22
0 25
25
11
11
19
29
17
17
48
46
46
38
30
22 2
54
22
31
52
42
13
42
7 28
23
11
31
38
45
32 3
63
27
54
46
55
04
54
5 49
56
69
48 5
26
37
55
98
19
94
75
57
43
0
20
40
60
80
100
120
53
54
55
56
57
58
59
60
61
62
63
64
65
66
67
68
69
70
71
72
73
74
75
76
77
78
79
80
81
82
83
84
85
86
87
88
89
90
91
92
93
94
95
96
97
98
99
00
01
02
03
04
05
06
07
08
09
10
11
12
13
14
*Through February 9, 2014.Source: Federal Emergency Management Administration; http://www.fema.gov/disasters; Insurance Information Institute.
The Number of Federal Disaster Declarations Is Rising and Set New Records in 2010 and 2011 Before Dropping in 2012/13
The number of federal disaster declarations set a new record in 2011, with 99, shattering 2010’s
record 81 declarations.
There have been 2,150 federal disaster
declarations since 1953. The average
number of declarations per year is 35 from 1953-2013, though
there few haven’t been recorded since 1995.
7 federal disasters were declared so far in 2014*
32

33
Federal Disasters Declarations by State, 1953 – 2014: Highest 25 States*
88
79
75
67
66
60
57
56
55
55
53
52
52
51
51
50
50
49
48
47
47
46
44
43
40
0
10
20
30
40
50
60
70
80
90
100
TX CA OK NY FL LA AL KY MO AR IL MS IA TN WV MN KS PA NE VA OH WA ND SD ME
Dis
as
ter
De
cla
rati
on
s
Over the past 60 years, Texas has had the highest
number of Federal Disaster
Declarations
*Through Feb. 9, 2014. Includes Puerto Rico and the District of Columbia.Source: FEMA: http://www.fema.gov/news/disaster_totals_annual.fema; Insurance Information Institute.

34
Federal Disasters Declarations by State, 1953 – 2014: Lowest 25 States*
42
40
39
38
37
36
35
33
29
28
26
26
26
26
24
24
23
23
22
19
17
15
15
13
11
11
9
0
10
20
30
40
50
NC AK IN VT WI GA NJ NH MA OR PR HI MI NM AZ MD ID MT CO CT NV DE SC DC UT RI WY
Dis
as
ter
De
cla
rati
on
s
Over the past 60 years, Wyoming and Rhode Island had the fewest
number of Federal Disaster Declarations
*Through Feb. 9, 2014. Includes Puerto Rico and the District of Columbia.Source: FEMA: http://www.fema.gov/news/disaster_totals_annual.fema; Insurance Information Institute.

35
SEVERE WEATHER REPORT UPDATE: 2013
Damage from Tornadoes, Large Hail and High Winds Keep Insurers Busy
35
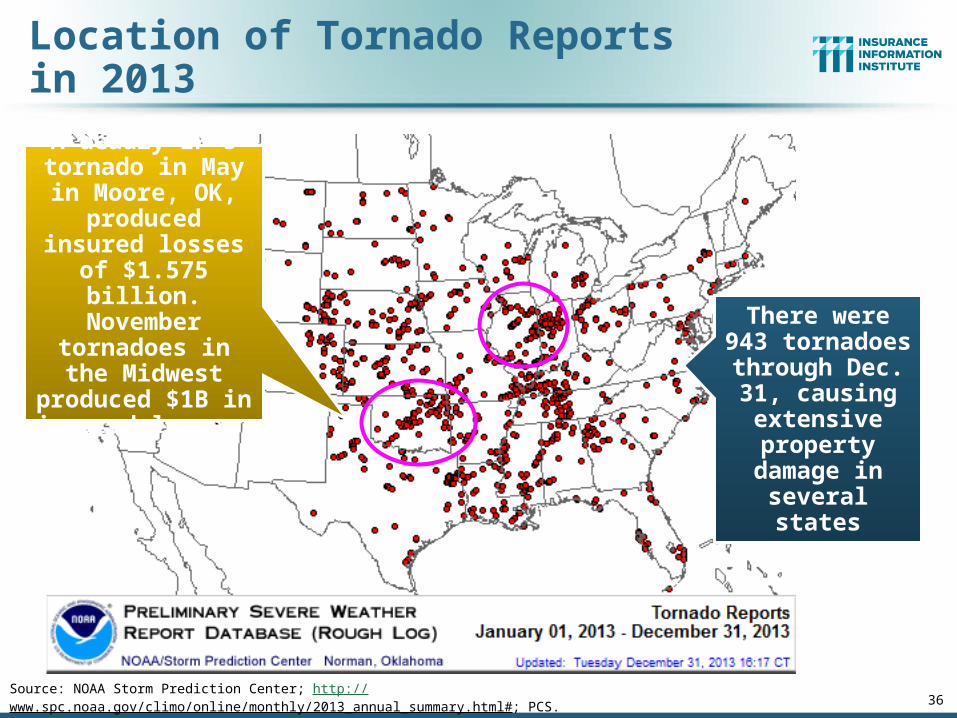
Location of Tornado Reports in 2013
36Source: NOAA Storm Prediction Center; http://www.spc.noaa.gov/climo/online/monthly/2013_annual_summary.html#; PCS.
There were 943 tornadoes
through Dec. 31, causing
extensive property
damage in several states
A deadly EF-5 tornado in May in
Moore, OK, produced insured losses of $1.575
billion. November tornadoes in the
Midwest produced $1B in insured
losses.

U.S. Tornado Count, 2005-2013*
37
*Through Dec. 31, 2013.Source: http://www.spc.noaa.gov/wcm/.
There were 1,897 tornadoes in the U.S. in 2011 far
above average, but well below 2008’s record
2013 count was the
lowest in a decade

Location of Large Hail Reports: 2013
38Source: NOAA Storm Prediction Center; http://www.spc.noaa.gov/climo/online/monthly/2013_annual_summary.html#
There were 5,457 “Large
Hail” reports in 2013, causing
extensive property and
vehicle damage
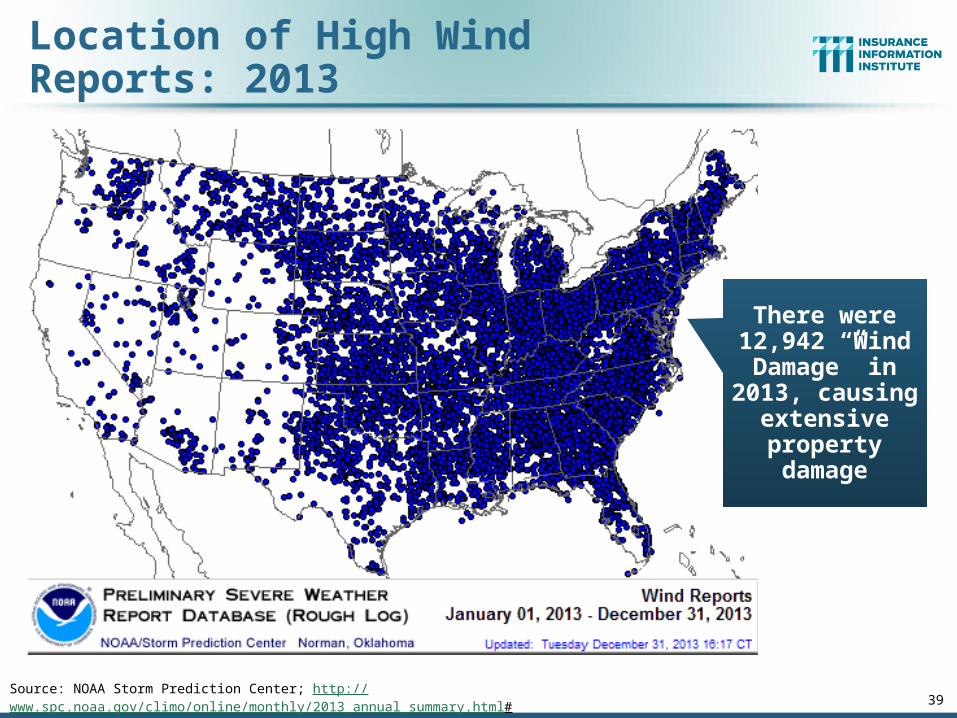
Location of High Wind Reports: 2013
39Source: NOAA Storm Prediction Center; http://www.spc.noaa.gov/climo/online/monthly/2013_annual_summary.html#
There were 12,942 “Wind Damage” in
2013, causing extensive property damage

Severe Weather Reports: 2013
40Source: NOAA Storm Prediction Center; http://www.spc.noaa.gov/climo/online/monthly/2013_annual_summary.html#
Severe weather reports are
concentrated east of the Rockies
There were 19,342 severe
weather reports in 2013;
including 942 tornadoes;
5,457 “Large Hail” reports
and 12,942 high wind events

41
SEVERE WEATHER REPORTS:LONGER-RUN CONVECTIVE EVENT TRENDS
Damage from Tornadoes, Large Hail and High Winds Keep Insurers Busy
41
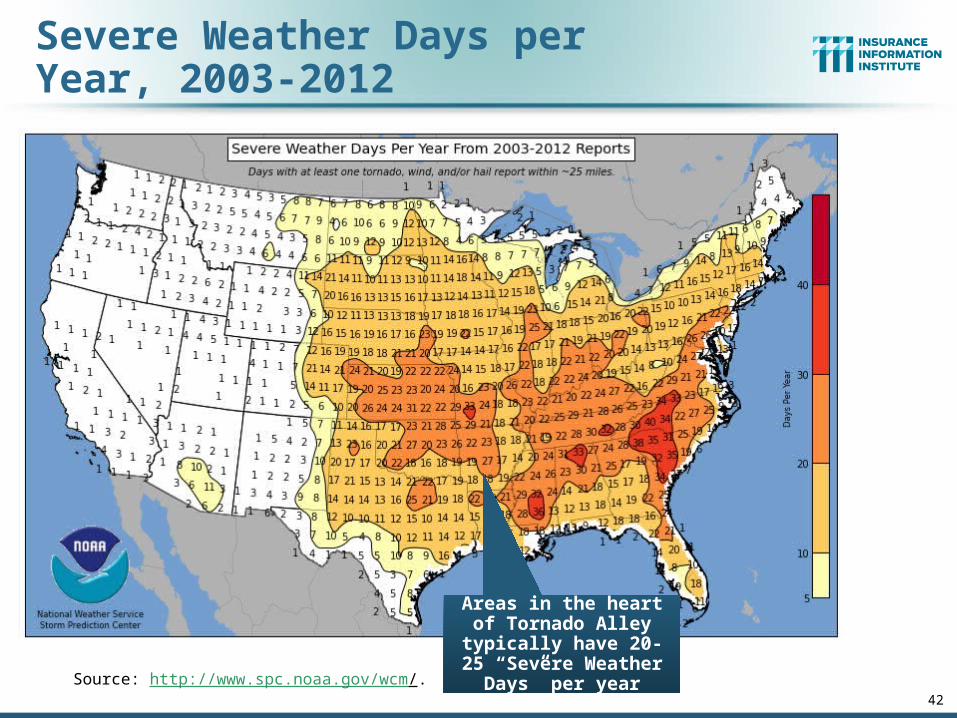
Severe Weather Days per Year, 2003-2012
42
Source: http://www.spc.noaa.gov/wcm/.
Areas in the heart of Tornado Alley typically
have 20-25 “Severe Weather Days” per year

Severe Thunderstorm Wind Days per Year, 2003-2012
43
Source: http://www.spc.noaa.gov/wcm/.
Severe t-storm events can breed tornadoes. KS and FL have the highest density of severe t-storms.
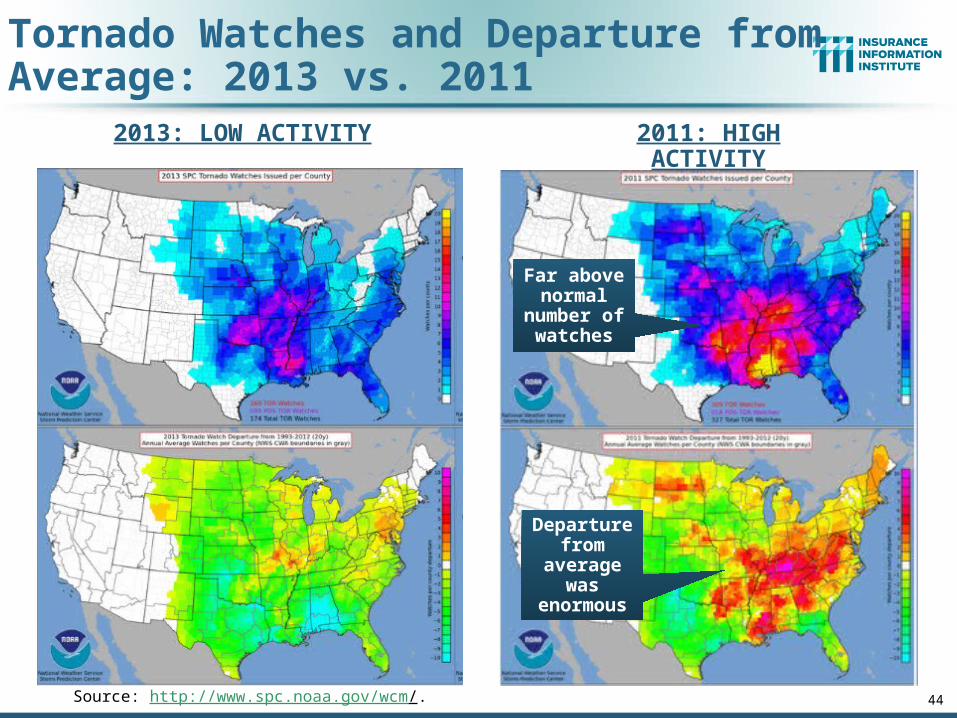
Tornado Watches and Departure from Average: 2013 vs. 2011
44Source: http://www.spc.noaa.gov/wcm/.
Far above normal
number of watches
2013: LOW ACTIVITY 2011: HIGH ACTIVITY
Departure from
average was
enormous

Severe Thunderstorm Wind Days per Year, 2003-2012
45
Source: http://www.spc.noaa.gov/wcm/.
Wind due to severe t-storm can occur in many areas but is concentrated further east

Tornado Days per Year, 2003-2012
46
Source: http://www.spc.noaa.gov/wcm/.
Peak tornado zones have 2-3 Tornado
Days per year

Severe Hail Days per Year, 2003-2012
47
Source: http://www.spc.noaa.gov/wcm/.
Severe hail occurs commonly in severe t-
storms and areas experiencing tornadoes

50
Severe Convective Events: A Global Perspective
Severe Thunderstorm Events Are Becoming More Common Globally
Trend Is Likely to Continue
50

Source: Munich Re Geo Risks Research, NatCatSERVICE – as of January 2014. 51
Geophysical events(earthquake, tsunami, volcanic activity)
Meteorological events (storm)
Hydrological events(flood, mass movement)
Climatological events(extreme temperature, drought, wildfire)
Extraterrestrial events(Meteorite impact)
880Loss events
EarthquakeChina, 20 April
Severe storms, tornadoesUSA, 18–22 May
FloodsIndia, 14–30 June
HailstormsGermany, 27–28 July
Winter Storm Christian (St. Jude)Europe, 27–30 October
Typhoon HaiyanPhilippines, 8–12 NovemberSevere storms, tornadoes
USA, 28–31 May
Hurricanes Ingrid & ManuelMexico, 12–19 September
FloodsCanada, 19–24 June
FloodsEurope, 30 May–19 June
Heat waveIndia, April–June
Typhoon FitowChina, Japan, 5–9 October
Earthquake (series)Pakistan, 24–28 September
FloodsAustralia, 21–31 January
Meteorite impactRussian Federation, 15 February
Flash floodsCanada, 8–9 July
FloodsUSA, 9–16 September
Geophysical events(earthquake, tsunami, volcanic activity)
Meteorological events (storm)
Selection of significant Natural catastrophes
Natural catastrophes Hydrological events(flood, mass movement)
Climatological events(extreme temperature, drought, wildfire)
Natural Loss Events:Full Year 2013
World Map

Hailstorm on July 27-28 2013 in Germany Was Most Expensive CAT Worldwide!
Region Overall losses Insured losses Fatalities
Southwestern and Northern Germany
US$ 4.8bn US$ 3.7bn 0
July 27
July 28
52
Hailstones with diameters up to 8 cm (tennis ball ≈ 7 cm)
Source: Munich Re Geo Risks Research, NatCatSERVICE – as of January 2014.

Reasons for lack of tornado activity during spring: Strong high pressure anchored
over the northeast Pacific Ocean Polar jet stream forced much
further north than normal into Alaska before diving southward across the eastern United States
This pattern allowed cool Arctic air masses to dive south over the central United States, keeping the atmosphere relatively stable.
54
Unusual Weather Pattern Over the US in Spring 2013 Led to Low Convective Activity
Source: Munich Re Geo Risks Research, NatCatSERVICE .
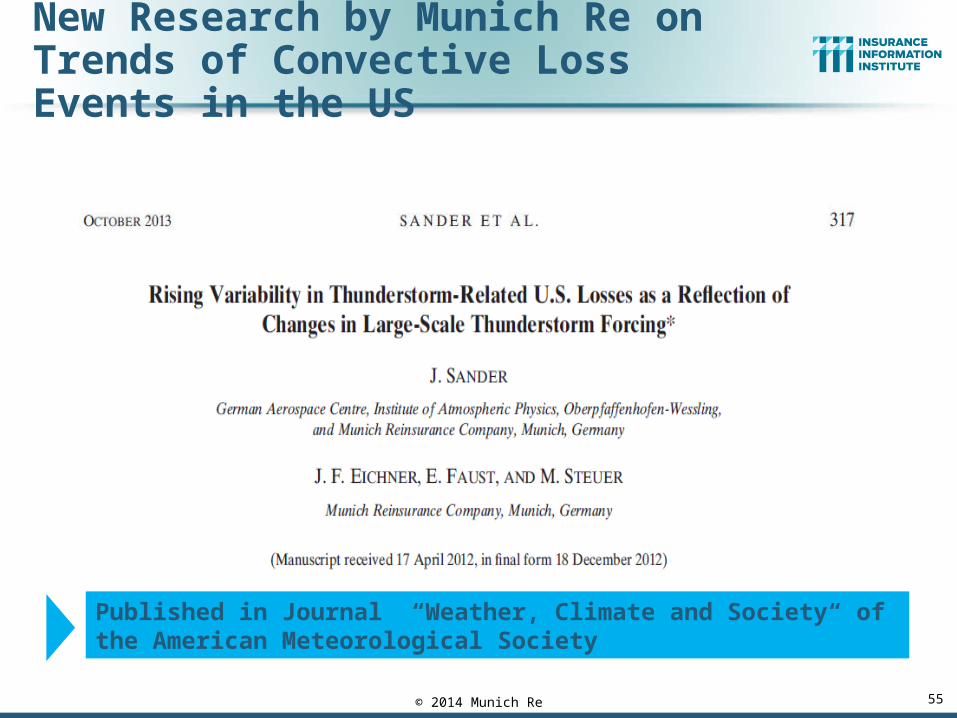
New Research by Munich Re on Trends of Convective Loss Events in the US
Published in Journal “Weather, Climate and Society“ of the American Meteorological Society
55© 2014 Munich Re

Decadal changes of Specific Humidity of the lower atmosphere between 1973 and 2012
Source: Willett et. al. (2013), Clim. Past, 9, 657–677
Black dots:regions with significant trend
56© 2014 Munich Re
Water content of the atmosphere has already increased
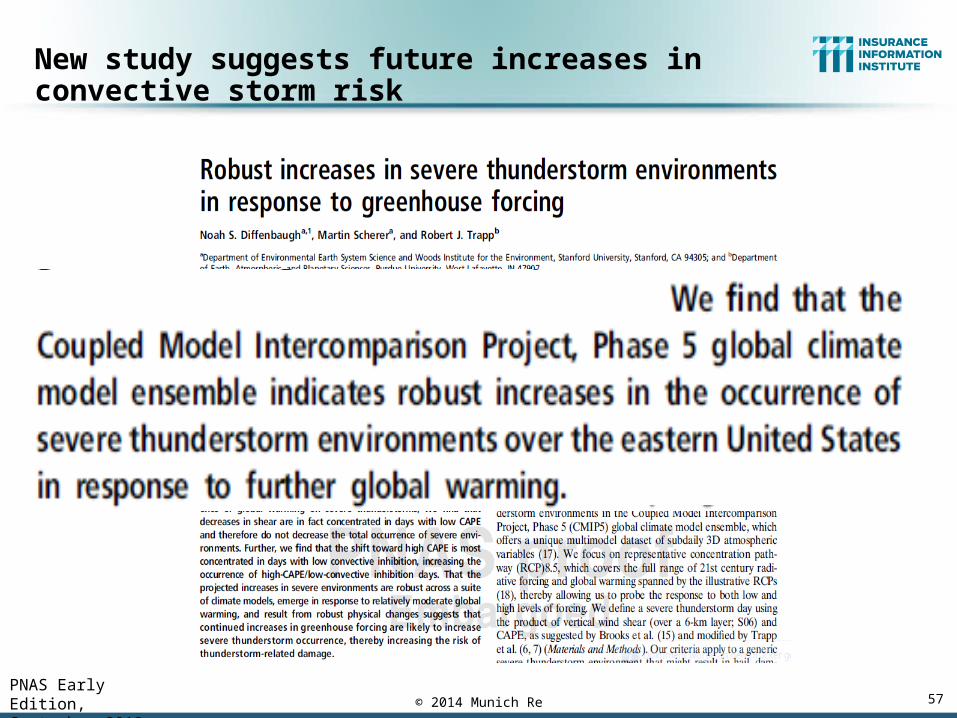
New study suggests future increases in convective storm risk
PNAS Early Edition, September 2013 57© 2014 Munich Re
Convective Storms
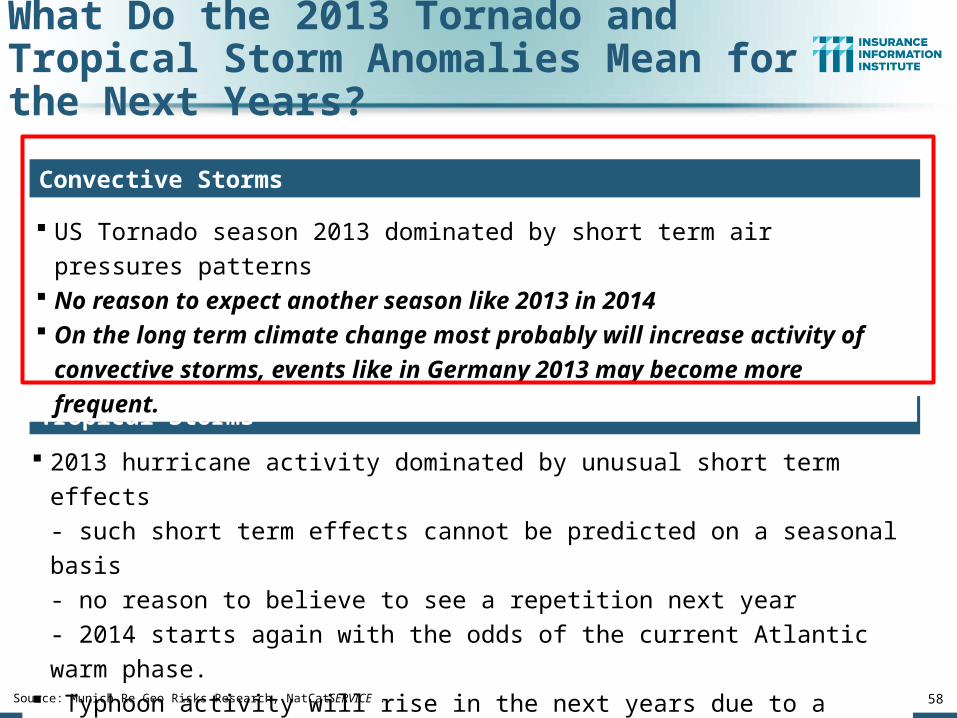
What Do the 2013 Tornado and Tropical Storm Anomalies Mean for the Next Years?
2013 hurricane activity dominated by unusual short term effects
- such short term effects cannot be predicted on a seasonal basis
- no reason to believe to see a repetition next year
- 2014 starts again with the odds of the current Atlantic warm phase. Typhoon activity will rise in the next years due to a natural oscillation
2013 a first indicator of this?
Tropical Storms
US Tornado season 2013 dominated by short term air pressures patterns No reason to expect another season like 2013 in 2014 On the long term climate change most probably will increase activity of
convective storms, events like in Germany 2013 may become more
frequent.
58Source: Munich Re Geo Risks Research, NatCatSERVICE .

www.iii.org
Thank you for your timeand your attention!
Twitter: twitter.com/bob_hartwigDownload at www.iii.org/presentations
Insurance Information Institute Online:
59