Embed Size (px)
Citation preview

TORNADO
H A Z A R D M I T I G A T I O N P L A N U P D A T E : P R O T E C T I N G T H E R E G I O N A G A I N S T A L L H A Z A R D S
Hazard Description ........................................................................................................................................ 1
Location ......................................................................................................................................................... 2
Extent ............................................................................................................................................................ 2
Historical Occurrences .................................................................................................................................. 5
Probability of Future Events ....................................................................................................................... 16
Impact and Vulnerability ............................................................................................................................. 16
Hazard Description
Tornadoes are among the most violent storms on the planet. A tornado is a violently rotating column of
air extending between, and in contact with, a cloud and the surface of the earth. The most violent
tornadoes are capable of tremendous destruction with wind speeds of 250 miles per hour or more. In
extreme cases, winds may approach 300 miles per hour. Damage paths can be in excess of one mile
wide and 50 miles long.
The most powerful tornadoes are produced by “super‐cell thunderstorms.” These storms are affected
by horizontal wind shears (winds moving in different directions at different altitudes) that begin to
rotate the storm. This horizontal rotation can be
tilted vertically by violent updrafts, and the rotation
radius can shrink, forming a vertical column of very
quickly swirling air. This rotating air can eventually
reach the ground, forming a tornado.
Severe thunderstorms can produce tornadoes, high
winds, and hail—any of which can cause extensive
property damage and loss of life. Thunderstorms
form when warm, moist air collides with cooler,
drier air. Since these masses tend to come together
during the transition from summer to winter, most
thunderstorms occur during the spring and fall
months.
Tornadoes occasionally accompany tropical storms and hurricanes that move over land. Tornadoes are
the most common to the right and front of the storm center path as it comes ashore. Tornadoes vary in
terms of duration, wind speed and the toll that they take, as shown in Table 9‐1.

S E C T I O N 9 : T O R N A D O
Hazard Mitigation Plan Update | 2011‐2016 2
Table 9‐1. Variations Among Tornadoes
WEAK TORNADOES STRONG TORNADOES VIOLENT TORNADOES
69% of all tornadoes
Less than 5% of tornado deaths
Lifetime 1‐10+ minutes
Winds less than 110 mph
29% of all tornadoes
Nearly 30% of all tornado deaths
May last 20 minutes or longer
Winds 110 – 205 mph
2% of all tornadoes
70% of all tornado deaths
Lifetime can exceed one hour
Winds greater than 205 mph
Location
While historical tornado events total 144 from 1950 to 2009, locations of these incidents are completely
random and unpredictable. Any area is as vulnerable as another. More vulnerable areas may be in
unincorporated areas of counties where construction codes are not enforceable.
Because tornadoes often cross jurisdictional boundaries, all existing and future buildings, facilities and
populations are considered to be exposed to this hazard and could potentially be impacted. It is
important to note that only reported tornadoes with georeferenced point data have been factored into
this vulnerability assessment.
Extent
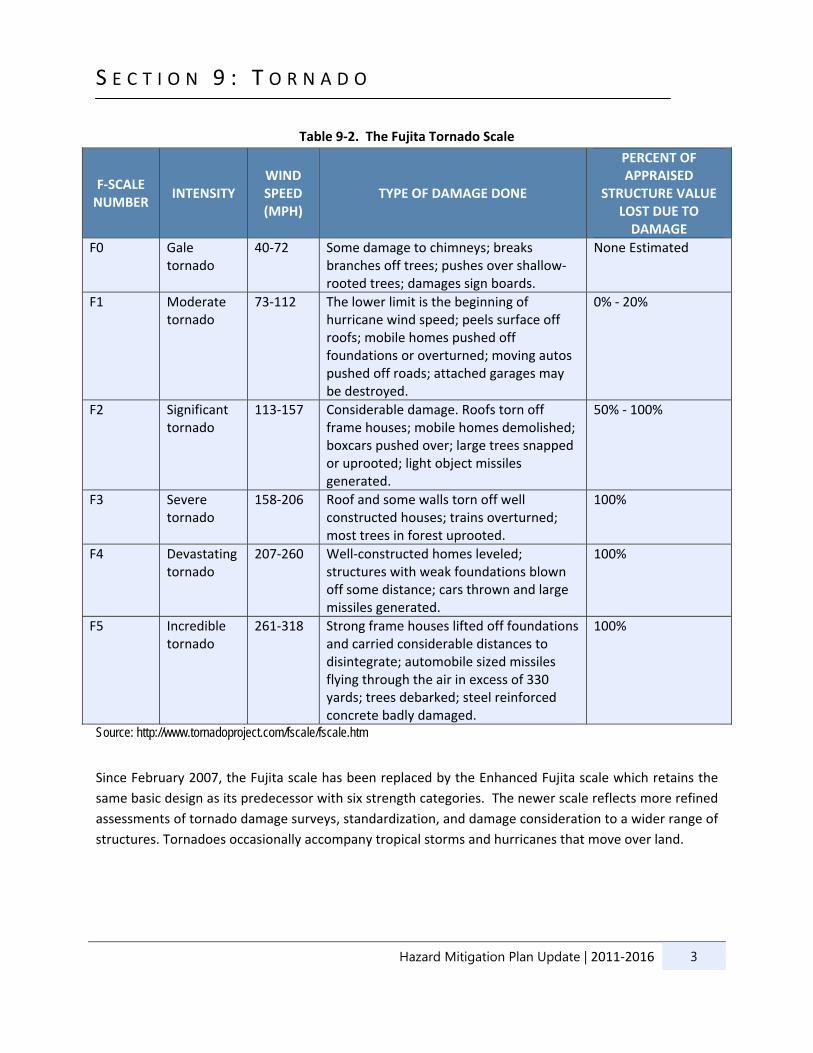
A tornado is given a Fujita rating of 0‐5, based on the most intense damage along its path. Wind
velocities necessary to produce center damage are often associated with the Fujita category, but that
practice is often misleading. The Fujita wind estimates are intended to be based upon the expected
damage to a well‐built residential structure. Poorly built structures can suffer significant structural
damage under lesser winds than the Fujita Scale might suggest. Commercial properties may or may not
experience the same failures under high wind speeds as a residence. Thus, the Fujita scale is largely a
residential scale, with much more care required in assessment after wind damage to a commercial
structure. A wider range of construction techniques and materials can be found in a building section
classified as commercial. For example, a concrete/steel reinforced building is much more durable than a
typical community convenience store, yet both may be considered commercial in city land use/appraisal
data sets.
S E C T I O N 9 : T O R N A D O
Hazard Mitigation Plan Update | 2011‐2016 3
Table 9‐2. The Fujita Tornado Scale
F‐SCALE NUMBER
INTENSITY WIND SPEED (MPH)
TYPE OF DAMAGE DONE
PERCENT OF APPRAISED
STRUCTURE VALUE LOST DUE TO DAMAGE
F0 Gale tornado
40‐72 Some damage to chimneys; breaks branches off trees; pushes over shallow‐rooted trees; damages sign boards.
None Estimated
F1 Moderate tornado
73‐112 The lower limit is the beginning of hurricane wind speed; peels surface off roofs; mobile homes pushed off foundations or overturned; moving autos pushed off roads; attached garages may be destroyed.
0% ‐ 20%
F2 Significant tornado
113‐157 Considerable damage. Roofs torn off frame houses; mobile homes demolished; boxcars pushed over; large trees snapped or uprooted; light object missiles generated.
50% ‐ 100%
F3 Severe tornado
158‐206 Roof and some walls torn off well constructed houses; trains overturned; most trees in forest uprooted.
100%
F4 Devastating tornado
207‐260 Well‐constructed homes leveled; structures with weak foundations blown off some distance; cars thrown and large missiles generated.
100%
F5 Incredible tornado
261‐318 Strong frame houses lifted off foundations and carried considerable distances to disintegrate; automobile sized missiles flying through the air in excess of 330 yards; trees debarked; steel reinforced concrete badly damaged.
100%
Source: http://www.tornadoproject.com/fscale/fscale.htm
Since February 2007, the Fujita scale has been replaced by the Enhanced Fujita scale which retains the
same basic design as its predecessor with six strength categories. The newer scale reflects more refined
assessments of tornado damage surveys, standardization, and damage consideration to a wider range of
structures. Tornadoes occasionally accompany tropical storms and hurricanes that move over land.

S E C T I O N 9 : T O R N A D O
Hazard Mitigation Plan Update | 2011‐2016 4
Table 9‐3. Enhanced Fujita Scale for Tornadoes
Both the Fujita Scale and Enhanced Fujita Scale should be referenced in reviewing previous occurrences
as tornado events prior to 2007 will follow the original Fujita Scale.
The range of intensity for a tornado for GBRA jurisdictions can be anywhere from as low as an EF0, with
gusts up to 85 miles per hour, to an EF5, which is an incredible storm with winds at over 200 miles per
hour.
The jurisdictions in the planning area experience a uniform range of intensity for a tornado as evidenced
by the location and historical occurrences. For all historical occurrences, magnitude is depicted in
Figures 9‐3 to 9‐10 and Table 9‐3 for each county. In addition, Figure 9‐1 below shows the average wind
STORM
CATEGORY
DAMAGE
LEVEL
3 SECOND
GUST
(MPH)
DESCRIPTION OF DAMAGES PHOTO
EXAMPLE
EF0 GALE 65–85
Some damage to chimneys; breaks branches off trees;
pushes over shallow‐rooted trees; damages to sign
boards.
EF1 WEAK 86–110
The lower limit is the beginning of hurricane wind speed;
peels surface off roofs; mobile homes pushed off
foundations or overturned; moving autos pushed off the
roads; attached garages might be destroyed.
EF2 STRONG 111–135
Considerable damage. Roofs torn off frame houses;
mobile homes demolished; boxcars pushed over; large
trees snapped or uprooted; light object missiles
generated.
EF3 SEVERE 136–165 Roof and some walls torn off well‐constructed houses;
trains overturned; most trees in forest uprooted.
EF4 DEVASTATING 166–200
Well‐constructed houses leveled; structures with weak
foundations blown off some distance; cars thrown and
large missiles generated.
EF5 INCREDIBLE 200+
Strong frame houses lifted off foundations and carried
considerable distances to disintegrate; automobile sized
missiles fly through the air in excess of 100 meters; trees
debarked; steel re‐enforced concrete structures badly
damaged.
S E C T I O N 9 : T O R N A D O
Hazard Mitigation Plan Update | 2011‐2016 5
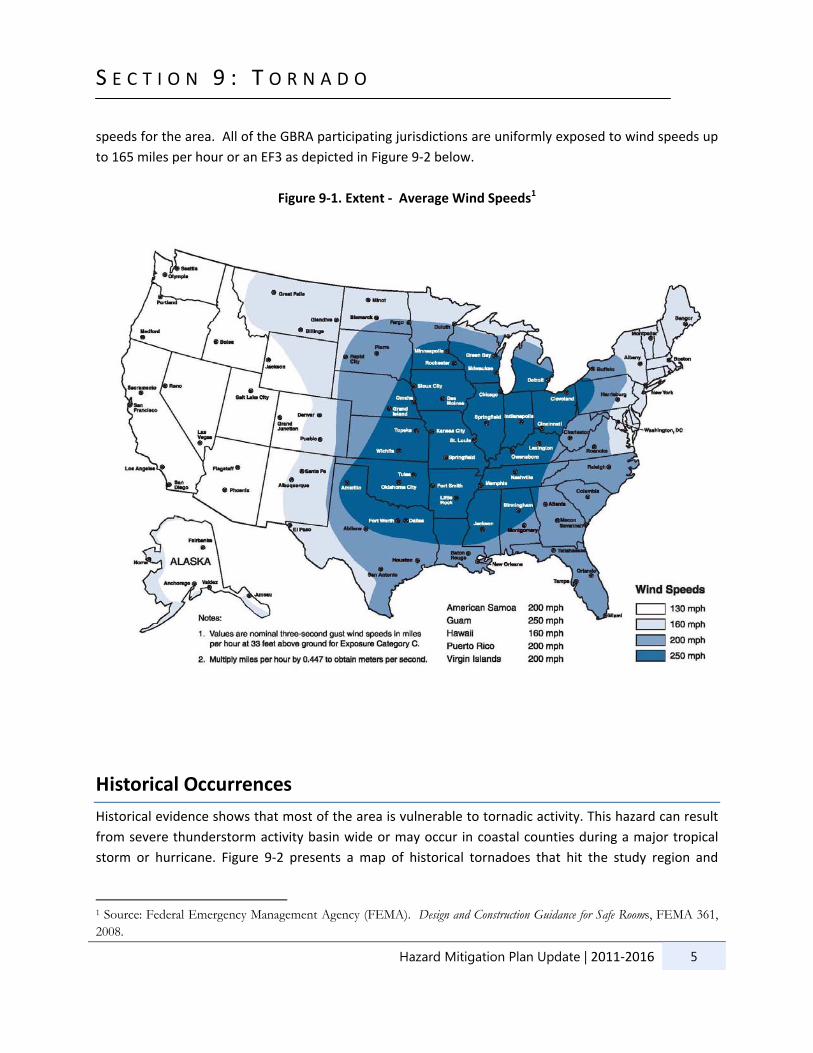
speeds for the area. All of the GBRA participating jurisdictions are uniformly exposed to wind speeds up
to 165 miles per hour or an EF3 as depicted in Figure 9‐2 below.
Figure 9‐1. Extent ‐ Average Wind Speeds1
Historical Occurrences
Historical evidence shows that most of the area is vulnerable to tornadic activity. This hazard can result
from severe thunderstorm activity basin wide or may occur in coastal counties during a major tropical
storm or hurricane. Figure 9‐2 presents a map of historical tornadoes that hit the study region and
1 Source: Federal Emergency Management Agency (FEMA). Design and Construction Guidance for Safe Rooms, FEMA 361, 2008.

S E C T I O N 9 : T O R N A D O
Hazard Mitigation Plan Update | 2011‐2016 6
Figures 9‐3 to 9‐10 provide an illustration of occurrences per county. Table 9‐4 shows aggregated
historical information by jurisdiction.
Figure 9‐2. Spatial Historical Tornado Events (NOAA Data 1950–2008)

S E C T I O N 9 : T O R N A D O
Hazard Mitigation Plan Update | 2011‐2016 7
Figure 9‐3. Historical Tornado Events in Caldwell County

S E C T I O N 9 : T O R N A D O
Hazard Mitigation Plan Update | 2011‐2016 8
Figure 9‐4. Historical Tornado Events in Calhoun County

S E C T I O N 9 : T O R N A D O
Hazard Mitigation Plan Update | 2011‐2016 9
Figure 9‐5. Historical Tornado Events in DeWitt County

S E C T I O N 9 : T O R N A D O
Hazard Mitigation Plan Update | 2011‐2016 10
Figure 9‐6. Historical Tornado Events in Gonzales County

S E C T I O N 9 : T O R N A D O
Hazard Mitigation Plan Update | 2011‐2016 11
Figure 9‐7. Historical Tornado Events in Kendall County

S E C T I O N 9 : T O R N A D O
Hazard Mitigation Plan Update | 2011‐2016 12
Figure 9‐8. Historical Tornado Events in Refugio County

S E C T I O N 9 : T O R N A D O
Hazard Mitigation Plan Update | 2011‐2016 13
Figure 9‐9. Historical Tornado Events in Victoria County

S E C T I O N 9 : T O R N A D O
Hazard Mitigation Plan Update | 2011‐2016 14
Figure 9‐10. Historical Tornado Events in Cibolo (in Guadalupe County)
S E C T I O N 9 : T O R N A D O
Hazard Mitigation Plan Update | 2011‐2016 15
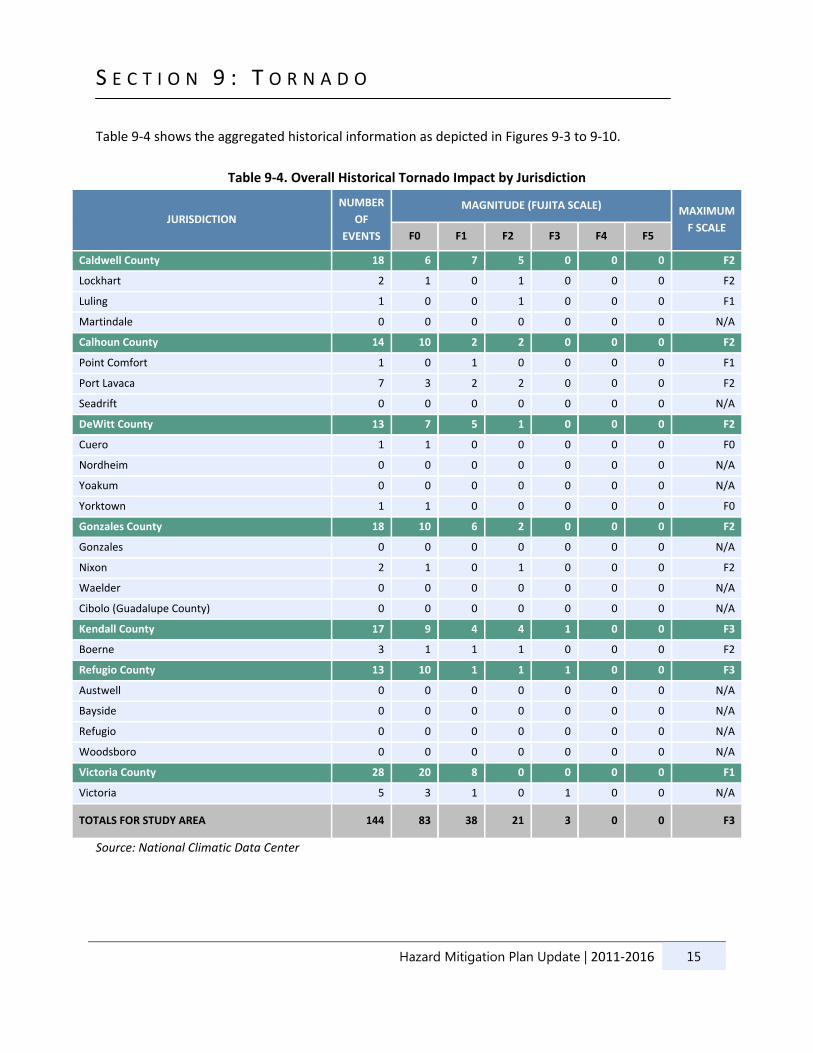
Table 9‐4 shows the aggregated historical information as depicted in Figures 9‐3 to 9‐10.
Table 9‐4. Overall Historical Tornado Impact by Jurisdiction
JURISDICTION
NUMBER
OF
EVENTS
MAGNITUDE (FUJITA SCALE) MAXIMUM
F SCALE F0 F1 F2 F3 F4 F5
Caldwell County 18 6 7 5 0 0 0 F2
Lockhart 2 1 0 1 0 0 0 F2
Luling 1 0 0 1 0 0 0 F1
Martindale 0 0 0 0 0 0 0 N/A
Calhoun County 14 10 2 2 0 0 0 F2
Point Comfort 1 0 1 0 0 0 0 F1
Port Lavaca 7 3 2 2 0 0 0 F2
Seadrift 0 0 0 0 0 0 0 N/A
DeWitt County 13 7 5 1 0 0 0 F2
Cuero 1 1 0 0 0 0 0 F0
Nordheim 0 0 0 0 0 0 0 N/A
Yoakum 0 0 0 0 0 0 0 N/A
Yorktown 1 1 0 0 0 0 0 F0
Gonzales County 18 10 6 2 0 0 0 F2
Gonzales 0 0 0 0 0 0 0 N/A
Nixon 2 1 0 1 0 0 0 F2
Waelder 0 0 0 0 0 0 0 N/A
Cibolo (Guadalupe County) 0 0 0 0 0 0 0 N/A
Kendall County 17 9 4 4 1 0 0 F3
Boerne 3 1 1 1 0 0 0 F2
Refugio County 13 10 1 1 1 0 0 F3
Austwell 0 0 0 0 0 0 0 N/A
Bayside 0 0 0 0 0 0 0 N/A
Refugio 0 0 0 0 0 0 0 N/A
Woodsboro 0 0 0 0 0 0 0 N/A
Victoria County 28 20 8 0 0 0 0 F1
Victoria 5 3 1 0 1 0 0 N/A
TOTALS FOR STUDY AREA 144 83 38 21 3 0 0 F3
Source: National Climatic Data Center

S E C T I O N 9 : T O R N A D O
Hazard Mitigation Plan Update | 2011‐2016 16
Probability of Future Events
Although at a lower risk than other Texas counties, it is expected that there will be one to six tornadoes
in the GBRA area annually. It is highly likely that the planning area can expect a tornado event at least
once annually.
Figure 9‐10. Tornado Risk Zones2
Seasonal patterns are relevant to tornadoes. Thunderstorms form when warm, moist air collides with
cooler, drier air. Since these masses tend to come together during the transition from summer to
winter, most thunderstorms and resulting tornadoes occur during the spring (April through June) and
fall (October through December). Warning time for tornadoes is minimal and ranges from no warning
time to 30 minutes.
Impact and Vulnerability
Impact describes potential severity of damages. While 144 tornado events of magnitudes F0 through F3
have impacted the planning area from 1950 to 2009, no fatalities in the planning area have been
reported and less than 10 percent of property was destroyed or suffered major damage. Therefore,
potential severity of tornado impact is limited.
2 From the Texas Hazard Mitigation Package, thmp.info
S E C T I O N 9 : T O R N A D O
Hazard Mitigation Plan Update | 2011‐2016 17
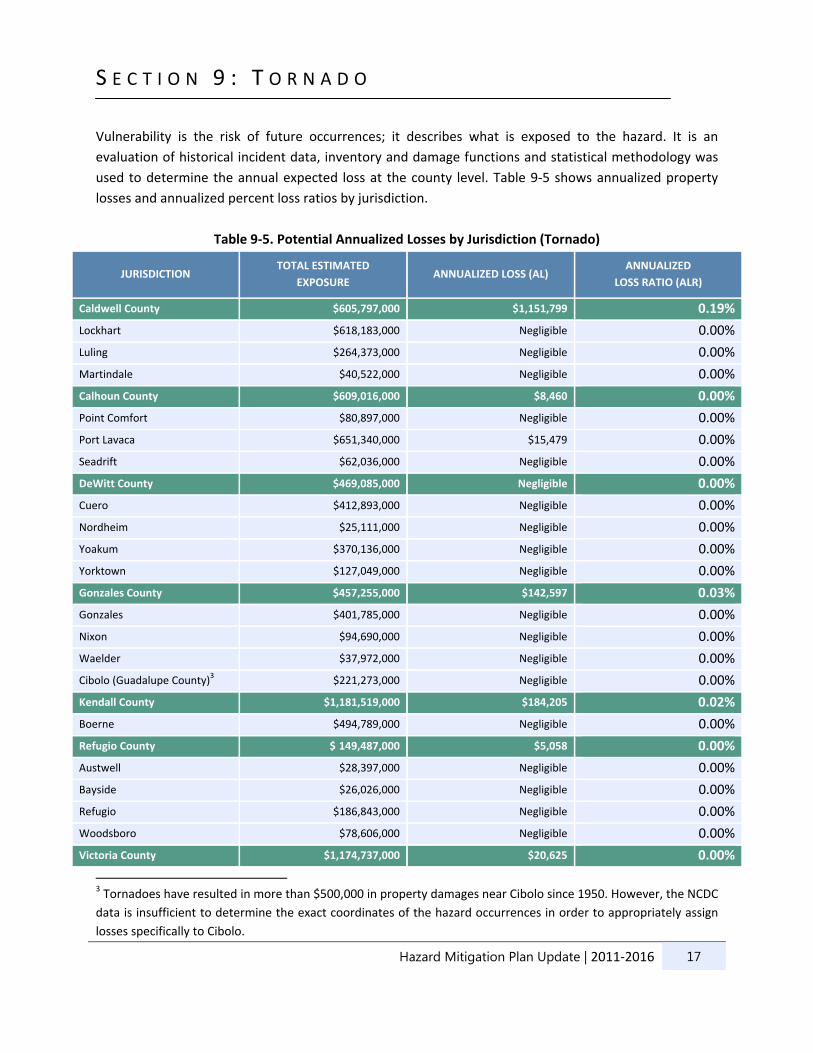
Vulnerability is the risk of future occurrences; it describes what is exposed to the hazard. It is an
evaluation of historical incident data, inventory and damage functions and statistical methodology was
used to determine the annual expected loss at the county level. Table 9‐5 shows annualized property
losses and annualized percent loss ratios by jurisdiction.
Table 9‐5. Potential Annualized Losses by Jurisdiction (Tornado)
JURISDICTION TOTAL ESTIMATED
EXPOSURE ANNUALIZED LOSS (AL)
ANNUALIZED
LOSS RATIO (ALR)
Caldwell County $605,797,000 $1,151,799 0.19%
Lockhart $618,183,000 Negligible 0.00%
Luling $264,373,000 Negligible 0.00%
Martindale $40,522,000 Negligible 0.00%
Calhoun County $609,016,000 $8,460 0.00%
Point Comfort $80,897,000 Negligible 0.00%
Port Lavaca $651,340,000 $15,479 0.00%
Seadrift $62,036,000 Negligible 0.00%
DeWitt County $469,085,000 Negligible 0.00%
Cuero $412,893,000 Negligible 0.00%
Nordheim $25,111,000 Negligible 0.00%
Yoakum $370,136,000 Negligible 0.00%
Yorktown $127,049,000 Negligible 0.00%
Gonzales County $457,255,000 $142,597 0.03%
Gonzales $401,785,000 Negligible 0.00%
Nixon $94,690,000 Negligible 0.00%
Waelder $37,972,000 Negligible 0.00%
Cibolo (Guadalupe County)3 $221,273,000 Negligible 0.00%
Kendall County $1,181,519,000 $184,205 0.02%
Boerne $494,789,000 Negligible 0.00%
Refugio County $ 149,487,000 $5,058 0.00%
Austwell $28,397,000 Negligible 0.00%
Bayside $26,026,000 Negligible 0.00%
Refugio $186,843,000 Negligible 0.00%
Woodsboro $78,606,000 Negligible 0.00%
Victoria County $1,174,737,000 $20,625 0.00%
3 Tornadoes have resulted in more than $500,000 in property damages near Cibolo since 1950. However, the NCDC
data is insufficient to determine the exact coordinates of the hazard occurrences in order to appropriately assign
losses specifically to Cibolo.

S E C T I O N 9 : T O R N A D O
Hazard Mitigation Plan Update | 2011‐2016 18
JURISDICTION TOTAL ESTIMATED
EXPOSURE ANNUALIZED LOSS (AL)
ANNUALIZED
LOSS RATIO (ALR)
Victoria $3,942,383,000 $30,799 0.00%
TOTALS FOR STUDY AREA4 $12,812,200,000 $1,559,022 0.24%
Sources: HAZUS‐MH MR4 (total exposure) and NCDC (annualized losses)
4 Totals for the study area may include values less than $5,000 for amounts that are classified as “Negligible” in the
table.