Embed Size (px)
Citation preview

TOPSReport:AnalysisoftheTOPSProgramfrom2005-
2014
LouisianaBoardofRegentsDecember2015

2
Act1202of2001andAct587of2014
Act1202ofthe2001RegularLegislativeSessionchargedtheBoardofRegents(BoR)withdevelopingauniformTOPSreportingsystemforthepurposesofpolicyanalysisandprogramevaluation,andtoprovideaccuratedataandstatisticsrelativetotheprogram’simpactontheStateandonstudents.InadditiontothedevelopmentofaTOPSreportingsystem,Act1202alsorequiredtheBoRtoprepareareporttoanalyzevariousaspectsoftheTOPSprogram(Act1202isincludedinAppendixA).Tosatisfythereportingrequirements,BoRstaffdevelopedinterfacesbetweenthemajorsystemsneededtoidentifyandtrackTOPSstudentsastheymovethroughthepostsecondaryeducationenrollmentcycle.AccordingtoAct1202,the“TOPSreport”shouldinclude:
• Ananalysisoftherelationshipbetweenthehighschoolcoursestakenandstudents’scoreontheAmericanCollegeTest(ACT);
• ThenumberofhighschoolgraduateswhoareeligibleforTOPSandsubsequentlyenrollincollege;
• Persistence(retention)ratesofTOPSstudents;• Thenumberofandreasonsforstudentslosingawardeligibility;and• Graduationrates.
Act587(AppendixB)ofthe2014RegularLegislativeSessionaddedseveraladditionallevelsofanalysestotheannualTOPSreport,including:
• Demographicinformationofprogramawardrecipients;• HighschoolGPAandACTscoresofprogramawardrecipientsgroupedbymean,
median,andmode;and• AveragehighschoolGPAandaverageACTscoresofthosewholosttheawardandthose
whowereplacedonprobationarystatus.
ItisimportanttomentionthatACT587ofthe2014RegularLegislativeSessionmandatesthatthisreportbesubmittedtotheSenateCommitteeonEducationandtheHouseCommitteeonEducation,nolaterthanDecember1stofeachyear.Therefore,inordertocomplywiththeAct’sestablisheddeadline,thedataonthe2015-16TOPSrecipientsarenotincluded.
BriefHistoryoftheTaylorOpportunityProgramforStudents(TOPS)
TheTaylorOpportunityProgramforStudents(TOPS),Louisiana’smerit-basedstudentaidprogram,wascreatedviaAct1375duringthe1997RegularLegislativeSession.ThefirstfreshmanclasstoreceiveTOPSawardsenteredpostsecondaryeducationinthefallof1998.Althoughthefoundinglegislationdoesnotdirectlydocumentthegoalsoftheprogram,thefourgenerallyacceptedpurposesofTOPSareto:
• Promoteacademicsuccessbyrequiringcompletionofarigoroushighschoolcorecurriculum;
• Providefinancialincentivesasarewardforgoodacademicperformance;

3
• KeepLouisiana’sbestandbrightestintheStatetopursuepostsecondaryeducationalopportunitiesandbecomeproductivemembersofLouisiana’sworkforce;and
• Promoteaccesstoandsuccessinpostsecondaryeducation.
EligibilityCriteria,LevelsofAward,RenewalRequirements,DistributionofAwards
TherearefourTOPSawardsavailabletostudentsenrollingatLouisiana’scollegesanduniversities:TOPSTech,Opportunity,Performance,andHonors.BecausetheTOPSTechawardhasbeenhistoricallyunderutilized,thisreportfocusesonlyonthosestudentsreceivinganOpportunity,PerformanceorHonorsaward(somelimitedstatisticalanalysisontheTOPSTechawardcanbefoundinAppendixC).Act230ofthe2015RegularSessionmadechangestotheTOPSTechprogram.UnderAct230,studentsgraduatingfromhighschoolduringthe2016-17schoolyearandthereafterwillonlybeabletousetheTOPSTechAwardtopursueanassociate'sdegreeorothershorter-termtrainingandeducationprograms,includingskill,occupational,vocational,technical,certificate,andacademic,thattheWorkforceInvestmentCouncilandtheBoardofRegentsdeterminearealignedtostateworkforcepriorities.Thesechangesareexpectedtoincreaseparticipation,allowingforamoredetailedanalysisoftheTOPSTechprograminsubsequentreports. ThecriteriaforeligibilityfortheOpportunity,PerformanceandHonorsawardsincludecompletionofadefinedhighschoolcorecurriculum,withaminimumgradepointaverage(GPA)incorecourses,andaminimumACTcompositescore.Table1listscurrenteligibilitycriteriaandawardcomponentsofTOPS.
Table1:TOPSEligibilityCriteriaandAwardComponents,2015
Award
Core
CoreGPAACT
Composite
AwardComponents
DurationOpportunity
19Units
2.50
20
Full-TimeTuition
4years,or8semesters
Performance
19Units
3.00
23
Full-TimeTuition+$400/year
4years,or8semesters
Honors
19Units
3.00
27
Full-TimeTuition+$800/year
4years,or8semesters
Source:LOSFAwebsite-TOPSBrochuresandFlyers
Currently,theTOPSCoreCurriculumconsistsof19units(thespecificcourserequirementsoftheTOPSCoreCurriculumarecontainedinAppendixD).
AdministrationofTOPSisstatutorilyassignedtotheLouisianaStudentFinancialAssistanceCommission(LASFAC).TheLouisianaOfficeofStudentFinancialAssistance(LOSFA)administersTOPSunderthedirectionofLASFAC.ProgrameligibilityisdeterminedprimarilybyusingtheFreeApplicationforFederalStudentAid(FAFSA)orTOPSOn-LineApplication;thehighschooltranscriptfromtheDepartmentofEducation’sStudentTranscriptSystem(STS);andofficialACTscores.
Tomaintaineligibility,TOPSrecipientsmustbecontinuouslyenrolledasfull-timestudents,earnatleast24semesterhoursequivalentofcrediteachacademicyear(fall,springandsummer),andmaintainacademicprogressasdemonstratedbythecumulativegradepointaverage.Table2lists

4
theminimumrenewalrequirementsforeachaward.ContinuingeligibilityisdeterminedbyLOSFAbasedondatareceivedfromthepostsecondaryinstitutioninwhichthestudentisenrolled.
Table2:RenewalRequirements,2015
Award
Hrs.Earned/Academic
Year
Cum.GPAEachAcademicYr.(2.0eachsemester/term)
AwardReinstated(Uponrecoveryofreq.
GPA)Opportunity
24
2.30-firstyear1;2.50-subsequentyears2
Yes
Performance 24 3.00 Yes,asOpportunityHonors 24 3.00 Yes,asOpportunity1Studentsmusthaveearneda2.30GPAattheendofthefirstAcademicYear(between24-47hoursofearnedcredit).2Studentsmusthaveearneda2.50GPAattheendofallotherAcademicYears(once48hourshavebeenearned).Source:LOSFAwebsite-TOPSBrochuresandFlyersTable3illustratesthedistributionofTOPSawardsacrosssystemsfortheAY2014-15.InAY2014-15,themajority(53.0%)ofTOPSawardswenttostudentsattendingaULSystemcampus.Dataalsoindicatethatthemajority(52.8%)ofstudentswithTOPSawardshadanOpportunityaward.Ofstudentswiththehighestlevelofaward,theHonorsaward,47.2%attendedanLSUSystemcampus.
Table3:DistributionofAwardTypesacrossSystems,AY2014-2015Award
LSUSystem
SouthernSystem
ULSystem
LCTCSystem
PrivateInstitutions
ProprietarySchools
%ofallawards
Opportunity 27.4% 2.0% 56.6% 7.7% 5.9% 0.5% 52.8%Performance 34.9% 0.7% 55.6% 2.5% 6.1% 0.2% 25.9%Honors 47.2% 0.2% 41.0% 0.5% 11.1% 0.0% 21.3%%ofallawards
33.5% 1.3% 53.0% 4.8% 7.1% 0.3%
Source:LOSFA-TOPSPaymentSummarybyAwardLevelforAcademicYear2014-2015asof07-24-15.
TOPSReport:HistoricalAnalysisoftheTOPSProgram,2005-2014
ThedatainthisreportincludecurrentandhistoricaldataonTOPSstudents(studentsreceivinganOpportunity,Performance,orHonorsaward)andnon-TOPSstudents,toallowforcomparison.Someofthedataprovidedinthe“Preparation”section,andallofthedataprovidedinthe“Participation,”“Persistence”and“Graduation”sectionsofthisreportdonotincludeprivatepostsecondaryinstitutionssincethoseinstitutionsdonotcurrentlyparticipateinRegents’reportingsystems.AsillustratedinFigureA,thereportispresentedinanorderthatfollowsthestudents’progressionthroughthepostsecondaryenrollmentprocess;frompreparation,toparticipationinpostsecondaryeducation,topersistence,tograduation.

5
FigureA:GraphicalOverviewofReport
Preparation
TOPSacademiceligibilitycriteriarequirestudentstotakehighschoolcoursesthatwillpreparethemforsuccessafterhighschool,particularlyinpostsecondaryeducation.TheTOPSCoreCurriculumisthekeycomponentforeligibilityforaTOPSaward.Withthe2001MasterPlan,theBoRadoptedtheTOPSCoreastheRegents’Core,themostimportantelementoftheminimumstandardsestablishedforadmissiontothestate’spublicfour-yearcollegesanduniversities.Withthischange,studentshadadoubleincentivetocompletethecollege-preparatorycurriculum.
Source:LOSFAinternaldatafilesasofAugust2015.TheTOPSCorewaschangedin2008.AnadditionalMathorSciencerequirementwasadded.
ACTconductedastudyofthe2015Louisianahighschoolgraduates,whichexaminedthecorrelationbetweentheACTCore--whichiscloselyalignedtotheTOPScore--andstudents’
Preparation
• Number&percentageofhighschoolgraduatescompletingtheTOPSCoreCurriculum.• AverageACTscoresofstudentswhocompletetheTOPSCorevs.theaverageACTscoresofstudentswhodonot.
Participation
• PercentageofTOPSeligiblestudentsthatenrollincollegeinLouisiana.• Mean,medianandmodeACTscoreandhighschoolGPAofTOPSrecipients• TOPSrecipientsbyrace,genderandparentalincome
Persistence
• Persistence(retention)ratesofTOPSstudentsvs.non-TOPSstudents.• RetentionofTOPSaward• AverageACTscoreandhighschoolGPAofthosewholosttheiraward
Graduation
• Graduationrates(150%and200%oftime)ofTOPSandnon-TOPSstudents.

6
performanceontheACT.ThefindingsfromthestudyindicatedthatstudentswhoreportedtakingtheACTCoreearnedhighercompositeACTscoresthanstudentswhodidnottaketheACTCore.AccordingtoACT,49,082studentsinthe2015graduatingclasstooktheACTtest.Ofthesestudents,approximately70%tooktheACTCoreand20%tooklessthantheCore.BecausesomestudentsdidnotindicatewhetherornottheycompletedtheACTCore,thenumbersdonotaddupto100%.TheaverageACTcompositeforthosewhocompletedtheACTCorewas20.7;whereastheaverageACTcompositescoreforthosewhodidnotcompletetheACTCorewas16.11.ItisreasonabletoconcludethatbecausetheTOPSCoreandACTCorearecloselyaligned,thatstudentswhocompletetheTOPSCoreearnhigherACTcompositescoresthanstudentswhodidnotcompletetheTOPSCore.AllindicationsarethattheTOPSeligibilitycriteriarequirestudentstotakeamorerigoroushighschoolcurriculum,whichinturnbetterpreparesthemfortheACTandforsuccessinpostsecondaryeducation.Participation
AgenerallyacceptedpurposeofTOPSistoattractandretainLouisiana’shighschoolgraduateswhoaremorelikelytopersistandattainapostsecondarycredential.Infact,acommonsloganassociatedwiththeTOPSprogramhasbeento“retainthebestandbrightest”studentstoattendLouisiana’scollegeswiththehopethattheywillentertheState’sworkforceaftergraduation.Tothatend,ofthe147,635studentsdeemedeligibleforaTOPSOpportunity,PerformanceorHonorsaward,132,975(or90.0%)acceptedtheawardandenrolledinapostsecondaryeducationinstitutioninLouisiana.
Source:LOSFAinternaldatafilesasofAugust2015.
1ACTCoreormoreresultscorrespondtostudentstakingthefourormoreyearsofEnglishandthreeormoreyearsofeachmath,socialstudies,andnaturalscience.
02,0004,0006,0008,00010,00012,00014,00016,00018,00020,000
05-06 06-07 07-08 08-09 09-10 10-11 11-12 12-13 13-14GraduatingHighSchoolCohort
FigureC:NumberEligibleforTOPSvs.NumberofRecipientsthatEnrollinPostsecondaryEducationInstitutions
#Eligible#Enrolled
88.2%ofclassof13-14acceptedTOPS
andenrolled91%ofclassof05-06acceptedTOPSand
enrolled

7
Since2005,boththeaverageACTscoresandhighschoolGPAofTOPSrecipientshaveincreased.Forexample,in2005theaverageACTscoreofTOPSrecipientswas23.By2014,theaverageACTscoreincreasedto24(themedianscorewas23andthemodewas20).Additionally,in2005theaveragehighschoolGPA(CoreGPA)was3.28.By2014,theaveragehighschoolGPAincreasedto3.35(andthemedianGPAwas3.35).BoththeaverageACTscoresandGPAofTOPSrecipientshavebeenconsistentlyhigherthantheminimumrequirementsforaTOPSOpportunityaward.
Table 4: Mean ACT and GPA of TOPS Recipients*
HS Graduating Cohort
TOPS Recipients’ Average Composite
ACT Score
Statewide Average ACT Composite Score**
TOPS Recipients Average
GPA
2005 23 19.8 3.28
2006 23 20.1 3.28
2007 23 20.1 3.29
2008 24 20.1 3.29
2009 24 20.1 3.28
2010 24 20.1 3.30
2011 24 20.2 3.34
2012 24 20.3 3.35
2013 24 19.5 3.36
2014 24 19.2 3.35
*Since 2005, the overall average composite ACT score of TOPS recipients is 23.8; the overall average of GPA is 3.31. ** The statewide average includes all high school graduating students (source ACT profile report). Source:LOSFAinternaldatafilesasofSeptember2015.
Astables5and6indicate,TOPSrecipientsarepredominantlywhite(79%)andfemale(59%).DataindicatetherearelargeracedisparitiesinTOPSrecipients.Thesetrendsarefoundinotherstateswithsimilarlylargemerit-basedscholarshipprograms.DespitetheracedifferencesinTOPSrecipients,thenumberofminoritiesreceivingTOPShasincreasedsignificantlyovertime.Forexample,in2014,2,685AfricanAmericanswereTOPSrecipients,comparedto1,873in2005.Thisrepresentsa43%increasesince2005.
Table5:TOPSRecipients,byRace*HSGraduating
Cohort Asian AmericanIndian
AfricanAmerican White Hispanic Other Total
2005 334 72 1,873 11,383 182 0 13,8442006 364 57 1,881 11,412 195 0 13,9092007 371 69 1,831 11,319 187 0 13,7772008 374 67 1,962 11,448 234 0 14,0852009 397 79 2,072 11,203 237 0 13,9882010 412 79 2,340 11,488 289 0 14,6082011 399 71 2,460 11,529 339 70 14,8682012 479 76 2,807 11,645 421 95 15,5232013 491 82 2,932 12,120 409 136 16,1702014 502 139 2,685 11,773 548 140 15,787
*Itshouldbenotedthat2,520individualsdidnotreporttheirrace.Therefore,theywerenotincludedinthisanalysis.Source:LOSFAinternaldatafilesasofSeptember2015.
8
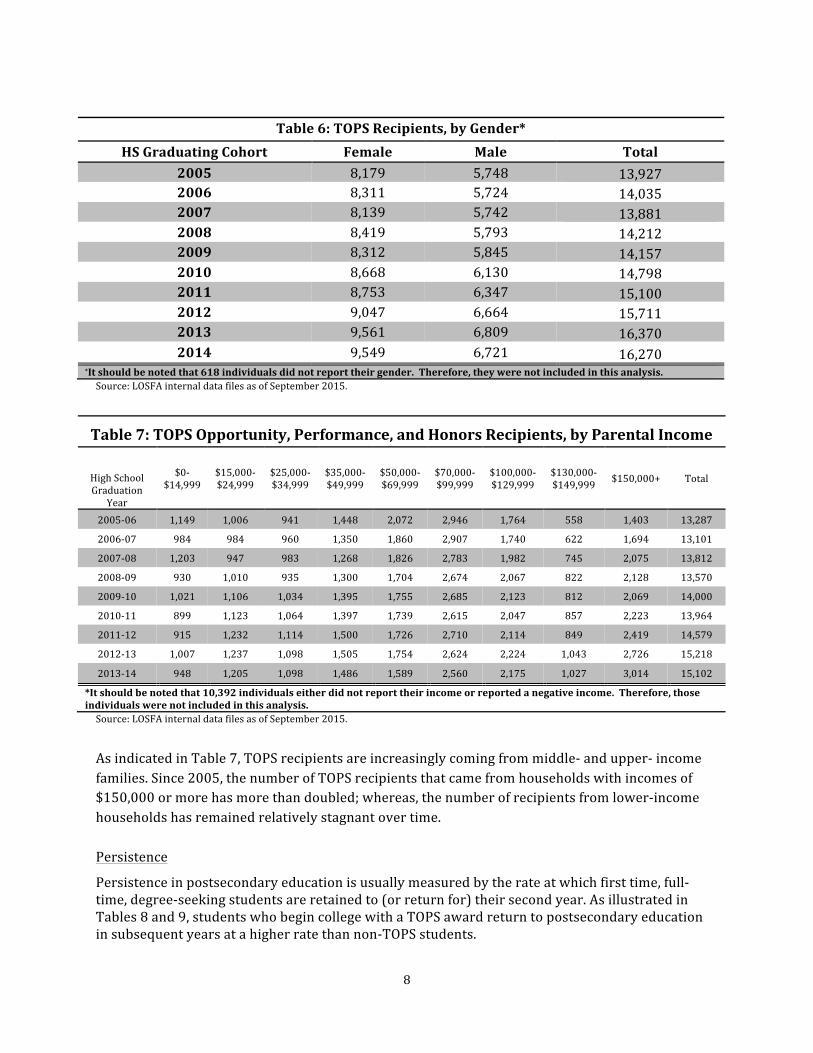
Table6:TOPSRecipients,byGender*
HSGraduatingCohort Female Male Total2005 8,179 5,748 13,9272006 8,311 5,724 14,0352007 8,139 5,742 13,8812008 8,419 5,793 14,2122009 8,312 5,845 14,1572010 8,668 6,130 14,7982011 8,753 6,347 15,1002012 9,047 6,664 15,7112013 9,561 6,809 16,3702014 9,549 6,721 16,270
*Itshouldbenotedthat618individualsdidnotreporttheirgender.Therefore,theywerenotincludedinthisanalysis.Source:LOSFAinternaldatafilesasofSeptember2015.
Table7:TOPSOpportunity,Performance,andHonorsRecipients,byParentalIncome
HighSchoolGraduation
Year
$0-$14,999
$15,000-$24,999
$25,000-$34,999
$35,000-$49,999
$50,000-$69,999
$70,000-$99,999
$100,000-$129,999
$130,000-$149,999 $150,000+ Total
2005-06 1,149 1,006 941 1,448 2,072 2,946 1,764 558 1,403 13,2872006-07 984 984 960 1,350 1,860 2,907 1,740 622 1,694 13,1012007-08 1,203 947 983 1,268 1,826 2,783 1,982 745 2,075 13,8122008-09 930 1,010 935 1,300 1,704 2,674 2,067 822 2,128 13,5702009-10 1,021 1,106 1,034 1,395 1,755 2,685 2,123 812 2,069 14,0002010-11 899 1,123 1,064 1,397 1,739 2,615 2,047 857 2,223 13,9642011-12 915 1,232 1,114 1,500 1,726 2,710 2,114 849 2,419 14,5792012-13 1,007 1,237 1,098 1,505 1,754 2,624 2,224 1,043 2,726 15,2182013-14 948 1,205 1,098 1,486 1,589 2,560 2,175 1,027 3,014 15,102
*Itshouldbenotedthat10,392individualseitherdidnotreporttheirincomeorreportedanegativeincome.Therefore,thoseindividualswerenotincludedinthisanalysis.Source:LOSFAinternaldatafilesasofSeptember2015.AsindicatedinTable7,TOPSrecipientsareincreasinglycomingfrommiddle-andupper-incomefamilies.Since2005,thenumberofTOPSrecipientsthatcamefromhouseholdswithincomesof$150,000ormorehasmorethandoubled;whereas,thenumberofrecipientsfromlower-incomehouseholdshasremainedrelativelystagnantovertime.PersistencePersistenceinpostsecondaryeducationisusuallymeasuredbytherateatwhichfirsttime,full-time,degree-seekingstudentsareretainedto(orreturnfor)theirsecondyear.AsillustratedinTables8and9,studentswhobegincollegewithaTOPSawardreturntopostsecondaryeducationinsubsequentyearsatahigherratethannon-TOPSstudents.

9
Table8examinestheoverallretentionrate(retentionatanypublicpostsecondaryinstitution,notnecessarilytheinstitutioninwhichthestudentstarted)tothesecond,thirdandfourthyearofstudentswhobeganatafour-yearinstitutionwithTOPScomparedtothosewhobeganwithoutTOPS(i.e.,non-TOPSstudents).
Table8:StatewideRetentionRatesofTOPSvs.Non-TOPSStudentsWhoBeganataFour-YearInstitution
FallSemesterEnteringClass
2ndYr.Retention 3rdYr.Retention 4thYr.Retention
TOPS Non-TOPs TOPS Non-TOPS TOPS Non-TOPS
2004 85% 62% 82% 54% 77% 47%2005 88% 68% 81% 56% 76% 49%2006 88% 68% 82% 58% 78% 52%2007 89% 69% 83% 59% 78% 53%2008 90% 70% 83% 58% 79% 53%2009 89% 71% 82% 60% 77% 52%2010 89% 72% 82% 61% 77% 54%2011 88% 71% 81% 59% 75% 52%2012 87% 71% 81% 59% N/A N/A2013 87% 71% N/A N/A N/A N/A
Source:BoRinternaldatafilesasofSeptember2015.Table9examinestheoverallretentionratetothesecondandthirdyearofstudentswhobeganatatwo-yearinstitutionwithTOPScomparedtothosewhobeganwithoutTOPS(i.e.,non-TOPSstudents).
Table9:StatewideRetentionRatesofTOPSvs.Non-TOPSStudentsWhoBeganataTwo-YearInstitution
FallSemesterEnteringClass2ndYr.Retention
TOPS Non-TOPS2004 69% 36%2005 76% 54%2006 74% 57%2007 78% 57%2008 81% 60%2009 78% 55%2010 76% 53%2011 72% 53%2012 74% 52%2013 72% 52%
Source:BoRinternaldatafilesasofSeptember2015.

10
StudentswhoreceiveaTOPSawardmustmaintainminimumacademiccriteriatoretaintheiraward(seeTable2).Theawardiscancelledwhenstudentsfailtomaintainfull-timeandcontinuousenrollment,earntherequired24hoursofcreditperacademicyear,orearntherequiredminimumGPA.AsshowninTable10,thenumberofawardscancelledhasdeclinedovertime.
Furthermore,betweenfall2004andspring2015,172,356studentsreceivedTOPSawards.OftheseTOPSawardrecipients,52,942(31%)hadtheirTOPSawardcancelledatsomepointduringtheirpostsecondaryacademiccareer.Ofthe52,942awardsthatwerecancelled,34,801(66%)werecancelledduetostudents’failuretoearn24hoursofcollegecreditduringanacademicyear.
Table10:PercentageofTOPSAwardsCancelledbyCohort
EnteringCohort
Total#of
Awards
Total#ofAwards
Cancelled*
Cancelled:24Hr.
Requirement
Cancelled:GPA
Requirement
Cancelled:Non-
ContinuousEnrollment
Cancelled:Student
Resignation
2004-2005 14,620 6,048 41% 3,424 23% 353 2% 2,271 16% 730 5%2005-2006 14,443 6,109 42% 3,145 22% 356 2% 2,608 18% 699 5%2006-2007 14,678 6,102 42% 3,819 26% 359 2% 1,924 13% 728 5%2007-2008 14,230 5,777 41% 3,668 26% 496 3% 1,613 11% 658 5%2008-2009 14,922 5,933 40% 3,786 25% 584 4% 1,563 10% 602 4%2009-2010 15,300 5,661 37% 3,576 23% 615 4% 1,470 10% 569 4%2010-2011 15,584 5,020 32% 3,129 20% 658 4% 1,233 8% 647 4%2011-2012 16,045 4,316 27% 2,990 19% 532 3% 794 5% 615 4%2012-2013 16,850 3,673 22% 3,165 19% 435 3% 73 0% 624 4%2013-2014 17,737 2,886 16% 2,692 15% 156 1% 38 0% 596 3%2014-2015 17,947 1,417 8% 1,407 8% 0 0% 10 0% 396 2%
GrandTotal 172,356 52,942 34,801 4,544 13,597 6,864 Source:LOSFAinternaldatafilesasofSeptember2015.TOPSTechawardrecipientsnotincluded.TheaverageACTscoreofalltheTOPSrecipientswhohadtheirawardcancelledbetween2004-05and2014-15(duetoafailureearntherequired24hoursofcreditperacademicyear,earntherequiredminimumGPA,ormaintainfull-timeandcontinuousenrollment)was22.9.AmongthissamegrouptheaveragehighschoolGPAwas3.10(Table11).
Table11:AverageACTScoreandHighSchoolGPAofTOPSRecipientsWhohadTheirAwardCancelled,2004-2015
Avg.ACT Avg.HighSchoolGPACancelled:24Hr.Requirement 22.9 3.10Cancelled:GPARequirement 22.6 3.06Cancelled:Non-ContinuousEnrollment 22.9 3.14

11
Graduation
Graduationistypicallymeasuredbycalculatingtherateatwhichfirst-time,full-timedegreeseekingstudentsearntheiracademicdegreeswithin150%ofthetimerequired(i.e.,withinsixyearsforbaccalaureatedegreesandwithinthreeyearsforassociatedegrees).This150%protocolwasadoptedbythefederalgovernmentandhasbecomethestandardfollowedbythestates.AsFiguresDandEbothillustrate,studentswhobeginabaccalaureatedegreeprogramoranassociatedegreeprogramwithTOPSgraduatewithin150%oftimeatmuchhigherratesthandostudentswithoutaTOPSaward.AsFigureDillustrates,61%ofthe2009first-time,full-timeenteringcohortofTOPSrecipientscompletedabaccalaureatedegreewithin150%oftime,comparedwith33%ofnon-TOPSstudentswhodidsowithinthesametimeframe.
Source:BoRinternaldatafiles.
Source:BoRinternaldatafiles.
60% 59% 61% 61% 62% 64% 61%
25% 25%29% 30% 32% 33% 33%
0%
20%
40%
60%
80%
2003 2004 2005 2006 2007 2008 2009
FigureD:150%StatewideBaccalaureateGraduationRateAmongTOPSandNon-TOPSStudentsFirst-Time,Full-TimeEnteringCohorts
2003-2009
TOPS150% Non-TOPS150%
10%13% 13% 14% 15% 16%
20%17% 17%
4% 5% 5% 5% 5% 4% 5% 4% 4%
0%
5%
10%
15%
20%
25%
2004 2005 2006 2007 2008 2009 2010 2011 2012
FigureE:150%StatewideAssociateGraduationRateAmongTOPSandNon-TOPSStudents
First-Time,Full-TimeEnteringCohorts2004-2012
TOPS150% Non-TOPS150%

12
FiguresF&Gdisplaythecomparisonsbetweenthestandardfederallydefined150%graduationratesversusa200%graduationrate.Again,TOPSrecipientsgraduateatahigherratethannon-TOPSstudents.
Source:BoRinternaldatafiles.
Source:BoRinternaldatafiles.FundingTOPS
AsdepictedinFigureHbelow,theStatespentapproximately$1.9billionfundingtheTOPSprogramfrom1999to2014.Duringthatsametimeperiod,totalexpendituresontheTOPSprogramincreased296%.Thegrowthislargelycontributedtotwofactors:(1)increasesinthenumberofstudentsreceivingtheawardand(2)theincreasingtuitionpricesinthestate’spublicinstitutionsofhighereducation.AsillustratedintheFigureHbelow,in1998-1999,thenumberof
60% 59% 61% 61% 62%67% 65% 66% 67% 68%
25% 25% 29% 30% 32%31% 31% 35% 35% 37%
0%
20%
40%
60%
80%
2003 2004 2005 2006 2007
FigureF:150%and200%StatewideBaccalaureateGraduationRatesamong
TOPSandNon-TOPSStudents
TOPS150% TOPS200% Non-TOPS150% Non-TOPS200%
10%13% 13% 14% 15% 16%
20%
15% 17% 17% 18% 20%23%
27%
4% 5% 5% 5% 5% 4% 5%6%8% 8% 9% 8% 7% 8%
0%5%10%15%20%25%30%
2004 2005 2006 2007 2008 2009 2010
FigureG:150%and200%StatewideAssociateGraduationRatesamong
TOPSandNon-TOPSStudents
TOPS150% TOPS200% Non-TOPS150% Non-TOPS200%

13
TOPSrecipientswas23,614.By2013-14,thenumberofTOPSrecipientsalmostdoubledto47,015.Moreover,since1998-1999,theaverageTOPSawardamountalsonearlydoubled.
FigureH:TOPSProgramFunding,1999-2014
Source:LOSFAinternaldatafilesasofSeptember2015.
Conclusions
InaccordancewithAct1202ofthe2001RegularLegislativeSessionandAct587ofthe2014RegularLegislativeSession,thisreporthasanalyzed:
• Therelationshipbetweenthehighschoolcoursestakenandthestudent’sscoreontheAmericanCollegeTest(ACT);
• ThenumberofhighschoolgraduateswhoareeligibleforTOPSandsubsequentlyenrollincollegeonTOPS;
• Themean,medianandmodeACTscoreandhighschoolGPAofTOPSrecipients;• DemographicinformationonTOPSrecipients;• Thepersistence(retention)ratesofTOPSstudents;• Thenumberofandreasonsforstudentslosingawardeligibility;• ThemeanACTscoreandhighschoolGPAofstudentswholosttheirTOPSaward;• GraduationratesofTOPSstudents;and• HistoricaldataonthecostoftheTOPSprogram,todate.

14
AllindicationsarethattheTOPSeligibilitycriteriarequirestudentstotakeamorerigoroushighschoolcurriculum,whichinturnbetterpreparesthemfortheACTandforsuccessinpostsecondaryeducation.StudentswhotooktheACTCoreearnedahigherGPAthanstudentsthatdidnottaketheACTCore.AlthoughthereareslightvariationsbetweentheACTCoreandTOPSCore,itisreasonabletoconcludethatstudentswhocompletetheTOPSCorealsoearnhigherACTcompositescoresthanstudentswhodidnotcompletetheTOPSCore.DataindicatethattheTOPSprogramhassucceededinkeepingLouisiana’shighschoolgraduatesintheStatetopursuepostsecondaryeducation.Asmentioned,sincethefall2005,ofthe147,635studentsdeemedeligibleforaTOPSOpportunity,PerformanceorHonorsaward,132,975(or90.0%)haveacceptedaTOPSOpportunity,PerformanceorHonorsawardandenrolledinapostsecondaryeducationinstitutioninLouisiana.TOPSrecipientsconsistentlyattainACTscoresandhighschoolGPA’sabovetheminimumrequiredforTOPSeligibility.AmongTOPSrecipientsfrom2005to2014,theaverageACTscorewas24(4pointsabovetherequiredminimumforeligibilityforaTOPSOpportunityaward)andtheaveragehighschoolGPA(CoreGPA)was3.35(significantlyhigherthanthe2.5minimumrequiredforaTOPSOpportunityaward).DataalsoindicatethatthemajorityofTOPSrecipientsarewhite(79%)andfemale(59%).ItisimportanttonotethatalthoughtherearelargeracedifferencesacrossTOPSrecipients,thenumberofminoritiesreceivingTOPShassignificantlyincreasedovertime.AlsoTOPSstudentsareincreasinglycomingfrommiddle-andupper-incomehouseholds. Withregardstopersistence,studentswhobegincollegewithaTOPSawardreturntopostsecondaryeducationinsubsequentyearsatahigherratethannon-TOPSstudents.Overall,approximately31%ofTOPSrecipientsbetween2004-05and2014-15hadtheirawardcancelled,withthemajoritybeingcancelledduetostudents’failuretoearn24hoursofcollegecreditduringanacademicyear.DataindicatethatstudentswhobeginabaccalaureateoranassociatedegreeprogramwithaTOPSawardgraduatewithin150%and200%oftimeatmuchhigherratesthandostudentswithoutaTOPSaward.Dataalsoindicatethat61%ofthe2009first-time,full-timeenteringcohortofTOPSrecipientscompletedabaccalaureatedegreewithin150%oftime,comparedwith33%ofnon-TOPSstudentswhodidsowithinthesametimeframe.
TheState’sgrowinginvestmentinTOPSiscontributedto(1)theincreaseinthenumberofstudentsreceivingtheawardand(2)theincreaseintuitionpricesintheState’spublicinstitutionsofhighereducation.Intotal,theStatehasspentapproximately$1.9billionontheTOPSprogram.Betweenthe1999and2014fiscalyears,totalexpendituresontheTOPSprogramincreased296%.In1998-1999theaverageTOPSawardamountwas$2,286(includingTOPSTech).In2013-2014,theaverageTOPSawardnearlydoubled(includingTOPSTech).Theseincreasesareduetoincreasesinbothenrollmentandtuition,butprimarilyintuition.

ENROLLED
Page 1 of 5
CODING: Words in struck through type are deletions from existing law;words underscored are additions.
Regular Session, 2001
HOUSE BILL NO. 2012
BY REPRESENTATIVE DANIEL
AN ACT
To enact R.S. 17:3048.3 and 3048.4, relative to the Tuition Opportunity
Program for Students; to provide for the establishment and
implementation of a uniform information reporting system; to provide
for applicability; to provide relative to compliance with reporting
system requirements by colleges and universities, including requiring
compliance as a condition of eligibility to receive certain payments by
the state; to require that the reporting system include certain
components; to provide for certain notifications to parents and others
about program availability; and to provide for related matters.
Be it enacted by the Legislature of Louisiana:
Section 1. R.S. 17:3048.3 and 3048.4 are hereby enacted to read as
follows:
§3048.3. Program information reporting system; implementation;
requirements; applicability; participation by eligible institutions
and others
A.(1) The Board of Regents shall formulate, develop, establish,
and implement a uniform Tuition Opportunity Program for Students
information reporting system for the purposes of policy analysis and
program evaluation and for providing accurate data and statistics to the
legislature, the governor and appropriate executive branch agencies,

H.B. NO. 2012 ENROLLED
Page 2 of 5
CODING: Words in struck through type are deletions from existing law;words underscored are additions.
and the public relative to the program’s impact on the state and on
students.
(2) In formulating and developing the information reporting
system, the Board of Regents shall consult with and seek written
recommendations from the Louisiana Student Financial Assistance
Commission, each college or university eligible for participation in the
Tuition Opportunity Program for Students, each of the public
postsecondary education management boards, the Louisiana
Association of Independent Colleges and Universities, legislators, and
knowledgeable others as determined appropriate by the Board of
Regents.
(3) It is the intention of the legislature that the reporting system
provided by this Section and the requirements thereof shall be
applicable to all Tuition Opportunity Program for Students applicants,
all award recipients regardless of eligible college or university attended,
and all such eligible colleges and universities. Effective for the 2002-
2003 award year and thereafter, compliance with the requirements of
the Tuition Opportunity Program for Students information reporting
system shall be a condition for an eligible college or university to
remain eligible to receive payments from the state on behalf of an
award recipient. Compliance determinations shall be made annually by
the Board of Regents.
B. The Tuition Opportunity Program for Students information
reporting system shall include but not be limited to the following:
(1) A report prepared as of the end of the Fall semester and
again as of the end of the Spring semester or equivalent periods of time
during each academic year relative to the rate of retention of program

H.B. NO. 2012 ENROLLED
Page 3 of 5
CODING: Words in struck through type are deletions from existing law;words underscored are additions.
awards by students as they progress from semester to semester or other
equivalent periods of time as may be applicable once enrolled at an
eligible college or university. The data shall be reported by institution
attended, by the two digit classification of instructional program, and
by program award category and shall include the percent of students
losing program eligibility due to not earning the minimum number of
credit hours, the percent of students losing program eligibility due to
not having the required cumulative grade point average, and the percent
of students losing program eligibility for failing to make steady
academic progress.
(2) The persistence rates at colleges and universities of
freshmen, sophomore, junior, and senior students receiving a program
award reported by award category and by award year.
(3) The graduation rates or rates of completion of the chosen
postsecondary education program if otherwise applicable for students
receiving a program award, reported by award category and award year,
including for those graduating with an academic degree at the
baccalaureate level the rate for persons graduating within four years,
within five years, and within six years, respectively.
(4) The mean length of time required for a student receiving a
program award to graduate with an academic degree at the
baccalaureate level or to complete the chosen postsecondary education
program if otherwise applicable with such information being reported
by award category and by award year.
(5) An annual report on the number of applicants as well as the
percent of high school graduates by high school and by parish who
H.B. NO. 2012 ENROLLED
Page 4 of 5
CODING: Words in struck through type are deletions from existing law;words underscored are additions.
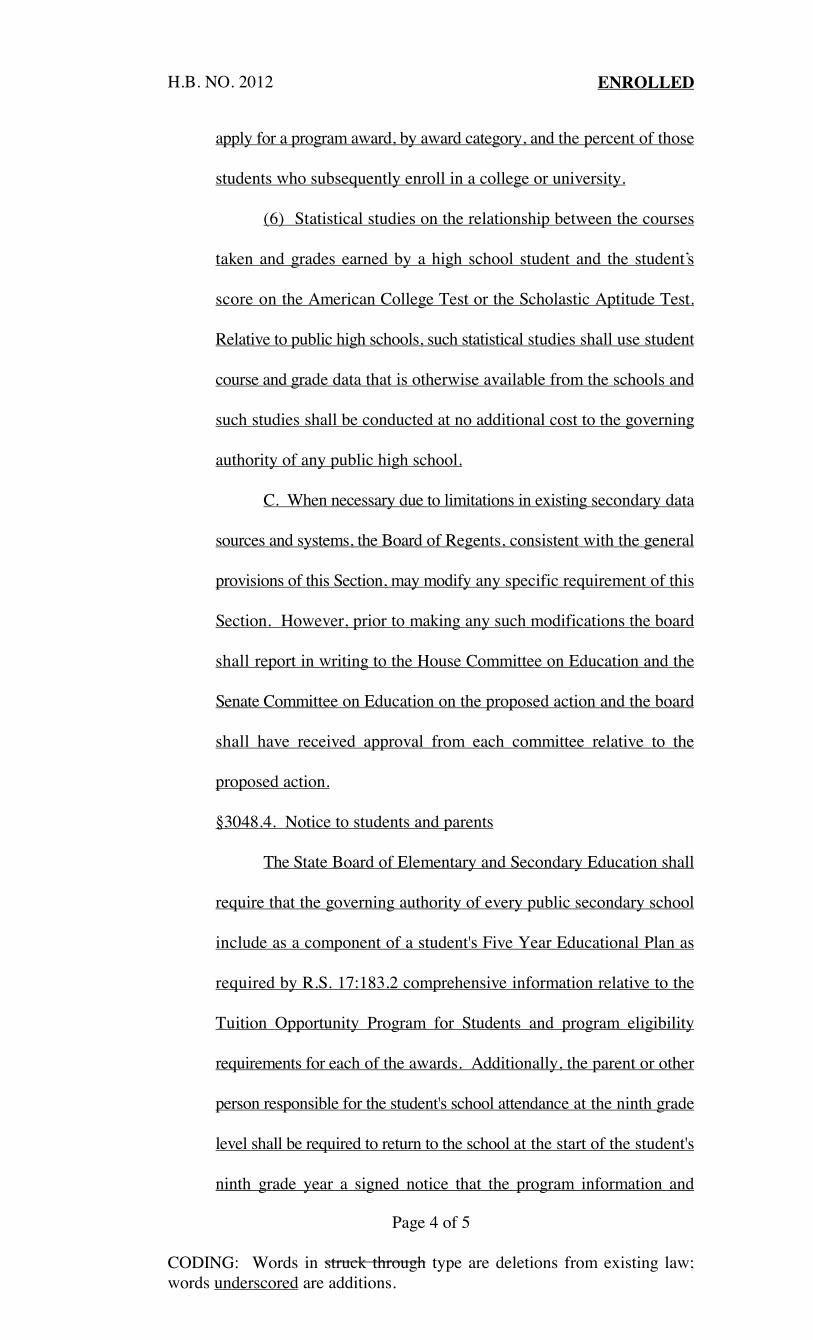
apply for a program award, by award category, and the percent of those
students who subsequently enroll in a college or university.
(6) Statistical studies on the relationship between the courses
taken and grades earned by a high school student and the student’s
score on the American College Test or the Scholastic Aptitude Test.
Relative to public high schools, such statistical studies shall use student
course and grade data that is otherwise available from the schools and
such studies shall be conducted at no additional cost to the governing
authority of any public high school.
C. When necessary due to limitations in existing secondary data
sources and systems, the Board of Regents, consistent with the general
provisions of this Section, may modify any specific requirement of this
Section. However, prior to making any such modifications the board
shall report in writing to the House Committee on Education and the
Senate Committee on Education on the proposed action and the board
shall have received approval from each committee relative to the
proposed action.
§3048.4. Notice to students and parents
The State Board of Elementary and Secondary Education shall
require that the governing authority of every public secondary school
include as a component of a student's Five Year Educational Plan as
required by R.S. 17:183.2 comprehensive information relative to the
Tuition Opportunity Program for Students and program eligibility
requirements for each of the awards. Additionally, the parent or other
person responsible for the student's school attendance at the ninth grade
level shall be required to return to the school at the start of the student's
ninth grade year a signed notice that the program information and

H.B. NO. 2012 ENROLLED
Page 5 of 5
CODING: Words in struck through type are deletions from existing law;words underscored are additions.
eligibility requirements have been reviewed by the parent or other
responsible person and by the student and that, for informational and
data collection purposes only, expresses the intent of the parent or other
responsible person as to whether or not the student will be pursuing the
necessary program of studies to be eligible for a Tuition Opportunity
Program for Students award.
Section 2. This Act shall become effective upon signature by the
governor or, if not signed by the governor, upon expiration of the time for bills
to become law without signature by the governor, as provided in Article III,
Section 18 of the Constitution of Louisiana. If vetoed by the governor and
subsequently approved by the legislature, this Act shall become effective on
the day following such approval.
SPEAKER OF THE HOUSE OF REPRESENTATIVES
PRESIDENT OF THE SENATE
GOVERNOR OF THE STATE OF LOUISIANA
APPROVED:

Page 1 of 2Coding: Words which are struck through are deletions from existing law;words in boldface type and underscored are additions.
Regular Session, 2014 ENROLLED
SENATE BILL NO. 599
BY SENATOR ERDEY
AN ACT1
To enact R.S. 17:3048.3(B)(7), (8) and (9), (D), and (E), relative to the Taylor Opportunity2
Program for Students; to provide relative to the program's information reporting3
system; and to provide for related matters.4
Be it enacted by the Legislature of Louisiana:5
Section 1. R.S. 17:3048.3(B)(7), (8) and (9), (D), and (E) are hereby enacted to read6
as follows: 7
§3048.3. Program information reporting system; implementation; requirements;8
applicability; participation by eligible institutions and others9
* * *10
B. The Taylor Opportunity Program for Students information reporting11
system shall include but not be limited to the following:12
* * *13
(7) Demographic information of program award recipients, including but14
not limited to race, gender, and parents' household income.15
(8) High school grade point average and ACT or concordant SAT scores16
of program award recipients grouped by mean, median, and mode.17
(9) High school grade point average and ACT or concordant SAT score18
cross-referenced with those students who lost the award and those who were19
placed on probationary status and the reasons therefor.20
* * *21
D. The Board of Regents shall submit a written report including all of22
the information required by this Section for the preceding academic year to the23
Senate Committee on Education and the House Committee on Education, not24
later than December first of each year.25
ACT˚No.˚˚587

SB NO. 599 ENROLLED
Page 2 of 2Coding: Words which are struck through are deletions from existing law;words in boldface type and underscored are additions.
E. All information reported pursuant to this Section shall be reported1
in the aggregate only and shall contain no personally identifiable information2
for any recipient of a program award.3
Section 2. This Act shall become effective upon signature by the governor or, if not4
signed by the governor, upon expiration of the time for bills to become law without signature5
by the governor, as provided by Article III, Section 18 of the Constitution of Louisiana. If6
vetoed by the governor and subsequently approved by the legislature, this Act shall become7
effective on the day following such approval.8
PRESIDENT OF THE SENATE
SPEAKER OF THE HOUSE OF REPRESENTATIVES
GOVERNOR OF THE STATE OF LOUISIANA
APPROVED:

AppendixCAnalysisofTOPSTechProgram
TheTOPSTechawardmaybeutilizedatanyLouisianaTechnicalCollegeandotherpublicpostsecondaryschooloratanymemberschooloftheLouisianaAssociationofIndependentCollegesandUniversities(LAICU)thatprovidesskilloroccupationaltraining,andcertaincosmetologyandproprietaryschools.ThecriteriaforeligibilityfortheTOPSTechawardincludescompletionofadefinedhighschoolcorecurriculum,withaminimumgradepointaverageincorecourses,andaminimumACTcompositescoreorminimumlevelscoreontheassessmentsoftheACTWorkKeyssystem.
Table1:TOPSTechEligibilityCriteria,byAwardLevel,2015 TOPSTechOption1 TOPSTechOption2Core 17Units 19UnitsCoreGPA 2.50 2.50ACTCompositeorACTWorkKeys
17orSilverLevel 17orSilverLevel
MaxAwardatPublicSchoolsthatdonotofferabaccalaureate
degree
Tuition Tuition
MaxAwardatPublicSchoolsthatofferbaccalaureatedegreesandatLAICUinstitutionsandcertaincosmetologyandproprietaryschools
TheaverageTOPSTechpaymentspaidtostudentsattendingpublic
schoolsthatdonotofferabaccalaureatedegree
TheaverageTOPSTechpaymentspaidtostudentsattendingpublic
schoolsthatdonotofferabaccalaureatedegree
Duration 2years 2yearsTheTOPSTechawardhashistoricallybeenunderutilized.From2009to2014,only31%ofeligibleTOPSTECHTechstudentsacceptedtheaward(Figure1).Itisimportanttonotethatstudentswhograduatedin2014haveuntilthefallsemesterof2015toaccepttheirawards.Figure1:ACCEPTANCERATEOFTOPSTECHAWARDS

Units Courses1
ENGLISH = 4 Units 4 units English I, II, III, & IV
MATH = 4 Units 1 unit Algebra I, or Integrated Mathematics I, or Applied Algebra I
or Algebra I - Parts 1 & 2 (two units) or Applied Mathematics I & II (two units) or Applied Algebra 1A and 1B (two units)
1 unit Algebra II or Integrated Mathematics II 2 units Geometry, Pre-Calculus, Advanced Math-Pre-Calculus, Calculus,
Advanced Math-Functions and Statistics, Probability and Statistics, Discrete Mathematics, Applied Mathematics III, Integrated Mathematics III, or Algebra III
SCIENCE = 4 Units 1 unit Biology I or II 1 unit Chemistry I or II, or Chemistry Com 2 units Earth Science, Physical Science, Environmental Science, Integrated
Science, Biology II, Chemistry II, Physics, Physics II, Physics for Technology I or II, or Anatomy and Physiology or both Agriscience I & II (both for 1 unit)
SOCIAL STUDIES = 4 Units 1 unit United States History 1 unit Civics and Free Enterprise (1 unit, combined),2 Civics (1 year), or AP
Government and Politics: United States 2 units World History, Western Civilization, World Geography, European
History, History of Religion or AP Human Geography FOREIGN LANGUAGE = 2 Units
2 units Foreign Language (2 units in the same language) FINE ARTS = 1 Unit
1 unit Fine Arts Survey or 1 unit of a performance course in music, or dance, or theater or 1 unit of studio art or 1 unit of visual art or both Speech III & IV (both for 1 unit)
TOTAL = 19 Units 1 Advanced Placement (AP) courses and International Baccalaureate (IB) courses with the same name as a course listed in the TOPS Core Curriculum may be substituted.
2 Can be used only by students who entered the 9th grade before July 1, 2011. (See R.S.17:274.1)
TOPS Core Curriculum For the Opportunity, Performance, and Honors Awards For High School graduates of 2014 through 2017. For High School graduates of 2018 and thereafter click here
This core curriculum is accurate as of the date of publication and includes courses listed in TOPS statute and those determined to be equivalent by the La. Board of Regents and BESE. (800) 259-5626 [email protected] www.osfa.la.gov P.O. Box 91202, Baton Rouge, LA 70821-9202 Updated : 08/15/2013