Embed Size (px)
Citation preview
This document is downloaded from DR‑NTU (https://dr.ntu.edu.sg)Nanyang Technological University, Singapore.
Topology optimization of support structure forselective laser melting process
Wu, Lingyun
2021
Wu, L. (2021). Topology optimization of support structure for selective laser meltingprocess. Master's thesis, Nanyang Technological University, Singapore.https://hdl.handle.net/10356/151396
https://hdl.handle.net/10356/151396
https://doi.org/10.32657/10356/151396
This work is licensed under a Creative Commons Attribution‑NonCommercial 4.0International License (CC BY‑NC 4.0).
Downloaded on 23 Feb 2022 03:14:03 SGT

TOPOLOGY OPTIMIZATION OF SUPPORT
STRUCTURE FOR SELECTIVE LASER
MELTING PROCESS
WU LINGYUN
School of Mechanical and Aerospace Engineering
A thesis submitted to the Nanyang Technological University
in partial fulfilment of the requirement for the degree of
Master of Engineering
2021


Supervisor Declaration Statement
I have reviewed the content and presentation style of this thesis and declare it is
free of plagiarism and of sufficient grammatical clarity to be examined. To the
best of my knowledge, the research and writing are those of the candidate except
as acknowledged in the Author Attribution Statement. I confirm that the
investigations were conducted in accord with the ethics policies and integrity
standards of Nanyang Technological University and that the research data are
presented honestly and without prejudice.
. . . . . . . . . . . . . . . . . . . . . . . . . . . . . . . . . . . . . . . . . . . . Date Li Hua
1 Jan 2021


i
ACKNOWLEDGEMENTS
I would like to thank my supervisor, Associate Professor Li Hua, of the School of
Mechanical and Aerospace Engineering (MAE) at Nanyang Technological University
(NTU). Professor Li has given me invaluable advice and continuous encouragement during
my study. The door to Professor Li’s office was always open whenever I ran into a trouble
spot or had question about my research or writing. Without his consistent illuminating
instructions, this thesis could not have been accomplished.
Also thanks to my parents and my wife for their tremendous understanding and unfailing
support throughout my years of study.

ii
TABLE OF CONTENTS
ACKNOWLEDGEMENTS ...................................................................................................i
TABLE OF CONTENTS ..................................................................................................... ii
ABSTRACT .......................................................................................................................... v
LIST OF FIGURES ........................................................................................................... vii
LIST OF TABLES ............................................................................................................. xii
CHAPTER 1 INTRODUCTION ...................................................................................... 1
1.1 Background ............................................................................................................ 1
1.2 Objective and scope ............................................................................................... 4
1.3 Organization of the thesis ....................................................................................... 4
CHAPTER 2 LITERATURE REVIEW ........................................................................... 6
2.1 Additive manufacturing ......................................................................................... 6
2.1.1 Classification .................................................................................................. 6
2.1.2 Advantages and applications .......................................................................... 7
2.1.3 Selective laser melting (SLM) ....................................................................... 8
2.2 Support structure in SLM ..................................................................................... 11
2.2.1 Types of support structure ............................................................................ 11
2.2.2 Functions of support structure ...................................................................... 12
2.3 Optimization methods for support structure ......................................................... 14
2.3.1 Support structure contact area optimization ................................................. 15
2.3.2 Main support structure optimization ............................................................ 17
2.3.3 Remarks ....................................................................................................... 20

Table of Contents
iii
CHAPTER 3 TOPOLOGY OPTIMIZATION METHODOLOGY .............................. 21
3.1 Structural problem ............................................................................................... 21
3.2 Thermal problem ................................................................................................. 24
3.3 Remarks ............................................................................................................... 25
CHAPTER 4 OPTIMIZATION RESULTS AND DISCUSSIONS FOR SLM ............ 27
4.1 Structural topology optimization subject to mechanical load .............................. 27
4.1.1 Uniform load ................................................................................................ 27
4.1.2 Non-uniform load ........................................................................................ 32
4.1.3 Remarks ....................................................................................................... 52
4.2 Thermal topology optimization subject to heat flux load .................................... 55
4.3 Topology optimization subject to thermo-mechanical coupled load ................... 62
4.3.1 Optimization with thermal compliance constraint ....................................... 62
4.3.2 Optimization with compliance constraint .................................................... 67
4.4 Displacement analysis for part with different support structures ........................ 70
4.4.1 Uniform support structures .......................................................................... 71
4.4.2 Non-uniform support structure subject to thermal stress ............................. 77
4.4.3 Non-uniform support structure subject to heat flux ..................................... 85
4.4.4 Non-uniform support structure subject to thermo-mechanical coupled load
88
4.4.5 Comparison of displacements for part with different support structures .... 92
4.5 Remarks ............................................................................................................... 95
CHAPTER 5 CONCLUSIONS AND FUTURE WORK .............................................. 97

Table of Contents
iv
5.1 Conclusions .......................................................................................................... 97
5.2 Future work .......................................................................................................... 99
REFERENCES ................................................................................................................. 101

v
ABSTRACT
As a kind of additive manufacturing technologies, selective laser melting (SLM) is widely
used in various industries. In the three-dimensional (3D) printing process, support structure
is often used to enhance the overhang structure and prevent the structure from collapsing.
In addition, as the energy is highly concentrated during the printing process, it may cause a
large temperature gradient, forming internal stress and warping deformation. Therefore, it
is necessary to add support structures, which are usually generated excessively by the
existing additive manufacturing technology, for avoiding warpage and enhancing thermal
diffusion to reduce temperature gradient.
As such, this thesis mainly studies the support structure in SLM using topology optimization
methods. The main contributions of this thesis are detailed as follows:
1) Optimization of support structure subject to mechanical load, based on structural
topology optimization methodology. Modelling is presented for simulation of the
support structure for SLM, based on structural topology optimization. This is
performed to find the best distribution of structure materials with the objectives
for minimizing compliance, and subject to certain volume fraction constraint.
2) Optimization of support structure subject to heat flux load, based on thermal
topology optimization methodology. Similar to structural topology optimization,
thermal topology optimization is conducted, in which the objective of the
optimization is to minimize temperature, that is, to minimize thermal compliance,
and subject to heat flux load generated during printing progress.
3) Optimization of support structure subject to thermo-mechanical coupled load,
based on structural topology optimization methodology. For structural topology
optimization with consideration of heat flux load, a thermal compliance is used as

Abstract
vi
an additional constraint in optimization, in order to obtain an optimized support
structure subject to thermo-mechanical coupled load.
4) Optimization of support structure subject to thermo-mechanical coupled load,
based on thermal topology optimization methodology. For thermal topology
optimization, the present procedure is similar to that for structural topology
optimization subject to thermal-mechanical coupled load. A structural compliance
is introduced as an additional constraint in thermal topology optimization, for the
support structures subject to thermal-mechanical coupled load.
Through the studies mentioned above, four kinds of support structures for a same printed
part are generated optimally for comparison, namely (1) the uniform support structure, (2)
the mechanical-loading support structure optimized by the structural topology optimization,
(3) the heating-loading support structure optimized by the thermal topology optimization,
and (4) the thermo-mechanical-coupled-loading support structure obtained by structural
topology optimization. It is shown through comparisons that the optimized structures are
more effective than the uniform structures for supporting the overhang structure and
transferring heat. The printing efficiency is also improved and thus material consumption
reduced.

vii
LIST OF FIGURES
Figure 2.1 Schematic illustration of the SLM system [25]. .................................................. 9
Figure 2.2 Schematic illustration of common overhangs [33]. .......................................... 11
Figure 2.3 Different types of support structure [34]. .......................................................... 12
Figure 2.4 Detailed view of support structure contact area [34]. ....................................... 15
Figure 2.5 Designed part and dimensions for experiments, a) part dimensions, b) block
support parameters, and c) tooth parameters [46]. .......................................... 16
Figure 2.6 Comparison of warping of support structures, a) support parameters, and b)
experiment results [47]. .................................................................................. 17
Figure 2.7 Unit cells and lattice support structures [14]. .................................................... 18
Figure 2.8 Examples of cellular support structures [13]..................................................... 19
Figure 2.9 Topology optimization of support structure [35]. ............................................. 20
Figure 3.1 Topology optimization for a 3D cantilever beam [27]. ..................................... 22
Figure 3.2 SIMP interpolation curve [56]. ......................................................................... 23
Figure 4.1 Geometry of printed part for structural topology optimization. ........................ 28
Figure 4.2 Design and Non-design domains with meshing. ............................................... 29
Figure 4.3 Setup of constraints for structural topology optimization. ................................ 30
Figure 4.4 Load and boundary condition for structural topology optimization. ................ 30
Figure 4.5 Setup of design variable for structural topology optimization. ......................... 31
Figure 4.6 Setup of parameters for structural topology optimization, (a) response of volume
fraction, (b) response of compliance, (c) constraint and (d) objective function.
........................................................................................................................ 31
Figure 4.7 Summary of parameters for structural topology optimization. ......................... 32
Figure 4.8 Result for structural topology optimization with uniform load......................... 32
Figure 4.9 Case study of two-steps load, (a) load distribution on printed part, (b) load setting
in Hypermesh, and (c) optimization result of support structure. .................... 35

List of Figures
viii
Figure 4.10 Case study of three-steps load, (a) load distribution on printed part, (b) load
setting in Hypermesh, and (c) optimization result of support structure. ......... 36
Figure 4.11 Case study of dual-constant load, (a) load distribution on printed part, (b) load
setting in Hypermesh, and (c) optimization result of support structure. ......... 37
Figure 4.12 Case study of positive-linear load, (a) load distribution on printed part, (b) load
setting in Hypermesh, and (c) optimization result of support structure. ......... 38
Figure 4.13 Case study of negative-linear load, (a) load distribution on printed part, (b) load
setting in Hypermesh, and (c) optimization result of support structure. ......... 39
Figure 4.14 Case study of inverse-v-shape load, (a) load distribution on printed part, (b)
load setting in Hypermesh, and (c) optimization result of support structure. . 40
Figure 4.15 Case study of v-shape load, (a) load distribution on printed part, (b) load setting
in Hypermesh, and (c) optimization result of support structure. ..................... 41
Figure 4.16 Case study of positive-constant-bilinear load, (a) load distribution on printed
part, (b) load setting in Hypermesh, and (c) optimization result of support
structure. .......................................................................................................... 42
Figure 4.17 Case study of constant-negative-bilinear load, (a) load distribution on printed
part, (b) load setting in Hypermesh, and (c) optimization result of support
structure. .......................................................................................................... 43
Figure 4.18 Case study of constant-positive-bilinear load, (a) load distribution on printed
part, (b) load setting in Hypermesh, and (c) optimization result of support
structure. .......................................................................................................... 44
Figure 4.19 Case study of first-dual-positive-linear load, (a) load distribution on printed part,
(b) load setting in Hypermesh, and (c) optimization result of support structure.
......................................................................................................................... 45

List of Figures
ix
Figure 4.20 Case study of second-dual-positive-linear load, (a) load distribution on printed
part, (b) load setting in Hypermesh, and (c) optimization result of support
structure. ......................................................................................................... 46
Figure 4.21 Case study of non-linear load, (a) load distribution on printed part, (b) load
setting in Hypermesh, and (c) optimization result of support structure. ......... 47
Figure 4.22 Case study of half-wave-sinusoidal load, (a) load distribution on printed part,
(b) load setting in Hypermesh, and (c) optimization result of support structure.
........................................................................................................................ 48
Figure 4.23 Case study of single-wave-sinusoidal load, (a) load distribution on printed part,
(b) load setting in Hypermesh, and (c) optimization result of support structure.
........................................................................................................................ 49
Figure 4.24 Case study of half-wave-cosine load, (a) load distribution on printed part, (b)
load setting in Hypermesh, and (c) optimization result of support structure. . 50
Figure 4.25 Case study of single-wave-cosine load, (a) load distribution on printed part, (b)
load setting in Hypermesh, and (c) optimization result of support structure. . 51
Figure 4.26 Geometry of printed part for thermal topology optimization. ......................... 56
Figure 4.27 Definition of design domain. ........................................................................... 56
Figure 4.28 Thermal boundary and load conditions for thermal topology optimization. ... 57
Figure 4.29 Setup of heat flux load for thermal topology optimization. ............................ 59
Figure 4.30 Setup of parameters for structural topology optimization, (a) response of volume
fraction, (b) response of thermal compliance, (c) constraint and (d) objective
function. .......................................................................................................... 60
Figure 4.31 Summary of parameters for thermal topology optimization. .......................... 60
Figure 4.32 Optimization result of thermal topology optimization. ................................... 61
Figure 4.33 Iteration history of thermal topology optimization process. ........................... 61

List of Figures
x
Figure 4.34 Summary of parameters for structural problem with thermal compliance
constraint. ........................................................................................................ 63
Figure 4.35 Setups of Loads and boundary conditions for coupled optimization. ............. 64
Figure 4.36 Optimized support structure with thermal compliance of (a) 13.1 s℃/(N mm),
(b) 15 s℃/(N mm), (c) 20 s℃/(N mm), (d) 25 s℃/(N mm), (e) 30 s℃/(N mm)
and (f) 33.7 s℃/(N mm). ................................................................................. 65
Figure 4.37 Summary of parameters for thermal problem with compliance constraint ..... 67
Figure 4.38 Support structure subject to heat flux by thermal topology optimization. ...... 68
Figure 4.39 Iteration history for the thermal topology optimization process. .................... 68
Figure 4.40 Optimized support structure with compliance of (a) 0.69 mm/N, (b) 1.1 mm/N,
(c) 1.5 mm/N, (d) 1.9 mm/N, (e) 2.3 mm/N and (f) 2.79 mm/N. ................... 69
Figure 4.41 Geometry views of printed part, (a) Front view, (b) ISO view and (c) Cartesian
coordinate system. ........................................................................................... 72
Figure 4.42 Imported part and uniform support structures in Netfabb. .............................. 73
Figure 4.43 Meshing result of part and uniform support structures. ................................... 74
Figure 4.44 Meshing details of part and uniform support structures. ................................. 75
Figure 4.45 Simulation steps in Netfabb. ............................................................................ 76
Figure 4.46 Simulation result of displacement of part with uniform support structures . .. 77
Figure 4.47 Maximum von Mises stresses at the specified points along the part. .............. 79
Figure 4.48 Optimized support structure subject to thermal stress. .................................... 80
Figure 4.49 Generated geometry for part and support structure subject to thermal stress. . 80
Figure 4.50 Printed part and support structure (a) Front view; (b) ISO view. .................... 82
Figure 4.51 Imported printed part in Netfabb. .................................................................... 83
Figure 4.52 Imported printed part and support structures in Netfabb. ................................ 83
Figure 4.53 Meshing result of part and support structure subject to thermal stress. ........... 84
Figure 4.54 Meshing details of part and support structure subject to thermal stress. ........ 84

List of Figures
xi
Figure 4.55 Simulation result of displacement of part with support subject to thermal stress.
........................................................................................................................ 85
Figure 4.56 Geometry of printing part and support structure (a) Front view; (b) ISO view.
........................................................................................................................ 86
Figure 4.57 Meshing result of part and support structure subject to heat flux. .................. 87
Figure 4.58 Meshing details of part and support structure subject to heat flux. ................. 87
Figure 4.59 Simulation result of displacement of part with support subject to heat flux. .. 88
Figure 4.60 Generated geometry of part and support subject to coupled load. .................. 89
Figure 4.61 Geometry of printing part and support structure (a) Front view; (b) ISO view.
........................................................................................................................ 90
Figure 4.62 Meshing result of part and support structure subject to coupled load. ............ 91
Figure 4.63 Meshing details of part and support structure subject to coupled load. .......... 91
Figure 4.64 Simulation result of displacement of part with support subject to coupled load.
........................................................................................................................ 92
Figure 4.65 Displacement of overhangs after wire-cutting. ............................................... 93

xii
LIST OF TABLES
Table 2.1 Classification of additive manufacturing processes by ASTM International [4]. 6
Table 4.1 Details of material properties used in optimization. ........................................... 29
Table 4.2 Summary of differently defined loads. ............................................................... 52
Table 4.3 Process parameters used in the optimization. ..................................................... 58
Table 4.4 Summary of the maximum displacement for different support structures. ......... 94

1
CHAPTER 1 INTRODUCTION
1.1 Background
3D printing is a new manufacturing technology based on 3D model data, unlike
conventional methods through material reduction. It constructs the objects by stacking
materials in layers, and it is also called additive manufacturing [1]. First, the 3D solid model
of the part is discretized in the printing direction, and the cross-sectional data of the model
is obtained. After that, the trajectory of the printing head is calculated, according to the
characteristics of different additive manufacturing technologies. During the printing process,
the printing head moves subject to the control of the computer to process the layer by layer.
The layers are then stacked and connected until the end of printing. Additive manufacturing
technology has been widely recognized by various industries and government departments
in the global arena, since its inception in the late 1990s [2, 3]. A variety of materials,
including plastics, metal powders, concrete, bioactive materials, food materials, ceramic
powders, and biomedical materials, can be used in 3D printing for various purposes, such
as printings of houses, cars, airplanes, animal organs and teeth, and these application fields
continuously expand [4-7].
Selective laser melting (SLM) technology, as the most promising technology in laser
additive manufacturing, started at Fraunhofer Institute for Laser Technology, Germany, in
1995. The technology uses high-power laser as energy input, selectively melting the solid
powder layer by layer according to the 3D model data, and solidifies the molten layers to
direct manufacturing high-performance parts with complex features. The porosity and pore
shape may be controlled conveniently. Due to the direct irradiation of high-energy laser, the
powder particles melt and solidify rapidly to form a very dense and fine microstructure.
Usually the quality of printed part is superior to the casting part and close to forging part,
Chapter 1 Introduction
2
showing that the technology has outstanding advantages in the direct forming of complex
and difficult work pieces. It also shows good application prospects in aerospace, automotive,
mould and other fields. At the same time, the selection of materials is very extensive.
Theoretically, any powder that is heated by laser to form an interatomic bonding can be used
as the printed materials. At present, the research of SLM is mainly based on metal powder,
including normal and stainless steels, cobalt-chromium alloy, aluminium and aluminium
alloy, titanium and titanium alloy, copper, iron, nickel-based alloy and so on.
SLM technology has progressed tremendously. During the SLM printing process however,
the laser acts directly on the surface of metal powder, which causes it to undergo rapid
melting and cooling. This leads to various defects, such as spheroidization, pores, cracks,
slag, over-burning, warping, etc. Although the surface quality of the printed part may be
improved by post process, it is impossible to eliminate these defects only by post-processing
methods for some complicated structures, such as overhang structure and complicated
curved surface. Therefore, it is necessary to perform both the structural and process
parameter optimizations before printing. In order to obtain a good quality of printed part,
special attention is necessarily given to process parameters, scanning strategy and support
structure, when the parts are printed with overhang structures and complex curved surfaces.
During the printing process of overhang structure, the thermal conductivity of the metal
powder is much smaller than that of the metal body. Thermal energy cannot diffuse easily
by heat conduction and thereby creates a molten pool. If there is no support structure added
to the overhanging structure, the molten pool may sink into the powder due to its own
gravity and capillary force, resulting in a dross phenomenon. In the case that the energy
cannot be diffused in time, the overhang structure may cause the concentration of energy
greatly. Temperature of the molten pool rises very fast, which may cause over-burning and
poor quality of the surface of the printed part. In addition, it may cause a large temperature

Chapter 1 Introduction
3
gradient, forming internal stress and warping deformation, since the energy is highly
concentrated.
In order to address the issues mentioned above, it is generally required to accelerate the
dissipation of heat by adding support structure, since reasonable layout support structure
may significantly improve the printing quality of the overhang structure. If the support is
very dense however, it is difficultly removed after printing is completed, and then the
printing surface may be destroyed. If the support is very thin, it is possible to cause defects,
such as dross and excessive burning in the unsupported area. At present, the support
structure generated by commercial software is usually a vertical bar connecting the
overhang and the closest physical part under it. This type of support structure consumes
more support materials than needed, and affects surface quality of the part when removing
the support structure.
In order to reduce support structures during SLM, research has focused on minimizing the
volume of support structures and interface between the part and support structures [8]. The
volume of support structures directly affects material consumption and processing time. The
interface is key to surface quality of finished part. Currently, there are two main ways to
minimize support structures. The first is to optimize the part orientation, to avoid or reduce
support structures [9-11]. The orientation of the part plays an important role in the SLM
process because it affects the quality of the final part, manufacturing time and amount of
support structures [12]. The second method is to use a better support structure to make it
cost-effective. Various support types, such as lattice, unit cell, cellular support, are used as
support structures to reduce the amount of support materials and shorten printing time [13-
15]. In addition to the above two methods, some commercial companies have also
introduced innovative technologies to reduce support structures. For example, the
SupportFree system developed by Velo3D, through process simulation, geometry-based
detection and closed-loop control of melt pool, can print parts with complex internal

Chapter 1 Introduction
4
geometries that don't need support structure. It can print parts with large horizontal holes
without support structures, finished with a high-quality surface [16].
However, most of these optimization methods for support structures are based on geometric
features. There are few studies on how to design lightweight support structures with
consideration of the process characteristics of SLM. Therefore, it is really necessary to
perform the optimization of support structure, in order to maximize the SLM processing
capabilities while achieving the goal of lightweight design.
1.2 Objective and scope
Based on the background described above, this thesis aims to optimize the support structure
by means of topology optimization method for reducing material waste and saving printing
time. In order to achieve the objectives, the scope of this thesis is listed down below.
(1) Theoretical analysis of the thermal-mechanical coupled problem during the SLM
printing process.
(2) Development of models for optimization of the support structure for SLM, based
on structural and thermal topology optimization methodologies. The support
structures are optimized systematically subject to the mechanical, heat flux, and
thermo-mechanical coupled loads.
(3) Comparison of various optimized support structures obtained by different methods.
1.3 Organization of the thesis
This thesis consists of five chapters, and each chapter is further composed of several sections
for a better organization.
Chapter 1 introduces the background information, followed up by objective and working
scopes of this thesis.

Chapter 1 Introduction
5
Chapter 2 provides a good literature review in details for the additive manufacturing, SLM,
support structure in SLM, and followed up by optimization methods for support structure in
SLM.
Chapter 3 introduces topology optimization methodology, including topology optimization
for structural and thermal problems.
Chapter 4 describes how to perform the optimization of the support structure subject to
mechanical, heat flux, and thermo-mechanical coupled loads through the structural and
thermal topology optimization methodologies. Systematically case studies are carried out
for comparison of the support structures optimized by different topology methods.
Finally, Chapter 5 draws several conclusions first based on the optimization studies detailed
in Chapter 4, and then recommends several studies for the future works.
6
CHAPTER 2 LITERATURE REVIEW
2.1 Additive manufacturing
2.1.1 Classification
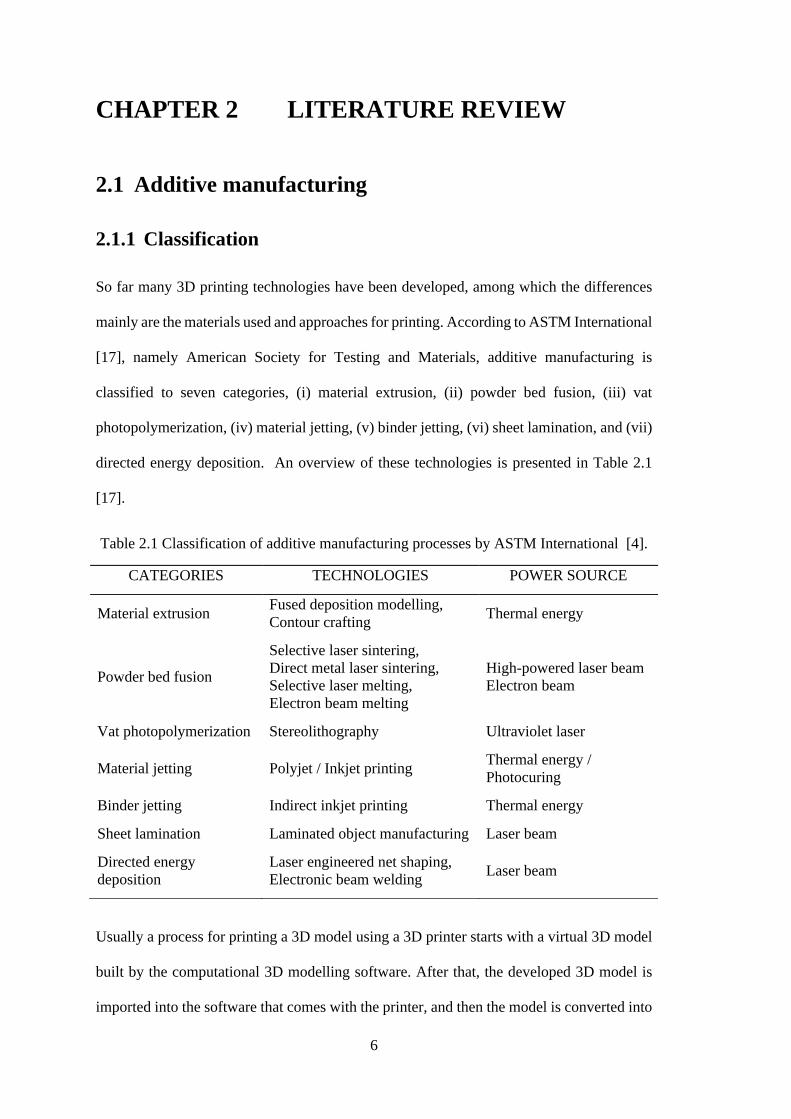
So far many 3D printing technologies have been developed, among which the differences
mainly are the materials used and approaches for printing. According to ASTM International
[17], namely American Society for Testing and Materials, additive manufacturing is
classified to seven categories, (i) material extrusion, (ii) powder bed fusion, (iii) vat
photopolymerization, (iv) material jetting, (v) binder jetting, (vi) sheet lamination, and (vii)
directed energy deposition. An overview of these technologies is presented in Table 2.1
[17].
Table 2.1 Classification of additive manufacturing processes by ASTM International [4].
CATEGORIES TECHNOLOGIES POWER SOURCE
Material extrusion Fused deposition modelling,
Contour crafting Thermal energy
Powder bed fusion
Selective laser sintering,
Direct metal laser sintering,
Selective laser melting,
Electron beam melting
High-powered laser beam
Electron beam
Vat photopolymerization Stereolithography Ultraviolet laser
Material jetting Polyjet / Inkjet printing Thermal energy /
Photocuring
Binder jetting Indirect inkjet printing Thermal energy
Sheet lamination Laminated object manufacturing Laser beam
Directed energy
deposition
Laser engineered net shaping,
Electronic beam welding Laser beam
Usually a process for printing a 3D model using a 3D printer starts with a virtual 3D model
built by the computational 3D modelling software. After that, the developed 3D model is
imported into the software that comes with the printer, and then the model is converted into

Chapter 2 Literature review
7
a series of layers, followed up by printing layer by layer. The printer can use viscous,
powdery or silk-like raw materials. Finally, the cross-sections of the layers are bonded in
their respective directions, eventually forming the whole object.
2.1.2 Advantages and applications
3D printing technology provides numerous benefits for both individuals and businesses. The
mainly significant benefits are briefly listed as follows [18-21].
(1) Complexity and diversification of products are achieved at a lower cost.
Manufacturing of products with complicated shapes by conventional methods
often incurs higher manufacturing costs. At the same time, conventional
manufacturing equipment has very few or even single function. Hence, the shape
of the processable product is limited. However, a 3D printer is able to print a wide
variety of shapes, regardless of complex or simple shape of the object. The
complexity of the product does not have a significant impact on its manufacturing
costs. Machining or prefabrication of mould is not required if 3D printing
technology is used. Therefore, the difficulty of manufacturing complex products
is reduced greatly and the development cycle is shortened.
(2) Customization and personalisation of products. 3D printing manufactures on-
demand productions, reduces the physical inventory of enterprises, avoids the
waste of resources for large quantities of unsold goods in mass production, and is
more environmentally friendly. Products are also printed locally on demand, and
thus the logistics and transportation costs are reduced. These advantages make 3D
printing ideal for rapid manufacturing of the following types of products: (1)
products with complex structures, such as free-form surface blades and complex
internal channels that are difficult to be manufactured by the conventional methods,
(2) personalized and customized products, such as cultural creative products,

Chapter 2 Literature review
8
jewels, human organs and small batch products before mass production, and (3)
high value-added products, such as products for aerospace and biomedical
applications [22, 23].
(3) Less manufacturing skill is required. Conventional workers need a few years to
master the skills they need. Although skill requirement is reduced by mass
production and computer-controlled manufacturing machines, skilled
professionals are still required to make machine adjustments and calibrations,
when using conventional manufacturing machines. Compared with conventional
technology for the same complex products, individuals for 3D printing only need
to intelligently design the products in computers, then convert the complex
workflow into digital files and send them to the 3D printer for manufacturing.
Throughout the process, users do not need to master a variety of complex
manufacturing processes and skills, and thus the technical threshold of
manufacturing is reduced greatly.
However, compared with the conventional machining, casting, forging, welding and
moulding technologies, 3D printing has its disadvantages. Firstly, 3D printing technology
differs from conventional technologies greatly in product dimensional accuracy and surface
quality. The post-processing of 3D printing is cumbersome, and the performance of the
product cannot meet the requirements of many advanced metal structures. Secondly, it is
relatively slow in manufacturing speed and inefficient for mass production. Finally, the
costs of 3D printing equipment and consumables is higher. For example, the cost of metal
powder-based printing is much higher than by conventional manufacturing.
2.1.3 Selective laser melting (SLM)
Selective laser melting (SLM) technology is one of additive manufacturing (AM) methods
that use a high-energy laser beam to melt metal alloy powder on two-dimensional (2D)

Chapter 2 Literature review
9
sections, which are sliced from a 3D model. It prints solid parts layer by layer from bottom
to top [24]. A schematic illustration of the SLM system is shown in Figure 2.1 [25], and
the main processes are detailed as follows [25].
(1) Use CAD software to design a 3D CAD model.
(2) Slice the 3D model into a series of thin layers and make a plan for the scanning
path.
(3) Import the processed data of the 3D model into the SLM printer.
(4) Import the sliced data layer by layer, and the high-energy laser beam is used to
melt metal powder selectively to complete the processing of one layer of the
product.
(5) After the melting of one layer of the product is finished, the piston is lowered by
one sliced layer, then the powder feeder spreads the metal powder over the powder
bed.
(6) Repeat the above Steps (4) and (5) until all the layers are printed.
(7) Remove the printed product from the substrate and perform post-processing.
Figure 2.1 Schematic illustration of the SLM system [25].
Compared with conventional manufacturing methods, SLM technology has advantages as
detailed below.

Chapter 2 Literature review
10
(1) The high-power density laser processes metal parts with high dimensional
accuracy and good surface roughness.
(2) The printed parts have metallurgical bonding characteristics. For example, the
relative density of the parts reach nearly 100%, and the mechanical properties of
the parts are comparable with castings and forgings [26, 27].
(3) The final metal product is printed directly from the 3D model, which eliminates
the intermediate steps and saves the time for making mould.
(4) SLM technology is suitable for manufacturing workpieces with various complex
shapes, such as products with complex internal cavity structures and personalized
products in the medical field, which may not be manufactured by conventional
methods.
SLM technology manufactures complex products, shortens product development cycles,
reduces costs, and makes product development more convenient. At present, it is mainly
applied to the rapid development of new concept products and the manufacture of small
batch products to shorten the cycle times. It is mainly used in biomedicine, aerospace,
industrial mould, automobile manufacturing and other fields, and gradually developed in
the directions of individualization, lightweight and customization [28-30].
SLM technology is used more and more widely with the increasing demand for precision
and personalization in the medical industry. It is gradually used to manufacture orthopaedic
implants, customized prostheses, and personalized orthodontic brackets. For example,
Wang et al. [31] fabricated a 316L stainless steel spinal surgery template. Song et al. [32]
designed and manufactured a personalized femoral component by SLM technology.

Chapter 2 Literature review
11
2.2 Support structure in SLM
2.2.1 Types of support structure
Support structures are required for both base surface and overhangs of the parts
manufactured by SLM. The base surface refers to the first layer in the forming direction of
the printed part. The support structure under the base surface lifts the printed part from the
substrate for a certain distance, which facilitates the removal of the printed part after printing
is completed. If there is no support structure connecting the part and the substrate, the base
surface of the part may be damaged when the printed part is removed from the substrate.
According to the geometric shape characteristics, the overhanging structures are divided
into surface, line and point overhangs. The surface overhang is further divided into flat and
inclined surfaces. A schematic illustration of these common overhangs is shown in Figure
2.2 [33].
Figure 2.2 Schematic illustration of common overhangs [33].
Chapter 2 Literature review
12
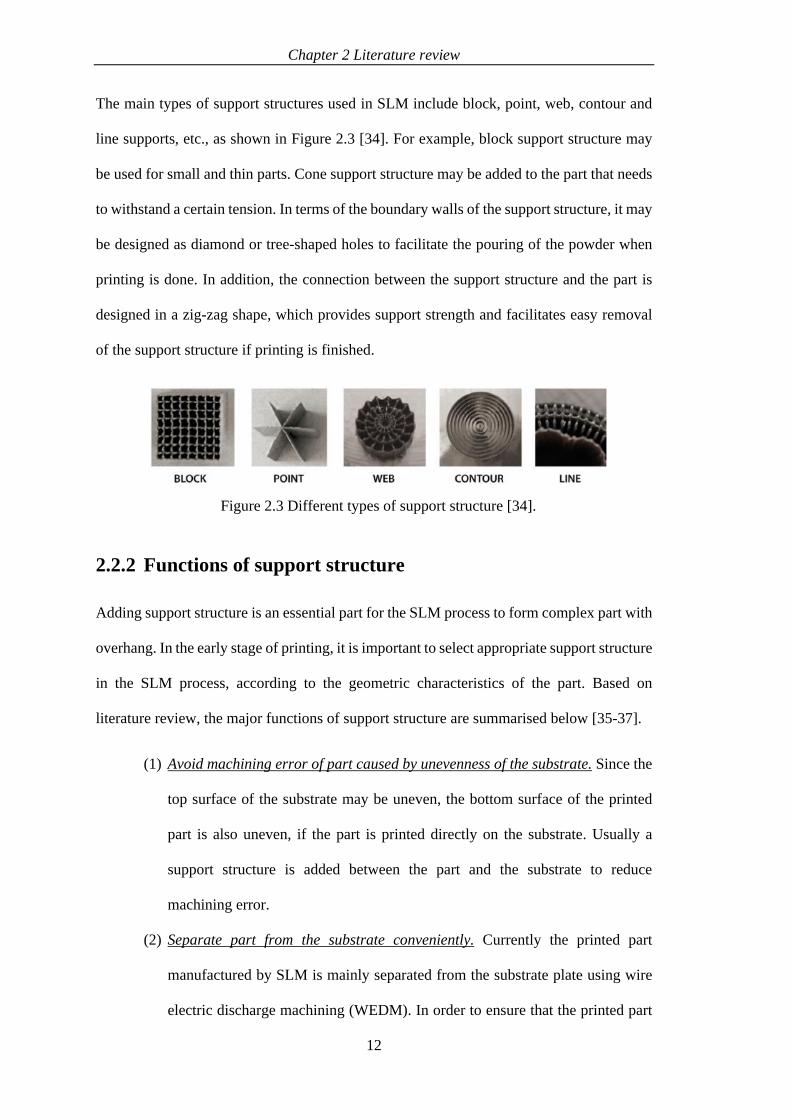
The main types of support structures used in SLM include block, point, web, contour and
line supports, etc., as shown in Figure 2.3 [34]. For example, block support structure may
be used for small and thin parts. Cone support structure may be added to the part that needs
to withstand a certain tension. In terms of the boundary walls of the support structure, it may
be designed as diamond or tree-shaped holes to facilitate the pouring of the powder when
printing is done. In addition, the connection between the support structure and the part is
designed in a zig-zag shape, which provides support strength and facilitates easy removal
of the support structure if printing is finished.
Figure 2.3 Different types of support structure [34].
2.2.2 Functions of support structure
Adding support structure is an essential part for the SLM process to form complex part with
overhang. In the early stage of printing, it is important to select appropriate support structure
in the SLM process, according to the geometric characteristics of the part. Based on
literature review, the major functions of support structure are summarised below [35-37].
(1) Avoid machining error of part caused by unevenness of the substrate. Since the
top surface of the substrate may be uneven, the bottom surface of the printed
part is also uneven, if the part is printed directly on the substrate. Usually a
support structure is added between the part and the substrate to reduce
machining error.
(2) Separate part from the substrate conveniently. Currently the printed part
manufactured by SLM is mainly separated from the substrate plate using wire
electric discharge machining (WEDM). In order to ensure that the printed part

Chapter 2 Literature review
13
is not damaged during the cutting process, a block or solid support is generally
added to connect the part and the substrate plate.
(3) Support overhang structures. If there is no support structure under the overhang
part, the molten pool collapses due to its own gravity and capillary force. In this
case, a support structure is needed to support the forming of the overhang part.
(4) Transfer energy during the printing process. The laser rapid prototyping process
generates a large amount of heat due to energy accumulation. The support
structure transfers the generated heat to the substrate rapidly, in order to reduce
the deformation of the part due to thermal stress. Compared with the cases
without support structures, good thermal conductivity of the support structure
makes more uniform distribution of the temperature field, thereby reducing
deformation due to thermal stress.
(5) Avoid warpage and deformation caused by shrinkage stress. When the metal
powder is melted and solidified during the printing process, there is warpage
caused by shrinkage stress. After one layer is printed, the scraper lays the metal
powder of the next layer, there is friction between the scraper and the solidified
layer. If there is no support structure, the solidified part may be damaged, which
affects the scraper spreading the powder continuously, and the machine may be
damaged seriously. The support structure connects the formed and the unformed
parts, thereby suppressing shrinkage effectively and maintaining the stress
balance of the formed part.
In brief, the support structure used is to connect the formed and unformed parts, enhance
strength, transfer heat, and maintain the stress balance of the formed part. Different types of
support structures are added for parts with different overhang features. However, the support
structure introduces some other challenges. The main disadvantages of support structure are
summarized as follows [37, 38].

Chapter 2 Literature review
14
(1) Waste of materials. Most of the support structure materials are not reusable and
have to be discarded after removal.
(2) Longer printing time is needed. When support structure is added to a part, the
printing time is longer as support structure also needs to be printed.
(3) Detrimental to the surface finishing when the support structure is removed. A
few main surfaces of structural parts are not precise enough that may fail
subsequent assembly and lead to insufficient mechanical performance.
2.3 Optimization methods for support structure
For the optimization of support structure in SLM, currently researchers mainly focus on
development of algorithms of support structure or overall rules [13-15, 34, 35, 39-42]. This
includes the minimum angle, at which the overhang structure is necessarily added, the effect
of different support types on formation of printed parts, the usage of the lattice structure,
and design and simulation for optimization of support structure.
For the forming angle of overhang structure [43, 44], researchers obtained the minimum
overhang angle for support structure under different conditions. A large number of
experiments showed that a self-supporting length of about 2 mm and an overhang angle of
less than 45° are required for metal cantilever. The effect of the scanning strategy was also
investigated on the formation of the overhang structure, indicating that reducing the
scanning energy input forms the overhanging structure with a smaller tilt angle. It was also
shown that the minimum angles required were different for different materials, and the
angular limit of the overhang structure depended on the forming process.
For the research in support structure optimization, Calignano [34] divided support structures
into two functional areas, contact area or teeth, and main support structure or support base.
A detailed view of support structure is shown in Figure 2.4, labelling four key parameters
that are tooth height, tooth top length, tooth base interval and tooth base length. Therefore,

Chapter 2 Literature review
15
support structure optimization is divided into contact area optimization and main support
structure optimization.
Figure 2.4 Detailed view of support structure contact area [34].
2.3.1 Support structure contact area optimization
The effects of the varying contact area parameters were investigated. Calignano [34] studied
the effects of varying six control factors on the warping of aluminium (AlSi10Mg) and
titanium (Ti6Al4V) samples printed by SLM. The experiment adopted the Taguchi L36
method and used samples at dimension of 20 × 10 × 15 mm. The results of the experiment
showed that three factors of tooth height, fragmentation and hatching are significant to the
warping of the aluminium part. Only two factors of tooth height and hatching are significant
to the warping of the titanium part.
Järvinen et al. [45] studied the availability of web and tube support structures, and applied
these two support structures to the mouldings of teeth and jewellery. Through their
experiments, it was found that the removability of the mesh support was better than that of
the tube support. The contact area was further optimized between the support structure and
the part, in order to improve the surface quality of the part.
Poyraz et al. [46] studied the support structures for Inconel625 (IN625) parts, which were
manufactured by direct metal laser sintering (DMLS). As shown in Figure 2.5 (a), a part
with an overhang was adopted. Two sets of experiment were conducted to test the effect of
different block support and hatch parameters on the support structures. The parameters of

Chapter 2 Literature review
16
hatch distance, fragmentation, tooth top length, and Zoffset were evaluated, as shown in
Figure 2.5 (b) and (c). The experiments discovered that lower hatch distance reduces the
distortion of the part and the top length with lower value leads to weaker support
attachments.
Figure 2.5 Designed part and dimensions for experiments, a) part dimensions, b) block
support parameters, and c) tooth parameters [46].
Liu et al. [47] researched the distortion of three same parts with different support structures.
The tooth base interval, tooth base length and tooth height were the same for all the three
parts. As shown in Figure 2.6 (a), the tooth top length for Part I, Part II and Part III was 0.3
mm, 0.3 mm and 1 mm, respectively. Uniform support structure with hatching at 2 mm was
added to Part I and Part III while non-uniform support structure with 1 mm hatching at two
sides and 2 mm in the middle was added to Part II. The parameters of three parts are listed
in Figure 2.6 (a). Part II has the same tooth top length with Part I but smaller hatching at

Chapter 2 Literature review
17
two sides. Part III has the same hatching with Part I but larger tooth top length. Part II and
Part III were manufactured without warping as shown in Figure 2.6 (b).
(a)
(b)
Figure 2.6 Comparison of warping of support structures, a) support parameters, and b)
experiment results [47].
2.3.2 Main support structure optimization
In terms of optimization of main support structure, Yan et al. [39] studied the lattice
structure with considering the influence of the geometric parameters of the unit cell, in order
to obtain an easily removable support structure with a minimum volume fraction. Hussein
et al. [48] explored the potential of using cellular structures to support overhang structures

Chapter 2 Literature review
18
of metal parts in SLM. As shown in Figure 2.7, the two types of unit cells, namely Schoen
gyroid and Schwartz diamond, were used to generate support structures for the experiments,
in which support structures generated from these unit cells were useful to support the
overhang structures of metal parts. After that, it was further understood that the structure
type, volume fraction and cell size had significant influence on the manufacturability,
support quantity and printing time of the lattice support structures [14]. The volume fraction
of the lattice support structures may be as low as 8%, which greatly saved the amount of
material used and printing time of the support structures.
Figure 2.7 Unit cells and lattice support structures [14].
Strano et al. [13] proposed a method to optimize the cellular support structure. This method
used 3D implicit functions to design the cellular support structure, which changed the
density. Since the implicit function method was used to design the geometric shape by pure
mathematical formulas, the method was very suitable for constructing and designing support
structure. Through this method, various cellular structures were easily defined and
optimized, especially in the case with different support requirements to produce different
cellular structures. Two examples of optimized cellular structures are shown in Figure 2.8.

Chapter 2 Literature review
19
Figure 2.8 Examples of cellular support structures [13].
Calignano [34] designed a flow chart for support structure optimization and obtained
optimized combined process by Taguchi orthogonal experiment. Zeng [40] optimized the
algorithm for generating support structures in SLM using simulation software 3DSIM, LLC.
The stress and thermal fields were simulated during the scanning process. A support
structure was developed for the heat accumulation characteristic of the printing process from
simulation.
Gan and Wong [41] at Singapore Centre for 3D Printing investigated three types of support
structures, namely “Y”, “IY” and pin types. Through experiments, a thin plate with levelled
surface was fabricated with only 25 contact points. It was shown in finite-element analysis
that unequal spacing of the support structures changed the thermal field distribution, which
resulted in thermal deformation of the thin plate. In addition, it was also shown that the
angle should be greater than 90° between the support structure and shrinkage direction of
the printing part to avoid upward warping.
Mirzendehdel and Suresh [42] established a topology optimization framework to reduce the
support structure by introducing sensitivity calculation methods and by constraining the
volume of the support structure. Vaidya and Anand [15] proposed a method combining the
shortest path algorithm and the use of a filled lattice structure to minimize the support
structure. Kuo et al. [35] proposed a repulsion index (RI), considering cost and surface
accuracy. As shown in Figure 2.9, an optimal support structure was obtained through multi-

Chapter 2 Literature review
20
objective solid isotropic material with penalization (SIMP) topology optimization method,
in which the load due to self-weight of the printed part was assumed in the optimization.
Figure 2.9 Topology optimization of support structure [35].
2.3.3 Remarks
The current optimization methods of support structure are mainly based on geometric
features. With development of metal additive manufacturing technologies such as SLM, the
support structure has to consider thermal condition and external load. For the optimization
of support structure, it is necessary to combine the simulation with other methods to
determine optimal distribution of the support by considering the temperature and stress
fields during the printing process. The simulation of the printed part with optimized support
structure has to consider part distortion. Therefore, it is necessary to consider the combined
effect of mechanical load coupled with heat in developing the optimization of support
structure, which requires the optimization of support structure in the product design stage.
In other words, it is necessary to combine the topological structure design with the
optimization of support structure of the product for the product design.

21
CHAPTER 3 TOPOLOGY OPTIMIZATION
METHODOLOGY
3.1 Structural problem
Structural optimization aims to achieve a better performance by changing the design
variables of the structure under given constraints. Similar to other optimization problems,
structural optimization also includes three factors, namely the objective function, design
constraints, and design variables. Among them, the objective function is used to characterize
the performance of a certain structure. The design variable is structural parameters that may
be optimized and adjusted in structure. The design constraint is additional conditions
attached to the design variables. The goal of structural optimization is to find the optimal
value of the design variables for a certain structure, and to obtain the optimal objective
function satisfying the given design constraints.
According to different design variables, structural optimization is divided into size, shape
and topology optimizations [49]. Size optimization mainly refers to the optimization of the
dimensional parameters of the structure to improve the performance of the structure while
maintaining the topology and shape of the structure unchanged. Shape optimization refers
to changing the shape of the design domain while maintaining the structural topological
relationship or boundaries, in order to find the optimal shape and boundary of the structure.
Topology optimization is to find the optimal configuration of the structure layout, topology
connection relationship, number of holes and location and so on in a certain design domain,
such that certain performance indicators of the structure are achieved. An example of
topology optimization for a 3D cantilever beam is shown in Figure 3.1 [50].

Chapter 3 Topology optimization methodology
22
Figure 3.1 Topology optimization for a 3D cantilever beam [27].
At present, many different optimization methods were proposed. They may be roughly
divided into (1) density-based methods such as solid isotropic material with penalization
(SIMP) method, (2) boundary variation methods such as level set method (LSM), and (3)
hard-kill methods such as evolutionary structural optimization (ESO) method [51, 52].
Bendsøe [53] proposed the density-based method in 1978, introduced a material unit with
variable density that does not exist in reality. The density of this material unit is considered
as a continuous variable with a variation ranging from 0 to 1. On this basis, this variable
density is used as a topological design variable, and the functional relationship is
constructed between the density of the assumed material unit and the physical property of
the material. Topological optimization is turned into optimal distribution problem of
material density, and then optimization criterion or mathematical programming method is
employed to solve the problem. The density-based method is one of the most widely-used
and most successful structural topology optimization methods.
SIMP method [54, 55] is one of the most widely-used density-based methods. A
power index p is used to punish the density variable, such that the density value of the
material during the optimization process is as close as possible to both ends, i.e. "0" or "1".

Chapter 3 Topology optimization methodology
23
In this way, the topology optimization with continuous density as the optimized variable is
approximated well to the optimization problem with discrete variable.
In present study, topology optimization is carried out using SIMP method. The elastic
modulus of the solid material in the SIMP method is expressed by a density variable as
𝐸(𝜌𝑒) = 𝜌𝑒
𝑝𝐸0
0 ≤ ⍴e ≤ 1 (3.1)
where E(ρe) is optimized elastic modulus, ρe is density variable, p is penalty factor and E0 is
initial elastic modulus of elements. A curve for material density function is shown in Figure
3.2 for different penalty factors. From top to bottom, the density curve of p = 1 to 5 is in
order. It is shown in Figure 3.2 that, if the penalty factor is larger, the more intermediate
density tends to ρ = 0 (void material). Through such processing, continuous variable
optimization is brought closer to the discrete variable optimization.
Figure 3.2 SIMP interpolation curve [56].
Let Ke0 and Ke be the initial and optimized stiffness matrices of structural elements,
respectively, then Equation (3.1) is re-written as [57],
𝐾𝑒 = 𝜌𝑒𝑝𝐾𝑒
0 (3.2)

Chapter 3 Topology optimization methodology
24
In general, topology optimization model for continuum structure based on density-based
method takes the minimum compliance of the structure as optimization goal, and the
material consumption of the structure (volume fraction) as constraint. The optimization
model is thus expressed as
Minimize 𝐶(𝜌𝑒) = 𝐹𝑇𝑈 = 𝑈𝑇𝐾𝑈 = ∑ 𝜌𝑒𝑝𝑁
𝑒=1 𝑢𝑒𝑇𝑘0𝑢𝑒
Subject to: {
𝑉
𝑉𝑜 ≤ 𝑓
𝐾𝑈 = 𝐹𝜌
𝑚𝑖𝑛 ≤ 𝜌
𝑒≤ 1
(3.3)
where C(ρe) is objective function, the compliance of the structure, F is structural load vector,
U is the overall displacement vector of the structure, K is the overall stiffness matrix of the
structure, N is the total number of elements in the design domain, ρe is the design variables,
the relative density of materials, p is penalty factor, ue is the displacement vector of element,
k0 is initial stiffness matrix of element, V is the volume after structural optimization, V0 is
the initial volume of structure, f is given volume fraction, and ρmin is minimum relative
density.
3.2 Thermal problem
The topology optimization for thermal structure is quite similar to the structural topology
optimization. For heat transfer structure, the properties of a material are described by the
thermal conductivity λ. By replacing the elastic modulus E in Equation (3.1) with the
thermal conductivity λ, the functional relationship is thus established between thermal
conductivity and density of materials, as shown in Equation (3.4) below,
𝜆(𝜌𝑒) = 𝜌𝑒
𝑝𝜆0
0 ≤ ⍴e ≤ 1 (3.4)

Chapter 3 Topology optimization methodology
25
where λ(ρe) is optimized thermal conductivity, ρe is density variable, p is penalty factor and
λ0 is initial thermal conductivity. Accordingly, Ke0 and Ke in Equation (3.2) are treated as
initial and optimized thermal conductivity matrices, respectively.
The topology optimization model for continuum heat transfer structure based on density-
based method takes the minimum thermal compliance of the structure as optimization goal,
and the material consumption of the heat transfer structure (volume fraction) as the
constraint. The optimization model is expressed as
Minimize 𝐶(𝜌𝑒) = 𝑄𝑇𝑇 = 𝑇𝑇𝐾𝑇 = ∑ 𝜌𝑒𝑝𝑁
𝑒=1 𝑡𝑒𝑇𝑘0𝑡𝑒
Subject to: {
𝑉
𝑉𝑜 ≤ 𝑓
𝐾𝑇 = 𝑄𝜌
𝑚𝑖𝑛 ≤ 𝜌
𝑒≤ 1
(3.5)
where C(ρe) is objective function, the thermal compliance of the structure, Q is heat
generated, T is the overall temperature vector of the thermal structure, K is the overall
thermal conductivity matrix of the structure, N is the total number of elements in the design
domain, ρe is the design variables, the relative density of materials, p is penalty factor, te is
the temperature vector of element, k0 is initial thermal conductivity matrix of element, V is
the volume after structural optimization, V0 is the initial volume of structure, f is given
volume fraction, and ρmin is minimum relative density.
3.3 Remarks
This chapter describes the two optimization methods for structural and thermal problems,
namely the structural and thermal topology optimizations. First, the structural topology
optimization method is introduced for the structure subject to mechanical force, while the
thermal topology optimization method descripted for the structure subject to thermal force.
Structural topology optimization method is essentially the same as the thermal one, such

Chapter 3 Topology optimization methodology
26
that either structural or thermal topology optimization method may be chosen for thermo-
mechanical coupled problems.

27
CHAPTER 4 OPTIMIZATION RESULTS AND
DISCUSSIONS FOR SLM
4.1 Structural topology optimization subject to
mechanical load
In this section, the support structures are optimized for SLM, based on structural topology
optimization subject to mechanical load, in which two types of load are considered, namely
uniform and non-uniform loads.
4.1.1 Uniform load
As the most typical specimen with overhang structure, usually a single or twin cantilever is
considered for experiment and simulation [14, 36, 58-61]. For example, the single or twin
cantilever is chosen for experiment verification [14, 58-60], while single cantilever is
generally chosen for simulation purpose [36, 59-61] because a twin cantilever is a
symmetrical structure, in order to save computational cost.
Due to the printing capacity of the printer, SLM250 is considered here as an example, which
is the smallest printer of SLM Solutions, with the smallest build envelope of 50 × 50 × 50
mm. To follow the dimensions approximately, a printed part is drawn for the optimization
of the support structure, as shown in Figure 4.1. The dimension of the vertical bar of the
printed part is 15.5 × 1.0 mm, and that of the horizontal bar is 26.0 × 0.5 mm.

Chapter 4 Optimization results and discussions for SLM
28
Figure 4.1 Geometry of printed part for structural topology optimization.
As shown in Figure 4.2, the design domain is defined as the space under the overhang of
the part and displayed in green colour, while the non-design domain on top in grey colour
remains unchanged even after optimization. There are two kinds of 2D basic element shapes,
namely Quad and Tri elements, in the commercial software Hypermesh. Quad element is
preferred in presented work. 2D meshing is done in the design domain, in which 2D Quad
element is used with size of 0.25 × 0.25 mm. In addition, the element thickness of 1mm is
considered. PSHELL is selected as Card Image under property definition.

Chapter 4 Optimization results and discussions for SLM
29
Figure 4.2 Design and Non-design domains with meshing.
Material property is an important aspect for simulation. The elastic modulus and Poisson’s
ratio used in simulation are 0.7 × 10¹¹ Pa and 0.3 respectively. These values correspond to
aluminium alloy AlSi10Mg, which is a commonly used material in parts produced by SLM.
Material property details are listed in Table 4.1.
Table 4.1 Details of material properties used in optimization.
Item Value Unit
Elastic modulus 0.7 × 10¹¹ Pa
Poisson’s ratio 0.3
Density 2.7 × 10³ Kg/m3
The rectangular design domain is ready for optimization after all meshing, material and
property selections are completed. Loads and boundary conditions are imposed on the
design domain after all the steps are done. As shown in Figure 4.3, all the nodes at bottom
surface are chosen and Dof1 to Dof6 are ticked, such that the bottom surface is fixed as the
boundary condition, as shown in Figure 4.4.
Chapter 4 Optimization results and discussions for SLM
30
Figure 4.3 Setup of constraints for structural topology optimization.
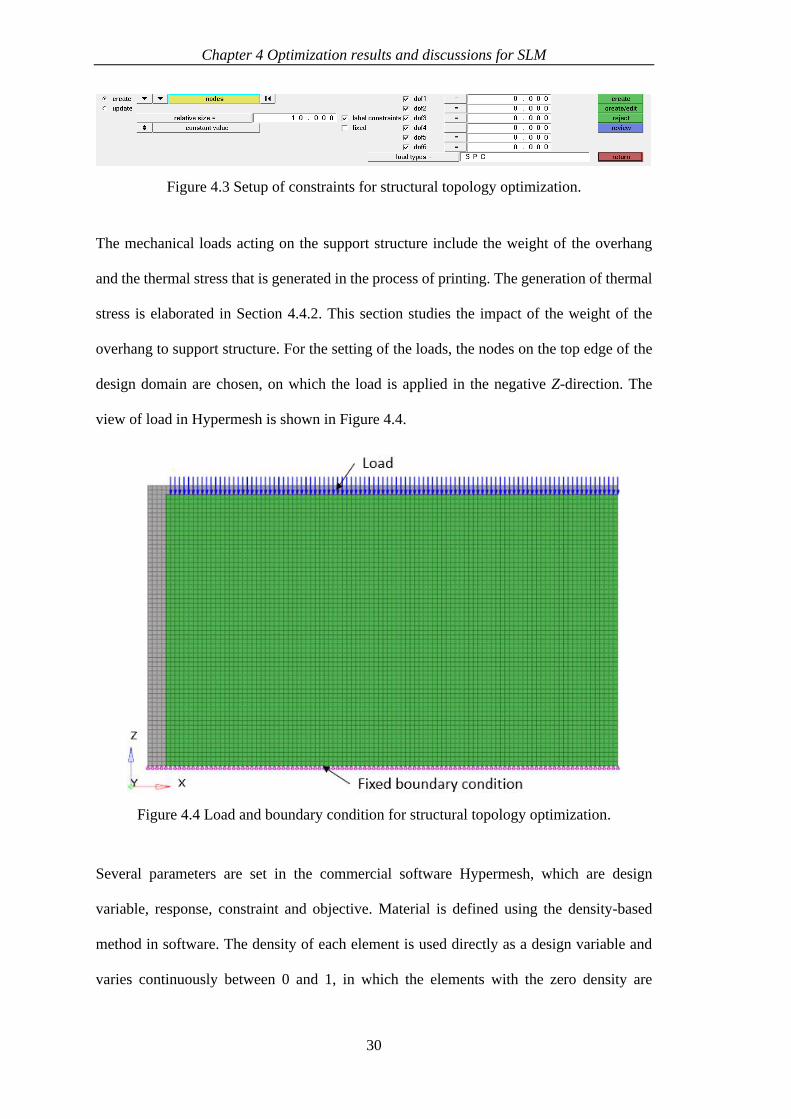
The mechanical loads acting on the support structure include the weight of the overhang
and the thermal stress that is generated in the process of printing. The generation of thermal
stress is elaborated in Section 4.4.2. This section studies the impact of the weight of the
overhang to support structure. For the setting of the loads, the nodes on the top edge of the
design domain are chosen, on which the load is applied in the negative Z-direction. The
view of load in Hypermesh is shown in Figure 4.4.
Figure 4.4 Load and boundary condition for structural topology optimization.
Several parameters are set in the commercial software Hypermesh, which are design
variable, response, constraint and objective. Material is defined using the density-based
method in software. The density of each element is used directly as a design variable and
varies continuously between 0 and 1, in which the elements with the zero density are
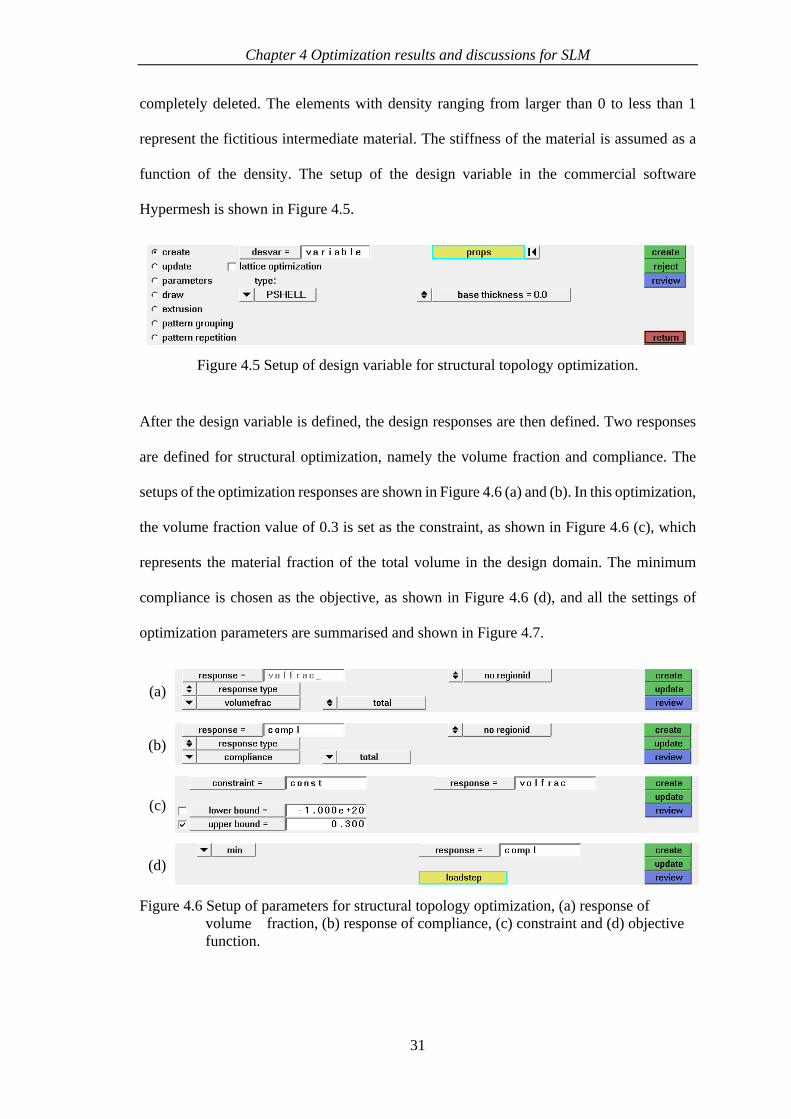
Chapter 4 Optimization results and discussions for SLM
31
completely deleted. The elements with density ranging from larger than 0 to less than 1
represent the fictitious intermediate material. The stiffness of the material is assumed as a
function of the density. The setup of the design variable in the commercial software
Hypermesh is shown in Figure 4.5.
Figure 4.5 Setup of design variable for structural topology optimization.
After the design variable is defined, the design responses are then defined. Two responses
are defined for structural optimization, namely the volume fraction and compliance. The
setups of the optimization responses are shown in Figure 4.6 (a) and (b). In this optimization,
the volume fraction value of 0.3 is set as the constraint, as shown in Figure 4.6 (c), which
represents the material fraction of the total volume in the design domain. The minimum
compliance is chosen as the objective, as shown in Figure 4.6 (d), and all the settings of
optimization parameters are summarised and shown in Figure 4.7.
(a)
(b)
(c)
(d)
Figure 4.6 Setup of parameters for structural topology optimization, (a) response of
volume fraction, (b) response of compliance, (c) constraint and (d) objective
function.
Chapter 4 Optimization results and discussions for SLM
32
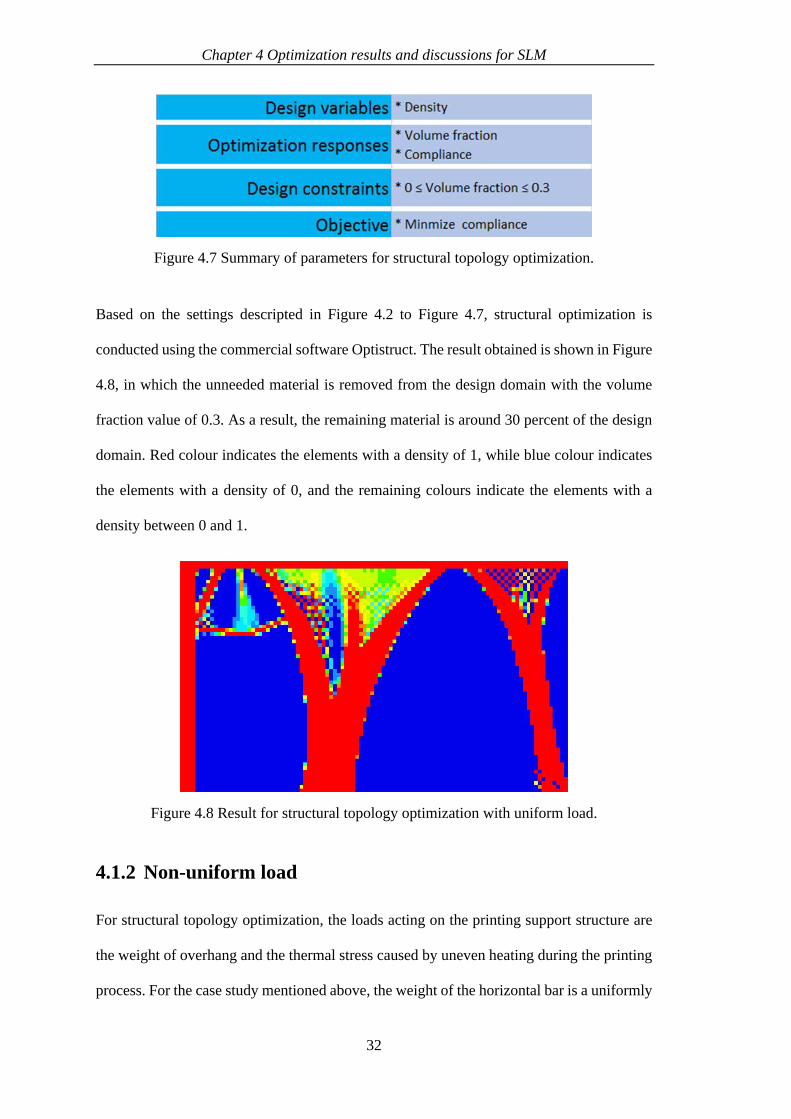
Figure 4.7 Summary of parameters for structural topology optimization.
Based on the settings descripted in Figure 4.2 to Figure 4.7, structural optimization is
conducted using the commercial software Optistruct. The result obtained is shown in Figure
4.8, in which the unneeded material is removed from the design domain with the volume
fraction value of 0.3. As a result, the remaining material is around 30 percent of the design
domain. Red colour indicates the elements with a density of 1, while blue colour indicates
the elements with a density of 0, and the remaining colours indicate the elements with a
density between 0 and 1.
Figure 4.8 Result for structural topology optimization with uniform load.
4.1.2 Non-uniform load
For structural topology optimization, the loads acting on the printing support structure are
the weight of overhang and the thermal stress caused by uneven heating during the printing
process. For the case study mentioned above, the weight of the horizontal bar is a uniformly

Chapter 4 Optimization results and discussions for SLM
33
distributed load, and the thermal stress is descripted in Section 4.4.2. For the supported and
printed parts with different geometrical shapes, there are different weights and thermal stress
distributed. For fully understanding of important parameters, several case studies are
conducted with the differently defined loads, in order to optimize the support structures.
These loads include the linear load, un-linear load, sinusoid load, and cosine load. The
optimal results of support structure are shown in Figure 4.9 to Figure 4.25, based on
topology optimization method with assumed loads. The simulated results obtained from the
present case studies definitely are useful for future work.
It is shown in Figure 4.9 to Figure 4.25 that, the optimal support structures are quite
similar to tree-like structures. The "tree" starts with a few small branches on the upper
that become larger as they get closer to the substrate plate. In nature, these geometries
can be found in plant leaf veins and roots [62]. Current optimization results as well as
studies stated in the literature show that tree-like structures constitute a promising
approach to support structures that can withstand mechanical and thermal loads [63-65].
Some findings from Figure 4.9 to Figure 4.25 are listed below.
(1) Optimized support structures have 2 trunks, except support structures subject to
two-step load (Figure 4.9) that have 3 trunks. The printed part is asymmetric
with a vertical bar on the left side. The vertical bar also acts as a support, i.e., the
"trunk", to withstand loads. Therefore, there is barely any support material
besides the vertical bar. The diagonal support at the upper left corner acts as a
branch of the vertical bar, connecting the vertical bar and the horizontal bar.
However, the diagonal support in some optimization results is not obvious, i.e.,
the density of material less than 1, such as the support structures shown in Figure
4.12 and Figure 4.21. This is because the load on the left side near the vertical
bar is very small or equal to 0.

Chapter 4 Optimization results and discussions for SLM
34
(2) Since the volume fraction is set at 0.3 in all cases, the material consumption of
each obtained support structure is the same and equals 30% of the design domain.
The distribution of support materials is directly related to the loads. Subject to
the distribution of loads on the overhang, the optimized support structures are
different in the position and size of the branches and trunks.
(3) When the load is notably greater at a certain position than other places, such as
the load on the left in Figure 4.20, there is more support material under it, and a
longer contact interface between support structures and overhang. On the
contrary, a smaller load requires less supporting material. As shown in Figure
4.11, the load in the middle is zero and results in no support material in the
middle position.
(4) For loads with similar curves, the obtained support structures are parallel. The
V-shape load shown in Figure 4.15 and the single-wave-cosine load shown in
Figure 4.25 are symmetric with the centre line of the top plate as symmetry line.
The maximum load occurs at both ends. The load gradually decreases from the
maximum on the left to 0, and then increases to the maximum on the right. The
material distribution of the obtained support structures is alike with materials
mostly distributed at both sides and no material in the middle.

Chapter 4 Optimization results and discussions for SLM
35
Case study of two-steps load
(a)
(b)
(c)
Figure 4.9 Case study of two-steps load, (a) load distribution on printed part, (b) load
setting in Hypermesh, and (c) optimization result of support structure.

Chapter 4 Optimization results and discussions for SLM
36
Case study of three-steps load
(a)
(b)
(c)
Figure 4.10 Case study of three-steps load, (a) load distribution on printed part, (b) load
setting in Hypermesh, and (c) optimization result of support structure.

Chapter 4 Optimization results and discussions for SLM
37
Case study of dual-constant load
(a)
(b)
(c)
Figure 4.11 Case study of dual-constant load, (a) load distribution on printed part, (b) load
setting in Hypermesh, and (c) optimization result of support structure.

Chapter 4 Optimization results and discussions for SLM
38
Case study of positive-linear load
(a)
(b)
(c)
Figure 4.12 Case study of positive-linear load, (a) load distribution on printed part, (b) load
setting in Hypermesh, and (c) optimization result of support structure.

Chapter 4 Optimization results and discussions for SLM
39
Case study of negative-linear load
(a)
(b)
(c)
Figure 4.13 Case study of negative-linear load, (a) load distribution on printed part, (b) load
setting in Hypermesh, and (c) optimization result of support structure.

Chapter 4 Optimization results and discussions for SLM
40
Case study of inverse-v-shape load
(a)
(b)
(c)
Figure 4.14 Case study of inverse-v-shape load, (a) load distribution on printed part, (b)
load setting in Hypermesh, and (c) optimization result of support structure.

Chapter 4 Optimization results and discussions for SLM
41
Case study of v-shape load
(a)
(b)
(c)
Figure 4.15 Case study of v-shape load, (a) load distribution on printed part, (b) load
setting in Hypermesh, and (c) optimization result of support structure.

Chapter 4 Optimization results and discussions for SLM
42
Case study of positive-constant-bilinear load
(a)
(b)
(c)
Figure 4.16 Case study of positive-constant-bilinear load, (a) load distribution on printed
part, (b) load setting in Hypermesh, and (c) optimization result of support
structure.

Chapter 4 Optimization results and discussions for SLM
43
Case study of constant-negative-bilinear load
(a)
(b)
(c)
Figure 4.17 Case study of constant-negative-bilinear load, (a) load distribution on printed
part, (b) load setting in Hypermesh, and (c) optimization result of support
structure.

Chapter 4 Optimization results and discussions for SLM
44
Case study of constant-positive-bilinear load
(a)
(b)
(c)
Figure 4.18 Case study of constant-positive-bilinear load, (a) load distribution on printed
part, (b) load setting in Hypermesh, and (c) optimization result of support
structure.
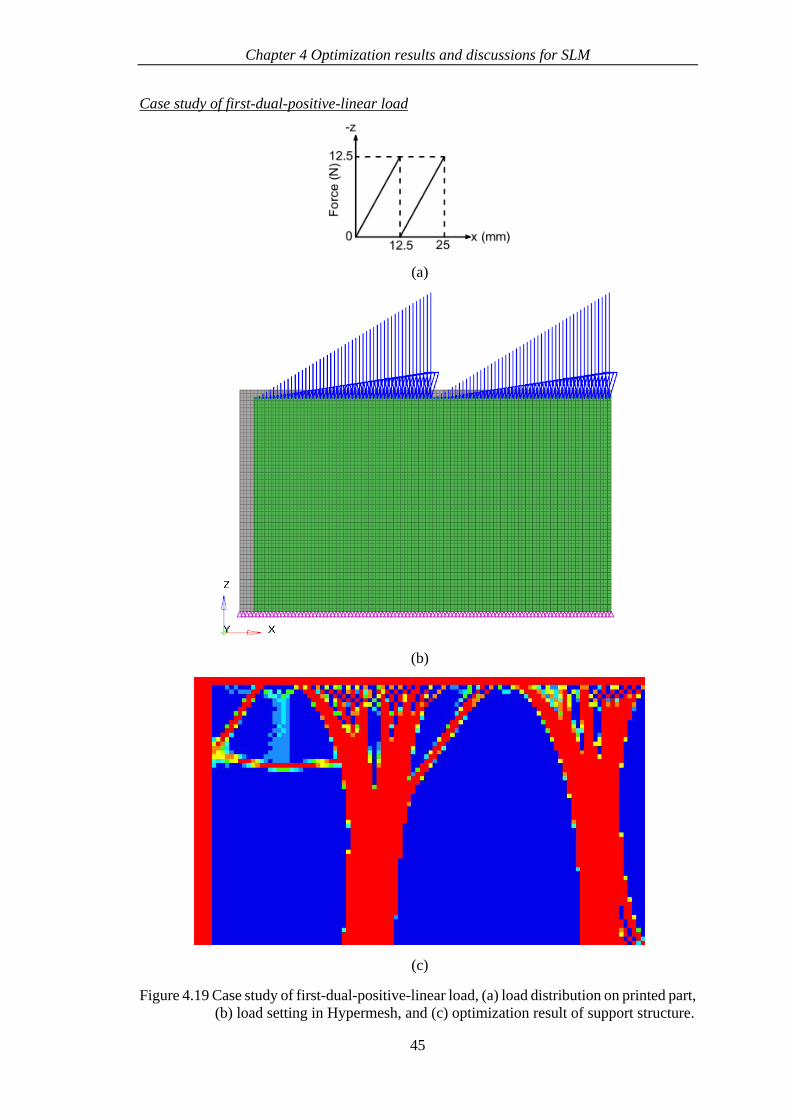
Chapter 4 Optimization results and discussions for SLM
45
Case study of first-dual-positive-linear load
(a)
(b)
(c)
Figure 4.19 Case study of first-dual-positive-linear load, (a) load distribution on printed part,
(b) load setting in Hypermesh, and (c) optimization result of support structure.

Chapter 4 Optimization results and discussions for SLM
46
Case study of second-dual-positive-linear load
(a)
(b)
(c)
Figure 4.20 Case study of second-dual-positive-linear load, (a) load distribution on printed
part, (b) load setting in Hypermesh, and (c) optimization result of support
structure.

Chapter 4 Optimization results and discussions for SLM
47
Case study of non-linear load
(a)
(b)
(c)
Figure 4.21 Case study of non-linear load, (a) load distribution on printed part, (b) load
setting in Hypermesh, and (c) optimization result of support structure.

Chapter 4 Optimization results and discussions for SLM
48
Case study of half-wave-sinusoidal load
(a)
(b)
(c)
Figure 4.22 Case study of half-wave-sinusoidal load, (a) load distribution on printed part,
(b) load setting in Hypermesh, and (c) optimization result of support structure.

Chapter 4 Optimization results and discussions for SLM
49
Case study of single-wave-sinusoidal load
(a)
(b)
(c)
Figure 4.23 Case study of single-wave-sinusoidal load, (a) load distribution on printed part,
(b) load setting in Hypermesh, and (c) optimization result of support structure.

Chapter 4 Optimization results and discussions for SLM
50
Case study of half-wave-cosine load
(a)
(b)
(c)
Figure 4.24 Case study of half-wave-cosine load, (a) load distribution on printed part, (b)
load setting in Hypermesh, and (c) optimization result of support structure.

Chapter 4 Optimization results and discussions for SLM
51
Case study of single-wave-cosine load
(a)
(b)
(c)
Figure 4.25 Case study of single-wave-cosine load, (a) load distribution on printed part,
(b) load setting in Hypermesh, and (c) optimization result of support structure.

Chapter 4 Optimization results and discussions for SLM
52
4.1.3 Remarks
In this section, modelling of the support structure for SLM based on structural topology
optimization is presented to explain how to use the structural topology optimization method
to generate optimal support structure for a given printed part. A printed part of a single
cantilever is used for optimization. An optimized support structure is obtained with the
objective with minimized compliance, subject to certain volume fraction constraint of 0.3
and weight of the overhang. Besides, for the supported and printed parts with different
geometrical shapes, several case studies are conducted with differently defined loads, in
order to optimize the support structures, and they are finally summarized in Table 4.2.
Table 4.2 Summary of differently defined loads.
Figure No. Load type Load shape
Figure 4.9 Two-steps
Figure 4.10 Three-steps
Figure 4.11 Dual-constant
Figure 4.12 Positive-linear

Chapter 4 Optimization results and discussions for SLM
53
Figure No. Load type Load shape
Figure 4.13 Negative-linear
Figure 4.14 Inverse-V-shape
Figure 4.15 V-shape
Figure 4.16 Positive-constant-bilinear
Figure 4.17 Constant-negative-bilinear
Figure 4.18 Constant-positive-bilinear
Figure 4.19 First-dual-positive-linear

Chapter 4 Optimization results and discussions for SLM
54
Figure No. Load type Load shape
Figure 4.20 Second-dual-positive-linear
Figure 4.21 Non-linear
Figure 4.22 Half-wave-sinusoidal
Figure 4.23 Single-wave-sinusoidal
Figure 4.24 Half-wave-cosine
Figure 4.25 Single-wave-cosine

Chapter 4 Optimization results and discussions for SLM
55
4.2 Thermal topology optimization subject to heat flux
load
In this section, a simulation model is presented for the support structure subject to heat flux
load, based on thermal topology optimization methodology.
A twin cantilever is considered for the printed geometry. If an experiment verification is
carried out in the future, the printing time is affected greatly by the height of the printed part,
such that the height of the selected printed part has to be appropriate. If the printed part is
very high, there is a long printing time. However, if the height of the printed part is very
small, the generated support structure is too small in the design domain, and thus the
structure cannot work well for its objective. For the horizontal bar of the printed part, an
appropriate thickness of 2 mm is selected. If the thickness of the bar is very large, the
deformation becomes very small and thus it cannot be measured experimentally. If the
thickness of the bar is very small, the deformation may collide with the powder scraper. For
the length of the horizontal bar, an appropriate length of 105 mm is selected. It is
unnecessary if the length of the horizontal bar is very large. If the length of the horizontal
bar is very small, the support structure becomes too small. Finally, the dimension of the
vertical bar of the printed part is designed as 48 × 5 mm, and that of the horizontal bar
designed as 105 × 2 mm, as shown in Figure 4.26.

Chapter 4 Optimization results and discussions for SLM
56
Figure 4.26 Geometry of printed part for thermal topology optimization.
The printed part is geometrically symmetrical, so half of the part is chosen for optimization.
A zero horizontal displacement is imposed on the boundary of the vertical bar to simulate
the symmetry condition. As shown in Figure 4.29, the corresponding design domain is
defined as the geometry volume and displayed in green colour in the commercial software
Hypermesh. Modelling has taken the vertical bar of the printed part into account as it plays
an important role in heat transfer in the process of printing. 2D meshing is done in the design
and non-design domains, in which the 2D quad elements are used with size of 0.5 × 0.5 mm.
Figure 4.27 Definition of design domain.
Aluminium alloy AlSi10Mg used in this case study adopts the same settings for the
structural topology optimization elaborated in Section 4.1. The setups of elastic modulus,

Chapter 4 Optimization results and discussions for SLM
57
Poisson’s ratio and density are the same with that listed in Table 4.1. Additionally, thermal
conductivity of 110 W/(m℃) is set in the optimization.
During the printing process, the heat generated by laser scanning is transferred through
support structure to a substrate, such that constant temperature is set at the bottom edges of
the design and non-design domains, representing the temperature condition of the substrate.
The adiabatic condition, that is, zero heat transfer, is imposed on all the remaining edges of
the domain. These thermal boundary conditions are shown in Figure 4.28.
Figure 4.28 Thermal boundary and load conditions for thermal topology optimization.
Laser is commonly used as a moving heat source to melt powders in the SLM process. The
Gaussian heat source model [66, 67] is most widely used, and its expression is
𝑞 =
2𝐴𝑃
𝜋𝑟02 exp (
−2𝑟2
𝑟02 )
(4.1)
where q is the heat flux, A is the absorption coefficient of the mental powder, P is the laser
power, r0 is the laser spot radius at which the laser energy reduces to 1/e2, and r is the radial
distance from the laser beam spot centre to a point on the powder bed surface. In the
modelling, each element layer represents 12.5 real layers. The laser beam melts about three
real powder layers [68], so the volume heat source can be simplified to surface heat source.
Equation (4.1) then can be written as [69]

Chapter 4 Optimization results and discussions for SLM
58
𝑞 =
2𝐴𝑃
𝜋𝑟02
(4.2)
The parameters used in the optimization include the absorption coefficient A of 0.2, laser
power P of 250 W, laser spot radius r0 of 75 μm, scanning speed v of 800 mm/s, and
thickness of 40 μm for each printing layer, which are summarized in Table 4.3. Based on
these parameters, heat flux q of 5659 W/mm2 is obtained by Equation (4.2).
Table 4.3 Process parameters used in the optimization.
Item Value Unit
Absorption coefficient (A) 0.2
Laser power (P) 250 W
Laser spot radius (r0) 75 µm
Laser travel speed 800 mm/s
Layer thickness 40 µm
Heat flux load is imposed on the design domain after meshing is completed. The first layer
of the overhang connecting supporting structures provides foundation for subsequent layers,
so it plays an immense role in dictating print success. Its deformation causes partial size loss
or print failure. When printing the subsequent layers, the bottom layers of the overhang are
completely solidified, so the laser heat is transferred to the substrate through the first layer
and the vertical bar. The key function of the support structure is to support the overhang
[41]. Therefore, the uniform heat flux is only imposed on the first element layer of the
overhang in this study, as shown in Figure 4.29.

Chapter 4 Optimization results and discussions for SLM
59
Figure 4.29 Setup of heat flux load for thermal topology optimization.
Same as structural topology optimization method, several parameters are input in the
commercial software Hypermesh, including design variable, constraint and objective. The
setup of the design variable is shown in Figure 4.5.
After the design variable is defined, the next step is to define design responses. Two
responses are defined for thermal optimization, namely volume fraction and thermal
compliance. The setups of design responses are shown in Figure 4.30 (a) and (b). The design
variable and responses are constrained with the allowed minimum and maximum values.
The volume fraction is the material fraction of the designable volume, which is chosen as
maximum 0.15 in this optimization, as shown in Figure 4.30 (c). Topology optimization is
performed to find the optimal material placement. In this study, minimizing thermal
compliance is chosen as the objective, which is shown in Figure 4.30 (d). As a summary,
all the optimization parameters are shown in Figure 4.31.

Chapter 4 Optimization results and discussions for SLM
60
(a)
(b)
(c)
(d)
Figure 4.30 Setup of parameters for structural topology optimization, (a) response of
volume fraction, (b) response of thermal compliance, (c) constraint and (d)
objective function.
Figure 4.31 Summary of parameters for thermal topology optimization.
For the problem described in Figure 4.31, thermal topology optimization is completed via
the commercial software Optistruct. The result obtained from the optimization is shown in
Figure 4.32, in which red colour indicates the elements with density equal to 1, blue colour
the elements to be removed with zero density, and the remaining colours the elements with
a density ranging between 0 and 1. Besides, iteration history of the optimization process is
shown in Figure 4.33.

Chapter 4 Optimization results and discussions for SLM
61
Figure 4.32 Optimization result of thermal topology optimization.
Figure 4.33 Iteration history of thermal topology optimization process.
As shown in Figure 4.32, the optimal support structure has a few of the material on the top
left-hand corner. Most of the material is on the right-hand side. Because most of the heat
generated from the middle of the overhang passes through the vertical bar to the substrate,
a little material is needed around the vertical bar on the left. This also proves the importance
of considering the vertical bar in the modelling.

Chapter 4 Optimization results and discussions for SLM
62
In this section, optimization of support structure for SLM based on thermal topology
optimization is conducted by the commercial software Hypermesh. A printed part formed
in the twin cantilever is used for the optimization. An optimized support structure is obtained
with the objective with minimized thermal compliance, subject to certain volume fraction
constraint of 0.15 and uniform heat flux imposed on the first element layer of the overhang.
4.3 Topology optimization subject to thermo-mechanical
coupled load
In this section, optimization of support structure is presented, subject to thermo-mechanical
coupled load for SLM. The coupled thermo-mechanical problem is solved by two methods,
namely structural and thermal topology optimizations. For the structural topology
optimization, compared with Section 4.1, an additional constraint of thermal compliance is
added, in order to consider the thermal environment in the optimization. Similarly, for the
thermal topology optimization, compared with Section 4.2, an additional constraint of
structural compliance is introduced to include the mechanical load.
4.3.1 Optimization with thermal compliance constraint
It is usual to only consider mechanical load in structural topology optimization. To carry
out the optimization subject to thermo-mechanical coupled load, the study adds a constraint
of thermal compliance. Thus, two constraints, volume fraction and thermal compliance, are
set in the optimization. The volume fraction is set at 0.15. The settings of the coupled
optimization are listed in Figure 4.34.

Chapter 4 Optimization results and discussions for SLM
63
Figure 4.34 Summary of parameters for structural problem with thermal compliance
constraint.
In this study, the printed part used is the same as the one descripted in Section 4.2, which is
shown in Figure 4.26. All the settings of parameters are also similar to those in Section 4.2.
The loads acting on the support structure are the weight of the overhang and the thermal
stress. The thermal stress is caused by uneven heating during the printing process that is
generated from the heat flux of the laser. Therefore, in the coupled thermo-mechanical
model, both the weight of the overhang and heat flux are considered for the loads input. As
shown in Figure 4.35, the uniform structural load, that is, the weight of the overhang, is
imposed on the upper boundary of the design domain, while the heat flux is applied on the
lowest finite element layer of the overhang. The constant temperature is set on the bottom
of the design and non-design domains to simulate the substrate temperature condition, while
all the nodes of bottom are fixed as the boundary condition, which simulates the fixed effect
of the printed part and support structure on the substrate.
Design variables * Density
Optimization responses* Volume fraction
* Compliance
* Thermal compliance
Design constraints* 0 ≤ Volume fraction ≤ 0.15
* Thermal compliance
Objective * Minmize compliance

Chapter 4 Optimization results and discussions for SLM
64
Figure 4.35 Setups of Loads and boundary conditions for coupled optimization.
In order to obtain an appropriate value of thermal compliance for setting constraint in the
coupled optimization, it must know the thermal compliance range when the part has
different support structures. In Section 4.2, thermal topology optimization aiming to get the
minimum thermal compliance is conducted, with which the settings of thermal boundary
condition, heat flux load and volume fraction in this section are the same. So based on the
thermal topology optimization in Section 4.2, the maximum thermal compliance of 33.7
s℃/(N mm) that is also the initial thermal compliance, and the minimum thermal
compliance of 13.1 s℃/(N mm) are obtained from the iteration curve, as shown in Figure
4.33. In other words, when a heat flux load is imposed on the part and different support
structures are set under the part, the obtainable minimum thermal compliance is 13.1 s℃/(N
mm), and the support structure has the best heat transfer efficiency at this moment.
Therefore, the upper bound of thermal compliance may be set between 13.1 and 33.7 s℃/(N
mm) in the structural topology optimization subject to thermo-mechanical load. Obviously,

Chapter 4 Optimization results and discussions for SLM
65
different optimized support structures are obtained with different settings of upper bound of
the thermal compliance. In the section, five case studies are made with upper bounds of the
thermal compliance at 13.1, 15, 20, 25, 30 and 33.7 s℃/(N mm). The optimized support
structures are shown in Figure 4.36.
(a) (b)
(c) (d)
(e) (f)
Figure 4.36 Optimized support structure with thermal compliance of (a) 13.1 s℃/(N mm), (b) 15 s℃/(N mm), (c) 20 s℃/(N mm), (d) 25 s℃/(N mm), (e) 30 s℃/(N mm) and (f) 33.7 s℃/(N mm).

Chapter 4 Optimization results and discussions for SLM
66
Figure 4.36 (a) shows the optimized support structure at thermal compliance of 13.1 s℃/(N
mm). It is alike that obtained from thermal topology optimization. Most materials are
located at the right-hand side so as to transfer heat from overhang to substrate. In topology
optimization, the iteration meets the constraints first, and then the optimization objective. If
the thermal compliance constraint is set at 13.1 s℃/(N mm), the optimized support
structure ensures it below 13.1 s℃/(N mm) in the first place. 13.1 s℃/(N mm) is the
minimum value that can be obtained in the thermal topology optimization subject to heat
flux, so setting at 13.1 s℃/(N mm) means fully considering the effect of heat flux and the
obtained support structure is alike that obtained by thermal topology optimization subject
to heat flux.
Figure 4.36 (f) shows the optimized support structure when the upper bound of thermal
compliance is set at 33.7 s℃/(N mm). It is the same with that obtained from structural
topology optimization. If the thermal compliance constraint is set at 33.7 s℃/(N mm), the
optimized support structure ensures it below 33.7 s℃/(N mm) in the first place. 33.7
s℃/(N mm) is the maximum value at initial status before iteration starts. Obviously, all
support structures can satisfy this constraint, which means 33.7 s℃/(N mm) has no
constraint at all. In this case, heat flux has no effect on the result of optimized structure and
the obtained support structure is very close to that obtained by structural topology
optimization subject to mechanical load.
Figure 4.36 (b) to Figure 4.36 (e) show the optimized support structures subject to coupled
loads that may be regarded as the superposition of support structures subject to separate load
cases, namely mechanical and heat flux loads. When the upper bound of thermal compliance
gradually reduces from 33.7 to 13.1 s℃/(N mm), the optimized support structure changes
from that obtained by structural topology optimization to that obtained by thermal topology
optimization. The support structure on the right-hand side gradually transforms from two
pillars to a single pillar. If the upper bound of thermal compliance is set between 13.1 and
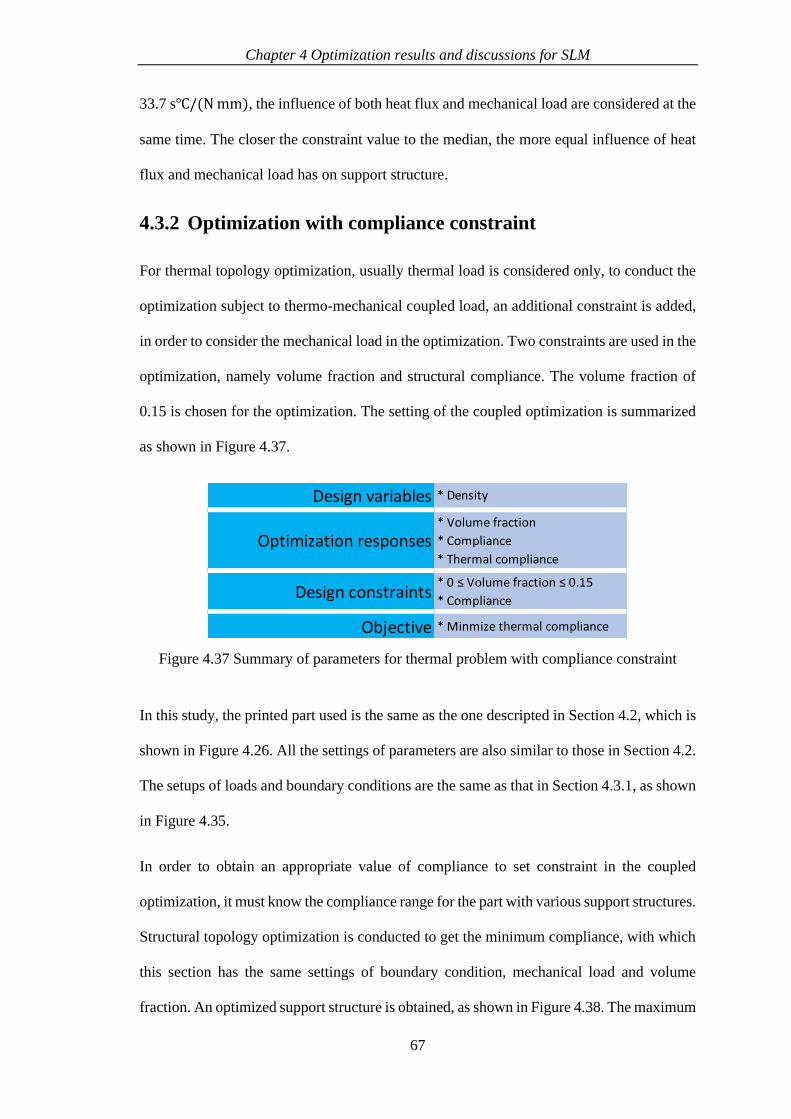
Chapter 4 Optimization results and discussions for SLM
67
33.7 s℃/(N mm), the influence of both heat flux and mechanical load are considered at the
same time. The closer the constraint value to the median, the more equal influence of heat
flux and mechanical load has on support structure.
4.3.2 Optimization with compliance constraint
For thermal topology optimization, usually thermal load is considered only, to conduct the
optimization subject to thermo-mechanical coupled load, an additional constraint is added,
in order to consider the mechanical load in the optimization. Two constraints are used in the
optimization, namely volume fraction and structural compliance. The volume fraction of
0.15 is chosen for the optimization. The setting of the coupled optimization is summarized
as shown in Figure 4.37.
Figure 4.37 Summary of parameters for thermal problem with compliance constraint
In this study, the printed part used is the same as the one descripted in Section 4.2, which is
shown in Figure 4.26. All the settings of parameters are also similar to those in Section 4.2.
The setups of loads and boundary conditions are the same as that in Section 4.3.1, as shown
in Figure 4.35.
In order to obtain an appropriate value of compliance to set constraint in the coupled
optimization, it must know the compliance range for the part with various support structures.
Structural topology optimization is conducted to get the minimum compliance, with which
this section has the same settings of boundary condition, mechanical load and volume
fraction. An optimized support structure is obtained, as shown in Figure 4.38. The maximum
Design variables * Density
Optimization responses* Volume fraction
* Compliance
* Thermal compliance
Design constraints* 0 ≤ Volume fraction ≤ 0.15
* Compliance
Objective * Minmize thermal compliance

Chapter 4 Optimization results and discussions for SLM
68
compliance of 2.79 mm/N that is also the initial compliance, and the minimum compliance
of 0.69 mm/N are obtained from the iteration curve, as Figure 4.39 shows the variation of
objective function with the iteration number. In other words, when a load is imposed on the
part and different support structures are set under the part, the obtainable minimum
compliance is 0.69 mm/N, and the support structure has the biggest stiffness to support the
part at this moment. Therefore, the upper bound of compliance may be set between 0.69 and
2.79 mm/N in the thermal topology optimization subject to thermo-mechanical coupled load.
Obviously, different settings of the upper bounds of the compliance result in different
optimized support structures. Here, the case studies include six upper bounds of the
structural compliance that are 0.69, 1.1, 1.5, 1.9, 2.3 and 2.79 mm/N. The optimized support
structures are shown in Figure 4.40.
Figure 4.38 Support structure subject to heat flux by thermal topology optimization.
Figure 4.39 Iteration history for the thermal topology optimization process.

Chapter 4 Optimization results and discussions for SLM
69
(a) (b)
(c) (d)
(e) (f)
Figure 4.40 Optimized support structure with compliance of (a) 0.69 mm/N, (b) 1.1 mm/N,
(c) 1.5 mm/N, (d) 1.9 mm/N, (e) 2.3 mm/N and (f) 2.79 mm/N.

Chapter 4 Optimization results and discussions for SLM
70
Figure 4.40 (a) shows the optimized support structure at structural compliance of 0.69 mm/N.
It is similar to that obtained from structural topology optimization, which is shown in Figure
4.38. Figure 4.40 (f) shows the optimal support structure when the upper bound of the
structural compliance is set as 2.79 mm/N. It is very close to that obtained from thermal
topology optimization subject to heat flux load. The reason for these similarities is the same
as that described in Section 4.3.1.
It is shown in Figure 4.40 (b) to Figure 4.40 (e) that the optimized support structures subject
to coupled loads may be regarded as the superposition of support structures subject to the
separated load cases, namely mechanical and heat flux loads. When the upper bound of the
structural compliance is gradually reduced from 2.79 to 0.69 mm/N, the optimized support
structures change from that obtained by thermal topology optimization to that obtained by
structural topology optimization. The support structure on the right-hand side gradually
translates from two pillars to a single one.
4.4 Displacement analysis for part with different support
structures
In this section, the optimized support structures obtained by structural and thermal topology
optimizations are verified and compared through case studies.
Four different support structures are compared using Netfabb, which is a commercial
software program for additive manufacturing produced by Autodesk. Netfabb Simulation is
one component of Netfabb, with the ability of simulating the printing process for metal
powder bed fusion and directed energy deposition, predicting part distortion, compensating
for distortion, calculating residual stresses and simulating response after wire-cutting, etc.
[70].
In Sections 4.1 to 4.3, the optimized support structures are obtained for the 2D printed part.
Netfabb cannot perform the simulation with zero thickness, so a thickness needs to be set

Chapter 4 Optimization results and discussions for SLM
71
for the printed part and support structures. Thickness affects printing time and material
usage in an experiment verification, so an appropriate thickness is very important. A small
thickness makes the part and support structures too weak and fails the manufacturing. A
large thickness requires a long printing time and waste of materials. In this study, a thickness
of 5 mm is chosen for the printed part and the support structures. The same printed part is
used for topology optimizations and simulations of the printing process, which is shown in
Figure 4.26.
4.4.1 Uniform support structures
In this section, printing process is simulated for a twin cantilever part with uniform support
structures. The part is supported by 28 columns equally distributed as the support structures,
with the cross section of 0.5×5 mm2 and the length of 48 mm. The total volume of material
used for the support structures is thus equal to 672 mm2. The geometry of twin cantilever
part with uniform support structures is shown in Figure 4.41 (a) and (b). A Cartesian
coordinate system is defined in 3D domain, as shown in Figure 4.41 (c). The x-, y-, and z-
axes are defined along horizontal, thickness and vertical directions, respectively. The
positive x-, y-, and z-axes are labelled by x, y and z, respectively and the coordinate origin
is located at the centre point of the bottom of the vertical bar. The building direction is along
the z- axis.
The area of support structures is 672 mm2 and the total area under the overhang is 4800
mm2, so the volume fraction of support structures is 672 / 4800 = 0.14, which is reasonable.
A smaller volume fraction may make the smallest size of the optimized support structures
less than the minimum feature size that SLM can print and thus fail printing. A larger
volume fraction generates a support structure too large to be easily removed in post-
processing.

Chapter 4 Optimization results and discussions for SLM
72
(a) Front view
(b) ISO view
(c) Cartesian coordinate system
Figure 4.41 Geometry views of printed part, (a) Front view, (b) ISO view and (c)
Cartesian coordinate system.
Before using the commercial software Netfabb for simulation, a geometric model including
the printed part and the support structures is developed and saved in STL format. After that,
the completed geometric model, including twin cantilever printed part and support
structures, is imported into Netfabb. In other words, the model of the printed part is imported
first, and then a substrate plate is added under the printed part. The substrate is considered

Chapter 4 Optimization results and discussions for SLM
73
to make the simulation of the printing process close to reality. A large substrate requires
greater computational effort, so a substrate with the same length of 105 mm and width of 5
mm as the printed part is adopted in the simulation to save cost. The height of the substrate
is set at 25 mm to prevent deformation of the printed part and support structures during the
printing process. Finally, the model of support structures is imported. The twin cantilever
printed part, support structures and substrate plate are shown in Figure 4.42.
Figure 4.42 Imported part and uniform support structures in Netfabb.
A set of the input parameters are required by the commercial software Netfabb, such as
material properties, process parameters, heat treatment, properties of build plate, and
operating conditions, etc. Aluminium alloy AlSi10Mg is chosen as the printing material for
the simulation. The key processing parameters are listed in Table 4.3. Pre-heating is not
considered for the substrate. Zero-displacement is set at the bottom of the substrate to
simulate the real boundary condition. A uniform heat loss coefficient of 2.5e-5 W/(mm2 ℃)
is set as the thermal boundary condition. The ambient temperature of 25 °C is set in the
simulation.

Chapter 4 Optimization results and discussions for SLM
74
There are four options for mesh accuracy setting, namely the “fastest”, “fast”, “accurate”
and “most accurate” options. Obviously, different settings of accuracy have influence on
the accuracy of the final results. When the accuracy is set at “fastest”, the meshed elements
are large and the number of elements is low, and thus the simulated results become worse.
If the accuracy is set at “most accurate”, the meshed elements are small and number of
elements is high, and thus the simulated results become best. In present simulation, the
option “fast” is chosen for setting of accuracy.
Meshing is carried out automatically once the parameters are set. The printed part, support
structures and substrate are discretized with 207062 nodes and 112163 elements, as shown
in Figure 4.43. Part of meshing detail is shown in Figure 4.44 for comparison of the meshing
result with the original geometric model, in which the size of the meshing elements in some
locations is larger than the geometric model. This may affect the computational accuracy.
Figure 4.43 Meshing result of part and uniform support structures.

Chapter 4 Optimization results and discussions for SLM
75
Figure 4.44 Meshing details of part and uniform support structures.
After the setting of meshing details is completed, the program is executed and various results
are displayed for each computational step, such as the displacement, principal stress,
principal stress direction and temperature distributions, etc. A lot of computing resources
are required to simulate every real layer, so Netfabb combines multiple layers into one
computational layer. There is a total of 24 computational layers for the printed part. The
first 23 layers are the vertical bar and support structures and the last layer is the overhang.
With a layer thickness of 40 μm for the printed part and support structures, a computational
layer corresponds to around 52 real printing layers.
The simulation of each computational layer is typically separated into two steps. In the first
step, the computational layer is instantaneously activated in a molten state. When the
computational layer cools and contracts after a specific time, it starts the second step. The
time between each computational layer (increment 2 & 3, 4 & 5, and so on) is short to
simulate a near steady state response from the end of one layer to the start of the next.
Several steps in printing order are shown in Figure 4.45. The printing process of vertical bar
and support structures is simulated from steps i=1 to i=46. The activation and cooling of the
overhang, that is, the last computational layer, are at step i=47 and i=48, respectively. A
short time of 0.24 s between step i=48 and i=49 simulates a near steady state response. The
temperature of the whole model cools down to the ambient temperature of 25 ℃ at step i=50.

Chapter 4 Optimization results and discussions for SLM
76
The substrate together with part and support structures are dismounted at step i=51. The part
and support structures are removed from the substrate at step i=52, and the support structures
are removed from the printed part at step i=53. It takes 13782 s to simulate the whole
printing process.
i = 53
i = 52
i = 47
i = 31
i = 1
Figure 4.45 Simulation steps in Netfabb.
The simulation result of displacement at step i=53 is shown in Figure 4.46. The minimum
displacement of 0.0134 mm occurs at the bottom of the vertical bar, and the maximum
displacement of 0.14698 mm at both ends of the horizontal bar. During the SLM processing,

Chapter 4 Optimization results and discussions for SLM
77
the laser source generates high thermal intensity. The rapid melting of metal powder is
followed by a rapid solidification. This solidification causes the area of the scanned layer to
expand or contract, and generates residual stress. The residual stress may cause geometric
deformation or warping of the part [71, 72]. Since there is a support structure under the part,
the support structure connects the part to a fixed substrate, thereby forcibly fixing the
geometric shape in the proper position. Therefore, the deformation or warping is not evident
during the printing process. When the support structures are removed, the residual stress
releases and causes two ends of the part to warp upward. Therefore, the displacements of
both ends are the largest. The bottom of the vertical bar connects to a fixed substrate, so
heat is transferred to the substrate through this area during the printing process, where the
cumulative residual stress is the smallest. Therefore, when the part is removed from the
substrate, the displacement at the bottom is the smallest.
Figure 4.46 Simulation result of displacement of part with uniform support structures .
4.4.2 Non-uniform support structure subject to thermal stress
In the structural topology optimization, the mechanical loads acting on the support structure
are the weight of the overhang and the thermal stress generated in the process of printing.

Chapter 4 Optimization results and discussions for SLM
78
In Section 4.1.1, an optimized support structure is obtained by structural topology
optimization, subject to the weight of overhang. However, the typical forces imposed on the
support structure during the printing process are usually thermal loads rather than gravity
loads [73]. Therefore, in the structural topology optimization of the support structure, the
influence of thermal stress is more important than that of overhang weight. In this section,
the support structure is optimized subject to thermal stress by structure topology
optimization.
Since the thermal stress exists throughout the printing process, it is necessary to simulate
the entire printing process to obtain the desired thermal stress. As illustrated in Section 4.4.1,
the simulation of the printing process is already done in Netfabb for the printed part with a
uniform support structure. Therefore, thermal stress can be obtained from the simulation
results in Section 4.4.1. It is used as the design load in structural topology optimization to
obtain the optimized support structure subject to the thermal stress. A similar method can
be found in other papers [8, 73].
The first layer of the overhang is activated from step i=47, which means the support
structure starts to support the overhang at step i=47. The support structure is removed from
the part at the last step i=53. Therefore, it is enough to consider the thermal stress generated
during the process from step i=47 to step i=52. To do this, the lower edge of the overhang,
that is, the upper edge of the design space, is divided into 50 equal parts and the thermal
stress on 51 points to be obtained from the simulation results. For the specified points on
the part-support interface, the thermal stresses at specified points changes constantly at
different stages. The maximum thermal stress needs to be considered for every specified
point to ensure the optimized support structure can withstand the forces over the entire
manufacturing process. All stages have to be checked to determine the maximum thermal
stress as they may not appear at the same stage. Figure 4.47 shows the maximum stresses at
each specified point obtained from simulation results.

Chapter 4 Optimization results and discussions for SLM
79
Figure 4.47 Maximum von Mises stresses at the specified points along the part.
It is shown in Figure 4.47 that the maximum thermal stress along the bottom edge of the
printed part ranges from 20.2 to 61.0 MPa, with an average value of 35.1 MPa. The
maximum thermal stress at a specific point may not occur in the process of “printing”. It
may occur after printing when cutting the part and support structures from the substrate or
removing support structures from the part. For example, the maximum thermal stress at
position 54 mm occurs at the simulation step i=52 when the part and support structure are
removed from the substrate.
The maximum stresses at specific points are then used as the design load in structural
topology optimization as descripted in Section 4.1.1. Figure 4.48 shows the optimized
support structure obtained from the optimization.

Chapter 4 Optimization results and discussions for SLM
80
Figure 4.48 Optimized support structure subject to thermal stress.
Figure 4.49 Generated geometry for part and support structure subject to thermal stress.
It is shown in Figure 4.48 that most of the material is on the right-hand side with a small
part on the top left-hand side. The vertical bar at the left-hand side plays a role in
withstanding thermal stress, so fewer supports are needed on the left. The surface of support
structure obtained by optimization is uneven, which is unsuitable for the final optimal
geometry. Apart from that, some elements are not connected to each other, and thus a final
CAD model is necessarily generated based on the material distribution. In the commercial

Chapter 4 Optimization results and discussions for SLM
81
software Hypermesh, the Ossmooth tool is used to convert the optimal model into a
geometry. A threshold for the density of elements is selected, such that all elements with a
density larger than the threshold are selected to generate a geometry, and elements with a
density less than the threshold are deleted. After the geometry is generated in Ossmooth, it
is exported and saved as a IGES format file, as shown in Figure 4.49. There are small
geometrical errors, such as tiny holes resulted from missed elements and disconnected
segments. The file is then imported into a CAD software, such as Solidworks and
Rhinoceros 3D. Finally, an optimal geometry is obtained by rebuilding of lines that
eliminates those errors, as shown in Figure 4.50. The area of the half support structure is
336 mm2 that is the same as that of the uniform support structures as described in Section
4.4.1.

Chapter 4 Optimization results and discussions for SLM
82
(a)
(b)
Figure 4.50 Printed part and support structure (a) Front view; (b) ISO view.
After the final geometries of the printed part and support structure are modelled, the printed
part is imported into Netfabb first, as shown in Figure 4.51. Then, support structure is
imported and added to the printed part, as shown in Figure 4.52. Using the same setting as
described in Section 4.4.1, the meshing result of printed part and support structure is shown
in Figure 4.53. More meshing details of support structure is shown in Figure 4.54. After
executing the program, the result of displacement at the last simulation step is shown in
Figure 4.55.

Chapter 4 Optimization results and discussions for SLM
83
Figure 4.51 Imported printed part in Netfabb.
Figure 4.52 Imported printed part and support structures in Netfabb.

Chapter 4 Optimization results and discussions for SLM
84
Figure 4.53 Meshing result of part and support structure subject to thermal stress.
Figure 4.54 Meshing details of part and support structure subject to thermal stress.

Chapter 4 Optimization results and discussions for SLM
85
Figure 4.55 Simulation result of displacement of part with support subject to thermal stress.
4.4.3 Non-uniform support structure subject to heat flux
In this section, the optimal support structure (Figure 4.32) subject to heat flux is chosen for
the printing process simulation by the commercial software Netfabb. After the optimal
geometry of the support structure is generated in Ossmooth, it is exported and saved as an
IGES format file. The file is imported to a CAD software and a final geometry is obtained
by rebuilding the lines, as shown in Figure 4.56. In the commercial software Netfabb, the
printed part is imported. Then, support structure is also imported and added to the printed
part. Using the setting same as described in Section 4.4.1, the meshing result of the printed
part and support structure is shown in Figure 4.57. More meshing details of the support
structure and printed part is shown in Figure 4.58. After executing the program, the
simulation result of displacement at the last step is shown in Figure 4.59.

Chapter 4 Optimization results and discussions for SLM
86
(a)
(b)
Figure 4.56 Geometry of printing part and support structure (a) Front view; (b) ISO view.

Chapter 4 Optimization results and discussions for SLM
87
Figure 4.57 Meshing result of part and support structure subject to heat flux.
Figure 4.58 Meshing details of part and support structure subject to heat flux.
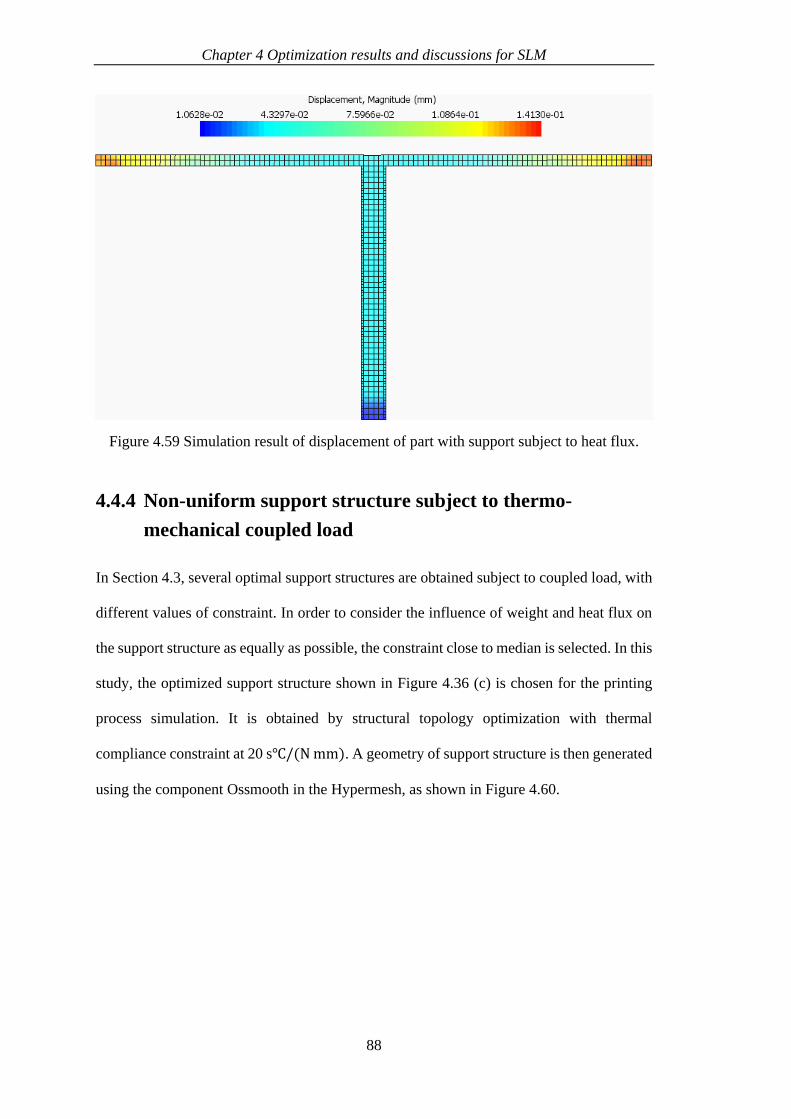
Chapter 4 Optimization results and discussions for SLM
88
Figure 4.59 Simulation result of displacement of part with support subject to heat flux.
4.4.4 Non-uniform support structure subject to thermo-
mechanical coupled load
In Section 4.3, several optimal support structures are obtained subject to coupled load, with
different values of constraint. In order to consider the influence of weight and heat flux on
the support structure as equally as possible, the constraint close to median is selected. In this
study, the optimized support structure shown in Figure 4.36 (c) is chosen for the printing
process simulation. It is obtained by structural topology optimization with thermal
compliance constraint at 20 s℃/(N mm). A geometry of support structure is then generated
using the component Ossmooth in the Hypermesh, as shown in Figure 4.60.

Chapter 4 Optimization results and discussions for SLM
89
Figure 4.60 Generated geometry of part and support subject to coupled load.
The generated optimal geometry is then exported from Hypermesh and imported to a CAD
software, and a final geometry is obtained by rebuilding the lines, as shown in Figure 4.61.
For the simulation in commercial software Netfabb, the printed part and support structure
are imported from CAD software. Using the setting as described in Section 4.3.1, the
meshing result of the printed part and support structure is shown in Figure 4.62. More
meshing details of the support structure and printed part is shown in Figure 4.63. Finally,
the simulation result of displacement at the last step is obtained, as shown in Figure 4.64.

Chapter 4 Optimization results and discussions for SLM
90
(a)
(b)
Figure 4.61 Geometry of printing part and support structure (a) Front view; (b) ISO view.

Chapter 4 Optimization results and discussions for SLM
91
Figure 4.62 Meshing result of part and support structure subject to coupled load.
Figure 4.63 Meshing details of part and support structure subject to coupled load.

Chapter 4 Optimization results and discussions for SLM
92
Figure 4.64 Simulation result of displacement of part with support subject to coupled load.
4.4.5 Comparison of displacements for part with different
support structures
In this section, four kinds of support structures are studied and compared each other for
printing the same part with different optimization methods, namely (1) the uniform support
structures without optimization for purpose of comparison, (2) the support structures
optimized by the structural topology optimization subject to thermal stress, (3) the support
structures generated by the thermal topology optimization subject to heat flux, and (4) the
support structures obtained by the structural topology optimization subject to thermo-
mechanical coupled load. The same volume fractions of 0.15 are used in all the
optimizations. In other words, the volume of material is around 15 percent of the design
domain for these four kinds of support structures. The printing process of parts with different
support structures is simulated via the commercial software Netfabb.
For the simulation results of displacement of printed parts shown in Figure 4.46, Figure 4.55,
Figure 4.59 and Figure 4.64, the displacement of the vertical bar is close to zero, and the

Chapter 4 Optimization results and discussions for SLM
93
largest displacement occurs at both ends of the overhangs. The twin cantilever printed parts
are geometrically symmetrical, so only the right half part is considered. To compare the
displacement of the overhangs, each overhang is divided into 10 equal sections. There are
11 points on each overhang. With displacement values of the points obtained from the
simulation results, the displacement curves of overhangs are drawn, as shown in Figure 4.65.
Figure 4.65 Displacement of overhangs after wire-cutting.
It is shown in Figure 4.65 that all the displacement curves are similar. The overhang presents
an uplifted shape, which is consistent with other research findings [14, 74]. This deflection
is due to the accumulation of residual stress during the printing process. When the part is
removed from substrate and support structure, the release of these residual stresses causes
the deformation. In practice, all parts undergo a heat treatment process to release residual
stress before being removed from the support structure. The inappropriate release of residual
stress through the heat treatment process will deform the part when it is removed from the
substrate and support structure. The maximum displacements of each printed part are
summarized in Table 4.3 for further discussion.

Chapter 4 Optimization results and discussions for SLM
94
Table 4.4 Summary of the maximum displacement for different support structures.
Support structure type Max. displacement (mm)
Uniform (Support_1) 0.147
Non-uniform optimized by structural topology
optimization subject to thermal stress (Support_2) 0.137
Non-uniform optimized by thermal topology
optimization subject to heat flux (Support_3) 0.141
Non-uniform optimized by structural topology
optimization subject to coupled load (Support_4) 0.134
As shown in Table 4.4, Support_1 represents the uniform support structure with the
maximum displacement of 0.147 mm, Support_2 represents the non-uniform support
structure optimized by structural topology optimization with the maximum displacement of
0.137 mm, Support_3 represents the non-uniform support structure optimized by thermal
topology optimization with the maximum displacement of 0.141 mm, and Support_4
represents the non-uniform support structure optimized by thermal topology optimization
with the maximum displacement of 0.134 mm. Some findings from Table 4.4 are listed
below.
(1) The printed part with Support_1 has the highest maximum displacement compared
with the other three support structures, suggesting that uniform support structures
are worse than non-uniform structures to support overhang and transfer heat.
(2) The printed part with Support_4 has the lowest maximum displacement, meaning
that its material distribution transfers heat better during the printing process, and
reduces distortion when the printed part is removed from the substrate plate.
(3) The maximum displacement of part with Support_2 is in between as the load
imposed on it is based on the simulation results of part with Support_1. It reflects
that the iterative method used in the optimization is an effective approach.

Chapter 4 Optimization results and discussions for SLM
95
(4) The maximum displacement of part with Support_2 is smaller than that of part with
Support_3. This is because the thermal stress is obtained from simulation results
which is caused by heat flux. The thermal stress is imposed directly on the support
structure during the printing process. This shows that the support structure
optimized subject to thermal stress is better than that subject to heat flux.
4.5 Remarks
In this chapter, the optimization results of support structure for SLM are presented and
discussed in detail. Simulation of the support structure is presented in Section 4.1 by
structural topology optimization subject to mechanical loads, in which uniform and non-
uniform loads are considered for the simulation. Thermal topology optimization method is
employed in Section 4.2 to generate the optimal support structure for a given printed part,
subject to uniform and non-uniform generated heats. Topology optimization subject to
thermo-mechanical coupled load is investigated in Section 4.3, in which thermal compliance
and displacement constraints are considered for the optimization. Four support structures
are simulated in Section 4.4 via the commercial software Netfabb, in order to compare the
displacements of the printed part after cutting from substrate. They include (1) the uniform
support structure, (2) the support structure generated by structural topology optimization,
(3) the support structure generated by thermal topology optimization, and (4) the support
structure obtained by topology optimization subject to thermo-mechanical coupled load. It
is shown through comparison that the printed part with the fourth support structure achieves
the smallest displacement, such that considering both heat and mechanical loads
simultaneously in topology optimization is critically important.
In terms of the topology optimization methods, a good optimized result means that the
generated support structure is manufacturable. First, the size of the support structure shall
be larger than the minimum size that SLM can print. Currently, the minimum printable

Chapter 4 Optimization results and discussions for SLM
96
feature size by SLM is 40-200 µm [75]. In this study, the smallest element size is 0.25 ×
0.25 mm that meets the minimum size requirement and ensures the structure is printable.
Second, the generated support structure itself does not need any support. The critical angle
of the overhang shall be around 45º to realize self-support [44, 76, 77]. In this study, most
obtained support structures meet this requirement. A few that fail, such as the overhang of
the support structure near the vertical bar in Figure 4.61 with the angle only at 26º, can be
solved by adding AM filters in the topology optimization, which makes structures self-
supported [78].
In this study, only the optimization of the main support structure was considered, which is
directly connected to the overhang. This brings great difficulties to remove the support
structure in post-processing. In order to reduce post-processing costs and improve surface
quality, one solution is to add a design constraint in the topology optimization to generate
comb-like patterns at the interface between the support structure and the overhang, so that
the support structures can be easily removed [35]. Another solution is to replace the upper
continuous connection area of the support with a comb-like pattern, so that the part is
connected to the support by multiple "teeth" that can be easily separated. These solutions
only alter the interface between the part and the support which requires a little change of
material amount. The conclusion of the comparison of several support structures in Table
4.3 remain unchanged.

97
CHAPTER 5 CONCLUSIONS AND FUTURE
WORK
This chapter summarizes the research work that has been completed so far. In particular,
major conclusions are made, based on the research work discussed in Chapter 4, followed
by several studies proposed for future work.
5.1 Conclusions
This thesis has mainly studied the optimizations of support structure for SLM by topology
optimization methodologies. Based on past research work in open literature, the support
structures are optimized by two optimization design methods, considering the heat and
mechanical loads in the SLM printing process. The printing efficiency is thus improved, and
the consumption of materials reduced. The main research contributions of this thesis are
summarized as follows.
(1) Optimization of support structures subject to mechanical, heat flux and thermo-
mechanical coupled loads. The commercial software Optistruct is utilized for
optimization of support structures subject to various loads, based on structural and
thermal topology optimization methodologies. This study’s results show that the
topology optimizations are indeed suitable to derive these support structures.
(2) Displacement analysis for a part with different support structures. The support
structures optimized by structural and thermal topology optimizations are verified
and compared with case studies. Four kinds of support structures for a same printed
part are studied and compared. The printing processes of parts with different support
structures are simulated by the commercial software Netfabb, and the displacements
of printed parts are studied. It is shown by simulation results that material
distribution of the support structure optimized by topology optimization subject to

Chapter 5 Conclusion and Future Work
98
thermo-mechanical coupled load offers better heat transfer during the printing
process, and reduces distortion after the printed part is removed from the substrate
plate.
The present study has made good progress in researching the topology optimization of
support structure in SLM. However, this study still has some limitations, as described below.
(1) The support structures obtained in the present study are based on a given volume
fraction. In practice, experience is required to choose an appropriate volume fraction,
which limits the application of the current method.
(2) The strength of the support structures is not considered in the topology optimizations.
In the optimization, if the volume fraction is set too small, it may result in a sparse,
elongated support structure with a relatively small contact interface on the substrate,
which may cause printing failure. To solve this problem, an additional stress
constraint can be added during topology optimization to ensure sufficient strength
of the generated support structure.
(3) There are some unsupported surfaces in the overhang. For example, in the support
structure obtained by thermal topology optimization subject to heat flux load (Figure
4.32), all the support materials are on the right side, and only a small part of the
overhang is supported. This problem can be solved by introducing an overhang
constraint in topology optimization [78].
(4) For the displacement analysis for parts, Netfabb Simulation is used for the
simulation of the printing process. Netfabb Simulation makes meshing
automatically whose element size cannot be changed manually, which may affect
the accuracy of the simulation results. Therefore, it is necessary to choose other
simulation software to do more simulations to observe the accuracy of the results.

Chapter 5 Conclusion and Future Work
99
5.2 Future work
With the continuous development and popularization of 3D printing technology, the 3D
printing process of parts with complex structures attracts significant attention from
researchers. For SLM printing technology, the support structure is important for part with
overhang, and it is necessary for more research work in this direction. In this thesis, the
optimizations of support structure are carried out by structural and thermal topology
optimization methods. The future work is thus recommended as follows.
1) It should be noticed that only 2D regular printed parts have been studied in this
thesis. Therefore, the study of 3D irregular printed parts via topology optimization
is recommended systematically through case studies.
2) In Chapter 4, the support structures are optimized by considering different loads
and using different topology optimization methods. In order to verify if these
support structures have greater stiffness and smaller thermal compliance compared
with conventional support structures, simulations of the printing process have been
conducted, and displacements of the overhang have been compared, for the same
printed part with different support structures. It is demonstrated that the optimized
support structures have better performance, compared with conventional support
structures. However, the results from simulation may not be accurate enough.
Therefore, it is necessary to conduct experiments for verification of the
performance of the optimized support structures.
3) For the topology optimization methodologies used in this thesis, the steady-state
heat conduction is assumed in the optimizations. However, practical printing is a
complex transient process. During the SLM manufacturing process, the support
structure and printed part are significantly subject to transient thermo-mechanical
coupled load. In order to consider the transient effects of the thermo-mechanical

Chapter 5 Conclusion and Future Work
100
coupling environment in the optimization of the support structure for the overhang,
a topology optimization methodology considering transient thermo-mechanical
coupled load is recommended for further study.
4) In order to achieve more accurate support structure subject to thermo-mechanical
coupled load, more printing-process parameters should be considered, such as
printing scanning strategy in optimization for the future work.

101
REFERENCES
1. Gibson, I., D.W. Rosen, and B. Stucker, Additive manufacturing technologies. 2010.
Google Scholar.
2. Levy, G.N., R. Schindel, and J.-P. Kruth, Rapid manufacturing and rapid tooling
with layer manufacturing (LM) technologies, state of the art and future perspectives.
CIRP Annals-Manufacturing Technology, 2003. 52(2): p. 589-609.
3. Ford, S.L., Additive manufacturing technology: potential implications for US
manufacturing competitiveness. J. Int'l Com. & Econ., 2014. 6: p. 40.
4. Chua, C.K., K.F. Leong, and C.S. Lim, Rapid prototyping: principles and
applications. Vol. 1. 2003: World Scientific.
5. Körner, C., Additive manufacturing of metallic components by selective electron
beam melting—a review. International Materials Reviews, 2016. 61(5): p. 361-377.
6. Vandenbroucke, B. and J.-P. Kruth, Direct digital manufacturing of complex dental
prostheses, in Bio-materials and prototyping applications in medicine. 2008,
Springer. p. 109-124.
7. Van Bael, S., et al. Design and production of bone scaffolds with selective laser
melting. in TMS 2009. 2009.
8. Bartsch, K., et al., Novel approach to optimized support structures in laser beam
melting by combining process simulation with topology optimization. Journal of
Laser Applications, 2019. 31(2): p. 022302.
9. Rattanawong, W., S.H. Masood, and P. Iovenitti, A volumetric approach to part-
build orientations in rapid prototyping. Journal of materials processing technology,
2001. 119(1-3): p. 348-353.
10. Pandey, P., N.V. Reddy, and S. Dhande, Part deposition orientation studies in
layered manufacturing. Journal of materials processing technology, 2007. 185(1-3):
p. 125-131.
11. Zhang, Y., et al., Feature based building orientation optimization for additive
manufacturing. Rapid Prototyping Journal, 2016.
12. Thrimurthulu, K., P.M. Pandey, and N.V. Reddy, Optimum part deposition
orientation in fused deposition modeling. International Journal of Machine Tools
and Manufacture, 2004. 44(6): p. 585-594.

References
102
13. Strano, G., et al., A new approach to the design and optimisation of support
structures in additive manufacturing. The International Journal of Advanced
Manufacturing Technology, 2013. 66(9-12): p. 1247-1254.
14. Hussein, A., et al., Advanced lattice support structures for metal additive
manufacturing. Journal of Materials Processing Technology, 2013. 213(7): p. 1019-
1026.
15. Vaidya, R. and S. Anand, Optimum Support Structure Generation for Additive
Manufacturing Using Unit Cell Structures and Support Removal Constraint.
Procedia Manufacturing, 2016. 5: p. 1043-1059.
16. Velo3d SupportFree system. Available from: https://www.velo3d.com/velo3d-
supportfree-process/.
17. Gao, W., et al., The status, challenges, and future of additive manufacturing in
engineering. Computer-Aided Design, 2015. 69: p. 65-89.
18. Lipson, H. and M. Kurman, Fabricated: The new world of 3D printing. 2013: John
Wiley & Sons.
19. Khajavi, S.H., J. Partanen, and J. Holmström, Additive manufacturing in the spare
parts supply chain. Computers in industry, 2014. 65(1): p. 50-63.
20. Huang, S.H., et al., Additive manufacturing and its societal impact: a literature
review. The International Journal of Advanced Manufacturing Technology, 2013.
67(5-8): p. 1191-1203.
21. Kwok, T.-H., et al., Mass customization: reuse of digital slicing for additive
manufacturing. Journal of Computing and Information Science in Engineering,
2017. 17(2).
22. Schrot, J., T. Pietila, and A. Sahu, State of the art: 3D printing for creating
compliant patient-specific congenital heart defect models. Journal of
Cardiovascular Magnetic Resonance, 2014. 16(1): p. W19.
23. Kroll, E. and D. Artzi, Enhancing aerospace engineering students' learning with 3D
printing wind-tunnel models. Rapid Prototyping Journal, 2011. 17(5): p. 393-402.
24. Kruth, J.-P., et al. Part and material properties in selective laser melting of metals.
in Proceedings of the 16th international symposium on electromachining. 2010.
25. Osakada, K. and M. Shiomi, Flexible manufacturing of metallic products by
selective laser melting of powder. International Journal of Machine Tools and
Manufacture, 2006. 46(11): p. 1188-1193.

References
103
26. Murr, L., et al., Microstructure and mechanical behavior of Ti–6Al–4V produced by
rapid-layer manufacturing, for biomedical applications. Journal of the mechanical
behavior of biomedical materials, 2009. 2(1): p. 20-32.
27. Morgan, R., et al., High density net shape components by direct laser re-melting of
single-phase powders. Journal of Materials Science, 2002. 37(15): p. 3093-3100.
28. Abe, F., et al., Influence of forming conditions on the titanium model in rapid
prototyping with the selective laser melting process. Proceedings of the Institution
of Mechanical Engineers, Part C: Journal of Mechanical Engineering Science, 2003.
217(1): p. 119-126.
29. Over, C., et al. Selective laser melting: a new approach for the direct manufacturing
of metal parts and tools. in Proceedings of the International Conferences on LANE.
2001.
30. Lu, L., et al., In situ formation of TiC composite using selective laser melting.
Materials Research Bulletin, 2000. 35(9): p. 1555-1561.
31. Wang, D., et al., Design and fabrication of a precision template for spine surgery
using selective laser melting (SLM). Materials, 2016. 9(7): p. 608.
32. Song, C., et al., Personalized femoral component design and its direct
manufacturing by selective laser melting. Rapid Prototyping Journal, 2016. 22(2):
p. 330-337.
33. Liu, P., Optimal design of support structures in selective laser melting. 2018,
Nanjing University of Aeronautics and Astronautics.
34. Calignano, F., Design optimization of supports for overhanging structures in
aluminum and titanium alloys by selective laser melting. Materials & Design, 2014.
64: p. 203-213.
35. Kuo, Y.-H., et al., Support structure design in additive manufacturing based on
topology optimization. Structural and Multidisciplinary Optimization, 2018. 57(1):
p. 183-195.
36. Krol, T., M. Zaeh, and C. Seidel, Optimization of supports in metal-based additive
manufacturing by means of finite element models. Bourell DL, 2012.
37. Jiang, J., X. Xu, and J. Stringer, Support structures for additive manufacturing: a
review. Journal of Manufacturing and Materials Processing, 2018. 2(4): p. 64.
38. Jiang, J., et al. A benchmarking part for evaluating and comparing support
structures of additive manufacturing. in 3rd International Conference on Progress
in Additive Manufacturing (Pro-AM 2018). 2018.

References
104
39. Yan, C., et al., Evaluations of cellular lattice structures manufactured using
selective laser melting. International Journal of Machine Tools and Manufacture,
2012. 62: p. 32-38.
40. Zeng, K., Optimization of support structures for selective laser melting. 2015.
41. Gan, M.X. and C.H. Wong, Practical support structures for selective laser melting.
Journal of Materials Processing Technology, 2016. 238: p. 474-484.
42. Mirzendehdel, A.M. and K. Suresh, Support structure constrained topology
optimization for additive manufacturing. Computer-Aided Design, 2016. 81: p. 1-
13.
43. Cloots, M., et al., Approaches to minimize overhang angles of SLM parts. Rapid
Prototyping Journal, 2017. 23(2): p. 362-369.
44. Wang, D., et al., Research on the fabricating quality optimization of the
overhanging surface in SLM process. The International Journal of Advanced
Manufacturing Technology, 2013. 65(9-12): p. 1471-1484.
45. Järvinen, J.-P., et al., Characterization of effect of support structures in laser
additive manufacturing of stainless steel. Physics Procedia, 2014. 56: p. 72-81.
46. Poyraz, Ö., et al. Investigation of support structures for direct metal laser sintering
(DMLS) of IN625 parts. in Proceedings of the solid freeform fabrication symposium,
Austin, Texas, USA. 2015.
47. Liu, Y., Y. Yang, and D. Wang, A study on the residual stress during selective laser
melting (SLM) of metallic powder. The International Journal of Advanced
Manufacturing Technology, 2016. 87(1-4): p. 647-656.
48. Hussein, A., et al., Preliminary investigation on cellular support structures using
SLM process. Innovative Developments in Virtual and Physical Prototyping. Taylor
& Francis Group, London, 2011: p. 609-612.
49. Mortazavi, A. and V. Toğan, Simultaneous size, shape, and topology optimization
of truss structures using integrated particle swarm optimizer. Structural and
Multidisciplinary Optimization, 2016. 54(4): p. 715-736.
50. Liu, K. and A. Tovar, An efficient 3D topology optimization code written in Matlab.
Structural and Multidisciplinary Optimization, 2014. 50(6): p. 1175-1196.
51. Deaton, J.D. and R.V. Grandhi, A survey of structural and multidisciplinary
continuum topology optimization: post 2000. Structural and Multidisciplinary
Optimization, 2014. 49(1): p. 1-38.
52. Rozvany, G.I., A critical review of established methods of structural topology
optimization. Structural and multidisciplinary optimization, 2009. 37(3): p. 217-237.

References
105
53. Bendsøe, M.P., Optimal shape design as a material distribution problem. Structural
optimization, 1989. 1(4): p. 193-202.
54. Rozvany, G.I., M. Zhou, and T. Birker, Generalized shape optimization without
homogenization. Structural optimization, 1992. 4(3-4): p. 250-252.
55. Rietz, A., Sufficiency of a finite exponent in SIMP (power law) methods. Structural
and Multidisciplinary Optimization, 2001. 21(2): p. 159-163.
56. Eschenauer, H.A. and N. Olhoff, Topology optimization of continuum structures: a
review. Applied Mechanics Reviews, 2001. 54(4): p. 331-390.
57. Olason, A. and D. Tidman, Methodology for topology and shpe optimization in the
design process. 2010.
58. Buchbinder, D., et al., Investigation on reducing distortion by preheating during
manufacture of aluminum components using selective laser melting. Journal of
Laser Applications, 2014. 26(1): p. 012004.
59. Tounsi, R. and F. Vignat. New concept of support structures in Electron Beam
Melting manufacturing to reduce geomtricdefects. in 15e Colloque National AIP-
Priméca. 2017.
60. Cooper, K., et al., Contact-free support structures for part overhangs in powder-
bed metal additive manufacturing. Inventions, 2018. 3(1): p. 2.
61. Cheng, B. and K. Chou. Deformation evaluation of part overhang configurations in
electron beam additive manufacturing. in ASME 2015 International Manufacturing
Science and Engineering Conference. 2015. American Society of Mechanical
Engineers Digital Collection.
62. Li, B., et al., Generating optimal heat conduction paths based on bionic growth
simulation. International Communications in Heat and Mass Transfer, 2017. 83: p.
55-63.
63. Vanek, J., J.A.G. Galicia, and B. Benes. Clever support: Efficient support structure
generation for digital fabrication. in Computer graphics forum. 2014. Wiley Online
Library.
64. Liu, Y., et al., Generating support structures for additive manufacturing with
continuum topology optimization methods. Rapid Prototyping Journal, 2019.
65. Mezzadri, F., V. Bouriakov, and X. Qian, Topology optimization of self-supporting
support structures for additive manufacturing. Additive Manufacturing, 2018. 21:
p. 666-682.

References
106
66. Tran, H.-C. and Y.-L. Lo, Heat transfer simulations of selective laser melting
process based on volumetric heat source with powder size consideration. Journal of
Materials Processing Technology, 2018. 255: p. 411-425.
67. Fu, C. and Y. Guo, Three-dimensional temperature gradient mechanism in selective
laser melting of Ti-6Al-4V. Journal of Manufacturing Science and Engineering,
2014. 136(6).
68. Thijs, L., et al., A study of the microstructural evolution during selective laser
melting of Ti–6Al–4V. Acta materialia, 2010. 58(9): p. 3303-3312.
69. Bartsch, K., et al. A Novel Approach to Support Structures Optimized for Heat
Dissipation in SLM by Combining Process Simulation with Topology Optimization.
in Proceedings of the NAFEMS World Congress. 2019.
70. Netfabb simulation capabilities. Available from:
https://www.autodesk.com/products/netfabb/features/simulation.
71. Mercelis, P. and J.P. Kruth, Residual stresses in selective laser sintering and
selective laser melting. Rapid prototyping journal, 2006.
72. Kruth, J.P., et al., Binding mechanisms in selective laser sintering and selective laser
melting. Rapid prototyping journal, 2005.
73. Allaire, G., M. Bihr, and B. Bogosel, Support optimization in additive
manufacturing for geometric and thermo-mechanical constraints. Structural and
Multidisciplinary Optimization, 2020.
74. Shiomi, M., et al., Residual stress within metallic model made by selective laser
melting process. CIRP Annals, 2004. 53(1): p. 195-198.
75. Chin, S.Y., et al., Powder-Based 3D Printing for the Fabrication of Device with
Micro and Mesoscale Features. Micromachines, 2020. 11(7): p. 658.
76. Mertens, R., et al., Optimization of scan strategies in selective laser melting of
aluminum parts with downfacing areas. Journal of Manufacturing Science and
Engineering, 2014. 136(6).
77. Kranz, J., D. Herzog, and C. Emmelmann, Design guidelines for laser additive
manufacturing of lightweight structures in TiAl6V4. Journal of Laser Applications,
2015. 27(S1): p. S14001.
78. Zhou, M., Y. Liu, and Z. Lin, Topology optimization of thermal conductive support
structures for laser additive manufacturing. Computer Methods in Applied
Mechanics and Engineering, 2019. 353: p. 24-43.