Embed Size (px)
Citation preview

Online Publication Date: 12 December, 2011
Publisher: Asian Economic and Social Society
Topographic Information System As A Tool For Environmental
Management
E.O. Oriola (Department of Geography & Environmental Management,
University of Ilorin, Ilorin. Nigeria.)
Asonibare S.O (Department of Surveying and Geoinfomatics Kwara State
Polytechnic Ilorin, Nigeria.)
Citation: E.O. Oriola, Asonibare S.O (2011): “ Topographic Information System As A Tool For
Environmental Management ” Journal of Asian Scientific Research , Vol.1, No.8,pp.441-450.

Journal of Asian Scientific Research, Vol.1 (8), pp.441-450
441
Introduction
Land surveying is the first point of reference in all
meaningful land development projects. Provision of
infrastructures; planning of towns and cities;
management of hazardous natural events and human
actions such as erosion, flooding, earthquakes, and
subsidence; coastal management; exploration and
exploitation of minerals; sitting of industries; resources
exploitation on the land and on the sea all are dependent
on Land Surveying products.
Topography of an area describes the surface
characteristics of relief features of such area as depicted
by hills, valleys and plains. It can be used to study and
represent, as a surface, any characteristic that has a
continuously changing value other than elevation. For
instance, population, geo-magnetic data and geo-
chemical data. Topographical Surveying involves the
acquisition of topographic data of the features on the
earth‟s surface, both man-made and natural in three-
dimensions. This employs the techniques of plane
surveying and other special techniques to establish both
horizontal and vertical controls.
The implications of the above is that no meaningful
development can be embarked upon by an individual,
government and any other agencies without information
about the topography of the land in the area where such
development is to take place. Topographic Information
System can be derived from the topographical data with
the employment of the analytical capabilities of
Geographic Information System (GIS).
According to Burrough (1986), GIS is a tool for
collecting, storing, retrieving at will, transforming and
displaying spatial data from the real world for a
particular set of purposes. In short, GIS can be used to
add value to spatial data (Sharma et al 2006). This is by
allowing data to be organized and viewed effectively, by
integrating them with other data, by analysis and by the
creation of new data that can be operated on in turn to
create useful information that can help decision making.
The uniqueness of GIS is in its ability to integrate data
from a variety of sources. A GIS can thus be described as
a form of spatial decision support system. This objective
of this paper is to create topographic information system
for adequate management immediate physical
environment.
Topographic Information System
Digital technology was successfully introduced in the
field of mapping in the late 1960‟s as means of speeding
up map production. (Perera and Shanta, 2002). With the
change in technology in the last two decades and the
growth in the number of spatial information systems, the
concept of topographic database has been introduced in
several mapping-surveying organizations in the world, in
order to deliver more Geo-information to the user
community.
Topographic Information System As A Tool For Environmental
Management
Abstract
Author (s)
E.O. Oriola Department of Geography & Environmental Management, University
of Ilorin, Ilorin. Nigeria.
E-mail: [email protected]
Asonibare S.O. Department of Surveying and Geoinfomatics Kwara State Polytechnic
Ilorin, Nigeria.
E-mail: [email protected]
Key words: Topography, Attribute
data, Information, Decision, Planning.
This paper is a pilot study to examine Topographic Information System as a
tool for environmental management. A part of Kwara State Polytechnic, Ilorin,
Kwara State Nigeria was used for the pilot study. Locational and Attribute data
of features were collected for the study. The usefulness of the Topographic
Information generated was highlighted. Topographical map revealed the
existing locations and areas for future development; Aspect map shows sun
facing surfaces for agricultural sun drying process and information for building
construction in the study area. The ruggedness of the landscape was presented
for amount of solar radiation received in a given area. The information is also
available for query that will assist in the physical planning of the area under
study. The study concludes that Topographic Information System is essential
for physical planning and accurate decision making. The system allows easy
updating of information and quick retrieval of information for better planning
and environmental management.

Topographic Information System…..
442
Topographic Information System is very crucial in this
present age in other to be able to update maps and
retrieve necessary data at any given time with minimal
efforts. Topographic Information System can be
explained as the combination of human effort and
computer-based tools for the collection, storage, analysis,
manipulation and retrieval of various kinds of data
relating to geographic features (man-made and natural)
on the surface of the earth (Lexicon Universal
Encyclopedia , 1989).
In view of this, it is necessary to create Topographic
Information System for different locations because the
information generated from such system can be used for
various purposes in physical planning and decision-
making in such locations. Some of the usefulness and
advantages of this digital database for such system over
the conventional maps include:-
a) Possibility of fast amendment and dynamic updating
of data
b) Fast capturing of data with Total Stations or GPS
c) Analysis of many important spatial problems
d) Versatility in integrating data collected from various
sources
e) Flexibility output possibilities
f) Provides bases for additional information with
relative ease for production of maps.
The Study Area
This study was carried out at the permanent site of the
Kwara state Polytechnic, Ilorin. Ilorin is located within
longitude 0829‟ 21”E latitude 0430‟ 50”N and 0829‟
43”E latitude 0431‟ 01”N. It is the capital of Kwara
State. It has been experiencing rapid urbanization since
1967 when it became the capital of Kwara State (see fig
1). The extent of its built-up area in 1967 was about
8.37km² but it has today increased by about sixty percent
in the year 2000. In general, the city grows mainly along
the major arteries of river Oyun and its numerous
tributaries drain the city (Oyegun, 1983). The largest of
the tributaries is Asa River which actively divided the
city into almost two halves.
The Polytechnic is at kilometer 10 along the old Ilorin-
Jebba Road. The polytechnic entrance is between
Elekoyangan and Oke-ose village along the road. The
Institution was carved out of the present Moro Local
Government area of the state. The State Polytechnic is
having boundary with Ilorin East Local Government and
Moro Local Government areas (see fig 2).
Materials And Methods
For the purpose of this pilot study, the following data
were collected from both primary and secondary sources:
previous analogue map covering the area, previous
control points at the vicinity of the project area and
coordinates of points at the vicinity of the project. Others
are Coordinates of points and features on the field.
Vector approach of data acquisition was used that is, x,
y, coordinates of the objects of interest were acquired
using Total Station in a computerized electronic
instrument which has a combination of EDM and
Theodolite was used for measuring distances, angle,
fixing of details and determination of coordinates of
points.
It is a basic rule in surveying that for a new area,
reference must be made to old existing controls by way
of connecting the new survey from the existing one. The
Surveying rule of working from whole to part was
employed. This is the basis for carrying out the perimeter
traverse first before the detailing and spot heightening.
Heights of instrument and target were measured and
stored in the memory of the instrument after the
perimeter traversing which started from the control point
KWPT 02 and closed back to the point KWPT 04. All
the detailing and spot heightening were done by
orienting with the coordinated boundary marks/Stations.
Results and Discussion
The major characteristic that differentiates GIS from
other information systems is the spatial analytical
capability; especially overlay operation, buffering,
spatial search, topographic operation, and neighborhood
and connectivity operations. GIS uses this spatial
analytical capability to answer fundamental generic
question of location, condition, trend, routing, pattern
and modeling by the manipulation and analysis of input
data. The major analyses performed in this project were
overlay operations, topographic operations and spatial
search.
Overlay Operation
In this study the contour map was overlaid on detailed
map of the study area to produce the topographic map of
the area, which shows the relationship that exists
between the various spatial entities in the study area.
This result can be used to determine area that need
access road to be built or other facilities.
The contour map of the study area is shown in fig 4. This
map assists in planning and control of erosion in the
study area, while the detailed map of the area under
investigation can be used to ascertain area that are
available for future developments.

Journal of Asian Scientific Research, Vol.1 (8), pp.441-450
443
Fig 1 Map of Nigeria showing Kwara State
Fig 2. Location of Kwara State Polytechnic.

Topographic Information System…..
444
Fig 3 Topographic Map of the Study Area
Topographic Operations This operation was performed from digital elevations
model generated using Arc View GIS 3.2a version. The
earth is 3-dimensional, most GIS applications include
some element of 3- dimensional analysis of which
topographic operations and analysis of surface terrain
becomes paramount. Slope, Aspect and other DTM
generations are considered as the most common uses in
application of terrain model use in GIS. The analyses
were performed using Arc View GIS 3.2a version and
the products generated are as follows:-
1. Hill shade map of the project site is presented in fig 5.
This can be used to determine the best part of a farmland
to be reserved for drying of crops after harvesting, in
fact, hill shade is used to portray relief difference and
terrain morphology in hilly and mountainous area.
Furthermore, Aspect map of the area is very essential for
the determination of intensity of sun that can be received.
This information can be used for sitting of houses where
they will get enough sunlight. Aspect maps can also be
used to determine where different crops will perform
best, the values for aspect are in degrees, 0º of true north,
90 º for east, 180 º for south and 270 º for west (fig 6).
KWPT
100
KWPT 101
KWPT 102
KWPT 103
KWPT
104
KWPT
105
KWPT 106
KWPT
107
KWPT
108
KWPT 109
277° 26'
253.70m
020°
57'
79.9
7m
293° 01'
(134.08m)
022°
57'
(97.7
8m
)
292° 57'
78.79m
018°
57'
120.9
3m
102° 23'111.16m
150.81m
101° 25'198.32m
199°
5
7'
318.3
2m
PLAN SHEWING THE TOPOGRAPHICAL MAP OF THE STUDY AREAOF
PART OF KWARA STATE POLYTECHNIC, ILORIN (PERMANENT SITE)
ALONG OLD ILORIN - JEBBA ROAD, MORO LOCAL GOVERNMENT AREA, KWARA STATE.ORIGIN:- WGS 84 (UTM)
AREA:- 12.25 HECTARES
SCALE:- 1: 2,500 U N
EX
IST
ING
RO
AD
RO
AD
EX
IST
ING
EXISTING
ROAD
50M 0 50 100 150 200 250 Metres
484700 484800 484900 485000 485100 485200 485300 485400
484700 484800 484900 485000 485100 485200 485300 485400
946780
946880
946980
947080
947180
947200
946780
946880
946980
947080
947180
947200
U/C
CONTOUR INTERVAL:- 0.5m
= Generator House
LEGEND
Coordinates Of KWPT 100
94 6793.230mN ; 48 5223.577mE
Figure: 3
= Buildings
= Roads
= Under ConstructionU/C
102° 33'
FIG. 4.1
= Boundary line
=Contour

Journal of Asian Scientific Research, Vol.1 (8), pp.441-450
445
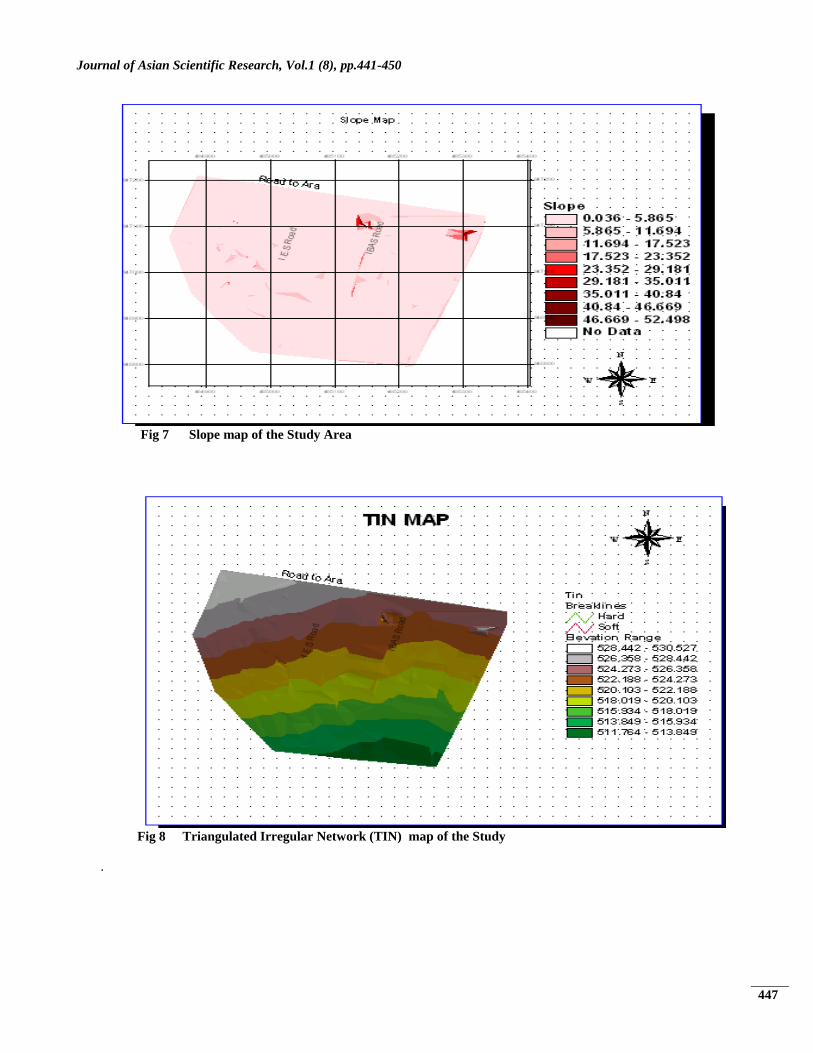
2. Slope map of the project site presented in
fig 8 is an important map for soil erosion analysis of
a given area and Triangulated irregular network
(TIN) map of the project site as shown in fig 8 is
basically used to connect points of equal heights.
Different colours in the map depict the different
ranges in the study area. It is a tessellation model
which allows recording topographic data as points
in a regular or irregular grid. When a three
dimensional view is necessary the grid can be
converted to the crystalline shape. In addition, the
point data can be used for performing the surface as
a series of contour lines with all interpolation
procedures needed for surface analysis.
KWPT 100
KWPT 101
KWPT 102
KWPT 103
KWPT 104
KWPT 105
KWPT 106
KWPT
107
KWPT 108
KWPT 109
277° 26'
253.70m
020°
57'
79.9
7m
293° 01'
(134.08m)
022°
57'
(97.7
8m
)
292° 57'
78.79m
018°
57'
120.9
3m
102° 23'111.16m
150.81m
101° 25'198.32m
199°
5
7'
318.3
2m
DETAIL MAP OF THE STUDY AREA OVERLAID WITH ROADSOF
PART OF KWARA STATE POLYTECHNIC, ILORIN (PERMANENT SITE)
ALONG OLD ILORIN - JEBBA ROAD, MORO LOCAL GOVERNMENT AREA, KWARA STATE.ORIGIN:- WGS 84 (UTM)
AREA:- 12.25 HECTARES
SCALE:- 1: 2,500U N
EX
IST
ING
RO
AD
RO
AD
EX
IST
ING
EXISTING
ROAD
50M 0 50 100 150 200 250 Metres
484700 484800 484900 485000 485100 485200 485300 485400
484700 484800 484900 485000 485100 485200 485300 485400
946780
946880
946980
947080
947180
947200
946780
946880
946980
947080
947180
947200
U/C= Generator House
LEGEND
Coordinates Of KWPT 100
94 6793.230mN ; 48 5223.577mE
= Building
= Roads
= Under ConstructionU/C
102° 33'
= Boundary line
FIG. 4.3
Fig 4 Detail Map of the Study Area
Query and presentation of analysis
The most fundamental of all tools provided by a GIS are
those involved with database query and its ability to
perform complex spatial analysis and modeling
operations in support of environmental management
planning and mapping. Queries may be Simple or
Multiple.
Simple criteria analysis
“Show all buildings that are used for Laboratory”.
Query command and syntax: {[B_Use] =
“Laboratory”}.Here the only condition requested in the
query is the USE of the buildings which are for
LABORATORY. This is shown in figure 9 and figure 10
with its attribute data

Topographic Information System…..
446
Figure 5 Hill shade of the Study Area
Figure 6 Aspect map of the Study Area
Journal of Asian Scientific Research, Vol.1 (8), pp.441-450
447
Fig 7 Slope map of the Study Area
Fig 8 Triangulated Irregular Network (TIN) map of the Study
.

Topographic Information System…..
448
Syntax ((Building Use) = “Laboratory)
Query on Single Criterion
Fig 9 Map of Laboratories in the Study Area
Syntax {(Building type) = “Storey}
Query on Single Criterion
Fig 10 Map of Storey building in the Study Area

Journal of Asian Scientific Research, Vol.1 (8), pp.441-450
449
{(Building Use) = Lect Room} and {(Building type) = Bungalow}
Fig 11 Map of Lecture Room that are bungalow
Multi criteria analysis
Multi criteria analysis refers to a situation where more
than one condition is used to query a database, for
example, “show all building that are bungalows and used
for Staff Offices”.
Query command and syntax: {[B_Type] = “Bungalow”}
and {[B_Use] = “Staff Offices‟} here the conditions
requested in the query are, the TYPE and USE of the
building which are BUNGALOW and LECTURE
ROOM (Fig. 11).
Query on Multiple Criteria. Queries can be designed to select all objects, point
objects, line objects, and polygon objects. The result of
the queries is then analyzed. Planners can be guided by
the results of the queries in deciding how many
structures are needed in the area. Likewise Estate
Surveyor can use the analysis or queries to determine the
exact available property for rent without taking the client
to the site. More importantly, the construction engineers
can used maps generated to determine the best route for
road connection.
Application of products
The various products generate in this study can be very
useful for planning purposes and decision making. The
topographical map of the Polytechnic shows all the
features as they exist on the ground and other available
areas for future development. Some of the products that
were generated include Slope, Aspect and hill shade.
These are maps that are very essential for taken good
decision on environmental issues.
a. Aspect map shows the direction the surface
faces. It is very useful in building construction and
agricultural management. Aspect map is useful for
drainage network. Its usefulness is pronounced in the
laying of pipes where direction of flow is prominent.
b. Hill shade map is like aspect map it shows how
rugged the landform is. It is used in hilly area to
determine the amount of sunlight that will be received in
a given area. It can be used to determine the best part of
a farmland to reserve for drying of crops after harvesting,
in fact, hill shade is used to portray relief difference and
terrain morphology in hilly and mountainous area.
c. The colour tones in a hill shade raster represent
the amount of reflected light in each location, depending

Topographic Information System…..
450
on its orientation relative to the illumination source. This
illumination source is usually chosen at an angle of 45
above the horizon in the north-west direction.
d. Useful in the visibility studies, that is,
determining what is visible on a surface from a set of one
or more location.
Other products generated from the query can be used for
physical planning, decision making, and solution of some
spatial problems of the Polytechnic. These products are
all very essential for environmental management and
easy analysis of our physical environment.
Conclusion
This study has been able to showcase topographic
information system as a necessary tool for managing
environmental issues and abate some environmental
related problems. With this system, it is now possible to
amend and update data in the system, quickly analyse
many important spatial problems in the area, produce
output that is flexible and supply data for producing
interactive maps of the area.
References
Burrough, P. A. (1986) „Principles of Geographical
Information System for Land Resources Assessment.‟
Oxford University Press, New York, Pp194
Lexicon University Encyclopedia (1989) Lexicon
publication inc. New York N.Y (1989).
Oyegun R. O. (1983) Water Resources in Kwara State.
Matanmi and sons publishing Co. Ltd. Ilorin. P7
Perera, S. and Shanta, K. O. (2002). “A Topographic
Database for Geoinformation Process in the Survey
Department of Sir Lanka”.Pp 1-6
Sharma, H.S. (2006) Modeling through Geographical
Formation system and Global System in Sharma, H.I,
Ram, D.R Rara Prasad and Binda P.R (eds)
Mathematical Modeling in Geographic Information
System Global Positioning System and Digital
Cartography. Concept Publication, New Delhi, India. P 2