Embed Size (px)
Citation preview

Topic IIC:
Empirical Analysis: How Well Do the Parity Relations Hold?
International Fixed IncomeInternational Fixed Income

OUTLINE
• Review of Evidence on PPP
• Alternative Exchange Rate Approaches
• Forecasting– Forward Premium Puzzle

I. Recall the Evidence on PPP
• Deviations from purchasing power parity can be substantial in the short run.
• Real exchange rates can take several years to return to equilibrium.
• Real exchange rates are autoregressive autoregressive (that is, they depend on previous levels).

The empirical Record of RPPP in the long run
-4%
-2%
2%
4%
-2% 2% 4% 5%
M ean annual percentage changein the spot exchange rate
S.Africa
Spain
Italy
U.K.
Hong Kong SwedenCanada
France
Denm ark
Norway
Netherlands
Japan
Austria
M alaysia
Belgium
Germ anySingapore
Switzerland
Difference inannual inflation rates

Evidence on RPPP Deviations

RXRs Over the (Very) Long Run: 1900-1990

Implementation Issues
A few problems/questions arise
• The choice of a price index– choices include CPI, PPI, GDP
• The choice of a base year/reference level– chose an “equilibrium” period
...but (I) how do we know?, and (II) what does disequ’m mean?
– some fundamental structural changes might have occurred
• Relative prices might have changed – hence PPP is not expected to hold

PPP: an Exchange Rate Determination Theory
• Causality is
Goods market ==> Currency Market
The adjustment mechanism:
real$ is weak and domestic prices are low
=> export will rise & import will fall
=> a trade surplus will generate a real and nominal $ appreciation
• We completely ignore
– the role of financial transactions
– the forward-looking nature of exchange rates
– the stickiness of prices
Recall the Evidence on the Fisher Relation
-5%
0%
5%
10%
-5% 0% 5% 10% 15%
Difference in 3-monthEurocurrency interest rates (i£i$)
Difference in realized quarterly inflation (£$)

II. Alternative Approaches to Modeling XR Determination
• Main challenge is to relate– Macro variables:
• consumption, savings, taxes, investments, export, import, gvt’ deficit
==> supply and demand of FX
THE FUNDAMENTALSFUNDAMENTALS APPROACH TO XRs DETERMINATION– Financial variables:
• interest rates, asset flows, volatility, risk premiums, stockmarket behavior• central bank policy and intervention
THE ASSETASSET APPROACH TO XRs DETERMINATION• ...and to provide theory(ies) which explain and reconcile
– short, medium and long term behavior of XRs and RXRs– puzzles

The Balance of Payments Approach
• Current Account: (sales and purchases of goods and services)– CA= X - M
X - export of goods and services
M - import of goods and services• As the RXR rises (real appreciation) X__, M__ => CA__• In Equ’m: Y = C + I + G + CA
GNP= consumption+investment+gvt’spend
Open economy: add CA surplus(deficit)• RXR <==> CA(RXR) = Y - C - I - G
...in order to (improve CA) <=> (reduce RXR)
we need to increase Y and/or reduce C and/or reduce I and/or reduce G
• Causality is the big leap of faith

The Asset Approach
• The traditional approach:
XRs adjust to eliminate trade imbalances
==> Countries with CA surplus will experience an appreciating currency
• Empirical evidence is counterfactual to this theory
consider especially the US during 1980-85 (deficit + appreciation)
• The asset approach treats XRs as a financial asset
– attribute a FORWARD LOOKING role to XRs, consistent w/ other financial theories
– explain large moves relative to fundamental
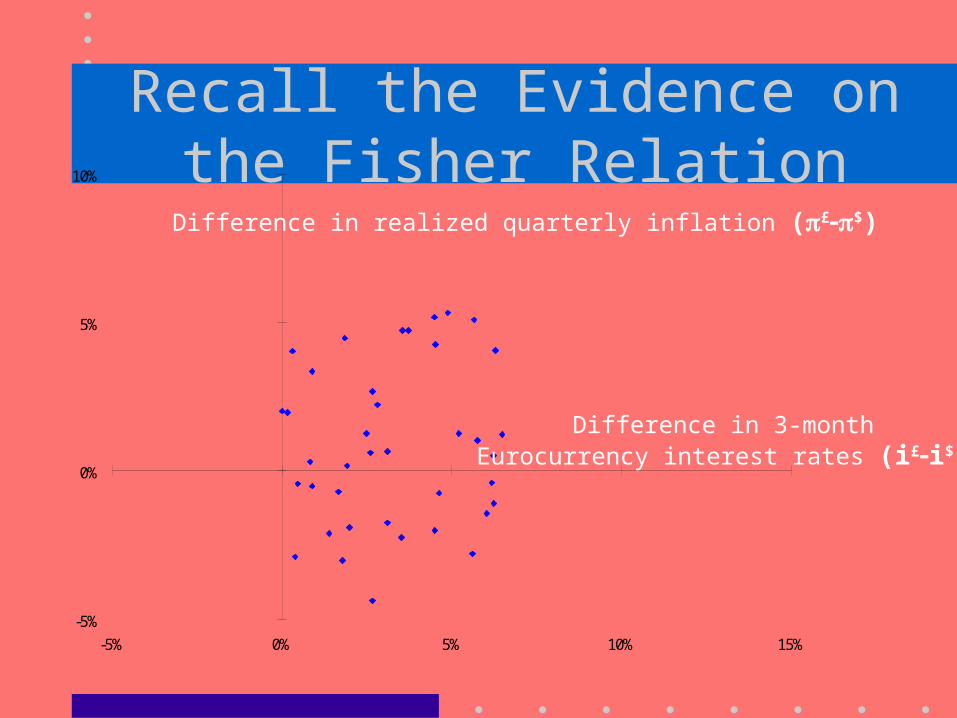
III. FORECASTING
• What do we (think we) know ?
– Higher interest rates ==> strengthening currency
– Inflation rises ==> currency weakens
…but for given real rates, high inflation <=> high interest rates
– Trade deficit ==> weaker currency
… but recall the experience in the US in the early 80’s and recent opposite experience in FE countries

Merrill’s March98 3mon Forecasts
• 3 out of 5 forecasts in the “right direction”• Mean change is 3.364% • Mean absolute error of forecast 4.102%• HOW DO THESE FORECASTS COMPARE TO MARKET-WIDE AVAILABLE FORECASTS ?(e.g., CURRENT XRs and FORWARD rates)
Currency March 98 June 98 Change (%) June forecast Error(%p.a.)DEM 1.815 1.770 -2.452 1.850 4.514JPY 125.530 139.330 10.993 130.000 -6.696GBP 0.607 0.611 0.543 0.629 2.985FFR 6.083 5.936 -2.423 6.200 4.447CHF 1.467 1.473 0.409 1.500 1.868
STATS - MAE= 3.364 - 4.102
Source: March 5th, 1998 “Currency and Bond Market Trends” biweekly review

Exchange Rate Forecasting
Market-Based Exchange Rate Forecasts
E[Std/f] = S0
d/f - The random walk hypothesis
E[Std/f] = Ft
d/f - The expectations hypothesis
E[Std/f] = S0
d/f [(1+pd)/(1+pf)]t - RPPP
Model-Based Exchange Rate Forecasts
• Technical analysis - uses the past history of exchange rates to predict future exchange rates
• Fundamental analysis - uses macroeconomic data to predict future exchange rate changes

March98 3mon Forward Forecasts
• 3 out of 5 forecasts in the “right direction”• Mean change is 3.364% •Mean absolute error of forecast 3.337%
Currency March 98 June 98 Interest Forward Error(%p.a.)DEM 1.815 1.770 3.490 1.805 1.973JPY 125.530 139.330 0.460 123.930 -11.053GBP 0.607 0.611 7.430 0.610 -0.099FFR 6.083 5.936 3.920 6.058 2.051CHF 1.467 1.473 1.150 1.450 -1.507
STATS - Ius,3m= 5.630 MAE= 3.337

Forward vs. Merrill
• 3 out of 5 forecasts in the “right direction” in both• Forward forecast outperforms
Currency March 98 June 98 Interest Forward Error(%p.a.)DEM 1.815 1.770 3.490 1.805 1.973JPY 125.530 139.330 0.460 123.930 -11.053GBP 0.607 0.611 7.430 0.610 -0.099FFR 6.083 5.936 3.920 6.058 2.051CHF 1.467 1.473 1.150 1.450 -1.507
STATS - Ius,3m= 5.630 MAE= 3.337
Currency March 98 June 98 Change (%) June forecast Error(%p.a.)DEM 1.815 1.770 -2.452 1.850 4.514JPY 125.530 139.330 10.993 130.000 -6.696GBP 0.607 0.611 0.543 0.629 2.985FFR 6.083 5.936 -2.423 6.200 4.447CHF 1.467 1.473 0.409 1.500 1.868
STATS - MAE= 3.364 - 4.102

Merrill vs. Random Walk
• Random Walk MAE is 3.170%• Outperforms both Forward and Merrill’s forecasts...
Currency March 98 June 98 Change (%) June forecast Error(%p.a.)DEM 1.815 1.770 -2.452 1.850 4.514JPY 125.530 139.330 10.993 130.000 -6.696GBP 0.607 0.611 0.543 0.629 2.985FFR 6.083 5.936 -2.423 6.200 4.447CHF 1.467 1.473 0.409 1.500 1.868
STATS - MAE= 3.364 - 4.102Currency March 98 June 98 Change (%) RW forecast Error(%p.a.)DEM 1.815 1.770 -2.452 1.815 2.514JPY 125.530 139.330 10.993 125.530 -9.905GBP 0.607 0.611 0.543 0.607 -0.540FFR 6.083 5.936 -2.423 6.083 2.483CHF 1.467 1.473 0.409 1.467 -0.407
STATS - MAE= 3.364 - 3.170

Forward premiumor discount
Actual change in the spot rate
-15%
-10%
-5%
0%
5%
10%
15%
-1% 0% 1%
1-month forward rates as spot rate predictors:Yen per dollar exchange rates 1970-1995

The Forward Premium Puzzle
• The Expectations hypothesisFFt+1t+1/ S/ Stt= E= Ett[S[St+1t+1] / S] / Stt
• Consider the regressionSSt+1t+1/ S/ Stt
= = + + (F (Ft+1t+1 / S / Stt) + err) + errtt
• Random walk ==> =___, =___, =___=___
• Exp’ Hypothesis==> =___, =___, =___=___

The Forward Premium PuzzleCurrency R2
GBP -.0062 *(.0027)
-1.840 *(0.847)
0.0213
CAD -.0036 *(.0009)
-1.575 *(0.460)
0.0341
FF -.0021(.0031)
-0.674(0.827)
0.0042
DM .0033(.0025)
-0.743(0.805)
0.0041
ITL -.0042(.0039)
-0.073(0.453)
0.0001
JPY .0080 *(.0024)
-1.711 *(0.643)
0.0230

The Forward Premium Puzzle:Long Horizon Evidence
Currency Mean forward Premia Mean Depreciaiton
GBP -3% -2%
CAD -1.7% -1.8%
FF -3% -0.5%
DM 1.7% 2.3%
ITL -6.5% -4.7%
JPY 2.5% 5.3%

Implications and Interpretations
• With a beta=-1.8, on average when i*>i by 1%, then the XR appreciates by 0.88% instead of depreciating by 1%
==> Sell a currency trading at a premium(UIP predicts it should appreciate, but empirically the reverse happens), and buy a currency at a discount