Embed Size (px)
Citation preview

Topic 5: Renewable Power
1Networking and Distributed Systems
Department of Electrical & Computer EngineeringTexas Tech University
Spring 2012

Carbon Footprint
Dr. Hamed Mohsenian-Rad Texas Tech UniversityCommunications and Control in Smart Grid
• Carbon Footprint is usually defined as:
• Usually the measure is presented in carbon dioxide equivalent.
A measure of the total amount of carbon dioxide(CO2) and methane (CH4) emissions of a definedpopulation, system, or activity, considering allrelevant sources, sinks, and storage within thespatial and temporal boundaries of thatpopulation, system, or activity of interest.
2

Carbon Footprint
Dr. Hamed Mohsenian-Rad Texas Tech UniversityCommunications and Control in Smart Grid 3
• We are interested in power plants with low carbon footprint:
• Both CO2 and CH4 are greenhouse gases.
• Potential for “Global Warming”
• They can also be toxic at high concentrations
• It is desired to reduce carbon footprint of different sectors.
Carbon Footprint
Dr. Hamed Mohsenian-Rad Texas Tech UniversityCommunications and Control in Smart Grid 4
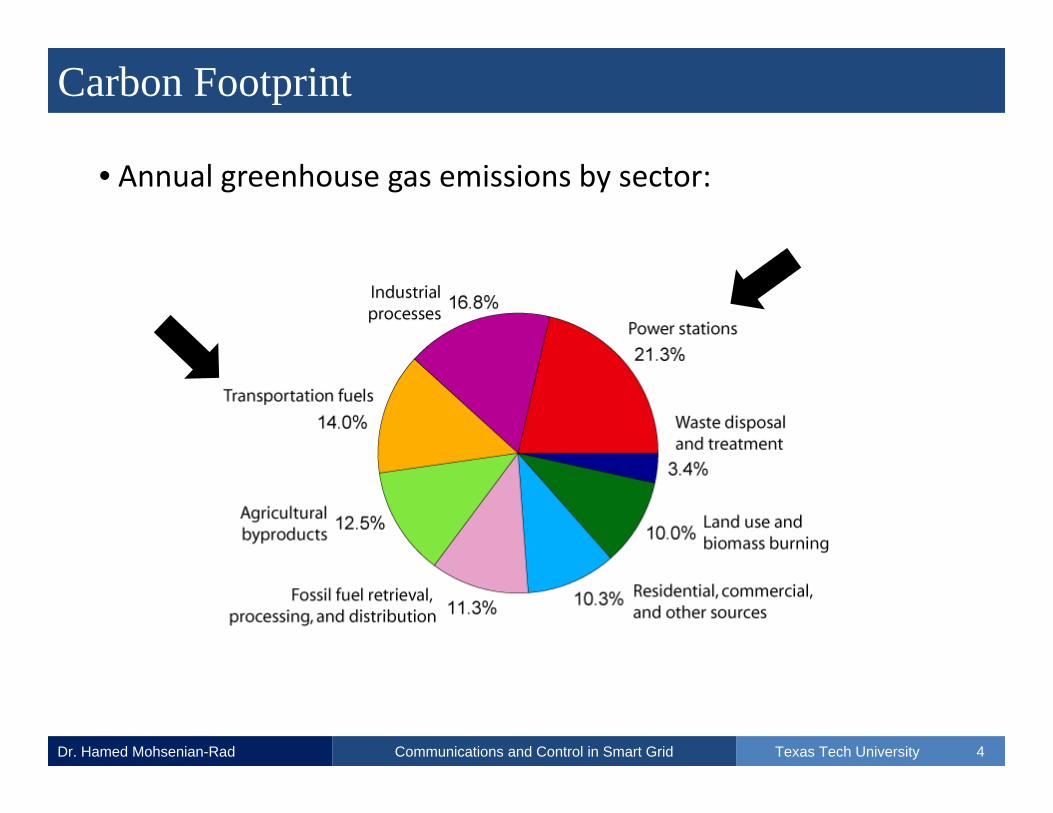
• Annual greenhouse gas emissions by sector:
Carbon Footprint
Dr. Hamed Mohsenian-Rad Texas Tech UniversityCommunications and Control in Smart Grid 5
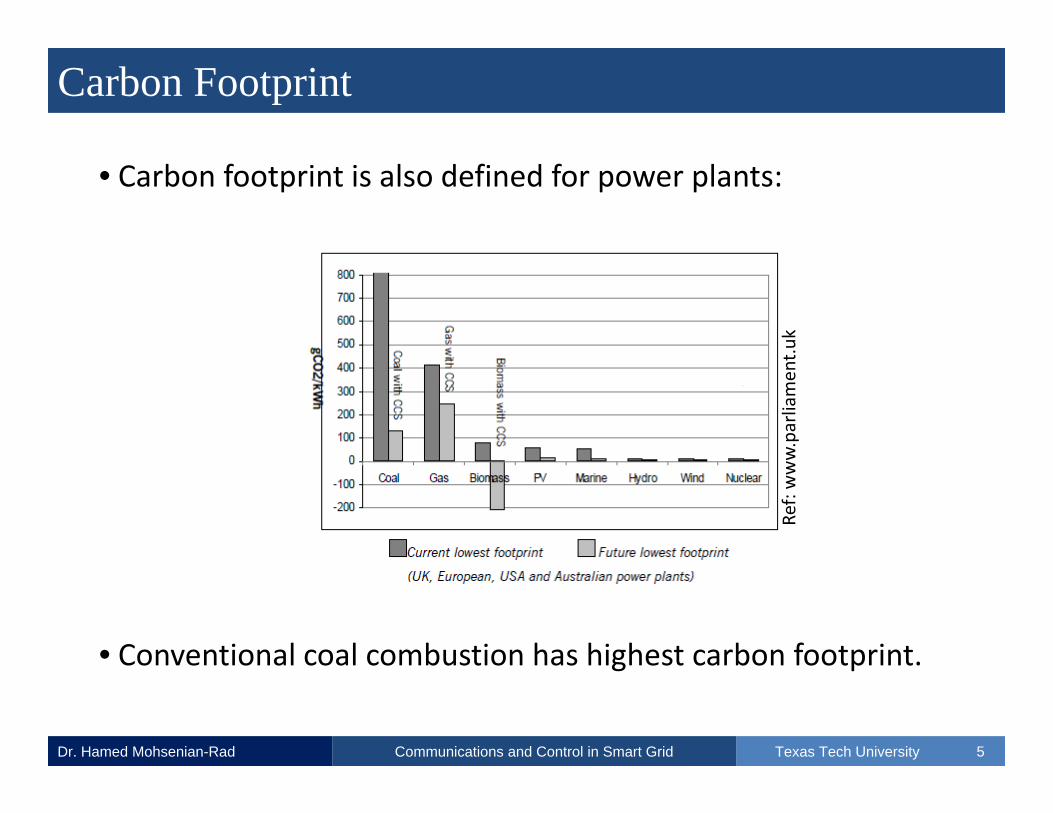
• Carbon footprint is also defined for power plants:
• Conventional coal combustion has highest carbon footprint.
Ref: www.parliament.u
k

Carbon Footprint
Dr. Hamed Mohsenian-Rad Texas Tech UniversityCommunications and Control in Smart Grid 6
• U.S. Electricity Generation by Source:
• The top sources are those with top carbon footprints.

Carbon Footprint
Dr. Hamed Mohsenian-Rad Texas Tech UniversityCommunications and Control in Smart Grid 7
• Percentage contributions of CO2 emissions in 2008:
Carbon Footprint
Dr. Hamed Mohsenian-Rad Texas Tech UniversityCommunications and Control in Smart Grid 8
• Nuclear energy has low carbon footprint.
• But it does have issues with respect to nuclear wastes.
• Desired choices (Renewable Sources):
• Marine: Wave and Tidal
• PV: Solar
• Wind
• Hydro

Carbon Tax
Dr. Hamed Mohsenian-Rad Texas Tech UniversityCommunications and Control in Smart Grid 9
• Tax applied based on carbon footprint.
• It is to encourage moving towards renewable generation.
• Example:
• Natural Gas: 181 g CO2 / kWh (0.66 cents / kWh)
• Coal: 215 g CO2 / kWh (1.21 cents / kWh)
• Boulder, CO applied the first carbon tax in the U.S. in 2006.

Wave Energy
Dr. Hamed Mohsenian-Rad Texas Tech UniversityCommunications and Control in Smart Grid 10
• Wave power is the energy from ocean surface waves.
• Orbital motion of particles decreases with increasing depth.
1 = Propagation direction.2 = Wave crest.3 = Wave trough.

Wave Energy Converter
Dr. Hamed Mohsenian-Rad Texas Tech UniversityCommunications and Control in Smart Grid 11
• Wave Snakes as wave energy converter
• They are floating on the ocean surface waves.

Wave Energy Converter
Dr. Hamed Mohsenian-Rad Texas Tech UniversityCommunications and Control in Smart Grid 12
• Generation capacity for each device is around 750 kW‐1MW.
• They come as wave farms with up to 10 MW capacity or so.

Wave Energy Converter
Dr. Hamed Mohsenian-Rad Texas Tech UniversityCommunications and Control in Smart Grid 13
• Each device has 3 power modules joined by tubular sections:
• A cable connects the device to the ocean floor to hold it.
cable
Power modules
Tubular section
Wave Energy Converter
Dr. Hamed Mohsenian-Rad Texas Tech UniversityCommunications and Control in Smart Grid 14
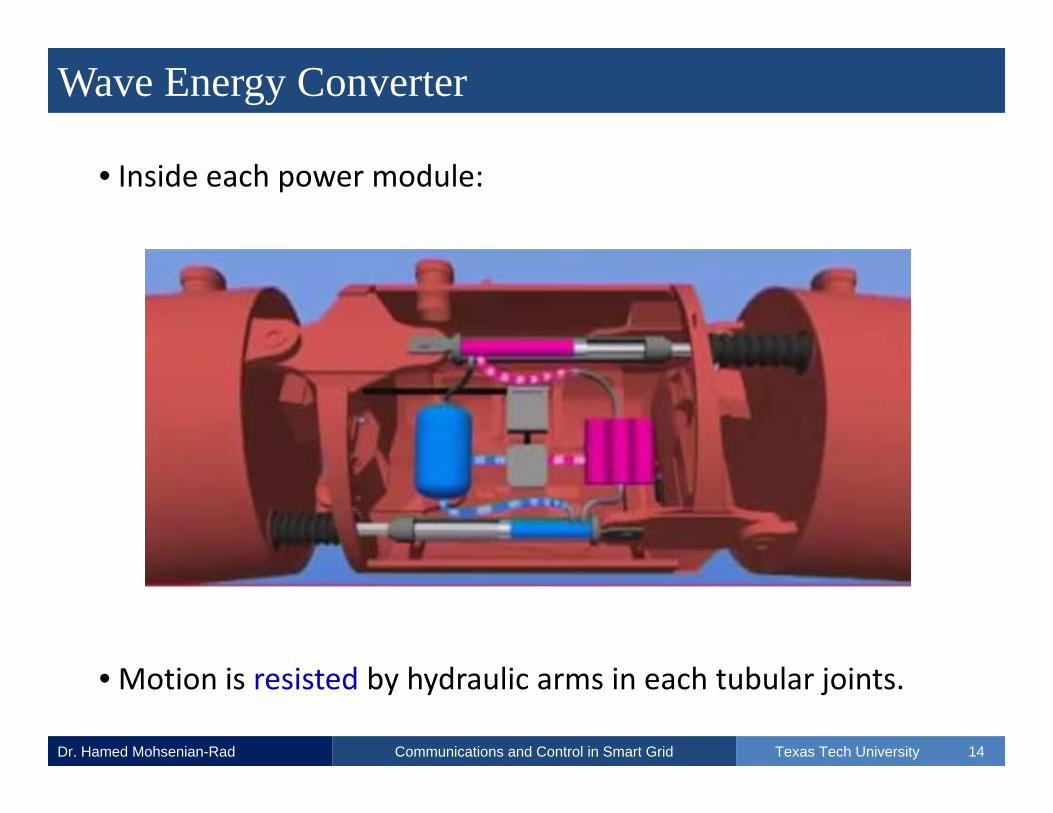
• Inside each power module:
• Motion is resisted by hydraulic arms in each tubular joints.

Tidal Energy
Dr. Hamed Mohsenian-Rad Texas Tech UniversityCommunications and Control in Smart Grid 15
• Tides are the rise and fall of sea levels:
• Caused by moon and sun’s gravitational forces.
• Most places in the ocean usually experience
• One or two high tides / low tides every day.
• The times and amplitude of the tides at the coast:
•Are influenced by the alignment of the sun and moon.

Tidal Energy
Dr. Hamed Mohsenian-Rad Texas Tech UniversityCommunications and Control in Smart Grid 16
• Example:
High Tide Low Tide

Tidal Energy
Dr. Hamed Mohsenian-Rad Texas Tech UniversityCommunications and Control in Smart Grid 17
• Tides are major sources of energy:
• Q: How can we use the tidal energy in this figure?

Tidal Barrage
Dr. Hamed Mohsenian-Rad Texas Tech UniversityCommunications and Control in Smart Grid 18
• Tides are major sources of energy:
• The operation is somehow similar to a dam! (Q: Why?)
Tidal Barrage
Dr. Hamed Mohsenian-Rad Texas Tech UniversityCommunications and Control in Smart Grid 19
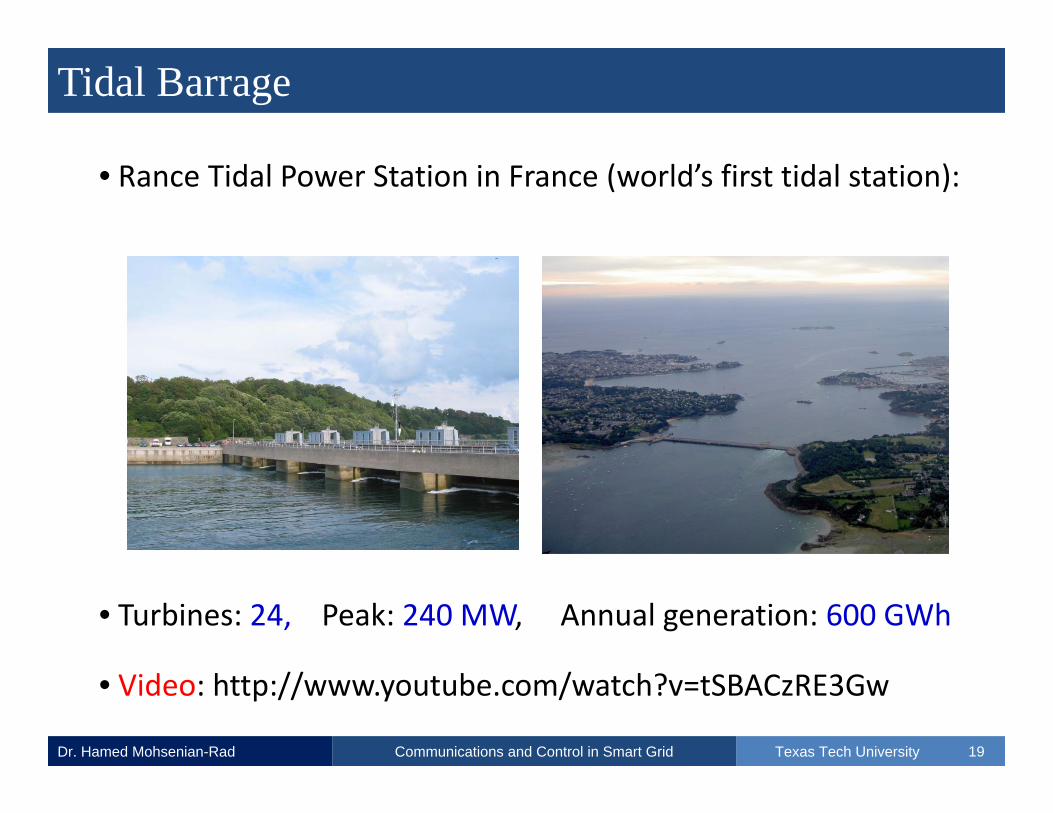
• Rance Tidal Power Station in France (world’s first tidal station):
• Turbines: 24, Peak: 240 MW, Annual generation: 600 GWh
• Video: http://www.youtube.com/watch?v=tSBACzRE3Gw

Hydro Dam Energy
Dr. Hamed Mohsenian-Rad Texas Tech UniversityCommunications and Control in Smart Grid 20
• Hydro dams are built on big rivers.
• In the U.S. the largest dams are on the Columbia River.
Hydro Dam Energy
Dr. Hamed Mohsenian-Rad Texas Tech UniversityCommunications and Control in Smart Grid 21
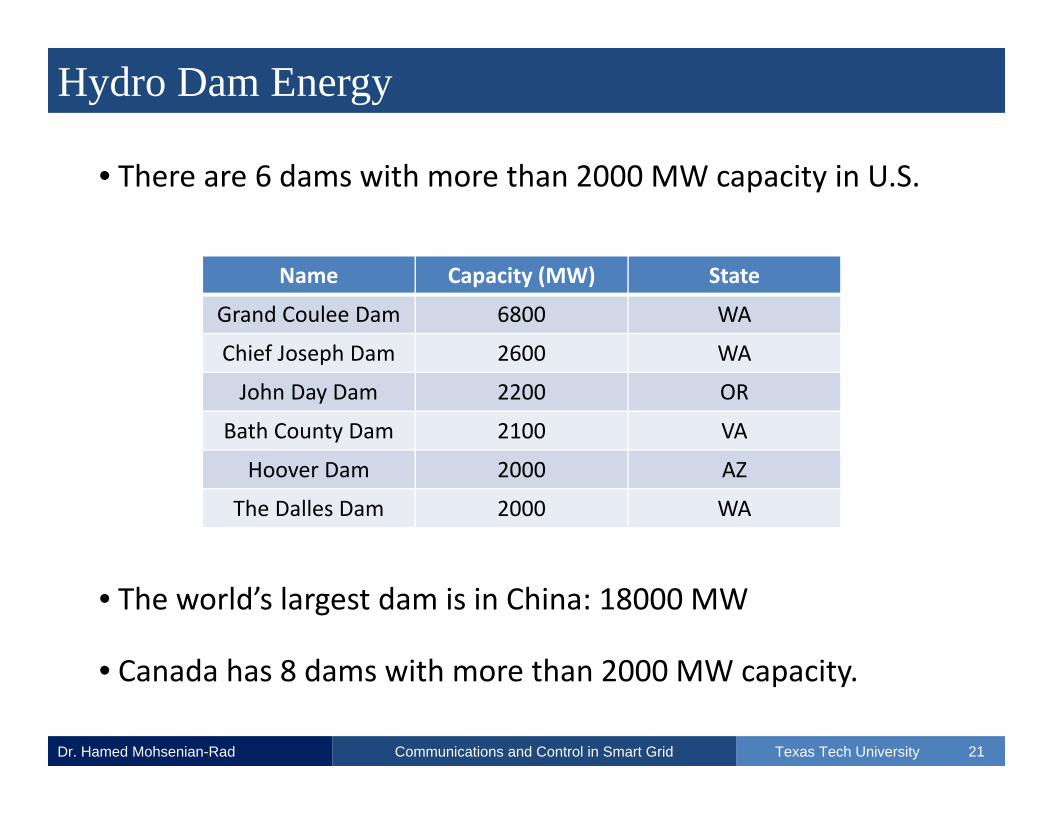
• There are 6 dams with more than 2000 MW capacity in U.S.
• The world’s largest dam is in China: 18000 MW
• Canada has 8 dams with more than 2000 MW capacity.
Name Capacity (MW) State
Grand Coulee Dam 6800 WA
Chief Joseph Dam 2600 WA
John Day Dam 2200 OR
Bath County Dam 2100 VA
Hoover Dam 2000 AZ
The Dalles Dam 2000 WA

Solar Energy
Dr. Hamed Mohsenian-Rad Texas Tech UniversityCommunications and Control in Smart Grid 22
• Solar panels are used to convert solar energy to DC power.
• 14 MW solar farm in Nevada.

Solar Energy Capacity in the U.S.
Dr. Hamed Mohsenian-Rad Texas Tech UniversityCommunications and Control in Smart Grid 23
Solar Energy
Dr. Hamed Mohsenian-Rad Texas Tech UniversityCommunications and Control in Smart Grid 24
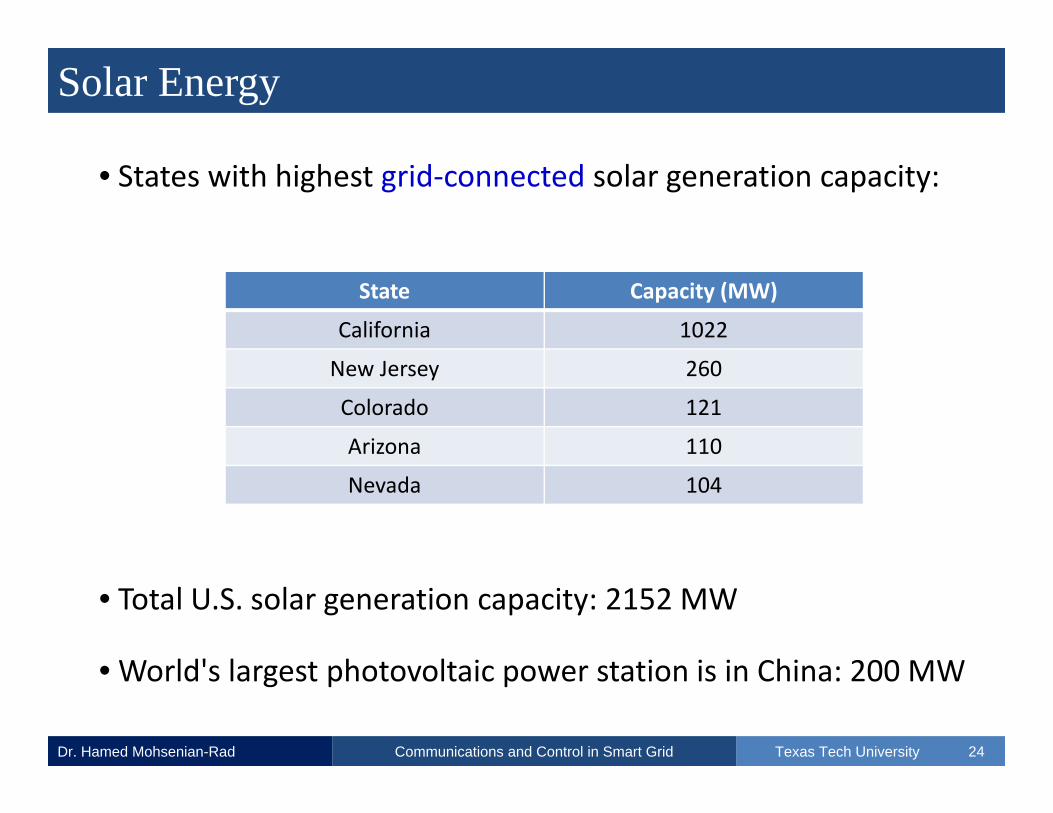
• States with highest grid‐connected solar generation capacity:
• Total U.S. solar generation capacity: 2152 MW
• World's largest photovoltaic power station is in China: 200 MW
State Capacity (MW)
California 1022
New Jersey 260
Colorado 121
Arizona 110
Nevada 104
Solar Energy
Dr. Hamed Mohsenian-Rad Texas Tech UniversityCommunications and Control in Smart Grid 25
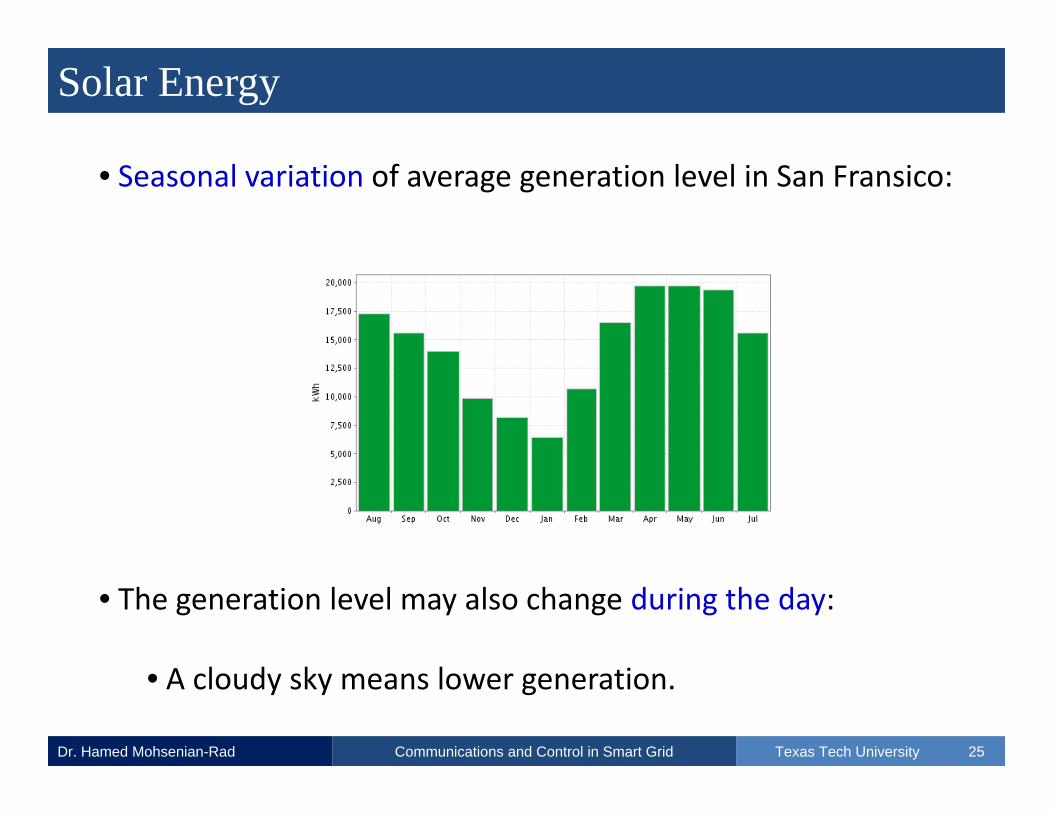
• Seasonal variation of average generation level in San Fransico:
• The generation level may also change during the day:
• A cloudy sky means lower generation.

Concentrated Solar Power
Dr. Hamed Mohsenian-Rad Texas Tech UniversityCommunications and Control in Smart Grid 26
• CSP systems use mirrors or lenses to concentrate:
• A large area of sunlight onto a small area
• In many cases, the mirrors follow the sun.
• The sun light could be concentrated on
• PV cells
• Pipes of hot liquid
Solar Thermal Energy
Dr. Hamed Mohsenian-Rad Texas Tech UniversityCommunications and Control in Smart Grid 27
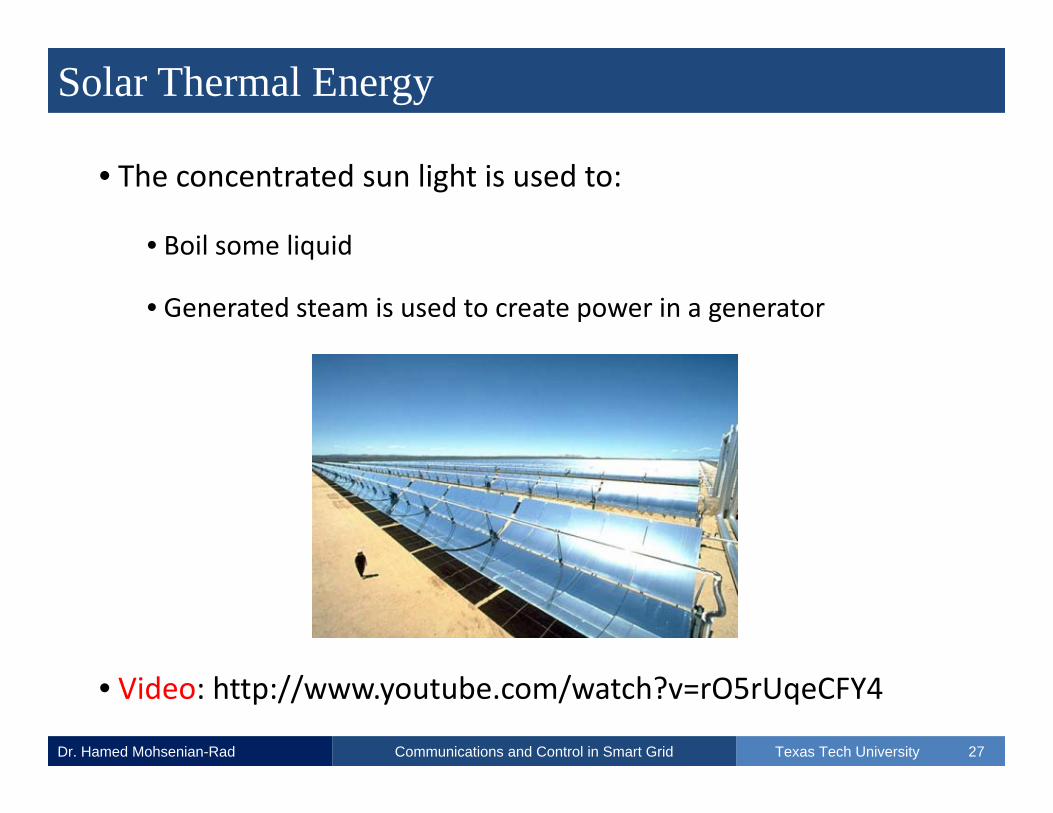
• The concentrated sun light is used to:
• Boil some liquid
• Generated steam is used to create power in a generator
• Video: http://www.youtube.com/watch?v=rO5rUqeCFY4

Wind Energy Potential in the U.S.
Dr. Hamed Mohsenian-Rad Texas Tech UniversityCommunications and Control in Smart Grid 28
• Wind power depends on the wind speed.

Wind Energy Potential in the U.S.
Dr. Hamed Mohsenian-Rad Texas Tech UniversityCommunications and Control in Smart Grid 29
• States with highest wind power generation potential:
• Total U.S. Wind Power Capacity in 2011: 43,461 MW
• U.S. DoE target: 20%Wind Power by 2030.
State Capacity (MW)
Texas 1022
Kansas 260
Montana 121
Nebraska 110
South Dakota 104

Wind Power vs. Wind Speed
Dr. Hamed Mohsenian-Rad Texas Tech UniversityCommunications and Control in Smart Grid 30
•A typical wind speed – wind power curve:
• A minimum cut‐in speed is needed to start generation.
• Video: http://www.youtube.com/watch?v=tsZITSeQFR0

Onshore vs. Offshore
Dr. Hamed Mohsenian-Rad Texas Tech UniversityCommunications and Control in Smart Grid 31
• Wind turbines can be installed:
• Onshore: on land
• Cheaper Installation
• Cheaper Integration
• Cheaper Maintenance
• Offshore: on sea
• Less Obstruction
• Higher and More Steady Wind Speed (Q: what is the advantage?)
An Offshore wind farm

Challenges with Renewable Energy
Dr. Hamed Mohsenian-Rad Texas Tech UniversityCommunications and Control in Smart Grid 32
• The key problem is the intermittency:
• Changes in wind speed will result in changes in wind power.
Wind Speed in Lubbock, TX

Challenges with Renewable Energy
Dr. Hamed Mohsenian-Rad Texas Tech UniversityCommunications and Control in Smart Grid 33
• The key problem is the intermittency:
• Actual power consumption (red) and solar power generation(green) on Aug. 30, 2011 for a home at the Mueller Smart GridDemonstration Project of Pecan Street Inc. in Austin, TX.
Challenges with Renewable Energy
Dr. Hamed Mohsenian-Rad Texas Tech UniversityCommunications and Control in Smart Grid 34
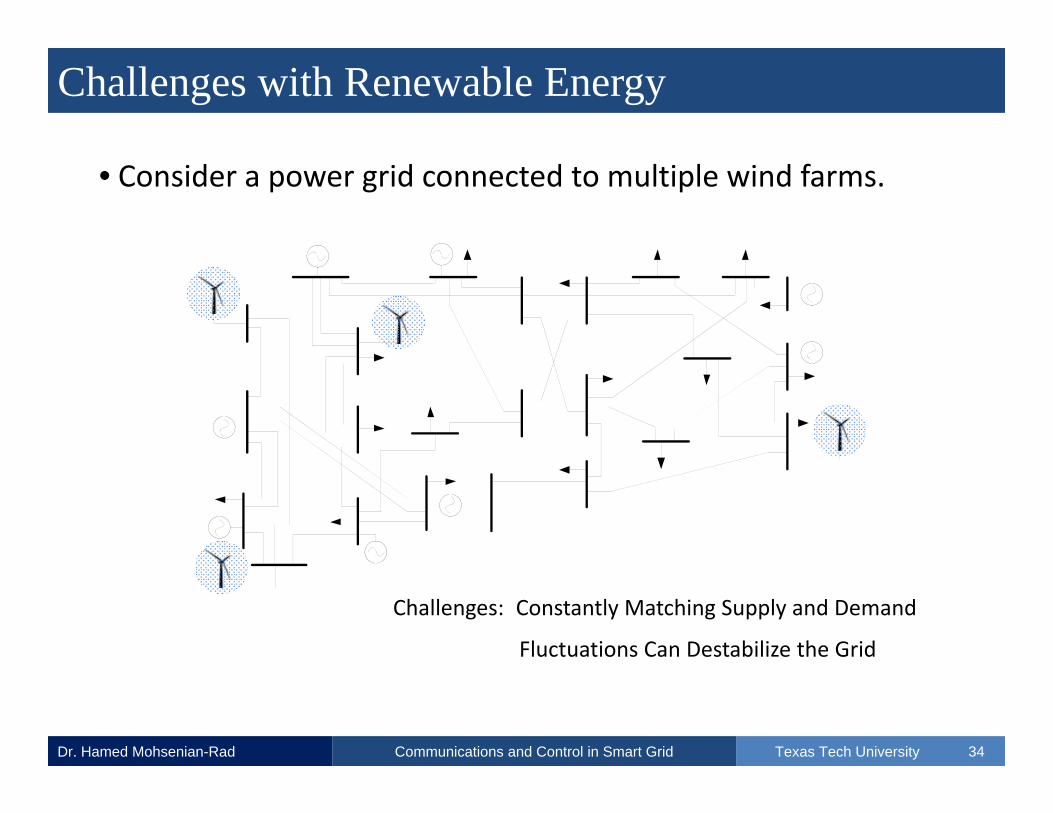
• Consider a power grid connected to multiple wind farms.
Challenges: Constantly Matching Supply and Demand
Fluctuations Can Destabilize the Grid
Renewable Power Integration
Dr. Hamed Mohsenian-Rad Texas Tech UniversityCommunications and Control in Smart Grid 35
• Some options to make integration easier:
• Limit Renewable Generation
• Curtailing
• Using Fast Responding Generators
• Using Storage Devices
• Demand Response
• Q: What else?

Limited Renewable Generation
Dr. Hamed Mohsenian-Rad Texas Tech UniversityCommunications and Control in Smart Grid 36
• Consider a typical daily load in Texas:
• Total load demand is always more than 25,000 MW.
• In general, we can assume a base load of at least 10,000 MW.

Limited Renewable Generation
Dr. Hamed Mohsenian-Rad Texas Tech UniversityCommunications and Control in Smart Grid 37
• If total renewable generation is much less than the base load:
• Renewable generation can never exceed the demand.
• We can define net load as
Net Load = Load – Renewable Generation ≥ 0
• Fluctuation in renewable generation:
• Will be treated just like fluctuations in load demand.

Curtailing
Dr. Hamed Mohsenian-Rad Texas Tech UniversityCommunications and Control in Smart Grid 38
• As we increase the installed capacity of renewable generation:
• It may happen that generation exceeds load demand
• The key problem:
• Peak generation may not match peak demand.
• An easy option is to curtail excessive generation
• Shut down some wind turbine, solar panels, etc…

Using Fast Responding Generators
Dr. Hamed Mohsenian-Rad Texas Tech UniversityCommunications and Control in Smart Grid 39
• Natural gas and coal units can quickly change generation level.
• They can compensate fluctuations in renewable power.
Renewable Generation Fast Responding Generation
?
Using Fast Responding Generators
Dr. Hamed Mohsenian-Rad Texas Tech UniversityCommunications and Control in Smart Grid 40
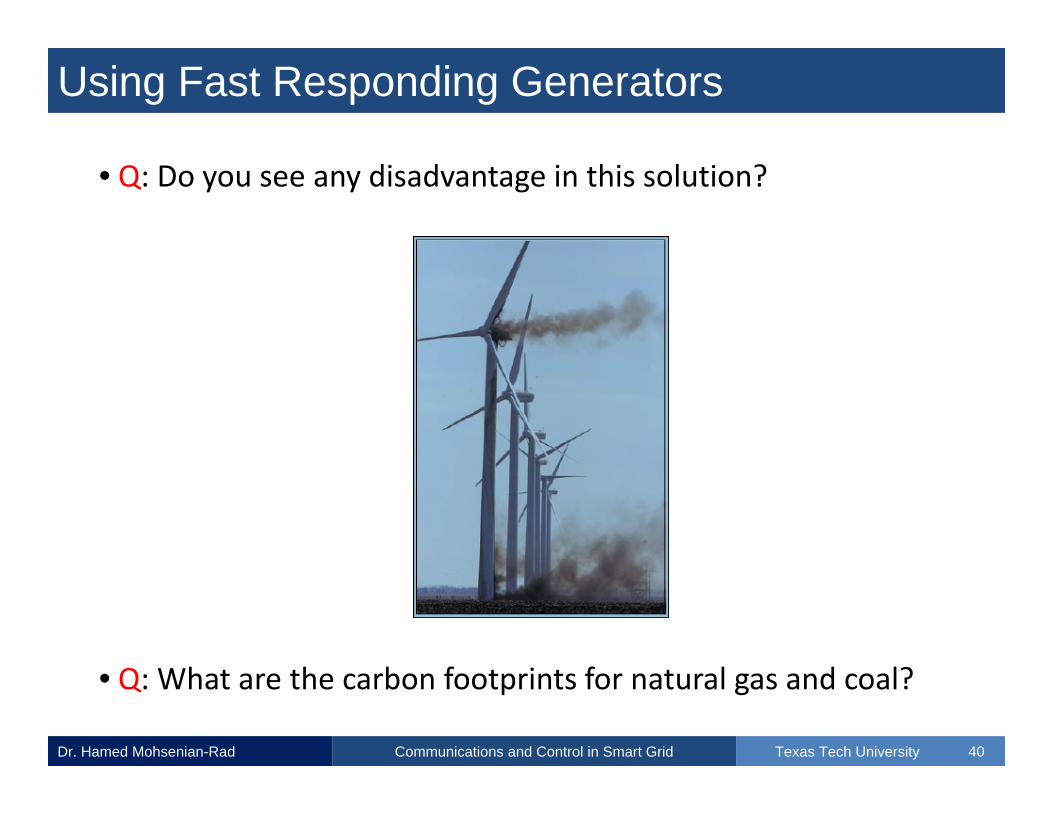
• Q: Do you see any disadvantage in this solution?
• Q: What are the carbon footprints for natural gas and coal?

Using Storage Devices
Dr. Hamed Mohsenian-Rad Texas Tech UniversityCommunications and Control in Smart Grid 41
• Charge at higher generation levels. Discharge otherwise.
Renewable Generation
Storage
Charge
Discharge
Net Output

Using Storage Devices
Dr. Hamed Mohsenian-Rad Texas Tech UniversityCommunications and Control in Smart Grid 42
• Some existing storage technologies:
• Batteries
• Flywheels
• Ultra Capacitors
• Hydrogen Fuel Cell
• Compressed Air
• Pumping Hydro
• Liquid Heating
Storage Technologies: Batteries
Dr. Hamed Mohsenian-Rad Texas Tech UniversityCommunications and Control in Smart Grid 43
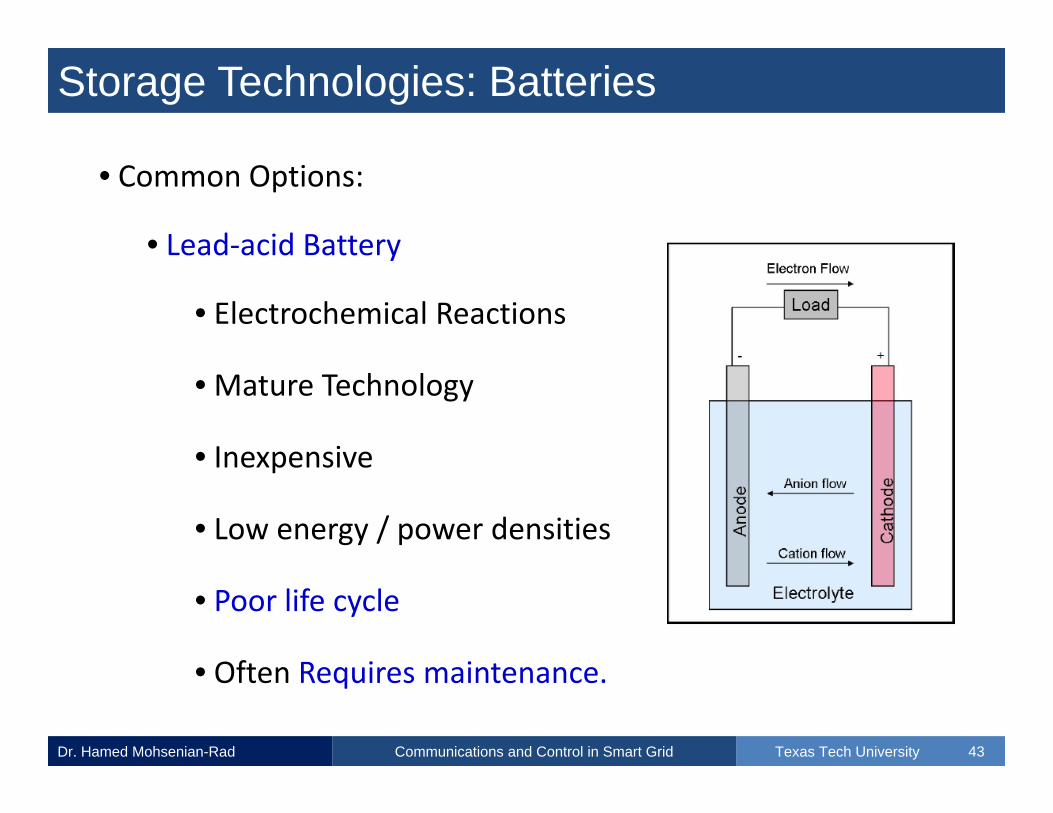
• Common Options:
• Lead‐acid Battery
• Electrochemical Reactions
• Mature Technology
• Inexpensive
• Low energy / power densities
• Poor life cycle
• Often Requires maintenance.

Storage Technologies: Batteries
Dr. Hamed Mohsenian-Rad Texas Tech UniversityCommunications and Control in Smart Grid 44
• Common Options:
• Lithium‐ion Battery
• Lithium‐ion Electrochemical Cells
A Lithium‐ion Battery of a Laptop Computer

Storage Technologies: Batteries
Dr. Hamed Mohsenian-Rad Texas Tech UniversityCommunications and Control in Smart Grid 45
• Industrial / Commercial Products (Order of Megawatts):
One MW pilot storage projects by PJM in Pennsylvania

Storage Technologies: Batteries
Dr. Hamed Mohsenian-Rad Texas Tech UniversityCommunications and Control in Smart Grid 46
• AES Battery Storage Projects in the U.S.:
• A two‐MW project in Huntington Beach, CA
• A one‐MW project in Houston, TX
• An eight‐MW project in New York that is scaling to 20 MW.
• A 32 MW Project in West Virginia to connect to PJM.
• Applications:
• Frequency Regulation / Renewable Energy Integration

Storage Technologies: Batteries
Dr. Hamed Mohsenian-Rad Texas Tech UniversityCommunications and Control in Smart Grid 47
• AES Battery Storage Projects in the U.S.:
• Video: http://vimeo.com/32170739 (Watch From Min 3:20)
These containers hold 1.3 million batteries: AES WV Project
Storage Technologies: Flywheels
Dr. Hamed Mohsenian-Rad Texas Tech UniversityCommunications and Control in Smart Grid 48
• Flywheels Energy Storage (FES) Operation:
• Accelerating a rotor (flywheel) to a very high speed
• Maintaining energy in the system as rotational energy
• Once we disconnect energy source:
• Rotor will continue rotating
• Acting as a source of energy
• Video: http://www.youtube.com/watch?v=mV_b5oMqc2M
Storage Technologies: Flywheels
Dr. Hamed Mohsenian-Rad Texas Tech UniversityCommunications and Control in Smart Grid 49
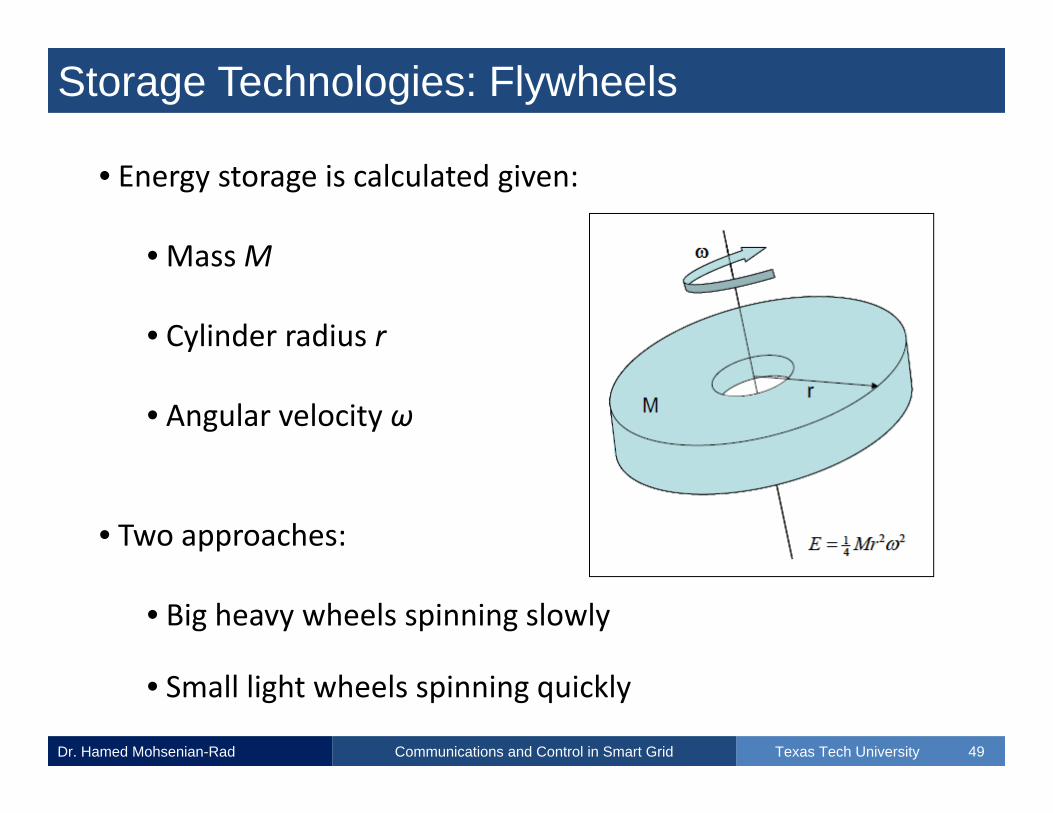
• Energy storage is calculated given:
• MassM
• Cylinder radius r
• Angular velocity ω
• Two approaches:
• Big heavy wheels spinning slowly
• Small light wheels spinning quickly

Storage Technologies: Flywheels
Dr. Hamed Mohsenian-Rad Texas Tech UniversityCommunications and Control in Smart Grid 50
• Commercial FES:
• Rotors are suspended by magnetic bearings
• Maintaining energy in the system as rotational energy
• Spinning at 20,000 ‐ 50,000 rpm in a vacuum enclosure
• Efficiency: Can be up to 90%.
• Capacity: hundreds of kwh per flywheel.

Storage Technologies: Flywheels
Dr. Hamed Mohsenian-Rad Texas Tech UniversityCommunications and Control in Smart Grid 51
• Commercial FES:
• Video: http://www.youtube.com/watch?v=ay_NiGu7mis
A Flywheel storage technology in New York by Beacon Power

Storage Technologies: Flywheels
Dr. Hamed Mohsenian-Rad Texas Tech UniversityCommunications and Control in Smart Grid 52
• Comparison Between Batteries and Flywheels:
Ref: S. M
cCluer
and J.‐F. Ch
ristin
Storage Technologies: Ultra Capacitors
Dr. Hamed Mohsenian-Rad Texas Tech UniversityCommunications and Control in Smart Grid 53
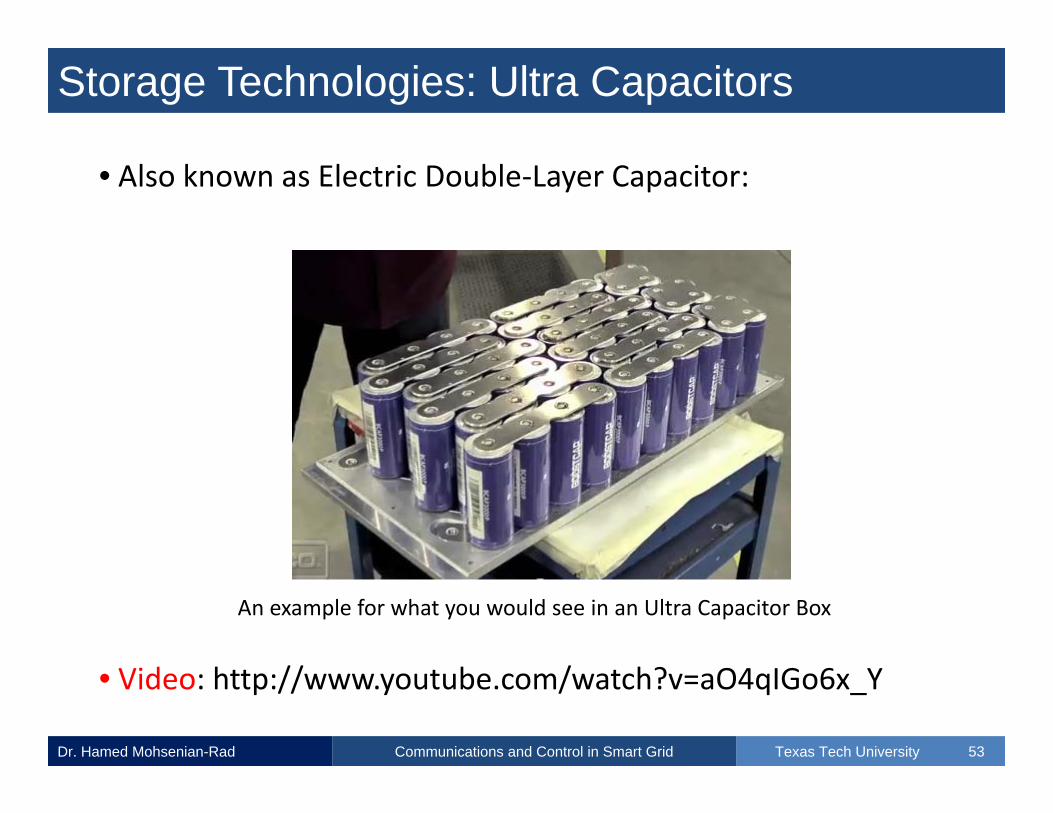
• Also known as Electric Double‐Layer Capacitor:
• Video: http://www.youtube.com/watch?v=aO4qIGo6x_Y
An example for what you would see in an Ultra Capacitor Box

Storage Technologies: Ultra Capacitors
Dr. Hamed Mohsenian-Rad Texas Tech UniversityCommunications and Control in Smart Grid 54
• Advantages:
• Very long life time
• Millions of Charge and Discharge Cycles
• Low cost per cycle.
• Very high rate of charge and discharge
• Very high cycle efficiency: 95% or more.
• Low internal resistance
Storage Technologies: Ultra Capacitors
Dr. Hamed Mohsenian-Rad Texas Tech UniversityCommunications and Control in Smart Grid 55
• Disadvantages:
• High weights
• The amount of energy stored per unit weight is low
• High Self‐discharge rate
• Short runtime (recall the comparison diagram)
• Low maximum voltage

Storage Technologies: Hydrogen Fuel
Dr. Hamed Mohsenian-Rad Texas Tech UniversityCommunications and Control in Smart Grid 56
• Hydrogen is not a primary energy source.
• Rather we should use some other type of energy
• To manufacture hydrogen
• Hydrogen is an eco‐friendly fuel
• Can be used as a transportation fuel
• Can be used to generate electricity
Storage Technologies: Hydrogen Fuel
Dr. Hamed Mohsenian-Rad Texas Tech UniversityCommunications and Control in Smart Grid 57
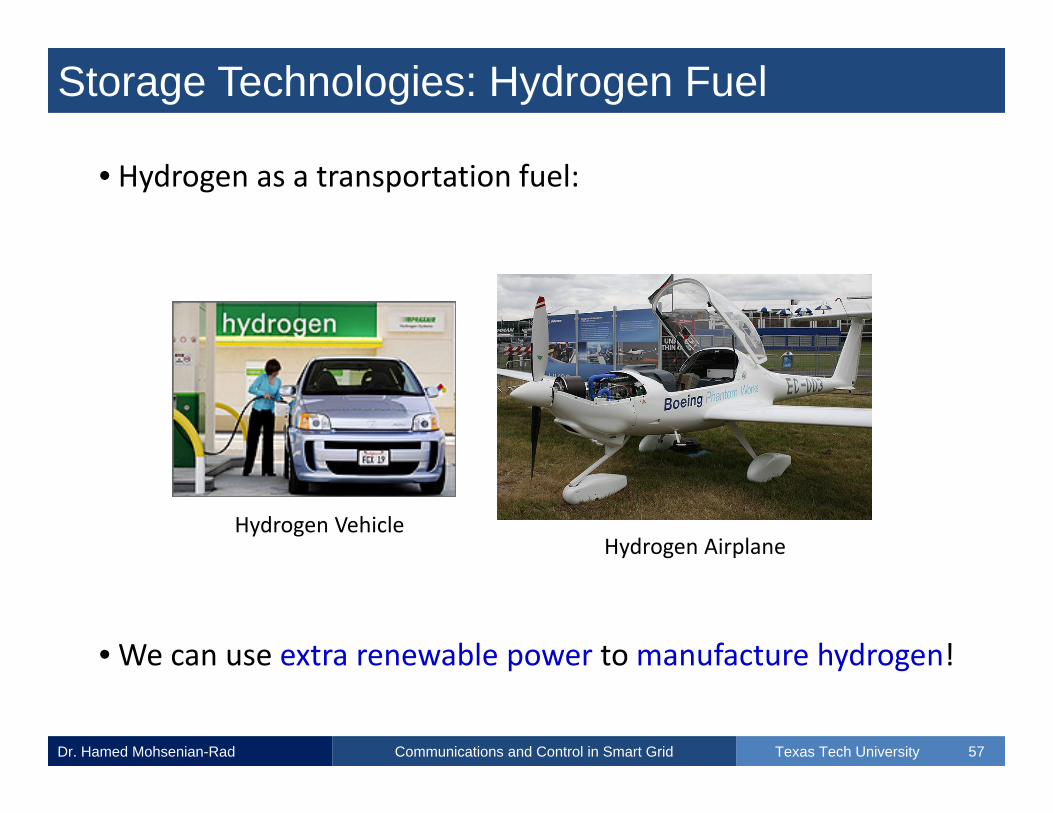
• Hydrogen as a transportation fuel:
• We can use extra renewable power to manufacture hydrogen!
Hydrogen VehicleHydrogen Airplane

Storage Technologies: Hydrogen Fuel
Dr. Hamed Mohsenian-Rad Texas Tech UniversityCommunications and Control in Smart Grid 58
• Hydrogen as electricity storage:
• Charge: Use excessive power to manufacture hydrogen
• Storage: Storage Hydrogen in tanks / underground caves
• Discharge: Use hydrogen to generate electricity
• Hydrogen is eco‐friendly fuel.
• Of course, the extra hydrogen can be used for transportation.
• Related Video: www.youtube.com/watch?v=meDgY98EuMw

Storage Technologies: Compressed Air
Dr. Hamed Mohsenian-Rad Texas Tech UniversityCommunications and Control in Smart Grid 59
• Compressed Air Energy Storage (CAES):
• Charge: Use excessive power to compress air
• Storage: Storage compressed air in underground caves
• Discharge: Use compressed air to generate electricity
• Through a compressed air engine / turibne
• Using expansion of compressed air
• Video: www.youtube.com/watch?v=dGd7PIC09AM (from 1:00)

Storage Technologies: Compressed Air
Dr. Hamed Mohsenian-Rad Texas Tech UniversityCommunications and Control in Smart Grid 60
• Compressed Air Energy Storage (CAES):
• Pros:
• Huge power capacity
• Cons:
• Special Locations
• Slow Responding
• Relatively Expensive

Storage Technologies: Pumping Hydro
Dr. Hamed Mohsenian-Rad Texas Tech UniversityCommunications and Control in Smart Grid 61
• Pumped Storage Hydroelectricity (PSH):
• A type of hydroelectric power generation (Q: other exmp?)
• Charge: Mump water to a reservoir in high altitude
• Storage: Store water in the reservoir until needed
• Discharge: Release water to a hydro turbine
• Charge at off‐peak hours and discharge at peak hours!

Storage Technologies: Pumping Hydro
Dr. Hamed Mohsenian-Rad Texas Tech UniversityCommunications and Control in Smart Grid 62
• Pumped Storage Hydroelectricity (PSH):
An example for the operation of PSH

Storage Technologies: Pumping Hydro
Dr. Hamed Mohsenian-Rad Texas Tech UniversityCommunications and Control in Smart Grid 63
• PSH requires building big reservoirs:
• Video: www.youtube.com/watch?v=mMvOZSVXlzI (up to 4:30)
A PSH reservoir in MichiganA PSH reservoir in Japan
Storage Technologies: Liquid Heating
Dr. Hamed Mohsenian-Rad Texas Tech UniversityCommunications and Control in Smart Grid 64
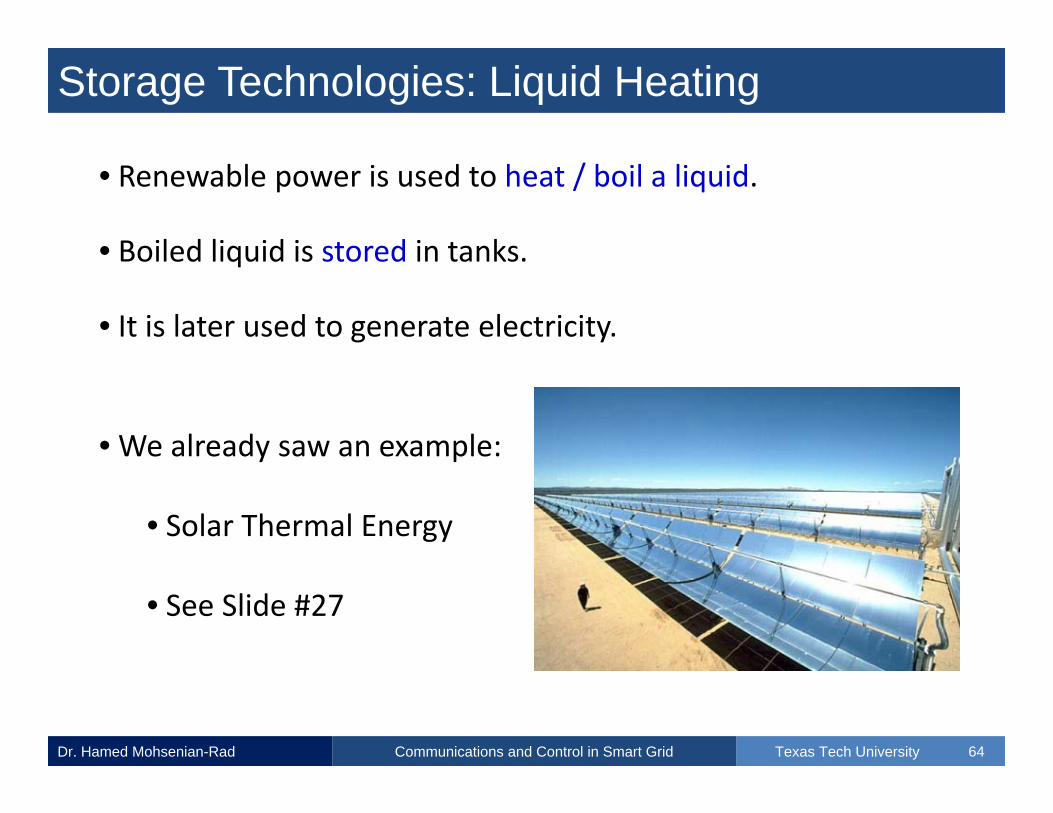
• Renewable power is used to heat / boil a liquid.
• Boiled liquid is stored in tanks.
• It is later used to generate electricity.
• We already saw an example:
• Solar Thermal Energy
• See Slide #27

Storage Technologies: Optimal Choices
Dr. Hamed Mohsenian-Rad Texas Tech UniversityCommunications and Control in Smart Grid 65
• Renewable Integration May Require Various Storage Options.
• They may not be a single best option
• Different Cost and Availability
• Different Capacity and Runtime
• Different Response Time
• Optimal resource management is needed to utilize them all!
Q: What is the difference?

Demand Response
Dr. Hamed Mohsenian-Rad Texas Tech UniversityCommunications and Control in Smart Grid 66
• Main Idea:
• Increase load when more renewable power is available.
• Decrease load when less renewable power is available.
• Pricing (e.g., Real‐time Pricing) can help:
• Lower (even negative) prices when generation increases.
• Higher prices when generation level drops.

Demand Response
Dr. Hamed Mohsenian-Rad Texas Tech UniversityCommunications and Control in Smart Grid 67
• Challenges:
• Demand Response is Usually Slow Responding
• Requires Notification to Users
• ECS Devices May Help to Some Extent
• Required Response Time: 10 Minutes or Less
• Otherwise, we may need excellent wind forecasting.
• Existing Project: Bonneville Power Admin (NW) and EnerNOC

Renewable Energy Prediction
Dr. Hamed Mohsenian-Rad Texas Tech UniversityCommunications and Control in Smart Grid 68
• So far, we saw multiple ways to integrate renewable power.
• However, efficient decision making still requires
• Accurate renewable (specially wind) power forecasting.
Wind Speed in Lubbock, TX Q: When should we charge or discharge a battery?
Renewable Energy Prediction
Dr. Hamed Mohsenian-Rad Texas Tech UniversityCommunications and Control in Smart Grid 69
• Our focus is on wind power forecasting.
• In particular, short‐term forecasting.
• But some techniques are general to any energy source.
• We may also differentiate:
• Forecasting the Power Output of a Single Wind Turbine
• Forecasting the Power Output of a Wind Farm

Single Wind Turbine
Dr. Hamed Mohsenian-Rad Texas Tech UniversityCommunications and Control in Smart Grid 70
• Assume that we know the wind speed vs. wind power curve.
• Predicting wind speed can help us predict wind power.
Single Wind Turbine
Dr. Hamed Mohsenian-Rad Texas Tech UniversityCommunications and Control in Smart Grid 71
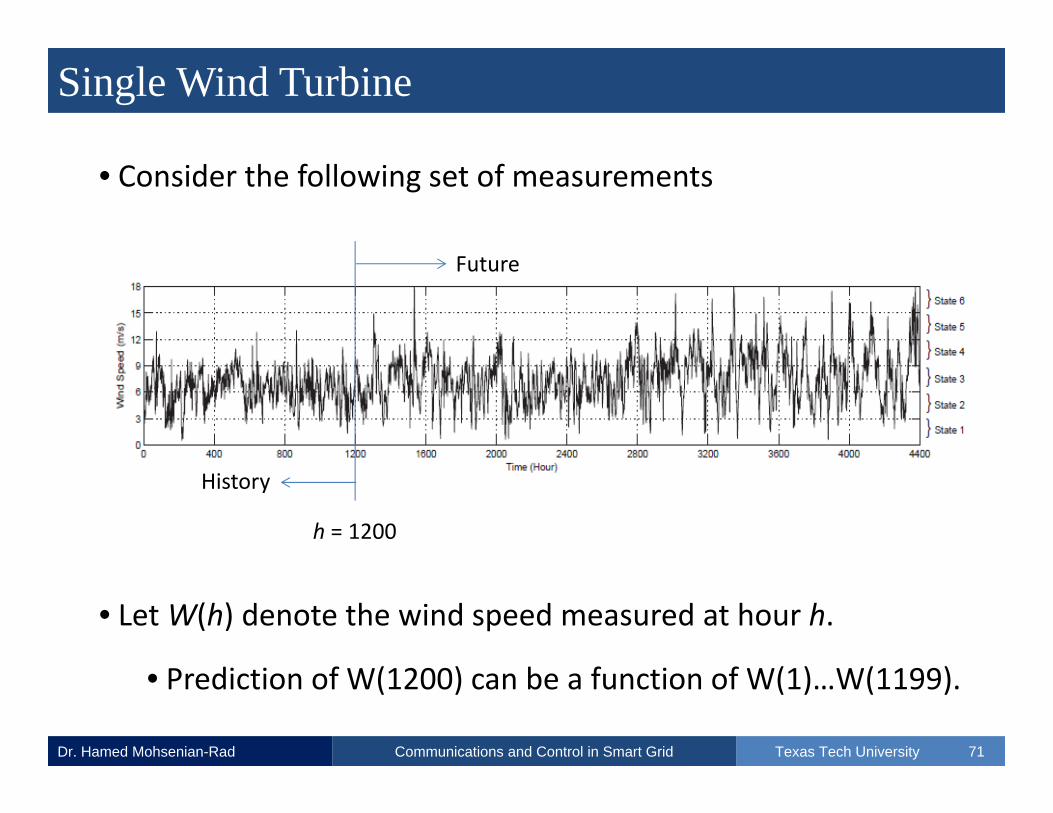
• Consider the following set of measurements
• LetW(h) denote the wind speed measured at hour h.
• Prediction of W(1200) can be a function of W(1)…W(1199).
h = 1200
History
Future

Single Wind Turbine
Dr. Hamed Mohsenian-Rad Texas Tech UniversityCommunications and Control in Smart Grid 72
• Assuming a linear prediction model, we can write:
• Sampling resolution can be anything: 5 min, 10 min, …, 1 hour.
• Furthermore, we may not use the entire history:
1
1
12321
)(
)1()2()3()2()1()(h
ii
hh
ihWa
WaWahWahWahWahW
1,)()(1
hNihWahWN
ii

Single Wind Turbine
Dr. Hamed Mohsenian-Rad Texas Tech UniversityCommunications and Control in Smart Grid 73
• Q: How can we obtain the right choice of
• Parameters a1, a2, …, aN?
• This can be done:
• Offline: Using a training sequence
• Online: A new model is derived / updated every time slot.
• Q: What is the difference between online and offline cases?

Single Wind Turbine: Online Model Prediction
Dr. Hamed Mohsenian-Rad Texas Tech UniversityCommunications and Control in Smart Grid 74
• At time h = 1000, if N = 5, we expect to see:
5
1
5
1
5
1
5
1
5
1
)996()996(
)997()997(
)998()998(
)999()999(
)1000()1000(
ii
ii
ii
ii
ii
iWaW
iWaW
iWaW
iWaW
iWaWUnknown
Known

Single Wind Turbine: Online Model Prediction
Dr. Hamed Mohsenian-Rad Texas Tech UniversityCommunications and Control in Smart Grid 75
• Prediction Error:
• Q: Can we choose a1, …, aN to minimize mean prediction error?
T
T
T
T
T
T
WWWWWaaaaaWe
WWWWWaaaaaWe
WWWWWaaaaaWe
WWWWWaaaaaWe
WWWWWaaaaaWe
WWWWWaaaaaWe
)990()991()992()993()994()995()995(
)991()992()993()994()995()996()996(
)992()993()994()995()996()997()997(
)993()994()995()996()997()998()998(
)994()995()996()997()998()999()999(
)995()996()997()998()999()1000()1000(
54321
54321
54321
54321
54321
54321

Single Wind Turbine: Online Model Prediction
Dr. Hamed Mohsenian-Rad Texas Tech UniversityCommunications and Control in Smart Grid 76
• Least Square Error Parameter Estimation:
• Q: Can you rewrite the above problem in matrix form?
• Q: Can you solve the formulated optimization problem?
2
54321
2
54321
2
54321
2
54321
2
54321,,
)990()991()992()993()994()995(
)991()992()993()994()995()996(
)992()993()994()995()996()997(
)993()994()995()996()997()998(
)994()995()996()997()998()999( minimize51
T
T
T
T
T
aa
WWWWWaaaaaW
WWWWWaaaaaW
WWWWWaaaaaW
WWWWWaaaaaW
WWWWWaaaaaW

Single Wind Turbine: Online Model Prediction
Dr. Hamed Mohsenian-Rad Texas Tech UniversityCommunications and Control in Smart Grid 77
• Q: Do we always want to look at the whole history
• When we calculate the Least Square Error criteria?
• Q: What if we want to care less about older errors?

Single Wind Turbine: Online Model Prediction
Dr. Hamed Mohsenian-Rad Texas Tech UniversityCommunications and Control in Smart Grid 78
• Once we calculate a1, a2, …, aN , we use them to predict:
• Q: Should we use the same a1, a2, …, aN at time h = 1001?
• Q: What if we want to update the prediction model?
• Q: What is the difference between online and offline models?
TWWWWWaaaaaW )995()996()997()998()999()1000( 54321

Single Wind Turbine: Online Model Prediction
Dr. Hamed Mohsenian-Rad Texas Tech UniversityCommunications and Control in Smart Grid 79
• So far, our predictions have been one‐step ahead.
• Q: How can we make multiple step (e.g., 3) ahead prediction?
• Accuracy degrades as we move forward in time for prediction.
TWWWWWaaaaaW )995()996()997()998()999()1000( 54321
T
WWWWWaaaaaW
)996()997()998()999()1000()1001( 54321
T
WWWWWaaaaaW
)997()998()999()1000()1001()1002( 54321

Single Wind Turbine
Dr. Hamed Mohsenian-Rad Texas Tech UniversityCommunications and Control in Smart Grid 80
• Abdel‐Karim et al. applied offline training to Dunkirk, NY data:
• Measurement resolution: 10 minutes
Ten min and one hour prediction using one hour past values
Q: What is N?

Single Wind Turbine
Dr. Hamed Mohsenian-Rad Texas Tech UniversityCommunications and Control in Smart Grid 81
• Abdel‐Karim et al. applied offline training to Dunkirk, NY data:
• Measurement resolution: 10 minutes
Ten min and one hour prediction using 10 min past value
Q: What is N?
Single Wind Turbine
Dr. Hamed Mohsenian-Rad Texas Tech UniversityCommunications and Control in Smart Grid 82
• It seems N = 1 works better.
• Similar results are reported in other papers.
• Q: How do you interpret these results?
• Q: What are the other prediction models when
• We only use the one past data to make the prediction?

Single Wind Turbine: Markov Chain Prediction
Dr. Hamed Mohsenian-Rad Texas Tech UniversityCommunications and Control in Smart Grid 83
• A Markov chain (MC) is a mathematical system that
• Undergoes transitions from one state to another
• Between a finite or countable number of possible states
• MC is a memoryless random process:
• The next state depends only on the current state
• Not on the sequence of events that preceded it.
Single Wind Turbine: Markov Chain Prediction
Dr. Hamed Mohsenian-Rad Texas Tech UniversityCommunications and Control in Smart Grid 84
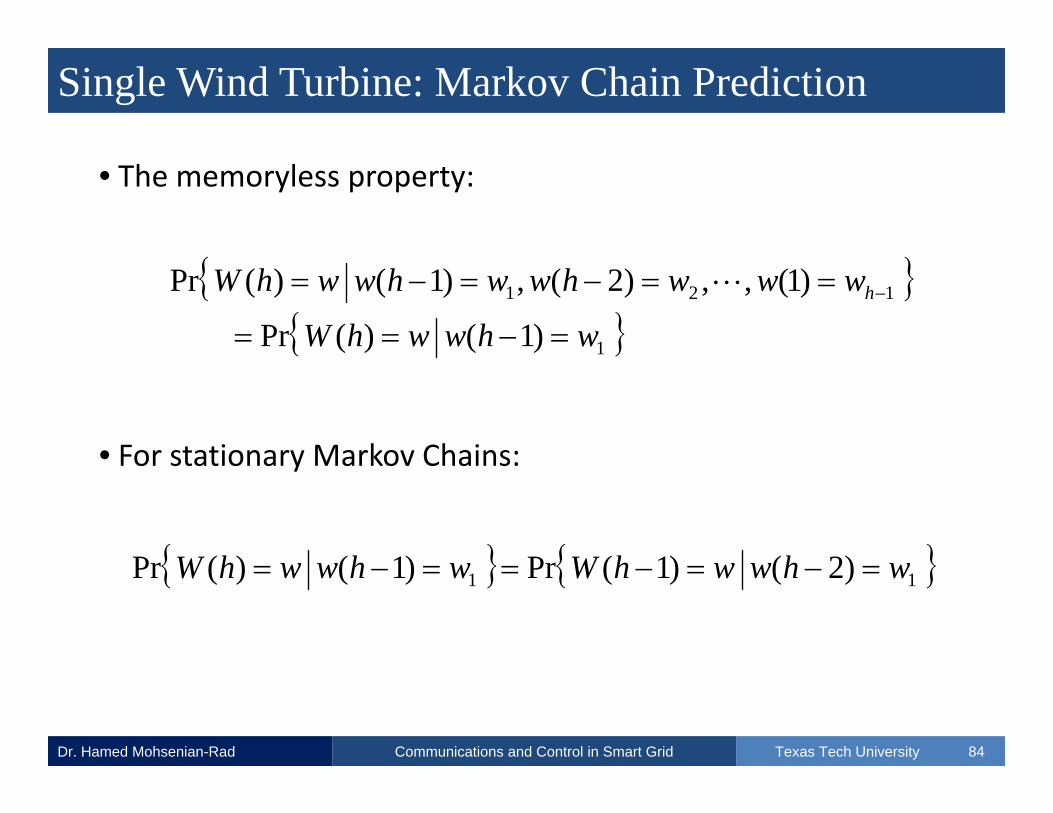
• The memoryless property:
• For stationary Markov Chains:
1
121
)1()(Pr
)1(,,)2(,)1()(Pr
whwwhW
wwwhwwhwwhW h
11 )2()1(Pr)1()(Pr whwwhWwhwwhW

Single Wind Turbine: Markov Chain Prediction
Dr. Hamed Mohsenian-Rad Texas Tech UniversityCommunications and Control in Smart Grid 85
• Example: A Stationary Markov Chain with Three States
• Q: What is the sum of
• Incoming probabilities
• Outgoing probabilities
to and from each state?
Q: What does it indicate?

Single Wind Turbine: Markov Chain Prediction
Dr. Hamed Mohsenian-Rad Texas Tech UniversityCommunications and Control in Smart Grid 86
• Example: Obtain the transition probability matrix for this MC:

Single Wind Turbine: Markov Chain Prediction
Dr. Hamed Mohsenian-Rad Texas Tech UniversityCommunications and Control in Smart Grid 87
• Obtain the transition probability matrix from measurements:
• If we are in state 1:
• Probability of staying in State 1:
• Probability of going to State 2:
• Probability of going to State 3:
1, 3, 2, 2, 3, 1, 2, 1, 3, 3, 2, 1, 1, 2, 3, 3, 2, 3, 1, 2, 3, 1, 2, 3, 3, 2, 2, 1, 1, 3, 2, 1, 2, 2, 3

Single Wind Turbine: Markov Chain Prediction
Dr. Hamed Mohsenian-Rad Texas Tech UniversityCommunications and Control in Smart Grid 88
• Obtain the transition probability matrix from measurements:
• If we are in state 2:
• Probability of going to State 1:
• Probability of staying in State 2:
• Probability of going to State 3:
1, 3, 2, 2, 3, 1, 2, 1, 3, 3, 2, 1, 1, 2, 3, 3, 2, 3, 1, 2, 3, 1, 2, 3, 3, 2, 2, 1, 1, 3, 2, 1, 2, 2, 3
Single Wind Turbine: Markov Chain Prediction
Dr. Hamed Mohsenian-Rad Texas Tech UniversityCommunications and Control in Smart Grid 89
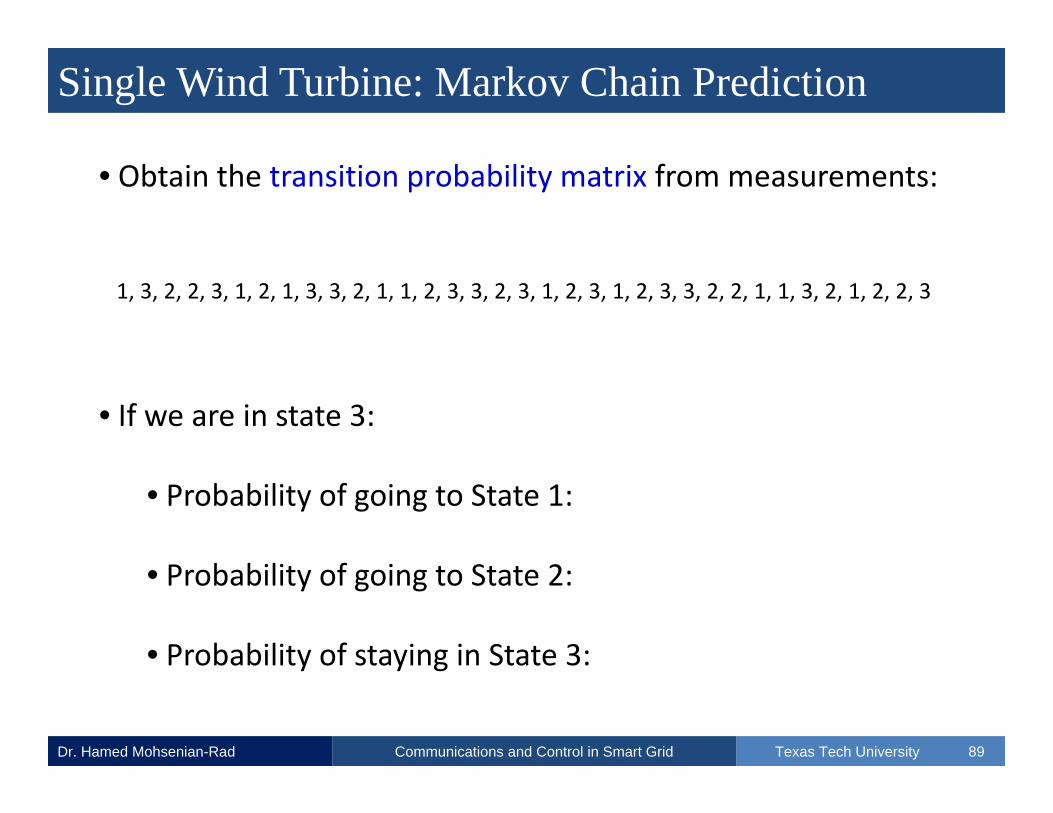
• Obtain the transition probability matrix from measurements:
• If we are in state 3:
• Probability of going to State 1:
• Probability of going to State 2:
• Probability of staying in State 3:
1, 3, 2, 2, 3, 1, 2, 1, 3, 3, 2, 1, 1, 2, 3, 3, 2, 3, 1, 2, 3, 1, 2, 3, 3, 2, 2, 1, 1, 3, 2, 1, 2, 2, 3

Single Wind Turbine: Markov Chain Prediction
Dr. Hamed Mohsenian-Rad Texas Tech UniversityCommunications and Control in Smart Grid 90
• Obtain the transition probability matrix from measurements:
1, 3, 2, 2, 3, 1, 2, 1, 3, 3, 2, 1, 1, 2, 3, 3, 2, 3, 1, 2, 3, 1, 2, 3, 3, 2, 2, 1, 1, 3, 2, 1, 2, 2, 3
Single Wind Turbine: Markov Chain Prediction
Dr. Hamed Mohsenian-Rad Texas Tech UniversityCommunications and Control in Smart Grid 91
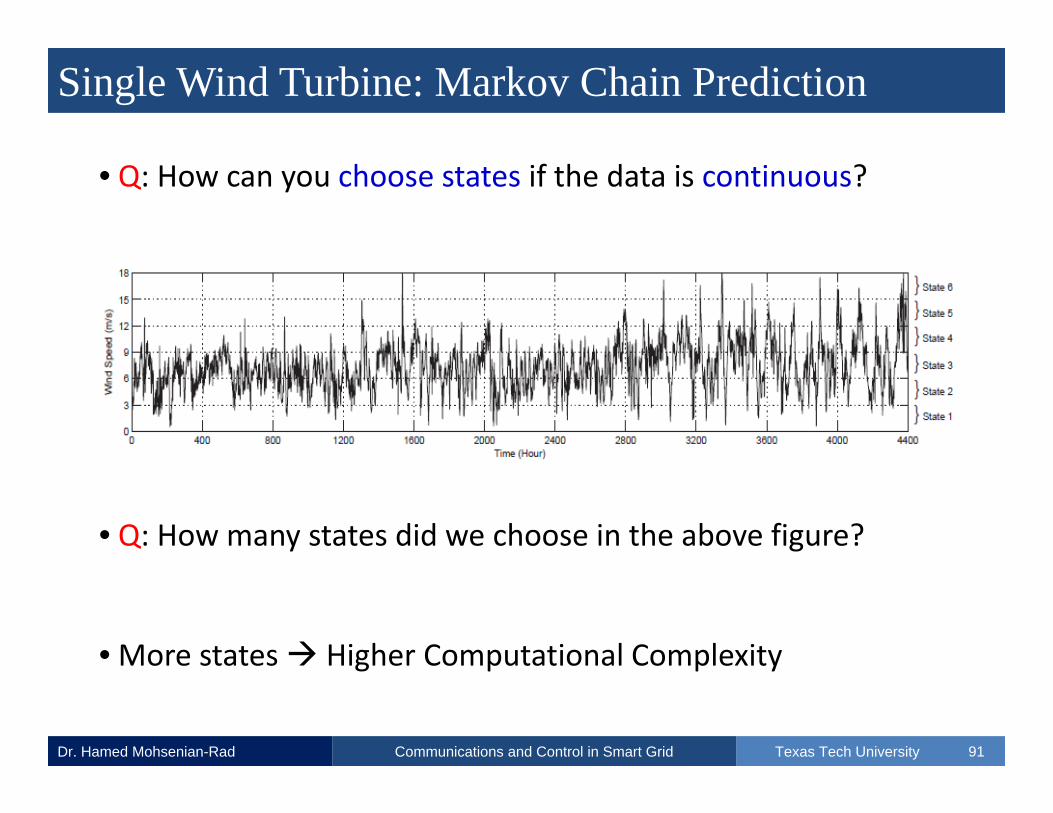
• Q: How can you choose states if the data is continuous?
• Q: How many states did we choose in the above figure?
• More states Higher Computational Complexity

Single Wind Turbine: Markov Chain Prediction
Dr. Hamed Mohsenian-Rad Texas Tech UniversityCommunications and Control in Smart Grid 92
• For wind power, transition probability matrix is usually sparse.
(a) Wind Speed Measurements over Six Months
(a) Corresponding Markov Chain Model (c) State Transition Probabilities

Single Wind Turbine
Dr. Hamed Mohsenian-Rad Texas Tech UniversityCommunications and Control in Smart Grid 93
• Abdel‐Karim et al. also used MC models for wind speed
Transition Probabilities with 16 States
Q: Is the corresponding transition probability matrix sparse?
Single Wind Turbine
Dr. Hamed Mohsenian-Rad Texas Tech UniversityCommunications and Control in Smart Grid 94
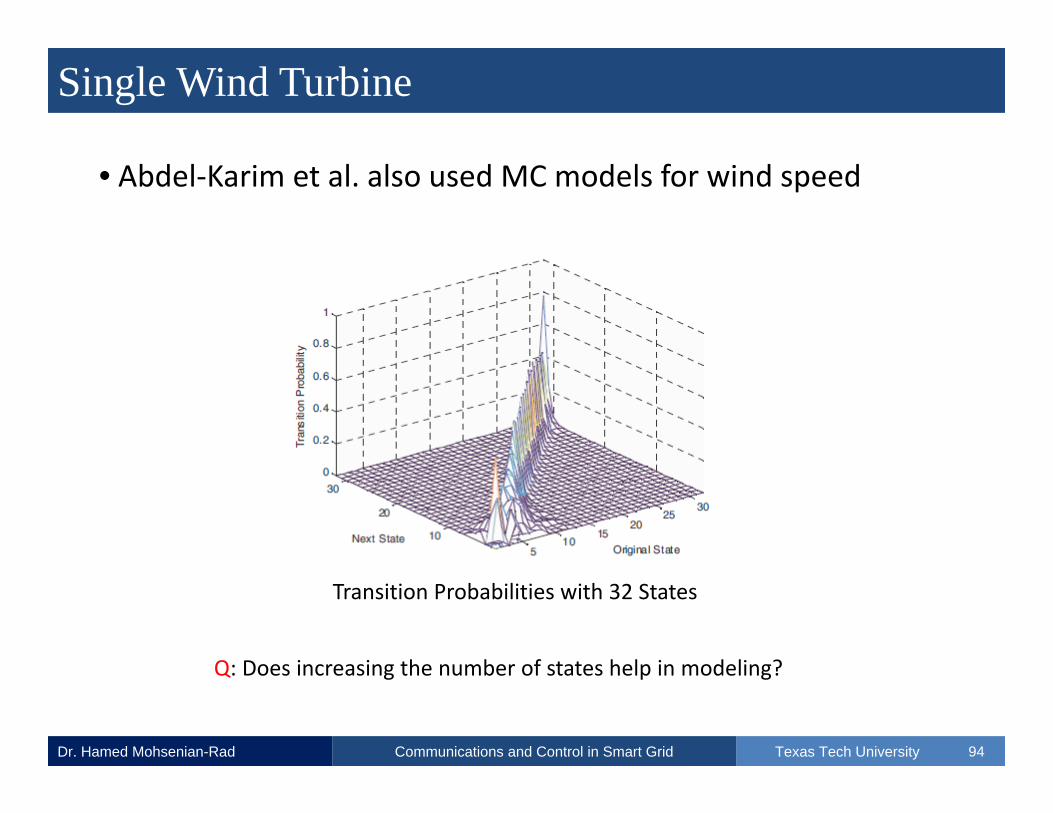
• Abdel‐Karim et al. also used MC models for wind speed
Transition Probabilities with 32 States
Q: Does increasing the number of states help in modeling?
Single Wind Turbine
Dr. Hamed Mohsenian-Rad Texas Tech UniversityCommunications and Control in Smart Grid 95
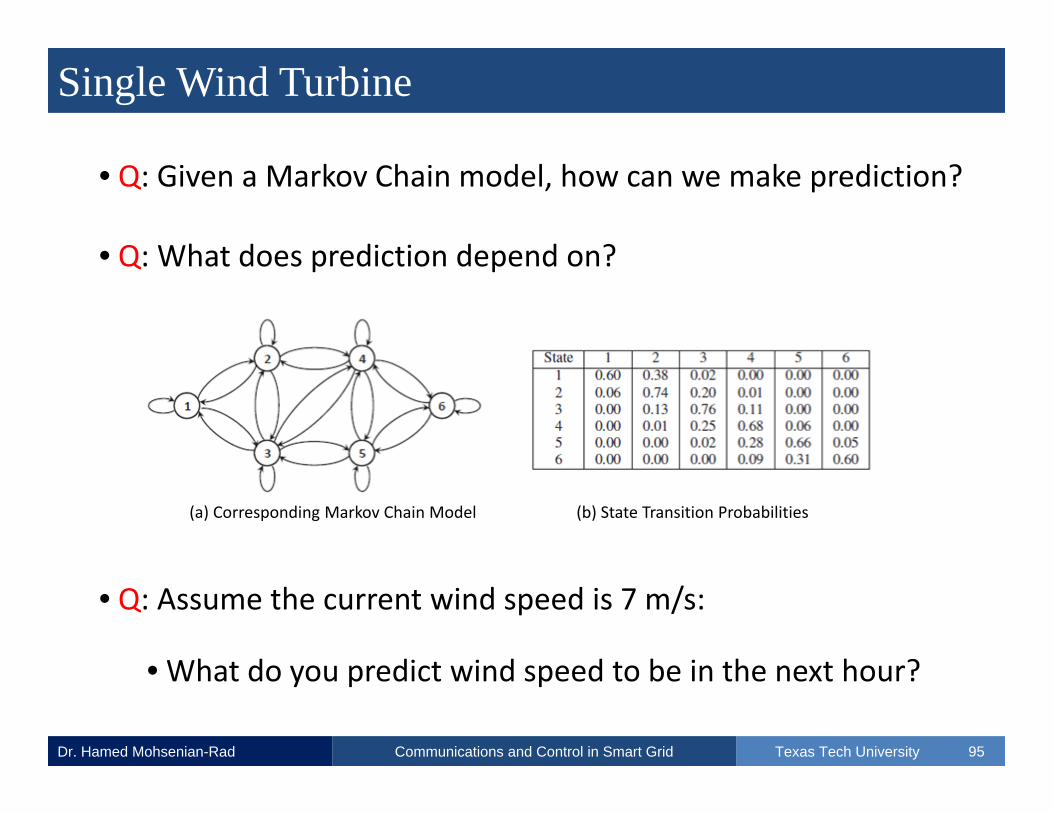
• Q: Given a Markov Chain model, how can we make prediction?
• Q: What does prediction depend on?
• Q: Assume the current wind speed is 7 m/s:
• What do you predict wind speed to be in the next hour?
(a) Corresponding Markov Chain Model (b) State Transition Probabilities
Single Wind Turbine
Dr. Hamed Mohsenian-Rad Texas Tech UniversityCommunications and Control in Smart Grid 96
• As an alternative model for linear wind speed predictors:
• We may use certain probability distribution functions.
• They too need training to obtain optimal parameters.
• Training can be done offline or online:
• But the common approach is offline parameter selection.
Single Wind Turbine
Dr. Hamed Mohsenian-Rad Texas Tech UniversityCommunications and Control in Smart Grid 97
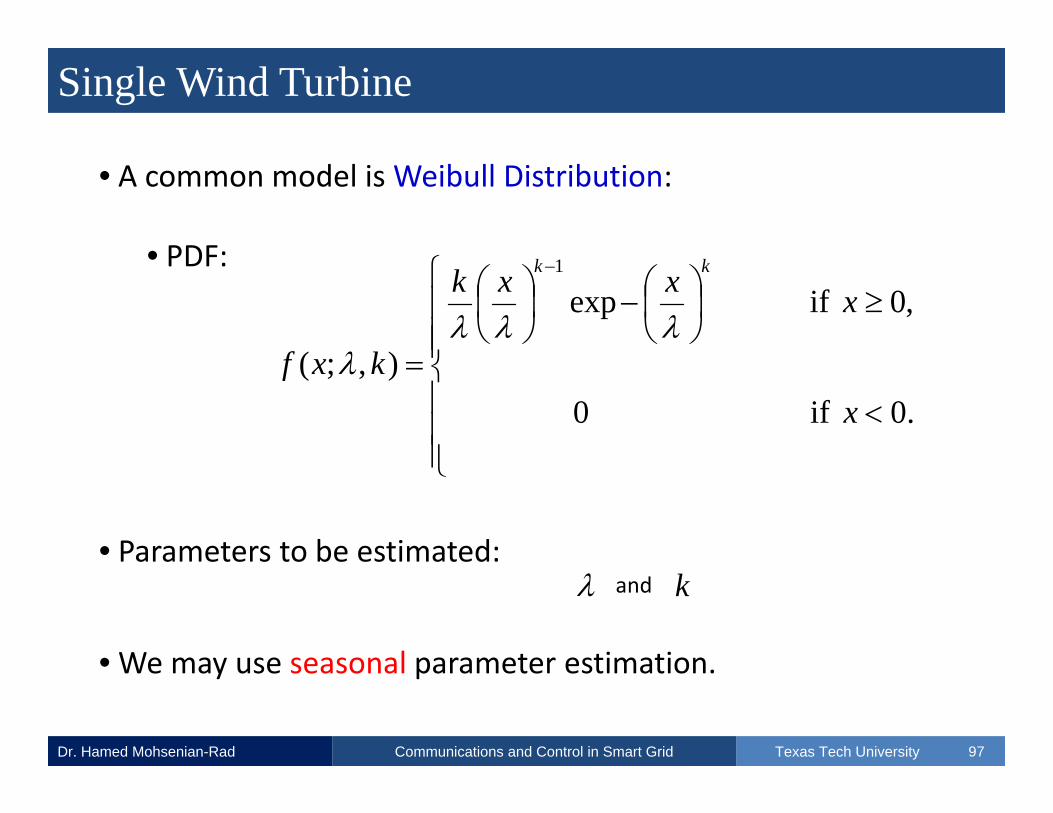
• A common model is Weibull Distribution:
• PDF:
• Parameters to be estimated:
• We may use seasonal parameter estimation.
.0if0
,0ifexp
),;(
1
x
xxxk
kxf
kk
kand

Single Wind Turbine
Dr. Hamed Mohsenian-Rad Texas Tech UniversityCommunications and Control in Smart Grid 98
• A common model is Weibull Distribution:
Wind Speed
Prob
ability
Single Wind Turbine
Dr. Hamed Mohsenian-Rad Texas Tech UniversityCommunications and Control in Smart Grid 99
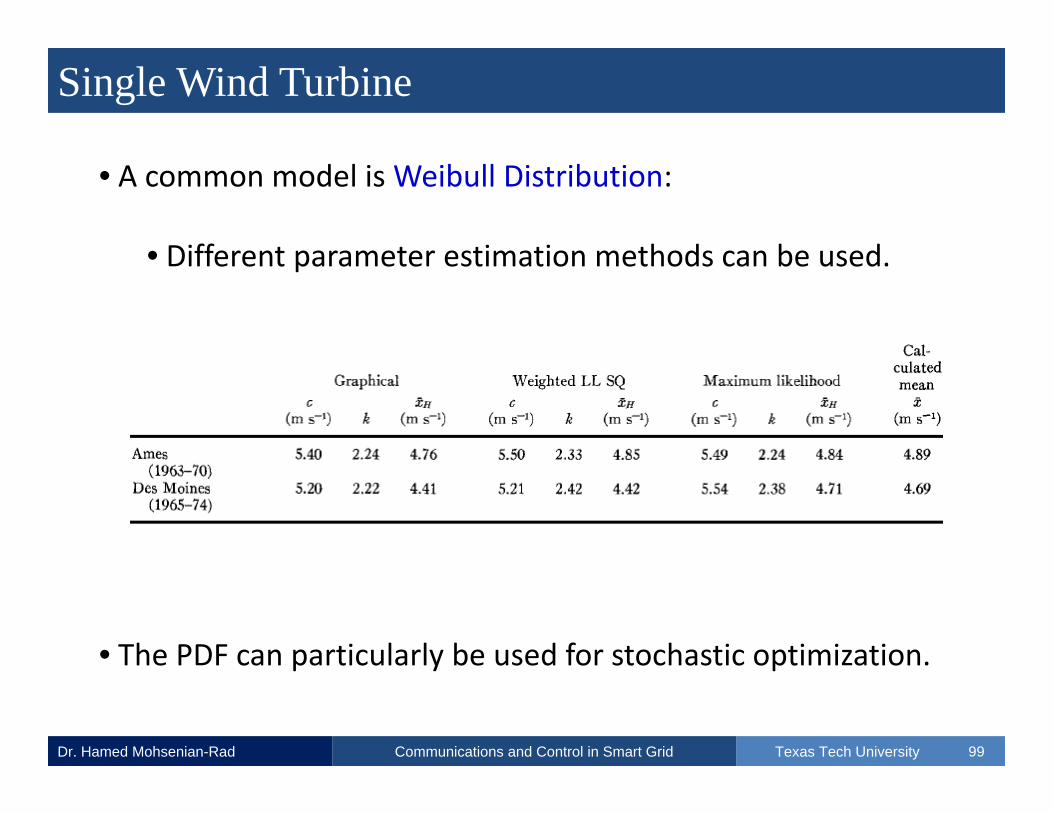
• A common model is Weibull Distribution:
• Different parameter estimation methods can be used.
• The PDF can particularly be used for stochastic optimization.
Wind Farm
Dr. Hamed Mohsenian-Rad Texas Tech UniversityCommunications and Control in Smart Grid 100
• Q: Why is wind power prediction different for wind farms?

Wind Farm
Dr. Hamed Mohsenian-Rad Texas Tech UniversityCommunications and Control in Smart Grid 101
• Key Challenges:
• Wind speed can vary within a wind farm.
• In particular, in non‐flat/mountain areas.
• One single wind speed measurement is not enough.
• A wind farm may include different types of turbines.
• Each type has a distinct wind‐speed wind‐power curve.
• We cannot scale up wind power prediction.

Wind Farm
Dr. Hamed Mohsenian-Rad Texas Tech UniversityCommunications and Control in Smart Grid 102
• Wind speed (generated power) can vary within a wind farm:
• Three identical turbines within same farm have different outputs.
One Wind TurbineClosest TurbineFurthest Turbine Re
f: Murugesan
2012

Wind Farm
Dr. Hamed Mohsenian-Rad Texas Tech UniversityCommunications and Control in Smart Grid 103
• A wind farm may include different types/classes of turbines:
• Different classes can have different wind speed / power curves.
Ref: Murugesan
2012
Wind Farm
Dr. Hamed Mohsenian-Rad Texas Tech UniversityCommunications and Control in Smart Grid 104
• Q: How can we tackle these two challenges?
• Option 1: We measure wind speed for each turbine.
• Perform individual forecasting for each single turbine.
• Aggregate the results to predict the farm’s output.
• This is a reasonable option:
• It can be computationally complex and requires resources.
Wind Farm
Dr. Hamed Mohsenian-Rad Texas Tech UniversityCommunications and Control in Smart Grid 105
• Q: How can we tackle these two challenges?
• Option 2: Wind‐form specific prediction with limited data.
• Separate wind speed measurement for each class.
• Could be challenging.
• Still an ongoing research.
• Here, we briefly review the 2012 work by Murugesan et al.
Wind Farm
Dr. Hamed Mohsenian-Rad Texas Tech UniversityCommunications and Control in Smart Grid 106
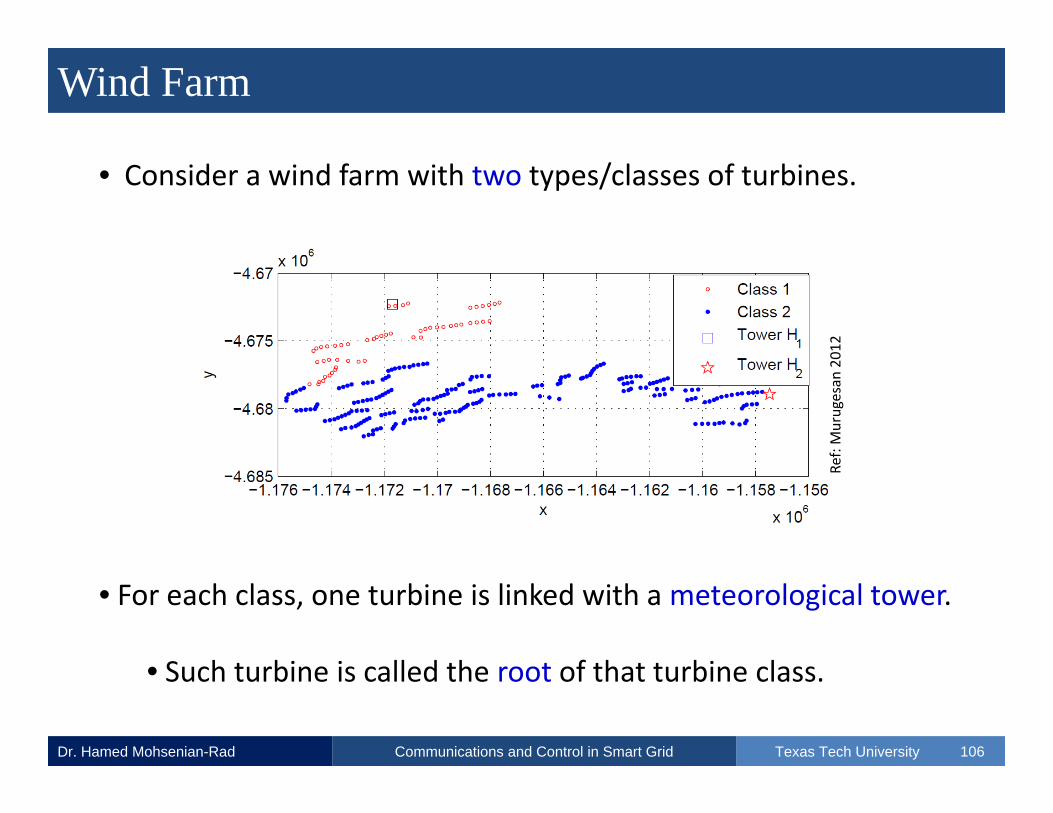
• Consider a wind farm with two types/classes of turbines.
• For each class, one turbine is linked with a meteorological tower.
• Such turbine is called the root of that turbine class.
Ref: Murugesan
2012
Wind Farm
Dr. Hamed Mohsenian-Rad Texas Tech UniversityCommunications and Control in Smart Grid 107
• Using one of the methods described before:
• We can predict wind speed and power output for the root.
• Example: Using Markov Chain or Weibull Distribution
• Q: How can we extend the prediction to turbines in same class?
• Q: Can we simply multiple it by number of turbines? Why?

Wind Farm
Dr. Hamed Mohsenian-Rad Texas Tech UniversityCommunications and Control in Smart Grid 108
• Let us define the minimum spanning tree (MST) for each class.
Ref: Murugesan
2012
Ref: Murugesan
2012

Wind Farm
Dr. Hamed Mohsenian-Rad Texas Tech UniversityCommunications and Control in Smart Grid 109
• We want to answer this question:
• Q: Given the prediction of wind power for a parent turbine:
• How can we predict the wind power for the child turbine?
• Starting from the root:
• We can predict wind power for all turbines in same class.
• Again, we will use a linear predictor: ParentChild PP
Wind Farm
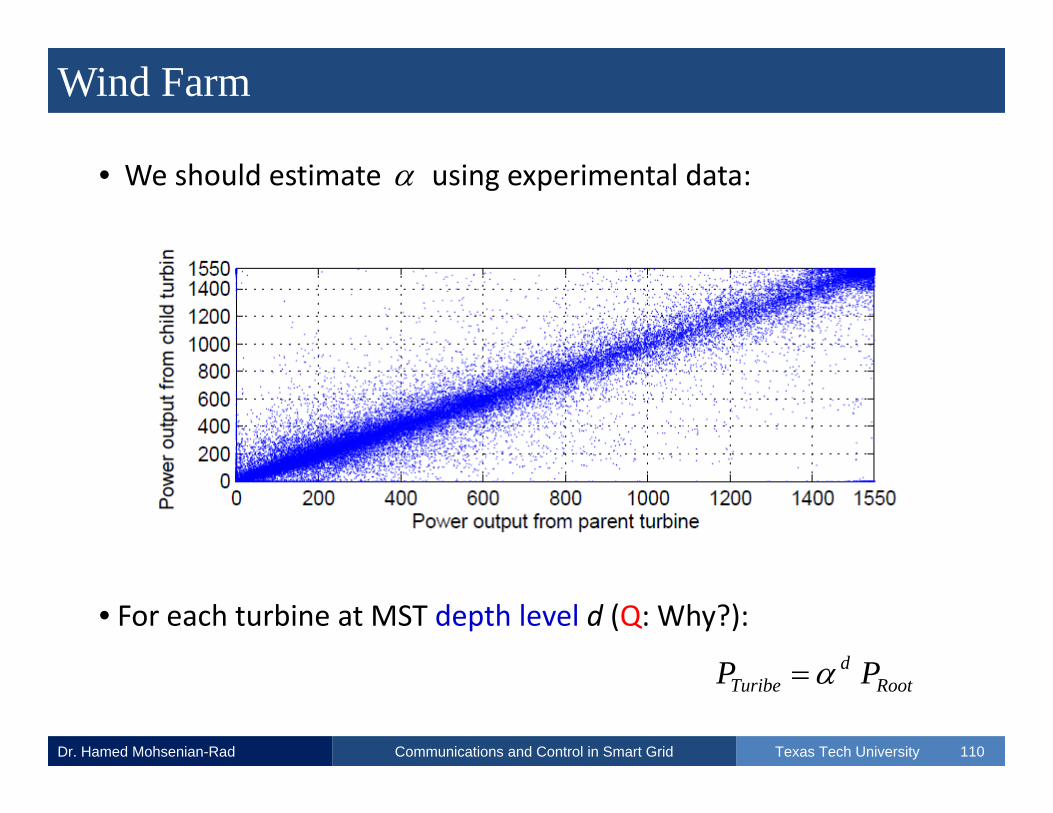
Dr. Hamed Mohsenian-Rad Texas Tech UniversityCommunications and Control in Smart Grid 110
• We should estimate using experimental data:
• For each turbine at MST depth level d (Q: Why?):
Rootd
Turibe PP
Wind Farm
Dr. Hamed Mohsenian-Rad Texas Tech UniversityCommunications and Control in Smart Grid 111
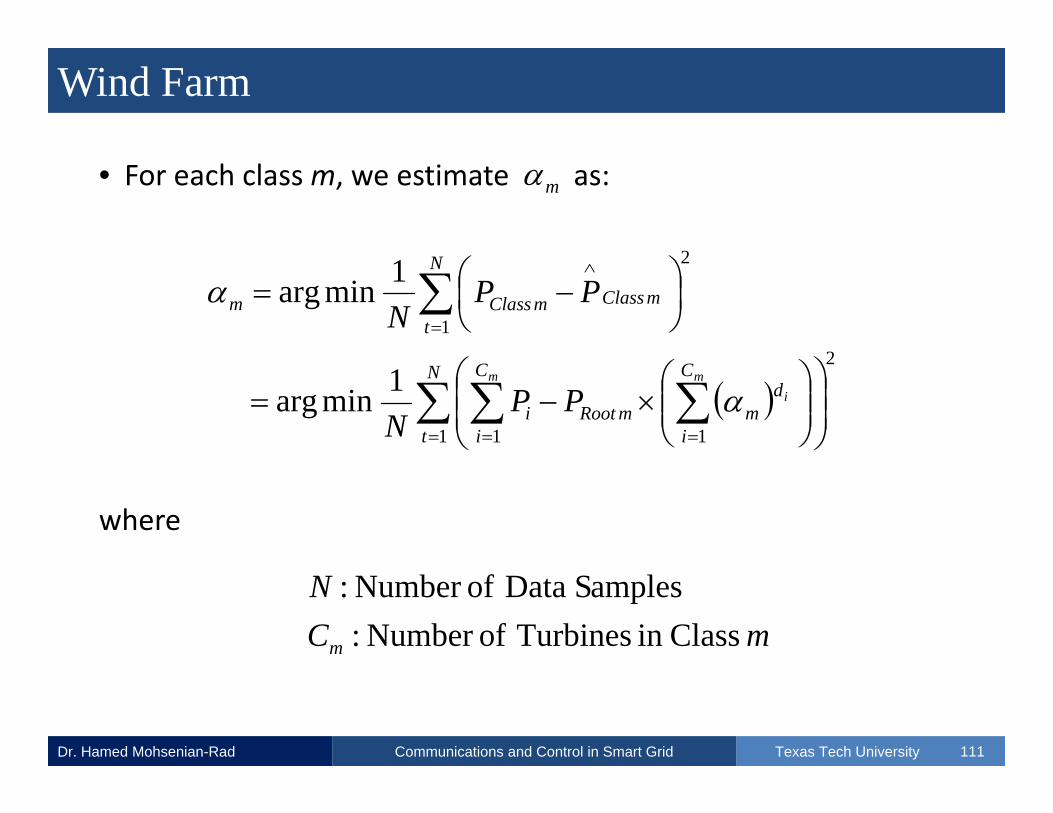
• For each classm, we estimate as:
where
m
N
t
C
i
dmmRoot
C
ii
N
tmClassmClassm
mi
m
PPN
PPN
1
2
11
1
2
1minarg
1minarg
mCN
m Classin Turbines ofNumber :amples SData ofNumber :
Wind Farm
Dr. Hamed Mohsenian-Rad Texas Tech UniversityCommunications and Control in Smart Grid 112
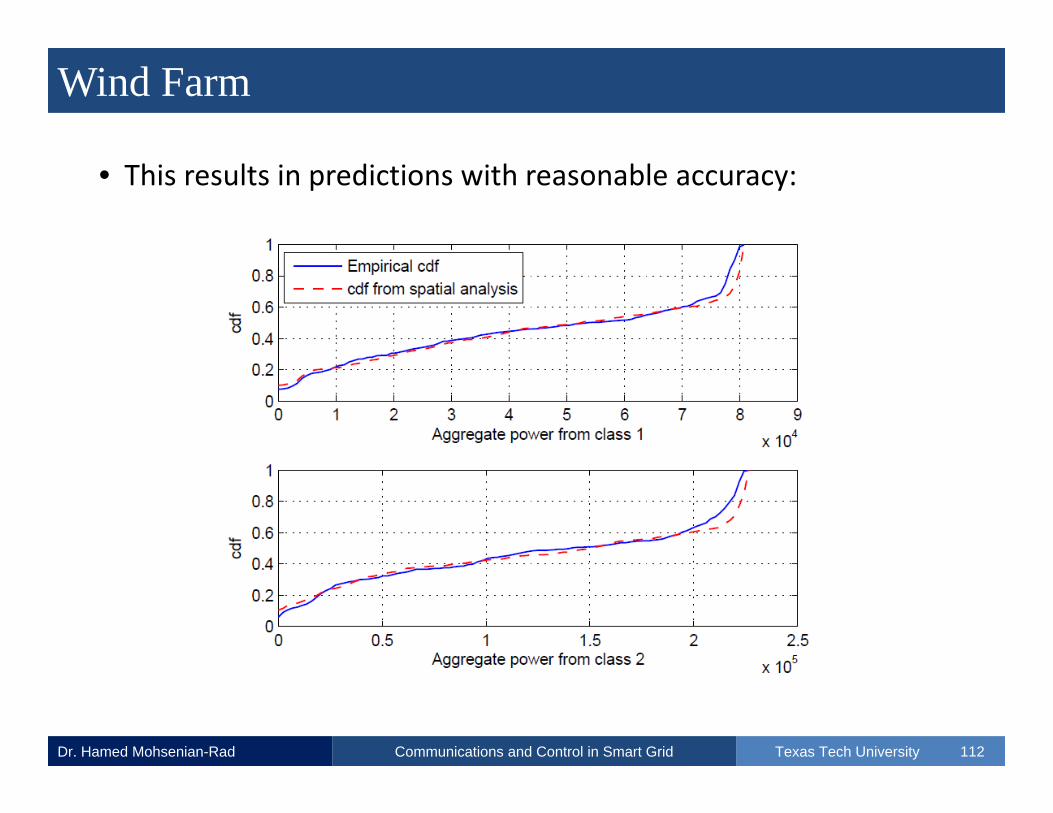
• This results in predictions with reasonable accuracy:

Microgrid
Dr. Hamed Mohsenian-Rad Texas Tech UniversityCommunications and Control in Smart Grid 113
• A microgrid is a localized grouping of:
• Electricity generation
• Energy storage
• Controllable and Non‐controllable Load
• It can operate in two modes:
• Grid‐Connected
• Islanded
Distributed Energy Resources (DERs)
Microgrid
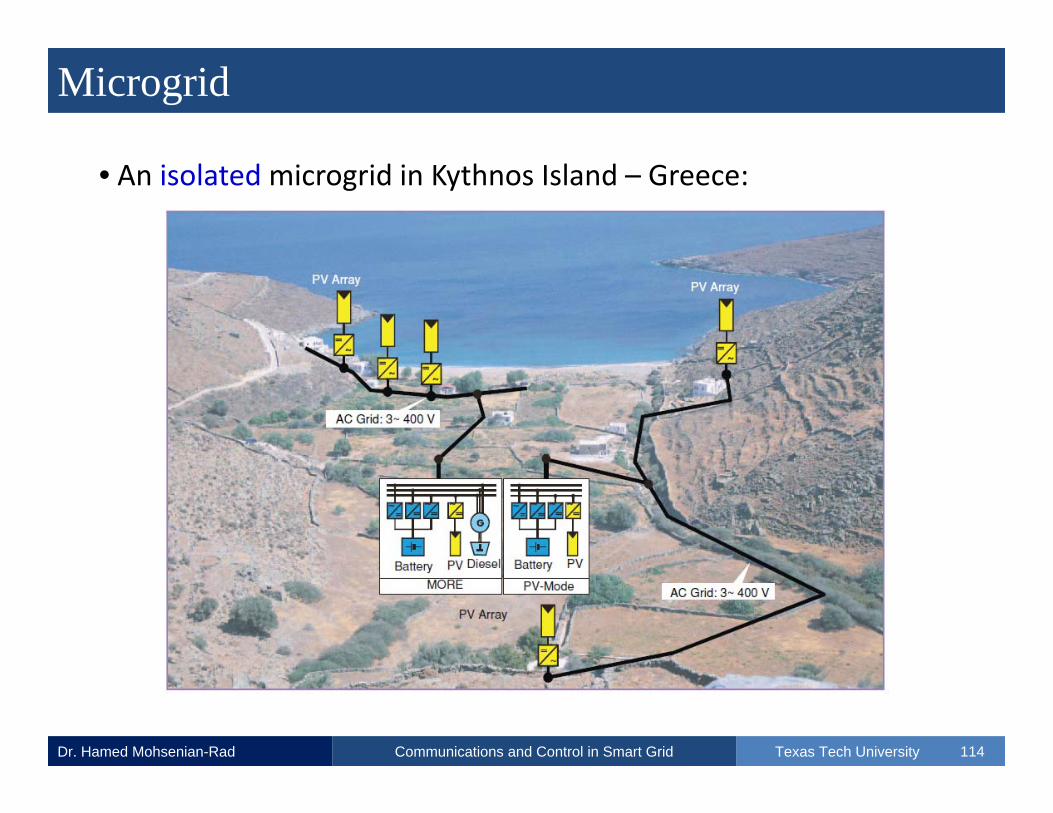
Dr. Hamed Mohsenian-Rad Texas Tech UniversityCommunications and Control in Smart Grid 114
• An isolated microgrid in Kythnos Island – Greece:

Microgrid
Dr. Hamed Mohsenian-Rad Texas Tech UniversityCommunications and Control in Smart Grid 115
• An microgrid facility: can operate in both modes:
It could be a zero‐net energy building with behind‐the‐meter generator

Microgrid
Dr. Hamed Mohsenian-Rad Texas Tech UniversityCommunications and Control in Smart Grid 116
• A microgrid can operate autonomously:
• Connected to grid when needed
• Disconnected otherwise
• From the point of view of the grid operator:
• A connected microgrid can be controlled as if it was one entity.
• Microgrids allow distributed generation and control.
Challenge: Having Smooth Transitions

Microgrid
Dr. Hamed Mohsenian-Rad Texas Tech UniversityCommunications and Control in Smart Grid 117
• Microgrid as a building block for smart grid:
Inter‐connecting Several Micro‐grids to Build a Zero‐Emission City

Microgrid
Dr. Hamed Mohsenian-Rad Texas Tech UniversityCommunications and Control in Smart Grid 118
• Microgrid as a building block for smart grid:
• Inter‐connection options:
• DC and AC Lines.
• Coordination can be done through a data center and SCADA.
• Just like the Internet, each micro‐grid will be:
• An Autonomous System (AS)
References
Dr. Hamed Mohsenian-Rad Texas Tech UniversityCommunications and Control in Smart Grid
• S. McCluer and J.‐F. Christin, "Comparing Batteries, Flywheels, and Ultracapacitors," White Paper, Schneider Electric, [Online]: www.apcmedia.com/salestools/DBOY‐77FNCT_R2_EN.pdf..
• C. Wu, H. Mohsenian‐Rad, and J. Huang, “Wind PowerIntegration via Aggregator‐Consumer Coordination: A GameTheoretic Approach”, in Proc. of the IEEE PES Innovative SmartGrid Technologies Conference, Washington, DC, January 2012.
• C. Wu, H. Mohsenian‐Rad, J. Huang, A. Wang, “Demand SideManagement for Wind Power Integration in Microgrid UsingDynamic Potential Game Theory”, IEEE GLOBECOMWorkshop onSmart Grid Communications, Houston, TX, Dec 2011.
119

References
Dr. Hamed Mohsenian-Rad Texas Tech UniversityCommunications and Control in Smart Grid
• N. Abdel‐Karim, M. Small and M. Ilic, “Short term wind speedprediction by finite and infinite impulse response filters: A statespace model representation using discrete markov process,”IEEE Bucharest Power Tech Conference, Bucharest, 2009.
• E. S. Tackle and J. M. Brown, “Note on the use of Weibullstatistics to characterize wind speed data,” Journal AppliedMeteorology, vol. 17, pp. 556 ‐ 559, 1978.
• S. Murugesan, J. Zhang, V. Vittal, "Finite State Markov ChainModel for Wind Generation Forecast: A Data‐drivenSpatiotemporal Approach", in Proc. of the IEEE Innovative SmartGrid Technologies Conference, Washington, DC, January 2012.
120

References
Dr. Hamed Mohsenian-Rad Texas Tech UniversityCommunications and Control in Smart Grid
• P. Bremaud,Markov Chains, Springer, March 2008.
• N. Hatziargyriou, H. Asano, R. Iravani, C. Marnay, "Microgrids:An Overview of Ongoing Research, Development, andDemonstration Projects," IEEE Power and Energy Magazine, vo.5, No. 4, pp. 78‐94, July / August 2007.
• G. Boyle, Renewable Energy: Power for a Sustainable Future,Oxford University Press, Second Edition, May 2004.
121