Embed Size (px)
DESCRIPTION
ess
Citation preview
Topic 3: Human Population, Carrying Capacity and Resource Use
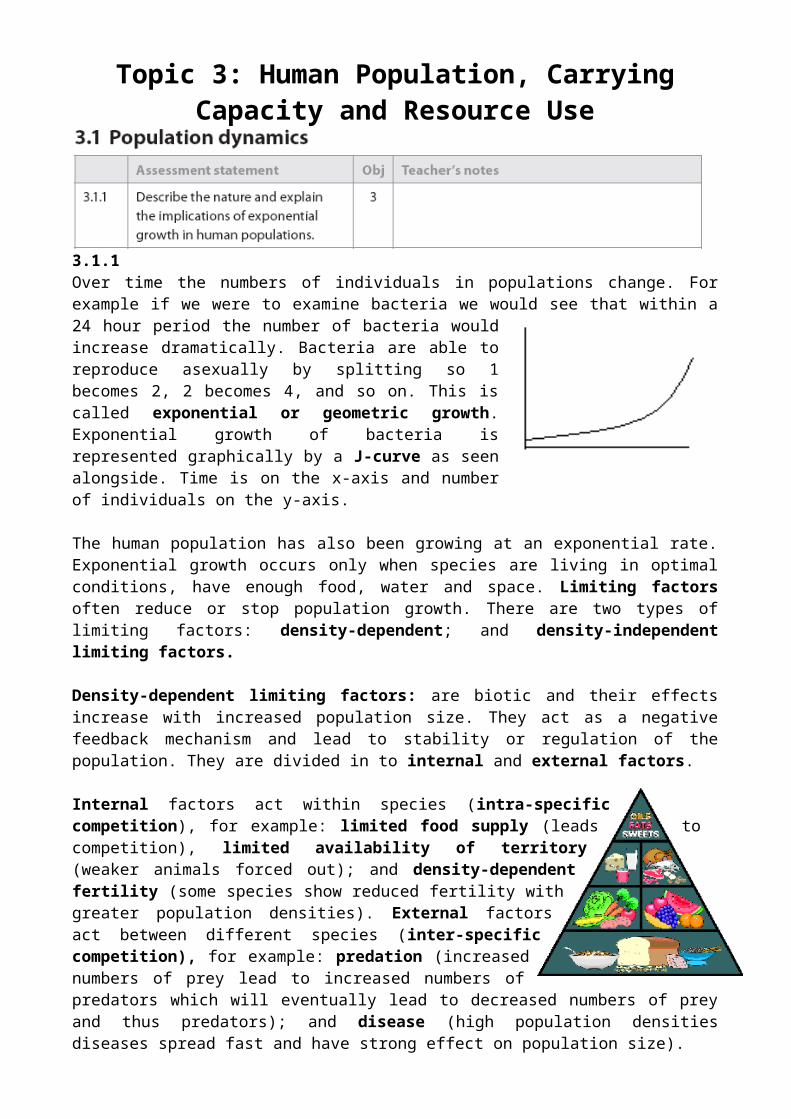
3.1.1Over time the numbers of individuals in populations change. For example if we were to examine bacteria we would see that within a 24 hour period the number of bacteria would increase dramatically. Bacteria are able to reproduce asexually by splitting so 1 becomes 2, 2 becomes 4, and so on. This is called exponential or geometric growth. Exponential growth of bacteria is represented graphically by a J-curve as seen alongside. Time is on the x-axis and number of individuals on the y-axis.
The human population has also been growing at an exponential rate. Exponential growth occurs only when species are living in optimal conditions, have enough food, water and space. Limiting factors often reduce or stop population growth. There are two types of limiting factors: density-dependent; and density-independent limiting factors.
Density-dependent limiting factors: are biotic and their effects increase with increased population size. They act as a negative feedback mechanism and lead to stability or regulation of the population. They are divided in to internal and external factors.
Internal factors act within species (intra-specific competition), for example: limited food supply (leads to competition), limited availability of territory (weaker animals forced out); and density-dependent fertility (some species show reduced fertility with greater population densities). External factors act between different species (inter-specific competition), for example: predation (increased numbers of prey lead to increased numbers of predators which will eventually lead to decreased numbers of prey and thus predators); and disease (high population densities diseases spread fast and have strong effect on population size).
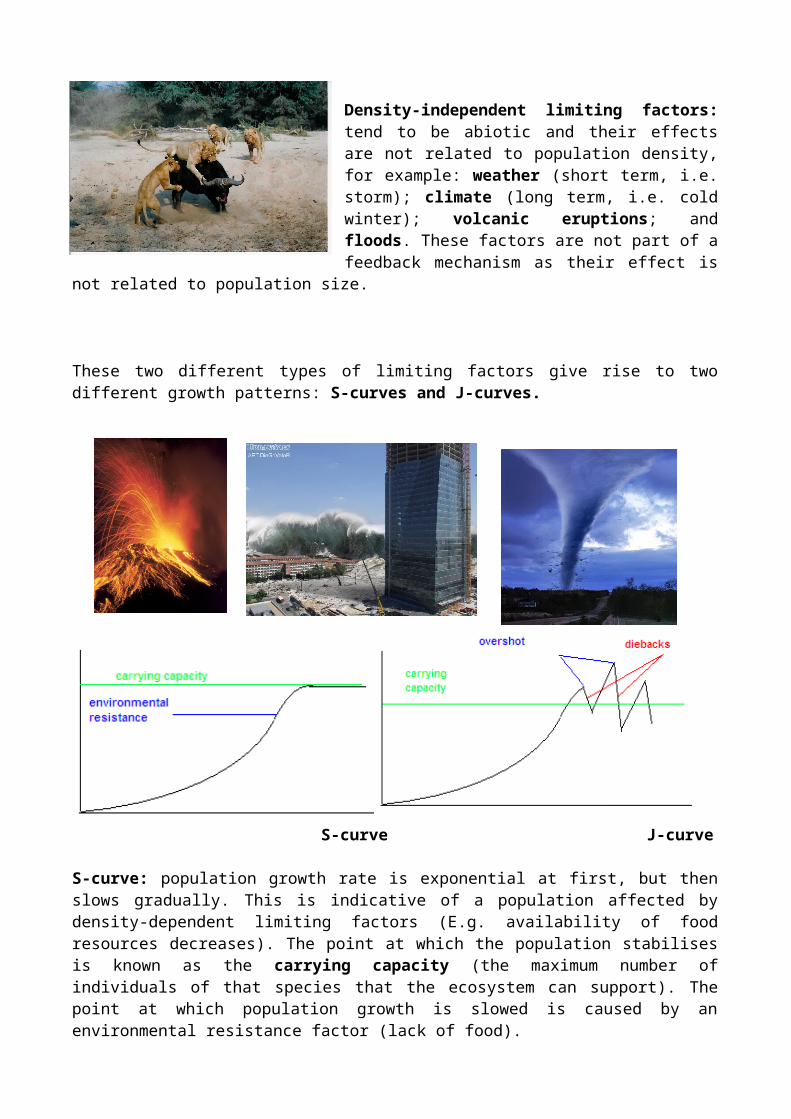
Density-independent limiting factors: tend to be abiotic and their effects are not related to population density, for example: weather (short term, i.e. storm); climate (long term, i.e. cold winter); volcanic eruptions; and floods. These factors are not part of a feedback mechanism as their effect is not related to population size.
These two different types of limiting factors give rise to two different growth patterns: S-curves and J-curves.
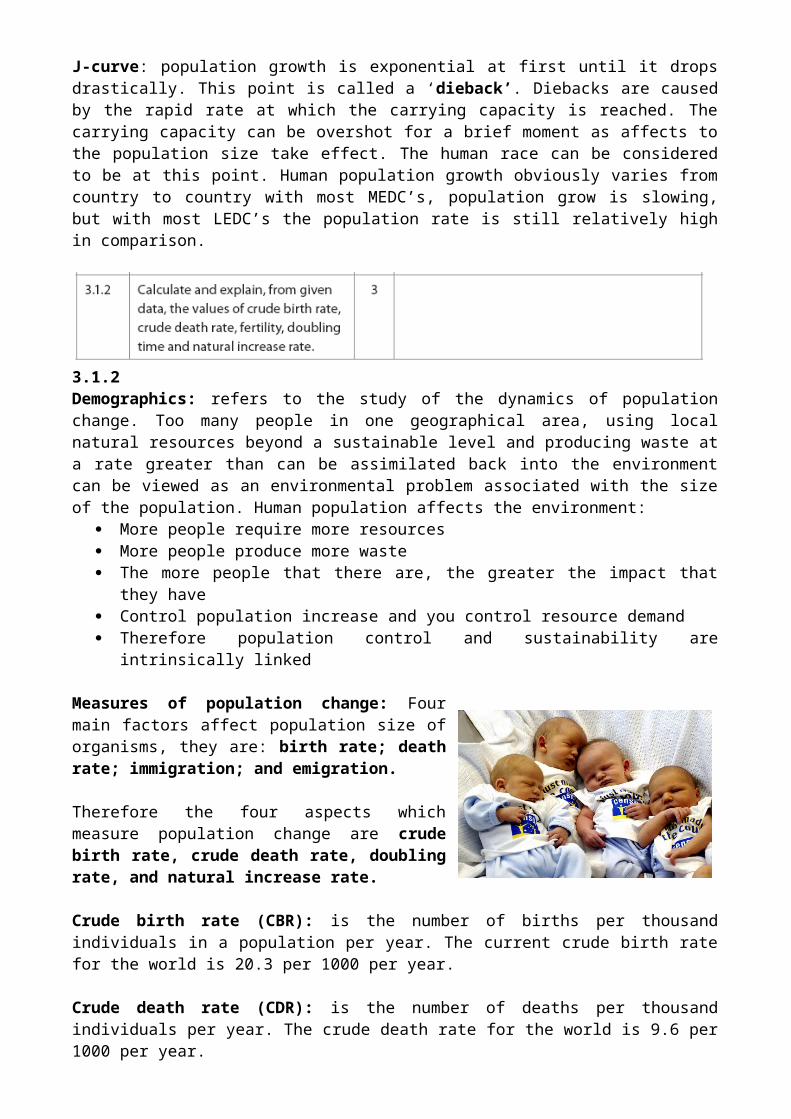
S-curve J-curve
S-curve: population growth rate is exponential at first, but then slows gradually. This is indicative of a population affected by density-dependent limiting factors (E.g. availability of food resources decreases). The point at which the population stabilises is known as the carrying capacity (the maximum number of individuals of that species that the ecosystem can support). The point at which population growth is slowed is caused by an environmental resistance factor (lack of food).
J-curve: population growth is exponential at first until it drops drastically. This point is called a ‘dieback’. Diebacks are caused by the rapid rate at which the carrying capacity is reached. The carrying capacity can be overshot for a brief moment as affects to the population size take effect. The human race can be considered to be at this point. Human population growth obviously varies from country to country with most MEDC’s, population grow is slowing, but with most LEDC’s the population rate is still relatively high in comparison.
3.1.2Demographics: refers to the study of the dynamics of population change. Too many people in one geographical area, using local natural resources beyond a sustainable level and producing waste at a rate greater than can be assimilated back into the environment can be viewed as an environmental problem associated with the size of the population. Human population affects the environment:
More people require more resources More people produce more waste The more people that there are, the greater the impact that they have Control population increase and you control resource demand
Therefore population control and sustainability are intrinsically linked
Measures of population change: Four main factors affect population size of organisms, they are: birth rate; death rate; immigration; and emigration.
Therefore the four aspects which measure population change are crude birth rate, crude death rate, doubling rate, and natural increase rate.
Crude birth rate (CBR): is the number of births per thousand individuals in a population per year. The current crude birth rate for the world is 20.3 per 1000 per year.
Crude death rate (CDR): is the number of deaths per thousand individuals per year. The crude death rate for the world is 9.6 per 1000 per year.
The crude death rate and birth rate are calculated by dividing the number of births or deaths by the population and then multiplying by 1000.
Natural increase rate (NIR): is calculated as follows: (crude birth rate – crude death rate) divided by ten. This gives the natural increase rate as a percentage. It excludes the effects of migration.
Doubling rate is the time it takes in years for the population to double in size.
Population growth: can be defined in terms of birth rate, doubling time, and fertility rate.
Total fertility rate: is the average number of children each woman has over her lifetime. A fertility rate higher than 2.0 results in population increase, while a rate lower than 2.0 will result in population decrease. Fertility rate is the number of births per thousand women of child bearing age. The difference between fertility rate and birth rate is that birth rate is expressed as a percentage of the population, not of each woman. However crude birth rate is usually more commonly used (births per 1000 individuals).
See Pg 168: To do exercise for examples.
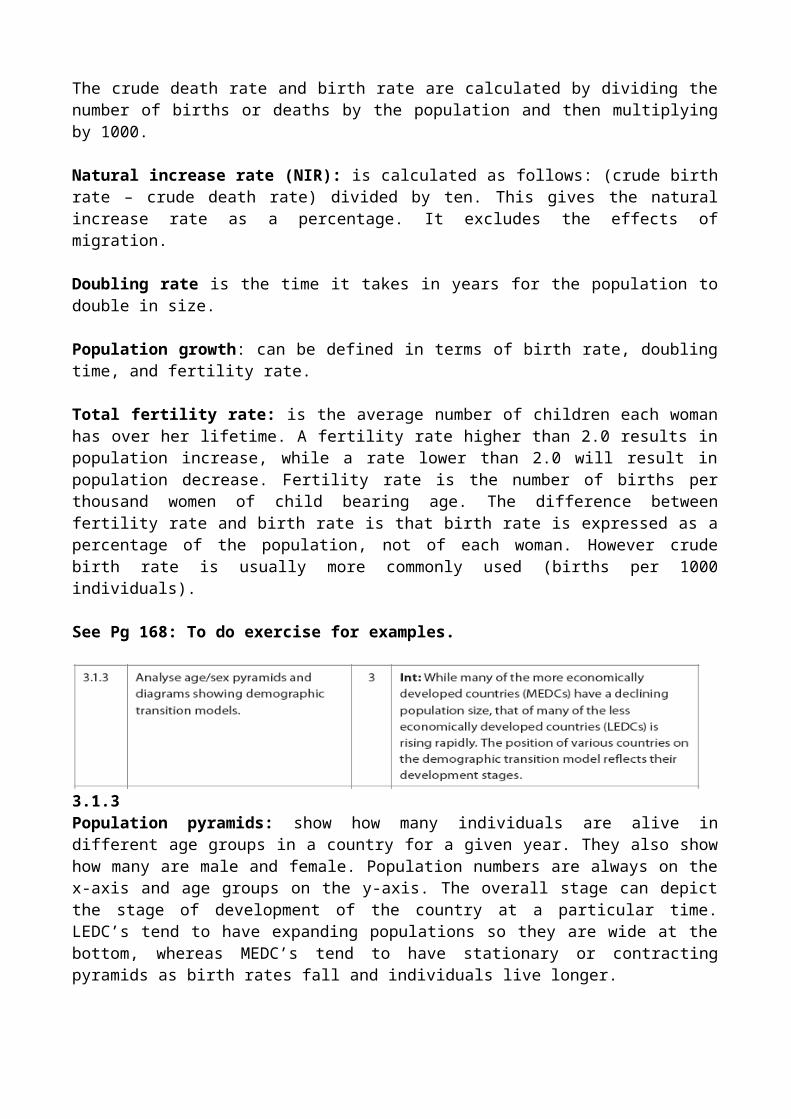
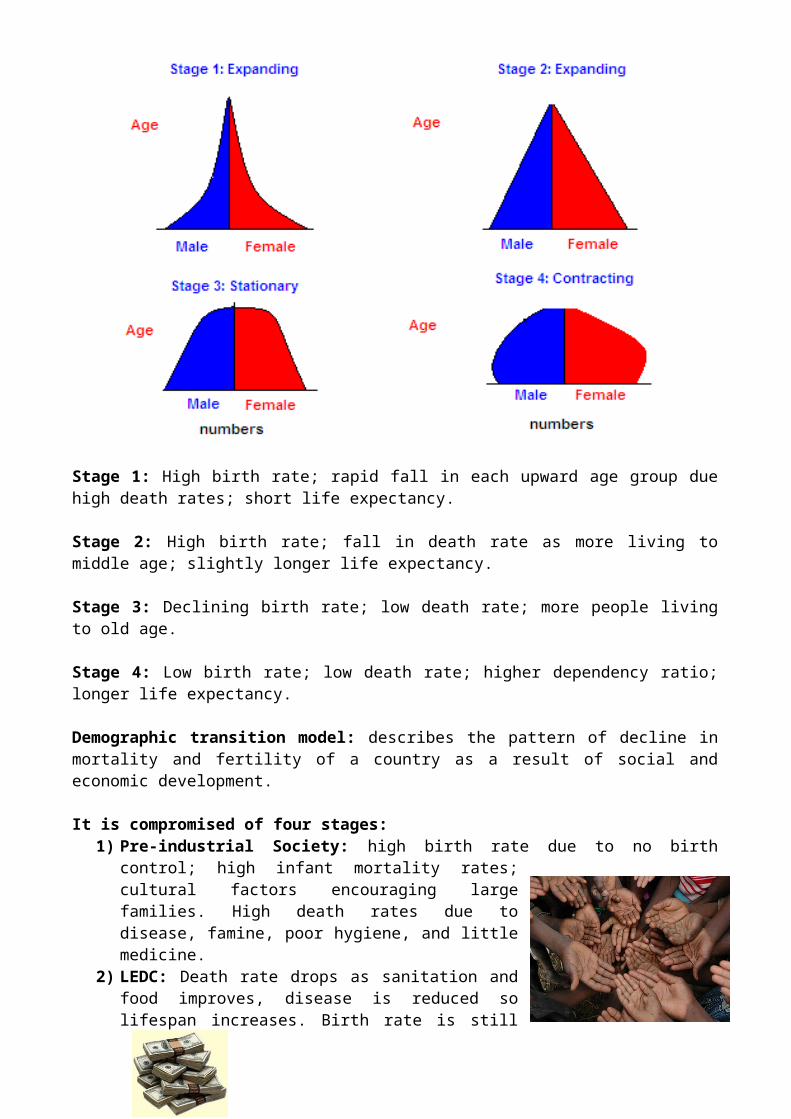
3.1.3Population pyramids: show how many individuals are alive in different age groups in a country for a given year. They also show how many are male and female. Population numbers are always on the x-axis and age groups on the y-axis. The overall stage can depict the stage of development of the country at a particular time. LEDC’s tend to have expanding populations so they are wide at the bottom, whereas MEDC’s tend to have stationary or contracting pyramids as birth rates fall and individuals live longer.
Stage 1: High birth rate; rapid fall in each upward age group due high death rates; short life expectancy.
Stage 2: High birth rate; fall in death rate as more living to middle age; slightly longer life expectancy.
Stage 3: Declining birth rate; low death rate; more people living to old age.
Stage 4: Low birth rate; low death rate; higher dependency ratio; longer life expectancy.
Demographic transition model: describes the pattern of decline in mortality and fertility of a country as a result of social and economic development.
It is compromised of four stages:1) Pre-industrial Society: high birth rate due to no birth control; high infant mortality rates;
cultural factors encouraging large families. High death rates due to disease, famine, poor hygiene, and little medicine.
2) LEDC: Death rate drops as sanitation and food improves, disease is reduced so lifespan increases. Birth rate is still high so population expands rapidly and child mortality falls due to
improved medicine.3) Wealthier LEDC: As a country becomes
more developed, birth rates also fall due to access to contraception, improved health care, education, emancipation of women. Population begins to level off and desire for material goods and low infant death rates mean
that people have smaller families. 4) MEDC: low birth rates and death rates. Industrialized countries. Stable population sizes.5) MEDC: Population may not be replaced as fertility rate is low. Problems of aging workforce.
The model seeks to explain changes in some countries but not others. Some countries due to war and civil unrest do not follow the model. It has been criticized as extrapolating the European model worldwide.
3.1.4Models may be very generalized and simple to use, or so complex that they are difficult to use. They should present the significant factors without extra detail that may confuse people. They should serve to help us make predictions and sense of the real world. There are various population growth models including computer models. All of these models have their advantages and disadvantages. Most criticisms are based on the fact that they are over simplified or represent only certain types of populations for example only LEDC’s or MEDC’s. Pyramids are a fairly useful graphical representation of populations and their demographics. Extrapolation of population curves is often rather inaccurate but doe serve to assist us in making predictions and while they often over-exaggerate the problem this often serves to inspire quicker action and solutions.
3.2.1
Natural Income: refers to the yield or harvest or services provided by the environment. The most important aspect of natural income is that it is natural and we do not need to give anything to get it, we only need look after it. Therefore the Earth has presented us with a wealth of resources which we can and do profit from. They will also continue to produce ‘profit’ for us if we utilize them in a sustainable manner.
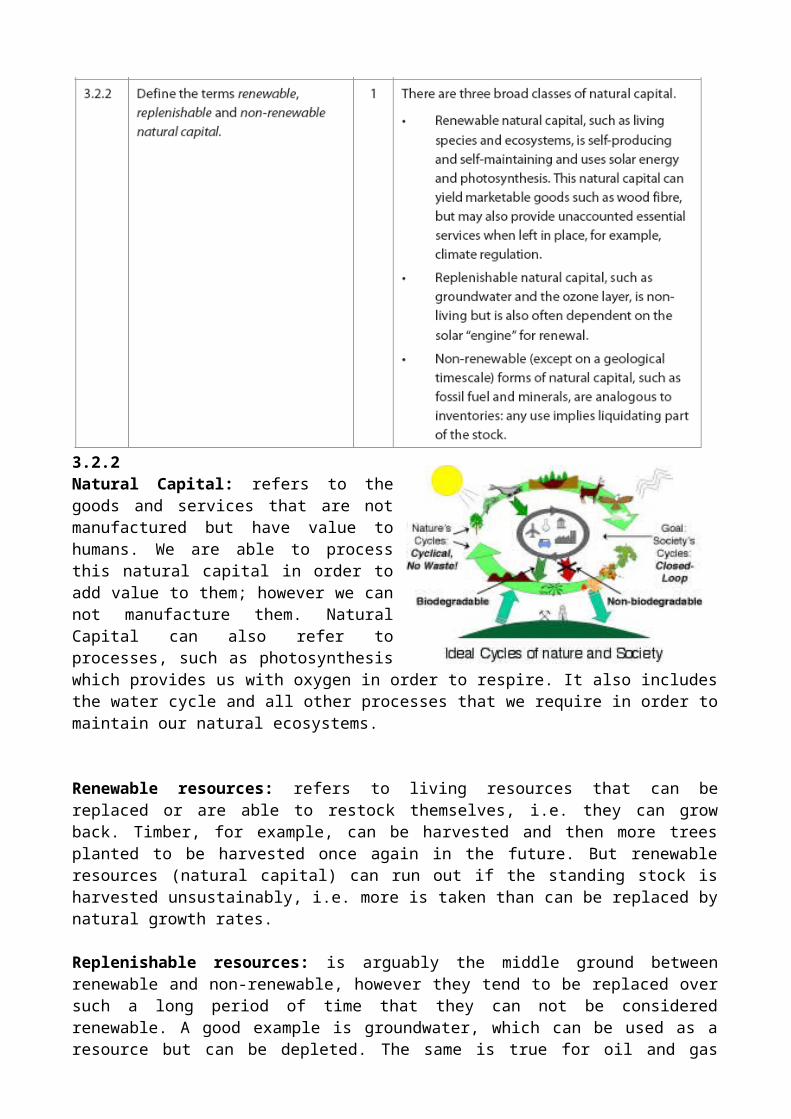
3.2.2Natural Capital: refers to the goods and services that are not manufactured but have value to humans. We are able to process this natural capital in order to add value to them; however we can not manufacture them. Natural Capital can also refer to processes, such as photosynthesis which provides us with oxygen in order to respire. It also includes the water cycle and all other processes that we require in order to maintain our natural ecosystems.
Renewable resources: refers to living resources that can be replaced or are able to restock themselves, i.e. they can grow back. Timber, for example, can be harvested and then more trees planted to be harvested once again in the future. But renewable resources (natural capital) can run out if the standing stock is harvested unsustainably, i.e. more is taken than can be replaced by natural growth rates.
Replenishable resources: is arguably the middle ground between renewable and non-renewable, however they tend to be replaced over such a long period of time that they can not be considered renewable. A good example is groundwater, which can be used as a resource but can be depleted. The same is true for oil and gas which can be depleted however they will not replenish themselves. Water can be considered either a renewable resource if you live in an area which experiences plentiful rainfall, or a replenishable resource if you live in a desert area where aquifers take time to replenish.
Non-renewable resource: are resources that exist in finite amounts on Earth and are not renewed or replaced after they are depleted. These include fossil fuels such as oil, gas, and coal. As the resources are used the natural capital or stocks are depleted.
3.2.3The importance of a resource varies with time. Resource available now may not be available in the future; likewise a resource available in the past may not be available today. The value of resources changes with time too. Technocentrics believe that new discoveries will provide new solutions to old problems, for example, harvesting algae as a food source. Arrowheads made from flint rock are no longer in demand and Uranium for nuclear power generation is.
Resources can be valued in several ways: Economic: having marketable goods or services, e.g. timber and food. Ecological: providing life-support services, e.g. water storage and gas exchange by plants. Scientific/technological: useful for applications, e.g. genetic, medicinal use. Intrinsic: having cultural, aesthetic, spiritual or philosophical values.
The main issue revolving around resources and resource use is that of sustainability. Are we using a resource in a sustainable manner? Agriculture or logging might be viewed as being sustainable, however if the soil fertility and structure degrades over time, and the forests are enable to replenish themselves, it is no longer sustainable. The key is to harvest below the maximum sustainable yield, i.e. the amount that nature is able to replace.
3.2.4Since the early 1980’s UNEP has been attempting to utilise a system of intergrated environmental and economic accounting (or socio-economic environmental assessment – SEEA) to try and value the environment and track resource depletion. If countries would include the cost of degrading their natural environments and resources within
their GNP (gross national product) the real cost and health of a nation would be clearer to see. By acknowledging our environmental impact as a cost we can better make decisions on what is or is not profitable to our nations and our people in the long run.
SEE ALSO ABOVE INFORMATION
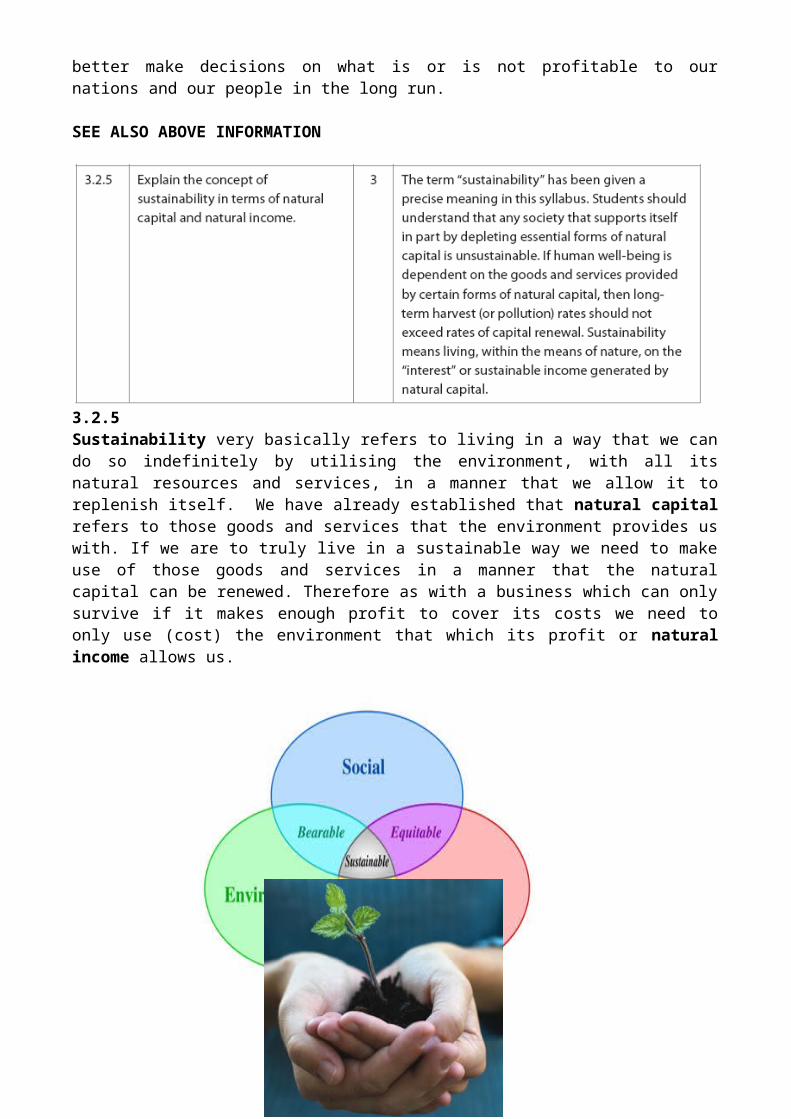
3.2.5Sustainability very basically refers to living in a way that we can do so indefinitely by utilising the environment, with all its natural resources and services, in a manner that we allow it to replenish itself. We have already established that natural capital refers to those goods and services that the environment provides us with. If we are to truly live in a sustainable way we need to make use of those goods and services in a manner that the natural capital can be renewed. Therefore as with a business which can only survive if it makes enough profit to cover its costs we need to only use (cost) the environment that which its profit or natural income allows us.
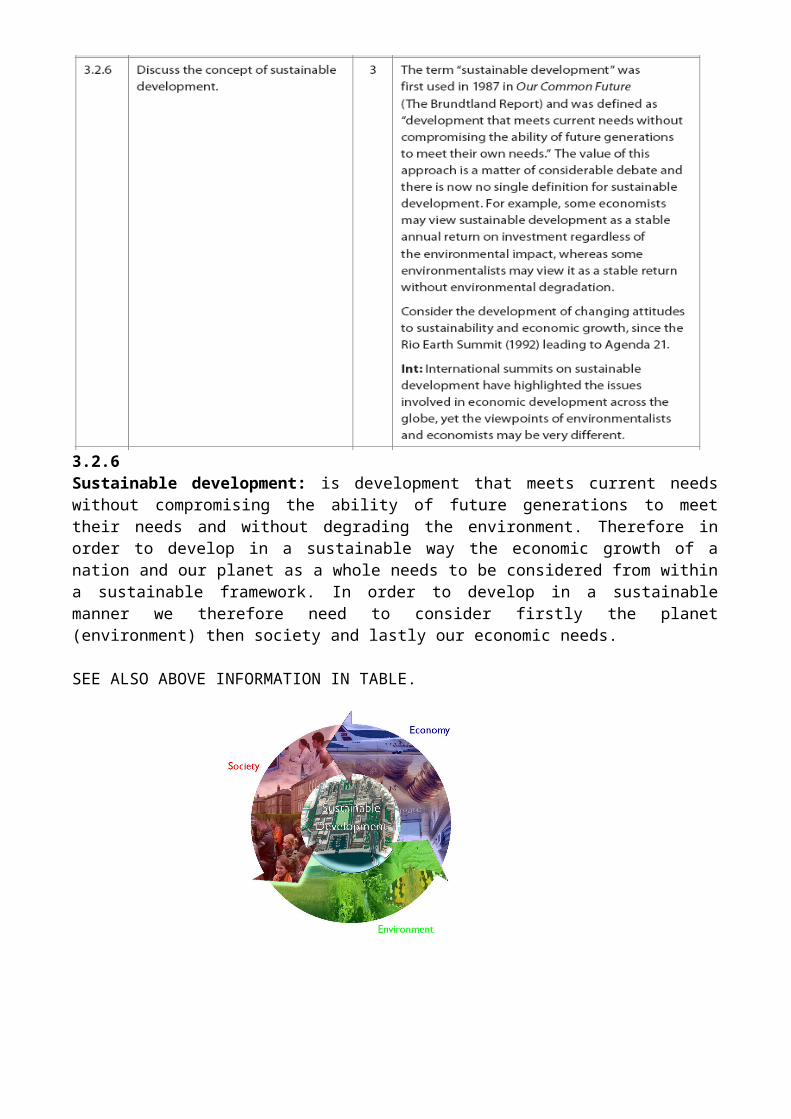
3.2.6Sustainable development: is development that meets current needs without compromising the ability of future generations to meet their needs and without degrading the environment. Therefore in order to develop in a sustainable way the economic growth of a nation and our planet as a whole needs to be considered from within a sustainable framework. In order to develop in a sustainable manner we therefore need to consider firstly the planet (environment) then society and lastly our economic needs.
SEE ALSO ABOVE INFORMATION IN TABLE.
3.3.1All our energy on Earth originates with the sun. The sun’s energy drives the climate, geochemical cycles (carbon, nitrogen, phosphorous, etc…), photosynthesis, animal life, and everything else. Humans obtain their energy from the sun via plants and via fossilised plants in the form of fossil fuels. Fossil fuels are sources of stored energy from the sun, from remains of organic life from millions of years ago, which can now be extracted and burned by humans. Oil is our greatest source of energy at the moment, supplying 37% of all energy demands. Coal is the
next with 25% and then natural gas with 23%. Fossil fuels therefore power 80% of the world’s economy. The other energy comes from nuclear (about 5%) and renewable resources (about 15%). Of the 15% of renewable energy 3% comes from
burning biomass, 3% from hydro-electric power, and the other sources (solar, wind, geothermal) provide the remainder. Obviously fossil fuels will not last forever and estimates predict the following:
Oil – 50 years Natural gas – 70 years Coal – 250 years
However these estimates are all dependent on how much we use and how fast as well as the technologies that are developed. What is for certain is that we will run out.
3.3.2Evaluate the advantages and disadvantages of two contrasting energy resourcesEnergy Source From Advantages Disadvantages
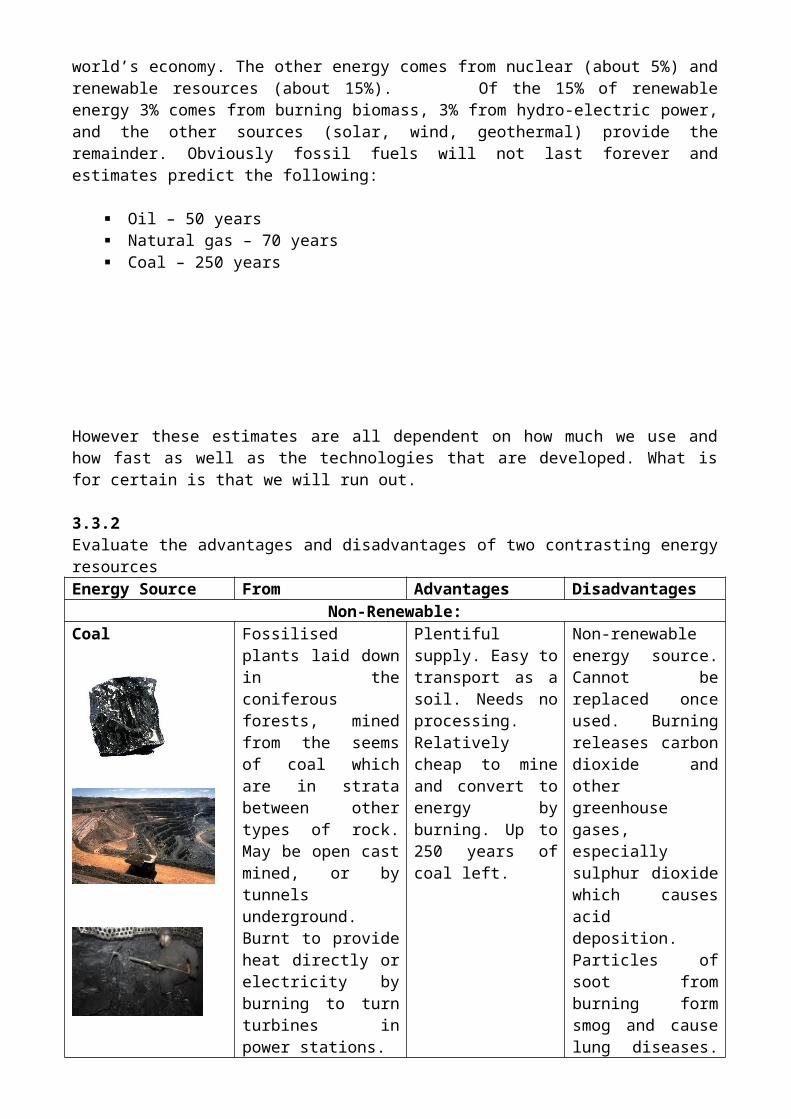
Non-Renewable:Coal Fossilised plants laid
down in the coniferous forests, mined from the seems of coal which are in strata between other types of rock. May be open cast mined, or by tunnels underground. Burnt to provide heat directly or electricity by burning to turn turbines in power stations.
Plentiful supply. Easy to transport as a soil. Needs no processing. Relatively cheap to mine and convert to energy by burning. Up to 250 years of coal left.
Non-renewable energy source. Cannot be replaced once used. Burning releases carbon dioxide and other greenhouse gases, especially sulphur dioxide which causes acid deposition. Particles of soot from burning form smog and cause lung diseases. Coal mines degrade the environment. Lower heat of combustion than other fossil fuels, i.e. less energy released per unit mass.
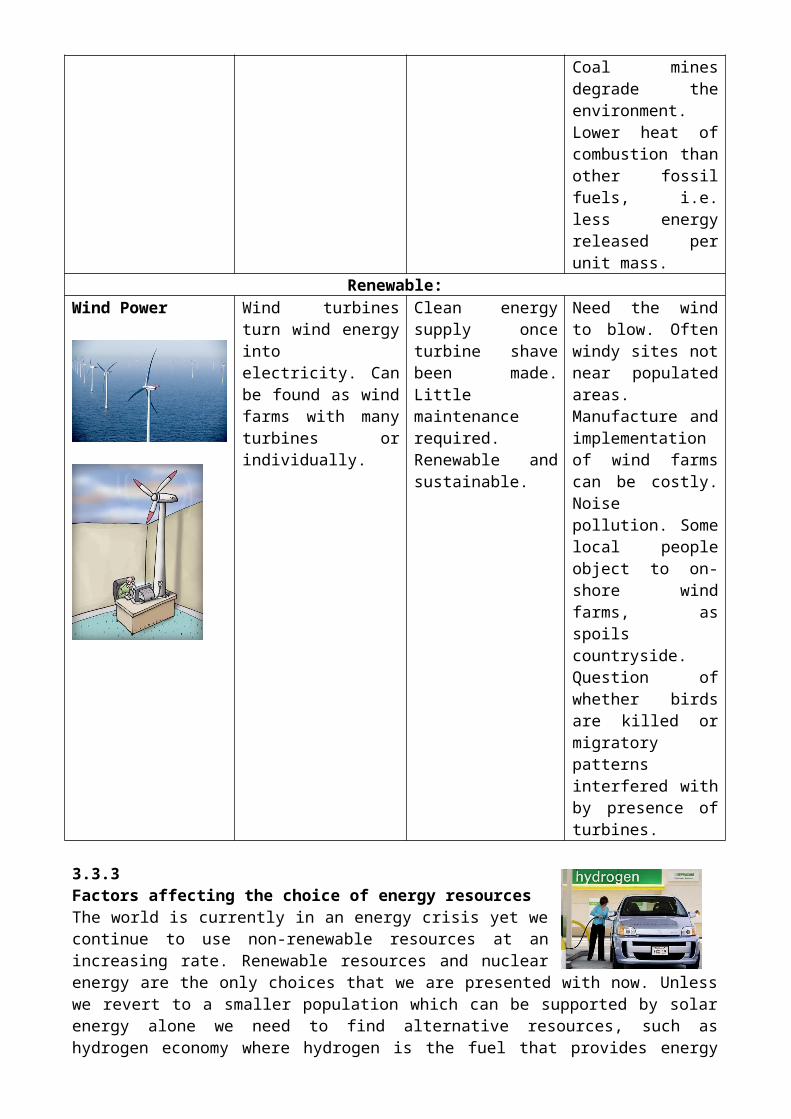
Renewable:Wind Power Wind turbines turn
wind energy into electricity. Can be found as wind farms with many turbines or individually.
Clean energy supply once turbine shave been made. Little maintenance required. Renewable and sustainable.
Need the wind to blow. Often windy sites not near populated areas. Manufacture and implementation of wind farms can be costly. Noise pollution. Some local
people object to on-shore wind farms, as spoils countryside. Question of whether birds are killed or migratory patterns interfered with by presence of turbines.
3.3.3Factors affecting the choice of energy resourcesThe world is currently in an energy crisis yet we continue to use non-renewable resources at an increasing rate. Renewable resources and nuclear energy are the only choices that we are presented with now. Unless we revert to a smaller population which can be supported by solar energy alone we need to find alternative resources, such as hydrogen economy where hydrogen is the fuel that provides energy for transport, industry and electrical generation. There prototype engines and cars that use hydrogen fuel releasing water as their waste product. But hydrogen is highly flammable and therefore difficult to handle and transport.
In nuclear fusion, energy can be released by the fusion of two nuclei of light elements, e.g. hydrogen. In theory we could generate energy sustainably in this way. Obviously we need to look to renewable and therefore sustainable ways to generate the energy we require in order to satisfy our needs and the need to take care of the environment.
Nuclear fusion
3.4.1Soil is a very important abiotic factor in any ecosystem, without adequate soil no ecosystem can function in a stable and sustainable manner. Soil is made up of four major components, namely:
Mineral particles mainly from underlying rock Organic remains of dead plants and animals Water in the spaces between soil particles
Air in the spaces between soil particles
Soil provides a habitat for not only plants but also burrowing animals such as invertebrates, micro-organisms, and larger animals such as rabbits, moles, meerkats, etc….We can therefore say that they are constitutes of the soil along with air, water, humus (decomposed organic matter), and rock particles.
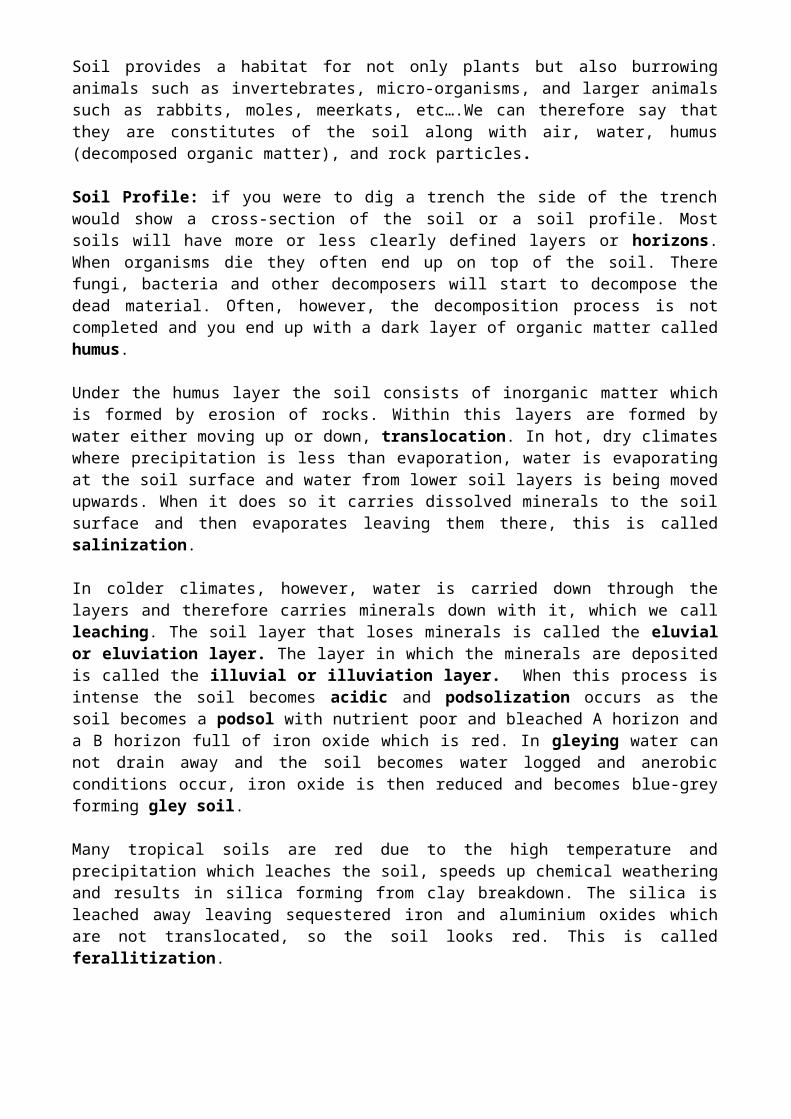
Soil Profile: if you were to dig a trench the side of the trench would show a cross-section of the
soil or a soil profile. Most soils will have more or less clearly defined layers or horizons. When organisms die they often end up on top of the soil. There fungi, bacteria and other decomposers will start to decompose the dead material. Often, however, the decomposition process is not completed and you end up with a dark layer of organic matter called humus.
Under the humus layer the soil consists of inorganic matter which is formed by erosion of rocks. Within this layers are formed by water either moving up or down, translocation. In hot, dry climates where precipitation is less than evaporation, water is evaporating at the soil surface and water from lower soil layers is being moved upwards. When it does so it carries dissolved minerals to the soil surface and then evaporates leaving them there, this is called salinization.
In colder climates, however, water is carried down through the layers and therefore carries minerals down with it, which we call leaching. The soil layer that loses minerals is called the eluvial or eluviation layer. The layer in which the minerals are deposited is called the illuvial or illuviation layer. When this process is intense the soil becomes acidic and podsolization occurs as the soil becomes a podsol with nutrient poor and bleached A horizon and a B horizon full of iron oxide which is red. In gleying water can not drain away and the soil becomes water logged and anerobic conditions occur, iron oxide is then reduced and becomes blue-grey forming gley soil.
Many tropical soils are red due to the high temperature and precipitation which leaches the soil, speeds up chemical weathering and results in silica forming from clay breakdown. The silica is leached away leaving sequestered iron and aluminium oxides which are not translocated, so the soil looks red. This is called ferallitization.
Soil Horizons: O horizon: many soils also contain an uppermost layer of newly added organic matter such
as leaf litter. This is called the O horizon. A horizon: upper layer. This is where many soils humus builds up. Humus that contains a
high quantity of alkaline mineral is called mull humus whereas that which contains low alkaline minerals forms acidic mor humus.
E horizon: is not always present but in older soils it is the layer where minerals and organic matter have been leached from the soil, leaving a pale layer which is mostly silica.
B horizon: is the layer where soluble minerals and organic matter tend to be deposited from the layer above. In particular clay and iron salts can be deposited here.
C horizon: mainly weathered rock from which the soil forms. R horizon: parent material (bedrock or other medium).
SEE ALSO ABOVE INFORMATION IN TABLE
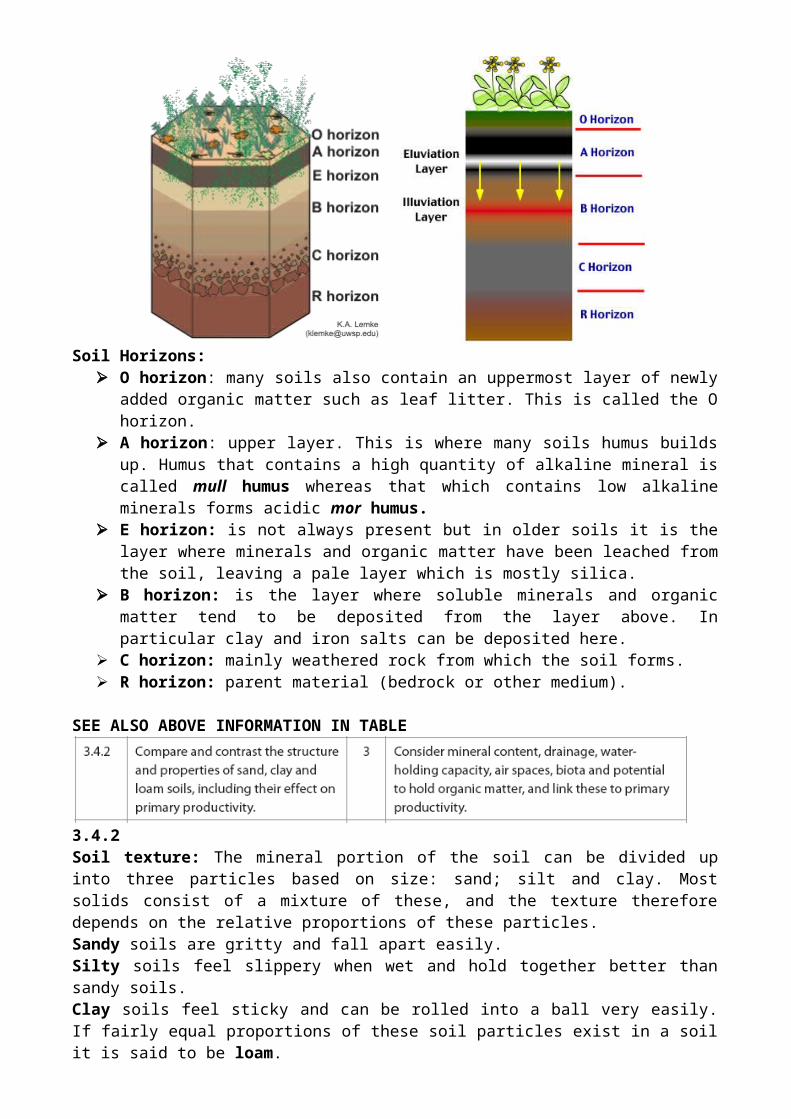
3.4.2Soil texture: The mineral portion of the soil can be divided up into three particles based on size: sand; silt and clay. Most solids consist of a mixture of these, and the texture therefore depends on the relative proportions of these particles. Sandy soils are gritty and fall apart easily. Silty soils feel slippery when wet and hold together better than sandy soils. Clay soils feel sticky and can be rolled into a ball very easily. If fairly equal proportions of these soil particles exist in a soil it is said to be loam. Loam soils are fairly fertile, drain well and can be worked easily, which makes them the soil of choice for agricultural use. Soil texture determines the soil’s fertility and primary productivity. Loam soils encompass the best qualities of all three types of soil particles. The sand particles ensure good drainage and a good air supply to the roots. The clay soil retains water (water-holding capacity) and supplies nutrients. The silt particles help to hold the sand and clay particles together.
Sandy soil Clay soil Loam soilComposition (%)Sand 100 15 40Silt 15 20Clay 70 40Mineral Content High High IntermediatePotential to hold organic matter
Low Low Intermediate
Drainage Very Good Poor GoodWater-holding capacity
Low Very High Intermediate
Air Spaces Large Small IntermediatePlants and Animals Low Low HighPrimary Productivity Low Quite Low High
3.4.3 Soil degradationIt could be argued that land degradation is the most pressing environmental and social problem facing society today. For the world’s poor, soil and soil fertility and therefore productivity is the most pressing issue In addition the depletion of fuel wood supplies due to unsustainable rates of use, lack of drinking water and poor sanitation, all of which can be linked to poor soil management. As populations expand and as the social and cultural changes occur, ever greater demands are being made on greater areas of landscape and soil.
Two types of processes can give rise to soil degradation: Processes that take away the soil (erosion). This mainly occurs when there is no vegetation
on the soil. Wind and water can then simply take the soil away. Processes that make soil less suitable for use. In these processes chemicals end up in the
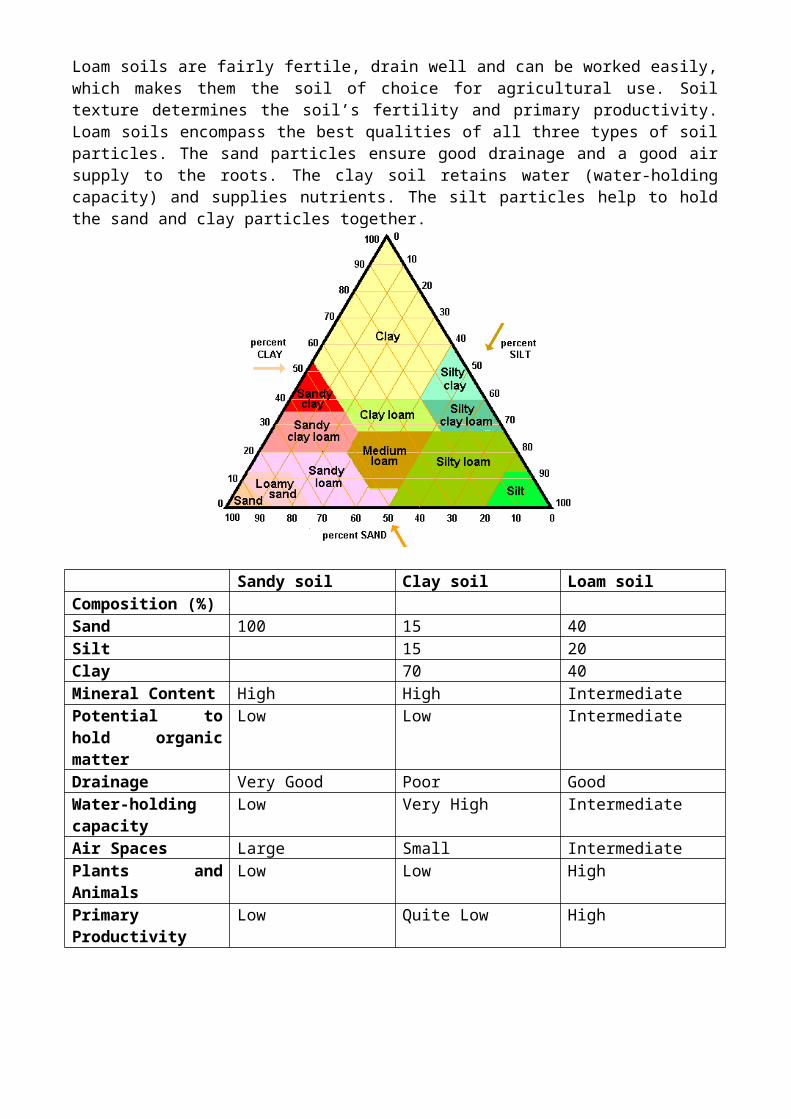
soil and make the soil useless in the long run.Soil Erosion:Three major processes of soil erosion exist:
1) Sheet wash: large areas of surface soil are washed away during heavy storms, moving as landslides in mountainous areas
2) Gullying: channels develop following rainfall. Over time these channels become larger.
3) Wind erosion: on drier soils high winds continually remove the surface layer.
Each of these processes can be triggered by a number of causes. Examples of human activities that lead to soil degradation are: overgrazing and overcropping; deforestation; and unsustainable
agriculture. Overgrazing leads to a loss of plant life which is necessary to hold the soil together. Overcropping depletes soil nutrients, which reduces soil fertility as no nutrients are able to be returned to the soil. Deforestation is the removal of forests. Obviously the more trees that are removed the greater the soil erosion. The leaves of
trees and other plants deflect and slow down rain which would otherwise cut into the soil and cause greater amounts of soil to be
washed away. Unsustainable agriculture techniques are techniques that cannot be applied over a long period of time without decreasing productivity. Examples include: total removal of crops after harvest; growing crops in rows with gaps in between; ploughing in the direction of the slope; excessive use of pesticides; and irrigation, in many methods a lot of the water evaporates before the crops can absorb it.

3.4.4 Soil Conservation Measures
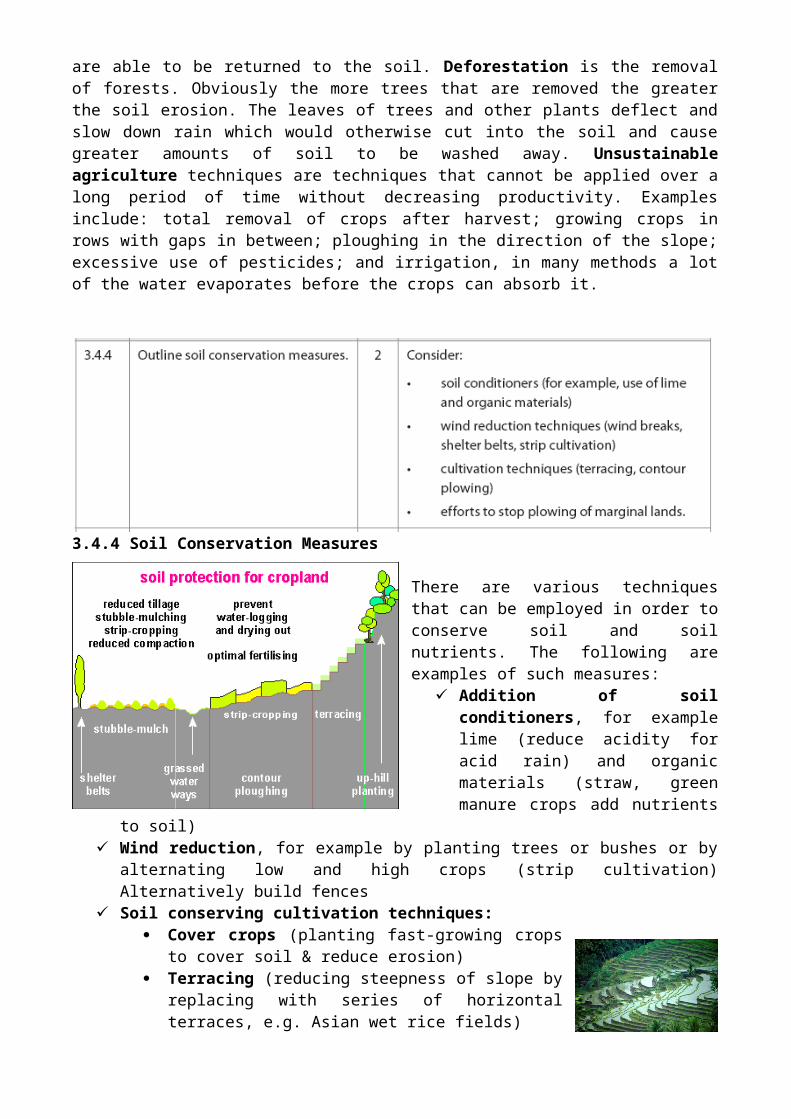
There are various techniques that can be employed in order to conserve soil and soil nutrients. The following are examples of such measures:
Addition of soil conditioners, for example lime (reduce acidity for acid rain) and organic materials (straw, green manure crops add nutrients to soil)
Wind reduction, for example by planting trees or bushes or by alternating low and high crops (strip cultivation) Alternatively build fences
Soil conserving cultivation techniques: Cover crops (planting fast-growing crops to cover soil &
reduce erosion) Terracing (reducing steepness of slope by replacing with
series of horizontal terraces, e.g. Asian wet rice fields)
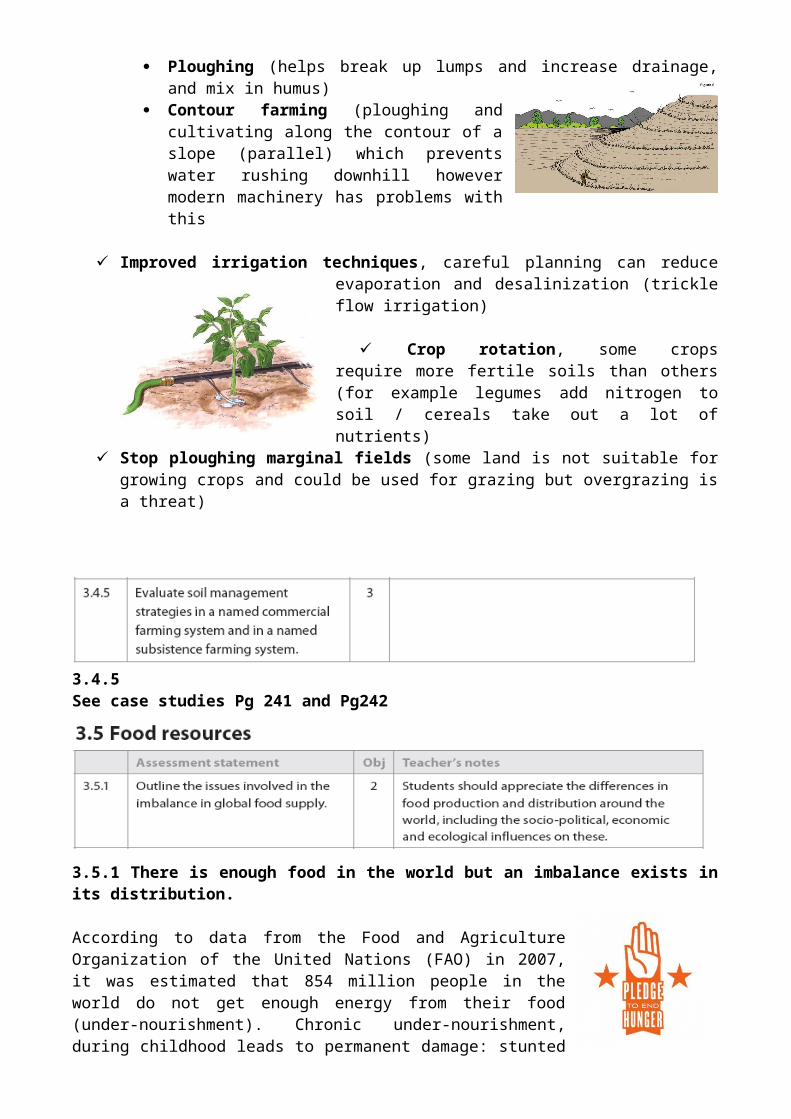
Ploughing (helps break up lumps and increase drainage, and mix in humus)
Contour farming (ploughing and cultivating along the contour of a slope (parallel) which prevents water rushing downhill however modern machinery has problems with this
Improved irrigation techniques, careful planning can reduce evaporation and desalinization (trickle flow irrigation)
Crop rotation, some crops require more fertile soils than others (for example legumes add nitrogen to soil / cereals take out a lot of nutrients)
Stop ploughing marginal fields (some land is not suitable for growing crops and could be used for grazing but overgrazing is a threat)
3.4.5See case studies Pg 241 and Pg242
3.5.1 There is enough food in the world but an imbalance exists in its distribution.
According to data from the Food and Agriculture Organization of the United Nations (FAO) in 2007, it was estimated that 854 million people in the world do not get enough energy from their food (under-nourishment). Chronic under-nourishment, during childhood leads to permanent damage: stunted growth, mental retardation, and social and developmental disorders. Many are also suffering from malnutrition (enough energy but not enough essential nutrients).
In many MEDCs, the cost of food is relatively cheap and people choose food based on preference not nutritional need. Seasonal foods have almost disappeared as foods are readily available all year
round. Modern technology and transport systems mean that foreign foods can be bought in almost any market. In LEDCs, many populations struggle to produce enough food to sustain them. Arable land is scarce. There may also be political agendas as well as simple environmental limitations on food production. Crops that are grown are often exported for profit (cash cropping) and not for the local communities. Arable land is in finite supply. There are large
differences in food production in the world (SEE Pg 246 Fig. 13.3) but distribution is the problem. Countries like USA, Canada, and Australia produce more food than they need but who should pay for it to be distributed to poorer countries in need such as Bangladesh, Sudan and Ethiopia. The political angle attached to this means that perhaps the receiving country maybe in the others debt, and prone to exploitation. Who decides who gets this food? These are issues that revolve around the topic of food distribution.
The diets of MEDCs and LEDCs, differ as well. MEDCs average calorie intake is about 3314 whereas LEDCs is only about 2666 per day (see table below). As we adapt more and more of the net primary productivity on Earth to human needs, use and degrade more land, demand more meat, we must be reaching our limits.
Food Composition (%)MEDCs LEDCs
Meat 12.9 7.3Fish/Seafood 1.4 0.9Cereals 37.3 56.1
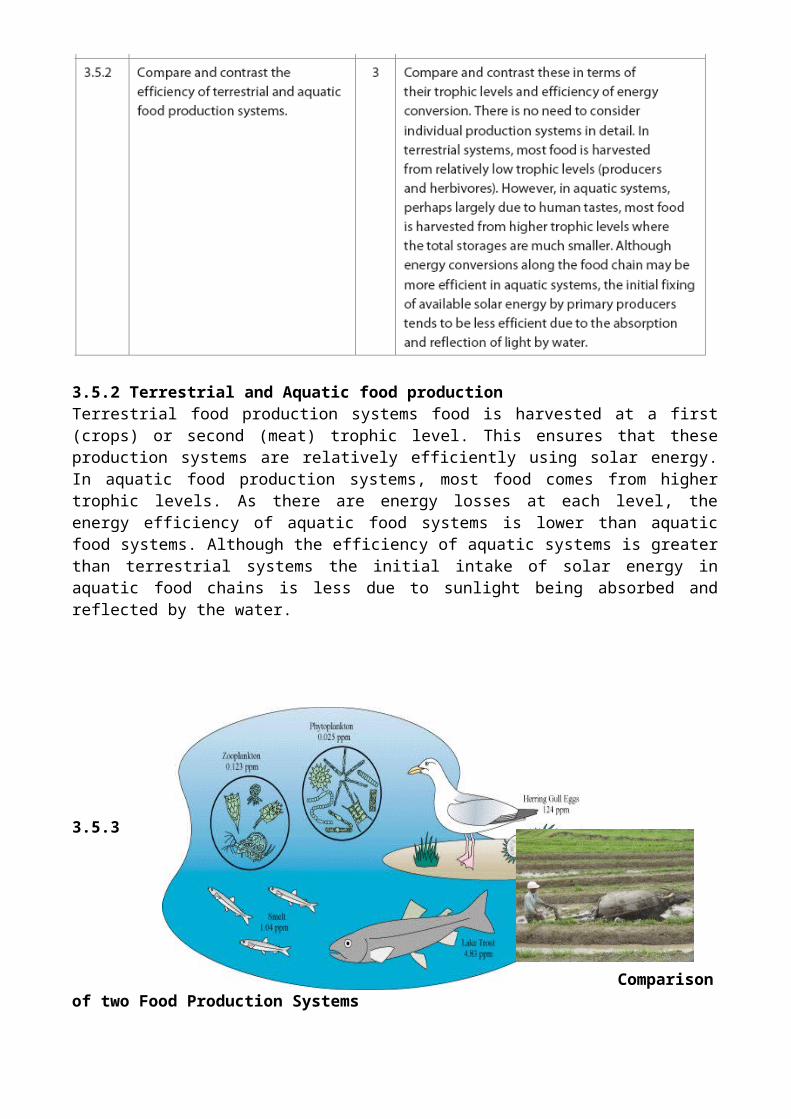
3.5.2 Terrestrial and Aquatic food productionTerrestrial food production systems food is harvested at a first (crops) or second (meat) trophic level. This ensures that these production systems are relatively efficiently using solar energy. In aquatic food production systems, most food comes from higher trophic levels. As there are energy losses at each level, the energy efficiency of aquatic food systems is lower than aquatic food systems. Although the efficiency of aquatic systems is greater than terrestrial systems the initial intake of solar energy in aquatic food chains is less due to sunlight being absorbed and reflected by the water.
3.5.3
Comparison of two Food Production Systems
Traditional, extensive rice production in Indonesian Borneo: characterized by low inputs of energy and chemicals, high labour intensity and low productivity. Rice yield is low, however, the energy efficiency is high (energy output over energy input). As no fertilisers or pesticides are used, the rice yield is the only output (no pollution).
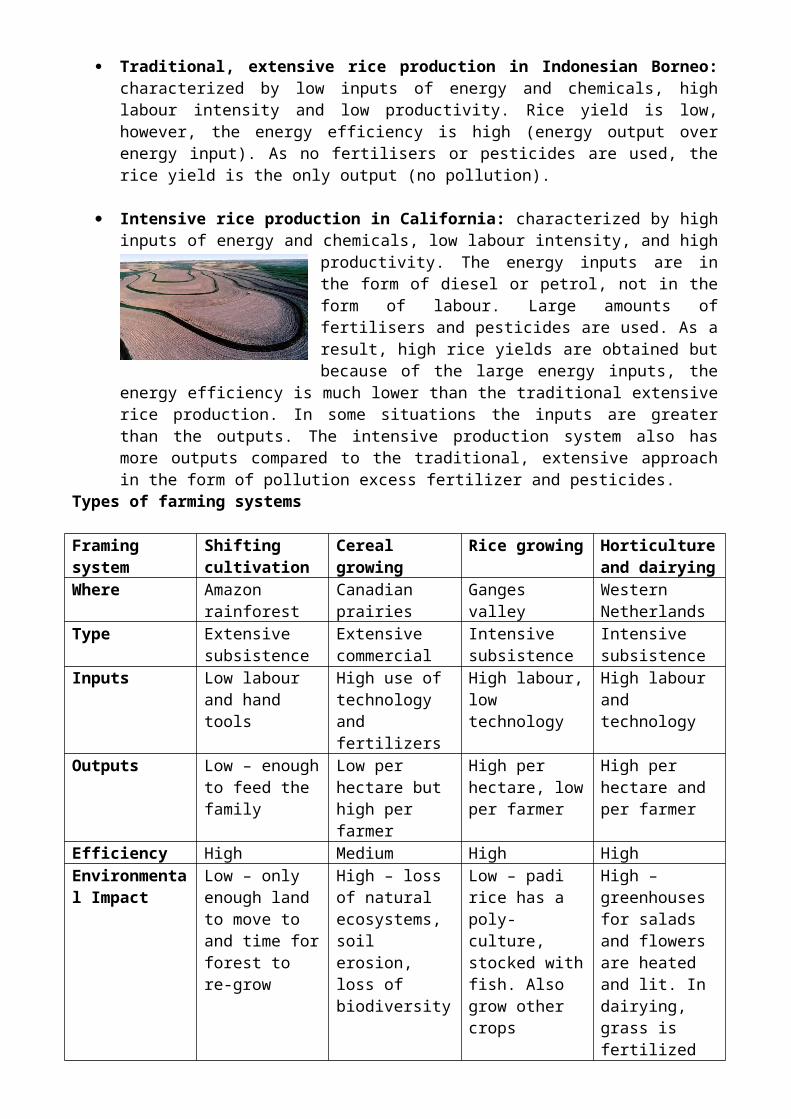
Intensive rice production in California: characterized by high inputs of energy and chemicals, low labour intensity, and high productivity. The energy inputs are in the form of
diesel or petrol, not in the form of labour. Large amounts of fertilisers and pesticides are used. As a result, high rice yields are obtained but because of the large energy inputs, the energy efficiency is much lower than the traditional extensive rice production. In some situations the inputs are greater than the outputs. The intensive production system
also has more outputs compared to the traditional, extensive approach in the form of pollution excess fertilizer and pesticides.
Types of farming systems
Framing system Shifting cultivation
Cereal growing Rice growing Horticulture and dairying
Where Amazon rainforest
Canadian prairies Ganges valley Western Netherlands
Type Extensive subsistence
Extensive commercial
Intensive subsistence
Intensive subsistence
Inputs Low labour and hand tools
High use of technology and fertilizers
High labour, low technology
High labour and technology
Outputs Low – enough to feed the family
Low per hectare but high per farmer
High per hectare, low per farmer
High per hectare and per farmer
Efficiency High Medium High HighEnvironmental Impact
Low – only enough land to move to and time for forest to re-grow
High – loss of natural ecosystems, soil erosion, loss of biodiversity
Low – padi rice has a poly-culture, stocked with fish. Also grow other crops
High – greenhouses for salads and flowers are heated and lit. In dairying, grass is fertilized and cows produce waste
3.5.4 Social systems and food production
What determines how we produce food?
There are many factors that come into consideration as to the method and level of sustainability of food production methods. Population density/size, culture, soil fertility, and method of agriculture are some of these factors. If the population density in an area or country is high then the number of people that that need food is high. Thus the demand is high, which usually leads to intensive farming practices which incorporate the use of fertilizers, machinery and possibly genetically modified seed in order to maximise yields. If the population density is low then the need is lower and the stress needed to be placed on the land is lower, which eliminates the need for intensive agricultural practices. Culture also has a role to play. Some cultures and traditions have higher demands for meat some for grains. The cultures that require more meat are going to need more land and resources, as it takes more energy to produce meat. Those cultures or traditions where more grains are consumed will require less energy and therefore less intensive methods (depending on the population size). The greater the demands fro crops or live stock the greater the demands placed on the soil. Therefore different agricultural methods have to be considered in order to maintain viable fertile soils. Shifting cultivation refers to moving from one site to another for long enough to give the ecosystem and therefore the soil enough time to recover before the next crop is harvested. This is possible if the population size, and therefore the demand for food, is small, however, is not always possible for larger populations. For some nations food systems represent a significant proportion of their GDP and therefore their economy relies on high food production yields. Therefore the focus is more on turning a profit than on the sustainable use of the land. All these factors need to be taken into consideration and balanced if the food production method of choice is to be both viable and sustainable.
3.6.1 Earth’s water budget
About 70% of the Earth’s surface is covered by water. Only about 3% of water is fresh and 97% salt water from the oceans. About 69% of the fresh water stores are contained in polar ice caps and glaciers and about 30% in ground water. Water contained on the surface of Earth,
in lakes, rivers and swamps, is only about 0.3% of the total. The atmosphere only holds 0.001% of the Earth’s total water volume.
3.6.2Sustainable use of a resource refers to using a resource in a manner that is slower than the rate at which it is reformed.
See above and Case Studies on pages 218-222
3.7.1Carrying capacity: is defined as the maximum number or load of individuals that an environment can sustainably carry or support. The major problems associated with attempting to predict the human carry capacity are the fact that humans use a huge variety of resources and can which from one to another at any point and when required by needs. The other problem is that humans can import resources from other environments so therefore not all our requirements have to come from our immediate environment. Importing resources raises the carrying capacity of the local community or population but has no effect on the global carrying capacity.
Ecocentric thinkers attempt to find ways to reduce their non-renewable resource use and attempt to use more renewable energy and thus reduce their impact on the carrying capacity.
Technocentric thinkers believe that the human carrying capacity can be expanded continuously through technological innovation and development. Conventional economists argue that trade and technology increase the carrying capacity. However, ecological economists believe that the efficiency of use of resources can be increased however the carrying capacity is set and that any developments can not be done sustainably.
See also above information in table
3.7.2Humans can reduce their environmental demands by reuse, recycling, remanufacturing, and absolute reductions in energy and material use.
Reuse: the object is used more than once. Examples include reuse of soft drink bottles (after cleaning) and second-hand cars.
Recycling: the object’s material is used again to manufacture a new product, an example of this is the use of plastic bags to make plastic poles for gardens. A second example is the recycling of aluminium. Obtaining aluminium from aluminium ore requires vast amounts of energy, as melting used aluminium to make new objects only takes a fraction of this energy recycling saves a lot of energy. However this increases the human carrying capacity.
Remanufacturing: the object’s material is used to make a new object of the same type, an example is the manufacturing of new plastic (PET) bottles from used ones.
Absolute reductions: means that we can use fewer resources, e.g. use less energy or less paper. Unfortunately the advantages of reductions in resource use, i.e. increased carrying capacity, are often eroded by population increase.
3.8.1 Ecological footprintThe ecological footprint of a population is the area of land that would be required to sustainably provide all of a particular population’s resources and assimilate (absorb and process) all its wastes. This is the inverse of carrying capacity (the population size that an area can sustainably support). It provides us with a quantitative estimate of the human carrying capacity.
See also above information in table
3.8.3The ecological footprint of a country depends on several factors: its population size and consumption per capita, in other words, how many people and how much land each one uses, It includes the cropland and other land that is needed to grow food, grow biofuels, graze animals for meat, produce wood, dig up minerals and the area of land needed to absorb wastes, not just solid waste but water, sewerage and carbon dioxide. Countries can be viewed either as creditors or debtors. Creditors have smaller footprints than their biocapacity (living capacity or natural resources) and the debtors have larger footprints represented below by changing the sizes of the countries in proportion.
Debtors could be harvesting goods unsustainably in their own countries, importing goods and exporting wastes. The main factor to remember is that there is no such thing as throwing away (all wastes must go somewhere) on Earth as it is a closed system.
The US has the biggest footprint at 10.3 hectares with Australia second at 9.0. To
compare the average person in India has a footprint of 0.8 and in China 1.6 hectares. While China produces a lot of carbon emissions and has a high level of productivity because it has such a large population, per capita it does not have nearly the same impact on the planet as the US or Canada for example. The relationship between development and ecological footprint is fairly stable whereby LEDC’s generally have lower standards of living and therefore use less resources (for example eat less meat which requires more land to produce than grain) than the MEDC’s who use far more resources and produce more waste than their LEDC counterparts.
3.8.4 See above information
3.8.5The importance of resources varies over time. A resource available today may not be in the future. Technocentrics believe that new discoveries will provide new solutions to old problems. Resources can be valued in several ways:
Economic: having marketable value, e.g. timber and food
Ecological: providing life-support systems, e.g. water storage and gas exchange by forests Scientific/technological: useful for applications, e.g. genetic, and medicinal Intrinsic: having cultural, aesthetic, spiritual or philosophical values
Everything we do needs to be sustainable. Agriculture is only sustainable if the crops we grow can continue to grow in the same way. In other words we need soil fertility to be maintained and the environment overall not to be degraded, in order for it to be considered a sustainable practice. Any society that supports itself in part by depleting natural capital is unsustainable. There are finite amounts of materials on Earth and we are using much of it in an unsustainable manner. At the moment we are in ecological overshoot as we are living off natural capital but not returning anything to the planet. This is not sustainable. We are consuming resources too fast and even with technological advances we are not acting wisely. Technological advances or developments only achieve an increased carrying capacity. They help to meet the current demands; however, they do not consider future consequences. Even with technology we are not accounting for the damage we are doing to the planet. Until material economic growth becomes of secondary importance
to sustainability then our extinction is a major concern.


![Annie Unsworth - Economics Notes Topic 3.Docx[1]](https://img.dokumen.tips/doc/110x75/577d255b1a28ab4e1e9e9a17/annie-unsworth-economics-notes-topic-3docx1.jpg)