Embed Size (px)
Citation preview

Winter 2011
SHAREOWNER Top StockCase StudiesSince 1987
TECH WORLDElectronic Componentsand Equipment Sector
PC GUTS AND GLORYComputer Hardware Sector
Plus Case Studies onNetflix, Pfizer andEcho Global
DesignSo
urce.co
m
4 SHAREOWNER Winter 2011
Case Study: An Overpriced Stock
NetflixIs this hot stock going to pay off or flame out?
(2) High Multiple. At the recent price, the stock trades atmore than 45 times projected EPS for 2011. That’s morethan three times the price-earnings valuation of the S&P500 (13 times projected 2011 EPS).
Growth Prospects
Growth in the company’s subscriber base is driven by:Advertising, strong brand recognition and positive word-of-mouth promotion. Consumer electronics partners. Users of set-top boxes(from Apple TV, Google TV and others) and gaming con-soles (from Microsoft, Nintendo and Sony) can watchNetflix’s content on their televisions. International Expansion. Netflix recently launched itsonline streaming service in Canada and expects to intro-duce its services overseas in 2011.
Improving Profitability. The company spends more than$500 million per year on mailing DVDs. This expense isexpected to decline significantly as more subscribers choosestreaming instead of DVD technology. The company predictsthat during the fourth quarter more Netflix content will beconsumed via streaming than on DVD. Streaming is also “scalable.” Movies and TV shows arelicensed from studios at a fixed cost. As Netflix expands itssubscriber base, the cost of content per subscriber falls.
However, the future is not all rosy for Netflix. Impedimentsto further growth include:
Increased Competition. Until recently, Netflix’s revenue andearnings growth were driven principally by its video-by-mailbusiness, where it faces little competition. In the future,growth is expected to come principally from its streamingbusiness. In addition to cannibalizing its video-by-mail busi-ness, streaming technology opens the “playing field” to com-petitors such as Amazon.com Inc., Hulu LLC. and others.
As well, cable companies (e.g. Comcast Corp. and TimeWarner Inc.) are improving their delivery of movie and TVcontent to limit the loss of customers to Netflix and otherstreaming services.
In the battle for “eyeballs” among cable companies andstreamers, selling prices are expected to fall. In addition,competition may drive up the prices that streamers and cablecompanies will have to pay to movie and TV studios forcontent.
Netflix has put together an impressive record of growthwith its innovative movie rental service. For a monthly
fee (usually $8 - $16) subscribers can rent an unlimitednumber of movies and TV shows from Netflix’s “library.”Customers can either receive a DVD in the mail or streamcontent over the Internet to their computer, television orsmartphone.
During the last decade, the subscriber base for the com-pany’s rental service increased from 100,000 to almost 17million. This unusually strong growth has made Netflix astock market darling. In the last two years, while the marketgained little, the stock’s price has increased from $20 to$170. Now, however, Netflix’s stock exhibits classic signs ofoverpricing.
(1) Visual. Chart 1 shows that the recent price has been wellabove the projected earnings per share (EPS) profile. Thisindicates that growth in the stock’s price has outpacedgrowth in the company’s earnings, a situation that cannotpersist. Over the longer term, it is growth in EPS that drivesgrowth in a stock’s price.
1.
2.
3.
DesignSo
urce.co
m

5SHAREOWNER Winter 2011
The Law of Diminishing Growth. Thereare about 115 million households inthe U.S., and approximately 15% sub-scribe to Netflix’s service. In theabsence of significant internationalgrowth, Netflix would have toincrease its penetration to roughlyone-third of U.S. households duringthe next five years to sustain its 20%historical revenue growth rate.
For context, the company’s mostmature market is the Bay Area (e.g.San Francisco and Oakland). There,about 23% of households are Netflixsubscribers.
Reliance on Debt. Since 2007, Netflixhas significantly increased its use ofdebt to finance EPS-enhancing sharebuybacks (see Chart 3). This means itnow has less capacity to use debtfinancing to support future growth.
Investment MeritThe table in Chart 1 reports thestock’s projected rate of return —from the recent price — based uponnine possible combinations of future
Chart 4: Asset Turnover
090807 06050403020100 10
(Revenue per $100 of Assets)
$68
$277
$117
00 01 02 03 04 05 06 07 08 09 2010 (E) 11 12 13 14 2015
$
0
20
40
Chart 1: Netflix Inc. (NFLX on NASDAQ; FYE December 31)
EPS
Revenue
P/E
PriceHi
20% $5.3M
$170.00
20%$7.20
$2.1B (E)
$2.89 (E)
$0.70
$20
$40$179
$997M
30%
25%
$10.74
$8.83
$36M
$25$30
EPS = Earnings Per Share
P/E = Price Earnings Ratio
Excluded Data Projected DataBenchmark Data
Annual Return
Illustrative5-Yr Projections
Stock PriceUpside Downside
3014%9%5%
2510%5%1%
5%1%
-3%
202015 EPS $10.74 $8.83 $7.20
2015 P/E
Chart 2: Earnings Retention Ratio
090807 06050403020100 10
(1 - Dividend Payout Ratio)
100% 100%
Chart 3: Reliance on Debt Financing
090807 06050403020100 10
(Assets per $100 of Equity)
$146
$401
$184
Chart 5: Net Profit Margin
090807 06050403020100 10
(Earnings per $100 of Revenue)
$2.39
$7.27
Chart 6: Return on Equity
090807 06050403020100 10
(Earnings per $100 of Equity)$80
$6
Improvement drivenlargely increasedreliance on debt.
Improvement reflects theshift to streaming andeconomies of scale.
Improvement due to increasedsubscriber base.
All earnings retained tofinance growth and sharerepurchases.
Average annual EPS growth, 44%;last year, 46% (E).
Average annual revenue growth, 20%;last year, 28% (E).
Recent move to an unusually high valuation.
Financial FundamentalsGrowth Fundamentals
Operating Fundamentals
Composite Fundamental
EPS and valuation.
The only combination that produces asomewhat attractive rate of returnrequires EPS growth to average atleast 30% over the next five years anda P/E ratio of 30 times EPS in 2015.Such growth and valuation are typi-cally unsustainable for such a lengthyperiod, frequently because they attractsignificant competition.
A more probable scenario mightinvolve a still high 20% growth rateand a P/E ratio of 20. In that event, afive-year investment in Netflix pro-duces a negative rate of return.
What to DoInvestors owning Netflix might con-sider taking profits by selling at leastsome of their position. Potential in-vestors might wait until the stock’sprice declines to the vicinity of theprojected EPS profile before startinga position. Even then, it is always pru-dent to build a position in a stockgradually, with a series of modest pur-chases.
Long-term debt issued tofinance share repurchases.
DesignSo
urce.co
m

6
Check the Front and Rear View Bonds beat stocks of late, but dividend-stock ETFs may shine.
SHAREOWNER Winter 2011
Exchange-Traded Funds (ETFs)
Bonds Outperforming StocksInvestors have moved their money intobonds en masse. In fact, the InvestmentCompany Institute reports that world-wide net sales of bond funds were $700billion during the past two years com-pared to net redemptions of $11 billionfrom equity funds. This recent enthusi-asm for bonds is largely attributable tothe higher returns (price appreciationplus interest) from bonds during the lastten years.
For example, a broadly-diversified port-folio of Canadian bonds, as representedby the iShares DEX Universe BondIndex Fund, has earned an averageannual return of about 6.5% during thelast decade. That’s significantly betterthan the 3.5% return delivered byCanadian blue chip stocks in the iSharesS&P/TSX 60 Fund. In addition to thehigher return, bond investors enjoyedsignificantly less volatility.
Bond FundamentalsHowever, investors considering bondsin their portfolio should be careful notto be caught looking through the rearview mirror. With 1, 5 and 10 year gov-ernment bonds yielding 1.3%, 2.4%and 3.1% (respectively), there is littlechance of significant further decline.
However, yields can go muchhigher if large doses of fiscaland monetary stimulus eventu-ally produce high rates of infla-tion. In that event, prices forpreviously-issued long-termbonds will decline significantly.
Today’s Better Alternative
Currently, the stocks of manyhigh-quality companies aredelivering yields (from divi-dends) that beat those of long-term bonds. Even better, a com-pany’s cash dividend oftenincreases over time whichincreases the yield realized onthe stock’s purchase price.
There is no opportunity for any increasein the interest paid on a typical bond.
Stock SelectionInvestors interested in selecting dividendstocks might begin looking for candi-dates among ShareOwner’s PortfolioBuilding Service (PBS). Table 1 showsthe service’s highest yielding stocks fromrecent prices.
All other things equal, Canadian tax-payers might prefer Canadian dividend-paying stocks because of their favour-able tax treatment relative to dividendsfrom foreign companies. However, thispreference does not apply in the case oftax-sheltered accounts such as retire-ment savings accounts and tax-free sav-ings accounts.
Stock PortfoliosInvestors less engaged in the stock mar-ket can still benefit from today’s rela-tively attractive dividend yields via anexchange-traded fund (ETF) that’sfocused on delivering dividend income.
Such funds own a broadly-based selec-tion of stocks with relatively high cur-rent dividend yields and strong pros-pects for future increases. Accordingly,ETFs are a convenient way to purchase
a diversified portfolio of income pro-ducing stocks. Unfortunately, this con-venience comes at the expense of anannual management and expense ratio(MER).
Table 120 Highest Yielding Stocks
in the Portfolio Building Service
Company SymbolYield(%)
CML Healthcare CLC-UN 8.6Northwest Income Fund NWF-UN 6.6AGF Management AGF-B 6.3Manitoba Telecom MBT 5.8TransAlta TA 5.5Sun Life Financial SLF 5.0IGM Financial IGM 4.9Great-West Lifeco GWO 4.7Husky Energy HSE 4.7AstraZeneca AZN 4.7TMX Group X 4.7Power Financial PWF 4.6Telus T 4.6Bank of Montreal BMO 4.6CIBC CM 4.5Entergy ETR 4.5Paychex PAYX 4.5US Ecology ECOL 4.4Reitmans RET.A 4.3Lockheed Martin LMT 4.2
Source: ShareOwner
continued on page 10
Make betterdecisions:
Learn how in theStock Market Investing Course
Sell the weak
Select a portfolio of at least 10 high-quality stocks & ETFsInvest as little as $10 in eachBuy and sell for one year, without commissions
It even lets you try-out your new decision-making skills:
Buy the strongDiversify better
Make More Moneyin the Stock Market
Learn more at ShareOwner.com
DesignSo
urce.co
m
7SHAREOWNER Winter 2011
Case Study: A Troubled Stock
Aging Pharma Icon Cuts Costs A once-hot drug-maker scrambles as growth flags.
Pfizer, Inc. is one of the world’s largestdevelopers of pharmaceuticals and bio-logics (medicinal products based onDNA technology). The company’s cho-lesterol-fighting Lipitor is the best-sell-ing prescription drug in the world. Italso makes many other widely useddrugs such as Viagra (erectile dysfunc-tion) and Celebrex (arthritis). In addi-tion, Pfizer sells general consumerhealth-care products and animal phar-maceuticals.
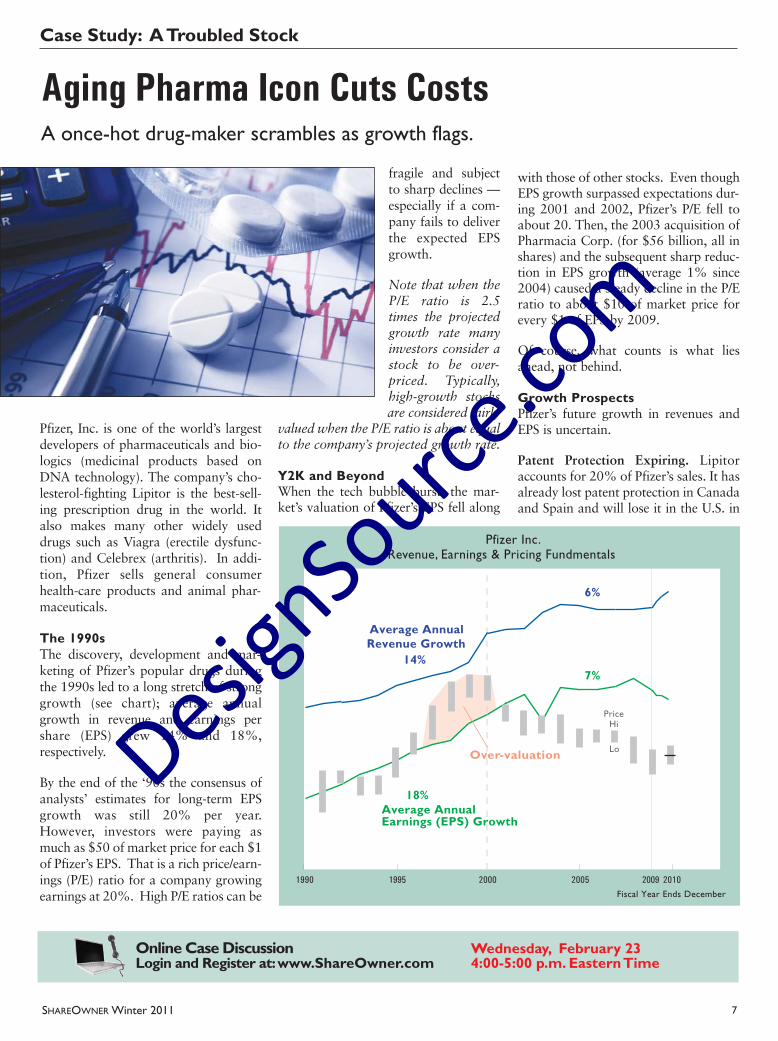
The 1990sThe discovery, development and mar-keting of Pfizer’s popular drugs duringthe 1990s led to a long stretch of stronggrowth (see chart); average annualgrowth in revenue and earnings pershare (EPS) grew 14% and 18%,respectively.
By the end of the ‘90s the consensus ofanalysts’ estimates for long-term EPSgrowth was still 20% per year.However, investors were paying asmuch as $50 of market price for each $1of Pfizer’s EPS. That is a rich price/earn-ings (P/E) ratio for a company growingearnings at 20%. High P/E ratios can be
fragile and subjectto sharp declines —especially if a com-pany fails to deliverthe expected EPSgrowth.
Note that when theP/E ratio is 2.5times the projectedgrowth rate manyinvestors consider astock to be over-priced. Typically,high-growth stocksare considered fairly
valued when the P/E ratio is about equalto the company’s projected growth rate.
Y2K and Beyond When the tech bubble burst, the mar-ket’s valuation of Pfizer’s EPS fell along
with those of other stocks. Even thoughEPS growth surpassed expectations dur-ing 2001 and 2002, Pfizer’s P/E fell toabout 20. Then, the 2003 acquisition ofPharmacia Corp. (for $56 billion, all inshares) and the subsequent sharp reduc-tion in EPS growth (average 1% since2004) caused a steady decline in the P/Eratio to about $10 of market price forevery $1 of EPS by 2009.
Of course, what counts is what liesahead, not behind.
Growth ProspectsPfizer’s future growth in revenues andEPS is uncertain.
Patent Protection Expiring. Lipitoraccounts for 20% of Pfizer’s sales. It hasalready lost patent protection in Canadaand Spain and will lose it in the U.S. in
Pfizer Inc.Revenue, Earnings & Pricing Fundmentals
$
1995 0102500200020991 2009
PriceHi
Lo
14%
Average AnnualRevenue Growth
18%
6%
7%
Average AnnualEarnings (EPS) Growth
Over-valuation
Fiscal Year Ends December
Online Case Discussion Wednesday, February 23Login and Register at: www.ShareOwner.com 4:00-5:00 p.m. Eastern Time
DesignSo
urce.co
m

Case Study: A Small Cap Stock
8 SHAREOWNER Winter 2011
Echo Global Logistics Inc. Echo Global’s magic slots cargo in trucks, planes and ships across the world.
Echo is a transportation logistics com-pany. It doesn’t own trucks, trains,
planes or ships. Instead, it uses a propri-etary communications platform tomatch shippers of goods (e.g. manufac-turers and distributors) with carriers(e.g. truckers and railroads).
Shippers Echo arranges for the transport of allmanner of large and small products (e.g.parcels, appliances and auto parts).Small and mid-sized shippers find
this third-party service particularlyappealing because it helps them reducecosts by: (1) avoiding a significantupfront investment in their own logisticscapabilities; (2) operating with a rela-tively small logistics staff; and, (3) pay-ing less per shipment.
Typically, shippers order Echo’s servicesby telephone or the Internet from a ded-icated sales agent or team. Once con-tracted, Echo manages the shipmentuntil final delivery. It bills the shipperand pays the carrier, retaining the differ-ence as profit.
Additional services include: tracking,reporting and compliance, freight billauditing and claims processing.
Transactional (60% of revenues). Thisrevenue comes from some 15,000 ship-pers — mainly small and mid-sized busi-nesses. These customers tend to orderonly occasionally and have no long-termcontract with Echo.
Enterprise (40%) About 140 shippershire Echo on 3-year contracts to takecare of some or all of their transportation
requirements. Echo says the renewal rateon these contracts is “nearly 100%.”
Carriers About 20,000 carriers are connected toEcho’s technology platform. This keepsEcho up to the date on carrier’s locationand available capacity. Echo uses thisinformation to find the lowest-cost car-rier with capacity in the required area.
Almost 90% of the shipments arrangedby Echo are transported by truck. Thebalance involves intermodal shipments(e.g. from truck to rail to ship).
Carriers join Echo’s network becausethey can: (1) obtain shipments without amarketing and sales effort; (2) operatefuller trucks or trains; and, (3) delegateservices (e.g. shipment tracking andfreight audit) to Echo.
Business Model Echo’s brand of logistics is a relativelylow-risk business. When the economyslows and transportation shipmentsdecrease, Echo isn’t stuck with expen-sive, underutilized transportation assets(e.g. trucks and rail cars).
Case Study: A Troubled Stock
2011. Patents for several other impor-tant drugs will also expire soon.
As generic drug makers such as TEVAPharmaceuticals, Inc. begin sellingequivalent drugs at lower prices, unitsales and profits for branded drugs typ-ically decline sharply.
In addition, Pfizer’s biologic productsare currently well protected fromgeneric copycats. There is concern, how-ever, that this protection will not last.Legislation is being considered thatwould allow for generic biologics.
Pipeline. Pfizer needs new drugs to off-set the loss of revenue to generic com-petitors. In 2009, it acquired Wyeth — a
leader in developing vaccines and bio-logics — to bolster its pipeline. The costwas $43 billion in cash plus $25 billionin shares.
The combined company has 115 drugsin clinical trials (Phases 1 through 3),which are expected to yield 15 to 20applications for drug approvals to theU.S. Food and Drug Administrationover the next two years. At least a fewof these applications are expected toresult in blockbuster drugs.
It should be noted, however, that manydrugs in development do not reach themarket. For example, safety issuescaused Pfizer to recently halt late-stageclinical trials for what was considered a
potential blockbuster heart medication.
Costs. Since the Wyeth acquisition,Pfizer has been cutting costs by closingfacilities and laying off staff. Annualsavings of between $4 billion and $5 bil-lion are expected by 2012.
What to Do?In the absence of several new block-buster drugs, growth investors have lit-tle reason to expect a return to attractiverevenue, earnings and price growth forthis large pharmaceutical company —even with its strong research infrastruc-ture. Still, investors looking for incomemight view Pfizer’s 4% dividend yieldfavourably and take comfort in its $25billion in cash.
DesignSo
urce.co
m