Embed Size (px)
Citation preview

Industries, Inc.Tootsie Roll
Annual Report 2011

1
Corporate ProfileTootsie Roll Industries, Inc. has beenengaged in the manufacture and sale ofconfectionery products for 115 years.Our products are primarily sold underthe familiar brand names: Tootsie Roll,Tootsie Roll Pops, Caramel Apple Pops,Child’s Play, Charms, Blow Pop, BlueRazz, Cella’s chocolate coveredcherries, Tootsie Dots, Tootsie Crows,Junior Mints, Junior Caramels,Charleston Chew, Sugar Daddy, SugarBabies, Andes, Fluffy Stuff cottoncandy, Dubble Bubble, Razzles, CryBaby, Nik-L-Nip and EI Bubble.
We believe that the differences among companies are attributable tothe caliber of their people, and therefore we strive to attract andretain superior people for each job.
We believe that an open family atmosphere at work combined withprofessional management fosters cooperation and enables eachindividual to maximize his or her contribution to the Company andrealize the corresponding rewards.
We do not jeopardize long-term growth for immediate, short-termresults.
We maintain a conservative financial posture in the deployment andmanagement of our assets.
We run a trim operation and continually strive to eliminate waste,minimize cost and implement performance improvements.
We invest in the latest and most productive equipment to deliver thebest quality product to our customers at the lowest cost.
We seek to outsource functions where appropriate and to verticallyintegrate operations where it is financially advantageous to do so.
We view our well known brands as prized assets to be aggressivelyadvertised and promoted to each new generation of consumers.
We conduct business with the highest ethical standards and integritywhich are codified in the Company’s “Code of Business Conduct andEthics.”
Corporate Principles
Melvin J. Gordon, Chairman and Chief Executive Officer and Ellen R. Gordon, President and Chief Operating Officer.
Merrill Corp - Tootsie Roll 10-K Tier 2 ED [AUX] | 105123 | 29-Feb-12 11:39 | 11-31190-1.ba | Sequence: 1CHKSUM Content: 58733 Layout: 48046 Graphics: 17590 CLEAN
JOB: 11-31190-1 CYCLE#;BL#: 8; 0 TRIM: 11" x 8.5" COMPOSITECOLORS: Black, Cyan, Magenta, Yellow, ~HTML color, ~HTML color 2, ~note-color 2, ~note-color 3 GRAPHICS: Gordon_new_fpo_4c_photo.eps, Tootsie_roll_candy_logo.eps V1.5

To Our ShareholdersNet product sales in 2011 were arecord $528 million, surpassing theprevious record of $517 million setin 2010. The Company had anotherstrong Halloween selling seasonand sales gains were achievedacross many of our core brands.Sales benefited from successfulpromotional programs, newdistribution and selected priceincreases.
Net earnings in 2011 were $44 millioncompared to $53 million in 2010.The decline in net earnings isprimarily due to significantly higherraw material and packaging costsin 2011. While we endeavor tomaintain the Company’s profitability
by adjusting prices in response torising costs, we are mindful of thecompetitive value positioning of ourproducts in the market place. Wealso remain true to the principlesenumerated on the facing page,which have guided the Company formany years.
We focus in particular on theprinciples of taking a long-termperspective, reinvesting in ouroperations and our brands andmaintaining a conservative financialposture. We believe that theseprinciples have served theCompany and its shareholders wellover the years and we remaincommitted to them.
Financial Highlights December 31, 2011 2010 (in thousands except per share data)
Net Product Sales . . . . . . . . . . . . . . . $528,369 $517,149
Net Earnings . . . . . . . . . . . . . . . . . . . 43,938 53,063
Working Capital . . . . . . . . . . . . . . . . 153,846 176,662
Net Property, Plant and Equipment . . . . . . . . . . . . . . . . . . 212,162 215,492
Shareholders’ Equity . . . . . . . . . . . . . 665,935 667,408
Average Shares Outstanding* . . . . . 57,892 58,685
Per Share Items*
Net Earnings . . . . . . . . . . . . . . . . . . $0.76 $0.90
Cash Dividends Paid . . . . . . . . . . . .32 .32
*Adjusted for stock dividends.
Highlights in 2011 include:
• $16 million was invested incapital expenditures for property,plant and equipment.
• Cash dividends were paid for thesixty-ninth consecutive year.
• Our forty-seventh consecutiveannual 3% stock dividend wasdistributed.
• 708,235 shares of our commonstock were repurchased in theopen market for an aggregateprice of $18 million.
• The above actions were takenentirely with internally generatedfunds, and the Company remainsessentially debt free.
As of December 31, 2011, theCompany had $186 million in cashand investments. These financialresources enable us to continuedistributing cash dividends to ourshareholders, repurchasing ourstock on the open market andreinvesting in operating assets andin our brands, including newproducts. We are also prepared toconsider and respond toappropriate business acquisitionopportunities as they may arise.
Sales and Marketing
Consumers have many temptingchoices in the candy aisle andretailers are highly selective as tothe products they stock. We havefound that consumers respond wellto the many high quality/high valuebrands in our portfolio. Additionally,
the high percentage of sell-throughsand attractive margins of our itemsare appealing to the trade. This wasevident once again in 2011. Weused carefully targeted promotionalinitiatives to help move ourproducts into distribution and tosubsequently move them off theretail shelf. Our diverse portfolio ofhighly recognizable brands remainspopular across all channels oftrade.
Our broad range of offeringsincludes something for virtuallyevery major consumerdemographic, which we continue torefine and evolve to meet changingconsumer preferences and thedemands of the trade in today’sfluctuating market place. We remainvigilant in keeping our productscontemporary even as they retaintheir iconic character.
Halloween is a major selling seasonin our primary market, the UnitedStates, for a number of productcategories including candy. It is amagical time of fun, familytogetherness, gatherings andparties, evoking feelings ofexcitement and nostalgia. Our salesin the third quarter are centered onthis popular holiday and are nearlydouble those of any other quarterduring the year.
In 2011, we posted strongHalloween sales in the grocery,mass merchandiser, warehouseclub, dollar store and drug storeclasses of trade. Our line ofpackaged goods, including straightgoods as well as large bags of
2
Merrill Corp - Tootsie Roll 10-K Tier 2 ED [AUX] | 105123 | 29-Feb-12 11:39 | 11-31190-1.bc | Sequence: 1CHKSUM Content: 4558 Layout: 51574 Graphics: No Graphics CLEAN
JOB: 11-31190-1 CYCLE#;BL#: 8; 0 TRIM: 11" x 8.5" COMPOSITECOLORS: Black, ~note-color 2, ~note-color 3 GRAPHICS: none V1.5

Child’s Play and other mixedassortments, are offered in anumber of merchandisingpresentations and are especiallypopular during this season. Othertraditional merchandisingpresentations such as shippers,pallet packs and display readycases contributed to Halloweensales.
Outside of Halloween, we continuedour position of leadership in thetheater box category. This categoryis no longer limited to the “bigscreen” venue and has developedinto a major format for everydaycandy purchases. Two newofferings in this important categorywere added to our line in 2011.
Blow Pop Minis, bite-sized candytablets, each with a real Blow Popbubble gum center, were extendedinto the theater box format. Popularand portable, this “Blow Pop withno stick!” includes four of the mostpopular Blow Pop flavors in eachbox, enveloped in a protectivesealed pouch for added freshness.Blow Pop Minis continue to be asales growth driver.
Blow Pop Minis’ New Theater Box
Another winning addition to ourtheater box line was Tootsie Roll
Raspberry Cremes. These deliciousmorsels feature a luscious, creamyraspberry center encased in a thinshell of pure dark chocolate. Aperfect snacking indulgence forpeople on the go!
Raspberry Cremes
We also extended our marketleadership position in the lollipopcategory with the introduction ofTear Jerkers Mini Pops. Thisexciting new addition to ourbagged line packs a super sourpunch into each pop! Theassortment includes six tangyflavors in a laydown bag with eyecatching graphics and greatconsumer appeal. Pucker up!
Tear Jerker Mini Pops
As big as we are in the lollipopcategory, in 2011 we introduced ourbiggest entry ever in the category–the Giant Sugar Daddy! Thisnovelty item consists of a full pound
of luscious caramel on a realwooden stick packaged in thefamiliar yellow and red SugarDaddy wrapper and shape. TheGiant Sugar Daddy makes a fun giftor an all-day good treat.
Giant Sugar Daddy
The Andes line was expanded witha delicious new seasonal offering.Andes Mint Truffles are beautifullypackaged in a festive Christmas-themed red box highlighted withgold ornaments and featuring adecorative green foil tree topper.The individually wrapped treatsfeature a delicious truffle mintcenter that melts in your mouth.Perfect for holiday gift giving!
Andes Mint Truffles
The Dubble Bubble Nostalgic BigBar was a new addition to theDubble Bubble line in 2011. Thewrapper features nostalgicgraphics and is made of foil forlasting freshness. The Big Bar is afoot-long rope of bubble blowingfun.
Dubble Bubble Big Bar
Our popular line of novelty funbanks grew with the addition of twonew items in 2011. The DubbleBubble bank was launched in apatriotic red, white and blue motifand the Tootsie Roll bank took on anostalgic tone with old-fashionedgraphics at a price point that makesit an old-fashioned value. All of ourbanks feature a slotted lid so whenthe candy is gone you can begin tosave for the next one. Fun you canbank on!
Dubble Bubble Patriotic and Tootsie RollNostalgic Banks
Advertising and Public RelationsHaving been described as “elegantin its simplicity” for more than40 years the Tootsie Pop “HowMany Licks?” television ad haspresented viewers with both an
3
Merrill Corp - Tootsie Roll 10-K Tier 2 ED [AUX] | 105123 | 29-Feb-12 11:39 | 11-31190-1.bc | Sequence: 2CHKSUM Content: 47174 Layout: 13607 Graphics: 24997 CLEAN
JOB: 11-31190-1 CYCLE#;BL#: 8; 0 TRIM: 11" x 8.5" COMPOSITECOLORS: Black, ~note-color 2, ~note-color 3 GRAPHICS: andes_mint_truffles_k_photo.eps, blow_pos_minis_k_photo.eps, db_tr_gum_k_photo.eps, dubble_bubble_k_photo.eps, giant_sugar_daddy_k_photo.eps, raspberry_cremes_k_photo.eps, tear_jerkers_mini_k_photo.eps V1.5

intriguing challenge and a clearconcept of the product and itsvalue proposition to severalgenerations of consumers. In 2011,this ad was showcased in an exhibitat the Chicago Museum ofBroadcast Communications.
The iconic ad, featuring the wiseold Mr. Owl advising a young boythat indeed three licks was all ittook before the inevitable crunch!when he bit his way to the middle ofthe Tootsie Pop, was culled fromover 100,000 spots in the museum’sarchives and was selected as oneof the 100 best commercials overthe last six decades.
The ad has led to an inestimablenumber of experiments and trials,ranging from innovative lickingmachines built by physics studentsthat counted strokes with scientificprecision, to informal personallicking trials communicated to us inmany thousands of consumerletters. Despite this massive amountof research, the provocativequestion posed by the announcer:“How many licks does it take to getto the Tootsie Roll center of aTootsie Pop?” remains unanswered.So, as the commercial states, “theworld may never know.”
This message has been extendedto social media, and in 2011 theCompany continued to bring newusers into the Tootsie Roll andTootsie Pops franchises with adigital media campaign targeting
moms with kids. Featuring our own“Mr. Owl” character, banner ads,online video ads, and search adsdirected consumers to the brands’Facebook pages. There,consumers could send Halloweene-cards featuring our brands, playcustomized games and sharephotos and stories with theirFacebook friends.
Additionally, several of our productswere featured in special interestprograms on the History Channel,the Travel Channel and the FoodChannel. These programs are quitepopular with viewing audiences andare often repeated, generatingextensive recurring exposure andinterest in the featured brands.
PurchasingThe markets for the majority of theCompany’s key ingredients,including corn syrup, edible oils,gum base, cocoa powder andsugar, rose sharply to record ornear record levels in 2011.Likewise, the cost of many of ourprinciple packaging materials,including corrugated, film and waxpaper, increased over 2010. Theseinput cost increases were well inexcess of the price increases weimplemented in 2011.
Competitive bidding, selectivehedging and forward purchasing aswell as leveraging our high volumeof purchases are some of themeans we use to manage costs tothe greatest extent possible in an
upward commodity and packagingmaterials price environment.
Operations and Supply ChainWe continue to invest capital andresources in projects that supportevolving customer/consumerpreferences and distributionpatterns, promote growing productlines, improve quality and maximizeefficiency across our operations. Itis our goal to be the low costproducer in the categories in whichwe compete. As technologyadvances, we are constantly on thelookout for new cost saving processenhancements as they becomefeasible and financially justified.
We have also made a majorcommitment to informationtechnology, and in 2011 the finalphase of a comprehensiveenterprise resource planningsystem was implemented.Investment in leading edgeequipment and technology is one ofour key corporate principles and webelieve it has resulted in theCompany’s success and profitabilityover many years.
InternationalSales in Mexico declined somewhatand operating income also declined,as price increases taken during theyear were not sufficient to recovercost increases. Our export sales tothe Canadian market decreaseddue to inventory reductions by adistributor.
Export sales to other countries werelower in 2011, though we continueto believe that the broad assortmentof well-known brands that we offerwill, over the long run, appeal toconsumers in a variety of foreignmarkets and venues. Accordingly,we continue to actively cultivatethese opportunities in over40 foreign countries.
In Appreciation
We wish to express ourappreciation to our many loyalemployees, customers, suppliers,sales brokers and distributorsthroughout the world for theirsupport during the past year. Wealso thank our fellow shareholdersfor their support in today’schallenging business environment.We remain committed to the pursuitof excellence in every aspect of ourbusiness in order to ensure theCompany’s success both in thenear term and far into the future.
Melvin J. GordonChairman of the Board andChief Executive Officer
Ellen R. GordonPresident andChief Operating Officer
4
Merrill Corp - Tootsie Roll 10-K Tier 2 ED [AUX] | 105123 | 29-Feb-12 11:39 | 11-31190-1.bc | Sequence: 3CHKSUM Content: 58132 Layout: 29610 Graphics: 6250 CLEAN
JOB: 11-31190-1 CYCLE#;BL#: 8; 0 TRIM: 11" x 8.5" COMPOSITECOLORS: Black, ~note-color 2, ~note-color 3 GRAPHICS: ellen_r_gordon_sig.eps, melvin_j_gordon_sig.eps V1.5
Child’s Play and other mixedassortments, are offered in anumber of merchandisingpresentations and are especiallypopular during this season. Othertraditional merchandisingpresentations such as shippers,pallet packs and display readycases contributed to Halloweensales.
Outside of Halloween, we continuedour position of leadership in thetheater box category. This categoryis no longer limited to the “bigscreen” venue and has developedinto a major format for everydaycandy purchases. Two newofferings in this important categorywere added to our line in 2011.
Blow Pop Minis, bite-sized candytablets, each with a real Blow Popbubble gum center, were extendedinto the theater box format. Popularand portable, this “Blow Pop withno stick!” includes four of the mostpopular Blow Pop flavors in eachbox, enveloped in a protectivesealed pouch for added freshness.Blow Pop Minis continue to be asales growth driver.
Blow Pop Minis’ New Theater Box
Another winning addition to ourtheater box line was Tootsie Roll
Raspberry Cremes. These deliciousmorsels feature a luscious, creamyraspberry center encased in a thinshell of pure dark chocolate. Aperfect snacking indulgence forpeople on the go!
Raspberry Cremes
We also extended our marketleadership position in the lollipopcategory with the introduction ofTear Jerkers Mini Pops. Thisexciting new addition to ourbagged line packs a super sourpunch into each pop! Theassortment includes six tangyflavors in a laydown bag with eyecatching graphics and greatconsumer appeal. Pucker up!
Tear Jerker Mini Pops
As big as we are in the lollipopcategory, in 2011 we introduced ourbiggest entry ever in the category–the Giant Sugar Daddy! Thisnovelty item consists of a full pound
of luscious caramel on a realwooden stick packaged in thefamiliar yellow and red SugarDaddy wrapper and shape. TheGiant Sugar Daddy makes a fun giftor an all-day good treat.
Giant Sugar Daddy
The Andes line was expanded witha delicious new seasonal offering.Andes Mint Truffles are beautifullypackaged in a festive Christmas-themed red box highlighted withgold ornaments and featuring adecorative green foil tree topper.The individually wrapped treatsfeature a delicious truffle mintcenter that melts in your mouth.Perfect for holiday gift giving!
Andes Mint Truffles
The Dubble Bubble Nostalgic BigBar was a new addition to theDubble Bubble line in 2011. Thewrapper features nostalgicgraphics and is made of foil forlasting freshness. The Big Bar is afoot-long rope of bubble blowingfun.
Dubble Bubble Big Bar
Our popular line of novelty funbanks grew with the addition of twonew items in 2011. The DubbleBubble bank was launched in apatriotic red, white and blue motifand the Tootsie Roll bank took on anostalgic tone with old-fashionedgraphics at a price point that makesit an old-fashioned value. All of ourbanks feature a slotted lid so whenthe candy is gone you can begin tosave for the next one. Fun you canbank on!
Dubble Bubble Patriotic and Tootsie RollNostalgic Banks
Advertising and Public RelationsHaving been described as “elegantin its simplicity” for more than40 years the Tootsie Pop “HowMany Licks?” television ad haspresented viewers with both an
3
Merrill Corp - Tootsie Roll 10-K Tier 2 ED [AUX] | 105123 | 29-Feb-12 11:39 | 11-31190-1.bc | Sequence: 2CHKSUM Content: 47174 Layout: 13607 Graphics: 24997 CLEAN
JOB: 11-31190-1 CYCLE#;BL#: 8; 0 TRIM: 11" x 8.5" COMPOSITECOLORS: Black, ~note-color 2, ~note-color 3 GRAPHICS: andes_mint_truffles_k_photo.eps, blow_pos_minis_k_photo.eps, db_tr_gum_k_photo.eps, dubble_bubble_k_photo.eps, giant_sugar_daddy_k_photo.eps, raspberry_cremes_k_photo.eps, tear_jerkers_mini_k_photo.eps V1.5
cited by Jeremy Siegel in his popular We also undertook a comprehensive We believe that our well knownInformation Technology andproducts, including the additions ofstudy to examine our supply chain inbook ‘‘The Future for Investors’’ as Internal ControlsDubble Bubble and other Concord2005. The focus was onhaving delivered the fourth highestbrands, offers a compelling andreengineering the network andreturn to our shareholders among allbroad assortment of items that canpatterns of distribution, As a result ofsurviving S & P 500 firms from the Our principal information technologybe extended to additional foreignthis study, certain changes wereoriginal index first published in 1957, efforts during 2005 were in supportmarkets.implemented in 2005 and otherand the highest among food of the Concord integration and the
recommendations that arose fromcompanies. We place a high value supply chain reengineering projects.this study are expected to beon ethics, corporate leadership and The former involved migrating
In Appreciationimplemented early in 2006. Wecreating shareholder value over the Concord onto all of our financial andanticipate cost savings, lowerlong-term, and are gratified to business systems, while the latterinventories and even better customerreceive distinctions such as these. required programming modifications We wish to thank our loyalfulfillment as a result of this project. to support the business process employees, customers, suppliers,
changes that were made. sales brokers, foreign distributorsIn one of the more unusual storiesand fellow shareholders for theirAs in all aspects of our business, wewe learned of in 2005, our El Bubblemany years of support. We are alsokeep a sharp focus on costbubble gum cigars were used by We consider state of the artgrateful to the many consumers whocontainment. Capital projects,astronaut Mike Fincke to celebrate information technology to be a keybuy and use our products forprocess reengineering and employeethe birth of his daughter, Tarali strategic tool to deliver informationmaking them a lasting part oftraining and development are all vitalPaulina. While El Bubble has long and support process refinementsAmericana.components of this process.been a fun and safe way to that enable the Company to remain
commemorate such a special competitive in today’s rapidlyoccasion, this marked the first time a evolving business environment. It isbaby was born to an astronaut while also a key component of our internalPurchasingin orbit-and the first time, to our control system, which wasknowledge, that one of our products successfully tested and audited
Although 2005 was another year ofwas brought aboard the international during 2005, our second year ofgenerally low inflation as measured compliance with the requirements ofspace station!by the Consumer Price Index, we Melvin J. GordonSection 404 of the Sarbanes-Oxley
Chairman of the Board andexperienced cost pressure in certain Act.Chief Executive Officeringredients, packaging,Manufacturing and Distribution transportation, fuel and energy. We
continue to use hedging programs to Internationalmoderate short-term commodityDuring 2005 we continued workingprice fluctuations and to useon key projects that were initiated incompetitive bidding, volume Our international sales increasedprior years, including thepurchasing and other means to during 2005 as a result of a full yearreengineering and start up of amitigate costs to the fullest extent of Concord foreign sales in additionmajor production line. We also Ellen R. Gordonpossible. to a strong year in Mexico. We President andapproved several new projects to
Chief Operating Officermanufacture and sell products inexpand capacity in support ofMexico under the Tutsi trademark.growing product categories in We also completed the integration ofWe also sell Tootsie, Charms andaddition to ongoing efforts to procurement activities related toConcord products to Canada andstreamline and automate existing Concord into our bidding processesover 75 other countries in Europe,processes at all of our plants, in and purchasing and MRP systems
during 2005. Asia and South and Central America.order to realize cost savings.
4

5
Management’s Discussion and Analysis of Financial Condition and Results of Operations(in thousands except per share, percentage and ratio figures)
FINANCIAL REVIEW
This financial review discusses theCompany’s financial condition,results of operations, liquidity andcapital resources, significantaccounting policies and estimates,new accounting pronouncements,market risks and other matters. Itshould be read in conjunction withthe Consolidated FinancialStatements and related footnotesthat follow this discussion.
FINANCIAL CONDITION
The Company’s overall financialposition remains very strong as aresult of its 2011 net product sales,net earnings and related cash flowsprovided by operating activities.
During 2011, the Company’s netproduct sales increased from$517,149 in 2010 to $528,369 in2011, an increase of $11,220 or2.2%. Cash flows from operatingactivities totaled $50,390 in 2011compared to $82,805 in 2010. TheCompany used its 2011 cash flowsto pay cash dividends of $18,407,purchase and retire $18,190 of itsoutstanding shares, and makecapital expenditures of $16,351.
The Company’s net working capitalwas $153,846 at December 31,2011 compared to $176,662 atDecember 31, 2010 reflecting a$37,364 decrease in cash and cashequivalents. As of December 31,
2011, the Company’s aggregatecash, cash equivalents andinvestments, including all long-terminvestments in marketablesecurities, was $185,668 comparedto $188,433 at December 31, 2010,a decrease of $2,765. Theaforementioned includes $41,768and $38,504 in trading securities asof December 31, 2011 and 2010,respectively. The Company investsin trading securities to provide aneconomic hedge for its deferredcompensation liabilities, as furtherdiscussed herein and in Note 7 tothe Consolidated FinancialStatements.
Shareholders’ equity decreasedfrom $667,408 at December 31,2010 to $665,935 as ofDecember 31, 2011, principallyreflecting 2011 net earnings of$43,938, less cash dividends andshare repurchases of $18,407 and$18,190, respectively, and $8,740of other comprehensive loss whichis summarized in Note 12 to theConsolidated Financial Statements.
The Company has a relativelystraight-forward financial structureand has historically maintained aconservative financial position.Except for an immaterial amount ofoperating leases, the Company hasno special financing arrangementsor “off-balance sheet” specialpurpose entities. Cash flows fromoperations plus maturities of
short-term investments areexpected to be adequate to meetthe Company’s overall financingneeds, including capitalexpenditures, in 2012. Periodically,the Company considers possibleacquisitions, and if the Companywere to pursue and complete suchan acquisition, that could result inbank borrowings or other financing.
Results of Operations
2011 vs. 2010
Net product sales were $528,369 in2011 compared to $517,149 in2010, an increase of $11,220 or2.2%. This increase principallyreflects sales price increasesduring 2011 which were required torecover some of our rising inputcosts as discussed below. Althoughprice increases were madethroughout 2011, most becameeffective during mid-fourth quarter2011 after the Company’s large pre-Halloween selling season, andtherefore, a substantial portion ofthe benefits of such price increaseswill be realized in 2012.
Product cost of goods sold were$365,225 in 2011 compared to$349,334 in 2010, an increase of$15,891 or 4.5%. Product cost ofgoods sold includes $44 and $770in certain deferred compensationexpenses in 2011 and 2010,respectively. These deferred
compensation expenses principallyresult from changes in the marketvalue of investments and investmentincome from trading securitiesrelating to compensation deferredin previous years and are notreflective of current operatingresults. Adjusting for theaforementioned, product cost ofgoods sold increased from $348,564in 2010 to $365,181 in 2011, anincrease of $16,617 or 4.8%. As apercent of net product sales, theseadjusted costs increased from67.4% in 2010 to 69.1% in 2011, anincrease of 1.7% as a percent ofnet product sales. The Companywas adversely affected bysignificantly higher input costs,including approximately $17,300and $2,800 of unit cost increases iningredients and packagingmaterials, respectively, in 2011compared to 2010. The Companygenerally experienced significantcost increases in sugar, corn syrup,cocoa, edible oils, dairy and gumbase inputs resulting in higher costof goods sold as a percentage ofsales.
Selling, marketing andadministrative expenses were$108,276 in 2011 compared to$106,316 in 2010, an increase of$1,960 or 1.8%. Selling, marketingand administrative expenses reflecta $15 decrease and $2,594 increasein certain deferred compensationexpenses in 2011 and 2010,
Merrill Corp - Tootsie Roll 10-K Tier 2 ED [AUX] | 105123 | 29-Feb-12 11:39 | 11-31190-1.ca | Sequence: 1CHKSUM Content: 27753 Layout: 56164 Graphics: No Graphics CLEAN
JOB: 11-31190-1 CYCLE#;BL#: 8; 0 TRIM: 11" x 8.5" COMPOSITECOLORS: Black, ~note-color 2, ~note-color 3 GRAPHICS: none V1.5
6
respectively. These deferredcompensation expenses principallyresult from changes in the marketvalue of investments and investmentincome from trading securitiesrelating to compensation deferredin previous years and are notreflective of current operating results.Adjusting for the aforementioned,selling, marketing and administrativeexpenses increased from $103,722in 2010 to $108,291 in 2011, anincrease of $4,569 or 4.4%. As apercent of net product sales, theseadjusted expenses increasedslightly from 20.1% of net productsales in 2010 to 20.5% of netproduct sales in 2011.
Selling, marketing and administrativeexpenses include $45,849 and$43,034 of freight, delivery andwarehousing expenses in 2011 and2010, respectively. These expensesincreased from 8.3% of net productsales in 2010 to 8.7% of net productsales in 2011, principally reflectingan 8.7% increase in freight anddelivery costs for trucking carriersincluding higher fuel surcharges fordiesel fuel.
The Company believes that thecarrying values of its trademarksand goodwill have indefinite lives asthey are expected to generate cashflows indefinitely. In accordancewith current accounting guidance,goodwill and indefinite-livedintangible assets are assessed atleast annually for impairment as ofDecember 31 or whenever eventsor circumstances indicate that thecarrying values may not be
recoverable from future cash flows.No impairments were recorded in2011 or 2010.
The fair values of indefinite livedintangible assets are primarilyassessed using the present value ofestimated future cash flows.Management believes that allassumptions used for theimpairment tests are consistent withthose utilized by marketparticipants performing similarvaluations. The Company’s fairvalue estimates based on theseassumptions were used to prepareprojected financial informationwhich it believes to be reasonable.Actual future results may differ fromthose projections and thedifferences could be material.Holding all other assumptionsconstant at the test date, a 100basis point increase in the discountrate or a 100 basis point decreasein the royalty rate would reduce thefair value of certain trademarks byapproximately 16% and 11%,respectively. Individually, a 100basis point increase in the discountrate would indicate a potentialimpairment of approximately $2,000as of December 31, 2011; however,if the royalty rate were decreasedby 100 basis points no potentialimpairment would be indicated asof December 31, 2011.
Earnings from operations were$57,966 in 2011 compared to$64,710 in 2010, a decrease of$6,744. Earnings from operationsincludes $29 and $3,364 in certaindeferred compensation expenses
in 2011 and 2010, respectively. Asdiscussed above, these deferredcompensation expenses relate tochanges in deferred compensationliabilities resulting fromcorresponding changes in themarket value of trading securitiesand related investment income thathedge these liabilities. Adjustingfor these deferred compensationexpenses, operating earnings were$57,995 and $68,074 in 2011 and2010, respectively, a decrease of$10,079 or 14.8%. This decreasein earnings from operationsprincipally reflects significantlyhigher ingredient costs andresulting lower gross profitmargins, as well as higher freightand delivery expenses asdiscussed above.
Management believes thecomparisons presented in thepreceding paragraphs afteradjusting for changes in deferredcompensation are more reflective ofthe underlying operations of theCompany.
Other income (expense), net was$2,946 in 2011 compared to $8,358in 2010, a decrease of $5,412. Thisdecrease principally reflects a$3,335 decrease in net gains andrelated investment income ontrading securities of $29 and $3,364in 2011 and 2010 which isdiscussed above. These tradingsecurities were substantially offsetby a like amount of expense inaggregate product cost of goodssold and selling, marketing, andadministrative expenses in the
respective years as discussedabove. Foreign exchange gains in2011 decreased $1,992 whichincludes a decrease in net realizedgains on foreign currency hedging.Other income (expense), net alsoincludes the operating losses of$194 and $342 for 2011 and 2010,respectively, relating to theCompany’s equity methodinvestment in two 50% ownedforeign companies.
As of December 31, 2011 and2010, the Company’s long-terminvestments include $7,453 and$6,775 ($13,550 original cost),respectively, of Jefferson CountyAlabama Sewer RevenueRefunding Warrants, originallypurchased with an insurance-backed AAA rating. This is anauction rate security (ARS) that isclassified as an available for salesecurity. Representatives ofJefferson County and the bondholders were unable to reach asettlement agreement, andtherefore the County filed forbankruptcy in 2011. Due to adverseevents related to Jefferson Countyand its bond insurance carrier,Financial Guaranty InsuranceCompany (FGIC), as well as eventsin the credit markets, the auctionsfor this ARS failed in 2008 through2011 (and subsequent toDecember 31, 2011). As such, theCompany estimated the fair value ofthis ARS as of December 31, 2011and 2010 utilizing a valuation modelwith Level 3 inputs, as defined byguidance and discussed in Note 10
Merrill Corp - Tootsie Roll 10-K Tier 2 ED [AUX] | 105123 | 29-Feb-12 11:39 | 11-31190-1.ca | Sequence: 2CHKSUM Content: 31797 Layout: 34706 Graphics: No Graphics CLEAN
JOB: 11-31190-1 CYCLE#;BL#: 8; 0 TRIM: 11" x 8.5" COMPOSITECOLORS: Black, ~note-color 2, ~note-color 3 GRAPHICS: none V1.5

7
to the Consolidated FinancialStatements. This valuation modelconsidered, among others items,recent third-party trading and salesprices, the credit risk of themunicipality and collateralunderlying the ARS, the credit riskof the bond insurer, interest rates,and the amount and timing ofexpected future cash flowsincluding assumptions about themarket expectation of the nextsuccessful auction or a restructuredsecurity that is likely to be issued asa result of the municipality’sbankruptcy.
During the fourth quarter of 2008,the Company determined that themarket decline in fair value of itsJefferson County ARS becameother-than-temporarily impaired, asdefined, and recorded a pre-taximpairment of $5,140. During 2011and 2010, the Company furtherevaluated this investment andconcluded that additional increasesand (declines) in the market valuewere temporary because it was notrelated to further credit impairmentand recorded $678 and $(935),respectively, as adjustments toaccumulated other comprehensivegain (loss). The Company hasclassified this ARS as non-currentand has included it in long-terminvestments on the ConsolidatedStatements of Financial Position atDecember 31, 2011 and 2010because the Company believes thatthe current financial conditions,including bankruptcy filing, ofJefferson County and the stressed
financial condition of FGIC, as wellas the conditions in the auction ratesecurities market, may take morethan twelve months to resolve.Future evaluations of the fair valueof this ARS could also result inadditional other-than-temporaryclassification of declines in marketvalue, and therefore result inadditional charges to earnings. TheCompany continues to receive allcontractual interest payments onthis ARS on a timely basis, it isinsured by FGIC and the Companyhas the intent and ability to hold thisARS until recovery of its amortizedcost basis. The Company is notcurrently able to predict theoutcome of this bankruptcy, or theamount and timing of net proceedsit may ultimately recover.
The consolidated effective tax ratewas 27.9% and 27.4% in 2011 and2010, respectively. At December 31,2011, the Company hasapproximately $66,740 of foreignsubsidiary tax loss carry-forwardsexpiring in future years 2014 through2031. The Company has concludedthat it is more-likely-than-not that itwould realize the deferred taxassets relating to such taxoperating loss carry-forwardsbecause it is expected thatsufficient levels of taxable incomewill be generated during thecarry-forward periods.
Net earnings were $43,938 in 2011compared to $53,063 in 2010, andearnings per share were $.76 and$.90 in 2011 and 2010, respectively,
a decrease of $.14 or 15.6%.Earnings per share benefited fromthe reduction in average sharesoutstanding resulting frompurchases of the Company’scommon stock (the “CommonStock”) in the open market by theCompany. Average sharesoutstanding decreased from 58,685in 2010 to 57,892 in 2011.
2010 vs. 2009
Net product sales were $517,149 in2010 compared to $495,592 in2009, an increase of $21,557 or4.3%. This increase principallyreflects organic growth in volume,including product line extensions.
Product cost of goods sold were$349,334 in 2010 compared to$319,775 in 2009, an increase of$29,559 or 9.2%. Product cost ofgoods sold reflects a $228decrease in certain deferredcompensation expenses in 2010compared to 2009. This decreaseprincipally results from changes inthe market value of investments intrading securities relating tocompensation deferred in previousyears and is not reflective of currentoperating results. Adjusting for theaforementioned, product cost ofgoods sold as a percentage of netproduct sales increased from64.3% in 2009 to 67.4% in 2010, anincrease of 3.1% as a percent of netproduct sales. The Company wasadversely affected by significantlyhigher input costs, includingapproximately $16,600 of ingredient
unit cost increases in 2010compared to 2009. However,packaging material unit costsfavorably decreased byapproximately $800 in 2010. TheCompany generally experiencedsignificant cost increases in sugar,cocoa, edible oils and dairy inputs,however, the Company experiencedfavorable declines in corn syrup.
Selling, marketing andadministrative expenses were$106,316 in 2010 compared to$103,755 in 2009, an increase of$2,561 or 2.5%. Selling, marketingand administrative expenses reflecta $932 decrease in certain deferredcompensation expense in 2010compared to 2009. This decreasereflects changes in the marketvalue of investments in tradingsecurities and related investmentincome relating to compensationdeferred in previous years and isnot reflective of current operatingresults. Adjusting for theaforementioned, selling, marketingand administrative expensesincreased from $100,230 in 2009 to$103,722 in 2010, an increase of$3,492 or 3.5%. As a percent of netproduct sales, these expensesdecreased slightly from 20.2% ofnet product sales in 2009 to 20.1%of net product sales in 2010.
Selling, marketing andadministrative expenses include$43,034 and $38,628 of freight,delivery and warehousing expensesin 2010 and 2009, respectively.These expenses increased from
Merrill Corp - Tootsie Roll 10-K Tier 2 ED [AUX] | 105123 | 29-Feb-12 11:39 | 11-31190-1.ca | Sequence: 3CHKSUM Content: 19979 Layout: 5344 Graphics: No Graphics CLEAN
JOB: 11-31190-1 CYCLE#;BL#: 8; 0 TRIM: 11" x 8.5" COMPOSITECOLORS: Black, ~note-color 2, ~note-color 3 GRAPHICS: none V1.5
8
7.8% of net product sales in 2009 to8.3% of net product sales in 2010,primarily due to increases inwarehousing expenses and an11.3% increase in freight anddelivery costs for trucking carriersincluding higher surcharges fordiesel fuel.
Earnings from operations were$64,710 in 2010 compared to$60,949 in 2009, a decrease of$3,761. Earnings from operationsreflect a $3,364 increase in certaindeferred compensation expenses in2010 compared to a $4,524increase in 2009. As discussedabove, these deferredcompensation expenses relate tochanges in deferred compensationliabilities resulting fromcorresponding changes in themarket value of trading securitiesand related investment income thathedge these liabilities. Adjusting forthese changes in deferredcompensation, and excluding thenon-recurring $14,000 non-cashimpairment charge in 2009 relatingto trademarks, operating earningswere $68,074 and $79,473 in 2010and 2009, respectively, a decreaseof $11,399 or 14.3%. This decreasein earnings from operationsprincipally reflects significantlyhigher ingredient costs andresulting lower gross profit margins,as well as higher freight anddelivery expenses as discussedabove.
Management believes thecomparisons presented in thepreceding paragraphs after
adjusting for changes in deferredcompensation are more reflective ofthe underlying operations of theCompany.
Other income (expense), net was$8,358 in 2010 compared to $2,100in 2009, an increase of $6,258. Thisincrease principally reflects a pre-tax impairment charge of $4,400 in2009 to write down to market valuethe Company’s equity methodinvestment combined with a $3,139increase in foreign exchange gainsin 2010. The increase in foreignexchange gains consists primarilyof net realized gains on foreigncurrency hedging. Other income(expense), net also includes gainson trading securities and relatedinvestment income of $3,364 and$4,524 in 2010 and 2009,respectively. These tradingsecurities gains principally reflectmarket appreciation in the equitymarkets and related investmentincome in the respective years andwere substantially offset by a likeamount of expense in aggregateproduct cost of goods sold andselling, marketing, andadministrative expenses in therespective years as discussedabove. Other income (expense), netalso includes the operating lossesof $342 and $233 for 2010 and2009, respectively, relating to theCompany’s equity methodinvestment in two 50% ownedforeign companies.
As of December 31, 2010 and2009, the Company’s long-terminvestments include $6,775 and
$7,710 ($13,550 original cost),respectively, of Jefferson CountyAlabama Sewer RevenueRefunding Warrants. The Companyestimated the fair value of this ARSas of December 31, 2010 and 2009utilizing a valuation model withLevel 3 inputs, as defined byguidance. During 2010 and 2009,the Company recorded $935 and$700, respectively, as a charge toaccumulated other comprehensiveloss.
The consolidated effective tax ratewas 27.4% and 15.7% in 2010 and2009, respectively. The increase inthe effective income tax rate fromthe prior year reflects the release ofCanadian income tax valuationallowances during 2009. Prior tofourth quarter 2009, Canadianincome tax valuation allowanceswere recorded against Canadiandeferred tax assets as a result oflosses generated in 2009 and prioryears. Because managementdetermined that the Canadian netoperating loss (NOL) carry-forwardbenefits were more-likely-than-notrealizable as of December 31,2009, the Company reversedapproximately $10,700 of valuationallowances as a credit to incometax expense as of December 31,2009.
Net earnings were $53,063 in 2010compared to $53,157 in 2009, andearnings per share were $.90 and$.89 in 2010 and 2009, respectively,an increase of $.01 or 1%. Earningsper share benefited from thereduction in average shares
outstanding resulting from CommonStock purchases in the open marketby the Company. Average sharesoutstanding decreased from 59,425in 2009 to 58,685 in 2010.
LIQUIDITY AND CAPITALRESOURCES
Cash flows from operating activitieswere $50,390, $82,805 and $76,994in 2011, 2010 and 2009,respectively. The $32,415 decreasein cash flows from operatingactivities from 2010 to 2011primarily reflects the 2011 decreasein net earnings, increased accountsreceivables and inventories, and bydecreases in income taxes payableand deferred.
During 2008 the Companycontributed $16,050 to a VEBA trustto fund the estimated future costs ofcertain employee health, welfareand other benefits. The Companyused the funds, as well asinvestment income in this VEBAtrust, to pay the actual cost of suchbenefits during 2010, 2011 and willcontinue to do so through 2012. AtDecember 31, 2011, the VEBA trustheld $6,424 of aggregate cash,cash equivalents and investments;this asset value is included inprepaid expenses in the Company’scurrent and other long-term assets.
Cash flows from investing activitiesreflect capital expenditures of$16,351, $12,813, and $20,831 in2011, 2010 and 2009, respectively,including $3,025 related to the 2011purchase of warehouse space and
Merrill Corp - Tootsie Roll 10-K Tier 2 ED [AUX] | 105123 | 29-Feb-12 11:39 | 11-31190-1.ca | Sequence: 4CHKSUM Content: 12793 Layout: 7518 Graphics: No Graphics CLEAN
JOB: 11-31190-1 CYCLE#;BL#: 8; 0 TRIM: 11" x 8.5" COMPOSITECOLORS: Black, ~note-color 2, ~note-color 3 GRAPHICS: none V1.5

9
land planned for future use. The2011, 2010 and 2009 capitaladditions include $727, $1,682 and$2,326, respectively, relating tocomputer systems and relatedimplementation.
The Company had no bankborrowing or repayments in 2009,2010, or 2011, and had nooutstanding bank borrowings as ofDecember 31, 2010 or 2011.
Financing activities includeCommon Stock purchases andretirements of $18,190, $22,881,and $20,723 in 2011, 2010 and2009, respectively. Cash dividendsof $18,407, $18,130, and $17,825were paid in 2011, 2010 and 2009,respectively. The increase in cashdividends each year reflects theannual 3% stock dividend issued ineach of these years less the effectsof Common Stock purchases andretirements.
SIGNIFICANT ACCOUNTINGPOLICIES AND ESTIMATES
Preparation of the Company’sfinancial statements involvesjudgments and estimates due touncertainties affecting theapplication of accounting policies,and the likelihood that differentamounts would be reported underdifferent conditions or usingdifferent assumptions. TheCompany bases its estimates onhistorical experience and otherassumptions, as discussed herein,that it believes are reasonable. Ifactual amounts are ultimately
different from previous estimates,the revisions are included in theCompany’s results of operations forthe period in which the actualamounts become known. TheCompany’s significant accountingpolicies are discussed in Note 1 tothe Consolidated FinancialStatements.
Following is a summary anddiscussion of the more significantaccounting policies whichmanagement believes to have asignificant impact on theCompany’s operating results,financial position, cash flows andfootnote disclosure.
Revenue recognition
Revenue, net of applicableprovisions for discounts, returns,allowances and certain advertisingand promotional costs, isrecognized when products aredelivered to customers based on acustomer purchase order, andcollectability is reasonably assured.The accounting for promotionalcosts is discussed under“Customer incentive programs,advertising and marketing” below.
Provisions for bad debts arerecorded as selling, marketing andadministrative expenses. Write-offsof bad debts did not exceed 0.1%of net product sales in each of2011, 2010 and 2009, andaccordingly, have not beensignificant to the Company’sfinancial position or results ofoperations.
Intangible assets
The Company’s intangible assetsconsist primarily of acquiredtrademarks and goodwill. Inaccordance with accountingguidance, goodwill and otherindefinite-lived assets are notamortized, but are insteadsubjected to annual testing forimpairment unless certain triggeringevents or circumstances are noted.The Company performs its annualimpairment testing as ofDecember 31. The Company mayutilize third-party professionalvaluation firms to assist in thedetermination of valuation of certainintangibles.
The impairment test is performedby comparing the carrying value ofthe asset with its estimated fairvalue, which is calculated usingestimates, including discountedprojected future cash flows. If thecarrying value exceeds the fairvalue, the second step of theprocess is necessary. The secondstep measures the differencebetween the carrying value andimplied fair value of goodwill. Theseprojected future cash flows aredependent on a number of factorsincluding the execution of businessplans, achievement of projectedsales, including but not limited tofuture price increases, projectedoperating margins, and projectedcapital expenditures. Suchoperating results are alsodependent upon future ingredientand packaging material costs,exchange rates for products
manufactured or sold in foreigncountries, operational efficiencies,cost savings initiatives, andcompetitive factors. Although themajority of the Company’strademarks relate to wellestablished brands with a longhistory of consumer acceptance,projected cash flows are inherentlyuncertain. A change in theassumptions underlying theimpairment analysis, including butnot limited to a reduction inprojected cash flows, the use of adifferent discount rate to discountfuture cash flows or a differentroyalty rate applied to theCompany’s trademarks, couldcause impairment in the future.
Customer incentive programs,advertising and marketing
Advertising and marketing costsare recorded in the period to whichsuch costs relate. The Companydoes not defer the recognition ofany amounts on its consolidatedbalance sheet with respect to suchcosts. Customer incentives andother promotional costs arerecorded at the time of sale basedupon incentive program terms andhistorical utilization statistics, whichare generally consistent from yearto year.
The liabilities associated with theseprograms are reviewed quarterlyand adjusted if utilization ratesdiffer from management’s originalestimates. Such adjustments havenot historically been material to theCompany’s operating results.
Merrill Corp - Tootsie Roll 10-K Tier 2 ED [AUX] | 105123 | 29-Feb-12 11:39 | 11-31190-1.ca | Sequence: 5CHKSUM Content: 22276 Layout: 61148 Graphics: No Graphics CLEAN
JOB: 11-31190-1 CYCLE#;BL#: 8; 0 TRIM: 11" x 8.5" COMPOSITECOLORS: Black, ~note-color 2, ~note-color 3 GRAPHICS: none V1.5
10
Split dollar officer life insurance
The Company provides split dollarlife insurance benefits to certainexecutive officers and records anasset principally equal to thecumulative premiums paid. TheCompany will fully recover thesepremiums in future years under theterms of the plan. The Companyretains a collateral assignment ofthe cash surrender values andpolicy death benefits payable toinsure recovery of these premiums.
Valuation of long-lived assets
Long-lived assets, primarilyproperty, plant and equipment arereviewed for impairment as eventsor changes in businesscircumstances occur indicating thatthe carrying value of the asset maynot be recoverable. The estimatedcash flows produced by assets orasset groups, are compared to theasset carrying value to determinewhether impairment exists. Suchestimates involve considerablemanagement judgment and arebased upon assumptions aboutexpected future operatingperformance. As a result, actualcash flows could differ frommanagement’s estimates due tochanges in business conditions,operating performance, andeconomic and competitiveconditions.
Income taxes
Deferred income taxes arerecognized for future tax effects of
temporary differences betweenfinancial and income tax reportingusing tax rates in effect for theyears in which the differences areexpected to reverse. The Companyrecords valuation allowances insituations where the realization ofdeferred tax assets, including thoserelating to net operating tax losses,is not more-likely-than-not; and theCompany adjusts and releases suchvaluation allowances when realizationbecomes more-likely-than-not asdefined by accounting guidance.The Company periodically reviewsassumptions and estimates of theCompany’s probable tax obligationsand effects on its liability foruncertain tax positions, usinginformed judgment which mayinclude the use of third-partyconsultants, advisors and legalcounsel, and historical experience.
Valuation of investments
Investments, primarily municipalbonds, mutual funds and equitymethod investments are reviewedfor impairment at each reportingperiod by comparing the carryingvalue or amortized cost to the fairmarket value. The Company mayutilize third-party professionalvaluation firms as necessary toassist in the determination of thevalue of investments using avaluation model with Level 3 inputsas defined. In the event that aninvestment security’s fair value isbelow carrying value or amortizedcost, the Company will record another-than-temporary impairment or
a temporary impairment based onaccounting guidance.
Other matters
In the opinion of management,other than contracts for foreigncurrency forwards and rawmaterials, including currency andcommodity hedges andoutstanding purchase orders forpackaging, ingredients, supplies,and operational services, allentered into in the ordinary courseof business, the Company does nothave any significant contractualobligations or future commitments.The Company’s outstandingcontractual commitments as ofDecember 31, 2011, all of whichare generally normal and recurringin nature, are summarized in thechart on page 13.
RECENT ACCOUNTINGPRONOUNCEMENTS
In May 2011, the FinancialAccounting Standards Board (FASB)issued Accounting StandardsUpdate (ASU) 2011-04, “Fair ValueMeasurement (Topic 820):Amendments to Achieve CommonFair Value Measurement andDisclosure Requirements in U.S.GAAP and International FinancialReporting Standards (IFRS).” ASU2011-04 represents convergedguidance between U.S. GAAP andIFRS resulting in commonrequirements for measuring fairvalue and for disclosing informationabout fair value measurements.This new guidance will be effective
for fiscal years beginning afterDecember 15, 2011 andsubsequent interim periods. TheCompany is currently assessing theimpact, if any, on the consolidatedfinancial statements.
In June 2011, the FASB issued ASU2011-05, “Presentation ofComprehensive Income.” ASU2011-05 requires us to presentcomponents of othercomprehensive income and of netincome in one continuous statementof comprehensive income or in twoseparate, but consecutive,statements. The option to reportother comprehensive income withinthe statement of equity has beenremoved. This new presentation ofcomprehensive income will beeffective for fiscal years beginningafter December 15, 2011 andsubsequent interim periods.
In September 2011, the FASB issuedASU 2011-08, “Testing Goodwill forImpairment”. The revised standardis intended to simplify how entitiestest goodwill for impairment. Undercertain circumstances, a two-stepimpairment test may beunnecessary. The revised standardis effective for annual and interimgoodwill impairment tests performedfor fiscal years beginning afterDecember 15, 2011. The Companycurrently believes there will be noimpact on its consolidated financialstatements.
In September 2011, FASB issuedASU 2011-09, “Compensation-Retirement Benefits-Multiemployer
Merrill Corp - Tootsie Roll 10-K Tier 2 ED [AUX] | 105123 | 29-Feb-12 11:39 | 11-31190-1.ca | Sequence: 6CHKSUM Content: 42874 Layout: 58084 Graphics: No Graphics CLEAN
JOB: 11-31190-1 CYCLE#;BL#: 8; 0 TRIM: 11" x 8.5" COMPOSITECOLORS: Black, ~note-color 2, ~note-color 3 GRAPHICS: none V1.5

11
Plans” which amends the guidancein ASC 715-80. The amendments inASU 2011-09 provide additionaldisclosure requirements for entitieswhich participate in multi-employerpension plans. The purpose of thenew disclosures is to providefinancial statement users withinformation about an employer’slevel of participation in and thefinancial health of significant plans.The new disclosures are effectivefor annual periods ending afterDecember 15, 2011. There will beno impact on the Company’sconsolidated financial statementsas the changes relate only toadditional disclosures.
MARKET RISKS
The Company is exposed to marketrisks related to commodity prices,interest rates, investments inmarketable securities, equity priceand foreign exchange.
The Company’s ability to forecastthe direction and scope of changesto its major input costs is impactedby significant volatility in crude oil,sugar, corn, soybean and edibleoils, cocoa and dairy productsmarkets. The prices of thesecommodities are influenced bychanges in global demand,changes in weather and cropyields, changes in governments’farm policies, including mandatesfor ethanol and bio-fuels, andenvironmental matters, includingglobal warming, and fluctuations in
the U.S. dollar relative to dollar-denominated commodities in worldmarkets. The Company believesthat its competitors face the sameor similar challenges.
In order to address the impact ofrising input and other costs, theCompany periodically reviews eachitem in its product portfolio toascertain if price increases, weightdeclines (indirect price increases)or other actions should be taken.These reviews include anevaluation of the risk factors relatingto market place acceptance of suchchanges and their potential effecton future sales volumes. In addition,the estimated cost of packagingmodifications associated withweight changes is evaluated. TheCompany also maintains ongoingcost reduction and productivityimprovement programs underwhich cost savings initiatives areencouraged and progressmonitored. The Company is notable to accurately predict theoutcome of these cost savingsinitiatives and their effects on itsfuture results.
Commodity future and foreigncurrency forward contracts
Commodity price risks relate toingredients, primarily sugar, cocoa,chocolate, corn syrup, dextrose,soybean and edible oils, milk, wheyand gum base ingredients. TheCompany believes its competitorsface similar risks, and the industryhas historically adjusted prices to
compensate for adversefluctuations in commodity costs.The Company, as well ascompetitors in the confectioneryindustry, have taken actions,including price increases andselective product weight declines(indirect price increases) to mitigaterising input costs for ingredients,energy, freight and delivery.Although management seeks tosubstantially recover cost increasesover the long-term, there is risk thatprice increases and weightdeclines cannot be fully passed onto customers and, to the extent theyare passed on, they couldadversely affect customer andconsumer acceptance andresulting sales volume.
The Company utilizes commodityfutures contracts and commodityoptions contracts as well as annualsupply agreements to hedge andplan for anticipated purchases ofcertain ingredients, including sugar,in order to mitigate commodity costfluctuation. The Company also maypurchase forward foreign exchangecontracts to hedge its costs ofmanufacturing certain products inCanada for sale and distribution inthe United States, and periodicallydoes so for purchases ofequipment or raw materials fromforeign suppliers. Such commodityfutures, commodity options andcurrency forward contracts arecash flow hedges and are effectiveas hedges as defined byaccounting guidance. The
unrealized gains and losses onsuch contracts are deferred as acomponent of accumulated othercomprehensive loss and arerecognized as a component ofproduct cost of goods sold whenthe related inventory is sold.
The potential change in fair value ofcommodity and foreign currencyderivative instruments held by theCompany at December 31, 2011,assuming a 10% change in theunderlying contract price, was$1,761. The analysis only includescommodity and foreign currencyderivative instruments and,therefore, does not consider theoffsetting effect of changes in theprice of the underlying commodityor foreign currency. This amount isnot significant compared with thenet earnings and shareholders’equity of the Company.
Interest rates
Interest rate risks primarily relate tothe Company’s investments in taxexempt marketable securities,including ARS, with maturities orauction dates of generally up tothree years.
The majority of the Company’sinvestments, which are classified asavailable for sale, have historicallybeen held until they mature, whichlimits the Company’s exposure tointerest rate fluctuations. Theaccompanying chart summarizesthe maturities of the Company’s
Merrill Corp - Tootsie Roll 10-K Tier 2 ED [AUX] | 105123 | 29-Feb-12 11:39 | 11-31190-1.ca | Sequence: 7CHKSUM Content: 1924 Layout: 35314 Graphics: No Graphics CLEAN
JOB: 11-31190-1 CYCLE#;BL#: 8; 0 TRIM: 11" x 8.5" COMPOSITECOLORS: Black, ~note-color 2, ~note-color 3 GRAPHICS: none V1.5
12
investments in debt securities atDecember 31, 2011.
Less than 1 year . . . . . . $10,8541 – 2 years . . . . . . . . . . 17,7532 – 3 years . . . . . . . . . . 29,133Over 3 years . . . . . . . . . 7,504
Total . . . . . . . . . . . . . . . $65,244
The Company’s outstanding debt atDecember 31, 2011 and 2010 was$7,500 in an industrial revenuebond in which interest rates reseteach week based on the currentmarket rate. Therefore, theCompany does not believe that ithas significant interest rate risk withrespect to its interest bearing debt.
Investment in marketable securities
As stated above, the Companyinvests primarily in tax exemptmarketable securities, includingARS, with maturities or auctiondates generally up to three years.The Company utilizes professionalmoney managers and maintainsinvestment policy guidelines whichemphasize quality and liquidity inorder to minimize the potential lossexposures that could result in theevent of a default or other adverseevent, including failed auctions.
However, given events in themunicipal bond and ARS markets,including failed auctions, theCompany continues to monitorthese investments and markets, aswell as its investment policies.Nonetheless, the financial marketshave been experiencingunprecedented events in recent
years, and future outcomes are lesspredictable than in the past.
Equity price
Equity price risk relates to theCompany’s investments in mutualfunds which are principally used tofund and hedge the Company’sdeferred compensation liabilities. AtDecember 31, 2011, the Companyhas investments in mutual funds,classified as trading securities, of$41,768. Any change in the fairvalue of these trading securities iscompletely offset by acorresponding change in therespective hedged deferredcompensation liability.
Foreign currency
Foreign currency risk principallyrelates to the Company’s foreignoperations in Canada and Mexico,as well as periodic purchasecommitments of machinery andequipment from foreign sources.
Certain of the Company’s Canadianmanufacturing costs, includinglocal payroll and plant operations,and a portion of its packaging andingredients are sourced inCanadian dollars. The Companymay purchase Canadian forwardcontracts to receive Canadiandollars at a specified date in thefuture and uses its Canadian dollarcollections on Canadian sales as apartial hedge of its overallCanadian manufacturingobligations sourced in Canadiandollars. The Company also
periodically purchases and holdsCanadian dollars to facilitate therisk management of these currencychanges.
From time to time, the Companymay use foreign exchange forwardcontracts and derivativeinstruments to mitigate its exposureto foreign exchange risks, as wellas those related to firmcommitments to purchaseequipment from foreign vendors. Asof December 31, 2011, theCompany held foreign exchangeforward contracts with a fair valueof $205.
RISK FACTORS
The Company’s operations andfinancial results are subject to anumber of risks and uncertaintiesthat could adversely affect theCompany’s operating results andfinancial condition. Significant riskfactors, without limitations thatcould impact the Company, are thefollowing: (i) significant competitiveactivity, including advertising,promotional and price competition,and changes in consumer demandfor the Company’s products;(ii) fluctuations in the cost andavailability of commodities andingredients, and packagingmaterials, and the ability to recovercost increases through productsales price increases; (iii) inherentrisks in the marketplace, includinguncertainties about trade andconsumer acceptance of priceincreases and seasonal events
such as Halloween; (iv) the effectof acquisitions on the Company’sresults of operations and financialcondition; (v) the effect of changesin foreign currencies on theCompany’s foreign subsidiariesoperating results, and the effect ofthe fluctuation of the Canadiandollar on products manufactured inCanada and marketed and sold inthe United States in U.S. dollars;(vi) the Company’s reliance on thirdparty vendors for various goods andservices, including commoditiesused for ingredients that areprimarily grown or sourced fromforeign locations; (vii) the Company’sability to successfully implementnew production processes andlines, and new computer softwaresystems; (viii) the effect of changesin assumptions, including discountrates, sales growth and profitmargins and the capability to passalong higher ingredient and otherinput costs through price increases,relating to the Company’simpairment testing and analysis ofits goodwill and trademarks;(ix) changes in the confectionerymarketplace including actionstaken by major retailers andcustomers; (x) customer, consumerand competitor response tomarketing programs and price andproduct weight adjustments, andnew products; (xi) dependence onsignificant customers, includingthe volume and timing of theirpurchases, and availability of shelfspace; (xii) increases in energycosts, including freight and delivery,that cannot be passed along to
Merrill Corp - Tootsie Roll 10-K Tier 2 ED [AUX] | 105123 | 29-Feb-12 11:39 | 11-31190-1.ca | Sequence: 8CHKSUM Content: 14751 Layout: 53378 Graphics: No Graphics CLEAN
JOB: 11-31190-1 CYCLE#;BL#: 8; 0 TRIM: 11" x 8.5" COMPOSITECOLORS: Black, ~note-color 2, ~note-color 3 GRAPHICS: none V1.5

13
customers through increasedprices due to competitive reasons;(xiii) any significant labor stoppages,strikes or production interruptions;(xiv) changes in governmental lawsand regulations including taxes andtariffs; (xv) the adverse effectsshould the Company eithervoluntarily or involuntarily recall itsproduct(s) from the marketplace;(xvi) the risk that the market valueof Company’s investments coulddecline including being classifiedas “other-than-temporary” asdefined; (xvii) the Company’sdependence on its enterpriseresource planning computer systemto manage its supply chain andcustomer deliveries, and the riskthat the Company’s informationtechnology systems fail to performadequately or the Company isunable to protect such informationtechnology systems against datacorruption, cyber-based attacks ornetwork security breaches; and(xviii) the potential effects ofcurrent and future macroeconomicconditions and geopolitical events.
Forward-looking statements
This discussion and certain othersections contain forward-lookingstatements that are based largelyon the Company’s currentexpectations and are madepursuant to the safe harborprovision of the Private SecuritiesLitigation Reform Act of 1995.Forward-looking statements can be
identified by the use of words suchas “anticipated,” “believe,”“expect,” “intend,” “estimate,”“project,” and other words of similarmeaning in connection with adiscussion of future operating orfinancial performance and aresubject to certain factors, risks,trends and uncertainties that couldcause actual results andachievements to differ materiallyfrom those expressed in theforward-looking statements. Suchfactors, risks, trends anduncertainties which in someinstances are beyond theCompany’s control, include theoverall competitive environment inthe Company’s industry, changes inassumptions and judgmentsdiscussed above under theheading “Significant AccountingPolicies and Estimates”, and factorsidentified and referred to aboveunder the heading “Risk Factors.”
The risk factors identified andreferred to above are believed to besignificant factors, but notnecessarily all of the significantfactors that could cause actualresults to differ from thoseexpressed in any forward-lookingstatement. Readers are cautionednot to place undue reliance on suchforward-looking statements, whichare made only as of the date of thisreport. The Company undertakesno obligation to update suchforward-looking statements.
Open Contractual Commitments as of December 31, 2011
Less than 1 to 3 3 to 5 More thanPayable in Total 1 Year Years Years 5 YearsCommodity hedges . . . . . . . $ 4,557 $ 4,538 $ 19 $ — $ —
Foreign currency hedges . . . . . . . 13,044 13,044 — — —
Purchase obligations . . . . 10,373 10,373 — — —
Interest bearing debt . . . . . . . . . 7,500 — — — 7,500
Operating leases . 3,926 1,047 1,836 1,043 — Total . . . . . . . . . . $39,400 $29,002 $1,855 $1,043 $7,500
Note: Commodity hedges and foreign currency hedges reflect theamounts at which the Company will settle the related contracts. Theabove amounts exclude deferred income tax liabilities of $43,521,liabilities for uncertain tax positions of $8,345, postretirement healthcare and life insurance benefits of $26,108 and deferred compensationand other liabilities of $48,092 because the timing of payments relatingto these items cannot be reasonably determined.
Merrill Corp - Tootsie Roll 10-K Tier 2 ED [AUX] | 105123 | 29-Feb-12 11:39 | 11-31190-1.ca | Sequence: 9CHKSUM Content: 25418 Layout: 16745 Graphics: No Graphics CLEAN
JOB: 11-31190-1 CYCLE#;BL#: 8; 0 TRIM: 11" x 8.5" COMPOSITECOLORS: Black, ~note-color 2, ~note-color 3 GRAPHICS: none V1.5
CONSOLIDATED STATEMENTS OF
Earnings, Comprehensive Earnings and Retained EarningsTOOTSIE ROLL INDUSTRIES, INC. AND SUBSIDIARIES (in thousands except per share data)
For the year ended December 31,
2011 2010 2009
Net product sales . . . . . . . . . . . . . . . . . . . . . . . . . . . . . . . . . . . . . . . . . . . . . . . . . . . . . $528,369 $517,149 $495,592Rental and royalty revenue . . . . . . . . . . . . . . . . . . . . . . . . . . . . . . . . . . . . . . . . . . . . . . 4,136 4,299 3,739 Total revenue . . . . . . . . . . . . . . . . . . . . . . . . . . . . . . . . . . . . . . . . . . . . . . . . . . . . . . . . 532,505 521,448 499,331Product cost of goods sold . . . . . . . . . . . . . . . . . . . . . . . . . . . . . . . . . . . . . . . . . . . . . 365,225 349,334 319,775Rental and royalty cost . . . . . . . . . . . . . . . . . . . . . . . . . . . . . . . . . . . . . . . . . . . . . . . . . 1,038 1,088 852 Total costs . . . . . . . . . . . . . . . . . . . . . . . . . . . . . . . . . . . . . . . . . . . . . . . . . . . . . . . . . . . 366,263 350,422 320,627Product gross margin . . . . . . . . . . . . . . . . . . . . . . . . . . . . . . . . . . . . . . . . . . . . . . . . . . 163,144 167,815 175,817Rental and royalty gross margin . . . . . . . . . . . . . . . . . . . . . . . . . . . . . . . . . . . . . . . . . . 3,098 3,211 2,887 Total gross margin . . . . . . . . . . . . . . . . . . . . . . . . . . . . . . . . . . . . . . . . . . . . . . . . . . . . 166,242 171,026 178,704Selling, marketing and administrative expenses . . . . . . . . . . . . . . . . . . . . . . . . . . . . . 108,276 106,316 103,755Impairment charges . . . . . . . . . . . . . . . . . . . . . . . . . . . . . . . . . . . . . . . . . . . . . . . . . . . — — 14,000 Earnings from operations . . . . . . . . . . . . . . . . . . . . . . . . . . . . . . . . . . . . . . . . . . . . . . . 57,966 64,710 60,949Other income (expense), net . . . . . . . . . . . . . . . . . . . . . . . . . . . . . . . . . . . . . . . . . . . . 2,946 8,358 2,100 Earnings before income taxes . . . . . . . . . . . . . . . . . . . . . . . . . . . . . . . . . . . . . . . . . . . 60,912 73,068 63,049Provision for income taxes . . . . . . . . . . . . . . . . . . . . . . . . . . . . . . . . . . . . . . . . . . . . . . 16,974 20,005 9,892 Net earnings . . . . . . . . . . . . . . . . . . . . . . . . . . . . . . . . . . . . . . . . . . . . . . . . . . . . . . . . . $ 43,938 $ 53,063 $ 53,157
Net earnings . . . . . . . . . . . . . . . . . . . . . . . . . . . . . . . . . . . . . . . . . . . . . . . . . . . . . . . . . $ 43,938 $ 53,063 $ 53,157Other comprehensive earnings (loss) . . . . . . . . . . . . . . . . . . . . . . . . . . . . . . . . . . . . . (8,740) 1,183 2,845 Comprehensive earnings . . . . . . . . . . . . . . . . . . . . . . . . . . . . . . . . . . . . . . . . . . . . . . . $ 35,198 $ 54,246 $ 56,002
Retained earnings at beginning of year . . . . . . . . . . . . . . . . . . . . . . . . . . . . . . . . . . . . $135,866 $147,687 $144,949 Net earnings . . . . . . . . . . . . . . . . . . . . . . . . . . . . . . . . . . . . . . . . . . . . . . . . . . . . . 43,938 53,063 53,157 Cash dividends . . . . . . . . . . . . . . . . . . . . . . . . . . . . . . . . . . . . . . . . . . . . . . . . . . . (18,360) (18,078) (17,790) Stock dividends . . . . . . . . . . . . . . . . . . . . . . . . . . . . . . . . . . . . . . . . . . . . . . . . . . . (47,175) (46,806) (32,629) Retained earnings at end of year . . . . . . . . . . . . . . . . . . . . . . . . . . . . . . . . . . . . . . . . . $114,269 $135,866 $147,687 Earnings per share . . . . . . . . . . . . . . . . . . . . . . . . . . . . . . . . . . . . . . . . . . . . . . . . . . . . $ 0.76 $ 0.90 $ 0.89 Average Common and Class B Common shares outstanding . . . . . . . . . . . . . . . . . . . 57,892 58,685 59,425
(The accompanying notes are an integral part of these statements.)
14
Merrill Corp - Tootsie Roll 10-K Tier 2 ED [AUX] | 105123 | 29-Feb-12 11:39 | 11-31190-1.da | Sequence: 1CHKSUM Content: 7460 Layout: 10130 Graphics: No Graphics CLEAN
JOB: 11-31190-1 CYCLE#;BL#: 8; 0 TRIM: 11" x 8.5" COMPOSITECOLORS: Black, ~note-color 2, ~note-color 3 GRAPHICS: none V1.5

15
CONSOLIDATED STATEMENTS OF
Financial PositionTOOTSIE ROLL INDUSTRIES, INC. AND SUBSIDIARIES (in thousands)
Assets December 31,
2011 2010
CURRENT ASSETS: Cash and cash equivalents . . . . . . . . . . . . . . . . . . . . . . . . . . . . . . . . . . . . . . . . . . . . . . . . . . . . . . . . . . . . $ 78,612 $115,976 Investments . . . . . . . . . . . . . . . . . . . . . . . . . . . . . . . . . . . . . . . . . . . . . . . . . . . . . . . . . . . . . . . . . . . . . . . . 10,895 7,996 Accounts receivable trade, less allowances of $1,731 and $1,531 . . . . . . . . . . . . . . . . . . . . . . . . . . . . . 41,895 37,394 Other receivables . . . . . . . . . . . . . . . . . . . . . . . . . . . . . . . . . . . . . . . . . . . . . . . . . . . . . . . . . . . . . . . . . . . . 3,391 9,961 Inventories: Finished goods and work-in-process . . . . . . . . . . . . . . . . . . . . . . . . . . . . . . . . . . . . . . . . . . . . . . . . . 42,676 35,416 Raw materials and supplies . . . . . . . . . . . . . . . . . . . . . . . . . . . . . . . . . . . . . . . . . . . . . . . . . . . . . . . . 29,084 21,236 Prepaid expenses . . . . . . . . . . . . . . . . . . . . . . . . . . . . . . . . . . . . . . . . . . . . . . . . . . . . . . . . . . . . . . . . . . . 5,070 6,499 Deferred income taxes . . . . . . . . . . . . . . . . . . . . . . . . . . . . . . . . . . . . . . . . . . . . . . . . . . . . . . . . . . . . . . . . 578 689
Total current assets . . . . . . . . . . . . . . . . . . . . . . . . . . . . . . . . . . . . . . . . . . . . . . . . . . . . . . . . . . . 212,201 235,167 PROPERTY, PLANT AND EQUIPMENT, at cost: Land . . . . . . . . . . . . . . . . . . . . . . . . . . . . . . . . . . . . . . . . . . . . . . . . . . . . . . . . . . . . . . . . . . . . . . . . . . . . . . 21,939 21,619 Buildings . . . . . . . . . . . . . . . . . . . . . . . . . . . . . . . . . . . . . . . . . . . . . . . . . . . . . . . . . . . . . . . . . . . . . . . . . . 107,567 102,934 Machinery and equipment . . . . . . . . . . . . . . . . . . . . . . . . . . . . . . . . . . . . . . . . . . . . . . . . . . . . . . . . . . . . . 322,993 307,178 Construction in progress . . . . . . . . . . . . . . . . . . . . . . . . . . . . . . . . . . . . . . . . . . . . . . . . . . . . . . . . . . . . . . 2,598 9,243 455,097 440,974 Less—Accumulated depreciation . . . . . . . . . . . . . . . . . . . . . . . . . . . . . . . . . . . . . . . . . . . . . . . . . . . . . . . 242,935 225,482
Net property, plant and equipment . . . . . . . . . . . . . . . . . . . . . . . . . . . . . . . . . . . . . . . . . . . . . . . 212,162 215,492 OTHER ASSETS: Goodwill . . . . . . . . . . . . . . . . . . . . . . . . . . . . . . . . . . . . . . . . . . . . . . . . . . . . . . . . . . . . . . . . . . . . . . . . . . . 73,237 73,237 Trademarks . . . . . . . . . . . . . . . . . . . . . . . . . . . . . . . . . . . . . . . . . . . . . . . . . . . . . . . . . . . . . . . . . . . . . . . . 175,024 175,024 Investments . . . . . . . . . . . . . . . . . . . . . . . . . . . . . . . . . . . . . . . . . . . . . . . . . . . . . . . . . . . . . . . . . . . . . . . . 96,161 64,461 Split dollar officer life insurance . . . . . . . . . . . . . . . . . . . . . . . . . . . . . . . . . . . . . . . . . . . . . . . . . . . . . . . . . 74,209 74,441 Prepaid expenses . . . . . . . . . . . . . . . . . . . . . . . . . . . . . . . . . . . . . . . . . . . . . . . . . . . . . . . . . . . . . . . . . . . 3,212 6,680 Equity method investment . . . . . . . . . . . . . . . . . . . . . . . . . . . . . . . . . . . . . . . . . . . . . . . . . . . . . . . . . . . . . 3,935 4,254 Deferred income taxes . . . . . . . . . . . . . . . . . . . . . . . . . . . . . . . . . . . . . . . . . . . . . . . . . . . . . . . . . . . . . . . . 7,715 9,203
Total other assets . . . . . . . . . . . . . . . . . . . . . . . . . . . . . . . . . . . . . . . . . . . . . . . . . . . . . . . . . . . . . 433,493 407,300 Total assets . . . . . . . . . . . . . . . . . . . . . . . . . . . . . . . . . . . . . . . . . . . . . . . . . . . . . . . . . . . . . . . . . . . . . . . . $857,856 $857,959 (The accompanying notes are an integral part of these statements.)
Merrill Corp - Tootsie Roll 10-K Tier 2 ED [AUX] | 105123 | 29-Feb-12 11:39 | 11-31190-1.da | Sequence: 2CHKSUM Content: 46195 Layout: 10650 Graphics: No Graphics CLEAN
JOB: 11-31190-1 CYCLE#;BL#: 8; 0 TRIM: 11" x 8.5" COMPOSITECOLORS: Black, ~note-color 2, ~note-color 3 GRAPHICS: none V1.5
16
(in thousands except per share data)
Liabilities and Shareholders’ Equity December 31,
2011 2010
CURRENT LIABILITIES: Accounts payable . . . . . . . . . . . . . . . . . . . . . . . . . . . . . . . . . . . . . . . . . . . . . . . . . . . . . . . . . . . . . . . . . . . $ 10,683 $ 9,791 Dividends payable . . . . . . . . . . . . . . . . . . . . . . . . . . . . . . . . . . . . . . . . . . . . . . . . . . . . . . . . . . . . . . . . . . . 4,603 4,529 Accrued liabilities . . . . . . . . . . . . . . . . . . . . . . . . . . . . . . . . . . . . . . . . . . . . . . . . . . . . . . . . . . . . . . . . . . . . 43,069 44,185
Total current liabilities . . . . . . . . . . . . . . . . . . . . . . . . . . . . . . . . . . . . . . . . . . . . . . . . . . . . . . . . . 58,355 58,505 NONCURRENT LIABILITES: Deferred income taxes . . . . . . . . . . . . . . . . . . . . . . . . . . . . . . . . . . . . . . . . . . . . . . . . . . . . . . . . . . . . . . . . 43,521 47,865 Postretirement health care and life insurance benefits . . . . . . . . . . . . . . . . . . . . . . . . . . . . . . . . . . . . . . . 26,108 20,689 Industrial development bonds . . . . . . . . . . . . . . . . . . . . . . . . . . . . . . . . . . . . . . . . . . . . . . . . . . . . . . . . . . 7,500 7,500 Liability for uncertain tax positions . . . . . . . . . . . . . . . . . . . . . . . . . . . . . . . . . . . . . . . . . . . . . . . . . . . . . . . 8,345 9,835 Deferred compensation and other liabilities . . . . . . . . . . . . . . . . . . . . . . . . . . . . . . . . . . . . . . . . . . . . . . . 48,092 46,157
Total noncurrent liabilities . . . . . . . . . . . . . . . . . . . . . . . . . . . . . . . . . . . . . . . . . . . . . . . . . . . . . . 133,566 132,046 SHAREHOLDERS’ EQUITY: Common stock, $.69-4/9 par value— 120,000 shares authorized— 36,479 and 36,057, respectively, issued . . . . . . . . . . . . . . . . . . . . . . . . . . . . . . . . . . . . . . . . . . . . . . . . 25,333 25,040 Class B common stock, $.69-4/9 par value— 40,000 shares authorized— 21,025 and 20,466, respectively, issued . . . . . . . . . . . . . . . . . . . . . . . . . . . . . . . . . . . . . . . . . . . . . . . . 14,601 14,212 Capital in excess of par value . . . . . . . . . . . . . . . . . . . . . . . . . . . . . . . . . . . . . . . . . . . . . . . . . . . . . . . . . . 533,677 505,495 Retained earnings, per accompanying statement . . . . . . . . . . . . . . . . . . . . . . . . . . . . . . . . . . . . . . . . . . . 114,269 135,866 Accumulated other comprehensive loss . . . . . . . . . . . . . . . . . . . . . . . . . . . . . . . . . . . . . . . . . . . . . . . . . . (19,953) (11,213) Treasury stock (at cost)— 71 shares and 69 shares, respectively . . . . . . . . . . . . . . . . . . . . . . . . . . . . . . . . . . . . . . . . . . . . . . . . . . (1,992) (1,992)
Total shareholders’ equity . . . . . . . . . . . . . . . . . . . . . . . . . . . . . . . . . . . . . . . . . . . . . . . . . . . . . . 665,935 667,408 Total liabilities and shareholders’ equity . . . . . . . . . . . . . . . . . . . . . . . . . . . . . . . . . . . . . . . . . . . . . . . . . . $857,856 $857,959
Merrill Corp - Tootsie Roll 10-K Tier 2 ED [AUX] | 105123 | 29-Feb-12 11:39 | 11-31190-1.da | Sequence: 3CHKSUM Content: 16862 Layout: 38711 Graphics: No Graphics CLEAN
JOB: 11-31190-1 CYCLE#;BL#: 8; 0 TRIM: 11" x 8.5" COMPOSITECOLORS: Black, ~note-color 2, ~note-color 3 GRAPHICS: none V1.5

17
CONSOLIDATED STATEMENTS OF
Cash FlowsTOOTSIE ROLL INDUSTRIES, INC. AND SUBSIDIARIES (in thousands)
For the year ended December 31,
2011 2010 2009 CASH FLOWS FROM OPERATING ACTIVITIES: Net earnings . . . . . . . . . . . . . . . . . . . . . . . . . . . . . . . . . . . . . . . . . . . . . . . . . . . . . . . . . . . . . . . . $ 43,938 $ 53,063 $ 53,157 Adjustments to reconcile net earnings to net cash provided by operating activities: Depreciation . . . . . . . . . . . . . . . . . . . . . . . . . . . . . . . . . . . . . . . . . . . . . . . . . . . . . . . . . . . . 19,229 18,279 17,862 Impairment charges . . . . . . . . . . . . . . . . . . . . . . . . . . . . . . . . . . . . . . . . . . . . . . . . . . . . . . — — 14,000 Impairment of equity method investment . . . . . . . . . . . . . . . . . . . . . . . . . . . . . . . . . . . . . . — — 4,400 Loss from equity method investment . . . . . . . . . . . . . . . . . . . . . . . . . . . . . . . . . . . . . . . . . 194 342 233 Amortization of marketable security premiums . . . . . . . . . . . . . . . . . . . . . . . . . . . . . . . . . . 1,267 522 320 Changes in operating assets and liabilities: Accounts receivable . . . . . . . . . . . . . . . . . . . . . . . . . . . . . . . . . . . . . . . . . . . . . . . . . . (5,448) 717 (5,899) Other receivables . . . . . . . . . . . . . . . . . . . . . . . . . . . . . . . . . . . . . . . . . . . . . . . . . . . . 3,963 (2,373) (2,088) Inventories . . . . . . . . . . . . . . . . . . . . . . . . . . . . . . . . . . . . . . . . . . . . . . . . . . . . . . . . . (15,631) (1,447) 455 Prepaid expenses and other assets . . . . . . . . . . . . . . . . . . . . . . . . . . . . . . . . . . . . . . 5,106 4,936 5,203 Accounts payable and accrued liabilities . . . . . . . . . . . . . . . . . . . . . . . . . . . . . . . . . 84 2,180 (2,755) Income taxes payable and deferred . . . . . . . . . . . . . . . . . . . . . . . . . . . . . . . . . . . . . . (5,772) 2,322 (12,543) Postretirement health care and life insurance benefits . . . . . . . . . . . . . . . . . . . . . . . . 2,022 1,429 1,384 Deferred compensation and other liabilities . . . . . . . . . . . . . . . . . . . . . . . . . . . . . . . . 2,146 2,525 2,960 Other . . . . . . . . . . . . . . . . . . . . . . . . . . . . . . . . . . . . . . . . . . . . . . . . . . . . . . . . . . . . . . (708) 310 305 Net cash provided by operating activities . . . . . . . . . . . . . . . . . . . . . . . . . . . . . . . . . . . . . . . . . . 50,390 82,805 76,994 CASH FLOWS FROM INVESTING ACTIVITIES: Capital expenditures . . . . . . . . . . . . . . . . . . . . . . . . . . . . . . . . . . . . . . . . . . . . . . . . . . . . . . . . . . (16,351) (12,813) (20,831) Net purchases of trading securities . . . . . . . . . . . . . . . . . . . . . . . . . . . . . . . . . . . . . . . . . . . . . . . (3,234) (2,902) (1,713) Purchase of available for sale securities . . . . . . . . . . . . . . . . . . . . . . . . . . . . . . . . . . . . . . . . . . . (39,252) (9,301) (11,331) Sale and maturity of available for sale securities . . . . . . . . . . . . . . . . . . . . . . . . . . . . . . . . . . . . 7,680 8,208 17,511 Net cash used in investing activities . . . . . . . . . . . . . . . . . . . . . . . . . . . . . . . . . . . . . . . . . . . . . . (51,157) (16,808) (16,364) CASH FLOWS FROM FINANCING ACTIVITIES: Shares purchased and retired . . . . . . . . . . . . . . . . . . . . . . . . . . . . . . . . . . . . . . . . . . . . . . . . . . . (18,190) (22,881) (20,723) Dividends paid in cash . . . . . . . . . . . . . . . . . . . . . . . . . . . . . . . . . . . . . . . . . . . . . . . . . . . . . . . . (18,407) (18,130) (17,825) Net cash used in financing activities . . . . . . . . . . . . . . . . . . . . . . . . . . . . . . . . . . . . . . . . . . . . . . (36,597) (41,011) (38,548) Increase (decrease) in cash and cash equivalents . . . . . . . . . . . . . . . . . . . . . . . . . . . . . . . . . . . . . . . (37,364) 24,986 22,082Cash and cash equivalents at beginning of year . . . . . . . . . . . . . . . . . . . . . . . . . . . . . . . . . . . . . . . . 115,976 90,990 68,908 Cash and cash equivalents at end of year . . . . . . . . . . . . . . . . . . . . . . . . . . . . . . . . . . . . . . . . . . . . . $ 78,612 $115,976 $ 90,990 Supplemental cash flow information: Income taxes paid . . . . . . . . . . . . . . . . . . . . . . . . . . . . . . . . . . . . . . . . . . . . . . . . . . . . . . . . . . . . $ 16,906 $ 20,586 $ 22,364 Interest paid . . . . . . . . . . . . . . . . . . . . . . . . . . . . . . . . . . . . . . . . . . . . . . . . . . . . . . . . . . . . . . . . . $ 38 $ 49 $ 182 Stock dividend issued . . . . . . . . . . . . . . . . . . . . . . . . . . . . . . . . . . . . . . . . . . . . . . . . . . . . . . . . . $ 47,053 $ 46,683 $ 32,538
(The accompanying notes are an integral part of these statements.)
Merrill Corp - Tootsie Roll 10-K Tier 2 ED [AUX] | 105123 | 29-Feb-12 11:39 | 11-31190-1.da | Sequence: 4CHKSUM Content: 2894 Layout: 49487 Graphics: No Graphics CLEAN
JOB: 11-31190-1 CYCLE#;BL#: 8; 0 TRIM: 11" x 8.5" COMPOSITECOLORS: Black, ~note-color 2, ~note-color 3 GRAPHICS: none V1.5
18
Notes to Consolidated Financial Statements ($ in thousands except per share data)
TOOTSIE ROLL INDUSTRIES, INC. AND SUBSIDIARIES
NOTE 1—SIGNIFICANT ACCOUNTING POLICIES:
Basis of consolidation:
The consolidated financial statements include the accounts of Tootsie Roll Industries, Inc.and its wholly-owned subsidiaries (the Company), which are primarily engaged in themanufacture and sales of candy products. All significant intercompany transactions have beeneliminated.
The preparation of financial statements in conformity with generally accepted accountingprinciples in the United States of America requires management to make estimates andassumptions that affect the reported amounts of assets and liabilities and disclosure of contingentassets and liabilities at the date of the financial statements and the reported amounts of revenuesand expenses during the reporting period. Actual results could differ from those estimates.
Revenue recognition:
Products are sold to customers based on accepted purchase orders which include quantity,sales price and other relevant terms of sale. Revenue, net of applicable provisions for discounts,returns, allowances and certain advertising and promotional costs, is recognized when productsare delivered to customers and collectability is reasonably assured. Shipping and handlingcosts of $45,850, $43,034, and $38,628 in 2011, 2010 and 2009, respectively, are included inselling, marketing and administrative expenses. Accounts receivable are unsecured. Revenuesfrom a major customer aggregated approximately 23.3%, 21.4% and 22.9% of net productsales during the years ended December 31, 2011, 2010 and 2009, respectively.
Cash and cash equivalents:
The Company considers temporary cash investments with an original maturity of three monthsor less to be cash equivalents.
Investments:
Investments consist of various marketable securities with maturities of generally up to threeyears. The Company classifies debt and equity securities as either available for sale or trading.Available for sale securities are not actively traded by the Company and are carried at fair value.The Company follows current fair value measurement guidance and unrealized gains and losseson these securities are excluded from earnings and are reported as a separate component ofshareholders’ equity, net of applicable taxes, until realized or other than temporarily impaired.Trading securities relate to deferred compensation arrangements and are carried at fair valuewith gains or losses included in other income (expense), net. The Company invests in tradingsecurities to economically hedge changes in its deferred compensation liabilities.
The Company regularly reviews its investments to determine whether a decline in fair valuebelow the cost basis is other than temporary. If the decline in fair value is judged to be otherthan temporary, the cost basis of the security is written down to fair value and the amount of thewrite-down is included in other income (expense), net. Further information regarding the fairvalue of the Company’s investments is included in Note 10 to the Consolidated FinancialStatements.
Derivative instruments and hedging activities:
Authoritative guidance requires qualitative disclosures about objectives and strategies forusing derivatives, quantitative disclosures about fair value amounts of derivative instrumentsand related gains and losses, and disclosures about credit-risk-related contingent features inderivative agreements.
From time to time, the Company enters into commodity futures, commodity options contractsand foreign currency forward contracts. Commodity futures and options are intended and areeffective as hedges of market price risks associated with the anticipated purchase of certainraw materials (primarily sugar). Foreign currency forward contracts are intended and areeffective as hedges of the Company’s exposure to the variability of cash flows, primarily relatedto the foreign exchange rate changes of products manufactured in Canada and sold in theUnited States, and periodic equipment purchases from foreign suppliers denominated in aforeign currency. The Company does not engage in trading or other speculative use of derivativeinstruments. Further information regarding derivative instruments and hedging activities isincluded in Note 11 to the Consolidated Financial Statements.
Inventories:Inventories are stated at cost, not to exceed market. The cost of substantially all of the
Company’s inventories ($67,339 and $52,863 at December 31, 2011 and 2010, respectively)has been determined by the last-in, first-out (LIFO) method. The excess of current cost overLIFO cost of inventories approximates $24,043 and $19,379 at December 31, 2011 and 2010,respectively. The cost of certain foreign inventories ($4,421 and $3,789 at December 31, 2011and 2010, respectively) has been determined by the first-in, first-out (FIFO) method. Rebates,discounts and other cash consideration received from vendors related to inventory purchasesis reflected as a reduction in the cost of the related inventory item, and is therefore reflected incost of sales when the related inventory item is sold.
Property, plant and equipment:Depreciation is computed for financial reporting purposes by use of the straight-line method
based on useful lives of 20 to 35 years for buildings and 5 to 20 years for machinery andequipment. Depreciation expense was $19,229, $18,279 and $17,862 in 2011, 2010 and 2009,respectively.
Carrying value of long-lived assets:The Company reviews long-lived assets to determine if there are events or circumstances
indicating that the amount of the asset reflected in the Company’s balance sheet may not berecoverable. When such indicators are present, the Company compares the carrying value ofthe long-lived asset, or asset group, to the future undiscounted cash flows of the underlyingassets to determine if an impairment exists. If applicable, an impairment charge would berecorded to write down the carrying value to its fair value. The determination of fair value involvesthe use of estimates of future cash flows that involve considerable management judgment andare based upon assumptions about expected future operating performance. The actual cashflows could differ from management’s estimates due to changes in business conditions,operating performance, and economic conditions. No impairment charges of long-lived assetswere recorded by the Company during 2011, 2010 and 2009.
Postretirement health care and life insurance benefits:The Company provides certain postretirement health care and life insurance benefits. The
cost of these postretirement benefits is accrued during employees’ working careers. TheCompany also provides split dollar life benefits to certain executive officers. The Companyrecords an asset equal to the cumulative insurance premiums paid that will be recovered uponthe death of covered employees or earlier under the terms of the plan. No premiums were paidin 2011, 2010 and 2009.
Goodwill and intangible assets:In accordance with authoritative guidance, goodwill and intangible assets with indefinite lives
are not amortized, but rather tested for impairment at least annually unless certain interim
Merrill Corp - Tootsie Roll 10-K Tier 2 ED [AUX] | 105123 | 29-Feb-12 11:40 | 11-31190-1.ea | Sequence: 1CHKSUM Content: 23682 Layout: 32448 Graphics: No Graphics CLEAN
JOB: 11-31190-1 CYCLE#;BL#: 8; 0 TRIM: 11" x 8.5" COMPOSITECOLORS: Black, ~note-color 2, ~note-color 3 GRAPHICS: none V1.5

triggering events or circumstances require more frequent testing. All trademarks have beenassessed by management to have indefinite lives because they are expected to generate cashflows indefinitely. The Company has completed its annual impairment testing of its goodwilland trademarks at December 31 of each of the years presented. As of December 31, 2009,management ascertained that certain trademarks were impaired, and recorded a pre-tax chargeof $14,000. No impairments of intangibles were recorded in 2011 and 2010.
This determination is made by comparing the carrying value of the asset with its estimated fairvalue, which is calculated using estimates including discounted projected future cash flows. Ifthe carrying value of goodwill exceeds the fair value, a second step would measure the carryingvalue and implied fair value of goodwill. Management believes that all assumptions used for theimpairment tests are consistent with those utilized by market participants performing similarvaluations.
Income taxes:Deferred income taxes are recorded and recognized for future tax effects of temporary
differences between financial and income tax reporting. The Company records valuationallowances in situations where the realization of deferred tax assets is not more-likely-than-not.Federal income taxes are provided on the portion of income of foreign subsidiaries that isexpected to be remitted to the U.S. and become taxable, but not on the portion that isconsidered to be permanently invested in the foreign subsidiary.
Foreign currency translation:The U.S. dollar is used as the functional currency where a substantial portion of the subsidiary’s
business is indexed to the U.S. dollar or where its manufactured products are principally soldin the U.S. All other foreign subsidiaries use the local currency as their functional currency.Where the U.S. dollar is used as the functional currency, foreign currency remeasurements arerecorded as a charge or credit to other income (expense), net in the statement of earnings.Where the foreign local currency is used as the functional currency, translation adjustments arerecorded as a separate component of accumulated other comprehensive (loss).
Equity method investment:The Company’s 50% interest in two foreign companies is accounted for using the equity
method. The Company records an increase in its investment to the extent of its share of earnings,and reduces its investment to the extent of losses and dividends received. No dividends werepaid in 2011, 2010 and 2009.
As of December 31, 2009, management determined that the fair value of the asset was lessthan the carrying value. As a result, the Company recorded a pre-tax impairment charge of$4,400 in the fourth quarter 2009, resulting in an adjusted carrying value of $4,961 as ofDecember 31, 2009. The fair value was primarily assessed using the present value of estimatedfuture cash flows. No impairments were recorded in 2011 and 2010.
Comprehensive earnings:Comprehensive earnings includes net earnings, foreign currency translation adjustments and
unrealized gains/losses on commodity and/or foreign currency hedging contracts, available forsale securities and certain postretirement benefit obligations.
Earnings per share:A dual presentation of basic and diluted earnings per share is not required due to the lack of
potentially dilutive securities under the Company’s simple capital structure. Therefore, allearnings per share amounts represent basic earnings per share.
The Class B Common Stock has essentially the same rights as Common Stock, except thateach share of Class B Common Stock has ten votes per share (compared to one vote per shareof Common Stock), is not traded on any exchange, is restricted as to transfer and is convertibleon a share-for-share basis, at any time and at no cost to the holders, into shares of CommonStock which are traded on the New York Stock Exchange.
Use of estimates:The preparation of consolidated financial statements in conformity with accounting principles
generally accepted in the U.S. requires management to make estimates and assumptions thataffect the amounts reported. Estimates are used when accounting for sales discounts, allowancesand incentives, product liabilities, assets recorded at fair value, income taxes, depreciation,amortization, employee benefits, contingencies and intangible asset and liability valuations. Forinstance, in determining the annual post-employment benefit costs, the Company estimates thecost of future health care benefits. Actual results may or may not differ from those estimates.
Retrospective application of change in accounting principle:During the fourth quarter of fiscal 2011, the Company changed the method used to compute
the LIFO value of its domestic inventories. The change was largely driven by the fact that theCompany has made changes in the business model over the last several years to achieveefficiencies in manufacturing, distribution and marketing processes and therefore combinedmultiple LIFO pools into a single LIFO pool to better reflect these changes. The Company hasapplied this change retrospectively, adjusting all prior periods presented. The cumulative effectof the change on retained earnings as of January 1, 2009, was a reduction of $174, with offsetsto inventories and deferred taxes. For 2010, inventories and deferred income taxes reflectdecreases of $2,424 and $878, respectively. For 2010 and 2009, product cost of goods soldincreased $1,021 and $1,130, respectively; provision for income taxes decreased $370 and$409, respectively.
Recent accounting pronouncements:In May 2011, the Financial Accounting Standards Board (FASB) issued Accounting Standards
Update (ASU) 2011-04, “Fair Value Measurement (Topic 820): Amendments to Achieve CommonFair Value Measurement and Disclosure Requirements in U.S. GAAP and International FinancialReporting Standards (IFRS).” ASU 2011-04 represents converged guidance between U.S.GAAP and IFRS resulting in common requirements for measuring fair value and for disclosinginformation about fair value measurements. This new guidance will be effective for fiscal yearsbeginning after December 15, 2011 and subsequent interim periods. The Company is currentlyassessing the impact, if any, on the consolidated financial statements.
In June 2011, the FASB issued ASU 2011-05, “Presentation of Comprehensive Income.”ASU 2011-05 requires the Company to present components of other comprehensive incomeand of net income in one continuous statement of comprehensive income, or in two separate,but consecutive statements. The option to report other comprehensive income within thestatement of equity has been removed. This new presentation of comprehensive income will beeffective for fiscal years beginning after December 15, 2011 and subsequent interim periods.
In September 2011, the FASB issued ASU 2011-08, “Testing Goodwill for Impairment”. Therevised standard is intended to simplify how entities test goodwill for impairment. Under certaincircumstances, a two-step impairment test may be unnecessary. The revised standard iseffective for annual and interim goodwill impairment tests performed for fiscal years beginningafter December 15, 2011. The Company currently believes there will be no impact on itsconsolidated financial statements.
19
Merrill Corp - Tootsie Roll 10-K Tier 2 ED [AUX] | 105123 | 29-Feb-12 11:40 | 11-31190-1.ea | Sequence: 2CHKSUM Content: 48954 Layout: 17792 Graphics: No Graphics CLEAN
JOB: 11-31190-1 CYCLE#;BL#: 8; 0 TRIM: 11" x 8.5" COMPOSITECOLORS: Black, ~note-color 2, ~note-color 3 GRAPHICS: none V1.5
In September 2011, FASB issued ASU 2011-09, “Compensation-Retirement Benefits-Multiemployer Plans” which amends the guidance in ASC 715-80. The amendments inASU 2011-09 provide additional disclosure requirements for entities which participate in multi-employer pension plans. The purpose of the new disclosures is to provide financial statementusers with information about an employer’s level of participation in and the financial health ofsignificant plans. The new disclosures are effective for annual periods ending afterDecember 15, 2011. There will be no impact on the Company’s consolidated financialstatements as the changes relate only to additional disclosures.
NOTE 2—ACCRUED LIABILITIES:
Accrued liabilities are comprised of the following:
December 31,
2011 2010 Compensation . . . . . . . . . . . . . . . . . . . . . . . . . . . . . . . . . . . . . . . . . . . . . . . . . . $ 8,817 $ 9,750Other employee benefits . . . . . . . . . . . . . . . . . . . . . . . . . . . . . . . . . . . . . . . . . . 2,004 2,030Taxes, other than income . . . . . . . . . . . . . . . . . . . . . . . . . . . . . . . . . . . . . . . . . 1,954 1,966Advertising and promotions . . . . . . . . . . . . . . . . . . . . . . . . . . . . . . . . . . . . . . . 20,568 20,775Other . . . . . . . . . . . . . . . . . . . . . . . . . . . . . . . . . . . . . . . . . . . . . . . . . . . . . . . . . 9,726 9,664 $43,069 $44,185
NOTE 3—INDUSTRIAL DEVELOPMENT BONDS:
Industrial development bonds are due in 2027. The average floating interest rate was 0.3%and 0.4% in 2011 and 2010, respectively. See Note 10 to the Consolidated Financial Statementsfor fair value disclosures.
NOTE 4—INCOME TAXES:
The domestic and foreign components of pretax income are as follows:
2011 2010 2009 Domestic . . . . . . . . . . . . . . . . . . . . . . . . . . . . . . . . . . . . . . . . . $56,651 $59.308 $68,649Foreign . . . . . . . . . . . . . . . . . . . . . . . . . . . . . . . . . . . . . . . . . . 4,261 13,760 (5,600) $60,912 $73,068 $63,049
The provision for income taxes is comprised of the following:
2011 2010 2009 Current: Federal . . . . . . . . . . . . . . . . . . . . . . . . . . . . . . . . . . . . . . . . . $15,568 $10,251 $ 21,836 Foreign . . . . . . . . . . . . . . . . . . . . . . . . . . . . . . . . . . . . . . . . . 559 806 500 State . . . . . . . . . . . . . . . . . . . . . . . . . . . . . . . . . . . . . . . . . . . 863 1,455 1,665 16,990 12,512 24,001 Deferred: Federal . . . . . . . . . . . . . . . . . . . . . . . . . . . . . . . . . . . . . . . . . (1,230) 5,622 (432) Foreign . . . . . . . . . . . . . . . . . . . . . . . . . . . . . . . . . . . . . . . . . 1,221 2,518 (12,987) State . . . . . . . . . . . . . . . . . . . . . . . . . . . . . . . . . . . . . . . . . . . (7) (647) (690) (16) 7,493 (14,109) $16,974 $20,005 $ 9,892
Significant components of the Company’s net deferred tax liability at year end were as follows: December 31, 2011 2010 Deferred tax assets: Accrued customer promotions . . . . . . . . . . . . . . . . . . . . . . . . . . . . . . . . . . . . $ 1,920 $ 1,634 Deferred compensation . . . . . . . . . . . . . . . . . . . . . . . . . . . . . . . . . . . . . . . . . 15,593 11,602 Postretirement benefits . . . . . . . . . . . . . . . . . . . . . . . . . . . . . . . . . . . . . . . . . 9,139 6,596 Other accrued expenses . . . . . . . . . . . . . . . . . . . . . . . . . . . . . . . . . . . . . . . . 6,347 5,475 Foreign subsidiary tax loss carry forward . . . . . . . . . . . . . . . . . . . . . . . . . . . 16,406 16,582 Tax credit carry forward . . . . . . . . . . . . . . . . . . . . . . . . . . . . . . . . . . . . . . . . . 841 978 Realized capital losses . . . . . . . . . . . . . . . . . . . . . . . . . . . . . . . . . . . . . . . . . 1,349 — Unrealized capital loss . . . . . . . . . . . . . . . . . . . . . . . . . . . . . . . . . . . . . . . . . . 6,401 6,566 57,996 49,433 Valuation reserve . . . . . . . . . . . . . . . . . . . . . . . . . . . . . . . . . . . . . . . . . . . . . . (2,190) (686) Total deferred tax assets . . . . . . . . . . . . . . . . . . . . . . . . . . . . . . . . . . . . . . . . $55,806 $48,747 Deferred tax liabilities: Depreciation . . . . . . . . . . . . . . . . . . . . . . . . . . . . . . . . . . . . . . . . . . . . . . . . . . $35,103 $32,376 Deductible goodwill and trademarks . . . . . . . . . . . . . . . . . . . . . . . . . . . . . . . 38,635 35,790 Accrued export company commissions . . . . . . . . . . . . . . . . . . . . . . . . . . . . 4,649 4,532 Employee benefit plans . . . . . . . . . . . . . . . . . . . . . . . . . . . . . . . . . . . . . . . . . 2,248 3,506 Inventory reserves . . . . . . . . . . . . . . . . . . . . . . . . . . . . . . . . . . . . . . . . . . . . . 1,733 1,871 Prepaid insurance . . . . . . . . . . . . . . . . . . . . . . . . . . . . . . . . . . . . . . . . . . . . . 289 377 Accounts receivable . . . . . . . . . . . . . . . . . . . . . . . . . . . . . . . . . . . . . . . . . . . 733 624 Deferred gain on sale of real estate . . . . . . . . . . . . . . . . . . . . . . . . . . . . . . . . 7,644 7,644 Total deferred tax liabilities . . . . . . . . . . . . . . . . . . . . . . . . . . . . . . . . . . . . . . . $91,034 $86,720 Net deferred tax liability . . . . . . . . . . . . . . . . . . . . . . . . . . . . . . . . . . . . . . . . . $35,228 $37,973
At December 31, 2011, the Company recognized $3,854 of benefits related to capital losscarry forwards. The carry forward losses will begin to expire in 2013. A valuation allowance hasbeen established for the carry forward losses to reduce the future income tax benefits toamounts expected to be realized.
At December 31, 2011 the Company recognized $841 of benefits related to foreign subsidiarytax credit carry forwards. The carry forward credits expire in 2017. A valuation allowance hasbeen established for the carry forward losses to reduce the future income tax benefits toamounts expected to be realized.
At December 31, 2011, the tax benefits of foreign subsidiary tax loss carry forwards expiringby year are as follows: $697 in 2014, $2,672 in 2015, $366 in 2026, $640 in 2027, $6,578 in2028, $4,681 in 2029 and $772 in 2031.
Certain out of period items have been included in the 2011 provision that are immaterialindividually and in the aggregate. The effective income tax rate differs from the statutory rateas follows: 2011 2010 2009 U.S. statutory rate . . . . . . . . . . . . . . . . . . . . . . . . . . . . . . . . . . . . . . . . . . 35.0% 35.0% 35.0%State income taxes, net . . . . . . . . . . . . . . . . . . . . . . . . . . . . . . . . . . . . . . 1.2 1.1 1.7Exempt municipal bond interest . . . . . . . . . . . . . . . . . . . . . . . . . . . . . . . (0.5) (0.4) (0.7)Foreign tax rates . . . . . . . . . . . . . . . . . . . . . . . . . . . . . . . . . . . . . . . . . . . (0.4) (2.0) (4.9)Release of prior period valuation allowances . . . . . . . . . . . . . . . . . . . . . — — (13.3)Qualified domestic production activities deduction . . . . . . . . . . . . . . . . (2.5) (2.6) (2.0)Tax credits receivable . . . . . . . . . . . . . . . . . . . . . . . . . . . . . . . . . . . . . . . (0.4) (0.2) (0.4)Adjustment of deferred tax balances . . . . . . . . . . . . . . . . . . . . . . . . . . . (1.7) — —Reserve for uncertain tax benefits . . . . . . . . . . . . . . . . . . . . . . . . . . . . . (0.6) (2.3) 1.3Other, net . . . . . . . . . . . . . . . . . . . . . . . . . . . . . . . . . . . . . . . . . . . . . . . . . (2.2) (1.2) (1.0) Effective income tax rate . . . . . . . . . . . . . . . . . . . . . . . . . . . . . . . . . . . . . 27.9% 27.4% 15.7%
20
Merrill Corp - Tootsie Roll 10-K Tier 2 ED [AUX] | 105123 | 29-Feb-12 11:40 | 11-31190-1.ea | Sequence: 3CHKSUM Content: 60988 Layout: 40072 Graphics: No Graphics CLEAN
JOB: 11-31190-1 CYCLE#;BL#: 8; 0 TRIM: 11" x 8.5" COMPOSITECOLORS: Black, ~note-color 2, ~note-color 3 GRAPHICS: none V1.5

In connection with the acquisition in 2004 of Concord Confections, a Canadian subsidiary,the Company established an inter-company financing structure which included a loan from theU.S. parent to the Canadian subsidiary. By December of 2006, significant operating losses hadaccumulated in Canada and management determined that the realization of the net operatingloss carry forward benefits was not more-likely-than-not, and provided a full tax valuationallowance. Consistent with relevant accounting guidance, these benefits continued to bereserved through 2008 and through the third quarter of 2009.
In December of 2008, a new U.S./Canada income tax treaty (Treaty) was ratified whicheffectively denies certain inter-company interest benefits to the U.S. shareholder of a Canadiancompany. Accordingly, in December of 2009, the Company decided to recapitalize its Canadianoperations effective January 1, 2010. During the fourth quarter of 2009, the Company consideredall of the evidence and relevant accounting guidance related to this recapitalization and basedon reasonable assumptions, the Company concluded that it was more-likely-than-not that itwould realize substantially all of the deferred tax assets related to the Canadian net operatingloss carry forward benefits because it is expected that sufficient levels of income will begenerated in the foreseeable future. As a result, the Company released $8.4 million of priorperiod valuation allowances and $2.3 million of allowances that were provided through the firstnine months of 2009.
The Treaty also introduced a phase out of the withholding tax on payments from Canada tothe U.S. allowing the Company to qualify for a zero percent withholding rate in 2010 if certainrequirements of the Treaty were met. On January 4, 2010, the Canadian subsidiary repaidaccrued interest to its U.S. parent in a manner consistent with these requirements. As a result,$1.5 million of withholding taxes accrued for 2007 and 2008 and through the third quarter of2009 were released in the fourth quarter of 2009.
The Company has not provided for U.S. federal or foreign withholding taxes on $6,410 and$4,787 of foreign subsidiaries’ undistributed earnings as of December 31, 2011 andDecember 31, 2010, respectively, because such earnings are considered to be permanentlyreinvested. It is not practicable to determine the amount of income taxes that would be payableupon remittance of the undistributed earnings.
The Company recognizes interest and penalties related to unrecognized tax benefits in theprovision for income taxes on the Consolidated Statements of Earnings.
At December 31, 2011 and 2010, the Company had unrecognized tax benefits of $6,804 and$8,138, respectively. Included in this balance is $4,199 and $4,949, respectively, ofunrecognized tax benefits that, if recognized, would favorably affect the annual effective incometax rate. As of December 31, 2011 and 2010, $1,541 and $1,697, respectively, of interest andpenalties were included in the liability for uncertain tax positions.
A reconciliation of the beginning and ending balances of the total amounts of unrecognizedtax benefits is as follows:
2011 2010 2009 Unrecognized tax benefits at January 1 . . . . . . . . . . . . . . . . . . . . . . . . . $8,138 $14,370 $13,069Increases in tax positions for the current year . . . . . . . . . . . . . . . . . . . . . 320 632 2,661Reductions in tax positions for lapse of statute of limitations . . . . . . . . . (668) (1,122) (514)Reductions in tax positions for withdrawal of positions previously taken . . — (5,256) —Reductions in tax positions for effective settlements . . . . . . . . . . . . . . . . (986) (486) (846) Unrecognized tax benefits at December 31 . . . . . . . . . . . . . . . . . . . . . . $6,804 $ 8,138 $14,370
The Company is subject to taxation in the U.S. and various state and foreign jurisdictions.The Company remains subject to examination by U.S. federal and state and foreign taxauthorities for the years 2008 through 2010. With few exceptions, the Company is no longersubject to examinations by tax authorities for the year 2007 and prior.
The Company is currently subject to a U.S. federal examination for tax year 2009. The fieldwork has not yet concluded and the Company is unable to determine the outcome at this time.The Company’s Canadian subsidiary is currently subject to examination by the CanadaRevenue Agency for tax years 2005 and 2006. The Company is unable to determine theoutcome of the examination at this time. In addition, the Company is currently subject to variousstate tax examinations. One of the state examinations has been effectively settled and thecorresponding liability for unrecognized tax benefits has been reduced. Although the Companyis unable to determine the ultimate outcome of the ongoing examinations, the Companybelieves that its liability for uncertain tax positions relating to these jurisdictions for such yearsis adequate.
Beginning in 2008, statutory income tax rates in Canada will be reduced five percentagepoints with the final rate reduction coming in 2014. Accordingly in 2009, the Company’sCanadian subsidiary has revalued its deferred tax assets and liabilities based on the rate ineffect for the year the differences are expected to reverse.
NOTE 5—SHARE CAPITAL AND CAPITAL IN EXCESS OF PAR VALUE:
Capital in Class B Excess Common Stock Common Stock Treasury Stock of Par Shares Amount Shares Amount Shares Amount Value (000’s) (000’s) (000’s) Balance at January 1, 2009 . . . . . . . . . . . . 35,658 $24,762 19,357 $13,442 (65) $(1,992) $470,927Issuance of 3% stock dividend . . . . . . . . . 1,064 739 580 403 (2) — 31,396Conversion of Class B common shares to common shares . . . . . . . . . . . . . . . . . . . . 18 12 (18) (12) — — —
Purchase and retirement of common shares . . . . . . . . . . . . . . . . . . . . . . . . . . . . (938) (651) — — — — (20,073)
Balance at December 31, 2009 . . . . . . . . . 35,802 24,862 19,919 13,833 (67) (1,992) 482,250Issuance of 3% stock dividend . . . . . . . . . 1,070 743 597 414 (2) — 45,526Conversion of Class B common shares to common shares . . . . . . . . . . . . . . . . . . . . 50 35 (50) (35) — — —
Purchase and retirement of common shares . . . . . . . . . . . . . . . . . . . . . . . . . . . . (865) (600) — — — — (22,281)
Balance at December 31, 2010 . . . . . . . . . 36,057 25,040 20,466 14,212 (69) (1,992) 505,495Issuance of 3% stock dividend . . . . . . . . . 1,077 748 612 426 (2) — 45,880Conversion of Class B common shares to common shares . . . . . . . . . . . . . . . . . . . . 53 37 (53) (37) — — —
Purchase and retirement of common shares . . . . . . . . . . . . . . . . . . . . . . . . . . . . (708) (492) — — — — (17,698)
Balance at December 31, 2011 . . . . . . . . . 36,479 $25,333 21,025 $14,601 (71) $(1,992) $533,677
Average shares outstanding and all per share amounts included in the financial statements andnotes thereto have been adjusted retroactively to reflect annual three percent stock dividends.
21
Merrill Corp - Tootsie Roll 10-K Tier 2 ED [AUX] | 105123 | 29-Feb-12 11:40 | 11-31190-1.ea | Sequence: 4CHKSUM Content: 11395 Layout: 371 Graphics: No Graphics CLEAN
JOB: 11-31190-1 CYCLE#;BL#: 8; 0 TRIM: 11" x 8.5" COMPOSITECOLORS: Black, ~note-color 2, ~note-color 3 GRAPHICS: none V1.5
While the Company does not have a formal or publicly announced Company Common Stockpurchase program, the Company’s board of directors periodically authorizes a dollar amountfor such share purchases.
Based upon this policy, shares were purchased and retired as follows: Total Number of SharesYear Purchased (000’s) Average Price Paid Per Share 2011 . . . . . . . . . . . . . . . . . . . . . . . . . . . . . . . . 708 $25.642010 . . . . . . . . . . . . . . . . . . . . . . . . . . . . . . . . 865 $26.412009 . . . . . . . . . . . . . . . . . . . . . . . . . . . . . . . . 938 $22.05
NOTE 6—OTHER INCOME (EXPENSE), NET:
Other income (expense), net is comprised of the following: 2011 2010 2009 Interest and dividend income . . . . . . . . . . . . . . . . . . . . . . . . . . . . . $1,087 $ 879 $ 1,439Gains (losses) on trading securities relating to deferred compensation plans . . . . . . . . . . . . . . . . . . . . . . . . . . . 29 3,364 4,524Interest expense . . . . . . . . . . . . . . . . . . . . . . . . . . . . . . . . . . . . . . . (121) (142) (243)Impairment of equity method investment . . . . . . . . . . . . . . . . . . . . — — (4,400)Equity method investment loss . . . . . . . . . . . . . . . . . . . . . . . . . . . . (194) (342) (233)Foreign exchange gains (losses) . . . . . . . . . . . . . . . . . . . . . . . . . . 2,098 4,090 951Capital gains (losses) . . . . . . . . . . . . . . . . . . . . . . . . . . . . . . . . . . . (227) (28) (38)Miscellaneous, net . . . . . . . . . . . . . . . . . . . . . . . . . . . . . . . . . . . . . 274 537 100 $2,946 $8,358 $ 2,100
As of December 31, 2009, management determined that the carrying value of an equitymethod investment was impaired as a result of accumulated losses from operations and reviewof future expectations. The Company recorded a pre-tax impairment charge of $4,400 resultingin an adjusted carrying value of $4,961 as of December 31, 2009. The fair value was primarilyassessed using the present value of estimated future cash flows.
NOTE 7—EMPLOYEE BENEFIT PLANS:
Pension plans:The Company sponsors defined contribution pension plans covering certain non-union
employees with over one year of credited service. The Company’s policy is to fund pensioncosts accrued based on compensation levels. Total pension expense for 2011, 2010 and 2009approximated $4,011, $4,196 and $4,178, respectively. The Company also maintains certainprofit sharing and retirement savings-investment plans. Company contributions in 2011, 2010and 2009 to these plans were $1,024, $1,043 and $1,011, respectively.
The Company also contributes to multi-employer defined benefit pension plan for certain ofits union employees under a collective bargaining agreement which expires on September 30,2012, as follows:
Plan name: Bakery and Confectionery Union and Industry International Pension FundEmployer Identification Number and plan number: 52-6118572, plan number 001Funded Status as of the most recent year available: 86.51% funded as of January 1, 2010The Company’s contributions to such plan: $2,046, $1,923 and $1,633 in 2011, 2010 and
2009, respectively Plan status: Not in reorganization and not insolvent as of December 31, 2010
Although the Company has been advised that the plan is currently in an underfunded status,the relative position of each employer associated with the multi-employer plan with respect to
the actuarial present value of benefits and net plan assets is not determinable by the Company.The Company’s annual contributions do not exceed 5% of total contributions to the Plan.
Deferred compensation:The Company sponsors three deferred compensation plans for selected executives and other
employees: (i) the Excess Benefit Plan, which restores retirement benefits lost due to IRSlimitations on contributions to tax-qualified plans, (ii) the Supplemental Plan, which allows eligibleemployees to defer the receipt of eligible compensation until designated future dates and(iii) the Career Achievement Plan, which provides a deferred annual incentive award to selectedexecutives. Participants in these plans earn a return on amounts due them based on severalinvestment options, which mirror returns on underlying investments (primarily mutual funds).The Company economically hedges its obligations under the plans by investing in the actualunderlying investments. These investments are classified as trading securities and are carriedat fair value. At December 31, 2011 and 2010, these investments totaled $41,768 and $38,504,respectively. All gains and losses and related investment income in these investments, whichare recorded in other income (expense), net, are equally offset by corresponding increasesand decreases in the Company’s deferred compensation liabilities.
Postretirement health care and life insurance benefit plans:The Company provides certain postretirement health care and life insurance benefits for
corporate office and management employees based upon their age, years of service, date ofhire and if they agree to contribute a portion of the cost as determined by the Company. TheCompany has the right to modify or terminate these benefits and does not fund postretirementhealth care and life insurance benefits in advance of payments for benefit claims. TheCompany is currently contemplating changes to its postretirement health care and lifeinsurance benefits with the intention of reducing the Company’s cost of providing such benefits.These changes are likely to include increasing retiree premium contributions, reducing andeliminating certain benefits, and taking steps to ensure that the Company does not becomesubject to the excise tax on high value coverage instituted by the Patient Protection andAffordability Act. The Company is not presently able to determine the effects of such changeson its financial statements.
Amounts recognized in accumulated other comprehensive loss (pre-tax) at December 31,2011 are as follows:Prior service credit . . . . . . . . . . . . . . . . . . . . . . . . . . . . . . . . . . . . . . . . . . . . . $ (626)Net actuarial loss . . . . . . . . . . . . . . . . . . . . . . . . . . . . . . . . . . . . . . . . . . . . . . 8,255 Net amount recognized in accumulated other comprehensive loss . . . . . . . $7,629
The estimated actuarial loss and prior service credit to be amortized from accumulated othercomprehensive income into net periodic benefit cost during 2012 are $1,146 and $(125),respectively.
The changes in the accumulated postretirement benefit obligation at December 31, 2011 and2010 consist of the following: December 31 2011 2010 Benefit obligation, beginning of year . . . . . . . . . . . . . . . . . . . . . . . . . . . . . . . . $20,689 $16,674Service cost . . . . . . . . . . . . . . . . . . . . . . . . . . . . . . . . . . . . . . . . . . . . . . . . . . . 831 696Interest cost . . . . . . . . . . . . . . . . . . . . . . . . . . . . . . . . . . . . . . . . . . . . . . . . . . . 1,117 958Actuarial loss . . . . . . . . . . . . . . . . . . . . . . . . . . . . . . . . . . . . . . . . . . . . . . . . . . 3,898 2,714Benefits paid . . . . . . . . . . . . . . . . . . . . . . . . . . . . . . . . . . . . . . . . . . . . . . . . . . (427) (353) Benefit obligation, end of year . . . . . . . . . . . . . . . . . . . . . . . . . . . . . . . . . . . . . $26,108 $20,689
22
Merrill Corp - Tootsie Roll 10-K Tier 2 ED [AUX] | 105123 | 29-Feb-12 11:40 | 11-31190-1.ea | Sequence: 5CHKSUM Content: 11567 Layout: 45860 Graphics: No Graphics CLEAN
JOB: 11-31190-1 CYCLE#;BL#: 8; 0 TRIM: 11" x 8.5" COMPOSITECOLORS: Black, ~note-color 2, ~note-color 3 GRAPHICS: none V1.5
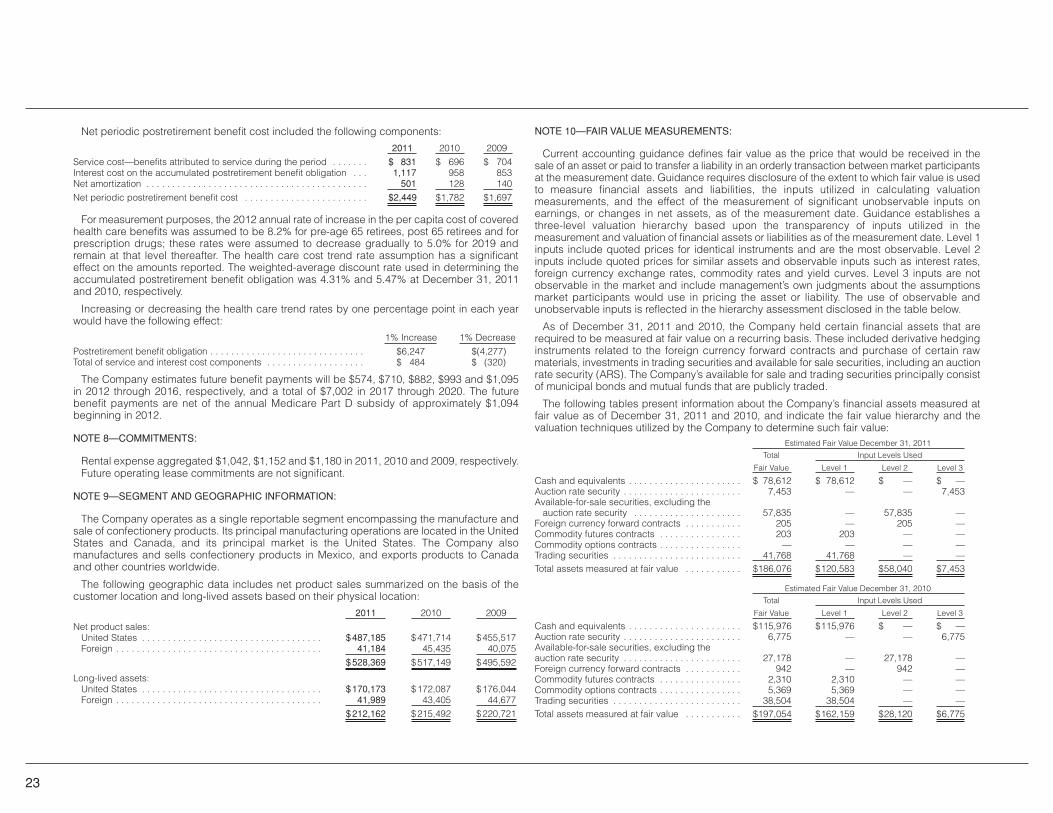
Net periodic postretirement benefit cost included the following components: 2011 2010 2009 Service cost—benefits attributed to service during the period . . . . . . . $ 831 $ 696 $ 704Interest cost on the accumulated postretirement benefit obligation . . . 1,117 958 853Net amortization . . . . . . . . . . . . . . . . . . . . . . . . . . . . . . . . . . . . . . . . . . . 501 128 140 Net periodic postretirement benefit cost . . . . . . . . . . . . . . . . . . . . . . . . $2,449 $1,782 $1,697
For measurement purposes, the 2012 annual rate of increase in the per capita cost of coveredhealth care benefits was assumed to be 8.2% for pre-age 65 retirees, post 65 retirees and forprescription drugs; these rates were assumed to decrease gradually to 5.0% for 2019 andremain at that level thereafter. The health care cost trend rate assumption has a significanteffect on the amounts reported. The weighted-average discount rate used in determining theaccumulated postretirement benefit obligation was 4.31% and 5.47% at December 31, 2011and 2010, respectively.
Increasing or decreasing the health care trend rates by one percentage point in each yearwould have the following effect: 1% Increase 1% Decrease Postretirement benefit obligation . . . . . . . . . . . . . . . . . . . . . . . . . . . . . . $6,247 $(4,277)Total of service and interest cost components . . . . . . . . . . . . . . . . . . . $ 484 $ (320)
The Company estimates future benefit payments will be $574, $710, $882, $993 and $1,095in 2012 through 2016, respectively, and a total of $7,002 in 2017 through 2020. The futurebenefit payments are net of the annual Medicare Part D subsidy of approximately $1,094beginning in 2012.
NOTE 8—COMMITMENTS:
Rental expense aggregated $1,042, $1,152 and $1,180 in 2011, 2010 and 2009, respectively.Future operating lease commitments are not significant.
NOTE 9—SEGMENT AND GEOGRAPHIC INFORMATION:
The Company operates as a single reportable segment encompassing the manufacture andsale of confectionery products. Its principal manufacturing operations are located in the UnitedStates and Canada, and its principal market is the United States. The Company alsomanufactures and sells confectionery products in Mexico, and exports products to Canadaand other countries worldwide.
The following geographic data includes net product sales summarized on the basis of thecustomer location and long-lived assets based on their physical location: 2011 2010 2009 Net product sales: United States . . . . . . . . . . . . . . . . . . . . . . . . . . . . . . . . . . . $487,185 $471,714 $455,517 Foreign . . . . . . . . . . . . . . . . . . . . . . . . . . . . . . . . . . . . . . . . 41,184 45,435 40,075 $528,369 $517,149 $495,592 Long-lived assets: United States . . . . . . . . . . . . . . . . . . . . . . . . . . . . . . . . . . . $170,173 $172,087 $176,044 Foreign . . . . . . . . . . . . . . . . . . . . . . . . . . . . . . . . . . . . . . . . 41,989 43,405 44,677 $212,162 $215,492 $220,721
NOTE 10—FAIR VALUE MEASUREMENTS:
Current accounting guidance defines fair value as the price that would be received in thesale of an asset or paid to transfer a liability in an orderly transaction between market participantsat the measurement date. Guidance requires disclosure of the extent to which fair value is usedto measure financial assets and liabilities, the inputs utilized in calculating valuationmeasurements, and the effect of the measurement of significant unobservable inputs onearnings, or changes in net assets, as of the measurement date. Guidance establishes athree-level valuation hierarchy based upon the transparency of inputs utilized in themeasurement and valuation of financial assets or liabilities as of the measurement date. Level 1inputs include quoted prices for identical instruments and are the most observable. Level 2inputs include quoted prices for similar assets and observable inputs such as interest rates,foreign currency exchange rates, commodity rates and yield curves. Level 3 inputs are notobservable in the market and include management’s own judgments about the assumptionsmarket participants would use in pricing the asset or liability. The use of observable andunobservable inputs is reflected in the hierarchy assessment disclosed in the table below.
As of December 31, 2011 and 2010, the Company held certain financial assets that arerequired to be measured at fair value on a recurring basis. These included derivative hedginginstruments related to the foreign currency forward contracts and purchase of certain rawmaterials, investments in trading securities and available for sale securities, including an auctionrate security (ARS). The Company’s available for sale and trading securities principally consistof municipal bonds and mutual funds that are publicly traded.
The following tables present information about the Company’s financial assets measured atfair value as of December 31, 2011 and 2010, and indicate the fair value hierarchy and thevaluation techniques utilized by the Company to determine such fair value: Estimated Fair Value December 31, 2011 Total Input Levels Used
Fair Value Level 1 Level 2 Level 3 Cash and equivalents . . . . . . . . . . . . . . . . . . . . . . $ 78,612 $ 78,612 $ — $ —Auction rate security . . . . . . . . . . . . . . . . . . . . . . . 7,453 — — 7,453Available-for-sale securities, excluding the
auction rate security . . . . . . . . . . . . . . . . . . . . . 57,835 — 57,835 —Foreign currency forward contracts . . . . . . . . . . . 205 — 205 —Commodity futures contracts . . . . . . . . . . . . . . . . 203 203 — —Commodity options contracts . . . . . . . . . . . . . . . . — — — —Trading securities . . . . . . . . . . . . . . . . . . . . . . . . . 41,768 41,768 — — Total assets measured at fair value . . . . . . . . . . . $186,076 $120,583 $58,040 $7,453
Estimated Fair Value December 31, 2010 Total Input Levels Used
Fair Value Level 1 Level 2 Level 3 Cash and equivalents . . . . . . . . . . . . . . . . . . . . . . $115,976 $115,976 $ — $ —Auction rate security . . . . . . . . . . . . . . . . . . . . . . . 6,775 — — 6,775Available-for-sale securities, excluding the auction rate security . . . . . . . . . . . . . . . . . . . . . . . 27,178 — 27,178 —Foreign currency forward contracts . . . . . . . . . . . 942 — 942 —Commodity futures contracts . . . . . . . . . . . . . . . . 2,310 2,310 — —Commodity options contracts . . . . . . . . . . . . . . . . 5,369 5,369 — —Trading securities . . . . . . . . . . . . . . . . . . . . . . . . . 38,504 38,504 — — Total assets measured at fair value . . . . . . . . . . . $197,054 $162,159 $28,120 $6,775
23
Merrill Corp - Tootsie Roll 10-K Tier 2 ED [AUX] | 105123 | 29-Feb-12 11:40 | 11-31190-1.ea | Sequence: 6CHKSUM Content: 42961 Layout: 13734 Graphics: No Graphics CLEAN
JOB: 11-31190-1 CYCLE#;BL#: 8; 0 TRIM: 11" x 8.5" COMPOSITECOLORS: Black, ~note-color 2, ~note-color 3 GRAPHICS: none V1.5
Available for sale securities which utilize Level 2 inputs consist primarily of municipal bonds,which are valued based on quoted market prices or alternative pricing sources with reasonablelevels of price transparency.
A summary of the aggregate fair value, gross unrealized gains, gross unrealized losses,realized losses and amortized cost basis of the Company’s investment portfolio by major securitytype is as follows: December 31, 2011
Amortized Fair Unrealized Realized
Available for Sale: Cost Value Gains Losses Losses Auction rate security . . . . . . . . . . . . . . . . $ 8,410 $ 7,453 $ — $ (957) $—Municipal bonds . . . . . . . . . . . . . . . . . . . 57,389 57,791 402 — —Mutual funds . . . . . . . . . . . . . . . . . . . . . . 45 44 — (1) — $65,844 $65,288 $402 $ (958) $—
December 31, 2010
Amortized Fair Unrealized Realized
Available for Sale: Cost Value Gains Losses Losses Auction rate security . . . . . . . . . . . . . . . . $ 8,410 $ 6,775 $ — $(1,635) $—Municipal bonds . . . . . . . . . . . . . . . . . . . 27,073 27,122 49 — —Mutual funds . . . . . . . . . . . . . . . . . . . . . . 56 56 — — — $35,539 $33,953 $ 49 $(1,635) $—
As of December 31, 2011, the Company’s long-term investments included an auction ratesecurity, Jefferson County Alabama Sewer Revenue Refunding Warrants, reported at a fairvalue of $7,453, after reflecting a $5,140 other-than-temporary impairment and a $957temporary, as defined, decline in market value against its $13,550 par value. Thisother-than-temporary impairment was recorded in other income (expense), net in 2008. In 2008,this auction rate security was determined to be other-than-temporarily impaired due to theduration and severity of the decline in fair value. The Company estimated the fair value of thisauction rate security utilizing a valuation model with Level 3 inputs.
This valuation model considered, among other items, the credit risk of the collateral underlyingthe auction rate security, the credit risk of the bond insurer, interest rates, and the amount andtiming of expected future cash flows including the Company’s assumption about the marketexpectation of the next successful auction. See also the Management’s Discussion and Analysisof Financial Condition and Results of Operations regarding Jefferson County auction rate security.
The Company classified this auction rate security as non-current and has included it in long-terminvestments on the Consolidated Statements of Financial Position at December 31, 2011 and2010 because the Company believes that the current condition of the auction rate securitymarket may take more than twelve months to improve.
The following table presents additional information about the Company’s financial instruments(all ARS) measured at fair value on a recurring basis using Level 3 inputs at December 31,2011 and 2010: 2011 2010 Balance at January 1 . . . . . . . . . . . . . . . . . . . . . . . . . . . . . . . . . . . . . . . . . . . . . . . . . $6,775 $7,710Unrealized loss recognized in other comprehensive loss . . . . . . . . . . . . . . . . . . . . 678 (935) Balance at December 31 . . . . . . . . . . . . . . . . . . . . . . . . . . . . . . . . . . . . . . . . . . . . . $7,453 $6,775
The $7,500 carrying amount of the Company’s industrial revenue development bonds atDecember 31, 2011 and 2010 approximates its estimated fair value as the bonds have a floatinginterest rate.
In addition to assets and liabilities that are recorded at fair value on a recurring basis, guidancerequires the Company to record assets and liabilities at fair value on a nonrecurring basisgenerally as a result of impairment charges. Assets measured at fair value on a nonrecurringbasis during 2009 are summarized below: Twelve Months Ended December 31, 2009 Pre-Impairment 2009 Level Used to Determine Cost Impairment New Cost New Cost Basis Basis Charge Basis Level 1 Level 2 Level 3 Equity method investment . . . . . $ 9,361 $ 4,400 $ 4,961 $— $— $ 4,961Trademarks . . . . . . . . . . . . . . . . . 189,024 14,000 175,024 — — 175,024 Total . . . . . . . . . . . . . . . . . . . . . . . $198,385 $18,400 $179,985 $— $— $179,985
As discussed in Note 6, during the fourth quarter of 2009 the Company recognized animpairment of $4,400 in an equity method investment based on Level 3 inputs.
As discussed in Note 13, during the fourth quarter of 2009 the Company recognized atrademark impairment of $14,000 based on Level 3 inputs.
NOTE 11—DERIVATIVE INSTRUMENTS AND HEDGING ACTIVITIES:
From time to time, the Company uses derivative instruments, including foreign currencyforward contracts, commodity futures contracts and commodity option contracts, to manageits exposures to foreign exchange and commodity prices. Commodity futures contracts andmost commodity option contracts are intended and effective as hedges of market price risksassociated with the anticipated purchase of certain raw materials (primarily sugar). Foreigncurrency forward contracts are intended and effective as hedges of the Company’s exposureto the variability of cash flows, primarily related to the foreign exchange rate changes of productsmanufactured in Canada and sold in the United States, and periodic equipment purchasesfrom foreign suppliers denominated in a foreign currency. The Company does not engage intrading or other speculative use of derivative instruments.
The Company recognizes all derivative instruments as either assets or liabilities at fair valuein the Consolidated Statements of Financial Position. Derivative assets are recorded in otherreceivables and derivative liabilities are recorded in accrued liabilities. The Company useseither hedge accounting or mark-to-market accounting for its derivative instruments. Derivativesthat qualify for hedge accounting are designated as cash flow hedges by formally documentingthe hedge relationships, including identification of the hedging instruments, the hedged itemsand other critical terms, as well as the Company’s risk management objectives and strategiesfor undertaking the hedge transaction.
Changes in the fair value of the Company’s cash flow hedges are recorded in accumulatedother comprehensive loss, net of tax, and are reclassified to earnings in the periods in whichearnings are affected by the hedged item. Substantially all amounts reported in accumulatedother comprehensive loss for commodity derivatives are expected to be reclassified to cost ofgoods sold. Substantially all amounts reported in accumulated other comprehensive loss forforeign currency derivatives are expected to be reclassified to other income (expense), net.
24
Merrill Corp - Tootsie Roll 10-K Tier 2 ED [AUX] | 105123 | 29-Feb-12 11:40 | 11-31190-1.ea | Sequence: 7CHKSUM Content: 26934 Layout: 18980 Graphics: No Graphics CLEAN
JOB: 11-31190-1 CYCLE#;BL#: 8; 0 TRIM: 11" x 8.5" COMPOSITECOLORS: Black, ~note-color 2, ~note-color 3 GRAPHICS: none V1.5

The following table summarizes the Company’s outstanding derivative contracts and theireffects on its Consolidated Statements of Financial Position at December 31, 2011 and 2010: December 31, 2011 Notional Amounts Assets Liabilities Derivatives designated as hedging instruments: Foreign currency forward contracts . . . . . . . . . . . . . . . . . . . . . . $13,044 $ 205 $ — Commodity futures contracts . . . . . . . . . . . . . . . . . . . . . . . . . . . 4,557 341 (138) Commodity option contracts . . . . . . . . . . . . . . . . . . . . . . . . . . . . — — — Total derivatives . . . . . . . . . . . . . . . . . . . . . . . . . . . . . . . . . . . . . . $ 546 $(138)
December 31, 2010 Notional Amounts Assets Liabilities Derivatives designated as hedging instruments: Foreign currency forward contracts . . . . . . . . . . . . . . . . . . . . . . $ 3,572 $ 942 $ — Commodity futures contracts . . . . . . . . . . . . . . . . . . . . . . . . . . . 4,407 2,310 — Commodity option contracts . . . . . . . . . . . . . . . . . . . . . . . . . . . . 10,344 5,481 (112) Total derivatives . . . . . . . . . . . . . . . . . . . . . . . . . . . . . . . . . . . . . . $8,733 $(112)
The effects of derivative instruments on the Company’s Consolidated Statement of Earnings,Comprehensive Earnings and Retained Earnings for years ended December 31, 2011 and2010 are as follows: For Year Ended December 31, 2011 Gain (Loss) Gain (Loss) on Amount Excluded Gain (Loss) Reclassified from from Effectiveness Recognized Accumulated OCI Testing Recognized in OCI into Earnings in Earnings Foreign currency forward contracts . . . . . . . . . . . . . . $ 317 $1,054 $—Commodity futures contracts . . . . . . . . . . . . . . . . . . . 4,674 6,782 —Commodity option contracts . . . . . . . . . . . . . . . . . . . (5,388) (305) — Total . . . . . . . . . . . . . . . . . . . . . . . . . . . . . . . . . . . . . . $ (397) $7,531 $—
For Year Ended December 31, 2010 Gain (Loss) Gain (Loss) on Amount Excluded Gain (Loss) Reclassified from from Effectiveness Recognized Accumulated OCI Testing Recognized in OCI into Earnings in Earnings Foreign currency forward contracts . . . . . . . . . . . . . . $ 467 $3,199 $—Commodity futures contracts . . . . . . . . . . . . . . . . . . . 2,120 (191) —Commodity option contracts . . . . . . . . . . . . . . . . . . . 4,726 (357) — Total . . . . . . . . . . . . . . . . . . . . . . . . . . . . . . . . . . . . . . $ 7,313 $2,651 $—
For the years ended December 31, 2011 and 2010, the Company recognized a loss of $0and $1,613 in earnings, respectively, related to mark-to-market accounting for certain commodityoption contracts.
NOTE 12—COMPREHENSIVE EARNINGS (LOSS):
The following table sets forth information with respect to accumulated other comprehensiveearnings (loss):
Unrealized Gain (Loss) on Foreign Accumulated Currency Postretirement Other Translation and Comprehensive Adjustment Investments Derivatives Pension Benefits Earnings (Loss) Balance at January 1, 2009 . . . . . . . . . $(14,292) $ 191 $ 220 $(1,360) $(15,241) Unrealized gains (losses) . . . . . . . . . 1,183 (709) 4,341 109 4,924 (Gains) losses reclassified to net earnings . . . . . . . . . . . . . . . . . — — (1,015) — (1,015) Tax effect . . . . . . . . . . . . . . . . . . . . . (118) 263 (1,232) 23 (1,064) Net of tax amount . . . . . . . . . . . . . . . 1,065 (446) 2,094 132 2,845 Balance at December 31, 2009 . . . . . (13,227) (255) 2,314 (1,228) (12,396) Unrealized gains (losses) . . . . . . . . . 856 (1,179) 7,313 (3,007) 3,983 (Gains) losses reclassified to net earnings . . . . . . . . . . . . . . . . . — — (2,651) — (2,651) Tax effect . . . . . . . . . . . . . . . . . . . . . 135 435 (1,724) 1,005 (149) Net of tax amount . . . . . . . . . . . . . . . 991 (744) 2,938 (2,002) 1,183 Balance at December 31, 2010 . . . . . (12,236) (999) 5,252 (3,230) (11,213) Unrealized gains (losses) . . . . . . . . . (2,496) 1,030 (397) (3,092) (4,955) (Gains) losses reclassified to net earnings . . . . . . . . . . . . . . . . . — — (7,531) — (7,531) Tax effect . . . . . . . . . . . . . . . . . . . . . 46 (382) 2,933 1,149 3,746 Net of tax amount . . . . . . . . . . . . . . . (2,450) 648 (4,995) (1,943) (8,740) Balance at December 31, 2011 . . . . . $(14,686) $ (351) $ 257 $(5,173) $(19,953)
NOTE 13—GOODWILL AND INTANGIBLE ASSETS:
All of the Company’s intangible indefinite-lived assets are trademarks.
The changes in the carrying amount of trademarks for 2011 and 2010 were as follows: 2011 2010 Original cost . . . . . . . . . . . . . . . . . . . . . . . . . . . . . . . . . . . . . . . . . . . . . . . . . . . . . $193,767 $193,767Accumulated impairment losses as of January 1 . . . . . . . . . . . . . . . . . . . . . . . . . (18,743) (18,743) Balance at January 1 . . . . . . . . . . . . . . . . . . . . . . . . . . . . . . . . . . . . . . . . . . . . . . . $175,024 $175,024 Current year impairment losses . . . . . . . . . . . . . . . . . . . . . . . . . . . . . . . . . . . . . . . — — Balance at December 31 . . . . . . . . . . . . . . . . . . . . . . . . . . . . . . . . . . . . . . . . . . . . $175,024 $175,024 Accumulated impairment losses as of December 31 . . . . . . . . . . . . . . . . . . . . . . $ (18,743) $ (18,743)
As of December 31, 2009, management ascertained certain trademarks were impaired, andrecorded a pre-tax charge of $14,000. The principal driver of this impairment charge was anincrease in the discount rate required by market participants. The fair value of indefinite-livedintangible assets was primarily assessed using the present value of estimated future cash flows.
The Company has no accumulated impairment losses of goodwill.
25
Merrill Corp - Tootsie Roll 10-K Tier 2 ED [AUX] | 105123 | 29-Feb-12 11:40 | 11-31190-1.ea | Sequence: 8CHKSUM Content: 30331 Layout: 11364 Graphics: No Graphics CLEAN
JOB: 11-31190-1 CYCLE#;BL#: 8; 0 TRIM: 11" x 8.5" COMPOSITECOLORS: Black, ~note-color 2, ~note-color 3 GRAPHICS: none V1.5
26
To the Board of Directors and Shareholders of Tootsie Roll Industries, Inc.:
In our opinion, the accompanying consolidated statements of financial position and the related consolidated statements of earnings, comprehensive earnings and retainedearnings, and of cash flows present fairly, in all material respects, the financial position of Tootsie Roll Industries, Inc. and its subsidiaries at December 31, 2011 andDecember 31, 2010, and the results of their operations and their cash flows for each of the three years in the period ended December 31, 2011 in conformity with accountingprinciples generally accepted in the United States of America. Also in our opinion, the Company maintained, in all material respects, effective internal control over financialreporting as of December 31, 2011, based on criteria established in Internal Control—Integrated Framework issued by the Committee of Sponsoring Organizations of theTreadway Commission (COSO). The Company’s management is responsible for these financial statements, for maintaining effective internal control over financial reportingand for its assessment of the effectiveness of internal control over financial reporting, included in Management’s Report on Internal Control over Financial Reporting onpage 27 of the 2011 Annual Report to Shareholders. Our responsibility is to express opinions on these financial statements and on the Company’s internal control overfinancial reporting based on our integrated audits. We conducted our audits in accordance with the standards of the Public Company Accounting Oversight Board(United States). Those standards require that we plan and perform the audits to obtain reasonable assurance about whether the financial statements are free of materialmisstatement and whether effective internal control over financial reporting was maintained in all material respects. Our audits of the financial statements included examining,on a test basis, evidence supporting the amounts and disclosures in the financial statements, assessing the accounting principles used and significant estimates made bymanagement, and evaluating the overall financial statement presentation. Our audit of internal control over financial reporting included obtaining an understanding ofinternal control over financial reporting, assessing the risk that a material weakness exists, and testing and evaluating the design and operating effectiveness of internalcontrol based on the assessed risk. Our audits also included performing such other procedures as we considered necessary in the circumstances. We believe that ouraudits provide a reasonable basis for our opinions.
As discussed in Note 1 to the consolidated financial statements, the Company changed the manner in which it accounts for LIFO inventories in 2011.
A company’s internal control over financial reporting is a process designed to provide reasonable assurance regarding the reliability of financial reporting and the preparationof financial statements for external purposes in accordance with generally accepted accounting principles. A company’s internal control over financial reporting includesthose policies and procedures that (i) pertain to the maintenance of records that, in reasonable detail, accurately and fairly reflect the transactions and dispositions of theassets of the company; (ii) provide reasonable assurance that transactions are recorded as necessary to permit preparation of financial statements in accordance withgenerally accepted accounting principles, and that receipts and expenditures of the company are being made only in accordance with authorizations of management anddirectors of the company; and (iii) provide reasonable assurance regarding prevention or timely detection of unauthorized acquisition, use, or disposition of the company’sassets that could have a material effect on the financial statements.
Because of its inherent limitations, internal control over financial reporting may not prevent or detect misstatements. Also, projections of any evaluation of effectiveness tofuture periods are subject to the risk that controls may become inadequate because of changes in conditions, or that the degree of compliance with the policies orprocedures may deteriorate.
Chicago, ILFebruary 29, 2012
Report of Independent Registered Public Accounting Firm
Merrill Corp - Tootsie Roll 10-K Tier 2 ED [AUX] | 105123 | 29-Feb-12 11:40 | 11-31190-1.fa | Sequence: 1CHKSUM Content: 235 Layout: 418 Graphics: 39708 CLEAN
JOB: 11-31190-1 CYCLE#;BL#: 8; 0 TRIM: 11" x 8.5" COMPOSITECOLORS: Black, ~note-color 2, ~note-color 3 GRAPHICS: price_water_k_sig.eps V1.5

27
The following performance graphcompares the cumulative totalshareholder return on theCompany’s Common Stock for afive-year period (December 31,2006 to December 31, 2011) withthe cumulative total return ofStandard & Poor’s 500 Stock Index(“S&P 500”) and the Dow JonesIndustry Food Index (“Peer Group,”which includes the Company),assuming (i) $100 invested onDecember 31 of the first year of thechart in each of the Company’sCommon Stock, S&P 500 and theDow Jones Industry Food Index and(ii) the reinvestment of dividends.
$140
$120
$100
$80
$60
$40
$20
TR
DJ
S&P
2006 2007 2008 2009 2010 2011$0
$100.00
$100.00
$100.00
$87.39
$105.49
$107.46
$85.13
$66.46
$80.58
$95.08
$84.05
$95.96
$104.87
$96.71
$107.08
$89.34
$98.75
$120.66
COMPARISON OF 5 YEAR CUMULATIVE TOTAL RETURN
Management’s Report on Internal Control Over Financial ReportingThe management of Tootsie Roll Industries, Inc. is responsible for establishing and maintaining adequate internal control over financial reporting, as suchterm is defined in the Securities Exchange Act of 1934 (SEC) Rule 13a-15(f). Our management conducted an evaluation of the effectiveness of theCompany’s internal control over financial reporting as of December 31, 2011 as required by SEC Rule 13a-15(c). In making this assessment, we used thecriteria established in Internal Control—Integrated Framework issued by the Committee of Sponsoring Organizations of the Treadway Commission (theCOSO criteria). Based on our evaluation under the COSO criteria, our management concluded that our internal control over financial reporting was effectiveas of December 31, 2011.
The effectiveness of the Company’s internal control over financial reporting as of December 31, 2011 has been audited by PricewaterhouseCoopers LLP,an independent registered public accounting firm, as stated in their report which appears on page 26.
Tootsie Roll Industries, Inc.
Chicago, IllinoisFebruary 29, 2012
Performance Graph
Merrill Corp - Tootsie Roll 10-K Tier 2 ED [AUX] | 105123 | 29-Feb-12 11:40 | 11-31190-1.fa | Sequence: 2CHKSUM Content: 47831 Layout: 38946 Graphics: 28954 CLEAN
JOB: 11-31190-1 CYCLE#;BL#: 8; 0 TRIM: 11" x 8.5" COMPOSITECOLORS: Black, ~note-color 2, ~note-color 3 GRAPHICS: 31190-1_comparison_k_line.eps V1.5
28
(Thousands of dollars except per share data)2011 First Second Third Fourth YearNet product sales . . . . . . . . . . . . . . . . . . . . . . . . . . . . . . . . . . . . . . . . . . . . . . . . $108,323 $104,884 $186,784 $128,378 $528,369Product gross margin . . . . . . . . . . . . . . . . . . . . . . . . . . . . . . . . . . . . . . . . . . . . . 34,799 33,898 54,554 39,893 163,144Net earnings . . . . . . . . . . . . . . . . . . . . . . . . . . . . . . . . . . . . . . . . . . . . . . . . . . . . 8,330 6,486 18,855 10,267 43,938Net earnings per share . . . . . . . . . . . . . . . . . . . . . . . . . . . . . . . . . . . . . . . . . . . . 0.14 0.11 0.33 0.18 0.76
2010Net product sales . . . . . . . . . . . . . . . . . . . . . . . . . . . . . . . . . . . . . . . . . . . . . . . . $103,244 $105,026 $191,045 $117,834 $517,149Product gross margin . . . . . . . . . . . . . . . . . . . . . . . . . . . . . . . . . . . . . . . . . . . . . 34,909 35,450 61,649 35,807 167,815Net earnings . . . . . . . . . . . . . . . . . . . . . . . . . . . . . . . . . . . . . . . . . . . . . . . . . . . . 9,068 8,309 26,245 9,441 53,063Net earnings per share . . . . . . . . . . . . . . . . . . . . . . . . . . . . . . . . . . . . . . . . . . . . 0.15 0.14 0.45 0.16 0.90
The results for the quarters presented reflect the retrospective application of a change in accounting principle for inventory valuation and the relatedeffects on product gross margin, net earnings and net earnings per share as discussed in Note 1 to the Consolidated Financial Statements. Productgross margin reflects increases (decreases) of $517, $504, and $811 for the three quarters of 2011 and $(212), $ (216), $(375) and $(218) for thefour quarters of 2010. Net earnings reflect increases (decreases) $330, $ 321, and $517 for the three quarters of 2011 and $(136), $(138), $(239) and$(138) for four quarters of 2010. Net earnings per share increased .01 per share for the third quarter of 2011 and decreased .01 per share for the firstquarter of 2010. All other quarters remain unchanged as reported.
Net earnings per share is based upon average outstanding shares as adjusted for 3% stock dividends issued during the second quarter of eachyear and revision of net earnings as discussed above. The sum of the per share amounts may not equal annual amounts due to rounding.
2011-2010 QUARTERLY SUMMARY OF TOOTSIE ROLL INDUSTRIES, INC. STOCK PRICES AND DIVIDENDS PER SHARE
STOCK PRICES* 2011 2010 High Low High Low1st Qtr . . . . . $29.45 $27.06 $28.24 $25.882nd Qtr . . . . $29.68 $27.78 $28.04 $23.653rd Qtr . . . . . $29.80 $23.52 $25.95 $23.344th Qtr . . . . . $25.95 $22.85 $29.84 $24.64*NYSE - Closing Price
Estimated Number of shareholders at February 2012:Common Stock . . . . . . . . . . . . . . . . . . . . . . . . . . . . . . . . 18,000Class B Common Stock . . . . . . . . . . . . . . . . . . . . . . . . . 5,000
DIVIDENDS 2011 20101st Qtr . . . . . $.08 $.082nd Qtr . . . . $.08 $.083rd Qtr . . . . . $.08 $.084th Qtr . . . . . $.08 $.08NOTE: In addition to the above cash dividends, a 3%stock dividend was issued on April 7, 2011 andApril 8, 2010. Cash dividends are restated to reflect3% stock dividends.
Quarterly Financial Data (Unaudited)TOOTSIE ROLL INDUSTRIES, INC. AND SUBSIDIARIES
Merrill Corp - Tootsie Roll 10-K Tier 2 ED [AUX] | 105123 | 29-Feb-12 11:40 | 11-31190-1.ga | Sequence: 1CHKSUM Content: 6384 Layout: 5750 Graphics: No Graphics CLEAN
JOB: 11-31190-1 CYCLE#;BL#: 8; 0 TRIM: 11" x 8.5" COMPOSITECOLORS: Black, ~note-color 2, ~note-color 3 GRAPHICS: none V1.5

29
Five Year Summary of Earnings and Financial HighlightsTOOTSIE ROLL INDUSTRIES, INC. AND SUBSIDIARIES
(Thousands of dollars except per share, percentage and ratio figures)
(See management’s comments starting on page 5) 2011 2010 2009 2008 2007
Sales and Earnings Data (2)(3)(4)(5)Net product sales . . . . . . . . . . . . . . . . . . . . . . . . . . . . . . $528,369 $517,149 $495,592 $492,051 $492,742Product gross margin . . . . . . . . . . . . . . . . . . . . . . . . . . . 163,144 167,815 175,817 158,055 165,456Interest expense . . . . . . . . . . . . . . . . . . . . . . . . . . . . . . . 121 142 243 378 535Provision for income taxes . . . . . . . . . . . . . . . . . . . . . . . 16,974 20,005 9,892 16,347 25,401Net earnings . . . . . . . . . . . . . . . . . . . . . . . . . . . . . . . . . . 43,938 53,063 53,157 38,880 52,175
% of net product sales . . . . . . . . . . . . . . . . . . . . . . . 8.3% 10.3% 10.7% 7.9% 10.6%% of shareholders’ equity . . . . . . . . . . . . . . . . . . . . 6.6% 8.0% 8.1% 6.1% 8.1%
Per Common Share Data (1)(3)(4)(5)Net earnings . . . . . . . . . . . . . . . . . . . . . . . . . . . . . . . . . . $ 0.76 $ 0.90 $ 0.89 $ 0.65 $ 0.85Cash dividends declared . . . . . . . . . . . . . . . . . . . . . . . . 0.32 0.32 0.32 0.32 0.32Stock dividends . . . . . . . . . . . . . . . . . . . . . . . . . . . . . . . 3% 3% 3% 3% 3%
Additional Financial Data (1)(2)(3)(4)(5)Working capital . . . . . . . . . . . . . . . . . . . . . . . . . . . . . . . $153,846 $176,662 $154,409 $129,694 $142,163Net cash provided by operating activities . . . . . . . . . . . 50,390 82,805 76,994 57,533 90,148Net cash provided by (used in) investing activities . . . . (51,157) (16,808) (16,364) (7,565) (43,429)Net cash used in financing activities . . . . . . . . . . . . . . . (36,597) (41,011) (38,548) (38,666) (44,842)Property, plant & equipment additions . . . . . . . . . . . . . . 16,351 12,813 20,831 34,355 14,767Net property, plant & equipment . . . . . . . . . . . . . . . . . . 212,162 215,492 220,721 217,628 201,401Total assets . . . . . . . . . . . . . . . . . . . . . . . . . . . . . . . . . . . 857,856 857,959 836,844 813,252 813,134Long-term debt . . . . . . . . . . . . . . . . . . . . . . . . . . . . . . . 7,500 7,500 7,500 7,500 7,500Shareholders’ equity . . . . . . . . . . . . . . . . . . . . . . . . . . . 665,935 667,408 654,244 636,847 640,204Average shares outstanding . . . . . . . . . . . . . . . . . . . . . 57,892 58,685 59,425 60,152 61,580
(1) Per Common share data and average shares outstanding adjusted for annual 3% stock dividends .(2) Certain reclassifications have been made to prior year numbers to conform to current year presentation.(3) The 2009 data included the release of tax valuation allowances, charges related to the impairment of an equity method investment and impairment charges related to certain trademarks as discussed
in Notes 4, 6 and 13 to the Consolidated Financial Statements, respectively.(4) The 2008 data included a charge for the other-than-temporary impairment of an ARS. Further information is included in Note 10 to the Consolidated Financial Statements.(5) Reflects the increase (decrease) retrospective application of a change in accounting principle for inventory valuation for the following: 2010 2009 2008 2007
Product gross margin . . . . . . . . . . . . . . . . . . . . . . . . . . . . . . . . . . . . . . . . . . . . . . . . . $(1,021) $(1,130) $(682) $ 409Provision for income taxes . . . . . . . . . . . . . . . . . . . . . . . . . . . . . . . . . . . . . . . . . . . . . . (370) (409) (247) 148Net earnings . . . . . . . . . . . . . . . . . . . . . . . . . . . . . . . . . . . . . . . . . . . . . . . . . . . . . . . . (651) (721) (435) 261Net earnings per share . . . . . . . . . . . . . . . . . . . . . . . . . . . . . . . . . . . . . . . . . . . . . . . . (0.02) (0.02) — 0.01Working capital . . . . . . . . . . . . . . . . . . . . . . . . . . . . . . . . . . . . . . . . . . . . . . . . . . . . . . (2,424) (1,403) (273) 409Total assets . . . . . . . . . . . . . . . . . . . . . . . . . . . . . . . . . . . . . . . . . . . . . . . . . . . . . . . . . (2,424) (1,403) (273) 409Shareholders’ equity . . . . . . . . . . . . . . . . . . . . . . . . . . . . . . . . . . . . . . . . . . . . . . . . . . (1,546) (895) (174) 261
Merrill Corp - Tootsie Roll 10-K Tier 2 ED [AUX] | 105123 | 29-Feb-12 11:40 | 11-31190-1.ga | Sequence: 2CHKSUM Content: 8661 Layout: 23835 Graphics: No Graphics CLEAN
JOB: 11-31190-1 CYCLE#;BL#: 8; 0 TRIM: 11" x 8.5" COMPOSITECOLORS: Black, ~note-color 2, ~note-color 3 GRAPHICS: none V1.5

Board of Directors
(1)Executive Committee (2)Audit Committee (3)Compensation Committee
Officers
Offices, Plants
Subsidiaries
Other Information
Melvin J. Gordon(1) Chairman of the Board andChief Executive Officer
Ellen R. Gordon(1) President and Chief Operating Officer
Barre A. Seibert(2)(3) Retired First Vice President,Washington Mutual Bank
Lana Jane Lewis-Brent(2)(3) President, Paul Brent Designer, Inc.,an art publishing, design and licensingcompany
Richard P. Bergeman(2)(3) Retired Senior Vice President, Bestfoods
Melvin J. Gordon Chairman of the Board andChief Executive Officer
Ellen R. Gordon President and Chief Operating Officer
G. Howard Ember, Jr. Vice President, Finance & ChiefFinancial Officer
John W. Newlin, Jr. Vice President, Manufacturing
Thomas E. Corr Vice President, Marketing & Sales
John P. Majors Vice President, Physical Distribution
Barry P. Bowen Treasurer & Assistant Secretary
Richard F. Berezewski Controller
Executive Offices 7401 S. Cicero Ave.Chicago, Illinois 60629www.tootsie.com
Plants/Warehouses IllinoisTennesseeMassachusettsPennsylvaniaWisconsinOntario, CanadaMexico City, Mexico
Foreign Sales Offices Mexico City, MexicoOntario, Canada
Andes Candies L.P.Andes Manufacturing LLCAndes Services LLCC.C.L.P., INC.C.G.P., INC.Cambridge Brands Manufacturing, Inc.Cambridge Brands Services, Inc.Cambridge Brands, Inc.Cella’s Confections, Inc.Charms LLCConcord (GP) Inc.Concord Canada Holdings ULCConcord Confections Holdings USA, Inc.Concord Partners LPJT Company, Inc.
The Sweets Mix Company, Inc.Tootsie Roll Company, Inc.Tootsie Roll Industries, LLCTootsie Roll Management, Inc.Tootsie Roll Mfg., LLCTootsie Roll of Canada, ULCTootsie Roll Worldwide, Ltd.Tootsie Rolls—Latin AmericaTRI de Latinoamerica S.A. de C.V.TRI Finance, Inc.TRI International, Inc.TRI Sales Co.TRI-Mass, Inc.Tutsi S.A. de C.V.World Trade & Marketing Ltd.
Stock Exchange New York Stock Exchange, Inc.(Since 1922)
Stock Identification Ticker Symbol: TRCUSIP No. 890516 10-7
Stock Transfer Agent andStock Registrar
American Stock Transferand Trust CompanyOperations Center6201 15th AvenueBrooklyn, NY 112191-800-710-0932www.amstock.com
Independent RegisteredPublic Accounting Firm
PricewaterhouseCoopers LLPOne North WackerChicago, IL 60606
General Counsel Becker Ross, LLP317 Madison AvenueNew York, NY 10017
Annual Meeting May 7, 2012Mutual Building, Room 1200909 East Main StreetRichmond, VA 23219
Printed on recycled paper.30
Merrill Corp - Tootsie Roll 10-K Tier 2 ED [AUX] | 105123 | 29-Feb-12 11:40 | 11-31190-1.za | Sequence: 1CHKSUM Content: 36742 Layout: 27686 Graphics: 12681 CLEAN
JOB: 11-31190-1 CYCLE#;BL#: 8; 0 TRIM: 11" x 8.5" COMPOSITECOLORS: Black, ~note-color 2, ~note-color 3 GRAPHICS: recycled_logo.eps, tr_listed_nyse_k_logo.eps V1.5
29
Five Year Summary of Earnings and Financial HighlightsTOOTSIE ROLL INDUSTRIES, INC. AND SUBSIDIARIES
(Thousands of dollars except per share, percentage and ratio figures)
(See management’s comments starting on page 5) 2011 2010 2009 2008 2007
Sales and Earnings Data (2)(3)(4)(5)Net product sales . . . . . . . . . . . . . . . . . . . . . . . . . . . . . . $528,369 $517,149 $495,592 $492,051 $492,742Product gross margin . . . . . . . . . . . . . . . . . . . . . . . . . . . 163,144 167,815 175,817 158,055 165,456Interest expense . . . . . . . . . . . . . . . . . . . . . . . . . . . . . . . 121 142 243 378 535Provision for income taxes . . . . . . . . . . . . . . . . . . . . . . . 16,974 20,005 9,892 16,347 25,401Net earnings . . . . . . . . . . . . . . . . . . . . . . . . . . . . . . . . . . 43,938 53,063 53,157 38,880 52,175
% of net product sales . . . . . . . . . . . . . . . . . . . . . . . 8.3% 10.3% 10.7% 7.9% 10.6%% of shareholders’ equity . . . . . . . . . . . . . . . . . . . . 6.6% 8.0% 8.1% 6.1% 8.1%
Per Common Share Data (1)(3)(4)(5)Net earnings . . . . . . . . . . . . . . . . . . . . . . . . . . . . . . . . . . $ 0.76 $ 0.90 $ 0.89 $ 0.65 $ 0.85Cash dividends declared . . . . . . . . . . . . . . . . . . . . . . . . 0.32 0.32 0.32 0.32 0.32Stock dividends . . . . . . . . . . . . . . . . . . . . . . . . . . . . . . . 3% 3% 3% 3% 3%
Additional Financial Data (1)(2)(3)(4)(5)Working capital . . . . . . . . . . . . . . . . . . . . . . . . . . . . . . . $153,846 $176,662 $154,409 $129,694 $142,163Net cash provided by operating activities . . . . . . . . . . . 50,390 82,805 76,994 57,533 90,148Net cash provided by (used in) investing activities . . . . (51,157) (16,808) (16,364) (7,565) (43,429)Net cash used in financing activities . . . . . . . . . . . . . . . (36,597) (41,011) (38,548) (38,666) (44,842)Property, plant & equipment additions . . . . . . . . . . . . . . 16,351 12,813 20,831 34,355 14,767Net property, plant & equipment . . . . . . . . . . . . . . . . . . 212,162 215,492 220,721 217,628 201,401Total assets . . . . . . . . . . . . . . . . . . . . . . . . . . . . . . . . . . . 857,856 857,959 836,844 813,252 813,134Long-term debt . . . . . . . . . . . . . . . . . . . . . . . . . . . . . . . 7,500 7,500 7,500 7,500 7,500Shareholders’ equity . . . . . . . . . . . . . . . . . . . . . . . . . . . 665,935 667,408 654,244 636,847 640,204Average shares outstanding . . . . . . . . . . . . . . . . . . . . . 57,892 58,685 59,425 60,152 61,580
(1) Per Common share data and average shares outstanding adjusted for annual 3% stock dividends .(2) Certain reclassifications have been made to prior year numbers to conform to current year presentation.(3) The 2009 data included the release of tax valuation allowances, charges related to the impairment of an equity method investment and impairment charges related to certain trademarks as discussed
in Notes 4, 6 and 13 to the Consolidated Financial Statements, respectively.(4) The 2008 data included a charge for the other-than-temporary impairment of an ARS. Further information is included in Note 10 to the Consolidated Financial Statements.(5) Reflects the increase (decrease) retrospective application of a change in accounting principle for inventory valuation for the following: 2010 2009 2008 2007
Product gross margin . . . . . . . . . . . . . . . . . . . . . . . . . . . . . . . . . . . . . . . . . . . . . . . . . $(1,021) $(1,130) $(682) $ 409Provision for income taxes . . . . . . . . . . . . . . . . . . . . . . . . . . . . . . . . . . . . . . . . . . . . . . (370) (409) (247) 148Net earnings . . . . . . . . . . . . . . . . . . . . . . . . . . . . . . . . . . . . . . . . . . . . . . . . . . . . . . . . (651) (721) (435) 261Net earnings per share . . . . . . . . . . . . . . . . . . . . . . . . . . . . . . . . . . . . . . . . . . . . . . . . (0.02) (0.02) — 0.01Working capital . . . . . . . . . . . . . . . . . . . . . . . . . . . . . . . . . . . . . . . . . . . . . . . . . . . . . . (2,424) (1,403) (273) 409Total assets . . . . . . . . . . . . . . . . . . . . . . . . . . . . . . . . . . . . . . . . . . . . . . . . . . . . . . . . . (2,424) (1,403) (273) 409Shareholders’ equity . . . . . . . . . . . . . . . . . . . . . . . . . . . . . . . . . . . . . . . . . . . . . . . . . . (1,546) (895) (174) 261
Merrill Corp - Tootsie Roll 10-K Tier 2 ED [AUX] | 105123 | 29-Feb-12 11:40 | 11-31190-1.ga | Sequence: 2CHKSUM Content: 8661 Layout: 23835 Graphics: No Graphics CLEAN
JOB: 11-31190-1 CYCLE#;BL#: 8; 0 TRIM: 11" x 8.5" COMPOSITECOLORS: Black, ~note-color 2, ~note-color 3 GRAPHICS: none V1.5

Industries, Inc.Tootsie Roll
Annual Report 2011