Embed Size (px)
Citation preview

Epidemiol. Serv. Saude, Brasília, 25(3), Jul-Sep 2016
Tools for healTh
surveillance managemenT
Method for estimating infant mortality and low birth weight indicators for Brazilian municipalities, 2012
Correspondence: Alicia Matijasevich – Universidade de São Paulo, Faculdade de Medicina, Departamento de Medicina Preventiva, Av. Dr. Arnaldo, No. 455, 2° andar, sala 2166, São Paulo-SP, Brasil. CEP: 01246-903 E-mail: [email protected]
AbstractObjective: to present a method for estimating low birth weight (LBW) prevalence and infant mortality rate (IMR) indicators
for Brazilian municipalities, so as to incorporate considerations with regard to sampling fluctuation. Methods: binomial and Poisson distributions were used to estimate 95% confidence intervals (95%CI); when the number of infant deaths was zero, the upper limit of the 95%CI was estimated by the cross-multiplication method; indicators were estimated for the year 2012 for demonstration purposes. Results: a slight increase in LBW and a decrease in IMR were detected as municipality population size increased; LBW estimates were more accurate than those for IMR; single-year estimates showed large width 95%CI in small municipalities and low reliability. Conclusion: an electronic spreadsheet was developed which will allow service managers to estimate the accuracy of these indicators for their municipalities.
Key words: Infant Mortality; Infant, Low Birth Weight; Estimation Techniques; Cities; Epidemiological Surveillance/statistics & numerical data.
doi: 10.5123/S1679-49742016000300020
Alicia Matijasevich1
Juan José Cortez-Escalante2
Dacio Rabello Neto3
Roberto Men Fernandes3
Cesar Gomes Victora4
1Universidade de São Paulo, Departamento de Medicina Preventiva, São Paulo-SP, Brasil2Organização Pan-Americana da Saúde, Oficina Nacional no Brasil, Brasília-DF, Brasil3Ministério da Saúde do Brasil, Coordenação-Geral de Informação e Análise Epidemiológica, Brasília-DF, Brasil4Universidade Federal de Pelotas, Programa de Pós-Graduação em Epidemiologia, Pelotas-RS, Brasil
*This study was funded by the Secretariat of Health Surveillance, of the Brazilian Ministry of Health and by the Brazilian Office of the United Nations Children's Emergency Fund (UNICEF). Process No. 43127038. Alícia Matijasevich and Cesar Gomes Victora are beneficiary of a grant on scientific production of the National Council for Scientific and Technological Development (CNPq), of the Ministry of Science, Technology and Innovation (MCTI).
Epidemiol. Serv. Saude, Brasília, 25(3), Jul-Sep 2016
Estimating infant mortality and low birth weight indicators for Brazilian municipalities
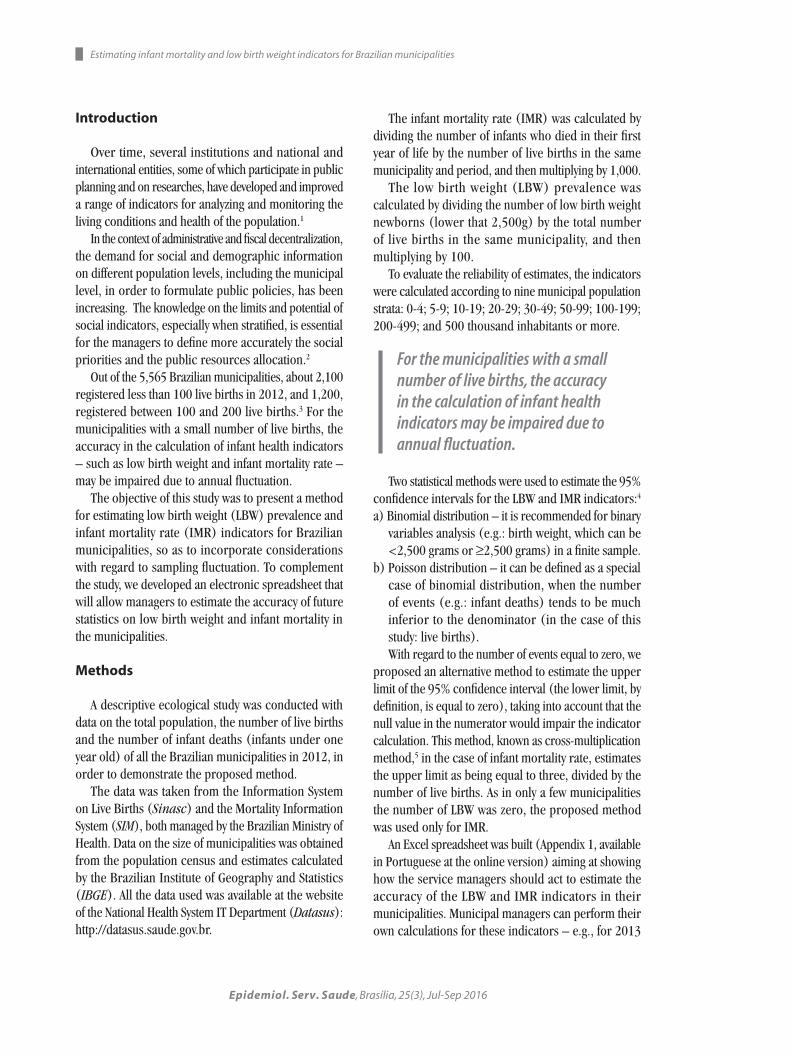
Introduction
Over time, several institutions and national and international entities, some of which participate in public planning and on researches, have developed and improved a range of indicators for analyzing and monitoring the living conditions and health of the population.1
In the context of administrative and fiscal decentralization, the demand for social and demographic information on different population levels, including the municipal level, in order to formulate public policies, has been increasing. The knowledge on the limits and potential of social indicators, especially when stratified, is essential for the managers to define more accurately the social priorities and the public resources allocation.2
Out of the 5,565 Brazilian municipalities, about 2,100 registered less than 100 live births in 2012, and 1,200, registered between 100 and 200 live births.3 For the municipalities with a small number of live births, the accuracy in the calculation of infant health indicators – such as low birth weight and infant mortality rate – may be impaired due to annual fluctuation.
The objective of this study was to present a method for estimating low birth weight (LBW) prevalence and infant mortality rate (IMR) indicators for Brazilian municipalities, so as to incorporate considerations with regard to sampling fluctuation. To complement the study, we developed an electronic spreadsheet that will allow managers to estimate the accuracy of future statistics on low birth weight and infant mortality in the municipalities.
Methods
A descriptive ecological study was conducted with data on the total population, the number of live births and the number of infant deaths (infants under one year old) of all the Brazilian municipalities in 2012, in order to demonstrate the proposed method.
The data was taken from the Information System on Live Births (Sinasc) and the Mortality Information System (SIM), both managed by the Brazilian Ministry of Health. Data on the size of municipalities was obtained from the population census and estimates calculated by the Brazilian Institute of Geography and Statistics (IBGE). All the data used was available at the website of the National Health System IT Department (Datasus): http://datasus.saude.gov.br.
The infant mortality rate (IMR) was calculated by dividing the number of infants who died in their first year of life by the number of live births in the same municipality and period, and then multiplying by 1,000.
The low birth weight (LBW) prevalence was calculated by dividing the number of low birth weight newborns (lower that 2,500g) by the total number of live births in the same municipality, and then multiplying by 100.
To evaluate the reliability of estimates, the indicators were calculated according to nine municipal population strata: 0-4; 5-9; 10-19; 20-29; 30-49; 50-99; 100-199; 200-499; and 500 thousand inhabitants or more.
Two statistical methods were used to estimate the 95% confidence intervals for the LBW and IMR indicators:4
a) Binomial distribution – it is recommended for binary variables analysis (e.g.: birth weight, which can be <2,500 grams or ≥2,500 grams) in a finite sample.
b) Poisson distribution – it can be defined as a special case of binomial distribution, when the number of events (e.g.: infant deaths) tends to be much inferior to the denominator (in the case of this study: live births). With regard to the number of events equal to zero, we
proposed an alternative method to estimate the upper limit of the 95% confidence interval (the lower limit, by definition, is equal to zero), taking into account that the null value in the numerator would impair the indicator calculation. This method, known as cross-multiplication method,5 in the case of infant mortality rate, estimates the upper limit as being equal to three, divided by the number of live births. As in only a few municipalities the number of LBW was zero, the proposed method was used only for IMR.
An Excel spreadsheet was built (Appendix 1, available in Portuguese at the online version) aiming at showing how the service managers should act to estimate the accuracy of the LBW and IMR indicators in their municipalities. Municipal managers can perform their own calculations for these indicators – e.g., for 2013
For the municipalities with a small number of live births, the accuracy in the calculation of infant health indicators may be impaired due to annual fluctuation.

Epidemiol. Serv. Saude, Brasília, 25(3), Jul-Sep 2016
Alicia Matijasevich et al.
on – or even aggregate results of 2-3-year periods, because the proposed method enables the acquisition of more stable estimates, with higher numerators and denominators. The spreadsheet allows to type the number of live births, of LBW infants and infant death, and automatically calculates the estimates with 95% confidence intervals. In order to use the aforementioned spreadsheet, it is necessary to install a macro for Excel that can be found in a Microsoft Excel Add-In file (or supplement). To install this file, you have to press the Microsoft Office button in 'Excel options', and then, in Supplements (search the name 'conf int'). When you find the file, click 'yes' to install and follow the instructions. In case you cannot find the file among the available Excel supplements, you have to download the program from the statpages.info, section 'confidence intervals, single-population tests’, and install it in the computer following the recommendations of the previous step.
This study used only secondary data, without identifying the individuals. It was conducted in accordance to the ethical principles defined in the National Health Council Resolution (CNS) No. 466, dated 12 December 2012.
Results
Initially, we are presenting the results for the municipalities, and then, the results by municipal population strata.
Results for the Brazilian municipalitiesThe results obtained in the LBW estimates and infant
mortality rates for the 5,565 Brazilian municipalities in 2012 are presented in an Excel spreadsheet (Appendix 2, available online in Portuguese). The spreadsheet includes two pages or tabs: one with simplified results, for service managers; and the other one with detailed comparison between the three methods (binomial, Poisson and cross-multiplication).
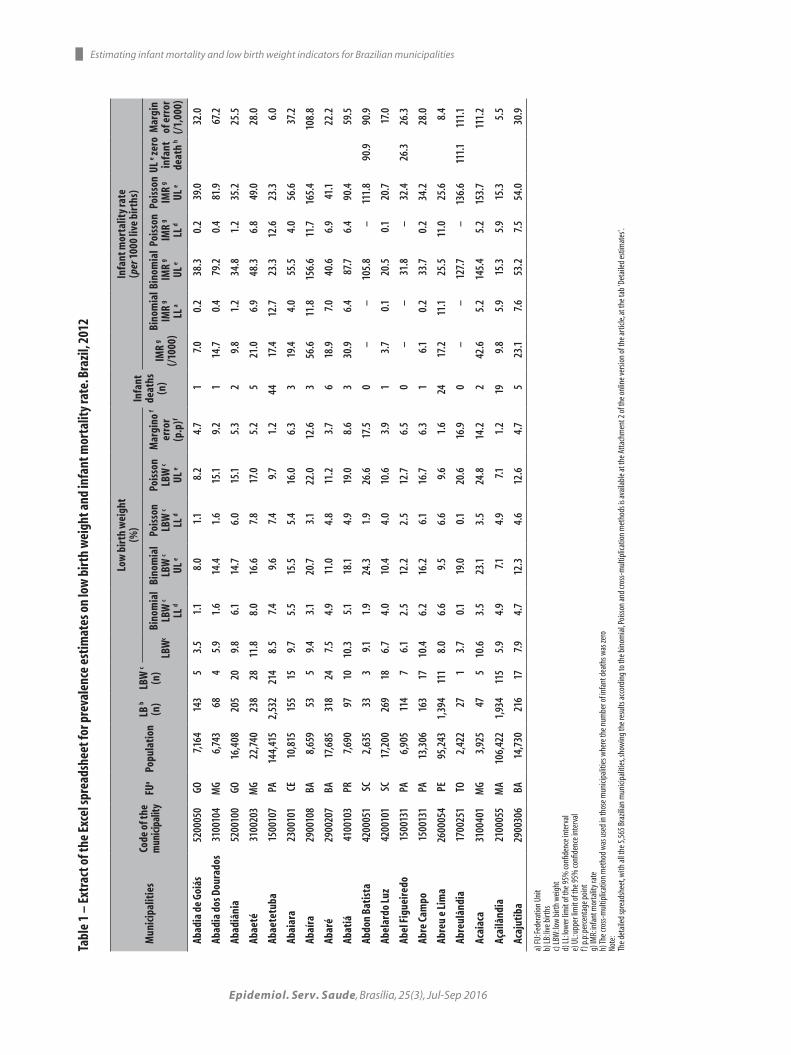
Table 1 represents an extract of the Excel spreadsheet of Appendix 2 (tab 'Detailed estimates') and one example of these procedures, with the first 19 of the 5,565 Brazilian municipalities. The first municipality, in alphabetical order, is Abadia de Goiás-GO, where 143 live births were recorded in 2012, counting with 5 low birth weight cases and 1 infant death. The LBW prevalence was 3.5% with 95% confidence intervals (95%CI) from 1.1 to 8.0% (binomial) and from 1.1
to 8.2% (Poisson). For IMR of 7.0 for every 1,000 live births, the 95%CI ranged from 0.2 to 38.3 and 0.2 to 39.0, respectively. The Poisson intervals are slightly wider, although the intervals’ overlapping is almost the same, confirming that both methods produced results with similar accuracy. It is important to highlight that the confidence limits were asymmetric in relation to the point estimate, i.e., the upper limit was further from the estimate than the lower limit. The spreadsheet presents the difference between the upper limit and the estimate, which can be interpreted as the margin of error (upper) of the value obtained for the studied year.
Still on Table 1, we can see the example of a municipality with bigger population: Abaetetuba-PA, with 2,532 live births, 214 LBW cases and 44 infant deaths. The LBW prevalence was 8.5%, with binomial distribution and 95%CI ranging from 7.4 to 9.6%, almost the same CI obtained with the Poisson distribution (from 7.4 to 9.7%). The upper limit was only 1.2 p.p. higher than the estimate. The IMR of 17.4 per 1,000 live births presented a binomial 95%CI ranging from 12.7 to 23.3, and the Poisson 95%CI was very close (from 12.6 to 23.3). The margin of error was of 6.0 deaths per one thousand live births.
Out of the 5,565 municipalities analyzed, 1,306 did not report infant death in 2012. This is the case of Abdon Batista-SC that recorded 33 live births, 3 of which presented LBW and zero infant death. Due to the small number of live births, the confidence intervals were wide. In those municipalities that did not present any infant death, the cross-multiplication method was applied: in Abdon Batista-SC, for example, the upper limit of the 95%CI was equal to 90.9 per 1,000 live births, compared to 111.8 according to the Poisson distribution and 105.8, according to binomial distribution.
As the aforementioned spreadsheet is complex, the Excel spreadsheet of the Appendix 2 presents the summarized results, aiming at making the comprehension easier for the service managers: in the 'Summarized Estimates' tab, only the Poisson confidence intervals were presented. This statistical method is more suitable for less frequent events in the population, which is the case of infant deaths. However, the results obtained with the Poisson distribution were very close to those obtained with the binomial distribution in this study.
Figure 1 shows the Excel spreadsheet of the Appendix 1, which will allow the service managers to type the number of live births, of LBW cases and infant deaths
Epidemiol. Serv. Saude, Brasília, 25(3), Jul-Sep 2016
Tabl
e 1
– Ex
trac
t of t
he E
xcel
spre
adsh
eet f
or p
reva
lenc
e es
timat
es o
n lo
w b
irth
wei
ght a
nd in
fant
mor
talit
y ra
te. B
razi
l, 20
12
Mun
icip
alit
ies
Code
of t
he
mun
icipa
lity
FUa
Popu
lati
onLB
b
(n)
LBW
c
(n)
Low
bir
th w
eigh
t(%
)In
fant
de
aths
(n)
Infa
nt m
orta
lity
rate
(per
100
0 liv
e bi
rths
)
LBW
cBi
nom
ial
LBW
c LL
d
Bino
mia
l LB
W c
UL e
Pois
son
LBW
c LL
d
Pois
son
LBW
c UL
e
Mar
gino
f er
ror
(p.p
)f
IMR
g (/
1000
)
Bino
mia
l IM
R g
LL a
Bino
mia
l IM
R g
UL e
Pois
son
IMR
g LL
d
Pois
son
IMR
g UL
e
UL e ze
ro
infa
nt
deat
h h
Mar
gin
of e
rror
(/1,
000)
Abad
ia d
e Go
iás
5200
050
GO7,1
6414
35
3.5
1.1
8.0
1.1
8.2
4.7
17.
00.
238
.30.
239
.032
.0
Abad
ia d
os D
oura
dos
3100
104
MG
6,74
368
45.
91.
614
.41.
615
.19.
21
14.7
0.4
79.2
0.4
81.9
67.2
Abad
iâni
a52
0010
0GO
16,4
0820
520
9.8
6.1
14.7
6.0
15.1
5.3
29.
81.
234
.81.
235
.225
.5
Abae
té31
0020
3M
G22
,740
238
2811
.88.
016
.67.
817
.05.
25
21.0
6.9
48.3
6.8
49.0
28.0
Abae
tetu
ba15
0010
7PA
144,
415
2,53
221
48.
57.
49.
67.
49.
71.
244
17.4
12.7
23.3
12.6
23.3
6.0
Abai
ara
2300
101
CE10
,815
155
159.
75.
515
.55.
416
.06.
33
19.4
4.0
55.5
4.0
56.6
37.2
Abaí
ra29
0010
8BA
8,65
953
59.
43.
120
.73.
122
.012
.63
56.6
11.8
156.
611
.716
5.4
108.
8
Abar
é29
0020
7BA
17,6
8531
824
7.5
4.9
11.0
4.8
11.2
3.7
618
.97.
040
.66.
941
.122
.2
Abat
iá41
0010
3PR
7,69
097
1010
.35.
118
.14.
919
.08.
63
30.9
6.4
87.7
6.4
90.4
59.5
Abdo
n Ba
tist
a42
0005
1SC
2,63
533
39.1
1.9
24.3
1.9
26.6
17.5
0–
–10
5.8
–11
1.8
90.9
90.9
Abel
ardo
Luz
4200
101
SC17
,200
269
186.
74.
010
.44.
010
.63.
91
3.7
0.1
20.5
0.1
20.7
17.0
Abel
Fig
ueir
edo
1500
131
PA6,
905
114
76.
12.
512
.22.
512
.76.
50
––
31.8
–32
.426
.326
.3
Abre
Cam
po15
0013
1PA
13,3
0616
317
10.4
6.2
16.2
6.1
16.7
6.3
16.
10.
233
.70.
234
.228
.0
Abre
u e
Lim
a26
0005
4PE
95,2
431,
394
111
8.0
6.6
9.5
6.6
9.6
1.6
2417
.211
.125
.511
.025
.68.
4
Abre
ulân
dia
1700
251
TO2,
422
271
3.7
0.1
19.0
0.1
20.6
16.9
0–
–12
7.7
–13
6.6
111.
111
1.1
Acai
aca
3100
401
MG
3,92
547
510
.63.
523
.13.
524
.814
.22
42.6
5.2
145.
45.
215
3.7
111.
2
Açai
lând
ia21
0005
5M
A10
6,42
21,
934
115
5.9
4.9
7.14.
97.1
1.2
199.
85.
915
.35.
915
.35.
5
Acaj
utib
a29
0030
6BA
14,7
3021
617
7.94.
712
.34.
612
.64.
75
23.1
7.6
53.2
7.5
54.0
30.9
a) FU
: Fed
erat
ion
Unit
b) LB
: live
birt
hsc)
LBW
: low
birt
h w
eigh
td)
LL: lo
wer
limit
of th
e 95%
confi
denc
e int
erva
le)
UL:
uppe
r lim
it of
the 9
5% co
nfide
nce i
nter
val
f) p.
p: pe
rcent
age p
oint
g) IM
R: in
fant
mor
talit
y rat
eh)
The c
ross
-mul
tiplic
atio
n m
etho
d w
as u
sed
in th
ose m
unici
palit
ies w
here
the n
umbe
r of i
nfan
t dea
ths w
as ze
roNo
te:
The d
etai
led
spre
adsh
eet, w
ith al
l the
5,5
65 B
razil
ian
mun
icipa
litie
s, sh
owin
g th
e res
ults
acco
rdin
g to
the b
inom
ial, P
oiss
on an
d cro
ss-m
ultip
licat
ion
met
hods
is av
aila
ble a
t the
Atta
chm
ent 2
of t
he o
nlin
e ver
sion
of th
e arti
cle, a
t the
tab
'Det
aile
d es
timat
es'.
Estimating infant mortality and low birth weight indicators for Brazilian municipalities

Epidemiol. Serv. Saude, Brasília, 25(3), Jul-Sep 2016
of their municipalities, and obtain the LBW and IDR estimates with Poisson confidence intervals. In Figure 1, the information related to Abaeté-MG was typed, as an example.
Results for municipal population strataTable 2 and Figures 2 and 3 present average values
of the prevalence estimates for LBW and IDR and their respective Poisson 95%CI, for nine municipal population strata.
Table 2 and Figure 2 show that there was a discrete rise in the prevalence for LBW, as the population size increased. It is possible to notice a large width of the 95%CI in small municipalities. For example, in the group of municipalities with less than 5 thousand inhabitants, the average confidence interval varied from 2.1 to 25.2% for an average prevalence of LBW of 8.1%, and the 95%CI was 2.9 times bigger than the LBW estimate, demonstrating higher inaccuracy in the estimates. The ratio between CI/LBW dropped as the population increased, and this ratio was lower than the unit in the interval from 20,000 to 29,999 inhabitants. In the group of municipalities with 500,000 inhabitants or more, the interval varied from 8.7 to 9.7%, for an
average prevalence of LBW of 9.2%, resulting in a ratio between CI/LBW of 0.11.
The variation was even higher for infant mortality (Table 2 and Figure 3), because this is a most rare event and, thus, more difficult to be precisely measured. The ratio between the CI and the IDR was 10.6 in the group with less than 5,000 inhabitants; only in municipalities with 100,000 inhabitants or more, the ratio was lower than the unit. Unlike the low birth weight, the infant mortality presented a slightly reduction trend as the population in the municipalities increased.
Table 3 confirms these observations, showing the difference between the average estimate value and its lower and upper limits of 95%CI for LBW and IDR, according to the population of the municipalities. Once more we can notice that the intervals are unequal, with higher margin of error in the upper intervals.
Discussion
Exploratory analyses were conducted on the reliability of the prevalence indicators for LBW and IDR, according to municipal population strata. It is essential to count
Calculation of confidence intervals for low birth weight and infant mortality
Enter the data in the five row below:
Name of the municipality Abaeté
Year 2012
Number of live births 238
Number of newborns weighing less than 2,500g 28
Number of infant deaths 5
Results for low birth weight:
Prevalence of low birth weight 11.8%
Lower limit of the 95% confidence 7.8%
Upper limit of the 95% confidence 17.0%
Results for infant mortality:
Infant mortality rate per 1,000 live births 21.0
Lower limit of the 95% confidence 6.8
Upper limit of the 95% confidence 49.0
a) The spreadsheet – Excel format – is available at the Appendix 1 of the online version of this article; the confidence intervals was based on the Poisson distribution method.
Figure 1 – Spreadsheet example for calculating the confidence intervals for low birth weight and infant mortalitya
Alicia Matijasevich et al.

Epidemiol. Serv. Saude, Brasília, 25(3), Jul-Sep 2016
Table 2 – Average values of low birth weight (LBW) prevalence and infant mortality rate (IMR) and the respective 95% confidence intervals of Poisson, according to municipal population strata. Brazil, 2012
Population strata(in million)
Number of municipalities
Total population
in each stratum in
Brazil
Live births
Newborns with LBW
Average values
LBWa prevalence
(%)
Lower limit(%)
Upper limit(%)
Infant deaths IMRb Lower
limitUpper limit
0-4 1,298 3,368 40 3 8.1 2.1 25.2 0.5 13.2 1.1 141.5
5-9 1,209 7,079 92 7 7.8 3.2 16.4 1.4 14.5 2.3 70.7
10-19 1,389 14,157 197 15 7.6 4.2 12.8 2.9 14.4 3.5 45.0
20-29 590 24,271 357 27 7.8 5.1 11.4 5.4 14.9 5.5 34.4
30-49 465 37,900 576 44 7.7 5.6 10.4 8.5 14.7 6.6 28.7
50-99 326 69,152 1,060 84 8.0 6.3 9.9 14.9 13.8 7.7 23.1
100-199 152 134,523 2,090 181 8.7 7.4 10.1 27.0 12.7 8.4 18.7
200-499 98 302,987 4,772 424 8.9 8.1 9.8 61.1 12.6 9.6 16.4
≥500 38 1,493,543 22,512 2091 9.2 8.7 9.7 280.2 12.5 10.7 14.4
a) LBW: low birth weightb) IMR: infant mortality rate
Figure 2 – Average values of low birth weight (LBW) prevalence and 95% confidence intervals of Poisson, according to municipal population strata. Brazil, 2012
0
5
10
15
20
25
30
0-‐4 5-‐9 10-‐19 20-‐29 30-‐49 50-‐99 100-‐199 200-‐499 >= 500
30
25
20
15
10
5
00-4 5-9 10-19 20-29 30-49 50-99 100-199 200-499 ≥500
Population strata (in millions)
Low
birt
h w
eigh
t (%
)
with good quality disaggregated data on a municipal level for a suitable health management. The processes of planning and management in the municipalities demand a global and continuous diagnosis on local reality. The decentralized information on municipal level provide essential data for planning, diagnosing and monitoring the local conditions, allowing the service
managers to conduct a decentralized management.6 However, the low human resources qualification and the little knowledge on the information systems, among other problems, may bind the bolstering and reliability of the information presented in national databases and impair the evaluation of the population health situation.7,8
Estimating infant mortality and low birth weight indicators for Brazilian municipalities

Epidemiol. Serv. Saude, Brasília, 25(3), Jul-Sep 2016
0
20
40
60
80
100
120
140
160
0-‐4 5-‐9 10-‐19 20-‐29 30-‐49 50-‐99 100-‐199 200-‐499 >= 500
Coefi
cien
te d
e M
orta
lidad
e In
fan1
l (x
1000
nas
cido
s viv
os)
Estrato populacional do município (milhares) 0-4 5-9 10-19 20-29 30-49 50-99 100-199 200-499 ≥500
160
140
120
100
80
60
40
20
0
Infa
nt M
orta
lity R
ate
(x 1
000
live
birt
hs)
Population stratum of the municipality (in millions)
Figure 3 – Average values of infant mortality rate and 95% confidence intervals of Poisson, according to municipal population strata. Brazil, 2012
Table 3 – Differences between the estimate average value and the lower and upper limits of 95% confidence for the prevalence of low birth weight (LBW) and the infant mortality rate (IMR), according to municipal population strata. Brazil, 2012
Population strata(in million)
LBWa
(%)IMRb
(per 1000 live births) Number of municipalities
Lower limit Upper limit Lower limit Upper limit
0-4 -6.0 17.1 -12.2 113.2 1,298
5-9 -4.6 8.6 -12.2 53.1 1,209
10-19 -3.4 5.2 -10.8 30.2 1,389
20-29 -2.7 3.6 -9.5 19.4 590
30-49 -2.1 2.7 -8.0 14.1 465
50-99 -1.6 1.9 -6.1 9.3 326
100-199 -1.2 1.4 -4.4 6.0 152
200-499 -0.9 0.9 -3.0 3.7 98
≥500 -0.5 0.5 -1.7 2.0 38
Total -3.9 7.9 -10.4 49.5 5,565
a) LBW: low birth weightb) IMR: infant mortality rate
Although the number of LBW live births and infant deaths include all the events recorded on the national systems (Sinasc and SIM, respectively) and not a sample of these events, in statistical analyses it is important to suppose the existence of information loss and apply techniques that allow
the accurate calculation (confidence interval) of the estimates.9
The main findings of these analyses were already expected, because the dependency on accuracy of the estimates related to the studied group is well known10 – in this case, the annual number of live births. The bigger the
Alicia Matijasevich et al.

Epidemiol. Serv. Saude, Brasília, 25(3), Jul-Sep 2016
sample size is, the more accurate the calculated estimates will be. This accuracy also depends on the frequency of the outcome studied. In the present analyses, for each population group considered, confidence intervals of the LBW estimates were always smaller (showing higher estimate accuracy) than the confidence intervals for IDR. This may happen because the LBW is a more frequent event than the infant death, and, for the sample size, the accuracy of the estimates will be higher if the studied event is more frequent. When the number of infant deaths and the number of live births were zero, the three analyzed methods presented varied results, although all of them were close to 100 per 1,000 live births.
The decision on what would represent an acceptable accuracy level is, in great part, arbitrary. With regard to LBW, the municipalities with more than 20,000 inhabitants presented more accurate estimates, with CI lower than the average value of the prevalence; still, the average 95%CI varied from 5.1 to 11.4%. Concerning the IDR, the 95%CI was inferior to the average value only in municipalities with more than 100,000 inhabitants, where it varied from 8.4 to 18.7 per 1,000. Nevertheless, for both indicators the upper limit was more than double of the lower limit, showing important inaccuracy.
In the past decades, the Ministry of Health has developed several programs that focus on reducing infant mortality.11 The monitoring of infant mortality trends from vital information of the Ministry of Health, with the direct calculation of the indicator using information from SIM and Sinasc, is accepted in those Brazilian states with information on live births and deaths that are considered suitable.12 The quality on the information systems has been improving as a whole.13-15 In a cohort study conducted in Pelotas-RS, with live births in 1982, 1993 and 2004, the researchers observed an improvement in the registration of deaths coverage along the studied period and zero infant deaths in that municipality in 2004.16
Several strategies have been proposed for estimating infant mortality in smaller municipalities using the information systems of the Ministry of Health, or where there is incomplete or irregular coverage of the vital records.17 Recently, some strategies, such as estimating correction factors for vital information and infant mortality per municipality18 and the use of spacial analyses methods19 have contributed to overcome the instability of LBW estimates in areas with small population.
It is important to highlight that the present analyses are restricted to statistical and sample fluctuations and, therefore, do not take into consideration systematic errors – case of the underreporting of events that can impact the municipal level estimates.
In future analyses, the accuracy of the estimates presented in the present study can be enhanced. For instance, it is possible to aggregate events (live births and deaths) occurred in two, three or more years, reducing the margin of error, but impairing the updating of estimates. If the long-term behavior presents pre-defined patterns (such as progressive reduction or raise), regression techniques can be used to improve the accuracy of certain estimates. Analysis strategies that include risk factors for mortality – e.g., socio-economical, environment, and assistance data –, although they are important, they depend greatly on correctly specifying the analysis model to be used and the accurate measure of the explanatory variables.20,21
It is necessary to motivate the municipal managers for using mortality and live births data for building health indicators and assisting the correct interpretation of these indicators, which will lead to an adequate analysis of the health situation on a local level.
The main contribution of this article is to demonstrate that the municipal estimates, for the most part, of the Brazilian municipalities present low reliability if analyzed only in a specific year. The offer of a simple tool to estimate confidence intervals may contribute to the adequate interpretation of statistical reliability for low birth weight and infant mortality. The proposed tool can be useful for detecting priority municipalities, implementing actions for improving vital information and organizing the health care network on mother-children health.
Authors’ contributions
Victora CG and Matijasevich A contributed to the formulation of the research question and of the study design, participated in the analysis and interpretation of results and manuscript drafting. Cortez-Escalante JJ, Rabello Neto D and Fernandes RM contributed to the interpretation of findings and final drafting of the manuscript.
All the authors have approved the final version of the manuscript and are responsible for all the work aspects, ensuring its accuracy and integrity.
Estimating infant mortality and low birth weight indicators for Brazilian municipalities

Epidemiol. Serv. Saude, Brasília, 25(3), Jul-Sep 2016
References
1. World Health Organization. Global reference list of 100 core health indicators [Internet]. Geneva: World Health Organization; 2015 [cited 2016 May 05]. Available from: http://apps.who.int/iris/bitstream/10665/173589/1/WHO_HIS_HSI_2015.3_eng.pdf?ua=1
2. Jannuzzi PM, Pasquali FA. Estimação de demandas sociais para fins de formulação de políticas públicas municipais: notas para discussão. RAP. 1999 mar-abr;33(2):75-94.
3. Instituto Brasileiro de Geografia e Estatística. Perfil dos municípios brasileiros: 2012 [Internet]. Rio de Janeiro: Instituto Brasileiro de Geografia e Estatística; 2012 [citado 2016 maio 05]. Disponível em: http://www.ibge.gov.br/home/estatistica/economia/perfilmunic/2012/
4. Altman DG, Machin D, Bryant TN, Gardner MJ. Statistics with confidence.: confidence intervals and statistical guidelines. 2th ed. London: British Medical Journal; 2000.
5. Hanley JA, Lippman-Hand A. If nothing goes wrong, is everything all right? Interpreting zero numerators. JAMA. 1983 Apr;249(13):1743-5.
6. Instituto Brasileiro de Geografia e Estatística (IBGE). Pesquisa de informações básicas municipais [Internet]. Rio de Janeiro: Instituto Brasileiro de Geografia e Estatística; 2013 [citado 2016 maio 05]. Disponível em : http://www.ibge.gov.br/home/estatistica/economia/perfilmunic/
7. Guimarães EAA, Carmo RF, Loyola Filho AI, Meira AJ, Luz ZMP. O contexto organizacional do Sistema de Informações sobre Nascidos Vivos segundo profissionais de saúde do nível municipal. Rev Bras Saude Matern Infant. 2014 abr-jun;14(2):165-72.
8. Pereira CCB, Vidal SA, Carvalho PI, Frias PG. Avaliação da implantação do Sistema de Informações sobre Nascidos Vivos (Sinasc) em Pernambuco. Rev Bras Saude Matern Infant. 2013 jan-mar;13(1):39-49.
9. Hartley HO, Sielken Júnior RL. A “super-population viewpoint” for finite population sampling. Biometrics. 1975 Jun;31(2):411-22.
10. Lemeshow S, Hosmer Júnior DW, Klar J, Lwanga SK. Sample size for sample surveys. In: Lemeshow S, Hosmer Júnior DW, Klar J, Lwanga SK. Adequacy of sample size in health studies. Chichester: John Wiley & Sons; 1990. 41-7p.
11. Victora CG, Aquino EM, do Carmo Leal M, Monteiro CA, Barros FC, Szwarcwald CL. Maternal and child
health in Brazil: progress and challenges. Lancet. 2011 May; 377(9780):1863-76.
12. Rede Interagencial de Informações para a Saúde. Indicadores básicos para saúde no Brasil: conceitos e aplicações. 2 ed. Brasília: Organização Pan-Americana da Saúde; 2008. 349 p.
13. Ministério da Saúde (BR). Secretaria de Vigilância em Saúde. Departamento de Análise de Situação em Saúde. Saúde Brasil 2010: uma análise da situação de saúde e de evidências selecionadas de impacto de ações de vigilância em saúde. Brasília: Ministério da Saúde; 2011. (Série G. Estatística e Informação em Saúde)
14. Pedraza DF. Qualidade do Sistema de informações sobre Nascidos Vivos (Sinasc): análise crítica da literatura. Cienc Saude Coletiva. 2012 out;17(10):2729-37.
15. Frias PG, Pereira PMH, Andrade CLT, Lira PIC, Szwarcwald CL. Avaliação da adequação das informações de mortalidade e nascidos vivos no Estado de Pernambuco, Brasil. Cad Saude Publica. 2010;26(4):671-81.
16. Santos IS, Menezes AM, Mota DM, Albernaz EP, Barros AJ, Matijasevich A, et al. Infant mortality in three population-based cohorts in Southern Brazil: trends and differentials. Cad Saude Publica.2008;24 Suppl 3:S451-460.
17. Frias PG, Szwarcwald CL, Lira PIC. Estimação da mortalidade infantil no contexto de descentralização do Sistema Único de Saúde (SUS). Rev Bras Saude Mater Infant. 2011 out-dez;11(4):463-70.
18. Almeida WS, Szwarcwald CL. Mortalidade infantil nos municípios brasileiros: uma proposta de método de estimação. Rev Bras Saude Mater Infant. 2014 out-dez;14(4):331-42.
19. Barufi AM, Haddad E, Paez A. Infant mortality in Brazil, 1980-2000: a spatial panel data analysis. BMC Public Health 2012 Mar;12:181.
20. Kato SK, Vieira DM, Fachel JM. Utilization of fully Bayesian modeling to detect patterns in relative risk variation for infant mortality in Rio Grande do Sul State, Brazil. Cad Saude Publica. 2009;25(7):1501-10.
21. Chin B, Montana L, Basagaña X. Spatial modeling of geographic inequalities in infant and child mortality across Nepal. Health Place. 2011 Jul;17(4):929-36.
Alicia Matijasevich et al.
Received on: 08/06/2015 Approved on: 13/04/2016