Embed Size (px)
Citation preview
1
Tools for catchment level soil and water conservation planning in the East African
Highlands (Draft)
Tool for participatory soil and water conservation mapping Tool for financial analysis of soil and water conservation measures
Development of an improved method for soil and water conservation planning at
catchment scale in the East African highlands (EROAHI)
EROAHI Report 4
2
The EROAHI project is funded by: • The Ecoregional Fund (www.ecoregionalfund.com), stimulating methodology
development for ecoregional development • The Partners for Water Programme (www.partnersvoorwater.nl), stimulating the
Netherlands involvement in the foreign water sector. • The Dutch Ministry of Agriculture, Nature and Fisheries (DLO Research Program
International Co-operation) Period: 1 July 2000 – 1 January 2005 © EROAHI Project Group Contact Alterra Wageningen University and Research Centre PO Box 47 6700 AA Wageningen The Netherlands Ir. H. (Rik) van den Bosch [email protected]
Erosion, Soil and Water Conservation Group Wageningen Agricultural University Nieuwe Kanaal 11 6709 PA Wageningen The Netherlands Dr. Ir. Geert Sterk [email protected]
3
Coordinators Project Management Alterra Ir. Rik van den Bosch P.O. Box 47 E-mail: [email protected] 6700 AA Wageningen Tel: +31 317 474 479 The Netherlands Fax: +31 317 419 000 Scientific Coordination Dr. Ir. Geert Sterk Wageningen Agricultural University E-mail: [email protected] Department of Environmental Sciences Tel: +31 317 484778 Erosion, Soil and Water Conservation Group Fax: +31 317 484759 6709 PA Wageningen The Netherlands Project partners ARI-Mlingano Dr. George Ley (Lead Scientist Soils Research Prog.) P.O. Box 5088 Albino J. Tenge (Project Site Manager) Tanga Dr. Jeremias G. Mowo (AHI Site Coordinator) Tanzania J. Wickama (Soil scientist) [email protected] Joseph P. Hella (Economist) KARI-Embu Dr. M. Gethi (Centre Director) P.O. Box 27 Barrack Okoba (Project Site Manager) Embu Kenya [email protected] Wageningen University Dr. Ir. Geert Sterk (Lecturer) Department of Environmental Sciences Ir. Olga Vigiak (Researcher) Erosion and Soil Water Conservation Group Ir. Dirk Meindertsma (Finance) Nieuwe Kanaal 11 Ir. Anton Vrieling (Researcher) 6709 PA Wageningen Prof. Dr. Ir. Leo Stroosnijder (Head of ESWC Group) The Netherlands Dr. Ir. Jan de Graaff (Senior Lecturer, Agricultural Economist) Alterra Green World Research Ir. Rik van den Bosch (Researcher) Soil and Land Use Department Dr. Rudi Hessel (Researcher) P.O. Box 47 Ing. Erik G.M. van den Elsen (Technical Engineer) 6700 AC Wageningen The Netherlands Kenyan Ministry of Agriculture Mr. Jackson M. Nyaga (Agronomist) Soil Water Conservation Branch Dr. Lincoln I. Mwarasomba (Socio-economist) P.O. Box 32 Embu Kenya Lushoto District Agriculture and Food Security Office Mr. T.M.A. Kizughuto (District Agriculture Officer) P.O. Box 22 Mr. H.B. Shellukindo (District Extension Officer) Lushoto Tanzania

4
ABSTRACT Author(s), 2005. Tools description EROAHI. Wageningen, Alterra, Tools description EROAHI 3 small pics.doc. 126 blz.; 30 figs.; 22. tables.; 33 refs. Keywords: ISSN 1566-7197
5
Contents Chapter 1. Introduction 11 1.1 Soil erosion in the East African Highland 11 1.2 The Catchment Approach 13 1.3 The EROAHI project 14 1.4 Outline of report and target groups 16 Chapter 2 Approach, activities and summary of results 19 2.1 Introduction 19 2.2 Site descriptions 20
2.2.1 The Gikuuri Catchment in Kenya 20 2.2.2 The Kwalei catchment in Tanzania 21
2.3 Cluster 1: Review of farmers’ perceptions on erosion, SWC measures and adoption 22
2.3.1 Objectives 22 2.3.2 Activities 22 2.3.3 Results 22
2.4 Cluster 2: Identification and calibration of indicators 23 2.4.1 Objectives 23 2.4.2 Activities 23 2.4.3 Results 24
2.5 Cluster 3: Construction of a tool for participatory soil erosion mapping 26 2.5.1 Objectives 26 2.5.2 Activities 26 2.5.3 Results 27
2.6 Cluster 4: Surveys and modelling 29 2.6.1 Objectives 29 2.6.2 Activities 29 2.6.3 Results 30
2.7 Cluster 5: Comparing farmers map and model results with the ACED survey map 31 2.7.1 Objective 31 2.7.2 Activities 32 2.7.3 Results 32
2.8 Cluster 6: Physical effectiveness of soil and water conservation 35 2.8.1 Objectives 35 2.8.2 Activities 36 2.8.3 Results 36
2.9 Cluster 7: Financial effectiveness of soil and water conservation 37 2.9.1 Objectives 37 2.9.2 Activities 37 2.9.3 Results 37
2.10 Cluster 8: Construction of a tool for financial analysis of soil and water conservation measures 38 2.10.1 Objective 38 2.10.2 Activities 38 2.10.3 Results 39
2.11 Cluster 9: Testing and application of the tools under field circumstances 39 2.11.1 Objective 39 2.11.2 Activities 39

6
2.11.3 Results 39 2.12 Cluster 10: How to use the tools in current approaches 40
2.12.1 Objective 40 2.12.2 Activities 41 2.12.3 Results 41
Chapter 3 Tool for participatory soil mapping 45 Chapter 4. Tool for participatory financial analysis of soil and water conservation measures for farm level planning 59 4.1 Introduction 59 4.2 Objectives 59 4.3 The participatory appraisal tool 59 4.4 The organisation of participatory appraisal of SWC 60 4.5 Application of the financial analysis tool 60 Chapter 5. The proposed use of the tools ‘participatory soil erosion mapping’ and ‘financial analysis of soil and water conservation measures’ in the Focal Area Extension Approach in Kenya (DRAFT) 81 5.1 Introduction 81 5.2 The Focal Area Extension Approach in Kenya 81
5.2.1 History and dynamics in the Focal Area Extension Approach 81 5.2.2 Institutional context of the Focal Area Extension Approach: The National
Agricultural and Livestock Programme (NALEP) 82 5.2.3 Steps in the Focal Area Extension Approach 83
5.3 The recommended use of the tools ‘participatory soil erosion mapping’ and ‘financial analysis of SWC measures’ within the Focal Area Extension Approach 86 5.3.1 Recommended use of the tools in the community mobilization: low
profile for the purpose of awareness raising 88 5.3.2 Proposed use of the tools during the farm planning: application from
A to Z 89 5.3.3 Recommended use of the tools at individual farmer level 89 5.3.4 Tools applied at Common Interest Group level 90 5.3.5 Proposed use of the tools in the Baraza and the implementation 91
5.4 Training 91 Chapter 6. The recommended use of the tool ‘participatory soil erosion mapping’ and the tool ‘financial analysis of soil and water conservation measures’ in the Catchment Approach in Tanzania, Lushoto District 95 6.1 Introduction 95 6.2 Introduction to the Catchment Approach (Lushoto District) 95
6.2.1 History 95 6.2.2 Steps in the Catchment Approach (Lushoto District) 96
6.3 The recommended use of tool ‘participatory soil erosion mapping’ and ‘financial analysis of SWC measures’ within the 100 6.3.1 Recommended use the tools ‘participatory soil erosion mapping’ and
financial analysis in part 1 of the Catchment Approach 101 6.3.2 Recommended use of the tools ‘participatory soil erosion mapping’
and financial analysis in part 2 ‘Planning of SWC measures’ 102 6.3.3 Recommended use the tools at group level 103 6.3.4 Proposed use of the tools in the part ‘moving forward’ 104

7
Chapter 7. Catchment prioritisation using satellite remote sensing 107 7.1 Introduction 107 7.2 Description of catchment prioritisation tool 107
7.2.1 General overview and rationale 107 7.2.2 Required data and availability 108 7.2.3 Pre-processing steps 108 7.2.4 Extraction of erosion factors 110 7.2.5 Data integration for map construction 111 7.2.6 Software requirements 111
7.3 Application of the catchment prioritisation tool in the Baga watershed, Tanzania 111 7.3.1 Data used 111 7.3.2 Pre-processing 112 7.3.3 Extraction of erosion factors 113 7.3.4 Erosion risk map 113
Chapter 8. References 119

8

9
INTRODUCTION
Chapter 1

10

11
1. Introduction
1.1 Soil erosion in the East African Highland Soil erosion is a common phenomenon in the East African Highlands, where it causes widespread soil degradation (e.g. Edwards, 1979, Gachene, 1995, Tiffen et al., 1994). The main reason for accelerated erosion is over-exploitation of natural resources due to an increasing demand for food, fiber and fodder by the growing human and livestock populations, without the economic means to sustain the resource base. The exploitative land use practices include deforestation for expansion of cultivation, grazing, fuel wood, and timber. These practices reduce the protective plant cover, thereby exposing the soil surface to the destructive impact of high-intensity rainfall (Aregay and Chadhokar, 1993). Although it is recognized that soil and water conservation (SWC) practices can substantially contribute to reversing soil degradation, the performance of past and ongoing soil and water conservation programs has, in most cases, been disappointing (Hudson, 1991). The physical achievements of past efforts to tackle soil degradation, in terms of areas treated and the range and number of earthworks constructed, are often impressive. However, such programs have proved expensive to implement and rarely succeeded in having any lasting impact on the problem. Too often farmers are blamed for this low success rate of soil conservation schemes. They are accused of being ignorant, uncooperative and conservative. In other cases extension workers are accused of not taking their task seriously, thereby failing to convince farmers of the benefits of soil and water conservation (Douglas, 1993). The publication of the important book ‘Working with farmers for better land husbandry’ (Hudson and Cheatle, 1993) has shown that more and more people involved in soil and water conservation realize that not the farmers but the planning approach, which is basically a top-down approach, was wrong. Experts from outside usually excluded the farmers from the planning process. The result was that projects often gave recommendations for mitigating problems that were not perceived as immediate priorities by the farmers. For most farmers the main concern is how to sustain and improve production, using the limited resources of land, labour, capital, equipment, and management skills available to them. The implication of this for soil conservation programmes is that the focus should be on combating productivity losses, rather than preventing soil loss (Douglas, 1993). It has become clear that small-scale farmers are not conservative land users. They are not reluctant to change their traditional farming practices when there are benefits to be derived from doing so (Sands, 1986). If farmers fail to adopt conservation recommendations, it is usually not from ignorance, but because they think they are wrong. In some cases, farmers believe that a recommendation will not do the job it is intended to do. In other cases they are deemed inappropriate to their family’s need and farming circumstances (Shaxson et al.,

12
1989). Successful soil and water conservation programs can only be achieved when farmers are actively involved in the planning process (Chambers et al., 1989). Idealistically, participatory soil and water conservation planning should be approached at the hydrological catchment level, instead of the level of the individual farmer or some form of administrative district (Pretty et al., 1995). The catchment has the advantage of being the natural geomorphologic unit for water erosion. It is an area that drains all rainfall within its boundaries to a single outlet. The risk of erosion at any point within a catchment can be understood in relation to its topographic position and the effect this has on local hydrology and sediment production. Also, the off-site effects, like sedimentation downstream and silting up of reservoirs, are more easily appreciated within a catchment than by the study of an individual field (Morgan, 1995). However, often the land belonging to a (village) community and sometimes even of one individual farmer may be dispersed over more than one hydrological catchment. This often forces soil and water conservation planners to consider areas that do not follow strict catchment boundaries, despite the disadvantage of losing the hydrological linkage between different farms. For adequate soil and water conservation planning at the catchment scale, information of the spatial distribution of current soil erosion processes is needed. However, simple and easily applicable quantification methods for information gathering at catchment scale are currently not available. The traditional approach to target soil and water conservation problems is to produce an “Erosion Hazard Map”. Such a map is constructed from information on soils, slopes, vegetation, land use and climatic data, and may rely on advanced resource mapping techniques such as Remote Sensing (RS) image interpretation and Geographical Information Systems (GIS). In most cases the resulting maps give an idea of the type and relative importance of the processes of land degradation. Other mappings techniques have undertaken assessment of soil degradation susceptibility a step further by combining RS image interpretation, GIS, erosion modelling and detailed soil survey techniques (Gachene, 1995). All these approaches aim at equipping land use planners with necessary tools to guide end users in making of decisions that will ensure sustainable exploitation of land resources. Whereas the importance of these strategies cannot be undermined, they have not succeeded in convincing smallholder farmers (decision takers) to adopt or invest in land and water conservation strategies. Decision takers have rejected some of the suggested strategies primarily because they were outside their context and not meeting their immediate needs (Shaxson et al., 1989). Therefore the on-going environmental degradation in the tropical regions is sufficient evidence that these approaches have failed.

13
1.2 The Catchment Approach Given the wide-scale problems of soil erosion in the East African Highlands, several countries in the region adopted a new strategy for participatory planning of soil and water conservation. This strategy is commonly known as the Catchment Approach. It was originally developed in Kenya, with financial support from the Swedish International Development Cooperation Agency (SIDA), and this development history is briefly outlined below.
To combat soil erosion in Kenya, the National Soil Conservation Program (NSCP) was established within the Kenyan Ministry of Agriculture (MoA) in 1974. The programme began working in pilot areas in four districts, but expansion to the whole country occurred with the establishment of the Soil and Water Conservation Branch within MoA in 1977. During the first 15 years, the program focused on working with contact farmers, who were expected to promote on-farm soil conservation through the use of a variety of physical and biological measures.
Following the experiences through the 1970’s and 1980’s, the Government of Kenya recognized that the only way to achieve widespread conservation coverage was to mobilize people to embrace soil and water conservation practices on their own terms. To this, it adopted the Catchment Approach. At first it was seen as a way of concentrating resources and efforts within a specified catchment, but the concept of the Catchment Approach changed over time. Now the objective of the Catchment Approach is the proper utilization and development, as well as protection of the natural resources, i.e. soil, water and vegetation. The catchment is seen as a focal area (not necessarily a hydrological catchment) where a community is willing to work towards the conservation of their environment. The method is based on a participatory community process, with actual physical planning of soil and water conservation measures at the farm level. The intention is for local communities to be involved in the analysis of their own farming and conservation problems, and decisions being made with their active participation, and the participation of the other stakeholders (governments, extension, NGOs, etc.)
The concept encompasses mobilization and participation of the entire community, and takes into account farmers needs and priorities. It also involves support of local leaders, government departments and other agencies. Soil and water conservation is not viewed from a narrow perspective, but is considered together with the whole farming system and the costs and benefits to the farmer. It makes use of participatory rural appraisal techniques to learn about the experiences, problems and opportunities of the community, and to collect information for planning. At the catchment level, the main erosion problems are identified, analysed and discussed jointly by specialists and the community. The discussions should result in a list of recommendations, which subsequently is used to develop soil and water conservation plans for each individual farm. In this step, the farmers’ views and preferences together with the socio-economic benefits are taken into account (Thomas et al., 1997).

14
It has become clear that where there is mobilization of the community, support to strong local groups, committed local staff and collaboration with other departments, there is increased agricultural productivity and reduction in resource degradation (Pretty et al., 1995). But, Admassie (1992) studied the functioning of the Catchment Approach and came, amongst others, to the following conclusions:
1. The extent and quality of involvement of the communities is not encouraging. In spite of the large amount of work done in propagating ideals and tenets of the Catchment Approach. Yawning gaps exist between what has been envisaged and what is practised in most of the catchments.
2. Off-farm conservation work is not provided for, and in the activities nothing is done to control gullies that develop along roads, cattle tracks, and farm boundaries. Contrary to the objectives of the Catchment Approach, the emphasis is still on measures that do not extend beyond the individual farm. The over emphasis on private as opposed to public land, and upon on-farm measures as opposed to off-farm measures, has limited the arena for a wider community based participation.
1.3 The EROAHI project In the year 2000 a four-year research project started with the aim to improve parts of the Catchment Approach. This project was entitled ‘Development of an improved method for soil and water conservation planning at catchment scale in the East African Highlands’ (acronym: EROAHI), and received financial support from the Fund for Methodological Support to Ecoregional Programmes. The EROAHI project proposed the following improvements to the Catchment Approach:
Semi-quantification of soil, water and nutrient losses using farmers’ knowledge For planning of soil and water conservation measures, as well as evaluation of the effects of the implemented measures, quantification of actual erosion and sedimentation rates and the related soil productivity changes is required. In the Catchment Approach, this quantification is usually not carried out. The assessment is mainly based on experience of soil and water conservation specialists and field visits. Traditionally, water erosion research is done on small plots, from which runoff, sediment and nutrient delivery are measured. For larger scales, simulation models can be applied to calculate runoff and sediment delivery from small catchments. Both kind of studies are expensive, time consuming and often too difficult to conduct in the African context. Therefore, a methodology for quick in-field quantification of erosion, sedimentation and soil productivity would help to improve the planning process.
To increase the adoption rate of the farm soil and water conservation plans, the ownership of the plans has to be improved by involving farmers in problem identification and planning. For this, the farmer must be taken serious and his/her knowledge should be used in the process of
15
problem identification and planning of measures. Therefore the EROAHI project carried out a thorough inventory of farmers’ knowledge and indicators of erosion, sedimentation, and soil productivity. Then, the identified indicators were quantified using well-established scientific techniques. In this way, a tool was developed for field and catchment-scale mapping of erosion severity, sedimentation, and crop yield decline. This tool enables a more quantitative assessment of erosion and sedimentation, but it also guarantees the involvement of farmers in the assessment from the very beginning.
Financial analysis of proposed technologies Although economic circumstances are considered during farm planning in the original Catchment Approach, the financial impact assessment of the proposed measures was only done after the implementation. A major improvement would be a methodology for quick ex ante calculation of the costs and benefits of the proposed measures for each individual farm. It was hypothesized that adoption of proposed would increase in the farmers are aware of the costs and benefits before implementation. Therefore, The EROAHI project developed a simple calculation tool for ex ante cost benefit analysis of soil and water conservation measures, in relation to the socio-economic and biophysical settings of the farm. These calculations are based on information that has been gathered during initial participatory rural appraisals (such as crop production, market prices, labour costs, etc.) and the estimated improvement of soil productivity when the soil and water conservation measures are implemented. The development of this tool was based on socio-economic surveys, cost-benefit analysis techniques, and field research on the physical effectiveness of common soil and water conservation measures. The latter implied quantification of the reduction in erosion, changes in soil moisture storage and crop yield effects of the specific measures.
The EROAHI project worked in two East African countries, Kenya and Tanzania. In both countries a small agricultural catchment was selected for research activities. In Kenya this was the Gikuuri catchment on the slopes of mount Kenya near Embu, while in Tanzania the Kwalei catchment in the West Usambara Mountains was selected. Both catchments are typical examples of a rainfed agricultural area, with high population densities, relatively good biophysical conditions, but also suffering from severe erosion problems. These catchments were benchmark sites of the African Highlands Initiative (AHI), an eco-regional programme in which many national and international institutes and organisation work jointly towards strategies for improved natural resource management. During the formulation of the project proposal, and also during the initial stages of the project, close contacts between the AHI coordination and the EROAHI team existed. Unfortunately, these contacts were not fully exploited and in a later stage the project lost contact with the overall coordination of AHI. At site level, however, we worked closely with the AHI site coordinators, and the project activities were well embedded in the local AHI research and development activities. It is expected that the developed tools of the EROAHI project will be extrapolated from the two experimental sites (Gikuuri and Kwalei) to other countries in the eco-region by AHI, while
16
the local NARS (KARI and ARI) and the extension services of Kenya and Tanzania can assist in the distribution of the tools within Kenya and Tanzania.
1.4 Outline of report and target groups This report is one of the main outcomes of the EROAHI project. It describes the research methods applied in the project (Chapter 2), the developed tool for soil erosion mapping (Chapter 3), the financial tool for cost-benefit analysis of soil and water conservation measures (Chapter 4), the recommended use of the developed tools in Kenya (Chapter 5) and Tanzania (chapter 6), and ends with a chapter on site selection for soil and water conservation planning.
Apart from this report, three doctoral theses have come out from the project as well (Okoba, 2005; Tenge, 2005; Vigiak, 2005). In those theses the scientific aspects of the conducted research and the developed tools have been described. The theses and a few journal articles (Hessel, 2005; Vrieling et al., 2005) are the scientific results of the project. This current report is intended to be a more applied description of the project results. It is intended for a different audience than the scientific papers. The target groups are extension services, NGO’s, NARS and potential donors interested in soil and water conservation issues in the East African Highlands. The report should not be seen as a field manual for soil and water conservation planning, but mainly a reference document for the development of field manuals for that purpose. It has been tried to write the report in such a way that it is clear and understandable for a non-scientific audience.
17
APPROACH, ACTIVITIES AND SUMMARY OF RESULTS
Chapter 2

18

19
2 Approach, activities and summary of results
2.1 Introduction This chapter describes the activities undertaken to arrive at the tools described in chapter 3 and 4 of this document. Figure 2.1 gives the various clusters of activities and their interrelations. Three types of activities are distinguished: • activities that contributed to the development of the tool for participatory soil erosion
mapping, relating to farmers’ indicators and how they can be used for SWC planning; • activities that contributed to the development of the tool for financial analysis of SWC
measures, relating to the effectiveness of SWC measures and how this can be used in SWC planning;
• and supporting modelling activities, scientific surveys and physical processes of soil erosion. One of the main objectives of this work is to understand how farmers’ knowledge and scientific knowledge can support each other in SWC planning. As indicated in Figure 2.1 the scientific work on modelling and surveys and (physical processes) supports the development of the tool for participatory soil erosion mapping as well as the development of the tool for financial analysis of SWC measures.
Figure 2.1: Clusters of activities and their relations. References: 1 = Okoba 2005, chapter 2; 2 = Tenge 2005, chapter 2; 3 = Okoba 2005, chapter 3; 4 = Okoba 2005, chapter 4; 5 = Okoba 2005, chapter 5; 6 = Vigiak, 2005, chapter 2; 7 = Hessel et al., 2005; 8 = Okoba 2005, chapter 5; 9 = Vigiak, 2005, chapter 7; 10= Tenge 2005, chapter 3; 11 = Tenge 2005, chapter 4; 12 = Tenge 2005, chapter 5; 13 = Tenge 2005, chapter 6; 14 = Okoba 2005, chapter 6; 15 = Chapter 3 of this report; 16 = Chapter 4 of this report; 17 = Chapter 5 of this report; 18 = Chapter 6 of this report
1. Review of farmers perceptions
Reference: 1, 2
2. Indicators: identification and calibration
Reference: 3, 4
3. Construction of tool for participatory erosion mapping
Reference 5
6. Physical effectiveness of SWC
Reference: 108. Construction of tool for financial assessment
Reference: 12
10. Key informant consultation on embedding
Reference: 17, 18
7. Financial effectiveness of SWC
Reference: 11
9 Application and testing under field conditions (Tanzania)
Reference 14
Tool 1: Tool for participatory soil erosion mapping
Reference: 15
Tool 2: Tool for financial assessment of SWC
Reference: 16
Development of soil erosion mapping tool
Supporting modeling and surveys activities
Development of financial analysis tool
4. Field surveys and modeling
Reference: 6, 7
9 Application and testing under field conditions (Kenya)
Reference 13
Development of the tools Testing and application of the tools
5. Comparison: models, surveys, farmers’ assessments
Reference: 8, 9
20
This chapter starts with a description of the research sites followed by a description of the nature of the activities in each cluster. It also gives a brief summary of the results. All information is based on Okoba (2005), Tenge (2005), Vigiak (2005), Hessel et al. (2005) and Hessel and Tenge (2005). For detailed descriptions references is made to underlying scientific publications.
2.2 Site descriptions
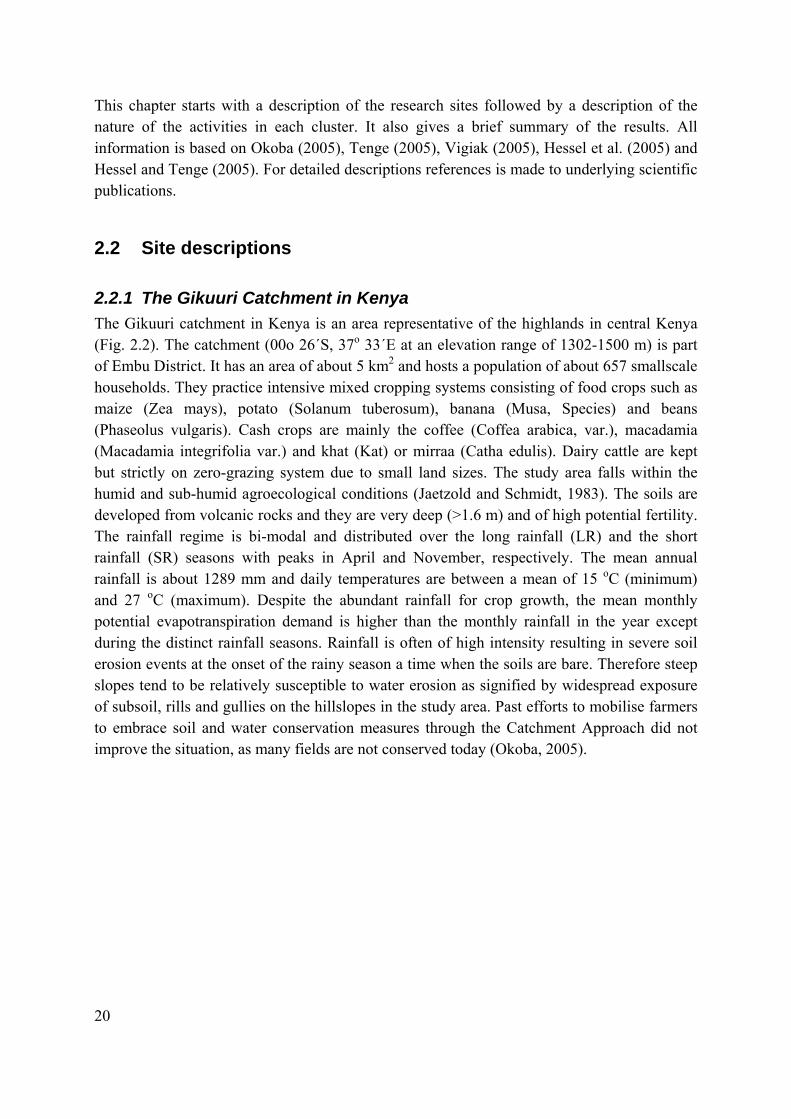
2.2.1 The Gikuuri Catchment in Kenya The Gikuuri catchment in Kenya is an area representative of the highlands in central Kenya (Fig. 2.2). The catchment (00o 26´S, 37o 33´E at an elevation range of 1302-1500 m) is part of Embu District. It has an area of about 5 km2 and hosts a population of about 657 smallscale households. They practice intensive mixed cropping systems consisting of food crops such as maize (Zea mays), potato (Solanum tuberosum), banana (Musa, Species) and beans (Phaseolus vulgaris). Cash crops are mainly the coffee (Coffea arabica, var.), macadamia (Macadamia integrifolia var.) and khat (Kat) or mirraa (Catha edulis). Dairy cattle are kept but strictly on zero-grazing system due to small land sizes. The study area falls within the humid and sub-humid agroecological conditions (Jaetzold and Schmidt, 1983). The soils are developed from volcanic rocks and they are very deep (>1.6 m) and of high potential fertility. The rainfall regime is bi-modal and distributed over the long rainfall (LR) and the short rainfall (SR) seasons with peaks in April and November, respectively. The mean annual rainfall is about 1289 mm and daily temperatures are between a mean of 15 oC (minimum) and 27 oC (maximum). Despite the abundant rainfall for crop growth, the mean monthly potential evapotranspiration demand is higher than the monthly rainfall in the year except during the distinct rainfall seasons. Rainfall is often of high intensity resulting in severe soil erosion events at the onset of the rainy season a time when the soils are bare. Therefore steep slopes tend to be relatively susceptible to water erosion as signified by widespread exposure of subsoil, rills and gullies on the hillslopes in the study area. Past efforts to mobilise farmers to embrace soil and water conservation measures through the Catchment Approach did not improve the situation, as many fields are not conserved today (Okoba, 2005).
21
2.2.2 The Kwalei catchment in Tanzania The West Usambara highlands are located in the northeastern part of Tanzania in Lushoto district, Tanga region (Fig. 2.2). The district lies between latitude 4o22′ and 5o08′ and between longitude 38o5′ and 38o38′. It has an area of about 3500 km2 out of which 2000 km2 are arable land and 340 km2 are forest reserve. The West Usambara highlands have good climatic conditions that have not only attracted farm communities but also tourists as well as providing different agricultural products to the population within and outside the highlands. The West Usambara highlands are also the sources of different water streams that are used for irrigation in the lowlands and generation of hydro-electricity (Mowo et al., 2002). According to Pfeiffer (1990), Lushoto district can be sub-divided into four Agro-Ecological Zones: The “Humid-Warm Zone, The “Dry-warm Zone, The “Dry Cold Zone and The “Dry Hot Zone. These zones differ in altitudes and amount of annual rainfall, but they have common problems of soil degradation due to soil erosion. Kwalei catchment forms part of the humid warm zone of the West Usambara Highlands. This zone covers the south, southeast and central part of the Lushoto district; it is situated at 800-1500 m a.s.l. and has an annual rainfall of 800-1700 mm. Cash crops in this zone include coffee, tea, and vegetables. Food crops include maize, bananas and beans. The major economic activity in the West Usambara highlands is agriculture on which over 90% of the population depends (Shelukindo and Kilasi, 1993; Lyamchai et al., 1998). Most of the agricultural activities are on steep slopes and on the valley bottoms where irrigation for horticultural crops is possible. The West Usambara highlands are experiencing stress in terms of decline in farm size and crop production due to population pressure and land degradation. According to the URT (2002), the population in the West Usambara highlands is estimated at 418,652 people with an annual growth rate of 2.8%, giving a population density greater than
Research site Kenya, Embu district, slopes of Mount Kenya
Research site Tanzania, Usambara Mountains,
Fig 2.2: Location of the research sites in Kenya and Tanzania

22
100 people km-2. This population density makes the West Usambara highlands the most densely populated area in the country. The population pressure has increased demands for food, fuel wood, construction materials and other socio-economic needs. In order to meet these demands, forestland has been cleared and agriculture has been expanded to marginal areas with steep slopes. Population pressure has also caused land fragmentation to uneconomical size and fallowing is no longer possible. Farmers cultivate on hill slopes (18-60%) with repeated clearing and burning of the vegetation leaving the soil bare or with very little ground cover. In some places animals graze freely on those steep slopes. These practices encourage soil erosion, consequently leading to loss of agricultural productivity and other off-site effects. It is estimated that about 84% of the original forest has been cleared. Landlessness is also becoming a common phenomenon and some people are migrating to the lowlands and urban centres (Tenge, 2005).
2.3 Cluster 1: Review of farmers’ perceptions on erosion, SWC measures and adoption
2.3.1 Objectives • To understand farmers perception on soil erosion • To determine the social and economic factors that influence adoption of SWC-measures. • To establish relationship with the farmers for further activities
2.3.2 Activities Two reviews were carried out, one in each research site. The review in the Kenyan site aimed to evaluate knowledge and perceptions of soil erosion and existing soil and water conservation measures. Community meetings and semi-structured household surveys were carried out in the catchment with 120 households. The review in the Tanzanian site consisted of group discussions and transect walks. A total of 104 households were interviewed and several fields were visited during the transect walks.
2.3.3 Results Farmers were aware of the on-going soil erosion and of several options for erosion control. Farmers perceived that SWC measures could successfully increase crop yields, soil-water retention and increase land value, but they also perceived that SWC measures did not help to prevented erosion phenomena. They attributed the continued erosion despite the implementation of SWC measures, to high rainfall, steep slopes, lack of maintenance and poorly designed SWC measures. They did not relate poor soil-cover, up-down tillage and tall trees as causes of erosion.

23
Labour shortage, lack of tools and construction know-how, location of fields and a lack of short-term benefits from SWC are among the major factors that negatively influence adoption. In the Tanzania site insecure land tenure was also mentioned as a hindrance for adoption, whereas this was not seen as of influence by the Kenyan farmers. Farmers who are involved in off-farm activities were less interested in SWC. Membership in farmer groups, level of education, contacts with extension agents and SWC programs were found to be positively influencing the adoption of SWC measures. Recommendations to facilitate adoption of different soil and water conservation measures include: integration of social and economic factors into SWC plans, the creation of more awareness among farmers on soil erosion effects and long term benefits of SWC, the development of flexible soil and water conservation measures to cater for different farm patterns and a participatory approach to soil and water conservation at catchment level rather than at individual farmers’ fields. For further reading see: Okoba (2005, chapter 2) and Tenge, (2005, chapter 2). The results were used as a basis for the identification and calibration of indicators (cluster 2), determination of effectiveness of SWC measures (cluster 6) and the construction of the financial analysis tool (cluster 7).
2.4 Cluster 2: Identification and calibration of indicators
2.4.1 Objectives The objectives of the activities in this cluster were to (i) identify the main indicators that farmers use to quantify erosion and to (ii) attach semi-quantitative values to the erosion indicators, using scientific measurements.
2.4.2 Activities Two types of surveys were carried out in the seven villages in the Kenyan study area. The first survey, comprising transect walks and farmer groups discussion sessions, focused on farmers’ knowledge and capability to identify existing erosion indicators on the cultivated landscape. During transect walks, conducted on village-by-village basis, researchers and extensionists observed the level of land degradation and types of erosion indicators associated with water erosion. In group meetings farmers listed known erosion indicators and assessed the indicators in their fields and their causes. Indicators were categorized into current indicators (those that are observable immediately after a rainfall event) and past indicators (resulting from long-term erosion). Later, key informants analysed the erosion indicators

24
generated by the village groups, to establish a final consensus list of erosion indicators for the study area. The second survey consisted of a set of semi-structured interviews on a randomly selected 120 households of the 657 family households in the study area. The aim was to assess individual household’s opinions on identification and perceptions of typical soil erosion indicators on their fields. After the inventory of farmers’ indicators a study was conducted to attach quantitative values of soil loss and maize crop yields to on-site erosion and sedimentation indicators as perceived by the farmers in the central highlands of Kenya. Splash pedestals, sheetwash, rills, sedimentation, red soils and stoniness were selected for quantification. Three soils types and three slope gradients were identified and on each combination of soil type and slope class runoff plots were installed to relate the sheet-rill erosion developments to actual soil loss. Whereas the temporal changes of the rills and pedestal height (sheet erosion) were used to quantify erosion rates within nine bounded runoff plots, five erosion indicators were identified within 24-31 farmers’ fields with an aim of estimating crop yield gaps.
2.4.3 Results This activity resulted in a consensus list of erosion indicators (Table 2.1) and a link between farmers’ erosion indicators and semi-quantitative values for soil loss and yield loss. The study that related some of the indicators to measured soil loss showed that topsoil profile depth, rill depth, width and total length were found to be significant variables that accurately described the actual soil loss in a field condition under sheet and rill erosion phenomenon. Two model equations were constructed relating soil loss rates and both the rill sizes and decline in topsoil depth (Table 2.2).

25
Table 2.1. Description and classification by farmers of the soil erosion indicators widely found in the central highlands of Kenya
Erosion indicator Brief description Class‡
Splash pedestals Describes the created craters by raindrop and protected soil column by stone, root or crop residues. Found under and outside tree canopies.
C
Sheetwash Marked by runoff flow path leaving smoothened surface that shows direction of the flow.
C
Rills Are continuous or discontinuous channel. Observed to develop after an intensive rainfall event, commencing from a short distance from ridge-crest or base of maize stem; due to the leaf structure that concentrates canopy-intercepted rainfall.
C
Root exposure Exposure of aerial roots after topsoil is stripped off by runoff and splash effect of raindrop. Indicates that topsoil had been removed thus weakening the crop stability.
C/P
Sedimentation Identified by the burying of crops/grass or deposition of “new soil”. Marked by fertile or infertile zone in a field. Soil material could be dark nutrient-rich or coarse sandy/stony deposit.
C
Broken SWC struct. Marked by gaps in formally continuous strips/bunds of conservation structure. Sign that runoff was too much to be contained by the existing structures.
C
Stoniness Small loose stones lying on soil surface. Signifies that overlaying topsoil and subsoil layers have been removed by water erosion.
P
Rock outcrops Partly exposed rocks. Indicates that soils are shallow and have been washed off by runoff flow, exposing tips of underlying parent rock.
P
Gullies Larger than rills and locally distinguished from rills when a 7 year-old child cannot jump across.
P
Red soils Implies that top-dark soils have been removed by runoff, also used as a strong indicator of severely eroded - leaving unproductive soils.
P
Loose soils Implies soils that are prone to wind erosion and easily scoured by runoff water. They are neither dark nor red but have poor water holding capacity. Do not occupy large areas since they are interspersed between red and darker soils.
P
‡C = current erosion indicators; P = past erosion indicators.
Table 2.2. Regression equations to predict soil loss, Gikuuri catchment, Kenya Y=0.128+0.0574RD+0.440SM+0.003RL Y=-0.483+0.035RW+0.462SM+0.003RL Y=1.149+0.437SM+0.001RDRL Y=0.933+0.408SM+0.001RWRL
Where: Y (ton ha-1) is the cumulative soil loss; RL (cm) is the total rill length; RD (mm) is the rill depth; RW (mm) is the rill width; SM (mm) is the splash pedestal height; units for combined terms: RDRL or RWRL are in cm
Five widespread erosion indicators were empirically linked to specific crop yield levels. Because of soil erosion a crop yield gap of over 50 percent was observed in fields bearing superficial stoniness and sedimentation indicators.

26
On basis of these results the rate of soil loss can now be estimated at field scale by fieldworkers in situations where sheet-rill erosion is prone within a rainfall event or season. This assists in satisfactory and timely advice to the farmers on aspects of soil and water conservation instead of relying on conventional erosion models. Besides knowing soil loss rates, data on crop yield decline experienced by farmers can be linked to observable soil surface erosion indicators to determine yield losses that farmers are likely to have as a result of erosion. For further reading see Okoba (2005, chapter 3 & 4) The results of this study were used to assist farmers in making their own soil erosion map (cluster 3).
2.5 Cluster 3: Construction of a tool for participatory soil erosion mapping
2.5.1 Objectives To develop methods to assist farmers to produce semi-quantified soil erosion maps at catchment scale based on the indicators identified before.
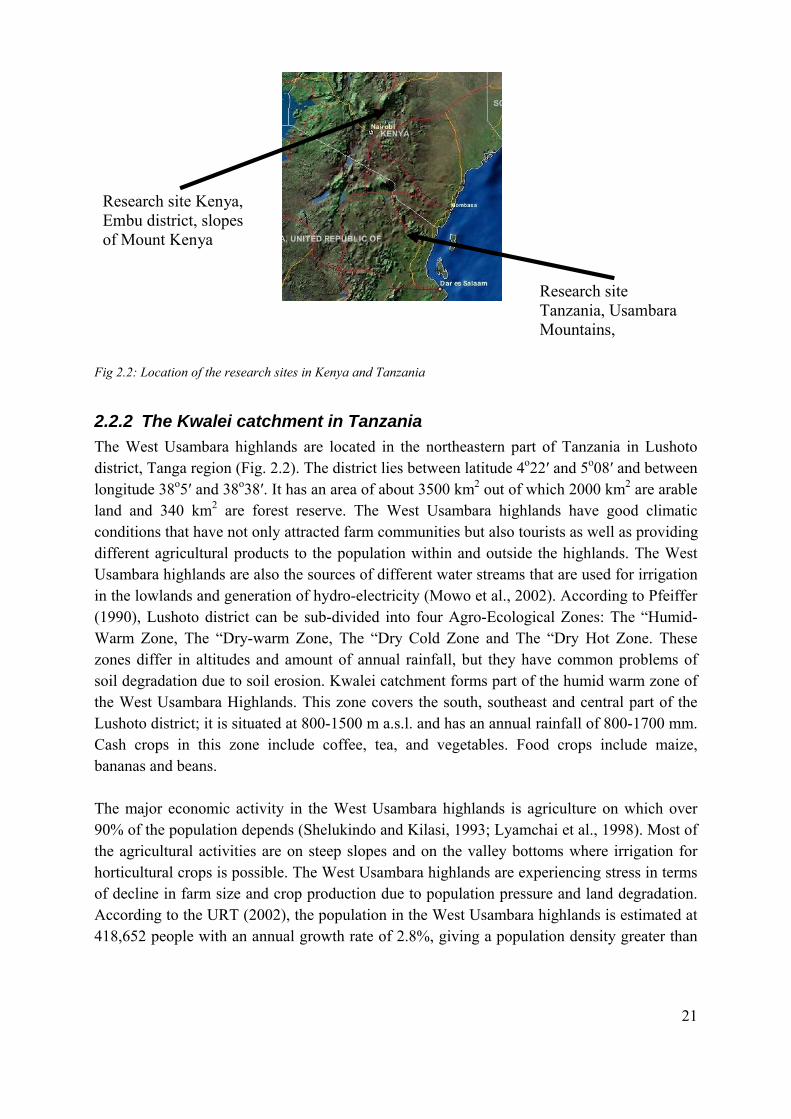
2.5.2 Activities Farmers’ from all villages representing the study area drew a soil erosion risk map based on the spatial distribution of the soil erosion indicators earlier identified. Key informants made a sketch of the catchment on the ground to outline the catchment area, the villages and field boundaries (Fig. 2.3). The map was copied from the ground to a large sheet of paper, which was consequently verified as true copy of the catchment field map made by the key informants. A field-by-field survey of soil erosion and crop production levels was carried out during 2 seasons using the previously compiled consensus list of indicators. For each field the extend of erosion damage was assessed on basis of the observed erosion indicators and scored as high, moderate or low. The resulting map represented the current state of soil erosion risk per household field, according to farmers’ knowledge and perceptions. The catchment erosion map was drawn on a large cloth, which was presented to all the villages in the study area for cross checking with all farmers. Later the map was digitised and stored in electronic format.
27
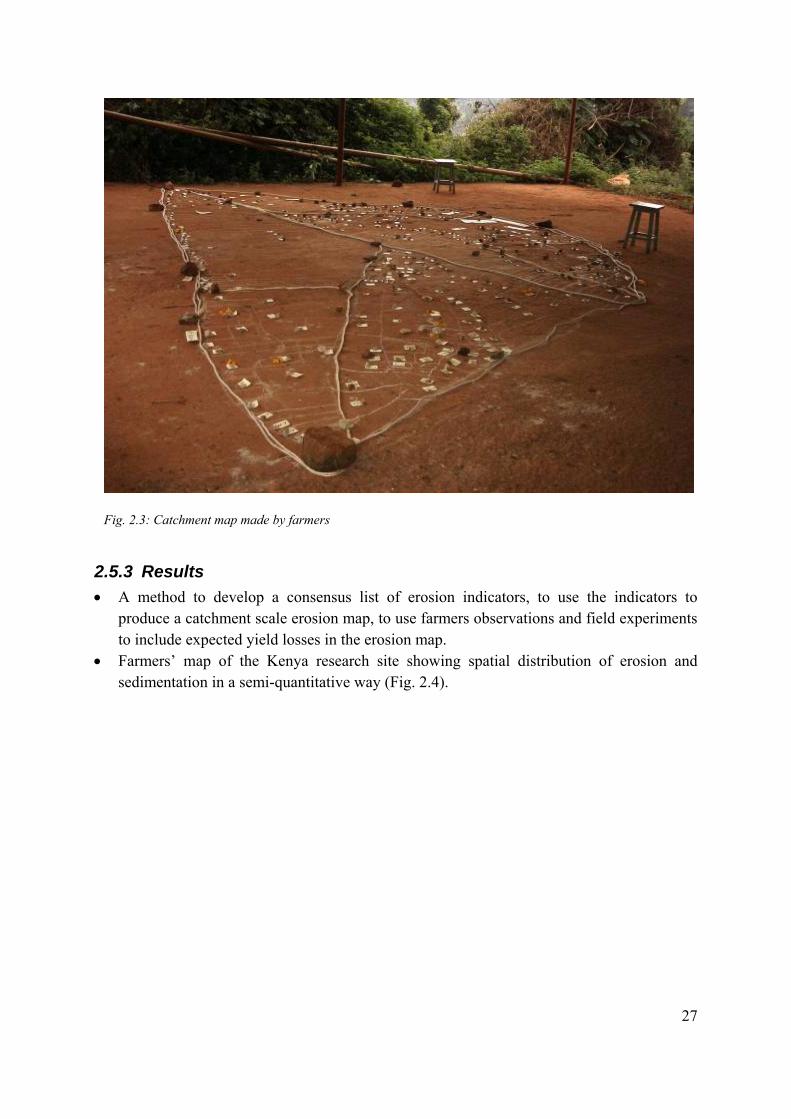
2.5.3 Results • A method to develop a consensus list of erosion indicators, to use the indicators to
produce a catchment scale erosion map, to use farmers observations and field experiments to include expected yield losses in the erosion map.
• Farmers’ map of the Kenya research site showing spatial distribution of erosion and sedimentation in a semi-quantitative way (Fig. 2.4).
Fig. 2.3: Catchment map made by farmers
28
For further reading see Okoba (2005, chapter 5). The farmers’ erosion map is compared with the results of a scientific erosion survey (cluster 5) in order to assess the validity and employability of farmers maps in SWC planning.
Fig 2.4: Farmers’ soil erosion map of the Gikuuri catchment, Kenya

29
2.6 Cluster 4: Surveys and modelling
2.6.1 Objectives • To assess the degree of soil erosion using scientific field surveys. • To assess the accuracy of model predictions for soil and water loss The objective of the modeling activities is to compare farmers maps with model simulations in order to assess the validity and employability of farmers maps in SWC planning1. . Before doing so, the accuracy and validity of the model simulations have to be assess by comparing model simulations with field surveys. This is done in this cluster.
2.6.2 Activities Field survey The actual erosion was assessed in the field following the guidelines of the Assessment of Current Erosion Damage method (ACED; Herweg, 1996). The ACED method allows semi-quantification of soil erosion and requires observation of type and intensity of erosion features, such as pedestals, sheet wash, interrills, rills, gullies, or others features (e.g. tree or rock exposure, build-up areas, re-depositions and so forth), together with presence of factors causing erosion. The method was applied along transects (Tanzania case) and on field level (Kenya case), and resulted in both cases in an erosion map for the catchment, indicating spatial distribution of erosion in a (semi-) quantitative way. Modelling The simulation results of two different models were compared to farmers’ assessments of soil erosion. The Morgan, Morgan and Finney (MMF) model is an empirical model developed to estimate mean annual soil loss from field-sized areas on hill slopes. The model was selected for several reasons. First, the model retains a strong physical base, but is easy to understand and requires few parameters. Moreover, the model had been applied successfully over many tropical locations and had already been tested in the East African Highlands (West Usambara Mountains, Tanzania). The second model used is the LISEM model, a model based on physical-chemical laws and equations that predict erosion patters within a catchment for a single rainfall event. Due to its complex nature the input data requirements of the model are high. Before the model results could be compared to the farmers assessments of soil erosion, the validity and accuracy of the model results when applied in the East African Highlands needed to be tested. This was done by comparing model predictions of soil and water loss at the outlet of the study catchments with measured values. Also predicted spatial distribution of soil loss was compared with 1 The objective is not to assess the possibilities to use models as tools in the regular planning process for SWC. From the
onset this was seen as not feasible because of the high complexity of the models, high input data requirements which would result and large training programmes and too costly monitoring campaigns to gather the required input data.
30
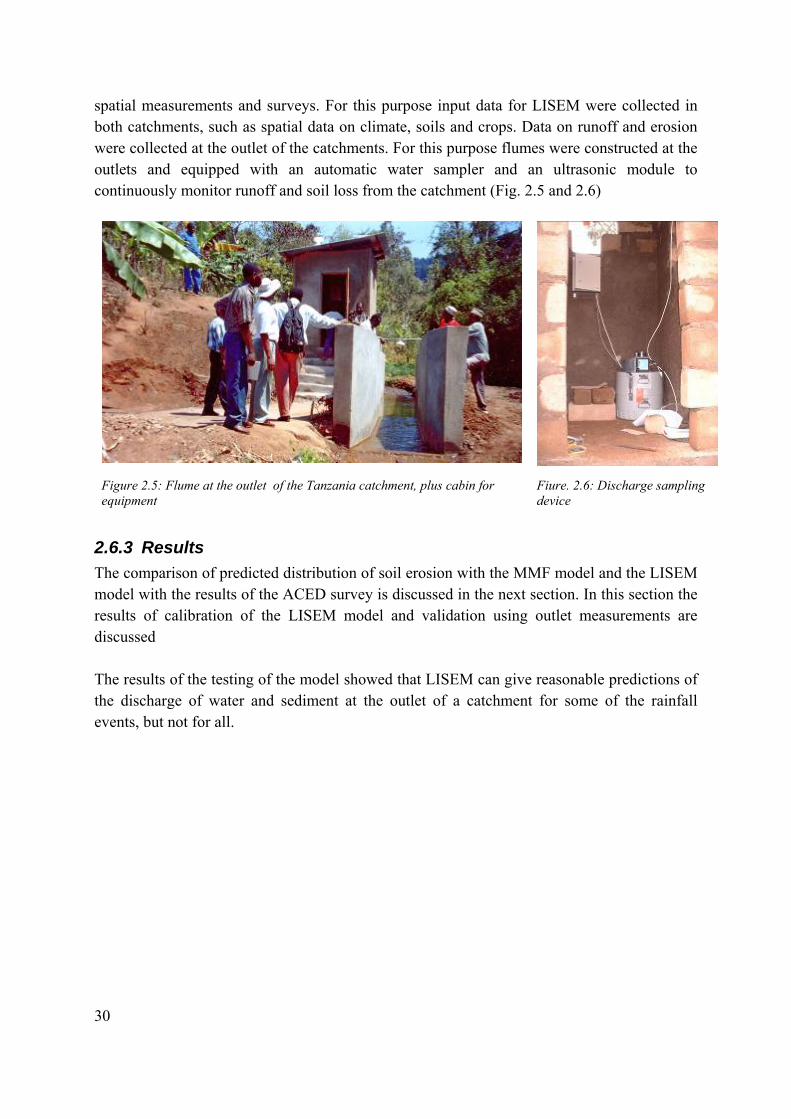
spatial measurements and surveys. For this purpose input data for LISEM were collected in both catchments, such as spatial data on climate, soils and crops. Data on runoff and erosion were collected at the outlet of the catchments. For this purpose flumes were constructed at the outlets and equipped with an automatic water sampler and an ultrasonic module to continuously monitor runoff and soil loss from the catchment (Fig. 2.5 and 2.6)
Figure 2.5: Flume at the outlet of the Tanzania catchment, plus cabin for equipment
Fiure. 2.6: Discharge sampling device
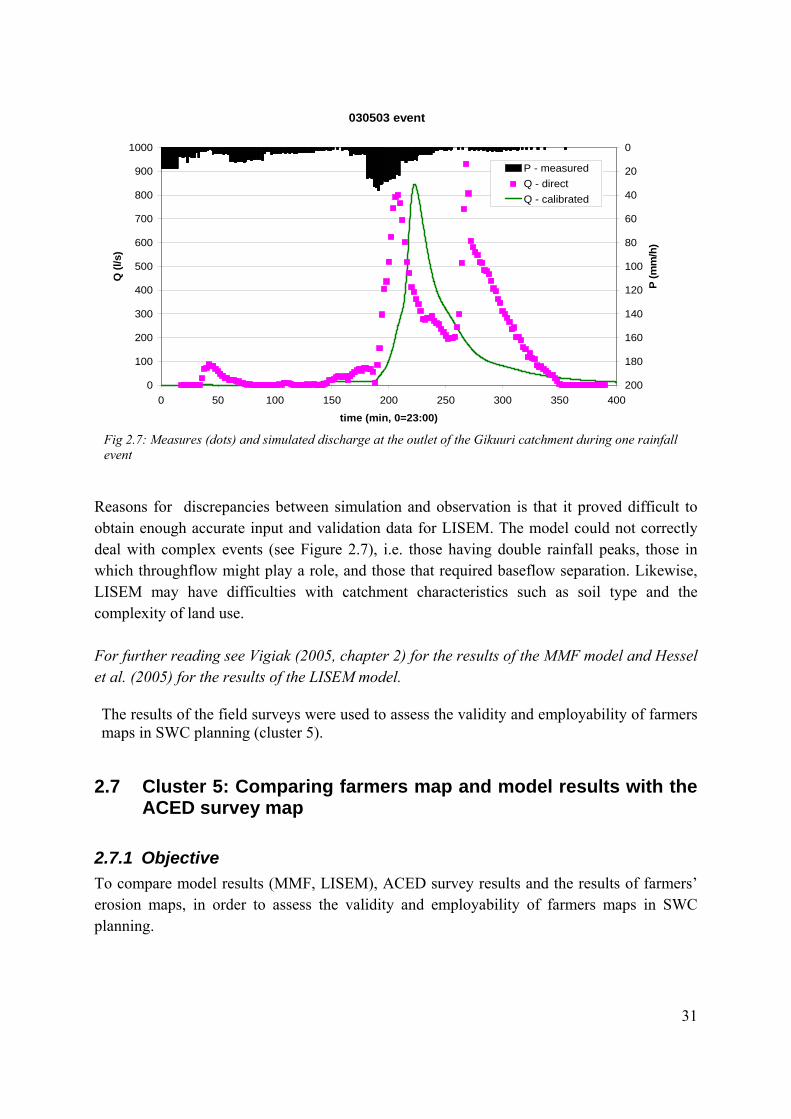
2.6.3 Results The comparison of predicted distribution of soil erosion with the MMF model and the LISEM model with the results of the ACED survey is discussed in the next section. In this section the results of calibration of the LISEM model and validation using outlet measurements are discussed The results of the testing of the model showed that LISEM can give reasonable predictions of the discharge of water and sediment at the outlet of a catchment for some of the rainfall events, but not for all.
31
Reasons for discrepancies between simulation and observation is that it proved difficult to obtain enough accurate input and validation data for LISEM. The model could not correctly deal with complex events (see Figure 2.7), i.e. those having double rainfall peaks, those in which throughflow might play a role, and those that required baseflow separation. Likewise, LISEM may have difficulties with catchment characteristics such as soil type and the complexity of land use. For further reading see Vigiak (2005, chapter 2) for the results of the MMF model and Hessel et al. (2005) for the results of the LISEM model. The results of the field surveys were used to assess the validity and employability of farmers maps in SWC planning (cluster 5).
2.7 Cluster 5: Comparing farmers map and model results with the ACED survey map
2.7.1 Objective To compare model results (MMF, LISEM), ACED survey results and the results of farmers’ erosion maps, in order to assess the validity and employability of farmers maps in SWC planning.
030503 event
0
100
200
300
400
500
600
700
800
900
1000
0 50 100 150 200 250 300 350 400
time (min, 0=23:00)
Q (l
/s)
0
20
40
60
80
100
120
140
160
180
200
P (m
m/h
)
P - measuredQ - directQ - calibrated
Fig 2.7: Measures (dots) and simulated discharge at the outlet of the Gikuuri catchment during one rainfall event

32
2.7.2 Activities Comparing farmers map with the ACED survey map For the Gikuuri catchment in Kenya farmers’ maps were compared with scientific observations. The scientific evaluation was done using rills and sheet erosion features firstly along the four transects and then upscaled to catchment, based on slope steepness. The spatial erosion patterns between the two approaches were compared using cross tabulation and the degree of agreement was evaluated using kappa coefficient analysis in the SPSS program. In the Tanzanian site the results of the previously described ACED method were compared to the results of a survey using farmers indicators. In this survey the type and number of erosion indicators per field were recorded. The number of farmers’ indicators per field increased with erosion intensity, from less than four in slightly eroded fields to more than eight in severely eroded fields. Comparing MMF model simulation results with ACED maps The MMF model was applied to both catchments and the results were compared to the results of the ACED field survey. Comparing LISEM simulation results with ACED maps The LISEM model was applied to the Kenyan catchments and the results were compared to the results of the ACED field survey.
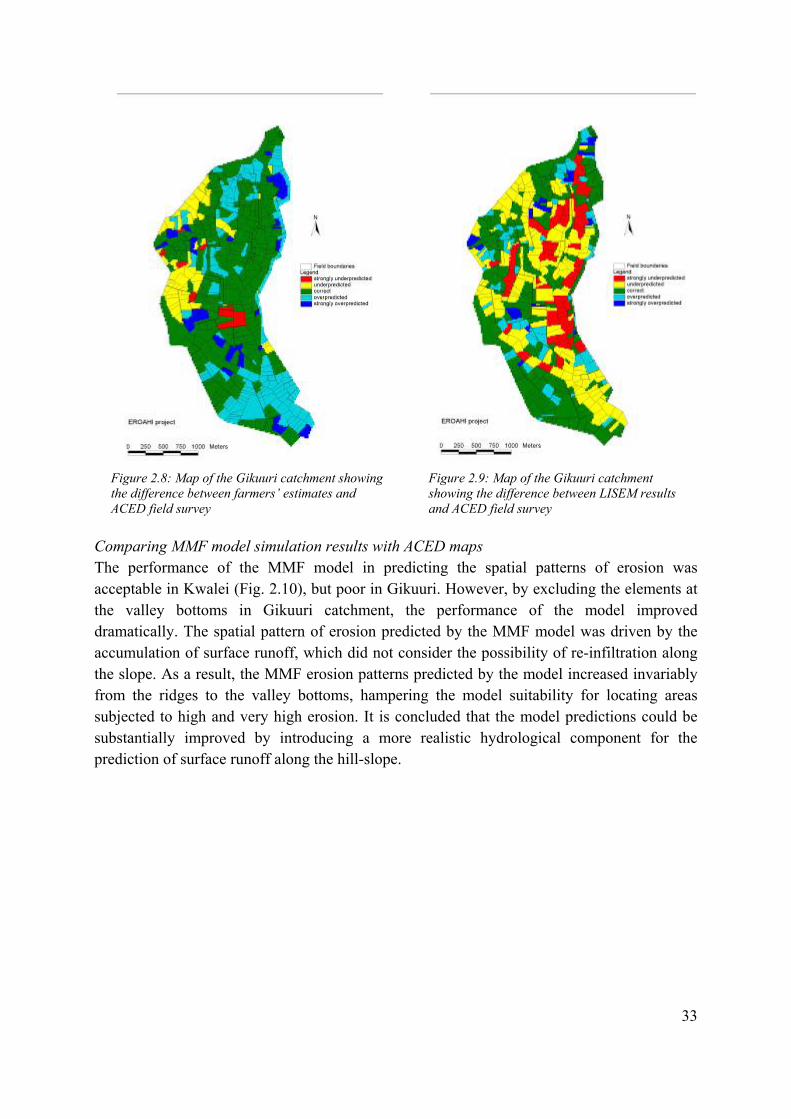
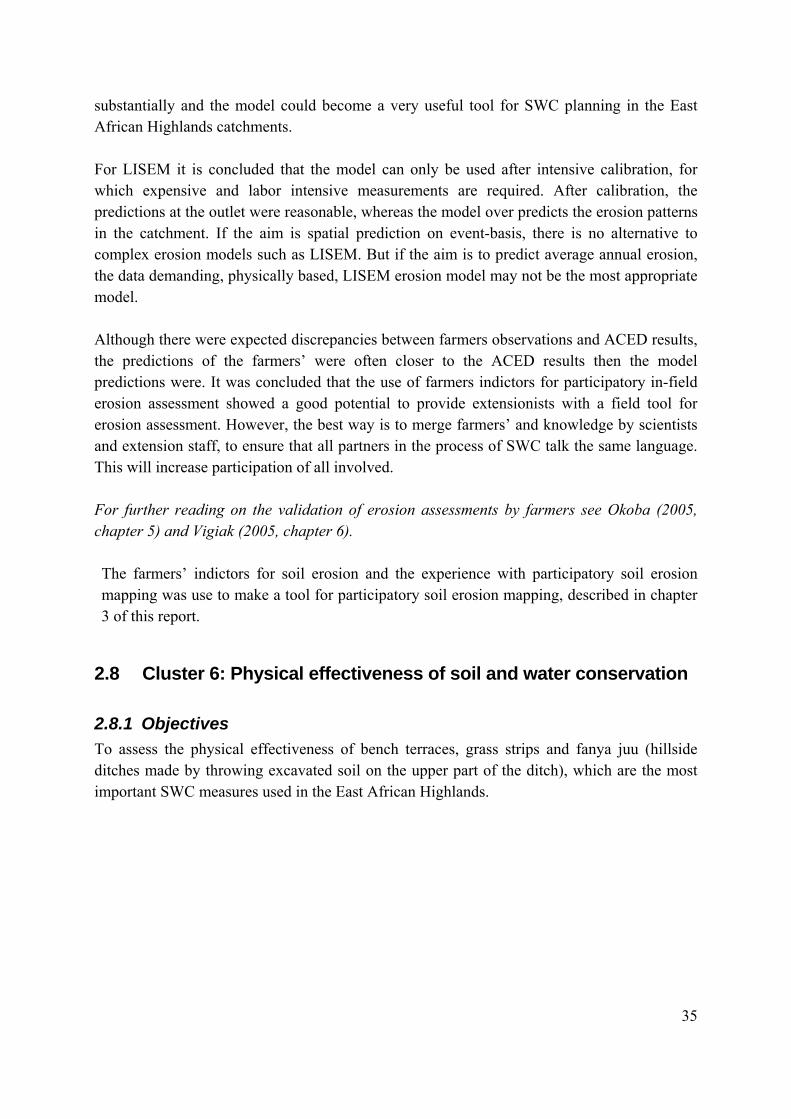
2.7.3 Results Comparing farmers map ACED field surveys In the Kenyan site the soil erosion pattern between the farmers’ and scientific approaches showed an agreement (a kappa value of 0.478 at P<0.01) at transect scale and at the catchment scale the agreement was slightly weaker (a kappa value of 0.272 at P<0.001). Matching the erosion patterns between the two approaches showed a correct match accounting for 56 percent of the catchment (Fig. 2.8), but increased to 92 percent when a one-class mismatch error was accepted. Farmers observed more area under flat and gentle slopes to have high erosion than the area approximated by scientific evaluation, which could be attributed to the inherent difference in the concept of erosion evaluation. In the Tanzanian research site all farmers’ indicators were positively correlated to the ACED erosion assessment classes. The validation yielded a highly significant correlation coefficient (0.81). More than 80% of very severely eroded fields were correctly classified, whereas most misclassification occurred among slightly and moderately eroded fields. Comparing LISEM simulation results with ACED maps Comparison with observed erosion patterns did not show over-prediction, but simulated patterns only partly matched observed ones (Fig. 2.9). The correlation coefficient was calculated at 0.224. However, if an erosion class difference of 1 class was accepted, 60% of the fields was classified correctly.
33
Figure 2.8: Map of the Gikuuri catchment showing the difference between farmers’ estimates and ACED field survey
Figure 2.9: Map of the Gikuuri catchment showing the difference between LISEM results and ACED field survey
Comparing MMF model simulation results with ACED maps The performance of the MMF model in predicting the spatial patterns of erosion was acceptable in Kwalei (Fig. 2.10), but poor in Gikuuri. However, by excluding the elements at the valley bottoms in Gikuuri catchment, the performance of the model improved dramatically. The spatial pattern of erosion predicted by the MMF model was driven by the accumulation of surface runoff, which did not consider the possibility of re-infiltration along the slope. As a result, the MMF erosion patterns predicted by the model increased invariably from the ridges to the valley bottoms, hampering the model suitability for locating areas subjected to high and very high erosion. It is concluded that the model predictions could be substantially improved by introducing a more realistic hydrological component for the prediction of surface runoff along the hill-slope.

34
Conclusions For the MMF model it is concluded that at field scale, considering the limited number of model inputs and its simplicity of application, the model is well suited for SWC planning purposes. At the catchment scale, the accumulation procedure of surface runoff should be applied critically, or even excluded in catchments where re-infiltration is frequent. More generally, by introducing a more realistic hydrological component for the prediction of surface runoff along the hill-slope, the model performance at catchment scale could improve
Figure 2.10 Spatial patterns of erosion at Kwalei Catchment
35
substantially and the model could become a very useful tool for SWC planning in the East African Highlands catchments. For LISEM it is concluded that the model can only be used after intensive calibration, for which expensive and labor intensive measurements are required. After calibration, the predictions at the outlet were reasonable, whereas the model over predicts the erosion patterns in the catchment. If the aim is spatial prediction on event-basis, there is no alternative to complex erosion models such as LISEM. But if the aim is to predict average annual erosion, the data demanding, physically based, LISEM erosion model may not be the most appropriate model. Although there were expected discrepancies between farmers observations and ACED results, the predictions of the farmers’ were often closer to the ACED results then the model predictions were. It was concluded that the use of farmers indictors for participatory in-field erosion assessment showed a good potential to provide extensionists with a field tool for erosion assessment. However, the best way is to merge farmers’ and knowledge by scientists and extension staff, to ensure that all partners in the process of SWC talk the same language. This will increase participation of all involved. For further reading on the validation of erosion assessments by farmers see Okoba (2005, chapter 5) and Vigiak (2005, chapter 6). The farmers’ indictors for soil erosion and the experience with participatory soil erosion mapping was use to make a tool for participatory soil erosion mapping, described in chapter 3 of this report.
2.8 Cluster 6: Physical effectiveness of soil and water conservation
2.8.1 Objectives To assess the physical effectiveness of bench terraces, grass strips and fanya juu (hillside ditches made by throwing excavated soil on the upper part of the ditch), which are the most important SWC measures used in the East African Highlands.
36
2.8.2 Activities Gerlach troughs, trench ditches and runoff plots were used to assess the physical effectiveness. Besides, farmer's were interviewed and group discussions were used to obtain farmer's reasons for preferences of certain SWC measures.
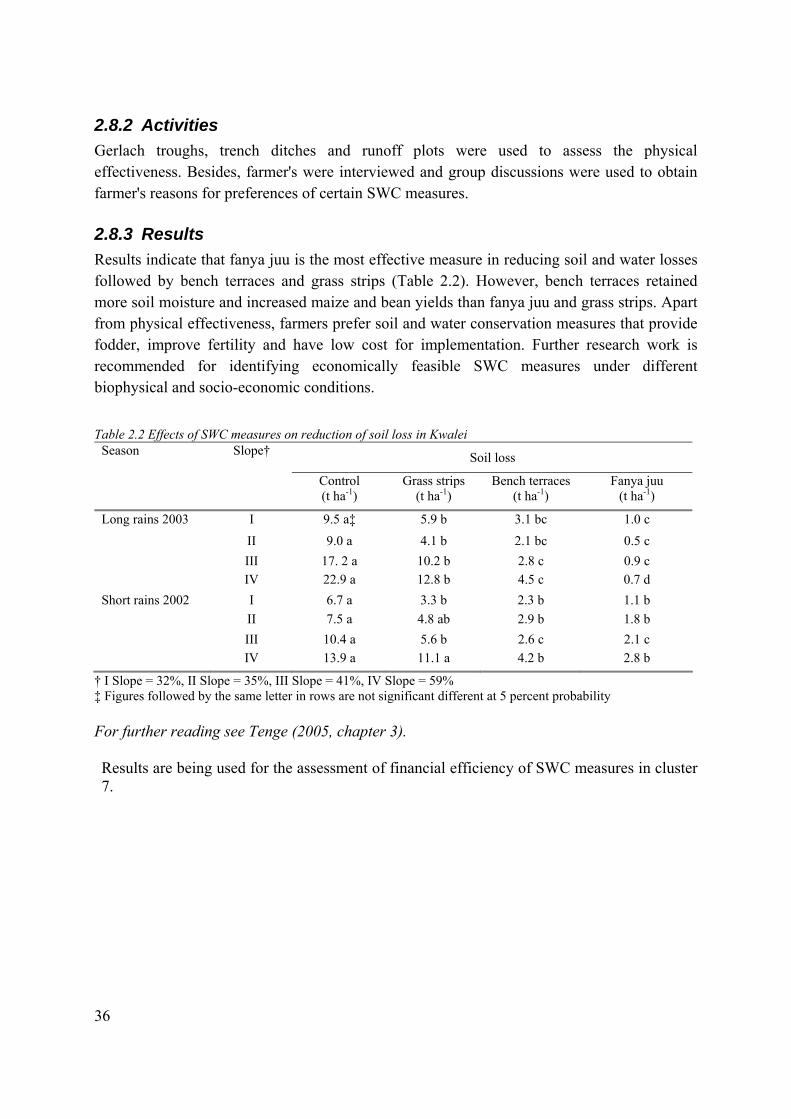
2.8.3 Results Results indicate that fanya juu is the most effective measure in reducing soil and water losses followed by bench terraces and grass strips (Table 2.2). However, bench terraces retained more soil moisture and increased maize and bean yields than fanya juu and grass strips. Apart from physical effectiveness, farmers prefer soil and water conservation measures that provide fodder, improve fertility and have low cost for implementation. Further research work is recommended for identifying economically feasible SWC measures under different biophysical and socio-economic conditions. Table 2.2 Effects of SWC measures on reduction of soil loss in Kwalei
Season Slope† Soil loss
Control (t ha-1)
Grass strips (t ha-1)
Bench terraces (t ha-1)
Fanya juu (t ha-1)
Long rains 2003 I 9.5 a‡ 5.9 b 3.1 bc 1.0 c II 9.0 a 4.1 b 2.1 bc 0.5 c III 17. 2 a 10.2 b 2.8 c 0.9 c IV 22.9 a 12.8 b 4.5 c 0.7 d Short rains 2002 I 6.7 a 3.3 b 2.3 b 1.1 b II 7.5 a 4.8 ab 2.9 b 1.8 b III 10.4 a 5.6 b 2.6 c 2.1 c IV 13.9 a 11.1 a 4.2 b 2.8 b
† I Slope = 32%, II Slope = 35%, III Slope = 41%, IV Slope = 59% ‡ Figures followed by the same letter in rows are not significant different at 5 percent probability For further reading see Tenge (2005, chapter 3). Results are being used for the assessment of financial efficiency of SWC measures in cluster 7.
37
2.9 Cluster 7: Financial effectiveness of soil and water conservation
2.9.1 Objectives To assess the costs and benefits of most frequently implemented SWC measures
2.9.2 Activities In the Tanzanian research site a study was carried out to assess the costs and benefits of bench terraces, grass strips and fanya juu which are important SWC measures. Cost Benefit Analysis (CBA) was undertaken to farmers with low, moderate and high opportunity costs of labour at different slopes and soil types.
2.9.3 Results Results show that labour is the major costly item in implementing SWC measures and is higher on bench terraces (66-592 LDha-1) than fanya juu (43-388 LDha-1) and grass strips (7-59 LDha-1). The results also show that the costs of establishing SWC measures exceeds the returns in the first two years, and that in the period of 15 years there is profitability (NPV) ranging from US $ 10-600 ha-1, depending on slope, soil type and opportunity costs of the labour (Fig. 2.11). When a farmers has off-farm income SWC measures are not financially attractive. It is concluded that high investment costs and initial negative returns are the major hindrances to the adoption of SWC measures by small holder farmers on Usambara Mountains. In order to alleviate the initial investment costs, support is needed e.g. by increase of purchase prices of crops and small credit facilities. Introduction of dairy cattle under zero grazing system will also increase adoption of SWC measures because of the high benefits from fodder grasses used to stabilize SWC measures.

38
Figure 2.11: Cash flow over 15 years for the three SWC measures on stable soil, moderate slope and for farmers with moderate opportunity costs of labour. For further reading see Tenge (2005, chapter 4). The results were used for the development of the financial analysis tool in cluster 8.
2.10 Cluster 8: Construction of a tool for financial analysis of soil and water conservation measures
2.10.1 Objective To develop a simple tool for financial analysis of SWC measures to be used by extension workers and farmers The purpose of this tool is to assess the financial benefits of SWC measures at the planning stage, both in the short and long runs, under different situations of farms and farmers in East African highlands. The tool was developed for the individual farm level but can be used to identify an extra costs due to run-on effects.
2.10.2 Activities The information from cluster 6 and 7 was used to make the tool.
-250
-200
-150
-100
-50
0
50
100
150
0 2 4 6 8 10 12 14 16
Time (years)
Cas
h flo
w (U
S $/
ha)
Bench terracesFanya juuGrass strips
39
2.10.3 Results The tool is in a form of manual with spreadsheets and uses the basic principles of cost benefit analysis. In this analysis both socio-economic and biophysical data are required. Socio-economic data are farmer groups and their opportunity costs of labour, input and output prices and the amount of labour required for each operation to establish, produce and maintain each SWC measure. Biophysical data include soil type, slope, erosion situation, type of crops, farm location and size, yield levels, available SWC options and their impacts on crop yields. The tool is used in stepwise approach where all the costs to be incurred in implementing SWC measure are identified and quantified. Benefits that are expected from SWC measure are also identified and quantified. The financial benefits are then determined by comparing the stream of benefits and costs over a number of years depending on farmer's time preferences and the life span of the respective SWC measure. When the benefits outweigh the costs, the respective SWC measure is financially profitable. The tool is described in detail in chapter 4 of this report.
2.11 Cluster 9: Testing and application of the tools under field circumstances
2.11.1 Objective Test the applicability of the tools in a different setting then where it was developed, and the fine-tune the methods based on this experience.
2.11.2 Activities The 2 tools developed in cluster 3 and 8 respectively were tested in the field. The financial tool was developed in Tanzania and tested in Kenya, and the soil erosion mapping tool was developed in Kenya and tested in Tanzania.
2.11.3 Results The use of the two participatory tools shows how farmers apply their knowledge of the local ecology to bring widespread awareness of the soil erosion indicators and status of the soil erosion to the community. The tools helped building common views by the community on the impact of soil erosion on soil productivity, also assisted farmers to be able to identify fields or hillslopes that were suffering from severe soil erosion problems. It was demonstrated that when farmers conduct their own evaluation of soil degradation they readily accept the depicted erosion scenario as their own. Apparent outcome of the soil erosion mapping tool was that sources of surface runoff that damaged downslope fields could be identified leading to collective planning of SWC measures at catchment scale. Farmers distinguished between SWC plans suitable for individual farms and those for public lands. Collective

40
implementation of conservation measures was only perceived practical and socially feasible at hillslope scale rather than catchment scale for infield conservation activities. The financial analysis demonstrated how farmers could make informed decisions when they are aware of their current and future financial position in with and without SWC situations. Application of the financial tool demonstrated how a farmer planning to conserve could resolve for financially suitable SWC measures that fits his/her socio-economic and biophysical setting therefore overriding blanket recommendation from the experts. The stepwise analysis of costs assisted farmers to identify conservation structures that must be undertaken collectively e.g. public properties at catchment scale and at hillslope scale for construction of structures like cut-off-drains, to counter overland flow between farms. It also points at the need for farmers who may not afford to construct their infield conservation measures to start by constructing cut-off-drains structures to avoid causing their neighbours from incurring costs that could be avoided. Therefore adoption of these tools can add value to SWC projects in various ways. • Firstly, it could increase acceptance of expert-generated recommendations after gaining
insight in the farmers’ self-evaluations of problems and solutions. This is so because farmers tend to be sceptical of extension messages and they are only accepted after they have been evaluated by individual farmers’ knowledge and beliefs. This could increase the adoption rate of SWC measures.
• The tools assist extension workers and farmers to make an ex-ante financial analysis of SWC measures, specific for their own situation. The financial analysis often shows that costs will exceed returns in the first 2 or 3 years, after which the returns will be higher. This analysis, again carried out together with the farmer, will help the farmer to make well informed decisions and will increase the adoption rate of SWC measures.
• The maps developed while applying the tool for participatory erosion mapping give a spatial distribution of erosion over the catchment. It shows areas with high, medium and low erosion. This map will provide the possibility to discuss with the community upstream – down stream effects. It will help to let farmers realise that their actions on their fields may affect other down streams. It may also help to initiate collective action in the hotspots of the catchment rather then farm by farm implementation of SWC measures.
2.12 Cluster 10: How to use the tools in current approaches
2.12.1 Objective To determine in which stages of the currently applied catchment approaches in Kenya and Tanzania the developed tools best fit and have optimal effect.

41
2.12.2 Activities The team consulted key informants of the extension services of the Ministries of Agriculture in Kenya and Tanzania. Interviews, workshops and field visits were organized. Conclusions were summarized and feed-back workshops were organized with key-informants and farmers.
2.12.3 Results The results of this cluster are described in chapter 5 (Kenya) and chapter 6 (Tanzania) of this report.

42
43
TOOL FOR PARTICIPATORY SOIL EROSION MAPPING
Chapter 3

44
45
3 Tool for participatory soil mapping
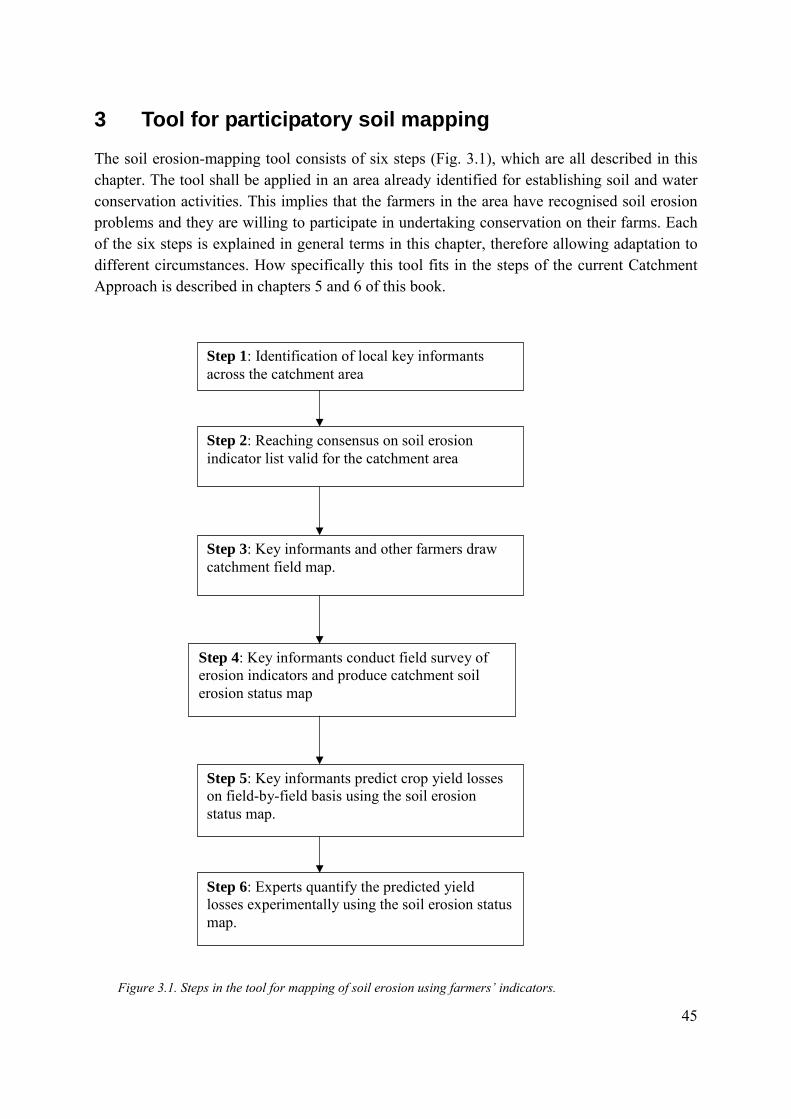
The soil erosion-mapping tool consists of six steps (Fig. 3.1), which are all described in this chapter. The tool shall be applied in an area already identified for establishing soil and water conservation activities. This implies that the farmers in the area have recognised soil erosion problems and they are willing to participate in undertaking conservation on their farms. Each of the six steps is explained in general terms in this chapter, therefore allowing adaptation to different circumstances. How specifically this tool fits in the steps of the current Catchment Approach is described in chapters 5 and 6 of this book.
Step 2: Reaching consensus on soil erosion indicator list valid for the catchment area
Step 3: Key informants and other farmers draw catchment field map.
Step 4: Key informants conduct field survey of erosion indicators and produce catchment soil erosion status map
Step 5: Key informants predict crop yield losses on field-by-field basis using the soil erosion status map.
Step 6: Experts quantify the predicted yield losses experimentally using the soil erosion status map.
Step 1: Identification of local key informants across the catchment area
Figure 3.1. Steps in the tool for mapping of soil erosion using farmers’ indicators.
46
Step 1: Identification of local key informants across the catchment area
Aim: Identify key informants whose homesteads are evenly distributed in their individual villages so that they assist in subsequent steps.
Expected outputs: List of key informants representing each catchment village units Activity: First, a team of key informants is carefully selected. The village leaders’ knowledge of the farmers in their respective villages could be applied in identification of suitable key informants. It is imperative that this team is gender balanced and as much as possible in equal proportion of both genders. Number of key-informants to select in each village should depend on the size of the village. Once identified, the experts applying this tool need to brief the key informants on their role in the participatory soil erosion mapping exercise.
“When dealing with women in a group activity, punctuality in executing the planned work must be adhered to, otherwise they are likely to politely depart before the planned activity is commenced or finalised…for reasons related to household chores”
Step 2: Reaching consensus on soil erosion indicator list valid for the catchment area
Aim: Establishing consensus knowledge of erosion indicators and their severity ranking.
Expected outputs: Consensus list of soil erosion indicators and their relative severity ranking
Activity: A public meeting during a focussed PRA, in the selected area e.g. a catchment area, can be organised for the farmers to generate a list of soil erosion indicators. With this list the key informants will then make transect walk across the landscape in the catchment area ensuring that all types of topographies prone to erosion impact are visited. The survey needs to be undertaken after a rainfall season. Besides this transect walk being a familiarization opportunity for some of the key informants, more other erosion indicators are likely to be identified to add to the list generated during the public meeting. After this it’s advisable to present the final list of indicators to the farmers in the study area during another public meeting. Once all agree, the consensus list of soil erosion and sedimentation indicators is established. The farmers could also indicate which of the indicators signify the current and past erosion processes.
47
Current indicators are those erosion features that develop after a short period of rainfall, but tillage or human movements can easily destoy their evidence. Past erosion indicators indicate long-term recurrence of erosion and cannot be easily reversed or obliterated by tillage operations alone
“My friend though I am the Soil and Water Conservation Officer in this Division, the degree of erosion is worrying and seriously higher than ever imagined” The officer making a comment during transect walks with farmers to the project leader
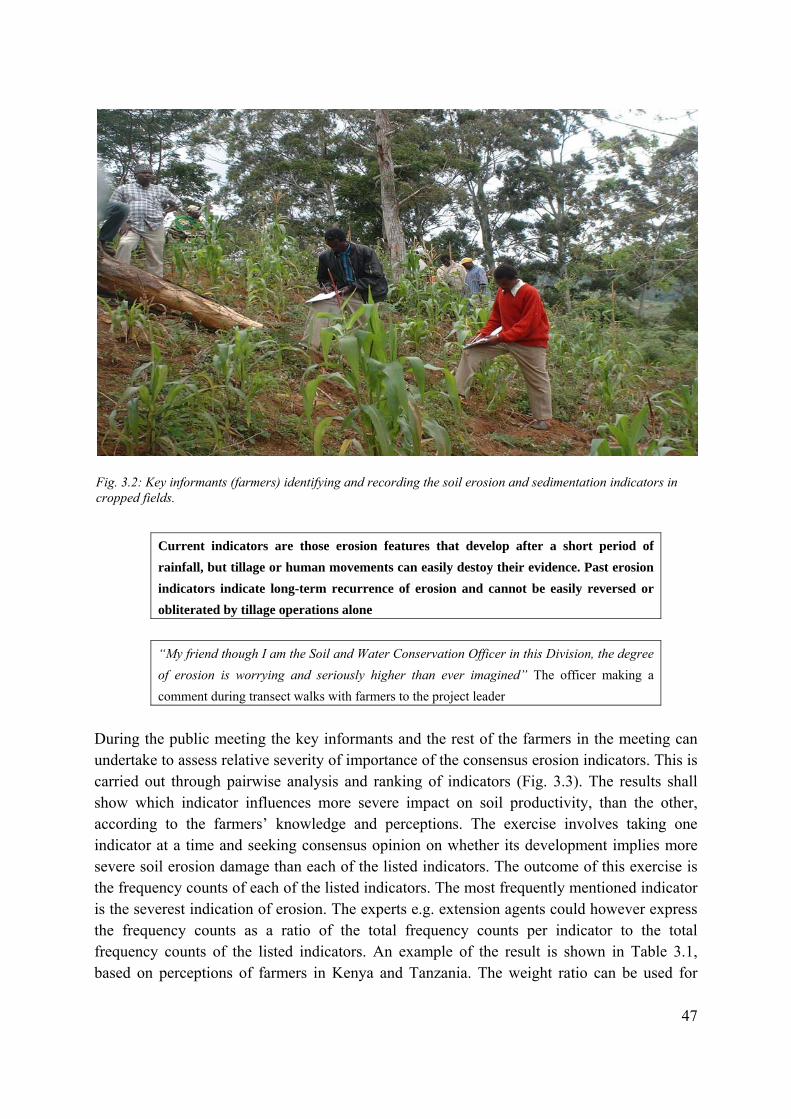
During the public meeting the key informants and the rest of the farmers in the meeting can undertake to assess relative severity of importance of the consensus erosion indicators. This is carried out through pairwise analysis and ranking of indicators (Fig. 3.3). The results shall show which indicator influences more severe impact on soil productivity, than the other, according to the farmers’ knowledge and perceptions. The exercise involves taking one indicator at a time and seeking consensus opinion on whether its development implies more severe soil erosion damage than each of the listed indicators. The outcome of this exercise is the frequency counts of each of the listed indicators. The most frequently mentioned indicator is the severest indication of erosion. The experts e.g. extension agents could however express the frequency counts as a ratio of the total frequency counts per indicator to the total frequency counts of the listed indicators. An example of the result is shown in Table 3.1, based on perceptions of farmers in Kenya and Tanzania. The weight ratio can be used for
Fig. 3.2: Key informants (farmers) identifying and recording the soil erosion and sedimentation indicators in cropped fields.
48
quick assessment of the erosion impact in areas with different distribution of soil erosion indicators.
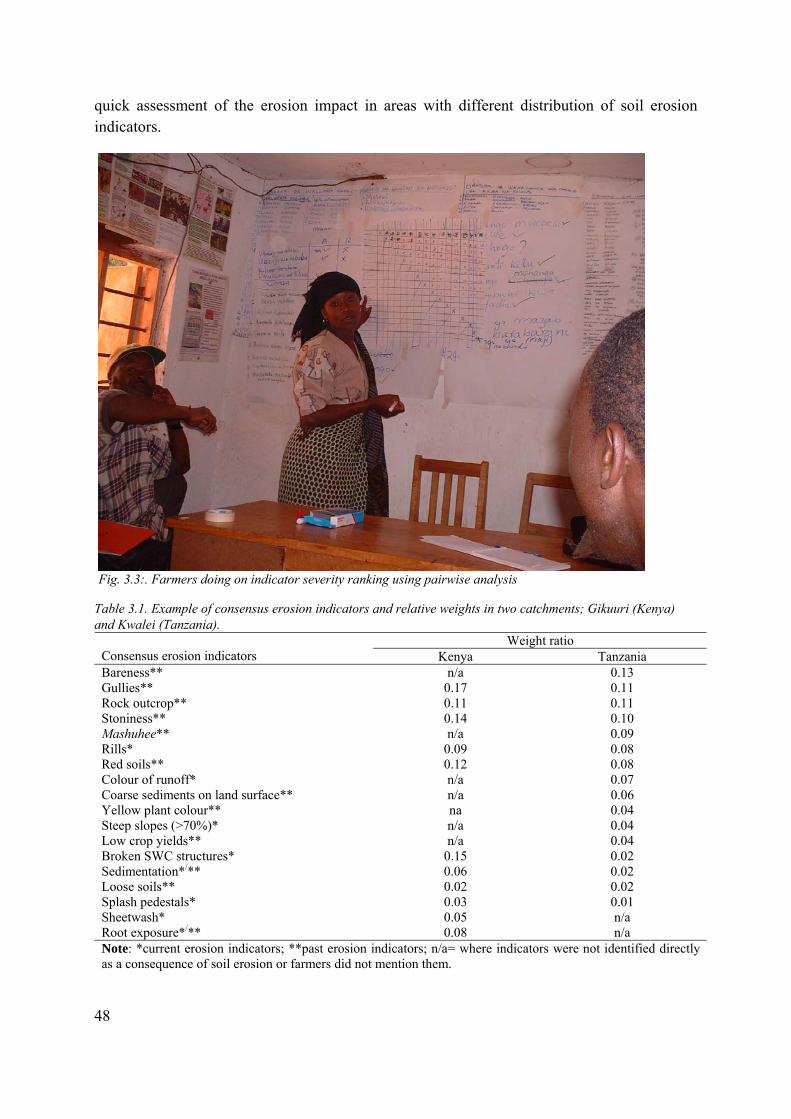
Table 3.1. Example of consensus erosion indicators and relative weights in two catchments; Gikuuri (Kenya) and Kwalei (Tanzania).
Weight ratio Consensus erosion indicators Kenya Tanzania Bareness** n/a 0.13 Gullies** 0.17 0.11 Rock outcrop** 0.11 0.11 Stoniness** 0.14 0.10 Mashuhee** n/a 0.09 Rills* 0.09 0.08 Red soils** 0.12 0.08 Colour of runoff* n/a 0.07 Coarse sediments on land surface** n/a 0.06 Yellow plant colour** na 0.04 Steep slopes (>70%)* n/a 0.04 Low crop yields** n/a 0.04 Broken SWC structures* 0.15 0.02 Sedimentation*/** 0.06 0.02 Loose soils** 0.02 0.02 Splash pedestals* 0.03 0.01 Sheetwash* 0.05 n/a Root exposure*/** 0.08 n/a Note: *current erosion indicators; **past erosion indicators; n/a= where indicators were not identified directly as a consequence of soil erosion or farmers did not mention them.
Fig. 3.3:. Farmers doing on indicator severity ranking using pairwise analysis

49
Step 3: Key informants and other farmers draw catchment field map.
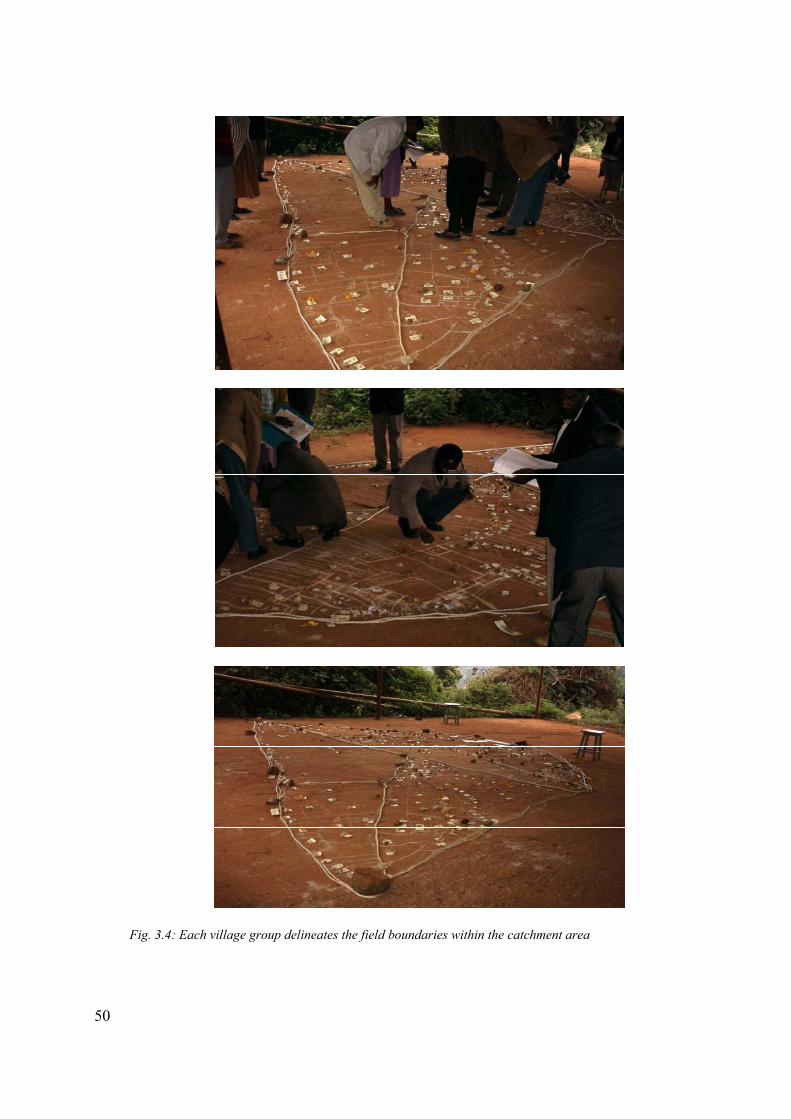
Aim: Sketch the catchment field map Expected outputs: Catchment field map Activity: The key informants and the rest of the farmers in the villages plan for a meeting. The purpose is to sketch the catchment area map, which shows the plan of all the field holdings identifying their respective owners. The sketching of the map by the farmers is possible since the key informants ought to have been selected from the villages within the catchment. So their knowledge of the respective villages should be quite adequate to undertake household field delineation and identification of the owners by name. First, the key informants are asked to sketch the outline of the catchment external boundary. They could use any local materials available to ensure the boundary line is clearly marked and any other features acting as benchmarks are noted within the catchment area. Once the outline has been established, the key informant can now identify on the map the approximate location of their villages. Upon which they can mark the outline boundary of their individual villages. Once all the key informants have marked the outline of village boundaries on the map, and it’s agreeable among them, the mapping of the individual field holdings can start. The farmers attending the meeting will check the accuracy of the field plans in the area (Fig. 3.4). Secondly, once the catchment field map has been drawn and all village leaders agree, the experts should transfer a copy of the same sketch map from the ground/floor to a sheet of paper and whose accuracy and details must be verified by the key informants (see the final catchment field map in Figure 3.4, at the bottom).
“Some of us have come to know many more people in our village and which field is adjacent to which through this map drawing exercise”…a farmer acknowledging the importance of participating in map drawing
50
Fig. 3.4: Each village group delineates the field boundaries within the catchment area
51
Step 4: Key informants conduct field survey of erosion indicators and produce catchment soil erosion status map
Aim: Identification of eroded fields, establishing the degree of erosion and classification into erosion classes
Expected output: Catchment soil erosion status map Activity: The next step is to request the key informants to visit all the fields and record the erosion indicators observed on each field using the sketched catchment field map. In every field the key informants check if soil erosion and sedimentation can be seen on the soil surface layer. They shall delineate the spatial extent of erosion: sub-dividing a field into different segments according to the type of indicators and extent of damage to the soils. Besides distinguishing field segments on the ground the same delineation is marked on the respective fields on the catchment field map. All indicators observed in every field segments must also be recorded in a field notebook. Also the name of the owner of the visited field holding shall be recorded and a code name marked on the catchment field map (see example, Table 3.2). It is recommended that this activity takes place at the end of a rainfall season, just before harvesting operations are carried out, to avoid destroying some of the evidence of soil erosion and sedimentation. Whereas the farmers, based on their experience, can estimate the severity of soil damage on basis of the indicators patterns and types (Fig. 3.5), the experts can determine the severity classes using the aggregation of weight ratios (using Tables 3.1 and 3.2). Finally after field-by-field visits a catchment-wide soil erosion status map is produced. A workshop is organised during which the field owners can verify the erosion classes assigned to their fields (Fig. 3.6).
“Some of these indicators we just knew them by name but today we were able to evidence them….” Statement from a key informant after a field survey
“This project has given us an opportunity to picture the extent of soil erosion in our area, a situation we earlier did not bother to discuss as a community. Because of this gloomy picture of soil damage, possible in the near future crop yields will become lower and lower, also under threat is the source of our rivers, the …” Assistant Chief’s remarks at the end of the meeting

52
Observation: Farmers were motivated to think of collective action activities seeing the extent of soil erosion beyond their individual fields. Catchment-wide activities were not favored, due to bad experiences of group work in the past, but at hillslope scale or cluster of farmers owning adjacent fields, it was discussed on how to overcome the common problems e.g. road runoff or neighbors field generating runoff, which was affecting downslope fields.
During the final workshop: Extension Officers: “Though we learnt about soil erosion processes in college we had neither imagined to use the erosion indicators to alert farmer on the extent of soil erosion nor thought about them when advising farmers on better land management practices” Farmer: “I was checking on the map to pinpoint the fields that were responsible of runoff water that floods my homestead and my vegetable garden so that I can approach the owners and discuss on how to solve the problem once and for all…we however need your intervention too”
Table 3.2. Example of how an expert could assess erosion status for field segments.
Field portion Indicators Adding up indicator(s) weights
Soil erosion class*
F33-upper Sheet, rills Σ(0.05+0.09)=0.14 L F33-Lower Sedimentation, stoniness Σ(0.06+0.14)=0.20 M D29 Rill, red soil Σ(0.09+0.12)=0.21 M
*Erosion risk High (H; >0.28), Moderate (M; 0.16-0.28), Low (L; <0.16)
Gullies
Stoniness
Rills
Figure 3.5: Farmers’ erosion classification (Moderate “M” and High “H”) in a field with non-uniform spread of erosion indicators.

53
Step 5: Key informants predict crop yield losses per field based on the soil erosion status map.
Aim: The farmers to establish association between soil loss and crop yield levels.
Expected output: Tables showing link between erosion classes and predicted crop yield loss Activity: This step could be carried out simultaneously with the previous step. But in case the crops were not yet mature when the previous step was carried out then this step could be undertaken at a different time. The key informants visit all the fields, characterised by different erosion indicators and a classified erosion status, and estimate (qualitatively) the crop yield loss the field owner is likely to experience during the current cropping season. The exercise can be repeated in consecutive cropping seasons to affirm the last season’ information. This ensures that effects of rainfall or management bias are ruled out. See an example of data sheet in Table 3. 3.
Figure 3.6: Soil erosion status map showing fields’ erosion class.
54
Table 3.3. An example of a survey form for erosion indicators and farmers’ perceived qualitative rates of soil erosion class and crop yield loss estimates
Names of enumerators Village: Date of visit
Name of farmer Observed erosion indicators
Predicted soil loss class (use H, M, L)
‡Predicted crop yield loss (use H, M, L)
Wilson Dan Rills, red soil M H Rop R Dawa Gullies, stoniness H H Kilimanjaro J Rills, sheet L L
‡Also reflects the general physical aspects of the soils besides the listed erosion indicators. H= high, M=moderate, L=Low. Yield loss of H = 50-100%, M = 25-50% and L = <25%.
Step 6: Experts quantify the predicted yield losses experimentally based on the soil erosion status map.
Aim: To establish local association between crop yield levels and soil erosion classes shown on the map
Expected output: Experimentally quantify farmers’ crop yield loss estimates Activity: Experts can sample a number of fields within areas classified as having high, moderate and low erosion status. Also the fields the farmers perceive as having minimum erosion impact should be identified. These fields would be the reference or control standards to enable calculation of the actual local crop yield gap or loss. Such fields can be found on hill summit (ridge-crest) or protected forest or areas near the homestead. The crop yield loss or reduction can be calculated by subtracting the crop yields in the different erosion classes from the reference or control fields (Table 3.4). The determined crop yield loss would be useful for rough estimation of crop yields in yield differences between fields experiencing different erosion levels. This association could motivate farmer to reconsider implementing improved soil and water management strategies. Table 3.4. Quantifying soil erosion status classes using crop yields.
Erosion status class Measured crop yield Crop yield loss
(t ha-1) (%)
Low 3.84 5 (±5) Moderate 2.14 48 (±15) High 1.39 66 (±20) REFERENCE‡ 4.08 0
‡This is a soil where erosion is perceived to have minimum impact Extra step 6.1: The experts could evaluate the equivalent soil fertility levels for soils under different erosion status. For this, soil samples from the topsoil depth could be collected from all the fields, both
55
the eroded and the hill summit fields (reference soils). An example of soil sample analysis shown below and showed a closer correlation between erosion status and the low fertility status: Table 3.5. Soil fertility levels for different erosion classes
Erosion status class Levels of the most sensitive soil nutrients
pH N% Pppm Kme% %Org C
Low 5.28 0.22 34.40 1.26 1.74 Moderate 4.51 0.21 19.00 0.97 1.42 High 4.81 0.19 20.83 0.80 1.48 REFERENCE‡ 5.23 0.24 35.36 1.46 1.66
Extra step 6.2. Though farmers have a clear knowledge of erosion processes, they most often ignore the impact of the insidious erosion phases due to splash drops, sheet and rills until severe and irreversible indicators emerge. Therefore illustrating the correlation between crop yields and dominant soil erosion indicators, could warn farmers not to let erosion attain some classes. Example of such relationship is shown: Table 3.5. Maize yields related to soil erosion indicators
Erosion indicator Maize crop yield (t/ha)
Maize grain yield loss (%)
Stoniness 0.83 79 (±20) Sedimentation 1.89 53 (±15) Red/loose soils 2.47 38 (±10) Current erosion indicators (sheet-rills- root exposure) 2.49 37 (±8) CONTROL 4.00 0

56

57
TOOL FOR PARTICIPATORY FINANCIAL ANALYSIS OF SOIL AND WATER CONSERVATION MEASURES
FOR FARM LEVEL PLANNING
Chapter 4

58
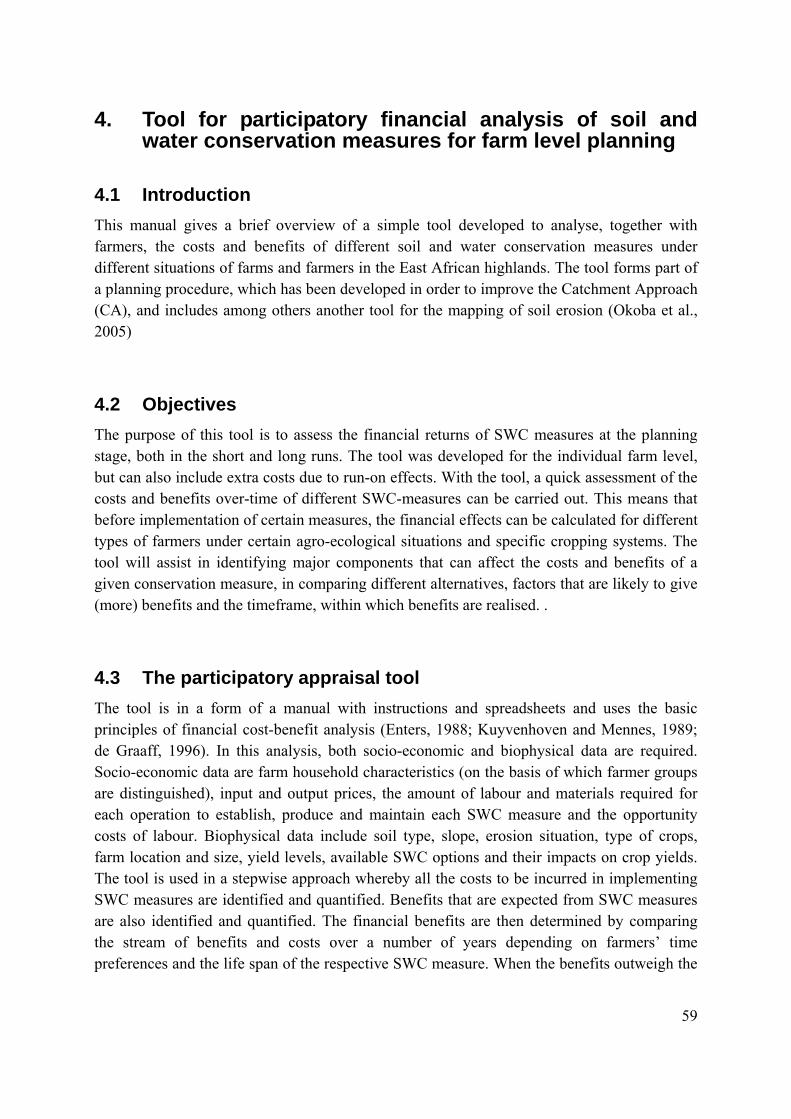
59
4. Tool for participatory financial analysis of soil and water conservation measures for farm level planning
4.1 Introduction This manual gives a brief overview of a simple tool developed to analyse, together with farmers, the costs and benefits of different soil and water conservation measures under different situations of farms and farmers in the East African highlands. The tool forms part of a planning procedure, which has been developed in order to improve the Catchment Approach (CA), and includes among others another tool for the mapping of soil erosion (Okoba et al., 2005)
4.2 Objectives The purpose of this tool is to assess the financial returns of SWC measures at the planning stage, both in the short and long runs. The tool was developed for the individual farm level, but can also include extra costs due to run-on effects. With the tool, a quick assessment of the costs and benefits over-time of different SWC-measures can be carried out. This means that before implementation of certain measures, the financial effects can be calculated for different types of farmers under certain agro-ecological situations and specific cropping systems. The tool will assist in identifying major components that can affect the costs and benefits of a given conservation measure, in comparing different alternatives, factors that are likely to give (more) benefits and the timeframe, within which benefits are realised. .
4.3 The participatory appraisal tool The tool is in a form of a manual with instructions and spreadsheets and uses the basic principles of financial cost-benefit analysis (Enters, 1988; Kuyvenhoven and Mennes, 1989; de Graaff, 1996). In this analysis, both socio-economic and biophysical data are required. Socio-economic data are farm household characteristics (on the basis of which farmer groups are distinguished), input and output prices, the amount of labour and materials required for each operation to establish, produce and maintain each SWC measure and the opportunity costs of labour. Biophysical data include soil type, slope, erosion situation, type of crops, farm location and size, yield levels, available SWC options and their impacts on crop yields. The tool is used in a stepwise approach whereby all the costs to be incurred in implementing SWC measures are identified and quantified. Benefits that are expected from SWC measures are also identified and quantified. The financial benefits are then determined by comparing the stream of benefits and costs over a number of years depending on farmers’ time preferences and the life span of the respective SWC measure. When the benefits outweigh the
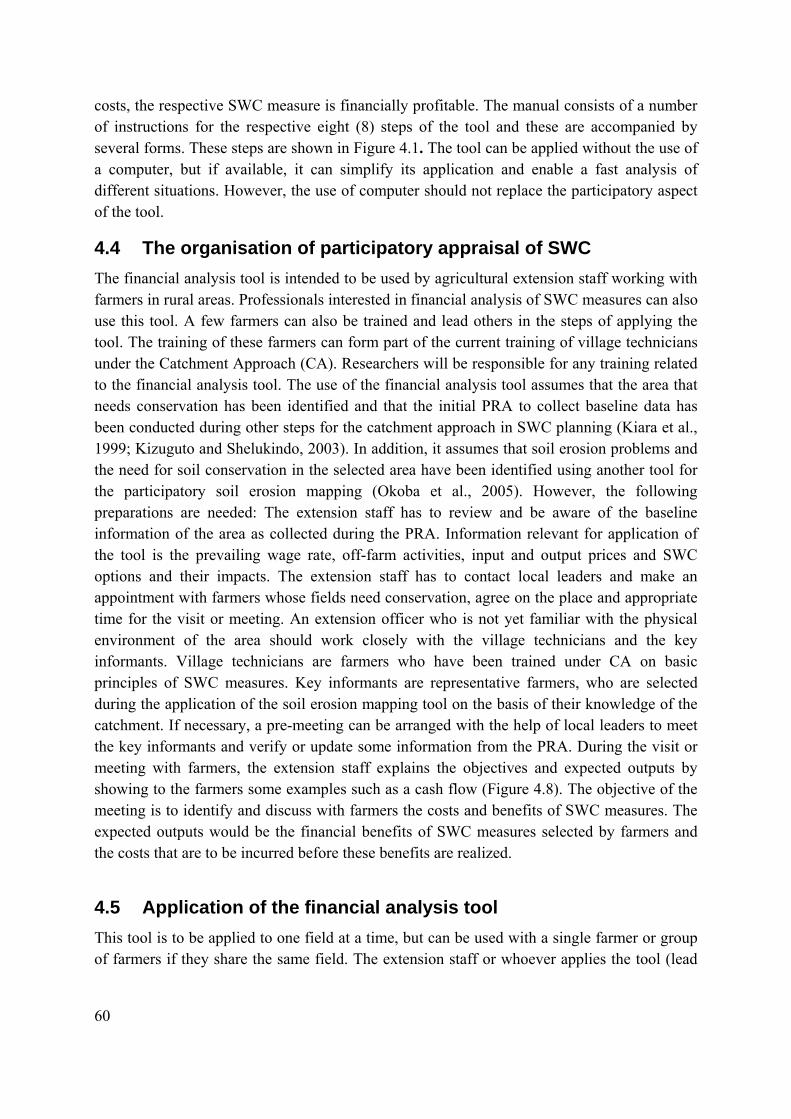
60
costs, the respective SWC measure is financially profitable. The manual consists of a number of instructions for the respective eight (8) steps of the tool and these are accompanied by several forms. These steps are shown in Figure 4.1. The tool can be applied without the use of a computer, but if available, it can simplify its application and enable a fast analysis of different situations. However, the use of computer should not replace the participatory aspect of the tool.
4.4 The organisation of participatory appraisal of SWC The financial analysis tool is intended to be used by agricultural extension staff working with farmers in rural areas. Professionals interested in financial analysis of SWC measures can also use this tool. A few farmers can also be trained and lead others in the steps of applying the tool. The training of these farmers can form part of the current training of village technicians under the Catchment Approach (CA). Researchers will be responsible for any training related to the financial analysis tool. The use of the financial analysis tool assumes that the area that needs conservation has been identified and that the initial PRA to collect baseline data has been conducted during other steps for the catchment approach in SWC planning (Kiara et al., 1999; Kizuguto and Shelukindo, 2003). In addition, it assumes that soil erosion problems and the need for soil conservation in the selected area have been identified using another tool for the participatory soil erosion mapping (Okoba et al., 2005). However, the following preparations are needed: The extension staff has to review and be aware of the baseline information of the area as collected during the PRA. Information relevant for application of the tool is the prevailing wage rate, off-farm activities, input and output prices and SWC options and their impacts. The extension staff has to contact local leaders and make an appointment with farmers whose fields need conservation, agree on the place and appropriate time for the visit or meeting. An extension officer who is not yet familiar with the physical environment of the area should work closely with the village technicians and the key informants. Village technicians are farmers who have been trained under CA on basic principles of SWC measures. Key informants are representative farmers, who are selected during the application of the soil erosion mapping tool on the basis of their knowledge of the catchment. If necessary, a pre-meeting can be arranged with the help of local leaders to meet the key informants and verify or update some information from the PRA. During the visit or meeting with farmers, the extension staff explains the objectives and expected outputs by showing to the farmers some examples such as a cash flow (Figure 4.8). The objective of the meeting is to identify and discuss with farmers the costs and benefits of SWC measures. The expected outputs would be the financial benefits of SWC measures selected by farmers and the costs that are to be incurred before these benefits are realized.
4.5 Application of the financial analysis tool This tool is to be applied to one field at a time, but can be used with a single farmer or group of farmers if they share the same field. The extension staff or whoever applies the tool (lead

61
person) should follow the steps shown in Figure A1 and described hereunder. During each step, the extension staff or lead person records the observations and responses in a pre-designed recording form (Tables 4.2-4.5). The recording forms can be modified to suit the local conditions. Figure 4.1. Steps in the tool for financial analysis of soil and water conservation measures
Step 1: Determination of biophysical situation
Aim: Identify the physical characteristics of the field (s) to be conserved. Expected output: List of bio-physical situation (slope, field size, erosion class, soil, crops
and yield levels) and SWC options for the respective field(s). Activities With the help of the soil erosion map from the participatory soil erosion mapping tool (Okoba et al., 2005), farmers locate their fields, identify the physical situation of slope, erosion class, crops, and yield levels (Figure 4.2 and Figure 4.3). Village technicians will help farmers to identify biophysical conditions that are not directly observed from the erosion map such as
Step 1: Determination of the physical situation
Step 3: Identification andquantification of costs
Step 2: Determination of socio-economic situation
Step 4: Identification and quantification of benefits
Step 5: Determination of the net benefits over the years
Step 6: Expressing future costs and benefits in present values (discounting)
Step 7: Discussion of the results
Step 8: Farm level selection of SWC measure
Soil erosion mapping tool
PRA
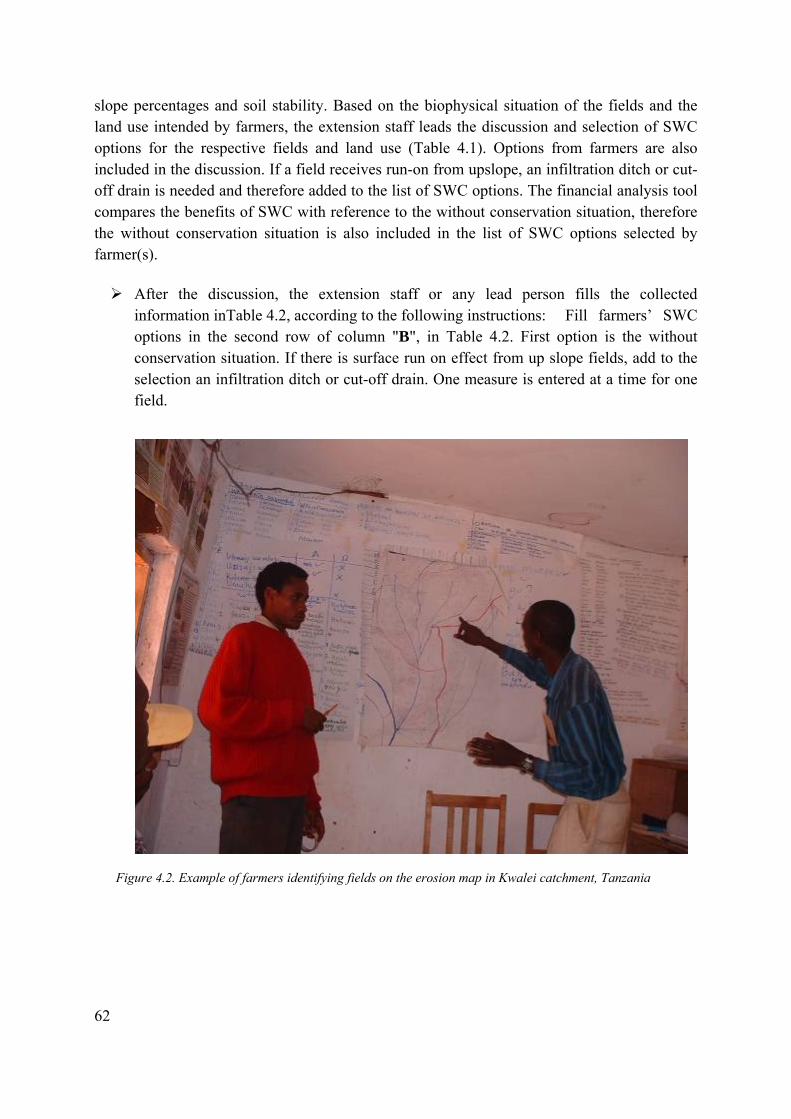
62
slope percentages and soil stability. Based on the biophysical situation of the fields and the land use intended by farmers, the extension staff leads the discussion and selection of SWC options for the respective fields and land use (Table 4.1). Options from farmers are also included in the discussion. If a field receives run-on from upslope, an infiltration ditch or cut-off drain is needed and therefore added to the list of SWC options. The financial analysis tool compares the benefits of SWC with reference to the without conservation situation, therefore the without conservation situation is also included in the list of SWC options selected by farmer(s).
After the discussion, the extension staff or any lead person fills the collected information inTable 4.2, according to the following instructions: Fill farmers’ SWC options in the second row of column "B", in Table 4.2. First option is the without conservation situation. If there is surface run on effect from up slope fields, add to the selection an infiltration ditch or cut-off drain. One measure is entered at a time for one field.
Figure 4.2. Example of farmers identifying fields on the erosion map in Kwalei catchment, Tanzania
63
%U%U
%U
%U
%U %U
%U
%U
%U
%U
%U
%U
%U
%U
%U
%U %U
%U %U
%U
%U
%U
%U
%U
%U
%U%U
%U %U
%U
%U%U
%U
%U
%U
%U%U
%U
%U
%U
%U
%U
%U
%U %U
%U
%U
%U
%U
%U
%U%U
%U
%U
%U
%U
%U
%U
%U
%U
%U
%U
%U
%U
%U
FARMERS' EROSION MAP- KWALEI
N
Erosion ClassesLowMediumHigh
%U Settlements
RoadsRoadsPaths
Rivers and StreamsRiver BagaStream
Figure 4.3. Soil erosion status map derived from farmers’ erosion indicator mapping in Kwalei catchment

64
Figure 4.4. Important SWC measures used in East African highlands Table 4.1. Guidelines for selecting SWC options based on bio-physical situation
Bio-physical condition SWC Options Requirements Slope and soils 2< % Slope <12 Mulching, vegetative strips, agroforestry,
trashlines, ridges, furrows, contour ploughing, cover crops, deep tillage
Appropriate species and spacing
12<% Slope <35 Fanya juu, terraces, agroforestry Manure application, stabilize terrace and fanya juu with vegetative strips
35<% Slope <55 Bench terrace, Fanya juu Manure application, stabilize with grass strips, cut-off drain, high value crops
% Slope > 55 Tree planting, perennial crops Cut-off drain
Very long slope Cut-off drain, Availability of water way for discharge
Shallow soils Fanya juu Clean the trench after each rainy season
Water Need protection from water outside the farm
Cut off drain Availability of water way for discharge
Need to maintain or improve soil moisture
Infiltration ditches, Bench terrace Deep soil, high value crops
No place to discharge water Retention ditch Clean the trench after each rainy season
Field on upper part of catchment
Cut-off drain, infiltration ditch, agroforestry
Check conditions under individual measure
Need to irrigate on steep slopes Bench terraces High value crops Others Need fodder for livestock Vegetative strips Appropriate species and spacing
Bench terraces Fanya juu
Grass strips Cut-off drain

65
Table 4.2. Labour inputs and costs of selected SWC measure Farmer name : ………… Location: ……………….. Field concerned : ………… SWC measure : e.g. Bench terraces Field location Upper, middle or lower Area (in ha) : e.g. 0.30 Soil type Stable or unstable Crop(s) before : e.g. Maize Slope class Gentle, mod, strong, steep, vs Crop(s) with SWC : e.g. Maize & fodder Erosion class High, moderate or low
Operation Mandays required (LD) Opportunity Labour costs (Tsh) A B costs C D
Year Without SWC Cutoff d* TSh/LD Without SWC Cutoff d*
Investment Layout 0 Construction 0 Stabilisation 0 Total labour investment
0 D1 D1 (D1)
Maintenance 1-15 D2 D2 (D2) Production Land prep. 1-15 Manure applic. 1-15 Planting 1-15 Weeding 1-15 Fertiliser appl 1-15 Spraying 1-15 Harvest 1-15 Transport 1-15 Total labour for prod. 1-15 D3 D3 (D3)
* Information on cutoff drains only to be given, when these are required
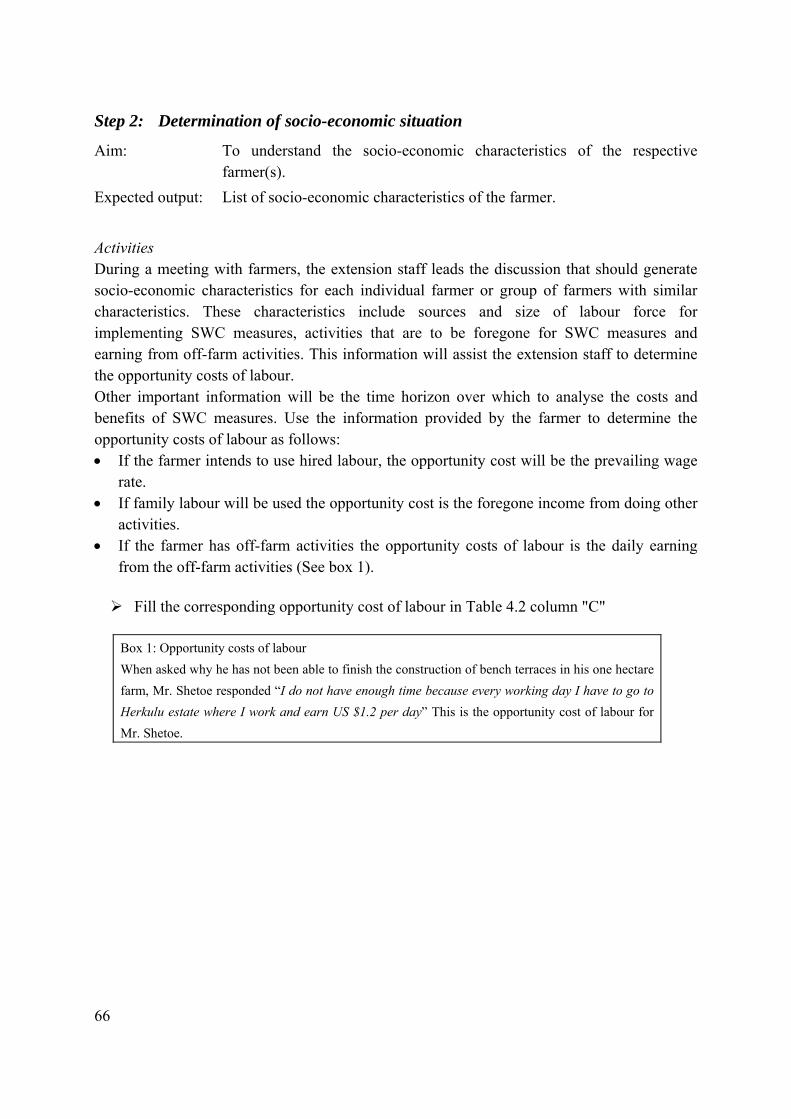
66
Step 2: Determination of socio-economic situation
Aim: To understand the socio-economic characteristics of the respective farmer(s).
Expected output: List of socio-economic characteristics of the farmer. Activities During a meeting with farmers, the extension staff leads the discussion that should generate socio-economic characteristics for each individual farmer or group of farmers with similar characteristics. These characteristics include sources and size of labour force for implementing SWC measures, activities that are to be foregone for SWC measures and earning from off-farm activities. This information will assist the extension staff to determine the opportunity costs of labour. Other important information will be the time horizon over which to analyse the costs and benefits of SWC measures. Use the information provided by the farmer to determine the opportunity costs of labour as follows: • If the farmer intends to use hired labour, the opportunity cost will be the prevailing wage
rate. • If family labour will be used the opportunity cost is the foregone income from doing other
activities. • If the farmer has off-farm activities the opportunity costs of labour is the daily earning
from the off-farm activities (See box 1).
Fill the corresponding opportunity cost of labour in Table 4.2 column "C"
Box 1: Opportunity costs of labour When asked why he has not been able to finish the construction of bench terraces in his one hectare farm, Mr. Shetoe responded “I do not have enough time because every working day I have to go to Herkulu estate where I work and earn US $1.2 per day” This is the opportunity cost of labour for Mr. Shetoe.
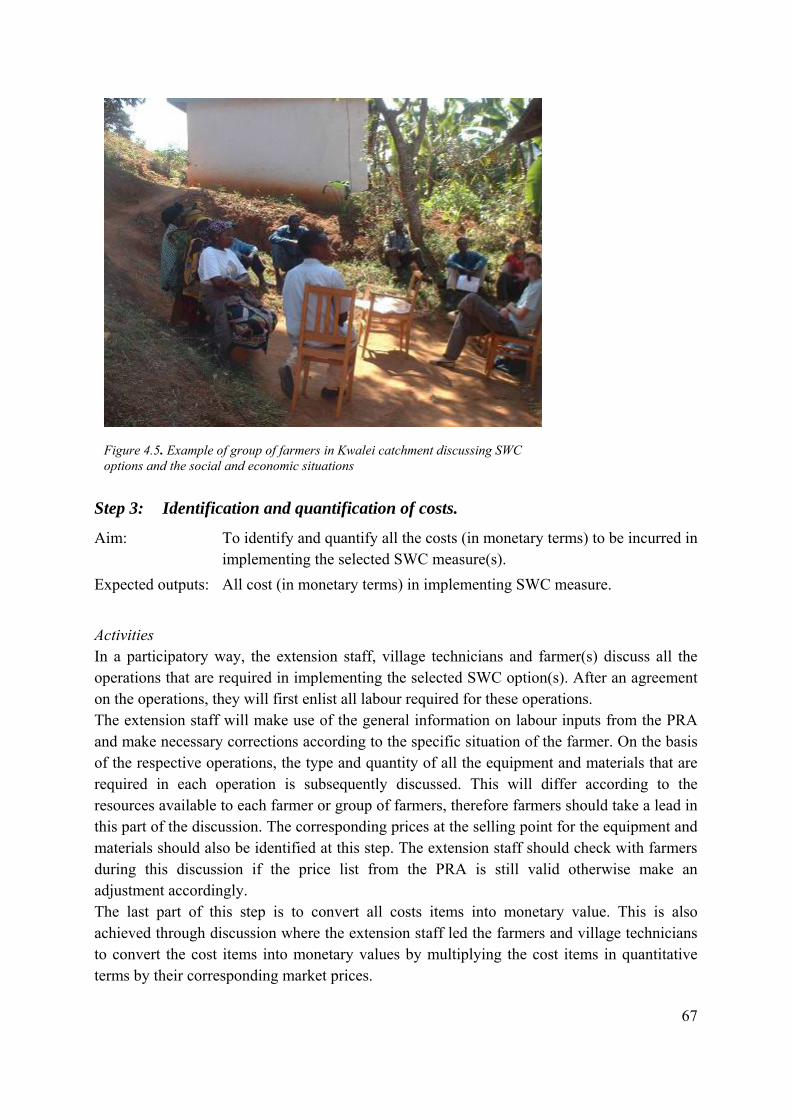
67
Step 3: Identification and quantification of costs.
Aim: To identify and quantify all the costs (in monetary terms) to be incurred in implementing the selected SWC measure(s).
Expected outputs: All cost (in monetary terms) in implementing SWC measure. Activities In a participatory way, the extension staff, village technicians and farmer(s) discuss all the operations that are required in implementing the selected SWC option(s). After an agreement on the operations, they will first enlist all labour required for these operations. The extension staff will make use of the general information on labour inputs from the PRA and make necessary corrections according to the specific situation of the farmer. On the basis of the respective operations, the type and quantity of all the equipment and materials that are required in each operation is subsequently discussed. This will differ according to the resources available to each farmer or group of farmers, therefore farmers should take a lead in this part of the discussion. The corresponding prices at the selling point for the equipment and materials should also be identified at this step. The extension staff should check with farmers during this discussion if the price list from the PRA is still valid otherwise make an adjustment accordingly. The last part of this step is to convert all costs items into monetary value. This is also achieved through discussion where the extension staff led the farmers and village technicians to convert the cost items into monetary values by multiplying the cost items in quantitative terms by their corresponding market prices.
Figure 4.5. Example of group of farmers in Kwalei catchment discussing SWC options and the social and economic situations

68
Labour costs In case of labour, labour cost is the product of the number of labour days (LD) required for particular operation and the opportunity costs of labour for the respective farmer group. One labour day refers to the total number of hours in a day a farmer can work in the farm. An opportunity cost of labour refers to the amount in monetary value a farmer would be paid by doing other activities. All costs are added to obtain total costs for investment, production and maintenance. After each discussion, the extension staff or any lead person should fill the required information in Table A.2 as follows:
List in Table 4.2 column "A", all the operations required for: (i) establishment (ii) maintenance and (iii) production of each conservation measure selected by the farmer (s). Fill in column "B", the number of labour days required for each operation under the respective SWC option. Use Figure 4.6 and Table 4.3 as guidelines, if the situation and the selected SWC measures are completely different consult the nearest extension office, research station or any knowledgeable persons with regards to the respective measure. Compute the labour cost for each operation as the product of number of labour days and the opportunity costs per labour day (LD) (See Box 2). Add the labour costs in column "D" to obtain the total labour costs. The lead person should make sure that farmers understand the results at each step.
Box 2: Calculation of labour costs (Table 4.2) Labour costs (D) = Labour days (B) x Opportunity cost per labour day (D)
Table 4.3. Example of average labour requirements for establishment and production of three SWC measures in Kwalei, West Usambara Tanzania.
Item Unit Bench terraces
Fanya juu
Grass strips
Without conservation
Layout m/LD† 100 100 100 0 Construction m/LD 8 13 100 0 Plant grasses m/LD 200 200 250 0 Land preparation LD/ha 20 20 25 30 Manuring LD/ha 15 15 15 16 Plant-maize LD/ha 15 15 16 17 Plant beans LD/ha 12 12 13 14 Weeding LD/ha 10 10 12 15 Fertilization LD/ha 12 12 13 14 Harvest-maize LD/ha 15 15 16 20 Harvest beans LD/ha 9 9 10 14 Harvest fodder LD/m 0.1 0.1 0.1 0
†LD = Labour day = 5-8 Working hours
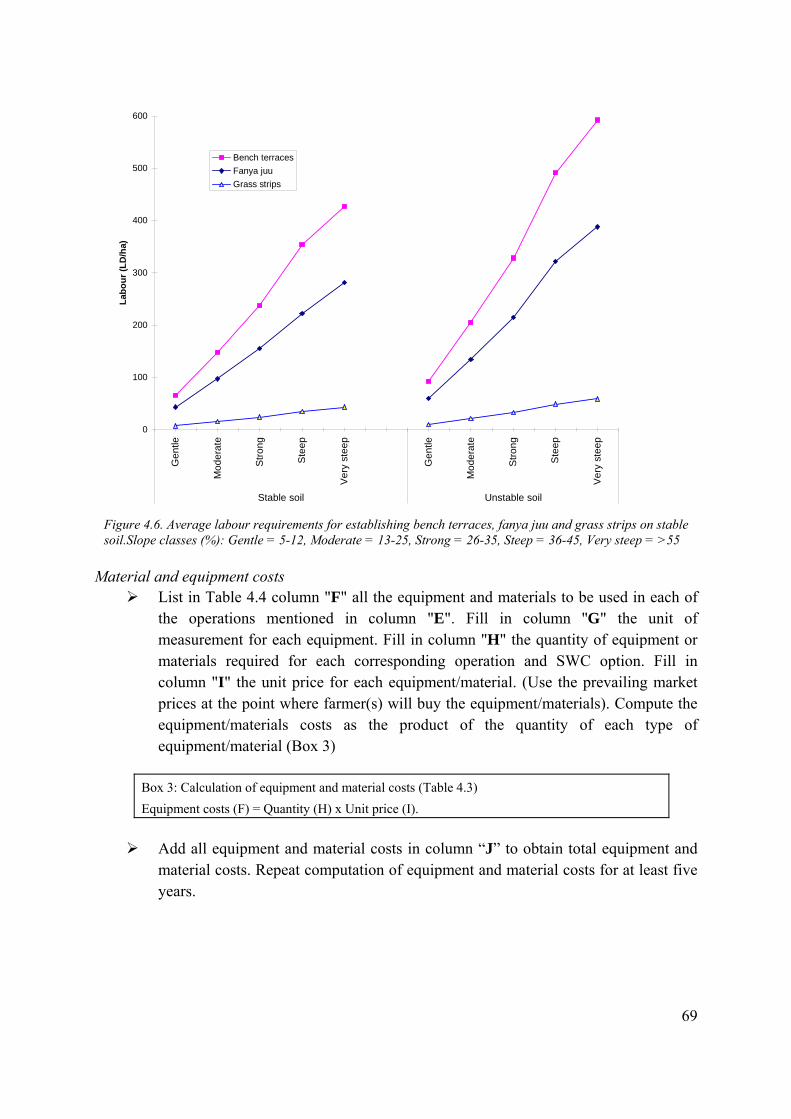
69
Material and equipment costs
List in Table 4.4 column "F" all the equipment and materials to be used in each of the operations mentioned in column "E". Fill in column ''G" the unit of measurement for each equipment. Fill in column "H" the quantity of equipment or materials required for each corresponding operation and SWC option. Fill in column "I" the unit price for each equipment/material. (Use the prevailing market prices at the point where farmer(s) will buy the equipment/materials). Compute the equipment/materials costs as the product of the quantity of each type of equipment/material (Box 3)
Box 3: Calculation of equipment and material costs (Table 4.3) Equipment costs (F) = Quantity (H) x Unit price (I).
Add all equipment and material costs in column “J” to obtain total equipment and
material costs. Repeat computation of equipment and material costs for at least five years.
0
100
200
300
400
500
600
Gen
tle
Mod
erat
e
Stro
ng
Ste
ep
Ver
y st
eep
Gen
tle
Mod
erat
e
Stro
ng
Ste
ep
Ver
y st
eep
Stable soil Unstable soil
Labo
ur (L
D/h
a)
Bench terracesFanya juuGrass strips
Figure 4.6. Average labour requirements for establishing bench terraces, fanya juu and grass strips on stable soil.Slope classes (%): Gentle = 5-12, Moderate = 13-25, Strong = 26-35, Steep = 36-45, Very steep = >55
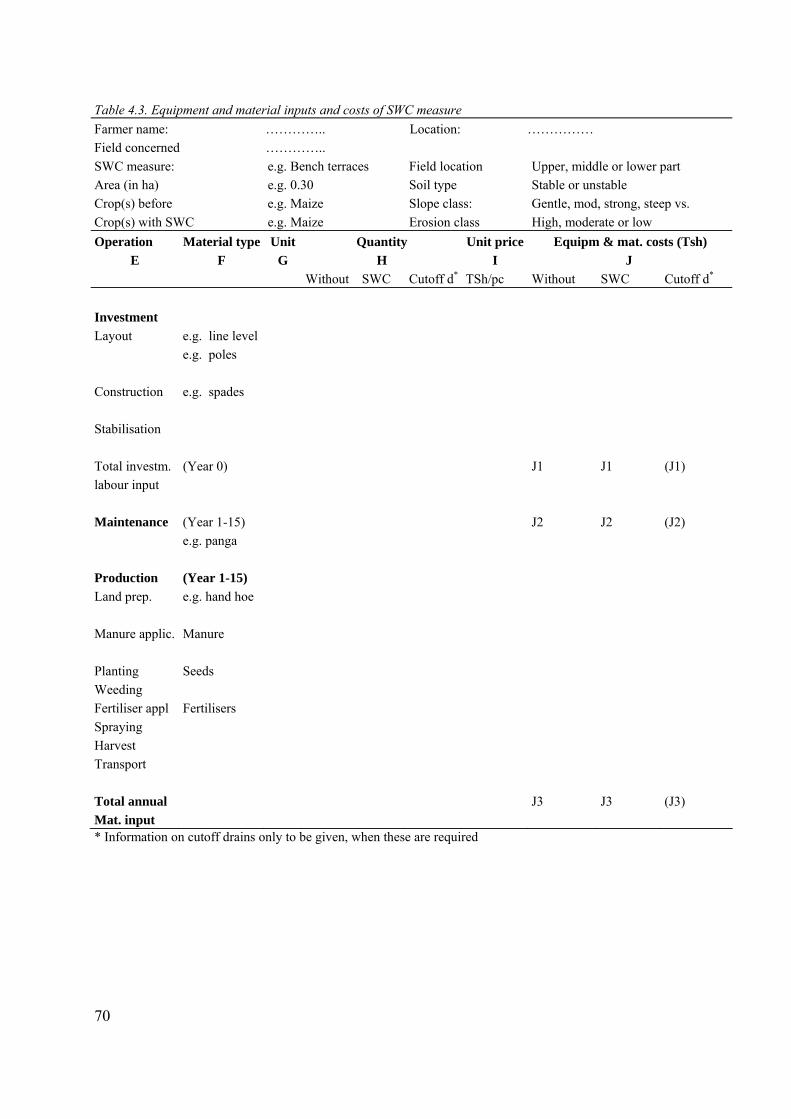
70
Table 4.3. Equipment and material inputs and costs of SWC measure Farmer name: ………….. Location: …………… Field concerned ………….. SWC measure: e.g. Bench terraces Field location Upper, middle or lower part Area (in ha) e.g. 0.30 Soil type Stable or unstable Crop(s) before e.g. Maize Slope class: Gentle, mod, strong, steep vs. Crop(s) with SWC e.g. Maize Erosion class High, moderate or low Operation Material type Unit Quantity Unit price Equipm & mat. costs (Tsh)
E F G H I J Without SWC Cutoff d* TSh/pc Without SWC Cutoff d* Investment Layout e.g. line level e.g. poles Construction e.g. spades Stabilisation Total investm. (Year 0) J1 J1 (J1) labour input Maintenance (Year 1-15) J2 J2 (J2) e.g. panga Production (Year 1-15) Land prep. e.g. hand hoe Manure applic. Manure Planting Seeds Weeding Fertiliser appl Fertilisers Spraying Harvest Transport Total annual J3 J3 (J3) Mat. input * Information on cutoff drains only to be given, when these are required
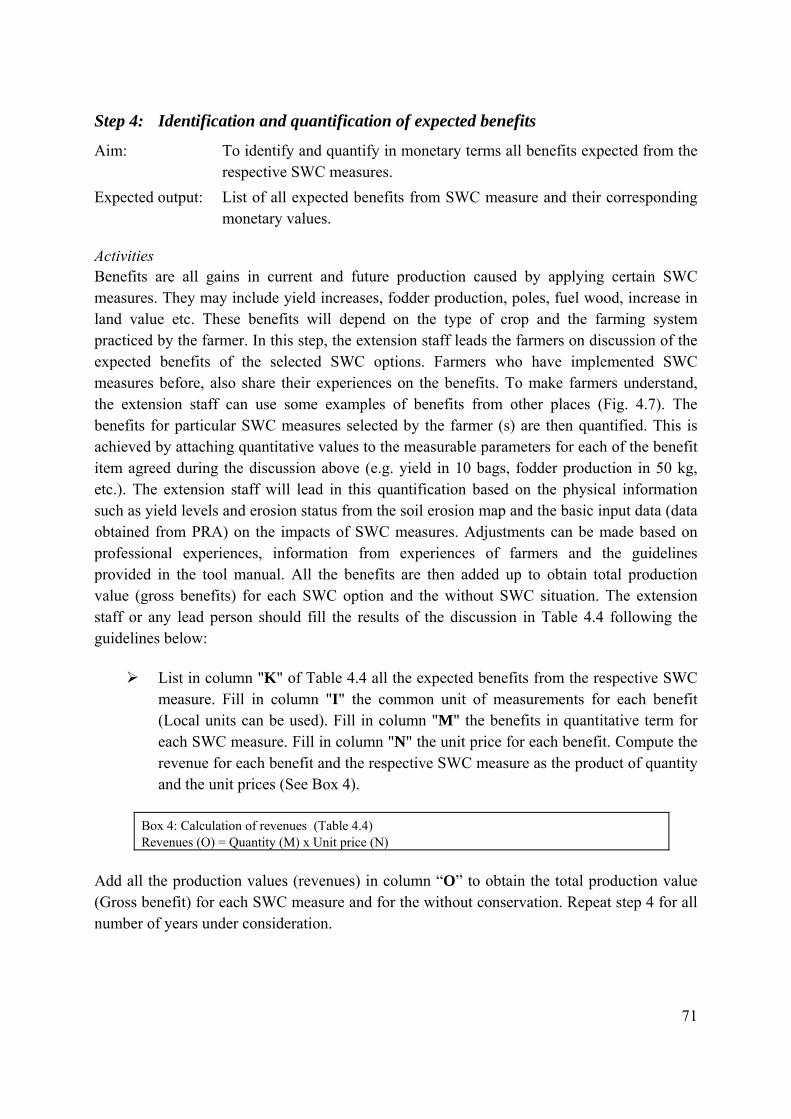
71
Step 4: Identification and quantification of expected benefits
Aim: To identify and quantify in monetary terms all benefits expected from the respective SWC measures.
Expected output: List of all expected benefits from SWC measure and their corresponding monetary values.
Activities Benefits are all gains in current and future production caused by applying certain SWC measures. They may include yield increases, fodder production, poles, fuel wood, increase in land value etc. These benefits will depend on the type of crop and the farming system practiced by the farmer. In this step, the extension staff leads the farmers on discussion of the expected benefits of the selected SWC options. Farmers who have implemented SWC measures before, also share their experiences on the benefits. To make farmers understand, the extension staff can use some examples of benefits from other places (Fig. 4.7). The benefits for particular SWC measures selected by the farmer (s) are then quantified. This is achieved by attaching quantitative values to the measurable parameters for each of the benefit item agreed during the discussion above (e.g. yield in 10 bags, fodder production in 50 kg, etc.). The extension staff will lead in this quantification based on the physical information such as yield levels and erosion status from the soil erosion map and the basic input data (data obtained from PRA) on the impacts of SWC measures. Adjustments can be made based on professional experiences, information from experiences of farmers and the guidelines provided in the tool manual. All the benefits are then added up to obtain total production value (gross benefits) for each SWC option and the without SWC situation. The extension staff or any lead person should fill the results of the discussion in Table 4.4 following the guidelines below:
List in column "K" of Table 4.4 all the expected benefits from the respective SWC measure. Fill in column "I" the common unit of measurements for each benefit (Local units can be used). Fill in column "M" the benefits in quantitative term for each SWC measure. Fill in column "N" the unit price for each benefit. Compute the revenue for each benefit and the respective SWC measure as the product of quantity and the unit prices (See Box 4).
Box 4: Calculation of revenues (Table 4.4) Revenues (O) = Quantity (M) x Unit price (N)
Add all the production values (revenues) in column “O” to obtain the total production value (Gross benefit) for each SWC measure and for the without conservation. Repeat step 4 for all number of years under consideration.

72
Table 4.4. Production and production value with/without SWC measure Farmer name: ……… Location: ……….. Field concerned ……… SWC measure: e.g. Bench terraces Field location Upper, middle or lower part Area (in ha) e.g. 0.30 Soil type Stable or unstable Crop(s) before e.g. Maize Slope class: Gentle, mod, strong, steep, vs. Crop(s) with SWC e.g. Maize, fodder Erosion class High, moderate or low Production Unit Year Quantity Unit price Production value (Tsh)
K L M N O In case Without SWC TSh/unit Without SWC No price Crop(s) Maize Bag 1 Bag 2 Bag 3-15 Beans Bag 1 Bag 2 Bag 3-15 Fodder Bundle 1 Bundle 2 Bundle 3-15 Wood Bundle 1 Bundle 2 Bundle
3-15
Other Total prod. 1 O1 O1 PM value 2 O2 O2 PM 3-15 O3 O3 PM
Error! Objects cannot be created from editing field codes. Figure 4.7. Example of benefits of soil and water conservation in terms of reduction of soil loss, retention of soil moisture and increase in maize yields. Data from Kwalei catchment, Tanzania.
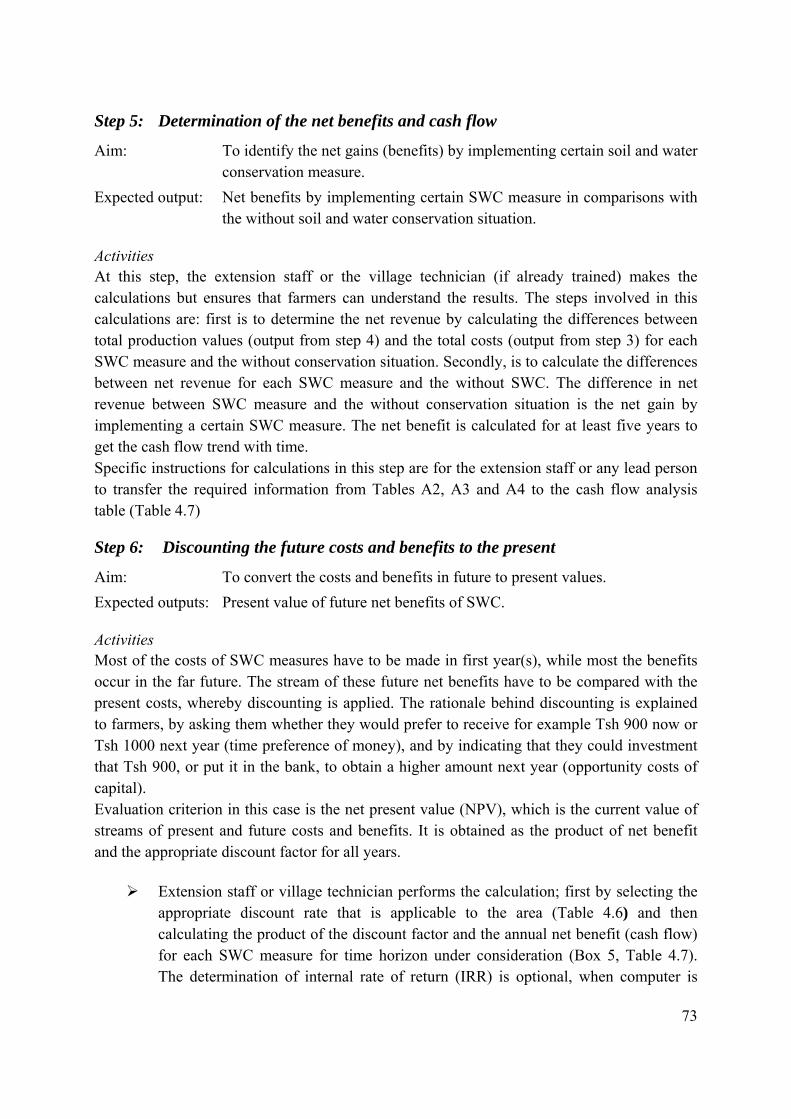
73
Step 5: Determination of the net benefits and cash flow
Aim: To identify the net gains (benefits) by implementing certain soil and water conservation measure.
Expected output: Net benefits by implementing certain SWC measure in comparisons with the without soil and water conservation situation.
Activities At this step, the extension staff or the village technician (if already trained) makes the calculations but ensures that farmers can understand the results. The steps involved in this calculations are: first is to determine the net revenue by calculating the differences between total production values (output from step 4) and the total costs (output from step 3) for each SWC measure and the without conservation situation. Secondly, is to calculate the differences between net revenue for each SWC measure and the without SWC. The difference in net revenue between SWC measure and the without conservation situation is the net gain by implementing a certain SWC measure. The net benefit is calculated for at least five years to get the cash flow trend with time. Specific instructions for calculations in this step are for the extension staff or any lead person to transfer the required information from Tables A2, A3 and A4 to the cash flow analysis table (Table 4.7)
Step 6: Discounting the future costs and benefits to the present
Aim: To convert the costs and benefits in future to present values. Expected outputs: Present value of future net benefits of SWC. Activities Most of the costs of SWC measures have to be made in first year(s), while most the benefits occur in the far future. The stream of these future net benefits have to be compared with the present costs, whereby discounting is applied. The rationale behind discounting is explained to farmers, by asking them whether they would prefer to receive for example Tsh 900 now or Tsh 1000 next year (time preference of money), and by indicating that they could investment that Tsh 900, or put it in the bank, to obtain a higher amount next year (opportunity costs of capital). Evaluation criterion in this case is the net present value (NPV), which is the current value of streams of present and future costs and benefits. It is obtained as the product of net benefit and the appropriate discount factor for all years.
Extension staff or village technician performs the calculation; first by selecting the appropriate discount rate that is applicable to the area (Table 4.6) and then calculating the product of the discount factor and the annual net benefit (cash flow) for each SWC measure for time horizon under consideration (Box 5, Table 4.7). The determination of internal rate of return (IRR) is optional, when computer is
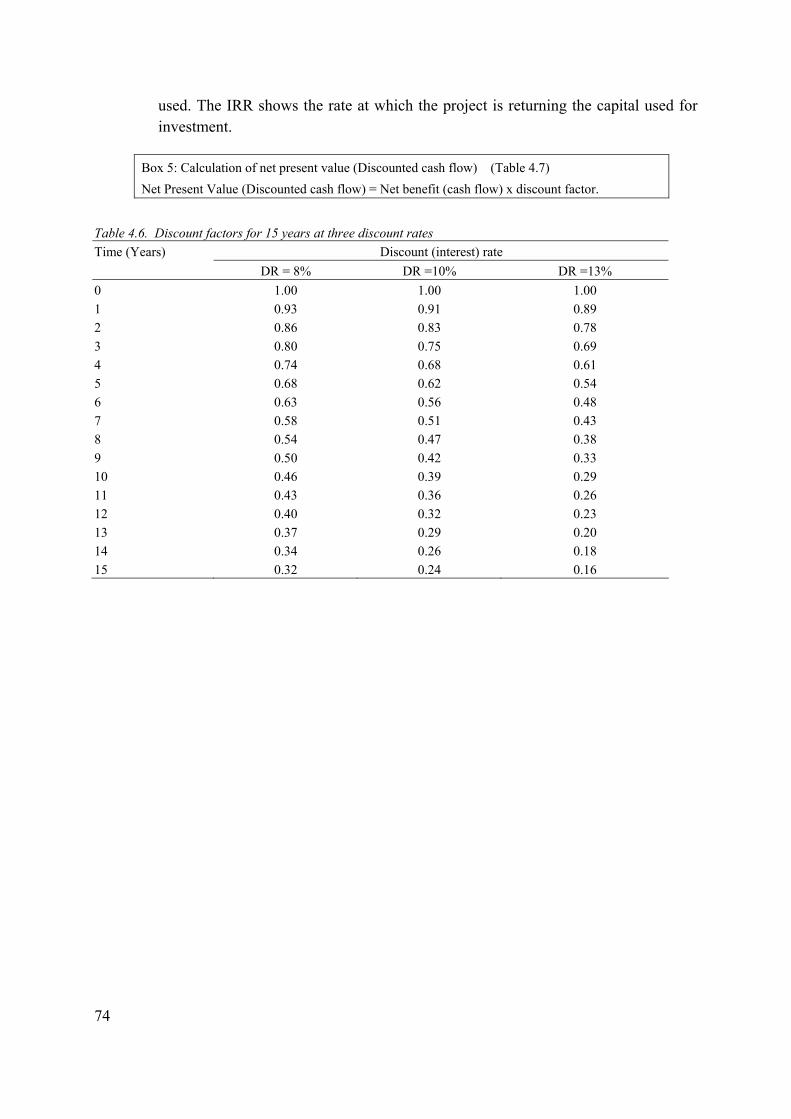
74
used. The IRR shows the rate at which the project is returning the capital used for investment.
Box 5: Calculation of net present value (Discounted cash flow) (Table 4.7) Net Present Value (Discounted cash flow) = Net benefit (cash flow) x discount factor.
Table 4.6. Discount factors for 15 years at three discount rates Time (Years) Discount (interest) rate DR = 8% DR =10% DR =13% 0 1.00 1.00 1.00 1 0.93 0.91 0.89 2 0.86 0.83 0.78 3 0.80 0.75 0.69 4 0.74 0.68 0.61 5 0.68 0.62 0.54 6 0.63 0.56 0.48 7 0.58 0.51 0.43 8 0.54 0.47 0.38 9 0.50 0.42 0.33 10 0.46 0.39 0.29 11 0.43 0.36 0.26 12 0.40 0.32 0.23 13 0.37 0.29 0.20 14 0.34 0.26 0.18 15 0.32 0.24 0.16
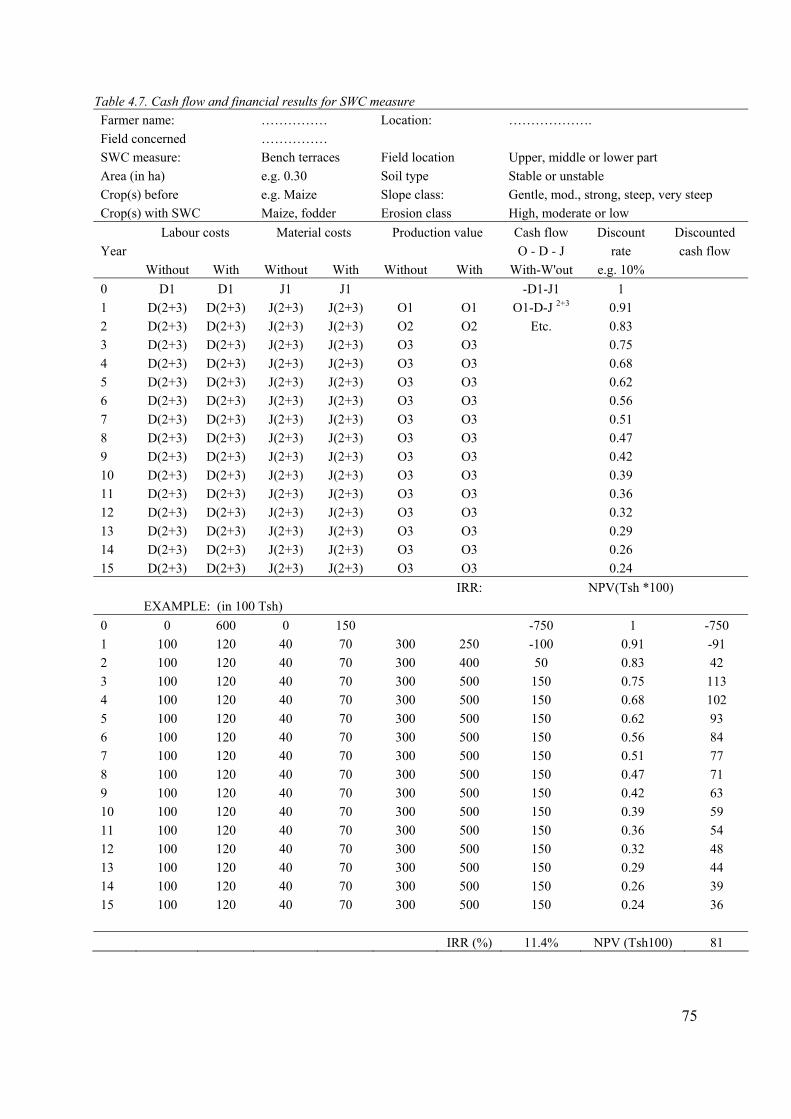
75
Table 4.7. Cash flow and financial results for SWC measure Farmer name: …………… Location: ………………. Field concerned …………… SWC measure: Bench terraces Field location Upper, middle or lower part Area (in ha) e.g. 0.30 Soil type Stable or unstable Crop(s) before e.g. Maize Slope class: Gentle, mod., strong, steep, very steep Crop(s) with SWC Maize, fodder Erosion class High, moderate or low Labour costs Material costs Production value Cash flow Discount Discounted Year O - D - J rate cash flow Without With Without With Without With With-W'out e.g. 10% 0 D1 D1 J1 J1 -D1-J1 1 1 D(2+3) D(2+3) J(2+3) J(2+3) O1 O1 O1-D-J 2+3 0.91 2 D(2+3) D(2+3) J(2+3) J(2+3) O2 O2 Etc. 0.83 3 D(2+3) D(2+3) J(2+3) J(2+3) O3 O3 0.75 4 D(2+3) D(2+3) J(2+3) J(2+3) O3 O3 0.68 5 D(2+3) D(2+3) J(2+3) J(2+3) O3 O3 0.62 6 D(2+3) D(2+3) J(2+3) J(2+3) O3 O3 0.56 7 D(2+3) D(2+3) J(2+3) J(2+3) O3 O3 0.51 8 D(2+3) D(2+3) J(2+3) J(2+3) O3 O3 0.47 9 D(2+3) D(2+3) J(2+3) J(2+3) O3 O3 0.42 10 D(2+3) D(2+3) J(2+3) J(2+3) O3 O3 0.39 11 D(2+3) D(2+3) J(2+3) J(2+3) O3 O3 0.36 12 D(2+3) D(2+3) J(2+3) J(2+3) O3 O3 0.32 13 D(2+3) D(2+3) J(2+3) J(2+3) O3 O3 0.29 14 D(2+3) D(2+3) J(2+3) J(2+3) O3 O3 0.26 15 D(2+3) D(2+3) J(2+3) J(2+3) O3 O3 0.24
IRR: NPV(Tsh *100) EXAMPLE: (in 100 Tsh) 0 0 600 0 150 -750 1 -750 1 100 120 40 70 300 250 -100 0.91 -91 2 100 120 40 70 300 400 50 0.83 42 3 100 120 40 70 300 500 150 0.75 113 4 100 120 40 70 300 500 150 0.68 102 5 100 120 40 70 300 500 150 0.62 93 6 100 120 40 70 300 500 150 0.56 84 7 100 120 40 70 300 500 150 0.51 77 8 100 120 40 70 300 500 150 0.47 71 9 100 120 40 70 300 500 150 0.42 63 10 100 120 40 70 300 500 150 0.39 59 11 100 120 40 70 300 500 150 0.36 54 12 100 120 40 70 300 500 150 0.32 48 13 100 120 40 70 300 500 150 0.29 44 14 100 120 40 70 300 500 150 0.26 39 15 100 120 40 70 300 500 150 0.24 36 IRR (%) 11.4% NPV (Tsh100) 81

76
Step 7: Feedback and discussion of the results. Aim: To discuss and make the farmer understand the meaning of cash flow and
the net present value (discounted cash flow). Expected output: Farmer understands the short and long term benefits of the respective
SWC measures. Activities The extension staff leads the discussion by explaining to the farmer (s) the meaning of cash flow and net present values (discounted cash flow). The extension staff may use pictorial presentation in the form of chart or graphs to make sure that farmers understand. Examples of these graphs are Figures 4.8 and 4.9. The cash flow figure (4.8) shows the farmer the efforts he has to make, in terms of labour and material inputs, in the early years before he can expect some steady net benefits. And the results of the net present value calculations (Fig. 4.9) shows the farmers under which conditions of soil type and slope the respective SWC measures are financially attractive. It appears among others in Figure 4.9 that the three measures are never attractive at very steep slopes, and that these are seldom attractive at higher opportunity costs of labour. If farmers are in particular interested to know what crop yield increase they should get at least with the SWC measures to make it financially viable, a breakeven analysis can also be undertaken, setting the NPV or IRR at certain values and calculating the required yield increase under the specific conditions. And a sensitivity analysis could be undertaken to see what the effects are of some changes in assumptions.
-250
-200
-150
-100
-50
0
50
100
150
0 2 4 6 8 10 12 14 16
Time (years)
Cas
h flo
w (U
S $/
ha)
Bench terracesFanya juuGrass strips
Figure 4.8. Cash flow of three SWC measures for a maize and beans farmer with opportunity costs of labour of 1US $ per labour day on moderate slope and stable soil

77
Step 8: Farmer(s) make final decision on the SWC to implement
Aim: To enable farmer understand and make an informed decision on which SWC measure to implement.
Expected output: Farmers final decision on SWC measure to implement. Activity In this step, the extension staff presents the results for each SWC measure selected by the respective farmer or group of farmers. The implications of the results are discussed until farmer(s) make an informed final decision on which SWC measure(s) to implement. After discussions with an individual farmer, the extension officer will organise a community meeting where all farmers in the catchment attend. In this community meeting, the extension officer shows the soil erosion map developed earlier using the participatory soil erosion mapping tool to remind farmers of the erosion situation in the catchment. Then the financial analysis results for individual farmer are presented pointing to the specific fields on the map. With evidences from the financial analysis, attention in this discussion should be focused to the extra costs that an individual farmer has to incur because of the run-on from the upslope field or from public areas. This is discussed until farmers reach an agreement on what actions to be taken.
0
50
100
150
200
250
300
350
400
450
500
550
600
Gen
tle
Mod
erat
e
Stro
ng
Ste
ep
Ver
y st
eep
Gen
tle
Mod
erat
e
Stro
ng
Ste
ep
Ver
y st
eep
Gen
tle
Mod
erat
e
Stro
ng
Ste
ep
Ver
y st
eep
Gen
tle
Mod
erat
e
Stro
ng
Ste
ep
Ver
y st
eep
Gen
tle
Mod
erat
e
Stro
ng
Ste
ep
Ver
y st
eep
Gen
tle
Mod
erat
e
Stro
ng
Ste
ep
Ver
y st
eep
Bench terraces Fanya juu Grass strips Bench terraces Fanya juu Grass strips
Unstable soil Stable soil
NP
V a
t 8%
(US
$/h
a) I=0.8 US$/LDII=1.0US$/LDIII=1.2 US$/LD
Figure 4.9. Example of long term (15 years) benefits (NPV at 8%) of three SWC measures on unstable and stable soils, five slope classes and farmers with three opportunity costs of labour . Data from West Usambara mountains, Tanzania

78

79
THE PROPOSED USE OF THE TOOLS ‘PARTICIPATORY SOIL EROSION MAPPING’ AND ‘FINANCIAL ANALYSIS OF SOIL AND WATER CONSERVATION MEASURES’ IN THE FOCAL AREA EXTENSION APPROACH IN KENYA (DRAFT)
Chapter 5

80

81
5. The proposed use of the tools ‘participatory soil erosion mapping’ and ‘financial analysis of soil and water conservation measures’ in the Focal Area Extension Approach in Kenya (DRAFT)
5.1 Introduction The assumption is that the tool for participatory soil erosion mapping and the tool for cost-benefit analysis of soil and water conservation measures will be useful and most effective when applied within the existing national extension programme which is in Kenya referred to as ‘the Focal Area Extension Approach’. Therefore, this chapter starts with a short description of this Focal Area Extension Approach as well as the broader programme in which it is embedded. A description on the proposed use of both tools in the Focal Area Extension Approach is provided at the end of this chapter. This chapter is mainly based on: the document ‘Focal Area Extension Planning: Field Notes (Baiya, 2000), on discussions with Kenyan key informants taken place during the field visit in March, 2004 (see annex 1).
5.2 The Focal Area Extension Approach in Kenya
5.2.1 History and dynamics in the Focal Area Extension Approach In Kenya, nowadays the main stream approach to soil and water conservation is within the Focal Area Extension Approach. Since the Soil and water Conservation Branch started coordinating soil conservation work in the Ministry of Agriculture in 1974, lots of change has taken place with different approaches being used. Various studies have been carried out leading to several recommendations that support various approaches and strategies that have been tried (ref). Between 1940s and 1962, use of force was the main strategy to achieve soil conservation efforts. This followed ten years of recession period between 1963 to 1973 when many conservation structures were destroyed. From 1974 to early 1980s farmers were persuaded to conserve their farms and in some cases, they were paid to construct cut off drain in their farms and conservation measures in public land. During this time, only 300,000 had been terraced out of over 2.7 million farms that needed conservation measures. Assuming same conservation growth rate of 300,000 farms in10 years, it would mean 90 years to cover 2.7 million farms. This challenge led to the beginning of a new strategy of Catchment Approach in 1987/88 when the Government of Kenya recognised that the only way to achieve widespread soil conservation coverage was to mobilise people to embrace soil and water conservation practices on their own terms. Initially, the Catchment Approach was a Swedish International Development Cooperation Agency (SIDA) supported initiative and run by the Soil and Water Conservation Branch, of the Ministry of Agriculture and Rural Development. Ever since the introduction of the Catchment Approach in 1988/1989, it has undergone several adjustments to respond to new challenges. At first it was seen as a way of

82
concentrating resources and efforts within a specific catchment. This was further modified to reflect proper utilisation and development, as well as protection of the natural resources, i.e., soil, water and vegetation. In 1993/1994, the Focal Area Extension Approach has undergone some major adjustments. The introduction and institutionalising of Participatory Rapid Appraisal has made soil and water conservation more apt to the farmers’ conditions, needs and priorities (Admassie, 1998). During the time the Catchment Approach was in use, soil and water conservation was used as an entry point to solving farmers’ problems. This was mainly because erosion was seen as a key problem limiting production at the farm level. However as time went, new challenges emerged which necessitated formulation of an approach in line with the government policy and at the same time a more farmer driven approach. In 2000, when the programme decided to take the whole farm in a holistic manner rather than just using soil erosion as an entry point, the Catchment Approach changed into the Focal Area Extension Approach Initially the assumption was that erosion was the main problem. Yet, one realised that farmers could be having other problems which could have reduced yield gap and therefore be used as entry point. The Focal Area Extension Approach unlike the Catchment Approach is more inclusive and it is implemented within the National Agricultural and Livestock Programme (NALEP). The year 2004 saw another change in the dynamics of the focal area extension. This time, a team of professionals drawn from the project area reviewed the whole community mobilization and participatory planning process and based on past experience and other social economic circumstances came with the new steps in practice since July last year. This time, a team of professionals drawn from the project area reviewed the whole community mobilization and participatory planning process and based on past experience and other social economic circumstances came with the new steps in practice since July 2004. The description of the Focal Area Extension Approach in 5.1.3 reflects the latest developments.
5.2.2 Institutional context of the Focal Area Extension Approach: The National Agricultural and Livestock Programme (NALEP)
Nowadays, the Focal Area Extension Approach falls under the National Agricultural and Livestock Programme (NALEP) and is officially referred to as the Focal Area Extension Approach. NALEP reflects the new Kenyan extension policy which is broader and more farmer-oriented and better equipped to meet the needs and demands of the small-scale farming population. The new extension policy is characterised by the facilitation of technology transfer and interaction among stakeholders so that all of them work in the same direction and complement each other (Baiya, 2000). Soil and water conservation, environmental protection and natural resource management are given very high priority in extension services.
83
The National Agricultural and Livestock Programme (NALEP) is supported by SIDA and has the following features, all of which have been borrowed from the experiences of the National Soil and Water Conservation programme that came to an end in June 2000 (Baiya, 2000): • concentration of efforts in an given area over a specified period; • stakeholder participation in decision making, planning, monitoring and evaluation; • bottom-up planning; • fund allocation is activity driven; • strict resource controls and audits; • structured supervision, reporting, monitoring and evaluation.
5.2.3 Steps in the Focal Area Extension Approach Since July 2004, the implementation of the Focal Area Extension Approach entails the following steps. Step 1: Identification of the focal area Eight months before the actual implementation starts, a focal area is identified and selected. The process of identification and selection goes together with the mobilization of the community. The identification and selection of the focal area is demand driven. The demands are put forwards by farmers and other stakeholders who know better their farming problems and aspirations, social interactions and cohesiveness in the focal area. The district and Provincial Subject Matter Specialist can provide guidance and advice in prioritizing the focal area. The Identification is based on consultation: with the sub-Divisional Development Committee; constituency development committees and other local agencies. Moreover, exhaustive reference to existing secondary information such as Participatory Rural Appraisals (PRA) carried out in the past, social welfare survey are to be considered. The preferences and decisions are forwarded to the Ministry of Agriculture and Rural Development via the divisional development committee or in some cases via the District Agricultural Officer. The key informants mentioned that the selection of the focal area is mainly based on physical criteria (e.g., degree of land degradation, degree of soil fertility problems, agricultural production level). However, the criteria for selection are also derived from the pro-poor focus in line with Poverty Reduction Strategy Reduction Paper (PRSP) on other policy papers. The size of the focal area is determined by the Divisional Implementation Team (DivIT) in assistance with the farmers. Before 2004, a focal area covered 300-400 farms and 200-400 ha (Baiya, 2000). However, since July 2004, the focal area corresponds with a location with 2000 farmers or even more. Another recent development is that for each step of the implementation of the Focal Area Extension, there has to be monitorable indicators and means of verification such as invitation letters to the meetings, minutes etc.
84
Step 2: Dividing the location into blocks The location is divided further into four blocks for ease of administration. The DivIT uses the existing administrative boundaries/location size/social cohesiveness and homogeneity to come up with four blocks of the focal area. The criteria for zoning are clearly documented. A locational map is drawn to capture the boundaries, the sub-location, the extension blocks, the infrastructure and rivers Step 3: Community mobilization The step ‘community mobilization’ entails a literature review from all information sources available, a field survey, problem analysis and community action plan development, a baraza at each block and the selection and training of a Focal area Development Committee.
Broad-based survey (BBS): Since July 2004, a broad-based survey replaces the previous PRA process. Before, the PRA process was used to assist the farming community to gain insights in available resources and problems as well as possible solutions. However, the rationale for using a BBS in stead of a PRA process is that there have been so many PRAs conducted in all areas and from different sources such that there is no need to do it again. Starting another time with a PRA process would just bother the farmers. Therefore what remains is analysing the available information and putting it into use. The BBS refers to a modified information gathering process that heavily builds on existing secondary data including past PRA, reconnaissance and baseline surveys, social welfare surveys and, economic surveys and views of key informant and stakeholder involvement in community development. The review and analysis of the available information is nowadays carried out by Division Implementation Team (DivIT). This team includes other stakeholders who have some interest and could be having relevant reports. Issues of resource poor and vulnerable are prominent in the review of the information because implementation may be affected by the HIV situation in the focal area. In case the review and analysis indicate some information gaps, a field survey will be carried out to fill these gaps. Field survey: A checklist showing the gaps of missing information in each block is used as a guide for information filling by carrying out a field survey is. This field survey is also guided by a secondary information review report (SIRR) which is produced after the thorough literature review before. Issues related to soil conservation are tackled in this activity. Problem analysis and Community Action Plan development is done at locational level by the 16 opinion leaders, 4 from each block, DivIT and other stakeholders. The Community Action Plan reflects what the community is intending to do. It includes: 1) an implementation plan showing the communal activities demanded, the objectives, the inputs required, an implementation schedule; and, 2) a participatory monitoring and evaluation strategy. Community Action Plan Baraza: The Community Action Plan is presented to the farmers at block level during a Community Action Plan baraza. At the same time, the baraza is used to
85
inform the community about the intended purpose of the Focal Area Extension Approach. Moreover, during the baraza, expectations are made explicit and shared. Usually, 50-60% of the community participates in the barazas. The past has shown that most of the participants in the barazas appear to be men. To announce the baraza, newsletters, letters to local leaders and posters are used. Election and training of a Focal Area Development Committee: During the community mobilisation stage, a focal area development committee is selected based on criteria such as full time farmer, education, age and gender. The Focal Area Development Committee composes of 50% men and 50% women. The committee members receive training in leadership, marketing, roles, economics and SWC measures. Common Interest Groups: During the previous PRA processes Common Interest Groups have already emerged. Common Interest Groups on SWC are hardly formed. Most of the Common Interest Groups are commodity based and soil conservation officer are expected to work with extension groups. They are expected to flag an opportunity entitled “soil and water conservation for sustainable farm production” with the hope that farmers will come up to demand soil and water conservation packages just like other opportunities. Step 4: Focal area scheme planning The DivIT defines the focal area boundaries for which it uses physical and infrastructural features. This team, with the assistance of the Focal Area Development Committee, is also to produce a Focal Area Map at a scale of 1:5000 which is developed in the following way: 1. A general map of the focal area is drawn showing infrastructure, markets, roads, rivers
etc.; 2. The general map is then divided in smaller blocks following infrastructural features; 3. For the smaller blocks, detailed maps is developed showing the farms, farm size and the
owners. All farms are given a reference number; 4. The maps of the smaller blocks are combined into one Focal Area Map which will also
serve as a monitoring and evaluation tool. Step 5: Farm Planning The farm planning follows the nurse-doctor model, in which the ‘nurse’ is the Frontline Extension Officer who makes a general inventory of problems and challenges, and the doctor the specialist for a specific topic. The Frontline Extension Worker goes into a family holding and develops a farm sketch together with the farmer(s). This farm sketch is still a draft sketch. A final sketch indicating both the existing and agreed land use changes will be drawn later at the Divisional Extension Coordinator’s office. Moreover, during the farm visit the Frontline Extension Worker collects general information about the farm such as farm background data, existing farm enterprises, production problems and opportunities to increase production. It can also include information on the type(s) of soil,

86
slopes, length of cut off drains and cropping patterns. Based on the collected information and discussion with the farmer(s), a draft Farm Specific Action Plan is developed. For specific planning issues which a Frontline Extension Worker cannot handle, a ‘doctor’ i.e., a Divisional Subject Matter Specialist comes in. S/he assists the farmer in exploring specific opportunities in terms of requirements and inputs, farmer commitment, implementation schedule and expected costs and benefits. Divisional Subject Matter Specialist puts the farmer in a situation where s/he can analyze the financial impacts of a particular enterprise using simple gross margin analyses and the opportunity costs of production resources (i.e., land, labor, capital) by calculating the returns to these resources. Up till July, 2004, the farm planning has been mainly carried out at the individual farm level, and this will continue in the future however only in case farmers demand for it. Nowadays, farm planning takes place within the Common Interest Groups. Farmers’ opportunities will be explored at individual farm as well as at Common Interest Group level. Step 6: Baraza The DivIT calls a meeting in which it hands over the responsibilities described in the Community Action Plan, the Farm Specific Action Plans and the Common Interest Group Specific Action Plan to the Focal Area Development Committee. The committee will be assisted in its work by the Frontline Extension Worker.
Step 7: Implementation The Farm Specific Action Plans, Interest Group Specific Action Plans and the Community Action Plan form the basis for the implementation of (amongst others) soil and water conservation measures. The implementation of these plans will be coordinated and monitored by the Focal Area Development Committee. The Frontline Extension Worker officer also monitors the progress made.
5.3 The recommended use of the tools ‘participatory soil erosion mapping’ and ‘financial analysis of SWC measures’ within the Focal Area Extension Approach
Looking at the way the tools ‘participatory soil erosion mapping’ and ‘financial analysis of SWC measures’ put farmers’ knowledge and priorities in the centre of farmer decision making on SWC issues, one could say that in principle these tools are consistent with NALEP and could enrich the Focal Area Extension Approach. This paragraph describes the proposed combined use of the tools within the current Focal Area Extension Approach in areas where soil erosion is perceived as one of the major problems. Both tools could be used separately as well. However a more effective and efficient use can be expected when they are applied together. When relevant, reference is made to the expected future of Focal Area Extension Approach.
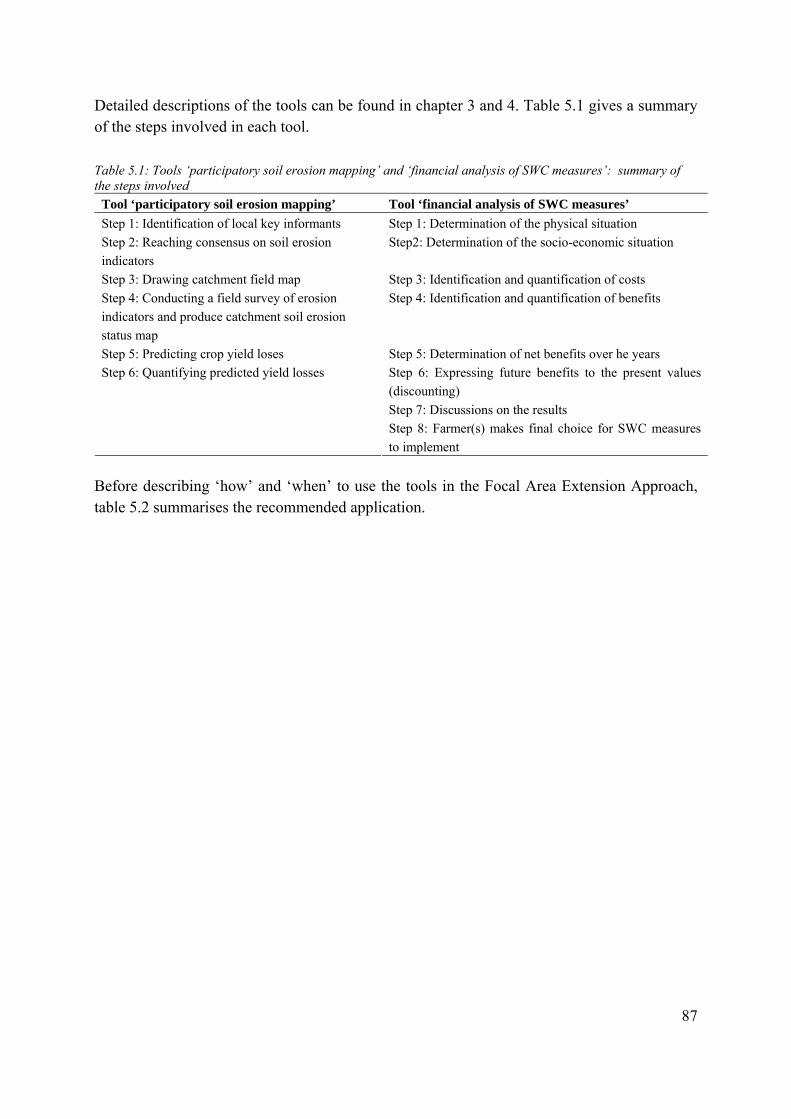
87
Detailed descriptions of the tools can be found in chapter 3 and 4. Table 5.1 gives a summary of the steps involved in each tool. Table 5.1: Tools ‘participatory soil erosion mapping’ and ‘financial analysis of SWC measures’: summary of the steps involved
Tool ‘participatory soil erosion mapping’ Tool ‘financial analysis of SWC measures’ Step 1: Identification of local key informants Step 1: Determination of the physical situation Step 2: Reaching consensus on soil erosion indicators
Step2: Determination of the socio-economic situation
Step 3: Drawing catchment field map Step 3: Identification and quantification of costs Step 4: Conducting a field survey of erosion indicators and produce catchment soil erosion status map
Step 4: Identification and quantification of benefits
Step 5: Predicting crop yield loses Step 5: Determination of net benefits over he years Step 6: Quantifying predicted yield losses Step 6: Expressing future benefits to the present values
(discounting) Step 7: Discussions on the results Step 8: Farmer(s) makes final choice for SWC measures to implement
Before describing ‘how’ and ‘when’ to use the tools in the Focal Area Extension Approach, table 5.2 summarises the recommended application.
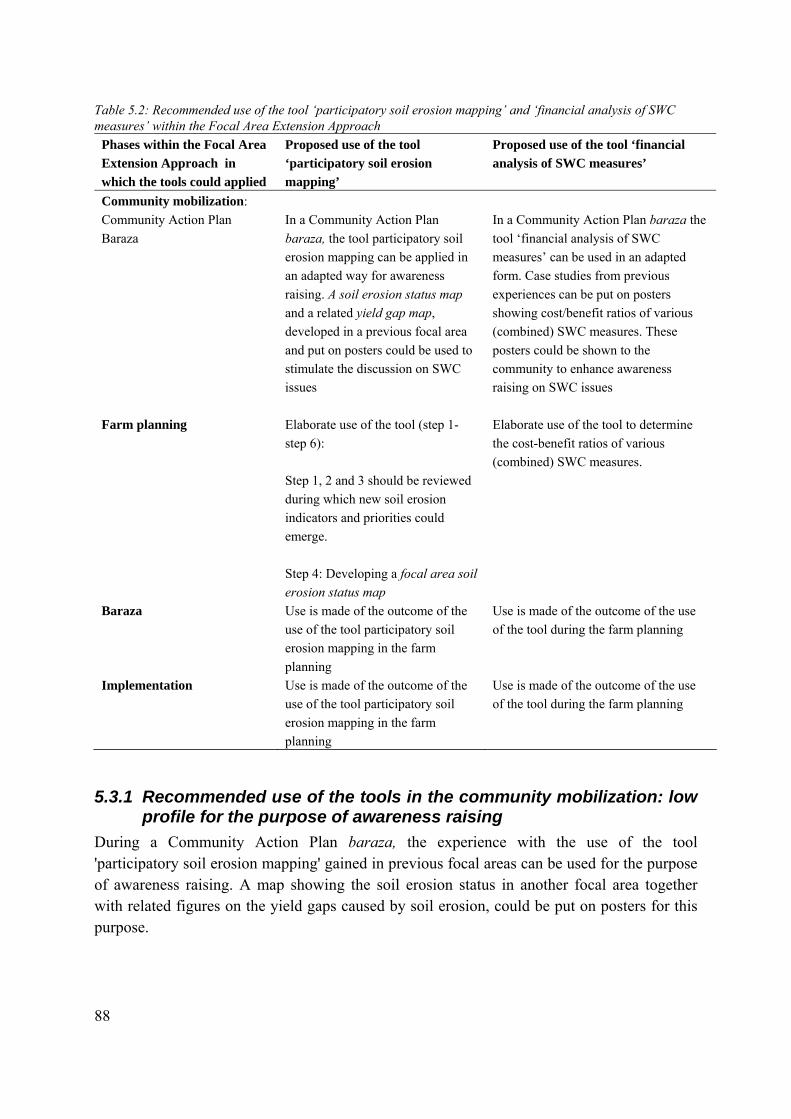
88
Table 5.2: Recommended use of the tool ‘participatory soil erosion mapping’ and ‘financial analysis of SWC measures’ within the Focal Area Extension Approach
Phases within the Focal Area Extension Approach in which the tools could applied
Proposed use of the tool ‘participatory soil erosion mapping’
Proposed use of the tool ‘financial analysis of SWC measures’
Community mobilization: Community Action Plan Baraza
In a Community Action Plan baraza, the tool participatory soil erosion mapping can be applied in an adapted way for awareness raising. A soil erosion status map and a related yield gap map, developed in a previous focal area and put on posters could be used to stimulate the discussion on SWC issues
In a Community Action Plan baraza the tool ‘financial analysis of SWC measures’ can be used in an adapted form. Case studies from previous experiences can be put on posters showing cost/benefit ratios of various (combined) SWC measures. These posters could be shown to the community to enhance awareness raising on SWC issues
Farm planning
Elaborate use of the tool (step 1- step 6): Step 1, 2 and 3 should be reviewed during which new soil erosion indicators and priorities could emerge. Step 4: Developing a focal area soil erosion status map
Elaborate use of the tool to determine the cost-benefit ratios of various (combined) SWC measures.
Baraza
Use is made of the outcome of the use of the tool participatory soil erosion mapping in the farm planning
Use is made of the outcome of the use of the tool during the farm planning
Implementation Use is made of the outcome of the use of the tool participatory soil erosion mapping in the farm planning
Use is made of the outcome of the use of the tool during the farm planning
5.3.1 Recommended use of the tools in the community mobilization: low profile for the purpose of awareness raising
During a Community Action Plan baraza, the experience with the use of the tool 'participatory soil erosion mapping' gained in previous focal areas can be used for the purpose of awareness raising. A map showing the soil erosion status in another focal area together with related figures on the yield gaps caused by soil erosion, could be put on posters for this purpose.

89
In this stage, the tool ‘financial analysis of SWC measures’ could be used in a similar way. Experience previously gained in another focal area could be the basis for posters showing the results of cost-benefit analysis of various soil and water conservation measures over a period of five years. The use of the posters during the Community Action Plan baraza can help the extension staff to deepen the knowledge on soil and water conservation as one of the issues addressed in the Community Action Plan.
5.3.2 Proposed use of the tools during the farm planning: application from A to Z
In the farm planning both tools could be applied from A to Z in the way the have been developed. The tools can be used at individual farm level in case of an individual demand. However some of the steps such as the development of an erosion indicators list and a Focal Area Map need to involve multiple farmers. Preferably both tools are to be applied at the level of a Common Interest Group. Hereafter, firstly for both tools the recommended use at individual farmer level is presented. Secondly, the way both tools could be applied within Common Interest Group is dealt with.
5.3.3 Recommended use of the tools at individual farmer level Tool ‘participatory soil erosion mapping’: At farm level, the tool ‘participatory soil erosion mapping’ could be used to incorporate SWC planning in the farm planning. After the ‘nurse’ has discussed the farmers’ problems and opportunities in a more general way, the Divisional Subject Matter Specialists in SWC is called for in case SWC problems are perceived as major constraints for agricultural production. Following the procedures of the tool, the Divisional Subject Matter Specialist and the farmer start visiting the farmer’s field to check whether erosion is occurring and in what degree. In discussion in which other key informants are involved, a soil erosion indicator list is developed (step 2 of the tool). Next, based on (parts of) the vocational map, a Focal Area Map is developed showing the farms (and focal area) boundaries (step 3 of the tool). In step 4 and 5 of the tool, the degree of erosion of the farmer’s field is determined in combination with a qualitative discussion on crop yield reduction. Based on the estimated damage, the soil erosion status can be determined which will be categorized in terms of highly, moderately or lowly eroded. The status is shown on the Focal Area Map. Back to the office, the Divisional Subject Matter Specialist on SWC aggregates all gathered soil erosion status patterns into a focal area soil erosion status map (step 4 of the tool). With the use of the focal area soil erosion status map, the Divisional Subject Matter Specialists can start the discussion with the farmer on how his/her (SWC) practices positively or negatively influence other farmers’ fields. Arrows can be added on the focal area soil erosion status map showing how neighboring farmers and farms affect each other. The determination of the degree of soil erosion can be combined with an estimation of crop yield

90
losses. Based on the identified soil erosion status, the farmer and Divisional Subject Matter Specialists together predict qualitatively the expected crop yield losses for the current season (step 5 of the tool). In step 6, experts such as Divisional Subject Matter specialist in SWC, quantify the predicted yield losses experimentally for which they use again the focal area soil erosion status map. They sample a number of fields within areas classified as having high, moderate and low erosion status. Also samples of a field that serve as reference or control field are taken (see chapter 3, step 6). After all, it can be expected that the farmer’s knowledge on the degree of erosion and its relation to crop yield losses will form an effective basis for the planning of SWC measures as part of the Farm Specific Action Plan. Tool ‘financial analysis of SWC measures’: At this stage, the farmer’s decision making process could be even more improved when s/he is assisted in carrying out a cost-benefit analysis of relevant SWC options applying the tool financial analysis of SWC measure. This could be done in the following way. First, information on the biophysical situation should be gathered. Often this will be a matter of checking what is already available, as most of the data has been already gathered in the BBS and during the use of the tool ‘participatory soil erosion mapping’. Relevant SWC options are also to be identified. The socio-economical situation is determined by discussing with the farmer the sources of labour for construction of the selected SWC options and what activities have to be forgone for SWC measures (step 2). Then the opportunity cost of labour is determined. In step 3 and 4, all (labour and material) costs and benefits are identified and quantified. Followed by a calculation of the net benefits for the number of years under consideration (for example 5 years). Next, the future benefits are expressed to the present situation (step 6), the various scenarios will be discussed (step 7) and the farmer makes a decision for the best SWC option(s) which form part of the Farm Specific Action Plan.
5.3.4 Tools applied at Common Interest Group level Regarding the developments in the Focal Area Extension Approach since July, 2004 the tools for SWC planning will be mainly used within Common Interest Group. The use of both tools is very similar to the use at individual farm level. However, from a water conservation perspective, when the discussion on erosion indicators, degree of erosion, Focal Area Map, yield losses due to erosion and costs and benefits of SWC measures takes within a Common Interest Group, the SWC measures are likely to have a more positive impact. For example, the focal area soil erosion status map and related crop yield losses for individual farmers can form the basis for a negotiation and learning process among the group members on how farmers’ (SWC) practices positively or negatively influence other farmers’ field. Arrows can be added on the focal area soil erosion status map to show how neighboring farmers and farms affect each other.
91
Likewise the use of the tool ‘financial analysis’ at Common Interest Group level group, although the costs and benefits of relevant SWC options are identified and quantified at individual farm level, when the cost-benefit ratios of SWC measures are marked on the highly eroded fields on the focal area soil erosion status map, in combination with the arrows showing how one field is affecting another field, the tool could also support the planning process at a collective level. As the costs for a farmer who wants to overcome the affect of a neighbouring farm, on which for example no SWC measurements are applied, are made visible with the use of the two tools, a negotiation among the farmers becomes is likely to start. The dynamics taking place in the relatively small Common Interest Groups such as mutual understanding, social learning and group pressure could strengthen the feeling of interdependency and consequently could persuade some farmers to take action and as such favor joint SWC planning and implementation. Finally, it is up to the Subject Matter Specialist to estimate whether the use of arrows will positively influence the collective planning process or not.
5.3.5 Proposed use of the tools in the Baraza and the implementation The planned SWC measures form part of the Farm Specific Action Plans and/or Common Interest Group Specific Plans which are presented and discussed with the Focal Area Development Committee. These plans will also form the basis for the monitoring and evaluation of the Focal Area Extension Approach
5.4 Training Preferably, the tools 'participatory soil erosion mapping' 'and ‘financial analysis of soil and water conservation measures’ should be incorporated in the current training on Focal Area Extension Planning and should form part of the field Guide Notes 'Focal Area Extension Planning'. This extension guide acts as field guide notes to DivIT in the Focal Area. It also serves as a training guide on the operational procedures. It details the entire planning process while explaining the roles of the key technical payers: i.e., Front Line Extension Worker, Divisional Subject Matter Specialists on SWC and the Focal Area Development Committee. Key informants during our visit in Kenya mentioned that preferably the Divisional Subject Matter Specialist on SWC, The Frontline Extension Worker and some members of the Focal Area Development Committee should be trained in the both tools.

92
93
THE RECOMMENDED USE OF THE TOOL ‘PARTICIPATORY SOIL EROSION MAPPING’ AND THE
TOOL ‘FINANCIAL ANALYSIS OF SOIL AND WATER CONSERVATION MEASURES’ IN THE CATCHMENT
APPROACH IN TANZANIA, LUSHOTO DISTRICT
Chapter 6

94
95
6. The recommended use of the tool ‘participatory soil erosion mapping’ and the tool ‘financial analysis of soil and water conservation measures’ in the Catchment Approach in Tanzania, Lushoto District
6.1 Introduction The tool for participatory soil erosion mapping and the tool for financial analysis of soil and water conservation measures are likely to be useful if they are applied and incorporated within the existing (extension) approach to rural development. In Tanzania, currently many rural development issues, including SWC, take place under the umbrella of the Catchment Approach. Firstly, this chapter provides a description on the Catchment Approach itself and especially on the Catchment Approach in Lushoto District. Secondly, a proposition on the use of both tools within the Catchment Approach is given. This chapter is mainly based on Kizuguto and Shelukindo (2002) and Kizuguto and Shelukindo (2003) and on discussions with key informants during a field visit, 14-18 March, 2004 (see annex 1).
6.2 Introduction to the Catchment Approach (Lushoto District)
6.2.1 History In Tanzania, a catchment is a hydrological catchment and is defined as an area with streams that drain water into a common drainage. It includes hilltops, slopes, valley bottoms and natural drainage (Kizuguto and Shelukindo, 2002). A catchment covers approximately an area of 100 ha. Following the experiences through the 1970’s and 1980’s of top down approaches to soil and water conservation, a Catchment Approach was adopted 1980. From 1990 till 2002, the Catchment Approach has been shaped and implemented by the Soil and Water Conservation Project (SECAP) funded by the German development organisation GTZ. Since 1990, the Catchment Approach is seen as an extension strategy carried out under the responsibility of the District Agricultural Officer. Likewise in Kenya, during the last decades the Catchment Approach has undergone various adaptations to respond the new challenges. For instance, in the beginning of the 1990s, SECAP started with grass bands as SWC measures. Only later on, SWC measures such as terraces became part of the extension packet. In the beginning of the 1990s, SCW was stimulated through the provision of incentives to the community. Since 1999, the Catchment Approach more participatory and is sometimes referred to as the ‘[Community-Based Catchment Approach’. Since 1999, the policy is that the entire community in a catchment is mobilized to become actively involved in the decision making on SWC issues. Incentives for SWC are no longer provided.

96
In contrast with the Focal Area Extension Approach in Kenya, in Tanzania the Catchment Approach is not institutionalised at national level, but organised and funded at district level. The districts fall under the responsibility of the ‘Ministry of Local Government’. The Catchment Approach is financed by the district through a district fund derived from tax and other (donor) contributions. For the district, nowadays the Catchment Approach is part of the Natural Resource Management programme. In Lushoto District, the Catchment Approach has the following characteristics: • it covers a area where a community is willing to work towards the conservation of their
environment; • it can be seen as an extension strategy to promote SWC measures as part of a basket of
development options relevant for a specific area of 100 ha; • it is seen and organised as a participatory process, involving key stakeholders who are
decision makers and who take part in the implementation of the SWC measures. • it involves a multi-disciplinary approach (agriculture, forestry, livestock, water, health
etc.) for sustainable management of natural resources. As such the Catchment Approach considers the whole farming system, SWC is just an element of it;
• it will increasingly focus on groups rather than on individual farmers.
6.2.2 Steps in the Catchment Approach (Lushoto District) The Catchment Approach in Lushoto District can be seen as process encompassing three phases: 1) getting it going; 2) implementation of (SWC) measures and 3) moving forward. The tool ‘participatory soil erosion mapping’ and the tool ‘financial analysis of soil and water conservation measures’ are likely to be more useful in the first planning part than in the other two phases. Therefore, the ‘getting it going’ part will be described more elaborately than the other two phases. Part 1 of the Catchment Approach: Getting it going Step 1: The selection process of a priority village A community at ward level sends a request for a priority village to the District Executive Director. Such a priority village can have more than one catchment. The identification of these catchment take place in step 2 (see below). Depending on the budget available and the extent to which the village meets the criteria, the proposed village will be selected or not. The selection of a priority village is based on a combination of technical and social criteria including: ‘willingness of the community to participate in the conservation process’, ‘degree of erosion’, ‘availability of a competent extension officer’, ‘leadership quality within the village’, ‘accessibility’, ‘number of the households that are still involved in farming’ and ‘priority of the district’. Noteworthy is that at ward level, the government is thinking about the development of an act implying that farmers can only receive assistance in the form of public projects after they have already implemented some SWC measures.

97
The experience has shown that the Catchment Approach has the most significant impact in case three catchment areas are located closely together within one village (Kizuguto and Shelukindo, 2003). In those cases where the catchments are located within the boundaries of two villages, the success of the Catchment Approach depends on the willingness of the village leaders to co-operate with each other. After a joint agreement on possible intervention areas, the District Executive Director appoints respective officers from various governmental departments to become involved in the selection process. An appointed catchment co-ordinator follows the conservation process in three neighbouring catchments. S/he is supported by a Village Extension Officer. The current Catchment Approach supports a community with conservation activities over a period of 18 months. After 18 months, the catchment co-ordinator leaves the area, but the Village Extension Officer usually stays. In an awareness raising meeting at division and ward level with the official local leaders exchange expectations, agree on priority areas and ensure their commitment in future activities related to the Catchment Approach. Step 2: Catchment identification Before the identification of the catchments within a priority village, a village leader meeting is organised to: a) identify priorities of the future conservation process; b) to agree on areas of intervention; and, c) to clarify the roles of the leaders in relation to SWC. After the village leader meeting, the technical staff, the village leaders and farmers carry out together a reconnaissance survey at hamlet level in a specific catchment. This survey aims to obtain a general overview of the area’s physical environment and land use patterns in order to identify the catchment(s) boundaries and their size. The survey also provides insight on the population density and assesses leadership at hamlet level. The catchment identification, including the reconnaissance survey(s) takes two weeks. Step 3: Situation analysis The catchment identification is followed by a situation analysis at catchment or hamlet level. The situation analysis has a participatory character through the use of methodologies such as Participatory Rural Appraisal (PRA), Participatory Learning and Action and Linked Local Learning. For 3-5 days, a multi disciplinary team assists the community in learning and exploring their current and desired future situation. The farmers learn about their available resources and their problems which from the basis for identifying and prioritising opportunities for improvement. The situation analysis has a broad focus and SWC issues forms only a part of it. After the situation analysis, a baraza at hamlet level is organised to receive feed back on and discuss the PRA outcomes. Step 4: Planning of the conservation measures (at catchment or hamlet level) The community continues the participatory conservation planning process together with the catchment co-ordinator. In principle, all farmers participate in the conservation planning

98
process, also those who do not experience particular SWC problems. As part of the planning process, the farmers develop together a catchment activity plan. Such a catchment plan shows the activities to be carried out; the responsibilities agreed on, the material they need to carry out the activities and a time frame. In this planning stage, working groups are formed as well. Farmers either join as family member, as friends or as neighbours for the purpose of lightening each others workload. In some catchments women want to form their own working groups whereas in others women and men join together the same working group. The issue of a Catchment Conservation Committee is also addressed, including a discussion on its roles. The election of the committee usually follows later on As part of the planning process, a land management plan is developed at hamlet or catchment level based on the physical map developed during the situation analysis. Farmers, sometimes males and females separately, jointly draw two physical maps of the catchment. One map representing its current state showing the soil types, slopes, gullies, crops and land use, and another map representing the preferred future situation, indicating the hot spots, size of the proposed area for SWC measures and recommendations for defined areas regarding e.g., agro-forestry, agriculture, settlement and infrastructure. SWC planning at individual farm level takes place during phase 2 ‘implementation of Soil and Water Conservation measures’ Step 5: Awareness raising and animation Awareness raising and animation regarding issues such as SWC involves farmer excursions, the use of audio-visual material and primary school support. Step 6: Training and capacity building Usually each working group which interested in SWC issues identifies two persons for a training on SWC measures. Especially those people (men or women) will be selected who will stay in the village to assist other farmers with the design and implementation of SWC measures. As part of capacity building, in this stage, the Catchment Conservation Committee is established. The role of the Catchment Conservation Committee is to motivate and organise farmers in the initiation of SWC initiatives and to monitor the activities during the conservation process. Hamlet leaders are members of the Catchment Conservation Committee to facilitate law enforcement. The catchment co-ordinator can provide the Catchment Conservation Committee members with training on SWC issues.
99
Part 2 of the Catchment Approach: Implementation of Soil and Water Conservation measures The implementation part of the Catchment Approach starts after the members of the working groups have been trained. Usually, it starts in the fourth month and involves SWC planning at individual farm level. Together with the farmers who received SWC training, the catchment team carries out a detailed field assessment and determines e.g., the slope percentage of the field, the contour lines, and the types of measures to be implemented. Next, the appropriate SWC measures are laid out in the field and the excavation can start. After excavation, farmers’awareness is raised on stabilisation and maintenance of SWC measures through grass bands. Major cut off drains are seen as a community issue. All farmers having their fields on the relevant slope have to agree on the implementation of it. A land use planner supports the catchment team and the farmers in the lay out and design of a cut-off drain. During implementation, agro forestry and other soil fertility improvement activities are carried out as well to support the SWC measures. Part 3 of the Catchment Approach: Moving forward Between the 6th and 18th month of the catchment support, monitoring and documentation of the activities takes place. Monitoring of SWC activities involves meetings at catchment and hamlet level, training sessions for farmers in the catchments, farmer field days, and, communication and feed back sessions at village level. The quality of the SWC measures is supervised by the District Subject Matter Specialist on Catchment Co-ordination and M&E. The Land Use Planner holds regularly monitoring meetings, where issues connected with the activity plan or the land use plan are discussed with the Catchment Conservation Committee. The Catchment Approach: lessons learned Without having the intention to provide a detailed overview of the outcome of the evaluation of the Cachment Approach (Kizuguto and Shelukindo, 2003) some interesting observations can be mentioned. The Tanzanian context in which the Catchment Approach is applied is significant different from the Kenyan context. Except from the way the Catchment Approach is institutionalised in Tanzania, physically, legally and socially, a catchment in Tanzania is different from a catchment in Kenya. In Kenya most farmers own the land they are cultivating. I n Tanzania, however, the government is the owner of the land and farmers just have usufruct. Moreover, in Kenya, farmer usually have one field but relatively large with the homesteads on it. In Tanzania, land fragmentation resulting in small and scattered fields often located in different catchments is a very common phenomenon. Land fragmentation is seen as a limiting factor for the implementation of SWC measures (Kizuguto and Shelukindo, 2003). Moreover, in Tanzania (temporary) migration of youth and men is a trend. The absence of men as being decision-makers negatively influences the planning of SWC measures and decreases the labour force seriously.

100
6.3 The recommended use of tool ‘participatory soil erosion mapping’ and ‘financial analysis of SWC measures’ within the
Looking at the way the tools ‘participatory soil erosion mapping’ and ‘cost benefit analysis of SWC measures’ put farmers’ knowledge and priorities in the centre of farmer decision making on SWC issues, in principle these tools are consistent with the Catchment Approach and have the potential to enrich it. This paragraph describes the recommendations on the combined use of the tools within the current Catchment Approach. Both tools could be used separately as well. However a more effective and efficient use can be expected in case they are applied in combination. Before a detailed description on how to use the tools and when in the Catchment Approach is provided, table 6.1 summarises the proposed use of both tools following the three parts: getting started, implementation and moving forward. More detailed information on the tools themselves can be found in chapter 3 and 4. Table 6.1: Proposed use of the tool ‘participatory soil erosion mapping’ and ‘cost benefit analysis of SWC measures’ within the Catchment Approach
Parts of the Catchment Approach and their steps in which the tools could applied
Proposed use of the tool ‘participatory soil erosion mapping’
Proposed use of the tool ‘cost benefit analysis of SWC measures’
Part 1: Getting started Planning conservation measures Adapted use of the tool (quick and
dirty) Adapted use of the tool (quick and dirty)
Awareness raising and animation Adapted use of the tool The physical map at catchment or hamlet level showing the hot, medium, and low erosion spots A soil erosion status map and a related yield gap map, both previously developed in another catchment and put on posters could be used to stimulate the discussion on SWC issues.
Adapted use of the tool Case studies from previous experiences could be put on posters showing cost/benefit ratios of various (combined) SWC measures.
Training and capacity building Training in the tool for working group members and members of the Catchment Conservation Committee
Training in the tool for working group members and members of the Catchment Conservation Committee
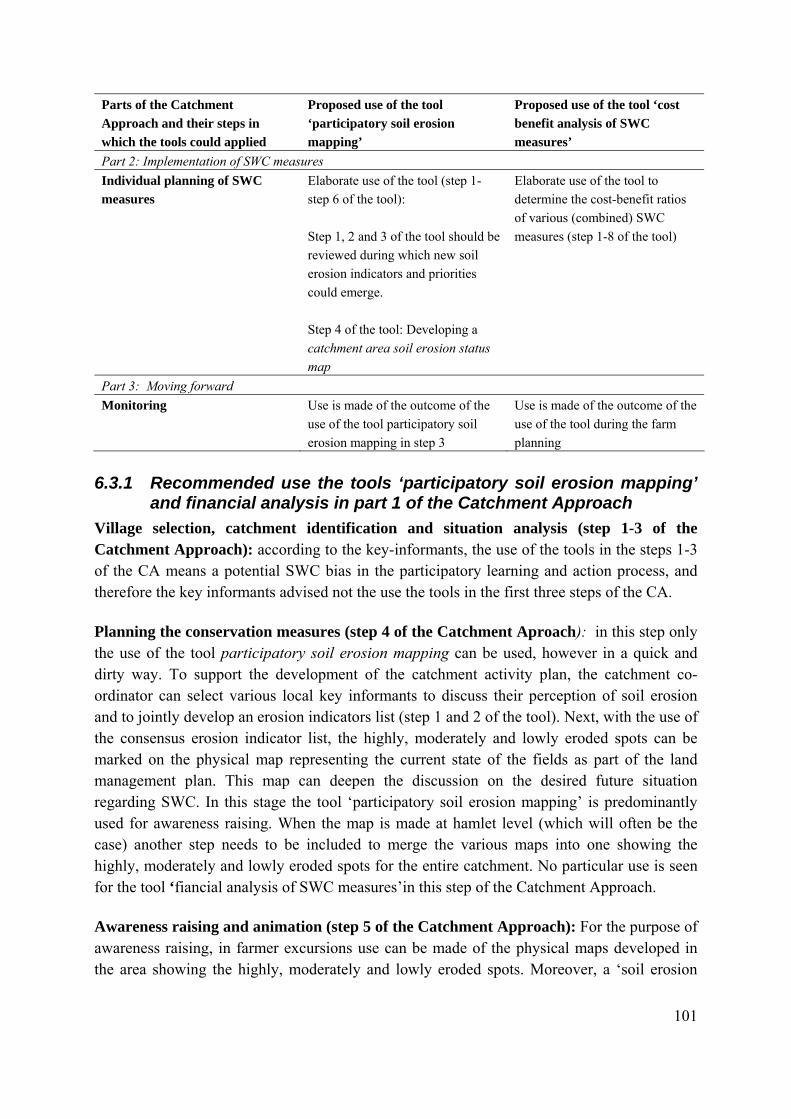
101
Parts of the Catchment Approach and their steps in which the tools could applied
Proposed use of the tool ‘participatory soil erosion mapping’
Proposed use of the tool ‘cost benefit analysis of SWC measures’
Part 2: Implementation of SWC measures Individual planning of SWC measures
Elaborate use of the tool (step 1- step 6 of the tool): Step 1, 2 and 3 of the tool should be reviewed during which new soil erosion indicators and priorities could emerge. Step 4 of the tool: Developing a catchment area soil erosion status map
Elaborate use of the tool to determine the cost-benefit ratios of various (combined) SWC measures (step 1-8 of the tool)
Part 3: Moving forward Monitoring Use is made of the outcome of the
use of the tool participatory soil erosion mapping in step 3
Use is made of the outcome of the use of the tool during the farm planning
6.3.1 Recommended use the tools ‘participatory soil erosion mapping’ and financial analysis in part 1 of the Catchment Approach
Village selection, catchment identification and situation analysis (step 1-3 of the Catchment Approach): according to the key-informants, the use of the tools in the steps 1-3 of the CA means a potential SWC bias in the participatory learning and action process, and therefore the key informants advised not the use the tools in the first three steps of the CA. Planning the conservation measures (step 4 of the Catchment Aproach): in this step only the use of the tool participatory soil erosion mapping can be used, however in a quick and dirty way. To support the development of the catchment activity plan, the catchment co-ordinator can select various local key informants to discuss their perception of soil erosion and to jointly develop an erosion indicators list (step 1 and 2 of the tool). Next, with the use of the consensus erosion indicator list, the highly, moderately and lowly eroded spots can be marked on the physical map representing the current state of the fields as part of the land management plan. This map can deepen the discussion on the desired future situation regarding SWC. In this stage the tool ‘participatory soil erosion mapping’ is predominantly used for awareness raising. When the map is made at hamlet level (which will often be the case) another step needs to be included to merge the various maps into one showing the highly, moderately and lowly eroded spots for the entire catchment. No particular use is seen for the tool ‘fiancial analysis of SWC measures’in this step of the Catchment Approach. Awareness raising and animation (step 5 of the Catchment Approach): For the purpose of awareness raising, in farmer excursions use can be made of the physical maps developed in the area showing the highly, moderately and lowly eroded spots. Moreover, a ‘soil erosion

102
status map’ and ‘the related yield gap map’, both previously developed in another catchment and put on posters can be used to increase understanding on SWC issues in terms oof the causes of erosion and the opportunities related to the implementation of SWC measures. Likewise, for the tool ‘cost benefit analysis of SWC measures’, case studies from previous experiences could be put on posters showing cost/benefit ratios of various (combined) SWC measures. Training and capacity building (step 6 of the Catchment Approach): Preferably, the members of the working group who are selected for a training on SWC issues as well as the some members of the Catchment Conservation Committee should be trained in the application of the tools ‘participatory soil erosion mapping’ and ‘cost benefit analysis of SWC measures’. Noteworthy is that in order to be able to train these farmers, the relevant Subject Matter Specialists, Land Use Planner and Village Extension Workers should be trained in the tools beforehand for which good training materials is needed.
6.3.2 Recommended use of the tools ‘participatory soil erosion mapping’ and financial analysis in part 2 ‘Planning of SWC measures’
Supporting individual planning Both tools can support the individual planning of SWC measures in part 2 of the Catchment Approach. In most case the planning will be carried out at the individual level, although the discussion on planning will often take place at working group or hamlet level. Tool ‘participatory soil erosion mapping’: In part 2 of the Catchment Approach, a catchment team together with the farmers who have received training in SWC, usually carry out a detailed field assessment. As part of this assessment, the list with the soil erosion indicators which was developed in part 1 could be reviewed while visiting the fields. New indicators might come up and/or a different priority can be given to some of the indicators. Then a catchment (or hamlet) field map can be sketched showing the farms, their size and owners (step 3 of the tool). With the use of the indicators the soil erosion status will be determined and the highly, moderately or lowly eroded areas can be marked on the map. Because all individual fields are marked on the map as well, the erosion status for each individual field can be indicated. Based on this sketch, the Divisional Subject Matter Specialist can produce a ‘catchment soil erosion status map’ (step 4 of the tool). With the use of the ‘catchment soil erosion status map’, the Divisional Subject Matter Specialists can start the discussion with the farmer on how his/her (SWC) practices positively or negatively influence other farmers’ fields. Arrows can be added on the catchment soil erosion status map showing how neighbouring farmers and farms affect each other. The determination of the degree of soil erosion can be combined with an estimation of crop yield losses. Based on the identified soil erosion status, the farmer and Divisional Subject Matter Specialists together predict qualitatively the expected crop yield losses for the current season (step 5 of the tool).
103
Next, experts such as relevant Divisional Subject Matter Specialists or the land Use Planner quantify the predicted yield losses experimentally for which they use again the catchment area soil erosion status map (step 6 of the tool). They sample a number of fields within areas classified as having high, moderate or a low erosion status. Moreover, samples of a field that serve as reference or control field can be taken. At the end, it can be expected that the farmers’ knowledge on the erosion, its causes and related crop yield losses will contribute to a more informed decision making on SWC measures. Tool ‘financial analysis of SWC measures’: Farmer’s decision making on SWC measures could be even more improved in case the tool ‘participatory soil erosion mapping' is combined with the tool ‘financial analysis of SWC measures’. This could be done in the following way. First, the catchment team gathers information on the biophysical situation. Often this will be a matter of checking what is already available as most of the data has been gathered already obtained during the situation analysis, the detailed field assessment and use of the tool ‘participatory soil erosion mapping’. Then, relevant SWC options are to be identified. The socio-economical situation is determined by discussing with the farmer(s) the sources of labour for construction of the selected SWC options and what activities have to be forgone for SWC measures (step 2 of the tool). Then, the opportunity cost of labour is determined. In step 3 of the tool 4, all (labour and material) costs and benefits are identified and quantified. Followed by a calculation of the net benefits for the number of years under consideration (for example 5 years). Next, the future benefits are expressed to the present situation (step 6 of the tool), the various scenarios will be discussed (step 7 of the tool) and the farmer(s) makes a decision for the best SWC option(s). The planned SWC measures can be marked on a specific form sheet.
6.3.3 Recommended use the tools at group level The risks of erosion and its site effects can be best treated at catchment level rather than at individual level (see chapter 1). Therefore, preferably the tools ‘participatory soil erosion mapping’ and ‘cost benefit analysis of SWC measures’ should be used by groups of farmers i.e., working group or at the hamlet level. The discussion on ‘erosion indicators’, ‘degree of erosion’, ‘catchment soil erosion status map’,’yield losses due to erosion’, and the ‘costs and benefits of SWC measures’ is likely to enhance collective SWC planning. Arrows on the catchment soil erosion status map show how neighboring farmers and farms affect each other in terms of erosion. Likewise the use of the tool ‘financial analysis’, although the costs and benefits of relevant SWC options are identified and quantified at individual farm level, when the cost-benefit ratios of SWC measures are marked on the highly eroded fields on the catchment soil erosion status map, in combination with the above mentioned arrows, the tool also supports the planning process at a collective level. As the costs for a farmer who wants to overcome the affect of a neighbouring farm, on which for example no SWC measurements are applied, are made visible with the use of the two tools, a negotiation among the farmers becomes is likely to start. The dynamics such as mutual understanding, social learning, group pressure, trust and felt interdependency that can emerge in relatively small groups can make

104
farmers to take action and as such favor joint SWC planning and implementation. Finally, it is up to the Subject Matter Specialist to estimate whether the use of arrows will positively influence the collective planning process or not.
6.3.4 Proposed use of the tools in the part ‘moving forward’ The developed soil erosion risk map, the planning sheets on SWC measures for individual farmers and /or working groups can be used in the monitoring as means of verification.
105
CATCHMENT PRIORITISATION USING SATELLITE REMOTE SENSING
Chapter 7

106
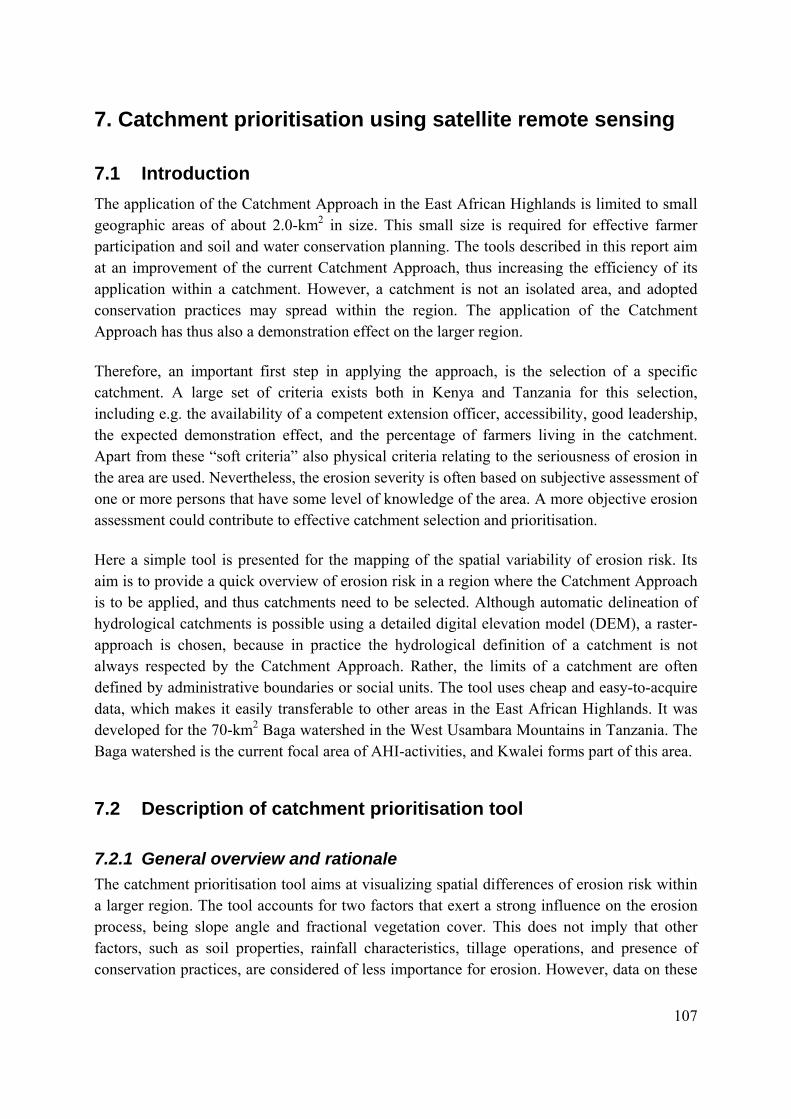
107
7. Catchment prioritisation using satellite remote sensing
7.1 Introduction The application of the Catchment Approach in the East African Highlands is limited to small geographic areas of about 2.0-km2 in size. This small size is required for effective farmer participation and soil and water conservation planning. The tools described in this report aim at an improvement of the current Catchment Approach, thus increasing the efficiency of its application within a catchment. However, a catchment is not an isolated area, and adopted conservation practices may spread within the region. The application of the Catchment Approach has thus also a demonstration effect on the larger region. Therefore, an important first step in applying the approach, is the selection of a specific catchment. A large set of criteria exists both in Kenya and Tanzania for this selection, including e.g. the availability of a competent extension officer, accessibility, good leadership, the expected demonstration effect, and the percentage of farmers living in the catchment. Apart from these “soft criteria” also physical criteria relating to the seriousness of erosion in the area are used. Nevertheless, the erosion severity is often based on subjective assessment of one or more persons that have some level of knowledge of the area. A more objective erosion assessment could contribute to effective catchment selection and prioritisation. Here a simple tool is presented for the mapping of the spatial variability of erosion risk. Its aim is to provide a quick overview of erosion risk in a region where the Catchment Approach is to be applied, and thus catchments need to be selected. Although automatic delineation of hydrological catchments is possible using a detailed digital elevation model (DEM), a raster-approach is chosen, because in practice the hydrological definition of a catchment is not always respected by the Catchment Approach. Rather, the limits of a catchment are often defined by administrative boundaries or social units. The tool uses cheap and easy-to-acquire data, which makes it easily transferable to other areas in the East African Highlands. It was developed for the 70-km2 Baga watershed in the West Usambara Mountains in Tanzania. The Baga watershed is the current focal area of AHI-activities, and Kwalei forms part of this area.
7.2 Description of catchment prioritisation tool
7.2.1 General overview and rationale The catchment prioritisation tool aims at visualizing spatial differences of erosion risk within a larger region. The tool accounts for two factors that exert a strong influence on the erosion process, being slope angle and fractional vegetation cover. This does not imply that other factors, such as soil properties, rainfall characteristics, tillage operations, and presence of conservation practices, are considered of less importance for erosion. However, data on these

108
factors are often hard to obtain at a detailed scale, and including such data would limit the application of the tool to data-rich environments, which is not the purpose here. Furthermore, vegetation cover is strongly correlated to most of these factors. Potentially, spatial variability of rainfall characteristics may be accounted for in large regions using readily available data products from the Tropical Rainfall Measuring Mission (TRMM: http://trmm.gsfc.nasa.gov). However, in regions < 100 km2 this factor can often be assumed uniform, and does not add therefore to spatial differences of erosion risk.
7.2.2 Required data and availability Two main data sources are required: a DEM and an optical satellite image of medium-resolution (15-90 m). There are many possible sources for obtaining a DEM. For some areas DEMs have been interpolated following the digitisation of contourlines present on topographic maps. However, when such information is not available, it is better to look for other sources, because the digitisation is a tedious process, especially for large areas. Therefore, the use of readily available DEMs is recommended. A very good option are the DEMs generated from the Shuttle Radar Topography Mission (SRTM), which was flown in 2000. For most parts of the world (including the East African Highlands) DEMs are available at 90-m resolution at no cost. These data can be obtained from ftp://e0mss21u.ecs.nasa.gov/srtm/ or http://seamless.usgs.gov. A large variety of optical satellite images exists. The application of widely-used Landsat Thematic Mapper (TM) or Enhanced TM (ETM) imagery has several advantages, principally the existence of a large archive of data, and the low price ranging from a limited number of free scenes (http://glcf.umiacs.umd.edu) to $ 600,- (http://edcsns17.cr.usgs.gov/EarthExplorer/) for areas covering 180*180 km. Other potential image sources include Terra ASTER data (less availability), and SPOT data (more expensive). Very important considerations are the image quality, especially related to cloud cover, and the timing of the image. Ideally the image should be taken at the moment during the year when erosion is most critical, e.g. just before the onset of the most important rainy season when fields are often bare, and the first rains can cause substantial erosion. Due to cloud cover this may imply using imagery of previous years.
7.2.3 Pre-processing steps The SRTM DEM data that can be downloaded freely from the internet contains some data holes, i.e. pixels with no value. Therefore the height of these locations needs to be interpolated. Freeware is available to do this, but results may not be satisfactory (e.g. http://www.3dnature.com/srtmfill.html). Commercial software packages like IDL-ENVI offer better filling capabilities, but these packages are expensive and may thus not be available to the potential users of the tool. For most users it would thus be the best option to use the pre-filled SRTM DEMs that are offered by the Consortium for Spatial Information (CSI-CGIAR) through http://srtm.csi.cgiar.org/.

109
The geometry of Landsat images is affected by the topography. Especially in mountainous environments it is necessary to correct for these geometric distortions to achieve a good fit with other data sources. Best practice is to use a DEM (e.g. SRTM) for the orthorectification of uncorrected images. However, orthorectification possibilities for Landsat imagery are currently offered only by the expensive software packages ERDAS Imagine and PCI Geomatics. The free data set (http://glcf.umiacs.umd.edu) however has orthorectification already applied for several scenes, although using a less detailed DEM. Nevertheless, the claimed positional accuracy is less than 50-m (Tucker et al., 2004), which seems realistic from an initial examination of the data. For the purpose of this tool, this accuracy is acceptable. For combination with additional data or existing maps, both the DEM and the Landsat image need to be geocoded. This implies first identifying control points on both the base data and the DEM/Landsat image. From these points a polynomial model is then calculated that transforms the DEM/Landsat image to the correct geometry. For the warping of the imagery, a resampling of the pixels is required. It is recommended to use nearest neighbour resampling for the Landsat image with an output resolution of 30-m. For the DEM a nearest neighbour resampling is also recommended, but maintaining at first the 90-m resolution. The step of warping and resampling is a standard operation in commercial remote sensing software packages. An alternative to this procedure is performing a simple reprojection of the DEM and Landsat image that already have georeference data, which is also a standard operation. However, a thorough visual check is needed whether the desired fit is obtained, because this is not always the case. This can be done by creating a simple overlay of the reprojected DEM and Landsat image. To account for atmospheric influences, the optical imagery should be calibrated. For the case of Landsat, this is done by first calculating the spectral radiance Lλ, using:
DNLMINLMAX
LMINL ⋅⎟⎠
⎞⎜⎝
⎛ −+=
255λλ
λλ (7.1)
where DN is the digital number of an image pixel, and LMINλ and LMAXλ are scaling variables for each spectral band. The values of these variables can be found in http://landsat.usgs.gov/cpf/cpf.php or in the header file of the image. For the method described here only band 3 and 4 (red and near infrared) need to be calibrated, as other bands will not be used. After calculation of Lλ the exoatmospheric reflectance ρp is calculated using the following equation:
sp ESUN
dLθ
πρ
λ
λcos
2
⋅⋅⋅
= (7.2)
where d is the Earth-Sun distance in astronomical units, ESUNλ is the mean solar exoatmospheric irradiance, and θs is the solar zenith angle in degrees. θs can be calculated using the scene acquisition date and time with e.g. online tools like

110
http://solardat.uoregon.edu/SolarPositionCalculator.html. ESUNλ can be derived from table 7.1 and d can be interpolated from the values in table 7.2. Table 7.1: ESUNλ values for band 3 and 4*
Band Landsat 4 Landsat 5 Landsat 7
3 1557 1554 1551
4 1033 1036 1044 *sources: Chander and Markham (2003) and Landsat 7 science data users handbook (http://ltpwww.gsfc.nasa.gov/IAS/handbook/handbook_toc.html) Table 7.2: Earth-Sun distance d in astronomical units*
Julian Day Distance Julian Day
Distance Julian Day
Distance Julian Day Distance
1 0.9832 106 1.0033 213 1.0149 319 0.9892 15 0.9836 121 1.0076 227 1.0128 335 0.9860 32 0.9853 135 1.0109 242 1.0092 349 0.9843 46 0.9878 152 1.0140 258 1.0057 365 0.9833 60 0.9909 166 1.0158 274 1.0011 74 0.9945 182 1.0167 288 0.9972 91 0.9993 196 1.0165 305 0.9925
*source: Chander and Markham (2003)
7.2.4 Extraction of erosion factors Slope angle is derived directly from the DEM. It can easily be calculated in many raster software packages. Different algorithms exist for the slope calculation. Here, the algorithm of Zevenbergen and Thorne (1987) is used. After the slope angle calculation, the slope map is converted to the same 30-m grid as the Landsat image using a cubic convolution resampling. Fractional vegetation cover (fcover) is derived from band 3 (red) and 4 (infrared) of the Landsat image. For healthy vegetation infrared reflection is much higher than red reflection, which is exploited by the Normalized Difference Vegetation Index (NDVI), that is calculated as follows:
)3()4()3()4(
)()()()(
bandbandbandband
redNIRredNIRNDVI
ρρρρ
ρρρρ
+−
=+−
= (7.3)
An important advantage of using the NDVI is the substantial reduction of topographic effects on reflection (Fig. 7.1). To derive the fcover from the NDVI ideally a linear relationship is determined using fcover field estimates and calculated NDVI-values from the image. However, when these field estimations are not available a linear stretching can be applied to the NDVI-values using areas within the study region with a known fcover of 0% (no cover), and a cover of 100% (full vegetation cover, e.g. dense forest). Both methods should give a reasonable approximation of fcover.

111
7.2.5 Data integration for map construction The acquired slope angle and fcover map are integrated with a decision tree to obtain the erosion risk map. The used decision tree is shown in table 7.3. Table 7.3: Decision tree for construction erosion risk map
fcover slope erosion risk fcover slope erosion risk
80 - 100 % very low 20 - 40 % 0 - 10 % low 60 - 80 % 0 - 10 % very low 20 - 40 % 10 - 20 % medium 60 - 80 % 10 - 40 % low 20 - 40 % 20 - 40 % high 60 - 80 % > 40 % medium 20 - 40 % > 40 % very high 40 - 60 % 0 - 20 % low 0 - 20 % 0 - 10 % medium 40 - 60 % 20 - 40 % medium 0 - 20 % 10 - 20 % high 40 - 60 % > 40 % high 0 - 20 % > 20 % very high
7.2.6 Software requirements Although the described tool is not software dependent, several basic pre-processing steps are required. Therefore, a raster-based GIS package that can execute several of these steps is required. Good options are IDL ENVI, ERDAS Imagine, and PCI Geomatica. However, cheaper packages such as ILWIS are also able to execute most of the processing steps.
7.3 Application of the catchment prioritisation tool in the Baga watershed, Tanzania
7.3.1 Data used For the application of the catchment prioritisation to the Baga watershed, two main data sources were used: an SRTM DEM, and a Landsat ETM image, acquired on February 6, 2003 (before start of the long rainy season). As base data for geocoding purposes orthophotos and a
Figure 7.1: False colour composite of small part of Landsat image (left) and stretched NDVI image of the same area (right). Dark parts on left indicate shadows due to topography that are greatly reduced on the right.
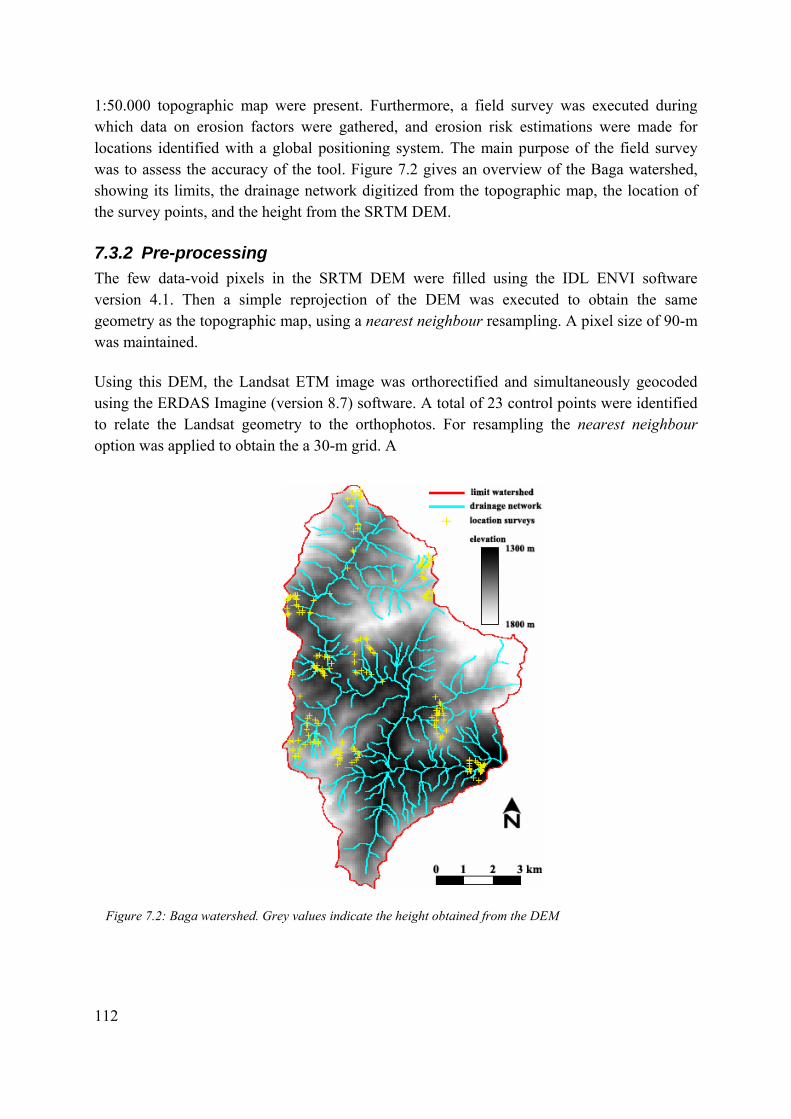
112
1:50.000 topographic map were present. Furthermore, a field survey was executed during which data on erosion factors were gathered, and erosion risk estimations were made for locations identified with a global positioning system. The main purpose of the field survey was to assess the accuracy of the tool. Figure 7.2 gives an overview of the Baga watershed, showing its limits, the drainage network digitized from the topographic map, the location of the survey points, and the height from the SRTM DEM.
7.3.2 Pre-processing The few data-void pixels in the SRTM DEM were filled using the IDL ENVI software version 4.1. Then a simple reprojection of the DEM was executed to obtain the same geometry as the topographic map, using a nearest neighbour resampling. A pixel size of 90-m was maintained. Using this DEM, the Landsat ETM image was orthorectified and simultaneously geocoded using the ERDAS Imagine (version 8.7) software. A total of 23 control points were identified to relate the Landsat geometry to the orthophotos. For resampling the nearest neighbour option was applied to obtain the a 30-m grid. A
Figure 7.2: Baga watershed. Grey values indicate the height obtained from the DEM
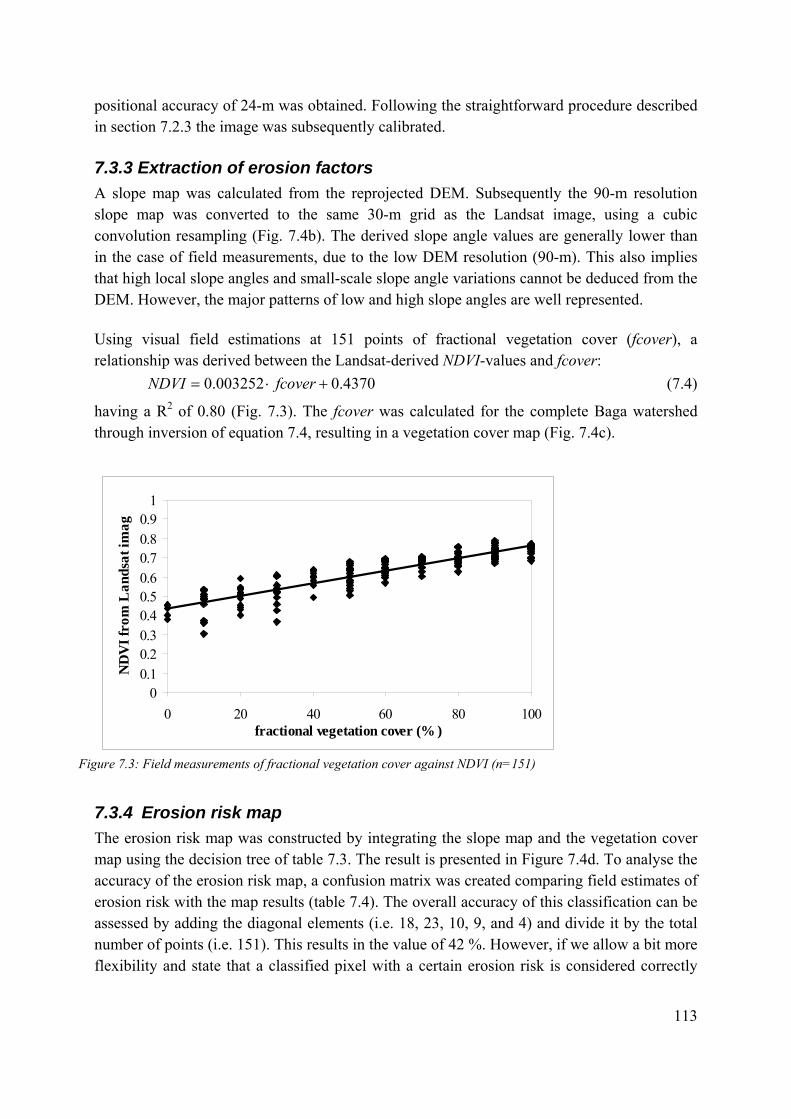
113
positional accuracy of 24-m was obtained. Following the straightforward procedure described in section 7.2.3 the image was subsequently calibrated.
7.3.3 Extraction of erosion factors A slope map was calculated from the reprojected DEM. Subsequently the 90-m resolution slope map was converted to the same 30-m grid as the Landsat image, using a cubic convolution resampling (Fig. 7.4b). The derived slope angle values are generally lower than in the case of field measurements, due to the low DEM resolution (90-m). This also implies that high local slope angles and small-scale slope angle variations cannot be deduced from the DEM. However, the major patterns of low and high slope angles are well represented. Using visual field estimations at 151 points of fractional vegetation cover (fcover), a relationship was derived between the Landsat-derived NDVI-values and fcover:
4370.0003252.0 +⋅= fcoverNDVI (7.4)
having a R2 of 0.80 (Fig. 7.3). The fcover was calculated for the complete Baga watershed through inversion of equation 7.4, resulting in a vegetation cover map (Fig. 7.4c).
7.3.4 Erosion risk map The erosion risk map was constructed by integrating the slope map and the vegetation cover map using the decision tree of table 7.3. The result is presented in Figure 7.4d. To analyse the accuracy of the erosion risk map, a confusion matrix was created comparing field estimates of erosion risk with the map results (table 7.4). The overall accuracy of this classification can be assessed by adding the diagonal elements (i.e. 18, 23, 10, 9, and 4) and divide it by the total number of points (i.e. 151). This results in the value of 42 %. However, if we allow a bit more flexibility and state that a classified pixel with a certain erosion risk is considered correctly
00.10.20.30.40.50.60.70.80.9
1
0 20 40 60 80 100fractional vegetation cover (% )
ND
VI f
rom
Lan
dsat
imag
Figure 7.3: Field measurements of fractional vegetation cover against NDVI (n=151)

114
classified when there is a maximum difference of one class (e.g. low erosion risk in classification is correct if field estimate is very low, low, or medium), the resulting overall accuracy becomes 84 %. It can be concluded that the presented tool, although simple, provided an accurate map of spatial patterns of erosion risk for the Baga watershed, using only readily available data sources. From this map, problem areas can easily be identified. Therefore, this tool can assist in the objective evaluation of the physical criterion of erosion risk for catchment prioritisation purposes within the East African Highlands. Table 7.4: Confusion matrix comparing field estimates of erosion risk with corresponding results of the erosion mapping tool.
Classification erosion risk map very low low medium high very high Total
very low 18 17 2 0 1 38 low 12 23 6 3 1 45 medium 4 11 10 5 2 32 high 0 8 3 9 6 26
Fiel
d es
timat
e
very high 0 1 2 3 4 10 Total 34 60 23 20 14 151

115
Figure 7.4: Baga watershed: A. False colour Landsat ETM+ image; B. SRTM-derived slope map; C. Landsat-derived fractional vegetation cover; D. Erosion risk map

116

117
REFERENCES
Chapter 8

118

119
8. References
Admassie, Y., 1992. The Catchment Approach to soil conservation in Kenya. Regional Soil Conservation Unit Report No. 6. RSCU, Swedish International Development Authority, Nairobi, Kenya.
Admassie, Y., 1998. The Sustainability of the Catchment Approach-Induced Measures and Activities: Report from a field study in nine 'old' catchments in Central, Western and Rift Valley Province. The National Soil and Water Conservation Programme, Ministry of Agriculture: Nairobi.
Aregay, B.W. and P.A. Chadokar. 1993. Soil conservation: An Ethiopian experience. p. 23-25 in N.W. Hudson and R.J. Cheatle (eds.) Working with farmers for better land husbandry. Soil and Water Conservation Society, Ankeny, Iowa.
Baiya, F.M. 2000. Focal Area Extension Planning: Field Guide-Notes. Min of Agriculture and Rural Development
Chambers, R., A. Pacey and L.A. Thrupp. 1989. Farmers First. Intermediate Technology Publications, London.
Chander, G. and Markham, B., 2003. Revised Landsat-5 TM radiometric calibration procedures and postcalibration dynamic ranges. IEEE Transactions on Geoscience and Remote Sensing, 41(11): 2674-2677.
Douglas, M.G. 1993. Making conservation farmer-friendly. p. 4-15 in N.W. Hudson and R.J. Cheatle (eds.) Working with farmers for better land husbandry. Soil and Water Conservation Society, Ankeny, Iowa.
Edwards, K.A. 1979. Regional contrasts in rates of soil erosion and their significance with respect to agricultural development in Kenya. In: Lal, R and D.J. Green land (eds.); Soil physical properties and crop production in the tropics.
Enters, T. 1998. Methods for the economic assessment of the on-and off-site impacts of soil erosion. Issues in Sustainable Land Management no.2. International Board for Soil Research and Management. Bangkok.
Gachene, C.C.K. 1995. Evaluation and mapping of soil erosion susceptibility: an example from Kenya. Soil Use and Management 11: 1-4.
Graaff, J de. 1996. The price of soil erosion. An economic evaluation of soil conservation and watershed development. PhD Thesis. Wageningen University, Wageningen.
120
Hessel, R., H. van den Bosch, and O.Vigiak. 2005 Evaluation Of The Lisem Soil Erosion Model In Two Catchments In The East African Highlands. Submitted to ‘Earth Surface Processes and Landforms’
Hessel, R. and Tenge, A.J.M., 2005. Modelling Soil And Water Conservation Measures With A Catchment Scale Erosion Model. Submitted to ‘Earth Surface Processes and Landforms’.
Hudson, N.W. 1991. A study of the reasons for success or failure of soil conservation projects. Soils Bulletin 64, FAO, Rome.
Hudson, N.W. and R.J. Cheatle., 1993. Working with farmers for better land husbandry. Soil and Water Conservation Society, Ankeny, Iowa.
Kiara JK, Munyikombo L.S., Mwarasomba L.S., Pretty J, Thomas J. 1999. Impacts of the Catchment Approach to Soil and Water Conservation: Experiences of ministry of Agriculture, Kenya. In: Fertile ground; The impact of participatory watershed management. Hinchcliffe F, Pretty J, Guijt I, Shah P (eds). IT Publications, Southampton.
Kizuguto, T.M. and H. B. Shelukindo. 2002. Guidelines to Mobilise and Support Community –Based Catchment Approach/ Watershed Management (SECAP project document).
Kizuguto T.M., Shelukindo H.B. 2003. The challenges facing the catchment approach in the East African highlands, the case of the Usambara mountains experiences and way forward. SECAP discussion paper. Soil Erosion and Agro-forestry program (SECAP), Lushoto District, Tanzania.
Kizuguto, T.M. and H. B. Shelukindo. 2003. The Challenges Facing the Catchment Approach in the East African Highlands: The case of the Usambara Mountains.
Kuyvenhoven, A. & L.B.M. Mennes. (1989). Guidelines for project appraisal. An introduction to the principles of financial, economic and social cost-benefit analysis for developing countries. Government Printing Office, The Hague.
Morgan, R.P.C. 1995. Soil erosion and conservation. 2nd ed. Longman, Harlow, England.
Okoba, B.O. 2005. Farmers’ indicators for soil erosion mapping and crop yield estimation in central highlands of Kenya. Doctoral thesis, Wageningen University, Wageningen, The Netherlands.
Okoba BO, Tenge A.J., Sterk G. 2005. Application of soil erosion mapping and financial analysis tools in soil and water conservation planning. Part 1: Case study of Gikuuri catchment, Kenya. Land Degradation and Development. Submitted.

121
Pretty, J.N., J Thompson and J.K. Kiara. 1995. Agricultural regeneration in Kenya: the catchment approach to soil and water conservation. Ambio 24: 7-15.
Sands, D.M. 1986. The technology application gap: Overcoming constraints to small farm development. FAO Research and Technology Paper 1, FAO, Rome.
Shaxson, T.F., N.W. Hudson, D.W. Sanders, E. Roose and W.C. Moldenhauer. 1989.Land husbandry: A framework for soil and water conservation. World Association of Soil and Water Conservation & Soil and Water Conservation Society, Ankeny, Iowa.
Tenge, A. 2005. Participatory appraisal for farm-level soil and water conservation planning in West Usambara Mountains, Tanzania. Doctoral thesis, Wageningen University, Wageningen, The Netherlands.
Thomas, D.B., A. Eriksson, M. Grunder and J.K. Mburu. 1997. Soil and water conservation manual for Kenya. Soil and Water Conservation Branch, Ministry of Agriculture, Livestock Development and Merketing, Nairobi, Kenya.
Tiffen, M., M. Mortimore and F. Gichuki. 1994. More people, less erosion: Environmental recovery in Kenya. Wiley, Chichester, U.K.
Tucker, C.J., Grant, D.M. and Dykstra, J.D., 2004. NASA's global orthorecticified Landsat data set. Photogrammetric Engineering and Remote Sensing, 70(3): 313–322.
Vigiak, O. 2005. Modelling spatial patterns of erosion in the West Usambara Mountains of Tanzania. Doctoral thesis, Wageningen University, Wageningen, The Netherlands.
Vrieling, A., G. Sterk and O. Vigiak. 2005. Spatial evaluation of soil erosion risk in the West Usamabara Mountains, Tanzania. Land Degradation and Development (in prep).
Zevenbergen, L.W. and Thorne, C.R., 1987. Quantitative analysis of land surface topography. Earth Surface Processes and Landforms, 12(1): 47-56.

122
123
RESOURCES
Annex 1

124
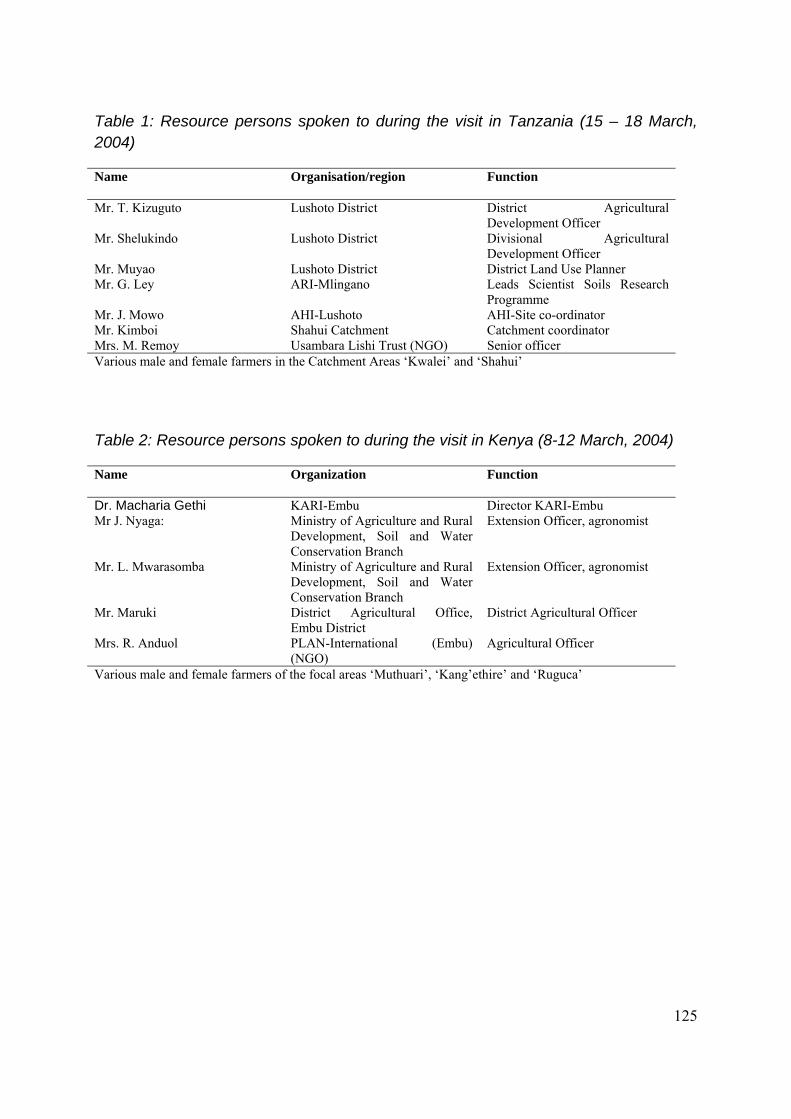
125
Table 1: Resource persons spoken to during the visit in Tanzania (15 – 18 March, 2004)
Name
Organisation/region Function
Mr. T. Kizuguto
Lushoto District District Agricultural Development Officer
Mr. Shelukindo Lushoto District Divisional Agricultural Development Officer
Mr. Muyao Lushoto District District Land Use Planner Mr. G. Ley ARI-Mlingano Leads Scientist Soils Research
Programme Mr. J. Mowo AHI-Lushoto AHI-Site co-ordinator Mr. Kimboi Shahui Catchment Catchment coordinator Mrs. M. Remoy Usambara Lishi Trust (NGO) Senior officer Various male and female farmers in the Catchment Areas ‘Kwalei’ and ‘Shahui’
Table 2: Resource persons spoken to during the visit in Kenya (8-12 March, 2004)
Name Organization Function
Dr. Macharia Gethi KARI-Embu Director KARI-Embu Mr J. Nyaga: Ministry of Agriculture and Rural
Development, Soil and Water Conservation Branch
Extension Officer, agronomist
Mr. L. Mwarasomba Ministry of Agriculture and Rural Development, Soil and Water Conservation Branch
Extension Officer, agronomist
Mr. Maruki District Agricultural Office, Embu District
District Agricultural Officer
Mrs. R. Anduol PLAN-International (Embu) (NGO)
Agricultural Officer
Various male and female farmers of the focal areas ‘Muthuari’, ‘Kang’ethire’ and ‘Ruguca’

126