Embed Size (px)
Citation preview

Tool Wear Prediction Modelling for
Sheet Metal Stamping Die in Automotive Manufacture
by
Xuan Zhi WANG
A thesis submitted for full fulfilment of the requirement for the
degree of Doctor of Philosophy
Faculty of Engineering and Industrial Sciences,
Swinburne University of Technology,
Hawthorn, Victoria 3122, Australia
March 2011

i
DECLARATION
This thesis contains no material which has been accepted for the award of any
other degree or diploma at any university and to the best of my knowledge and
belief contains no material previously published or written by another person or
persons excepts where due reference is made.
Xuan Zhi WANG 24 March 2011

ii
ACKNOWLEDGMENTS
I would like to express my sincere thanks for all who have contributed to this thesis.
First of all, I wish to thank my supervisor Prof Syed Masood. This thesis would not
have been possible without his great and valuable support and guidance. I hereby
express my special thanks to my co-supervisor Dr Matthew Dingle from Deakin
University. Here particular thanks to Dr Tim Hilditch and Dr Matthias Weiss from
Deakin University for their helps in preparing the channel bending tests.
I would like to show my gratitude to the Cooperative Research Centre for Advanced
Automotive Technology (AutoCRC) for funding my research project, especially to Ms
Kate Neely from AutoCRC for her kind support for the project. I would also be thankful
for GM Holden for providing samples and technical documents. Mr Shane Christian
from GM Holden deserves special thanks for his assistance and coordination for the
project.
I am grateful to my parents for their continuous support thorough my life. They always
encourage me to achieve my goals in my life, especially in some tough time. Special
thank to my uncle for his valuable support.
I would like to thank my colleagues from Faculty of Engineering & Industrial Sciences,
Swinburne University of Technology. I would also like to thank my friends in
Melbourne who helped me during my study.

iii
ABSTRACT
Advanced high strength steels (AHSS) are increasingly used in sheet metal
stamping in the automotive industry. In comparison with conventional steels,
AHSS stampings produce higher contact pressures at the interface between draw
die and sheet metal blank, resulting in more severe wear conditions, particularly at
the draw die radius. Developing the ability to accurately predict and reduce the
potential tool wear during the tool design stage is vital for shortening lead times
and reducing production costs. This thesis investigates the influence of draw die
geometry on the wear distribution over the draw die radius for AHSS and
develops a methodology for optimising the draw die geometry to reduce wear
using numerical and experimental methods.
Tool wear predictions on automotive sheet metal forming die and recommended
protections of the tool surface under the initial production conditions were
obtained from AutoForm simulation software. Effects of lubrication coefficients,
binder pressure loads and die coating on tool wear distributions were investigated
as well. It is concluded that the areas that are most sensitive to tool wear occurs
at the locations corresponding to the large gradient of drawing depth.
To study the tool wear distributions for more common stamping parts, a numerical
tool wear model was developed and applied using the commercial software
package Abaqus. Channel tests are carried out using an Erichsen sheet metal tester
with high pressure prescale films to verify the numerical model results.
Comparing the results obtained from the prescale film with the results from the
simulation, it is concluded that the contact pressure distributions indicated by the
prescale film are consistent with those from the simulation.

iv
Various geometries of radius arc profiles, including standard circular profiles, high
elliptical profiles, and flat elliptical profiles, were numerically investigated using
the tool wear model developed, and the contact pressure distribution and tool wear
work along the radii were determined. The following conclusions were reached
from the investigations:
(1) The colour contour of the high contact pressure on the die radius can be
divided into three distinct zones of high pressure and tool wear;
(2) The dominant zone leading to maximum contact pressure and tool wear
severity depends on the geometry of die radius profile under the same
material and process conditions;
(3) The geometry of draw die radius has a significant influence on the tool
wear and standard circular and elliptical curves can lead to the
achievement of reduced and uniform contact pressure distribution (wear
distribution) along most of zones of the draw die radius arc.
The results suggest that to minimise contact pressure and tool wear using this
approach it would be necessary to optimise the shape for a particular combination
of material type, thickness and forming process.
Effects of control parameters, such as blank geometry, punch geometry,
deep-drawing process parameters and tool material, on wear behaviour in
deep-drawing for various shape of die radius were then investigated to provide
guidelines for impacts of these parameters.
A specialised software routine was then compiled for optimisation of die radius
profiles to minimise and achieve uniform contact pressure (wear distribution)

v
using Python programming language. The routine was fully integrated with
Abaqus software and has the following functions:
(1) To provide a user-friendly Graphical User Interface for pre-processing
data input for users who have less experience and skill;
(2) To optimise a die radius profile according to the control parameters that
users input.
The results obtained are relevant to the issue of reducing the high tool wear in
automotive stamping tools by predicting the causes of such tool wear related to
tool geometry and process parameters. They provide useful guidelines for
enhancing the tool life of sheet metal processing in automotive industry.

vi
TABLE OF CONTENTS
DECLARATION.................................................................................................... i
ACKNOWLEDGMENTS .................................................................................... ii
ABSTRACT.......................................................................................................... iii
TABLE OF CONTENTS ..................................................................................... vi
LIST OF FIGURES ............................................................................................ xii
LIST OF TABLES… ......................................................................................... xvii
CHAPTER 1 INTRODUCTION .................................................................... 1
1.1 Background and Significance of Research ............................................... 1
1.2 Objectives and Scope of Research ............................................................ 3
1.3 Outlines of Thesis ..................................................................................... 5
CHAPTER 2 LITERATURE REVIEW ........................................................ 7
2.1 Overview .................................................................................................. 7
2.2 Sheet Metal Stamping ............................................................................... 7
2.2.1 Introduction ........................................................................................ 7
2.2.2 Contact zones in sheet metal forming ................................................ 8
2.3 Advanced High Strength Steel .................................................................. 9
2.3.1 Dual phase (DP) steel ......................................................................... 9
2.3.2 Tool wear in stamping of AHSS ........................................................ 11
2.4 Tool Wear Mechanism ............................................................................ 13
2.4.1 Introduction ...................................................................................... 13
vii
2.4.2 Adhesive wear .................................................................................. 14
2.4.3 Abrasive wear ................................................................................... 16
2.4.4 Tool wear model for conventional deep-drawing ............................. 18
2.5 Test Methods for Tool Wear Prediction .................................................. 19
2.5.1 Pin-on-disk test ................................................................................. 19
2.5.2 Modified bending-under-tension-test ............................................... 21
2.5.3 Bending-under-tension test ............................................................... 22
2.5.4 Deep-drawing process-simulator ...................................................... 22
2.5.5 Slider-on-flat-surface tribometer ...................................................... 24
2.5.6 Twist compression test ..................................................................... 25
2.5.7 U-bending test .................................................................................. 27
2.5.8 Strip-drawing test ............................................................................. 29
2.5.9 Draw bead test .................................................................................. 30
2.5.10 Slider test system .............................................................................. 32
2.5.11 Acoustic emission technique ............................................................ 33
2.6 Research and Development in Tool Wear ............................................... 34
2.6.1 Coating ............................................................................................. 34
2.6.2 Lubrication ....................................................................................... 40
2.6.3 Alternative die materials ................................................................... 43
2.6.4 Tool wear modelling ......................................................................... 46
2.6.5 Die radius geometry ......................................................................... 47
2.7 Summary ................................................................................................. 50
viii
CHAPTER 3 TOOL WEAR PREDICTION USING AUTOFORM
SOFTWARE ............................................................................ 52
3.1 Introduction ............................................................................................ 52
3.2 AutoForm software ................................................................................. 53
3.3 Simulation Setup ..................................................................................... 56
3.4 Results and Discussion ........................................................................... 59
3.4.1 Identification of critical tool worn areas .......................................... 59
3.4.2 Relationship between tool worn area, contact pressure and drawing
depth ................................................................................................. 62
3.4.3 Comparison of contact pressure distribution for various lubrication
coefficients ....................................................................................... 63
3.4.4 Comparison of contact pressure distribution upon various binder
pressure loads ................................................................................... 64
3.4.5 Comparison of tool wear distribution upon various die coating ...... 66
3.5 Advantages and Limitations of AutoForm Software .............................. 68
3.6 Summary ................................................................................................. 70
CHAPTER 4 NUMERICAL TOOL WEAR PREDICTION
MODELLING ......................................................................... 71
4.1 Introduction ............................................................................................ 71
4.2 Wear Work Calculation Along Die Radius Profile ................................. 73
4.3 Finite Element Modelling ....................................................................... 76
4.3.1 Geometry .......................................................................................... 76
4.3.2 Discretisation .................................................................................... 79
4.3.3 Material properties ............................................................................ 80

ix
4.3.4 Contact interaction ............................................................................ 81
4.3.5 Analysis steps with constraints and loadings ................................... 82
4.3.6 Deformed and undeformed model .................................................... 84
4.4 Summary ................................................................................................. 90
CHAPTER 5 EXPERIMENTAL VALIDATION OF TOOL WEAR
PREDICTON MODEL .......................................................... 92
5.1 Introduction ............................................................................................ 92
5.2 Experimental Constraints ....................................................................... 92
5.3 Fuji Prescale Film ................................................................................... 93
5.3.1 Working principle of prescale film ................................................... 93
5.3.2 Momentary pressure measurement ................................................... 94
5.4 Experimental Equipment ........................................................................ 95
5.4.1 Erichsen sheet metal tester ............................................................... 95
5.4.2 Fuji mono-sheet type prescale film .................................................. 97
5.4.3 Mild steel strip .................................................................................. 97
5.5 Experimental Sequences ......................................................................... 98
5.6 Experimental Results and Discussion ................................................... 100
5.7 Summary ............................................................................................... 102
CHAPTER 6 INVESTIGATION OF DIE RADIUS ARC PROFILE
ON WEAR BEHAVIOUR .................................................... 103
6.1 Introduction .......................................................................................... 103
6.2 Variation of Die Radius Profiles ........................................................... 103
6.3 Results and Discussion ......................................................................... 106

x
6.3.1 Standard circular profiles................................................................ 106
6.3.2 High elliptical profiles ..................................................................... 110
6.3.3 Flat elliptical profiles ....................................................................... 112
6.4 Summary ................................................................................................ 115
CHAPTER 7 INVESTIGATION OF CONTROL PARAMETERS ON
WEAR BEHAVIOUR ............................................................ 117
7.1 Introduction ........................................................................................... 117
7.2 Variation of Control Parameters ............................................................ 117
7.3 Results and Discussion ......................................................................... 120
7.3.1 Lubrication coefficient ................................................................... 120
7.3.2 Binder holder force ......................................................................... 122
7.3.3 Young's modulus of die .................................................................. 123
7.3.4 Clearance between die and punch .................................................. 125
7.3.5 Punch radius ................................................................................... 127
7.3.6 Punch diameter ............................................................................... 128
7.3.7 Blank thickness ............................................................................... 130
7.4 Summary ............................................................................................... 132
CHAPTER 8 OPTIMISATION OF DIE RADIUS GEOMETRY .......... 134
8.1 Introduction .......................................................................................... 134
8.2 Graphical User Interface ....................................................................... 134
8.3 Algorithm for Die Radius Optimisation ............................................... 139
8.4 Case Study ............................................................................................ 143
8.4.1 Optimisation parameters settings ................................................... 143

xi
8.4.2 Results and discussion .................................................................... 144
8.5 Summary ............................................................................................... 148
CHAPTER 9 CONCLUSIONS AND FURTHER RESEARCH .............. 149
9.1 Overview .............................................................................................. 149
9.2 Major Research Outcomes .................................................................... 149
9.3 Recommendations for Future Work ...................................................... 152
REFERENCES.................................................................................................. 153
APPENDIX A LIST OF PUBLICATIONS ................................................163
APPENDIX B MOMENTARY PRESSURE CHART............................... 164
xii
LIST OF FIGURES Figure 1.1 Automotive Stamping Die ................................................................ 2
Figure 1.2 Body side components formed by stamping process ........................ 2
Figure 2.1 Cross-sectional view of a simple sheet metal stamping die ............. 8
Figure 2.2 Contact zones in deep drawing ......................................................... 9
Figure 2.3 Microstructure of DP steel .............................................................. 10
Figure 2.4 Five principal types of tool failure.................................................. 12
Figure 2.5 Formation of an adhesive junction ................................................. 14
Figure 2.6 Schematic of a hypothetical model of generation of a
hemispherical wear particle during a sliding contact ..................... 15
Figure 2.7 A hard conical asperity in sliding contact with a softer surface in
an abrasive wear model .................................................................. 18
Figure 2.8 Pin-on-disk test ............................................................................... 20
Figure 2.9 A modified bending under tension test ........................................... 21
Figure 2.10 Schematic of bending-under-tension test ........................................ 22
Figure 2.11 Schematic of deep-drawing process-simulator ............................... 23
Figure 2.12 Schematic presentation of the SOFS tribometer ............................. 25
Figure 2.13 Schematic of twist compression test ............................................... 26
Figure 2.14 Temperature measurement using a thermocouple .......................... 26
Figure 2.15 Schematic view of U-bending test .................................................. 27
Figure 2.16 U-bending equipment showing die-holder with inserts .................. 28
Figure 2.17 Principle for U-bending test ........................................................... 28

xiii
Figure 2.18 Strip-drawing test ............................................................................ 29
Figure 2.19 Strip-drawing test ............................................................................ 30
Figure 2.20 Draw bead test ................................................................................ 31
Figure 2.21 Slider test system ............................................................................ 32
Figure 2.22 Die sample dimensions and its actual photo on wear tracks .......... 33
Figure 2.23 Robot-based die wear test system ................................................... 40
Figure 2.24 Simulation testing machine for hot stamping ................................. 42
Figure 2.25 Scheme of strip drawing test .......................................................... 44
Figure 2.26 Algorithm applied in UGS .............................................................. 48
Figure 3.1 Sheet metal forming process chain in AutoForm Software ............ 54
Figure 3.2 Reinforced rear suspension support ................................................ 57
Figure 3.3 Forming limit curve ........................................................................ 57
Figure 3.4 Simulation sequences in AutoForm ................................................ 58
Figure 3.5 Blank, binder, punch and die in AutoForm software ...................... 59
Figure 3.6 Potential tool worn area location on die surface obtained from
initial simulation ............................................................................. 60
Figure 3.7 Photos of the worn areas on the corresponding surface of actual
sheet metal part ............................................................................... 61
Figure 3.8 Cross-section 1 on Areas 2’ and 3’ ................................................. 61
Figure 3.9 Contact pressure distribution and drawing depth at Cross
section 1 .......................................................................................... 62
Figure 3.10 Contact pressure distributions upon various lubrication
coefficients along Cross-section 1 .................................................. 64
Figure 3.11 Contact pressure distributions upon various binder pressure
xiv
loads along Cross-section 1 ............................................................ 65
Figure 3.12 Tool wear distributions upon various die coating method with
lubrication coefficient 0.10 ............................................................. 67
Figure 3.13 Maximum production volume until the occurrence of local wear
along Cross-section 1 ..................................................................... 67
Figure 3.14 Comparison of major strain results from AutoForm and Abaqus
software with experimental results ................................................. 69
Figure 4.1 Meshed finite element model in the deep-drawing simulations ..... 77
Figure 4.2 Dimensions and parameters of finite element model ..................... 78
Figure 4.3 Undeformed model after Step 3 ...................................................... 85
Figure 4.4 Deformed model after Step 4 .......................................................... 86
Figure 4.5 Deformed model during Step 5 in early stage ................................ 87
Figure 4.6 Deformed model during Step 5 in middle stage ............................. 88
Figure 4.7 Deformed model during Step 5 in late stage .................................. 89
Figure 4.8 Fully-deformed model after Step 5 ................................................. 90
Figure 5.1 Fuji prescale film types and corresponding pressure range ............ 94
Figure 5.2 Erichsen sheet metal tester ............................................................. 96
Figure 5.3 Schematic of Erichsen sheet metal tester........................................ 96
Figure 5.4 Steps in channel test (black: mild steel strip, red: prescale films) .. 99
Figure 5.5 Placement of prescale film.............................................................. 99
Figure 5.6 Comparison of contact pressure distributions obtained from tests
and simulations ............................................................................. 101
Figure 6.1 Three regular types of die radius profile....................................... 104
Figure 6.2 Contact pressure over die radius with CR5 profile ....................... 107

xv
Figure 6.3 Contact pressure over die radius with CR10 profile ..................... 107
Figure 6.4 Contact pressure over die radius with CR15 profile ..................... 108
Figure 6.5 Cause of high contact pressure of standard circular profiles ........ 108
Figure 6.6 Wear work over die radius with standard circular profiles ........... 109
Figure 6.7 Contact pressure over die radius with HER5r10 profile ................ 110
Figure 6.8 Contact pressure over die radius with HER5r15 profile ................ 111
Figure 6.9 Cause of high contact pressure of high elliptical profile ............... 111
Figure 6.10 Wear work over die radius with high elliptical profile .................. 112
Figure 6.11 Contact pressure over die radius with FER10r5 profile ................ 113
Figure 6.12 Contact pressure over die radius with FER15r5 profile ................ 113
Figure 6.13 Cause of high contact pressure of flat elliptical profile ................. 114
Figure 6.14 Wear work over die radius with flat elliptical profiles .................. 114
Figure 7.1 Wear work over die radius with various lubrication coefficients
for three die radius arc profiles ..................................................... 121
Figure 7.2 Wear work over die radius with various binder holder forces
for three die radius arc profiles ..................................................... 123
Figure 7.3 Wear work over die radius with various Young’s modulus of die
for three die radius arc profiles ..................................................... 124
Figure 7.4 Wear work over die radius with various clearances between die
and punch for three die radius arc profiles ................................... 126
Figure 7.5 Wear work over die radius with various punch radius for three
die radius arc profiles ................................................................... 128
Figure 7.6 Wear work over die radius with various punch diameters for
three die radius arc profiles .......................................................... 129

xvi
Figure 7.7 Wear work over die radius with various blank thicknesses for
three die radius arc profiles .......................................................... 131
Figure 8.1 GUI for “Geometry” created using Python programming
language ........................................................................................ 136
Figure 8.2 GUI for “Process Parameters” created using Python
programming language ................................................................. 137
Figure 8.3 GUI for “Simulation Setting” created using Python
programming language ................................................................. 138
Figure 8.4 Die radius profile .......................................................................... 138
Figure 8.5 Accumulated wear work along die radius .................................... 138
Figure 8.6 Flow chart of proposed algorithm ................................................ 138
Figure 8.7 Divisions of die radius profile ...................................................... 138
Figure 8.8 Positions of division points of optimised curve ............................ 138
Figure 8.9 Wear work over die radius for CR5 and optimised curves ........... 138

xvii
LIST OF TABLES
Table 3.1 Material properties of reinforce rear suspension support ................. 56
Table 4.1 Material properties of mild steel blank and die ................................ 80
Table 5.1 Material properties and fitted values of K, e, n of mild steel ........... 98
Table 5.2 Comparison of locations of contact pressure peaks from 0° .......... 101
Table 6.1 Material properties of DP780 blank and die .................................. 104
Table 6.2 Various die radius profiles used in simulations .............................. 105
Table 7.1 Material properties of DP780 blank and die ................................... 118
Table 7.2 Die radius profiles in simulations .................................................... 118
Table 7.3 Control parameters in simulations ................................................... 119
Table 7.4 Impacts of control parameters on wear work ................................. 133
Table 8.1 Material properties of DP780 blank and die .................................. 143
Table 8.2 Effective radius R for CR5 and optimised curves .......................... 145
Table 8.3 Comparison of wear work of un-optimised circular profile with
optimised one ................................................................................. 147

1
CHAPTER 1 INTRODUCTION
1.1 Background and Significance of Research
Sheet metal stamping is a process to stretch a part over a punch of complicated
shape in a draw die [1]. Due to its efficiency in bulk forming operations, sheet
metal stamping is widely implemented in automobile industries to convert sheet
metal into exterior and interior parts, such as auto-body panels and a variety of
appliance parts, with prescribed sizes and shapes (Figures 1.1 and 1.2). A rapidly
changing automobile market demands high precision and perfect appearance of
finished parts, soft flexibility of new materials as well as shortened lead time and
decreased production costs in whole production-cycles.
Compared with other parts produced by bulk forming operations, the automobile
parts with complex three-dimensional shapes are desired to meet (i) high
dimensional accuracy to ensure the compatibility and interchangeability in
subsequent welding and painting operations, and (ii) perfect surface appearance,
especially for exterior auto-body panel, to eliminate wrinkle, corrugation,
indentation and scratching. As the material flow in sheet metal forming mainly
depends on the sliding and bending friction between a workpiece and
corresponding die/punch, wear of tools caused by high normal contact pressure
and sliding distances could seriously influence dimensional accuracy and surface
appearance of finished parts, which results in high scrap rate of workpieces.

2
Figure 1.1 Automotive Stamping Die [2]
Figure 1.2 Body side components formed by stamping process [3]
Emerging new materials, such as advanced high strength steels (AHSS), are used
in sheet metal stamping, which involves higher contact pressure and temperature
at the tool-workpiece interface than conventional materials. It leads to increased
possibility of potential tool wear and decreased maximum production volumes
without occurrence of tool wear if suitable protection measurements, such as

3
coatings and hardness treatments, are not applied under efficient investigation of
the mechanism of tool wear.
It is impossible to shorten lead time and decrease production cost without
determination of the extent of tool wear. Unexpected tool changes caused by wear
usually result in unacceptable down times and increased die maintenance cost
with extra budgets.
Thus, tool wear of sheet metal stamping dies is becoming a major obstacle for
industries to meet the above demands from automotive markets. Due to the
complicated geometric, material and nonlinear contact characteristics in the
deformation of automotive parts, it is rather time-consuming and costly to
research the mechanism of tool wear and predict the extent of tool wear by means
of try-out techniques based solely on conventional trial and error and engineers’
experiences. To overcome limitations of traditional methods, a prediction model is
required to be established based on numerical simulations and validated by wear
tests.
1.2 Objectives and Scope of Research
A typical die assembly of sheet metal stamping consists of a punch, a draw die
and a binder. During a stamping operation, several contact pairs are established
between one of the components in the die assembly and sheet metal blank. The
contact pair of draw die and sheet metal blank is the most critical pair, because
both stretching and bending occur in the contact zone formed by the pair. The tool
surface in the contact zone is exposed to severe wear conditions with high contact

4
pressure and long sliding distance compared with the tool surface in other contact
pairs.
Early work has shown that modification of the geometry of the draw die profile
could improve the contact condition between the draw die and sheet metal blank
and reduce the tool wear. Several researchers have investigated relationship
between various draw die profiles and tool wear distribution. Due to the limitation
and diversity in their experiments and numerical simulations in early years, some
results obtained from these researches are not consistent with each other [4, 5].
Moreover, these previous researches were mainly limited to sheet metal stamping
with conventional materials.
To overcome these limitations, this research presents a comprehensive
investigation, employing the latest experimental equipments and numerical
simulation technologies, to study the influence of draw die geometry on the wear
distribution over the draw die radius for advanced high strength steels (AHSS).
The work presents a methodology for optimising the draw die geometry to reduce
wear using numerical and experimental methods.
Specifically, the research aims to achieve the following objectives:
(1) To predict and identify critical tool worn area on GM Holden’s sheet metal
forming die using AutoForm simulation software;
(2) To establish a numerical tool wear prediction model of deep-drawing process
using Abaqus simulation software for a common part and perform
experimental validation by a series of channel bending test;

5
(3) To determine the relationship between different die profile shape and tool
wear distribution for deep-drawing process;
(4) To determine the relationship between different control parameters (with the
same type shape, e.g. elliptical, circular) and tool wear distribution for
deep-drawing process;
(5) To develop a specialised algorithm for achieving minimised and uniform wear
distribution by changing the die profile shape for deep-drawing process using
Python programming language.
1.3 Outlines of Thesis
The thesis is composed of nine chapters, eight of which follow on from this
introduction. Chapter 2 conducts a literature review of the current status of
researches and developments in the area of tool wear prediction for sheet metal
stamping.
Chapter 3 presents tool wear predictions on a particular automotive sheet metal
forming die and recommended protections of the tool surface under the initial
production conditions as obtained from AutoForm simulation software. Effects of
lubrication coefficients, binder pressure loads and die coating on tool wear
distributions were investigated as well. It is concluded that the areas that are
most sensitive to tool wear occur at the locations corresponding to the large
gradient of drawing depth.
Chapter 4 describes a numerical tool wear prediction model developed using the
commercial software package Abaqus simulation software to study the tool wear

6
distributions for more common stamping parts.
Chapter 5 outlines a series of channel bending tests to validate the prediction
model presented in Chapter 4. The experimental equipments, procedures and
validation results for testing are detailed.
Chapter 6 investigates various geometries of radius arc profiles, including
standard circular profiles, high elliptical profiles, and flat elliptical profiles using
the tool wear prediction model developed in Chapter 4, and the contact pressure
distribution and tool wear work along the radii were determined. Several
significant suggestions were concluded from the investigation.
Chapter 7 presents effects of control parameters, such as blank geometry, punch
geometry, deep-drawing process parameters and tool material, on wear behaviour
in deep-drawing for various shape of die radius, which provides guidelines for
impacts of these parameters.
Chapter 8 develops a specialised algorithm for optimising the die profile shape for
deep-drawing process using Python programming language, which leads to a
minimised and uniform tool wear distribution.
Chapter 9 draws conclusions from the outcomes of the research program and
details recommendations for further work to supplement the techniques outlined
in this thesis.

7
CHAPTER 2 LITERATURE REVIEW
2.1 Overview
In this Chapter, the background of sheet metal stamping is introduced in Section
2.2. Characteristics and wear behaviours of advanced high strength steel are
described in Section 2.3. Then, in Section 2.4, tool wear mechanisms are briefly
described. The various tool wear experimental methods are presented in Section
2.5. Section 2.6 introduces recent research and developments in tool wear
prediction for sheet metal forming process using various coatings, lubricants,
alternative materials, tool wear models and die radius geometries. Section 2.7
summarises the finding in the literature review and identifies the areas of research,
which form the basis of the present research.
2.2 Sheet Metal Stamping
2.2.1 Introduction
Sheet metal stamping is a process of stretching a sheet metal blank over a punch
of more complicated shape in a draw die [6]. A typical assembly of sheet metal
stamping consists of a punch, a die and a binder. Figure 2.1 shows a simple sheet
metal stamping die. A blank is clamped at the edges by the binder using one action
of the press. Drawbeads on the binder surface optimise strain distributions in the

8
subsequent operations. The punch then travels down through the binder into the
die cavity and presses the blank until the required shape of the part is formed.
Figure 2.1 Cross-sectional view of a simple sheet metal stamping die [6]
2.2.2 Contact zones in sheet metal forming
One of the most common sheet metal forming operations is deep drawing as
shown in Figure 2.2. In a deep drawing operation, there are five contact zones
with different properties. Contact zones between the punch and the blank, as
labelled as 1, 2, 3, are characterised by a low relative sliding velocity, in the order
of 10-4 m/s, which means that the punch and the blank are moving at almost the
same velocity. However, in Contact Zone 4 between the die and the blank and
Contact Zone 5 between the blank holder and the blank, the sliding velocity is of
the order from 10-3 m/s to 10-1 m/s, which is relatively high.

9
At contact Zone 4, i.e. the radius of the die, a combination of stretching and
bending occurs and the contact pressure exceeds 100 MPa. Both boundary
lubrication and mixed lubrication occur in Contact Zone 4. Boundary lubrication
is a condition of lubrication in which the friction and wear behaviour are
determined by the properties of the surfaces and by the properties of fluid
lubricants other than their bulk viscosity, while mixed lubrication is a condition of
lubrication in which the friction and wear behaviour are determined by the
properties of the surfaces and by the viscous and non-viscous properties of fluid
lubricants [7]. The contact condition in Contact Zone 4 is most severe in all
contact zones as its predominant lubrication type is a combination of boundary
lubrication and mixed lubrication [8]. Therefore, tool wear mechanism at radius
portion of a die is important for tribological study of sheet metal forming.
Figure 2.2 Contact zones in deep drawing [8]
2.3 Advanced High Strength Steel
2.3.1 Dual phase (DP) steel
Advanced high-strength steels (AHSS) are used extensively in the automotive
10
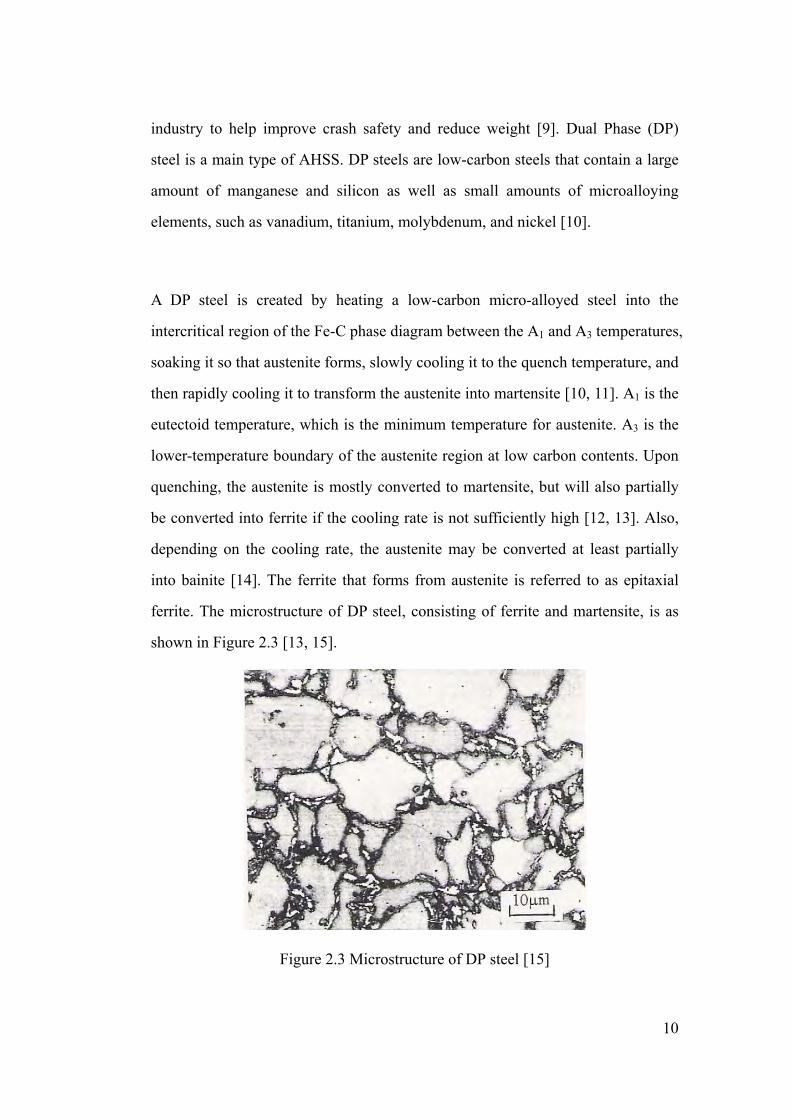
industry to help improve crash safety and reduce weight [9]. Dual Phase (DP)
steel is a main type of AHSS. DP steels are low-carbon steels that contain a large
amount of manganese and silicon as well as small amounts of microalloying
elements, such as vanadium, titanium, molybdenum, and nickel [10].
A DP steel is created by heating a low-carbon micro-alloyed steel into the
intercritical region of the Fe-C phase diagram between the A1 and A3 temperatures,
soaking it so that austenite forms, slowly cooling it to the quench temperature, and
then rapidly cooling it to transform the austenite into martensite [10, 11]. A1 is the
eutectoid temperature, which is the minimum temperature for austenite. A3 is the
lower-temperature boundary of the austenite region at low carbon contents. Upon
quenching, the austenite is mostly converted to martensite, but will also partially
be converted into ferrite if the cooling rate is not sufficiently high [12, 13]. Also,
depending on the cooling rate, the austenite may be converted at least partially
into bainite [14]. The ferrite that forms from austenite is referred to as epitaxial
ferrite. The microstructure of DP steel, consisting of ferrite and martensite, is as
shown in Figure 2.3 [13, 15].
Figure 2.3 Microstructure of DP steel [15]

11
DP steels have a bake hardening effect, which is an important benefit compared to
conventional higher strength steels. The bake hardening effect is the increase in
yield strength resulting from elevated temperature aging (created by the curing
temperature of paint bake ovens) after prestraining (generated by the work
hardening due to deformation during stamping or other manufacturing process).
2.3.2 Tool wear in stamping of AHSS
AHSS can result in severe loading, and therefore contact pressure, to traditional
die structures with more than double tensile strengths [16-18] at radii and draw
wall features. Such high local stresses have resulted in severe local die wear.
Five principal types of tool failure related to tool wear (Figure 2.4) were reported
as follows [9]:
(1) Wear is damage to a solid surface involving loss or displacement of material.
Wear is caused by sliding contact between the workpiece and tool. Two main
types of wear are abrasive, caused by hard particles forced against and moving
along a solid surface, and adhesive, caused by localized bonding between
contacting solid surfaces and leading to material transfer between these
surfaces.
(2) Plastic deformation is caused by contact pressure exceeding the compression
yield stress of the tool material.
(3) Chipping is a result of stresses exceeding the fatigue strength of the tool
material.

12
(4) Cracking is caused by stresses exceeding the fracture toughness of the tool
steel.
(5) Galling is a form of damage caused by sliding of two solids. It often includes
plastic flow, material transfer, or both.
Figure 2.4 Five principal types of tool failure [9]
Billur [9] also summarised the four main factors that have an effect on these
failures:
(1) Contact pressure: Local contact pressure between the sheet and tool affects all
types of tool failure. As stamping of AHSS requires increased contact pressure,
the probability to observe tool failures increases significantly compared to
stamping milder steel grades. For a given sheet material, contact pressure can
be reduced by die design, such as using larger radii or reducing the sheet
thickness.

13
(2) Surface quality: Although the surface of the tool is much smoother than the
surface of the sheet, the tool’s surface quality affects galling. Polishing the
tool surfaces before and after coating helps to reduce galling. The sheet’s
roughness has little influence on tool failure.
(3) Tool coating: The proper coating with a low coefficient of friction is crucial to
reduce galling and tool wear.
(4) Lubrication: Forming AHSS requires better-performing lubricants, possibly
with extreme-pressure (EP) additives, because of the high contact pressure and
temperature that occur during the process.
2.4 Tool Wear Mechanism
2.4.1 Introduction
Wear is the surface damage or removal of material from one or both of two solid
surfaces in a sliding, rolling, or impact motion relative to one another. Scientific
studies of wear developed little until the mid-twentieth century. In sheet metal
stamping, adhesive wear and abrasive wear are two primary types of wear [19].
Raymond [20] recognised the following characteristics of wear:
(1) Wear is a system property, not a material property;
(2) Materials can wear by a variety of mechanisms and combinations of
mechanisms, depending on the tribosystem in which it is used;
(3) Wear behaviour is frequently nonlinear;

14
(4) Transitions can occur in wear behaviour as a function of a wide variety of
parameters.
2.4.2 Adhesive wear
Adhesive wear is a type of wear due to localised bonding between contacting
solid surfaces leading to material transfer between two surfaces or loss from either
surface [7]. Contact surfaces between a sheet metal blank and its die always
exhibit some degree of roughness instead of being completely smooth. During the
sliding contact between a die and a blank in a sheet metal stamping, fracture of the
die usually occurs if internal stresses are so high that the fracture criterion of the
material of the die is satisfied at some contact points.
Figure 2.5 Formation of an adhesive junction [21]
Asperities on the contact surfaces form contact spots at the interface of the blank
and die. Deformations appear firstly at the contact spots characterised by high
normal and tangential stresses. A series of adhesive junctions is created as a result
of two contact surfaces being pressed together (Figure 2.5). Bonding occurs at
these junctions and the tips of the softer asperities are sheared and adhered to the
harder surface. These tips may subsequently be detached and become wear
15
particles or fragments. Severe types of adhesive wear are often referred to as
galling, scuffing, welding or smearing.
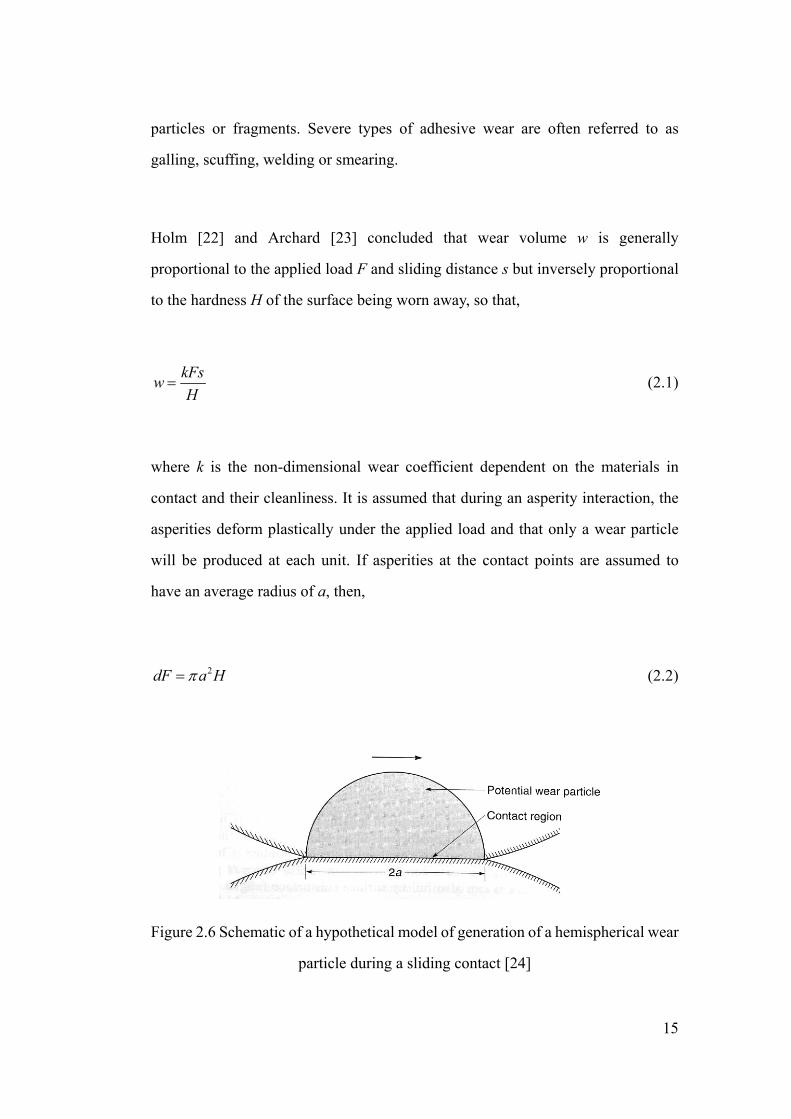
Holm [22] and Archard [23] concluded that wear volume w is generally
proportional to the applied load F and sliding distance s but inversely proportional
to the hardness H of the surface being worn away, so that,
kFswH
(2.1)
where k is the non-dimensional wear coefficient dependent on the materials in
contact and their cleanliness. It is assumed that during an asperity interaction, the
asperities deform plastically under the applied load and that only a wear particle
will be produced at each unit. If asperities at the contact points are assumed to
have an average radius of a, then,
2dF a H (2.2)
Figure 2.6 Schematic of a hypothetical model of generation of a hemispherical wear
particle during a sliding contact [24]
16
If a particle is assumed to be hemispherical in shape with radius equal to the
contact radius (Figure 2.6), then,
323
dw a (2.3)
Finally, contact is assumed to remain in existence for a sliding distance ds equal to
2a, after which it is broken and the load is taken up by a new contact, so that,
13
dw dFds H
(2.4)
13
Fs kFswH H
(2.5)
Archard’s equation is valid for dry contacts only. In the case of lubricated contacts,
where wear is a real possibility, certain modification to Archard’s equation is
required [21].
2.4.3 Abrasive wear
Abrasive wear on a die surface is a common phenomenon in sheet metal stamping
because the hardness of a die is larger than that of a sheet metal blank. Generally,
abrasive wear is divided into two types: two-body abrasive wear and three-body
abrasive wear [24]. In two-body abrasive wear, abrasive grits are embedded into
one of the contact surfaces to scratch the other one, or asperities of the harder

17
surface slide on the softer one to damage the interface. In three-body abrasive
wear, some small particles of abrasive are trapped between two surfaces but are
free to move with respect to both surfaces, and are sufficiently hard to abrade one
or both of the contact surfaces. In many cases, the wear mechanism starts with
adhesive wear, which generates wear particles that are trapped at the interface,
resulting in a three-body abrasive wear [25].
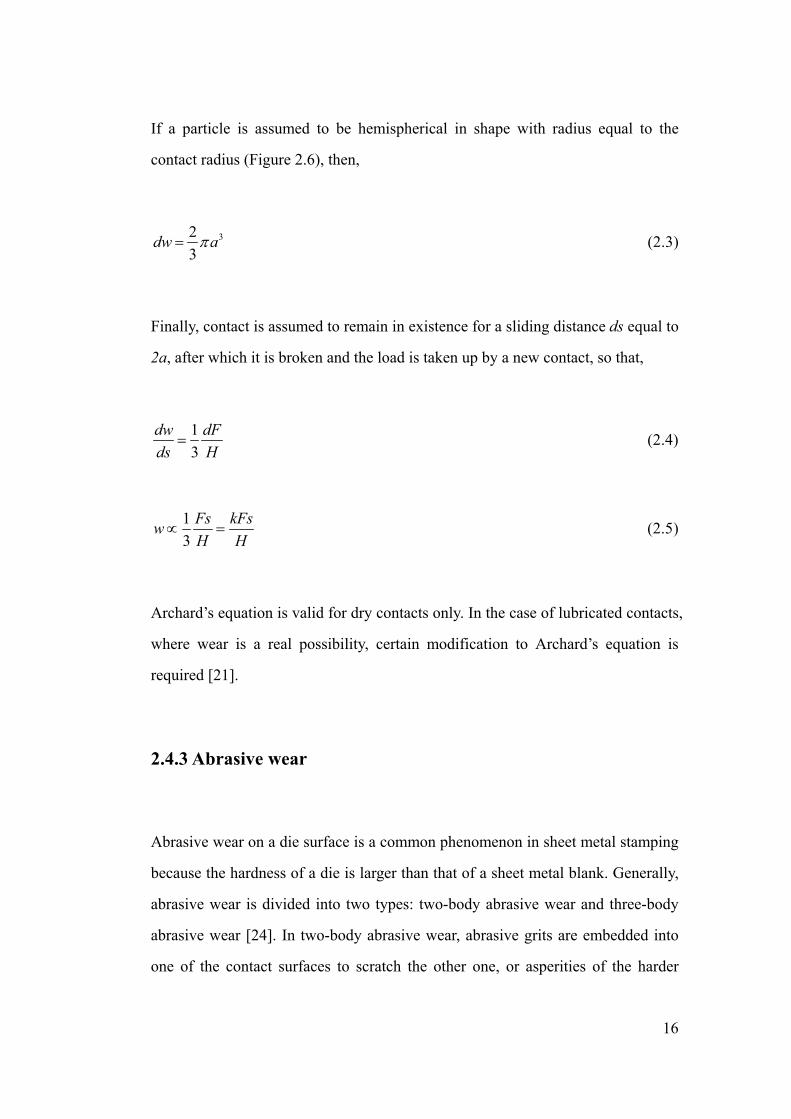
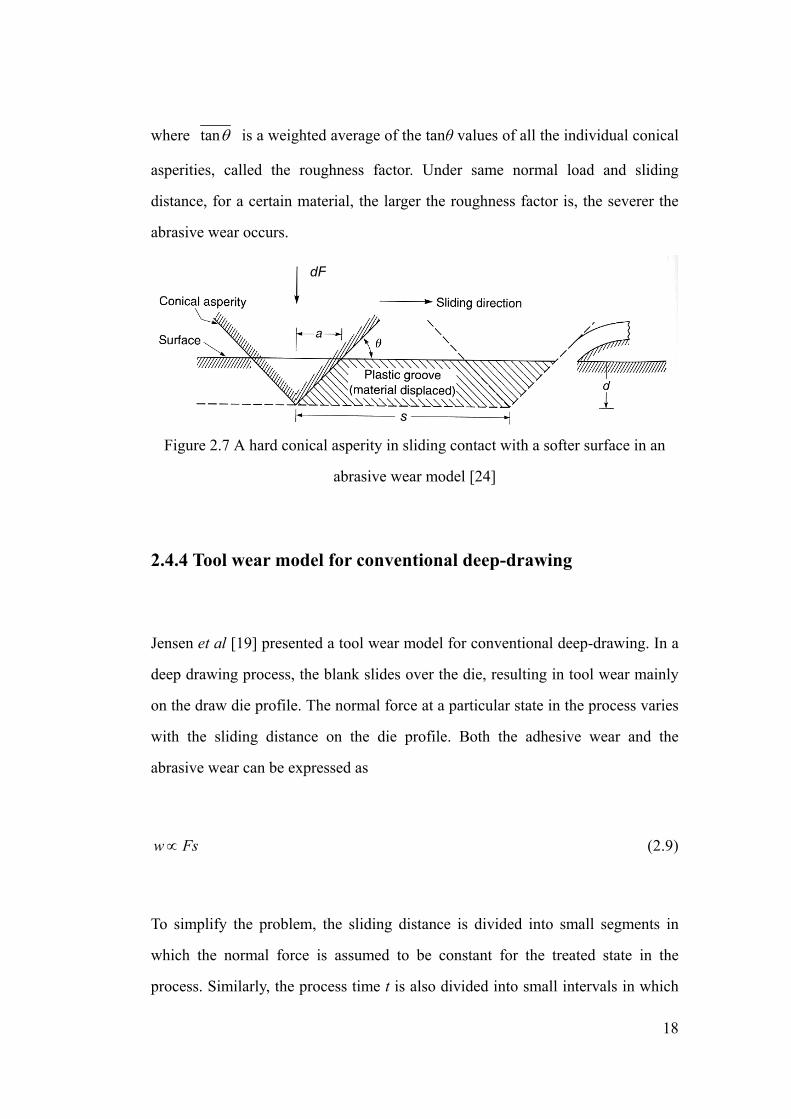
A simplified model for abrasive wear was developed by Rabinowicz [26], in
which one surface consists of an array of hard conical asperities sliding on a softer
and flat surface and ploughs a groove of uniform depth. Figure 2.7 shows a single
conical asperity, with roughness angle of θ, creating a track through the softer
surface with a depth of d and width of 2a. It is assumed that the material has
yielded under the normal load dF, so that,
212
dF a H (2.6)
where H is the hardness of the softer surface. The wear volume w displaced in a
distance s is
2 (tan )dw a s (2.7)
2 tanFswH
(2.8)
18
where tan is a weighted average of the tanθ values of all the individual conical
asperities, called the roughness factor. Under same normal load and sliding
distance, for a certain material, the larger the roughness factor is, the severer the
abrasive wear occurs.
Figure 2.7 A hard conical asperity in sliding contact with a softer surface in an
abrasive wear model [24]
2.4.4 Tool wear model for conventional deep-drawing
Jensen et al [19] presented a tool wear model for conventional deep-drawing. In a
deep drawing process, the blank slides over the die, resulting in tool wear mainly
on the draw die profile. The normal force at a particular state in the process varies
with the sliding distance on the die profile. Both the adhesive wear and the
abrasive wear can be expressed as
w Fs (2.9)
To simplify the problem, the sliding distance is divided into small segments in
which the normal force is assumed to be constant for the treated state in the
process. Similarly, the process time t is also divided into small intervals in which
dF
s

19
the normal force can be assumed constant. Thus,
, ,1
n
x t x t xt
w F s
(2.10)
Because the wear depth h is more significant than the wear volume, Equation 2.10
can be expressed as below by dividing both sides by the area of each division,
then,
, ,1
n
x t x t xt
h P s
(2.11)
where P is the contact pressure.
2.5 Test Methods for Tool Wear Prediction
2.5.1 Pin-on-disk test
Pin-on-disk test (Figure 2.8) is a widely-used simple wear test to investigate the
wear resistance of tool surfaces and surface coatings. A test ball is drawn over a
disk surface with several revolutions in the same track at a pre-defined normal
force and velocity. The test set up allows for the direct measurement of the normal
and tangential (friction) forces during the test and by measuring the wear volume
as a function of sliding distance the wear rate and the wear coefficient can be

20
determined [16, 26, 27]. SRV (Schwingung Reibung Verschlei reciprocating
friction and wear) tester is one of several configurations of pin-on-disk test
systems, and same surfaces of die and sheet materials of interest are in contact
during the whole test [28].
Figure 2.8 Pin-on-disk test [16]
Although the sliding speeds and normal forces can be adjusted to a level that is
similar to sheet metal forming processes, the effect of plastic deformation is
ignored in these tests. Therefore, the progression of tool wear in sheet metal
stamping may not be presented by this test [16].
Analysis of the pin-on-disk test is standardized in ASTM G99-05, “Standard Test
Method for Wear Testing with a Pin-on-disk Apparatus” with respect to volume
loss [29]. The volume loss can be measured directly from the specimen
dimensions before and after the test, or it can be calculated from mass loss. If
galling is present, volume loss may not reflect the tool wear, so this test method
should not be used [30].

21
2.5.2 Modified bending-under-tension-test
Eriksen [4] utilised a modified bending-under-tension test to investigate the
influences of die edge geometry in a standard deep drawing process on the
maximum wear and the wear distribution over the die edge (Figure 2.9).
Figure 2.9 A modified bending under tension test [4]
The test material (St 1403) ⑦ was wound in a coil ①. The material was drawn
into the lubrication system ② and then into the wedge dies ③. After the wedge
die, the strip was bent 90° over a cylindrical die ④. The strip was pulled by a
hydraulic cylinder ⑥ which had a clamping system ⑤ that held the strip. After
the clamping system, the strip was transferred to a cutting machine ⑧, which cut
the strip into small pieces.

22
2.5.3 Bending-under-tension test
Alinger and Van Tyne [31] evaluated five die materials during repeated
stretch-bend sheet steel deformation using the bending-under-tension test with
each of three sheet steel surfaces. Figure 2.10 shows the schematic of the
bending-under-tension test. Approximately 140 tests have been performed on a
fresh surface of each die using each sheet material. The dies, made from a number
of alternative materials, are 25.3 mm diameter cylinders, with 360° of testing
surface. It was concluded that the tungsten carbide die material performed the best
in the wear study.
Figure 2.10 Schematic of bending-under-tension test [31]
2.5.4 Deep-drawing process-simulator
Boher et al [32] developed an experimental device, named the deep-drawing
process-simulator (DDPS), to study the tribological interaction between the metal

23
strip and the tool in the radius portion of a die in deep drawing (Figure 2.11). A
steel strip, unrolled directly from a coil, was in contact with a portion of the radius
tool. The flat blankholder and the die radius constituted the working system of
DDPS. A rolling up engine pulled the strip through the working system. The
loading of the die radius was a result of the restraining forces H and the pulling
forces T. The blank holder forces were controlled by a hydraulic cylinder. The
sliding of the steel strip over the die radius varied in accordance with a defined
angle α which simulated the running of the strip steel on the tool. The strip exit
angle α was fixed in relation to the angular position of the reversing cylinder. A
low-carbon steel sheet and an X160CrMoV12 steel die radius were used in the
experiments.
Figure 2.11 Schematic of deep-drawing process-simulator [32]
Two mechanisms of surface degradation were determined on the die radius
portion through micrographs: adhesion and ploughing. It was found that the tool
wear on the die radius was localised in two areas but varied in intensity depending
on the exit angle between the sheet and the die radius, which was in accordance
with the high contact pressure areas obtained from the numerical simulation. For a
strip exit angle of 70° and 80°, the main damage at the surface of the die radius
was adhesion, while for a strip exit angle of 90°, ploughing dominated the main

24
damage. The degradation evolution reveals that the adhesion occurred after the
first cycle and ploughing was observed after 500 or 700 cycles.
2.5.5 Slider-on-flat-surface tribometer
Gaard et al [33] designed a slider-on-flat-surface (SOFS) tribometer (See Figure
2.12) to investigate the tool wear mechanism in sheet metal forming. In the test, a
tool was pushed against a sheet material placed on a solid table with a normal load,
applied with a servo engine and slid with a velocity v in the y-direction. A
double-curved tool geometry with radii of 5 and 25 mm was utilised. At the end of
a track, the tool was lifted and returned to the starting position and moved a
selected distance in the x-direction, after which the process was reiterated. During
testing, the normal and friction force was measured with a sampling frequency of
1 kHz using two separate force transducers, A and B, respectively. Transducer B,
used for monitoring the friction force, was mounted as close as possible to the
sheet surface to minimise torque due to friction. To indicate the presence of wear,
the coefficient of friction was monitored and continuously plotted during the
experiments, along with the observation of the sheets.
The worn surface morphologies and mechanisms of a deep drawing die were
compared with worn surfaces obtained by the SOFS tribometer. It identified
abrasion and adhesion as the main surface damage mechanisms on the
investigated dies. Transfer of sheet material and abrasive scratching were found as
the main damage mechanism of the dies.

25
Figure 2.12 Schematic presentation of the SOFS tribometer [33]
2.5.6 Twist compression test
Kim et al [34] utilised a twist compression test (TCT) to investigate galling, a
form of adhesive wear, in forming galvanised advanced high strength steel (AHSS)
in automotive stamping. Figure 2.13 shows the schematic of TCT. In the TCT, a
rotating annular tool was pressed against a fixed sheet metal specimen while the
pressure and torque are measured. To determine the effect of interface temperature
upon lubricant effectiveness and galling, the temperature near the tool-workpiece
interface was measured as shown in Figure 2.14. A dummy sheet of 1 mm
thickness with a slot for the thermocouple was used. Thus, the temperature was
measured at the bottom surface of the sheet specimen used in the test. The
specimen and the dummy sheet were held in position with two fixture wings.

26
Figure 2.13 Schematic of twist compression test [34]
Figure 2.14 Temperature measurement using a thermocouple [34]

27
2.5.7 U-Bending test
Sato and Besshi [35] carried out a U-bending test is carried out for the evaluation
of anti-galling performance of the tools in aluminium sheet forming (Figure 2.15).
Bending tests were carried out with a high-speed hydraulic press, the working
speed used in the test being mainly 10 mm s-1, but for comparison, a high speed of
100 mm s-1 was used also. Lubricant was applied to the surface of sheet by
brushing. All tools were cleaned with acetone before each series of tests.
Figure 2.15 Schematic view of U-bending test [35]
Nilsson, Gabrielson and Ståhl [36] also utilised U-bending test to evaluate the
wear resistance for three different zinc-alloys with different primary phase as
die-tool material in forming process equipment. Wear tests were conducted in an
excenter press, which was equipped with a die-holder for the die-tools (Figure
2.16). The die-holder was equipped with a monitoring system that allows
measurements during the forming process. Measurements during pressing

28
operation were performed regarding press force and drawing height. Outside the
excenter press, measurements for every 1000 strokes were performed on the loss
of weight, surface roughness and radii alteration of the die-tools. The principle for
the U-bending process is shown in Figure 2.17. Two different sheet-metal
materials, aluminium AA6016-T4 and steel 220RP, with different wear
characteristics have been investigated.
Figure 2.16 U-bending equipment showing die-holder with inserts [36]
Figure 2.17 Principle for U-bending test [36]

29
2.5.8 Strip-drawing test
Jonasson et al [37] conducted a strip-drawing test to study shotblasted and
electrical-discharge-textured rolls with regard to frictional behavior of the rolled
steel sheet surfaces. In this test, originally developed by Wojtowicz [38], a steel
strip is pulled between a pair of flat tools while a normal force is applied. In the
strip-drawing test all deformation occured in the asperities by replacing one of the
tools with a cylinder. A lower contact force gave a larger spread on friction levels.
Figure 2.18 strip-drawing test [37]
Hortig and Schmoeckel [39] also performed a strip-drawing test to analyse of
local loads on the draw die profile with regard to wear (Figure 2.19). The
intermitting strip-drawing test with bending was a wear-test, modelling the loads
in the flange-region of a deep-drawing die. A sheet metal strip was drawn through
a model-tool consisting of blank holder and draw die. During the test the blank
holder force was kept on a constant value and the friction force on the blank
holder and the total drawing force are measured continuously. In addition to these

30
global measurements, the local wear marks on the tool surface were examined in
long-time tests to check the plausibility of the calculations. In the experiments
with steel sheet material, TiC/TiN coatings on 1.2379 steel were used, because the
coating shown visible change of colour by means of tribo-oxidation according to
local tribological load. Experiments with aluminium sheet material showed
significant influence of the local tribological load on local galling. For localisation
of highly loaded areas, a minimal lubrication was used in the tests with aluminium.
The WCC coating used for the experiments showed beginning contamination with
aluminium in the highly loaded regions.
Figure 2.19 strip-drawing test [39]
2.5.9 Draw bead test
Sanchez [40] carried out draw bead test to measure friction on sheet metal under
plane strain. The test method follows Nine’s original work in draw bead
simulation (DBS) [41]. The sheet metal is pulled to flow between three cylindrical
pins of equal radii (Figure 2.20). To determine a coefficient of friction, two test
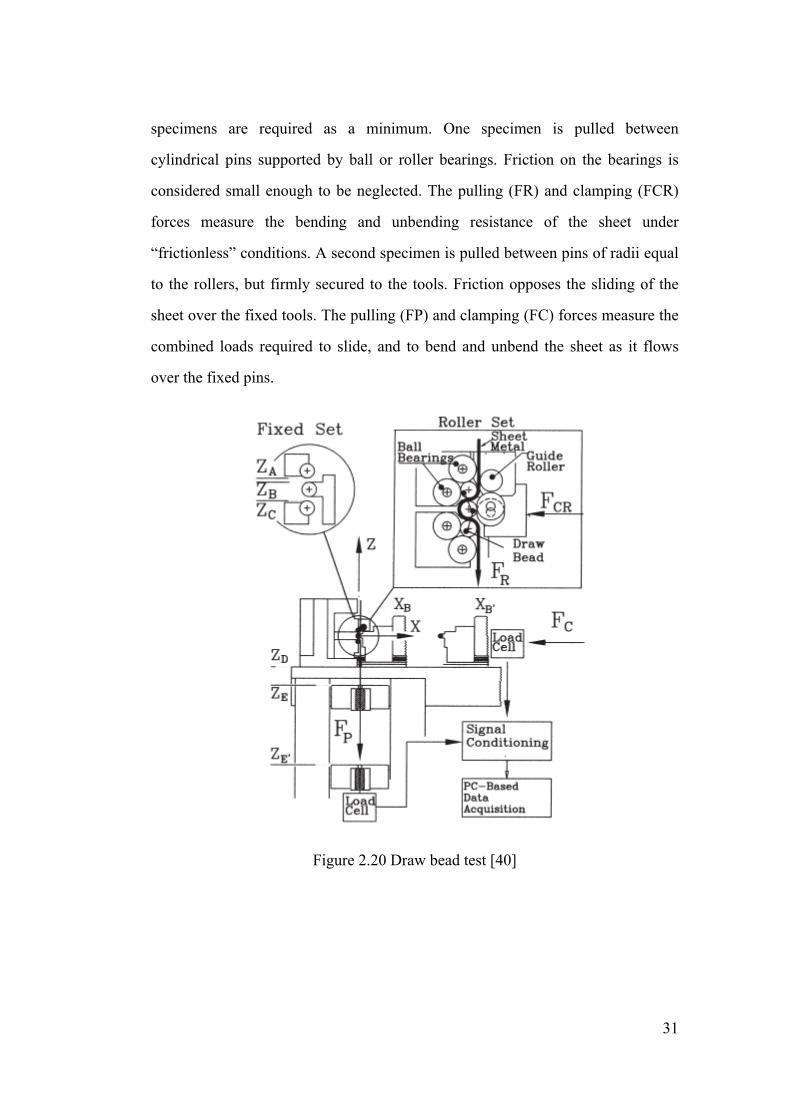
31
specimens are required as a minimum. One specimen is pulled between
cylindrical pins supported by ball or roller bearings. Friction on the bearings is
considered small enough to be neglected. The pulling (FR) and clamping (FCR)
forces measure the bending and unbending resistance of the sheet under
“frictionless” conditions. A second specimen is pulled between pins of radii equal
to the rollers, but firmly secured to the tools. Friction opposes the sliding of the
sheet over the fixed tools. The pulling (FP) and clamping (FC) forces measure the
combined loads required to slide, and to bend and unbend the sheet as it flows
over the fixed pins.
Figure 2.20 Draw bead test [40]

32
2.5.10 Slider test system
Cora, Namiki and Koc [42] developed a slider test system to assess Wear
performance of alternative stamping die materials. This test system is based on the
use of precise and controlled motion of a vertical machining centre (HAAS VF-3
CNC)’s x-, y- and z-axes and spindle (no rotation).A load sensor was mounted on
the spindle through a holder which also houses the die sample of interest. AHSS
sheet blanks are laid on the x–y table with clamps at four corners as can be seen in
Figure 2.21. CNC was programmed for the precise pressing of die sample and
one-way scratching/sweeping on the AHSS sheet blank. Normal force occurring
at the die and blank interface was recorded during the tests.
Figure 2.21 Slider test system [40, 42]

33
Figure 2.22 Die sample dimensions and its actual photo on wear tracks [42]
Figure 2.22 shows the die sample dimension and an actual picture with the wear
tracks on the sheet blank. Performance evaluation of die samples was based on the
following measurements (1) mass loss, (2) surface profile (roughness) and (3)
microscopic evaluations.
2.5.11 Acoustic emission technique
Skåre and Krantz [43] monitored wear and frictional behaviour of high strength
steel in stamping by acoustic emission (AE) technique. AE from a forming
operation contains measurable data from events such as galling, tool wear,
lubricant penetration, stick–slip, wrinkling, necking in the sheet material and
cracking in the tool or the sheet material. The detected AE is directly proportional
to the energy (mechanical) consumed between the contacting surfaces and can
therefore be used to estimate the forces acting on these surfaces. A change in the
tribological parameters, such as materials in contact, the efficiency of lubricants,
the roughness of the contacting surfaces, relative velocity between the contacting
materials and contact pressure can be monitored by AE technique. Wear tests have

34
been made using flat dies and a U-bending tool. The results indicate that the
U-bending tool can be used to study wear behaviour and it simulates forming over
the linear portion of a stamping tool. AE, punch force and tool temperature are
shown to be essential in the evaluation and understanding of the wear process.
The result shows that the surface treatment and surface quality of the tool are
important for the wear behaviour. These results indicate that it is possible to use
uncoated hardened tools provided that a minimum tool surface quality is
maintained. These results also show that hot-dip galvanised high strength steel
(HSS) wears the tool out less than uncoated HSS.
2.6 Research and Development in Tool Wear
2.6.1 Coating
Nowadays, several types of commercial film coatings prepared by chemical and
physical deposition process are commonly used to increase the tool life and
reduce the requirement for high performance lubricant in sheet metal forming
process.
Sresomroeng et al [44] evaluated the anti-adhesion performance of commercial
nitride and DLC films coated on cold work tool steel against HSS in forming
operation. The friction coefficient and wear rate of the non-coated ball (SKD11;
hardness 60±2 HRC), balls coated with TiN-PVD, TiCN-PVD, AlTiN-PVD,
Nitride+CrN and DLC have been evaluated in sliding contact against SPFH 590
(JIS) disk. The scratch and nano-indentation tests were done on each type of
coated tools to characterise the adhesive strength between the film and the

35
substrate, and the hardness and the elastic modulus, respectively. The
anti-adhesion performance of various film-coated tools in metal stamping process
was also investigated by performing U-bending experiment. The cold roll carbon
steel (JIS: SPCC) was also used to compare a material transfer problem to the case
of using HSS (JIS: SPFH590). As the results, for HSS sheet, the adhesion of
workpiece material on a non-coated die surface was detected after 49 strokes
whereas adhesion could not be found in case of stamping SPCC sheet up to 500
strokes. The TiCN, AlTiN, and Nitride+CrN films showed good anti-adhesion
performance when forming HSS, while the TiN and DLC films did not provide
the satisfied results.
Fox-Rabinovich et al [45] analysed the wear behaviour for cutting tools with
nitride PVD coatings. The chemical and phase composition as well as the
structural characteristics of TiN-based PVD versus the nitrogen pressure used
during deposition coatings were analysed using AES and XRD methods. Also the
friction and wear properties of the coatings were established under different wear
conditions. Using these results a relation between the TiN PVD coating’s wear
resistance and its ability to dissipate the energy of plastic deformation as well as
to accumulate the energy of elastic deformation were obtained by using a
nano-indentation method. Based on this work, a microhardness dissipation
parameter (MDP) was developed to serve as an indicator of a coating’s durability.
Straffelini, Bizzotto and Zanon [46] improved the wear resistance of tools for
stamping using coating by physical vapour deposition with a AlCrN layer. In the
first stage of the investigation, the progression of tool wear during a precision
stamping operation was investigated. Punches and dies wear made by a
heat-treated HSS and each operation took place in a boundary lubrication

36
condition. Observed wear was due to adhesion (with some transfer) and after
160,000 strokes micro cracking damage was also shown to start in the punch. A
commercial AlCrN (Alcrona) coating was thus selected as the PVD AlCrN
coating was reported to give optimal behaviour for a variety of tools [47-49]. The
coating was deposited on the S390 HSS tools in the mirror polished condition.
The results show that the AlCrN coating gave rise to a significant increase in the
wear resistance.
Wang et al [50] investigated material transfer phenomena and failure mechanisms
of a nanostructured Cr-Al-N coating in laboratory wear tests and an industrial
punch tool application. CrAlN and TiN coatings were deposited on AISI M2
tool steel substrate test coupons and on industrial punch tools by electron beam
plasma-assisted physical vapour deposition (EB-PAPVD). The microstructure and
morphology of the coatings were investigated by XRD, XPS, TEM, and SEM
with EDX. Pin-on-disc tribotests were conducted on the coatings against AISI
52100 steel counterface material in order to investigate their wear performance,
with particular emphasis on the material transfer phenomena during the sliding
tests. After industrial trials on piercing high strength steels, the worn uncoated as
well as CrAlN- and TiN-coated punches were also studied. The results showed
that the nanostructured CrAlN coating exhibited less material transfer and thus
better adhesive wear protection than the TiN coating under both laboratory
pin-on-disc tribotests and industrial trial conditions. It was also found that the
coating morphologies replicated the surface finish of the punch substrates, and
that local coating spallation appeared to be initiated at machining grooves on the
punches, which were detrimental to the coating lifetime.
Aizawa, Iwamura & Itoh [51] explored the effect of a number of layers and
37
bi-layer thickness on the mechanical properties by the nano-indentation technique.
Nano-lamination is a new way to make full use of multi-layered structure for
coating instead of the monolayered coating system. Different from the
conventional nano-lamination approach, where two different kinds of material
system are deposited in layers, the amorphous carbon layer, a-C:H, is alternatively
deposited with graphite-like cluster layer, resulting in an amorphous carbon base
nano-laminated coating. Higher hardness and Young's modulus are attained with
reduction of bi-layer thickness. The scratching test of this nano-laminated coating
is made to demonstrate that it has sufficient scratch load above 100 N.
Furthermore, a dry micro stamping test is performed to prove that this
nano-laminated coating has sufficient wear-toughness to make dry stamping
10,000 times in practice even if it has nearly the same Young's modulus and
hardness as the mono-layered coating. No delamination or break-away occurs on
the ironed surface of coated tools while severe delamination is observed in the
conventional mono-layered coating
Silva, Dias and Cavaleiro [52] assessed the tribological behaviour of W-Ti-(N)
thin films by pin-on-disk testing with contact geometry of uncoated and coated
100Cr6 balls sliding against uncoated different disk materials used as stamping
sheet. Different types and amounts of lubricants were used in the tests. In
non-lubricated tests, friction coefficients as high as 0.8 were achieved. For the
more ductile sheet materials (Al alloy and Zn-coated steel) strong adhesion was
observed. The best compromise between low wear rate and low friction
coefficient was achieved for N-containing coatings deposited without ion gun
assistance. In lubricated conditions, a significant decrease of the friction
coefficient down to 0.05 and a reduction of the wear coefficient in more than one
order of magnitude down to < 10−16 m2N−1 were reached in relation to
non-lubricated tests. Very good tribological results were achieved using the
38
corrosion protection oil as lubricant, with amounts usually applied for protection
of sheet materials (2 g/m2). It was found that the wear coefficient of the coated
ball decreased linearly with increasing hardness of the coating, being the best that
deposited with N contents in the range from 35% to 40%. The tribological
performance of the coated samples was approximately constant even when the
amount of used lubricant was reduced to only 25% of the initial value (0.5 g/m2).
Schramm et al [53] presented the tribological properties and dry machining
characteristics of PVD-coated carbide inserts. The mechanical properties and the
dry machining characteristics show that chromium-based cutting tools might have
sufficient potential to become a machining alternative to the state-of-the-art TiAlN
coating. It could be shown that the deposited CrxN and CrxAlyN coatings have a
poor machining performance, which could be explained by the brittle coating
structure and/or high coefficient of friction. The high hardness of both CrN and
CrAlN could not yet be completely utilized for dry machining, which can be seen
in the increased abrasive wear. In contrast, the good surface quality during
machining of SGI-50 and 42CrMo4 are encouraging for further investigations. It
is possible to improve the coating systems by changing, pre- and post-treatment of
the cemented carbide tools [54-56].
Van der Heide et al [57] conducted the wear resistance of alternative tooling
materials by a combination of forming tests at a high speed stamping line and
model wear tests using the TNO slider-on-sheet tribometer. With this tribometer,
volume loss of alternative tooling materials can be determined as a function of the
sliding distance, using sheet materials from automotive practise. Results show that
the wear rate of a soft tool material can change two orders of magnitude as a result
of the zinc layer type used. Furthermore, it is shown that the relative performance
39
of alternative tool materials is strongly related to the hardness of the (tooling and
sheet) materials. Industrial forming tests with a selection of alternative tooling
materials confirmed the model wear test results. The same ranking of the tooling
materials with respect to volume loss is obtained per sheet material.
Bressan et al [58] concluded Wear on tool steel AISI M2, D6 and 52100 coated
with Al2O3 by the MOCVD process. The wear tests by sliding and abrasion were
performed in a pin-on-disk and ball-on-disk apparatus, whose pin and ball
substrates were steels fabricated from AISI M2, D6 and 52100. From the plotted
graphs of lost volume versus sliding distance, it was observed a greater wear rate
of AISI D6 pins without coating, and this is possibly due to more severe adhesion
and delamination mechanisms. The AISI M2 and D6 pin coated with Al2O3
showed similar wear resistance and higher resistance than the uncoated D6 pin.
However, the tested sphere of AISI 52100 showed different behaviour under 20N
normal load. For both the spheres, coated with Al2O3 and uncoated, the wear rate
was similar. Nitrided M2 and D6 tool steels coated with Al2O3 showed superior
wear resistance characteristics for cold working tooling. The spheres of AISI
52100 coated with Al2O3 presented poor wear resistance due to surface defects.
Cora and Koc [59] investigated the wear performances of seven different,
uncoated die materials (AISI D2, Vanadis 4, Vancron 40, K340 ISODUR, Caldie,
Carmo, 0050A) using a robot-based die wear test system (Figure 2.23). DP600
AHSS (advanced high-strength steel) sheets were used in these tests. For the same
force levels, similar wear scars and depths were observed for all tests except for
0050A and K340 Isodur. In some part of the K340 Isodur tests, depth of wear
tracks on sheet blank was shallower and the sheet surface was shiny. It is
concluded that this material is more prone to material stacking on the surface and

40
coating might be necessary for some cases. For the Vancron 40 specimen, the
wear pattern was almost uniform along the contact surface.
Figure 2.23 Robot-based die wear test system [59]
2.6.2 Lubrication
Lubrication plays a critical role in sheet metal stamping process as it reduces
friction between the tool and blank and enhances the ability to produce a good
quality part. The lubrication fluid acts as a barrier to separate the tool surface from
the sheet material and then decreases the interface strength between the contacting
surface asperities [60]. It is important to understand the influence of the
lubrication on the tool wear distribution in sheet metal stamping, especially in
forming complicated automotive parts using AHSS. There has been extensive
research carried out to evaluate the influences of lubrication behaviour in sheet
metal processing of various materials.
Kim et al [61] presented a practical methodology that uses the deep drawing test
and finite element (FE) analysis to evaluate stamping lubricants under near

41
production conditions. In this study, five stamping lubricants (four dry film lubes
and one wet lube) were evaluated using the deep drawing test. The performance of
the lubricants were evaluated based on: (a) maximum punch force measured, (b)
the maximum applicable blank holder force (BHF), (c) the draw-in length, (d) the
perimeter of flange after test, (e) the change of surface roughness, and (f) the
inspection of surface topography. The coefficient of friction for each lubricant
tested was determined through the FE-based inverse analysis by matching the
predicted and measured values of the load-stroke curve and the draw-in length.
This study showed that one of the tested lubricants was most effective, regardless
of test speed and the magnitude of BHF. The methodology used was shown to be
effective in evaluating various lubricants for sheet metal forming and accurately
differentiating their performances.
Chandrasekharan et al [62] developed a laboratory ironing tribo test to evaluate
stamping lubricants at various temperature levels (Figure 2.24). Lubricants were
evaluated and ranked based on (a) ironing load, (b) surface quality of the ironed
cup and (c) apparent shear friction factor. Five lubricants, namely a dry film, a
zinc phosphate coating+sodium soap, a pre-emulsified with solid lubricant and
two emulsions were tested using the ironing test at both room temperature and
elevated temperature (100 °C) conditions. It is concluded that at both room
temperature and elevated temperature, Lub B (the zinc phosphate coatingCsodium
soap), performed best followed by Lub A (the dry film) and Lub E (pre-emulsified
with solid lubricant), while the emulsions failed (scratching and galling) due to
the high interface pressures. However, Lub A and Lub B are ideal lubricants for
sheet metal forming operations that generate contact pressures in the range of 650
MPa and interface temperatures in the range of 20–140 °C; however, they cannot
realistically be used in a high speed progressive die or transfer die operation
because they are costly to apply and remove. Lub E is a pre-emulsified lubricant
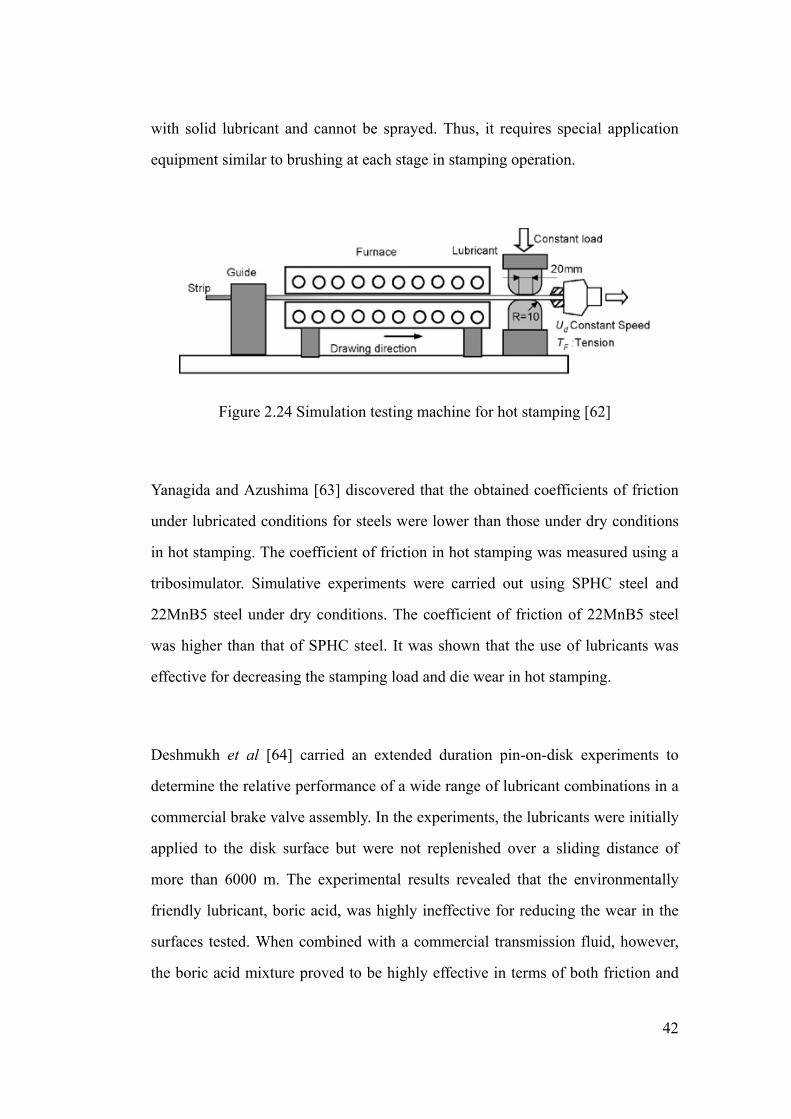
42
with solid lubricant and cannot be sprayed. Thus, it requires special application
equipment similar to brushing at each stage in stamping operation.
Figure 2.24 Simulation testing machine for hot stamping [62]
Yanagida and Azushima [63] discovered that the obtained coefficients of friction
under lubricated conditions for steels were lower than those under dry conditions
in hot stamping. The coefficient of friction in hot stamping was measured using a
tribosimulator. Simulative experiments were carried out using SPHC steel and
22MnB5 steel under dry conditions. The coefficient of friction of 22MnB5 steel
was higher than that of SPHC steel. It was shown that the use of lubricants was
effective for decreasing the stamping load and die wear in hot stamping.
Deshmukh et al [64] carried an extended duration pin-on-disk experiments to
determine the relative performance of a wide range of lubricant combinations in a
commercial brake valve assembly. In the experiments, the lubricants were initially
applied to the disk surface but were not replenished over a sliding distance of
more than 6000 m. The experimental results revealed that the environmentally
friendly lubricant, boric acid, was highly ineffective for reducing the wear in the
surfaces tested. When combined with a commercial transmission fluid, however,
the boric acid mixture proved to be highly effective in terms of both friction and

43
wear performance. Based on the success of the combined lubricant experiments,
the boric acid was then mixed with canola oil to form a completely natural
lubricant combination. Based on further pin-on-disk experiments, this lubricant
combination yielded the best wear performance of all the lubricants tested.
2.6.3 Alternative die materials
Recently, automotive industry shifts its focus on customised production, facing an
increasing demand for medium and small batch production, where cost-effective
manufacturability of sheet metal forming dies with improved tool wear behaviours
comes into the foreground. Some alternative materials, such as filled polymers,
offer possibilities to fulfil such requirements. Work has also been carried out to
prolong tool-life through utilisation of alternative die materials.
Rück, Boos and Brown [65] conducted an investigation of the effect of metal ion
implantation into high speed steel dies, using high current metal ion beams from a
repetitively pulsed vacuum arc ion source. The testing method used was the
upsetting process, which is comparable to actual forming processes and stimulates
the wear strain of the tools used in the metal forming industry.
Narojczyk, Werner and Piekoszewski [66] utilised nitrogen ion implantation for
stamping die to form the cross-recessed heads of screws. It was revealed that the
effect of nitrogen ion implantation on the wear rate of stamping dies resulted in an
improvement by a factor of about 2.5. And tool chipping rate was reduced by a
similar factor as well. However, no effect of ion implantation upon the force
exerted by the tool on the workpiece was found.

44
de Souza and Liewald [67] investigated the tribological and tool design aspects of
using polymeric materials for sheet metal forming purposes. In the study, wear
behaviour of two polymer composites on sheet metal counterface materials have
been investigated. A new testing method for wear evaluation of polymeric
materials for sheet metal forming using a Strip Drawing Test facility was
developed as shown in Figure 2.25. A method to predict lifetime of polymeric
stamping dies using the linear wear-distance relation measured with the new
testing method was also proposed. Significant improvements in wear performance
of polymer composites have been observed using sheet materials with structured
surfaces.
Figure 2.25 Scheme of strip drawing test [67]
Myint et al [68] compared the tool wear mechanism of tetragonal zirconia
polycrystal (TZP) punch with that of commercially available WC (tungsten
carbide) punch during stamping. The tool life for the TZP punch was found to be
over 2.5 times higher than that of commercial tungsten carbide. The worn-out
tools were analysed using scanning electron microscope and optical microscope
for studying the tool wear mechanisms. Tool wear and chemical action possibly

45
cause the failure of the tungsten carbide punch, whereas wear of TZP punch is
predominantly caused by mechanical shearing of asperity and plastic deformation.
Due to their inherent high melting point and the absence of the second-phase
binder, ceramics materials do not soften at higher temperature unlike the carbide
tools. Hence, they can be used at high cutting speeds without initiating
deformation/diffusion wear. This assists in improving the tool life significantly. In
addition, TZP ceramics is inert, corrosion resistant and non-wetting when
contacting metals. Exposed carbide grains act as a site for increased wear and
metal pickup during precision, high-speed metal stamping and forming. Moreover,
cobalt-depleted carbide tools can create burring of the strip being stamped,
leading to poor part quality.
A few rapid tooling technologies have been recently proposed and among them
Selective Laser Sintering is probably one of the most relevant and promising.
Levy et al [69] reported some results of a wide experimental research on the
application of SLS tools in sheet metal forming. A wear test was carried out to
investigate the progressive degradation of laser-sintered materials in comparison
with traditional cold-work steels. In conclusion, SLS may represent an effective
rapid tooling technique in the field of tool manufacturing for sheet metal
stamping.
Pinto et al [70] studied the usability and robustness of polymer and wood
materials for tooling in sheet metal forming. A target production volume has been
defined and both tool materials were submitted to stampings in the press shop and
the evolution of tool wear, roughness and geometrical changes in punch and die
radius were measured throughout production. In spite of that the tooling costs of
presented alternative materials are very similar, results have shown that a good
46
compromise for this particular presented part should be the use of the
polyurethane based material once this material does not suffer an excessive wear
like the densified wood material, and therefore, the stamped part accuracy is
preserved. Nevertheless, according to the experimental results, both materials
have shown that they can be a practical alternative in the production of tools for
sheet metal forming, both by their aptitude and robustness as well as their
economic feasibility, in the low volume production series.
2.6.4 Tool wear modelling
Although a number of test methods have been developed in recent years, some
numerical tool wear models for sheet metal forming process were also introduced.
Ersoy-Nürnberg et al [71] have studied the simulation of tool wear in sheet metal
forming tools using the modified Archard’s model in which wear coefficient is a
function of accumulated wear work and is proportional to the dissipated energy. In
order to determine these wear coefficient values as well as their gradients along
the life cycle, deep drawing experiments with a cylindrical cup geometry were
carried out. The prediction of tool wear is accomplished by REDSY, a wear
simulation software developed at the Institute of Metal Forming and Casting, TU
München. The wear predictions made by this software are based on the results of
a finite element deep drawing simulation. The results obtained using the proposed
model are in a good agreement with the experiments.
Hambli [72] has developed a wear model in sheet metal blanking/punching
process using finite element analysis with tool wear as a function of normal

47
pressure and material properties. A wear model has been implemented in a finite
element code, in which the tool wear is a function of the normal pressure and
some material parameters. A damage model is used in order to describe crack
initiation and propagation into the sheet. The distribution of the tool wear on the
tool profile is obtained and compared to industrial observations. In general, the
need for regrinding of the shearing tool is determined on the basis of allowable
burr height on the final product. This wear analysis is very helpful to improve the
reliability of the shearing tool and to determine the tool repair or change.
2.6.5 Die radius geometry
It has also been observed in some studies that tool geometry also plays an
important role in affecting the tool life of sheet metal stamping of conventional
steels.
Boher et al [32] studied the tool wear behaviour by investigating the degradations
of the radius portion of a die in deep drawing process of low-carbon steel sheets.
It is concluded that strip particle transfer is the main wear damage and it is located
on two specific areas of the die radius. The tribological behaviour of the die radius
is quite different in function of the strip exit angle. For low strip exit angles,
particle transfer on the die radius is important and for high strip exit angle, the
main damage is abrasion. The friction coefficient may also give information about
the contact evolution.
Hortig and Schmoeckel [39] have described an approach to identify the
characteristic distribution of local loads on the draw die surface and have analysed

48
the influence of various parameters such as sheet thickness, draw die radius,
coefficient of friction, and material parameters on load amount and positions.
Hoffmann, Hwang and Ersoy [73] developed an advanced simulation scheme for
tool wear modelling that considers the geometry changes caused by wear using
interactive iterations. REDSY is tool wear simulation software developed by
Hoffmann et al, which implemented Geometry-Update-Scheme (UGS) to consider
the change of tool geometry by the increase of the number of punch strokes.
Figure 2.26 describes an iterative algorithm applied in UGS. REDSY imports the
results of forming simulation, calculates elemental wear, and exports the worn
grometry to a file for the next iterative.
Figure 2.26 Algorithm applied in UGS [73]
Jensen et al [19] applied a finite element method to determine the distribution of
tool wear in deep drawing of austenitic stainless steel using a quantitative
semi-empirical wear model and compared it to industrial observations. In the tool
wear prediction model, it was assumed that the equations for the adhesive wear
and abrasive wear were identical, and the constants and the hardness of the die

49
remained constant through the operation time. The simulation results showed that
the tool wear was concentrated in two areas at around 20°and 70°, which agrees
with the experimental results obtained at Grundfos A/S and the Technical
University of Denmark [74]. Through the simulations, it was observed that an
increase in the n-value led to a significant reduction of the tool wear. The blank
thickness, the ratio of the blank thickness to the die radius and draw ratio, resulted
in a large increase of tool wear when these parameters were increased. However, it
was found that tool wear does not depend significantly on the die radius.
More recently Pereira et al [75] have provided a qualitative description of the
evolution and distribution of contact pressure at the die radius in sheet metal
stamping process and have identified three distinct phases of contact pressure
distribution to better understand the wear phenomenon. It was found that a
typical-peak steady-state contact pressure response existing for the majority of the
process proceeded by a transient response. It was revealed that the peak transient
contact pressure was more than double the steady-state peak, which may have a
significant influence on the tool wear distributions.
In a numerical study on the circular cup drawing test, Shahani and Salehinia [5]
have used finite element method to study the wear depth on draw die arc segment
and revealed that the contact stress peaks can be reduced by simply increasing the
die radius. The wear model was developed by considering the abrasive wear only.
It was concluded that the wear profile contains two peaks: one near the inlet of die
arc and the second at some distance from the outlet. The second relative
maximum wear point moved toward the end point (90°) of the draw die arc by
decreasing the clearance between the punch and the die. The influence of the
blank holder force on the first peak of the relative wear depth was much more than
50
that on the second peak. For blank holding force, there was a certain value before
which increasing its magnitude increased the peak values of the relative wear
profile and beyond that the peak values decreased as the blank holder force
increased. In opposition to the results obtained by Jensen et al [19], the results of
the simulations showed that increasing the radius of the die causes the relative
wear depth to be decreased and to be more distributed.
2.7 Summary
Rising fuel prices and the increasing customer demand for safety have led to the
greater usage of new AHSS in the automobile industry. Compared to conventional
mild steels, AHSS show higher strength levels as well as improved hardening
characteristics, which makes them suitable for applications where low weight and
improved passenger safety are major design targets.
During sheet metal stamping, however, the higher surface hardness and high
material strength of AHSS lead to higher contact stresses between the tooling and
the work piece, which results in increased tool wear compared to conventional
steel grades [18, 76].
There has been extensive research carried out to study and predict the tool wear
behaviour in sheet metal processing of various materials both numerically and
experimentally. As many control parameters can affect the severity of tool wear,
research work has also been carried out to prolong tool-life through a combination
of surface coatings and alternative die materials.

51
In predicting tool wear, it has also been observed in various studies that tool
geometry also plays an important role in affecting the tool life of sheet metal
stamping of conventional steels. However, very little work seems to have been
done on determination of exact die geometry to reduce tool wear in sheet metal
stamping of AHSS.
Even though some of the previous studies have shown that tool wear can be
reduced by modifying the die shape, they mainly focused on dies with standard
circular profiles and the forming of a conventional steel sheet. Automotive
industries are now adopting increasing use of AHSS for their body panels due to
their superior strength, light weight and crashworthiness capabilities. However, as
AHSS can show strength levels three to four times higher than conventional steel
sheet, these previous studies on tool wear do not give an accurate indication of the
die contact stress distribution and the effect of the die shape on tool wear when
forming AHSS.

52
CHAPTER 3 TOOL WEAR PREDICTION USING
AUTOFORM SOFTWARE
3.1 Introduction
During sheet metal forming, various process control parameters usually display
their effect leading to a degree of uncertainty in the tool wear severity. To identify
the complex tool wear problems in stamping as early as possible, simulation
software is used to study the forming process during tool development. As the
rapid growth in the research and development of finite element simulation for
sheet metal forming application continues, a number of commercial software is
available in the markets, for example, AutoForm, Pam-stamp, dynaform, etc.
In this chapter, AutoForm 4.1 software was employed as pre-processing,
simulation and post-processing tool to conduct a finite element analysis of the tool
wear prediction for a particular stamping part.
For the simulation study, an assembly tool and a part model for a reinforced rear
suspension support of a GM Holden’s vehicle was created in the Unigraphics NX2
software. The model consists of a die, punch, binder and part. The model was
exported to AutoForm software. After defining material properties of each part in
the model, the model was automatically meshed to produce nodes and elements
by selecting corresponding parameters in AutoForm, followed by determining the
parameters of boundary conditions and contact characteristics between each

53
component and loads. These procedures are referred to as the pre-processing
procedures. After specifying parameters of the solution, AutoForm software
would solve the specified problem.
3.2 AutoForm software
AutoForm software package version 4.1 was developed by AutoForm Engineering
GmbH [77]. The software offers solutions for the die-making and sheet metal
forming industries. The software can improve reliability in planning, reduce the
number of die tryouts and tryout time, and lead to higher quality part and tool
designs that can be produced with maximum confidence. In addition, press
downtime and reject rates in production are substantially reduced.
Based on practical, industrial know-how and sheet metal forming expertise,
AutoForm’s solutions result in a complete, integrated and specialised system to
analyse, review and optimise every phase of the process chain.
AutoForm provides solutions all along the sheet metal forming process chain
(Figure 3.1). It ranges from stand-alone modules for small and mid-size
companies to complete, integrated multi-module systems for large companies.

54
Figure 3.1 Sheet metal forming process chain in AutoForm Software [78]
The software provides accurate simulations for sheet metal forming based on the
static implicit approach, which can be expressed as:
,v Aij i j i iT u dV t u dA (3.1)
where V is the volume, A is the surface area, Tij is the Cauchy stress tensor, ui,j is
the gradient of the displacements, ti is the traction vector and δ is the variational
operator [79].
In sheet metal forming, for a certain part with a fixed drawing depth, the contact
pressure distribution of the work-piece provides a reference to predict the tool
wear of the die. The contact pressure shows the normal stress imposed on a
55
work-piece by the action of the die and punch. By examining the reaction stresses
of a die, it can be used to assess the danger of the tool wear during the forming
process.
AutoForm incremental module produces the contact pressure distributions of a
work-piece at the die-workpiece interface to indicate the wear of the
corresponding die, under various binder pressure loads and lubrication
coefficients [77].
AutoForm die advisor module was used for the prediction of the tool wear
location and the extent of wear, and determination of the optimal coating method
of the tool. Various coating methods, such as physical vapour deposition (PVD),
chemical vapour deposition (CVD) and protective coatings, including TiN, TiCN,
TiAlN, hard-chrome and a-C:H, are supported by the module. This module
utilised the finite element model to calculate friction work generated at contact
regions between the die and workpiece [77]. Friction work is the work of friction
per unit area and can be expressed as the integral of frictional shear stresses over
an element:
F FA ds (3.2)
where AF is friction work, τF is the frictional shear stress at the nodes in an
element and s is the sliding distance. Wear volume w can be expressed as:
Fkw AH
(3.3)

56
where H is the hardness of tool material and wear coefficient k was measured by
experiments performed by VST Keller, a partner of AutoForm Engineering
GmbH.
3.3 Simulation Setup
A reinforced rear suspension support of a vehicle was used as a case study (Figure
3.2). The material of the part is cold rolled hot dip galvanized high strength steel.
The production rate is 8 strokes per minute and production volume is 100,000.
The thickness of the part is 2.5 mm. Table 3.1 shows the material properties of the
part. Figure 3.3 illustrates the forming limit curve (FLC) of the part obtained from
a test from the material supplier, in which the minor principal strain is along the x
axis and the major principal strain is along the y axis. The FLC is used in sheet
metal forming for predicting forming behaviour of sheet metal [1, 80]. The
diagram attempts to provide a graphical description of material failure tests, such
as a punched dome test.
Table 3.1 Material properties of reinforce rear suspension support
Young's
module Poisson's
ratio
Specific
weight
Strain
hardening
coefficient
Initial yield
stress
Strength
coefficientNormal
anisotropy(MPa) (Nm-3) (MPa) (MPa)
2.07×10⁵ 0.333 7.8×10⁻⁵ 0.13 420 766.25 1.0

57
Figure 3.2 Reinforced rear suspension support
Figure 3.3 Forming limit curve
Figure 3.4 shows the sequences of simulation steps used in AutoForm. The CAD
data of finished part was imported to AutoForm incremental module and then
meshed automatically. The blank, binder, punch and die were then imported to the
module by AutoForm-UG interface, respectively, and placed at their specified
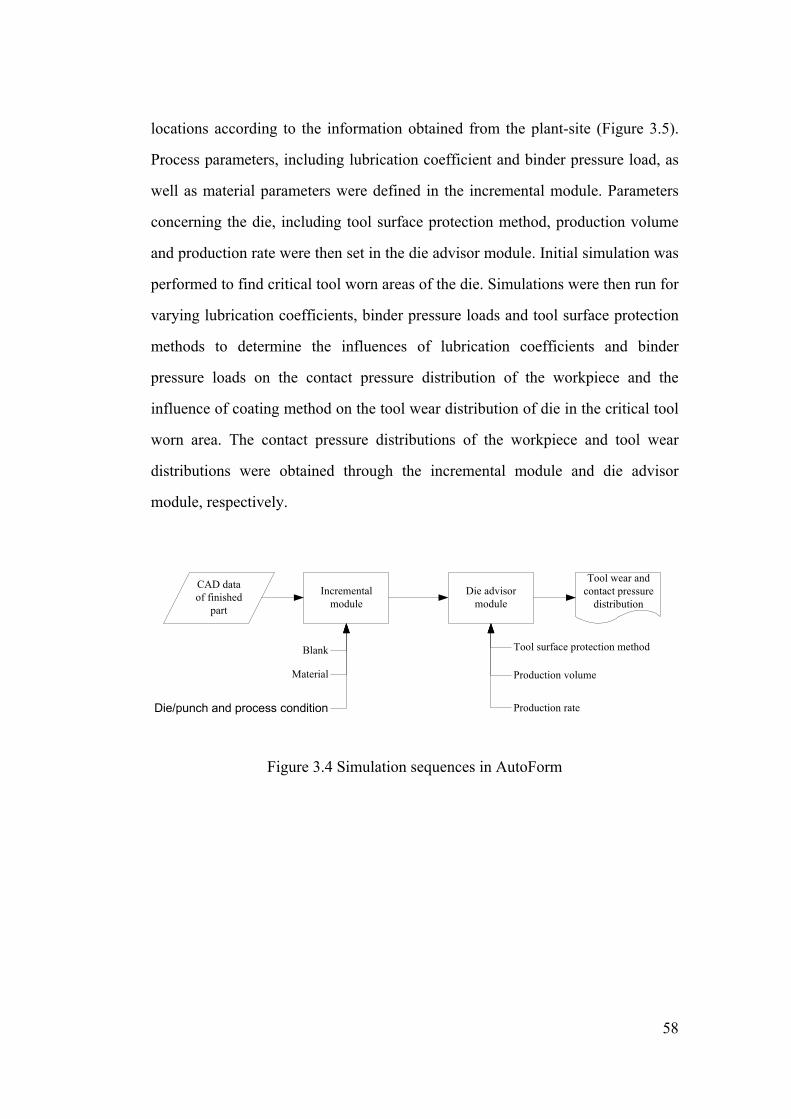
58
locations according to the information obtained from the plant-site (Figure 3.5).
Process parameters, including lubrication coefficient and binder pressure load, as
well as material parameters were defined in the incremental module. Parameters
concerning the die, including tool surface protection method, production volume
and production rate were then set in the die advisor module. Initial simulation was
performed to find critical tool worn areas of the die. Simulations were then run for
varying lubrication coefficients, binder pressure loads and tool surface protection
methods to determine the influences of lubrication coefficients and binder
pressure loads on the contact pressure distribution of the workpiece and the
influence of coating method on the tool wear distribution of die in the critical tool
worn area. The contact pressure distributions of the workpiece and tool wear
distributions were obtained through the incremental module and die advisor
module, respectively.
CAD data of finished
part
Incremental module
Blank
Material
Die/punch and process condition
Die advisor module
Tool wear and contact pressure
distribution
Tool surface protection method
Production volume
Production rate
Figure 3.4 Simulation sequences in AutoForm

59
Figure 3.5 Blank, binder, punch and die in AutoForm software
3.4 Results and Discussion
3.4.1 Identification of critical tool worn areas
In the initial simulation used to determine locations of the critical tool worn area,
the binder pressure load and lubrication coefficient were set as 4.5 MPa and 0.15,
respectively. The initial coating method was selected as PVD Steel. Figure 3.6
plots the tool worn areas distribution obtained from the initial simulation. In
Figure 3.6, the area with the red colour presents an area of sensitivity to tool wear,
and it is a tool worn failure area with high probability. However, the area with the
green colour in Figure 3.6 means an area of insensitivity to tool wear, and it is
unlikely the tool wear would occur in the area. The area with the yellow colour is
marginal area to suffer tool wear. It was concluded that Areas 1, 2, 3 and 4 were
highly sensitive to tool wear, and tool wear would occur in the very early stage of
BinderPunch
BlankDie

60
the production. These areas were compared with the worn out areas of the actual
surfaces of the parts produced.
Figure 3.6 Potential tool worn area location on die surface obtained from initial
simulation
Figure 3.7 illustrates the photos of the worn areas, named Areas 1’, 2’, 3’ and 4’,
located on the surface of the actual sheet metal part, which contacted to the
corresponding Areas 1, 2, 3 and 4, respectively, in the sliding movement during
the sheet metal forming process. The initial predicted result is found to be in
accordance with the result obtained from the plant-site.
Areas 1, 2, 3, 4 were identified as the critical tool worn area on the die surface. As
the gradient in both Areas 2 and 3 was extremely large in both longitudinal and
latitudinal directions, this resulted in highly increased sliding movement between
the tool surface and the part surface, and accelerated the formation of worn areas
in both the die surface and sheet metal blank surface. In the following discussion
of contact pressure distributions, a cross-section of Areas 2’ and 3’, named
Area 1
Area 2
Area 3
Area 4
Safe Marginal Failure
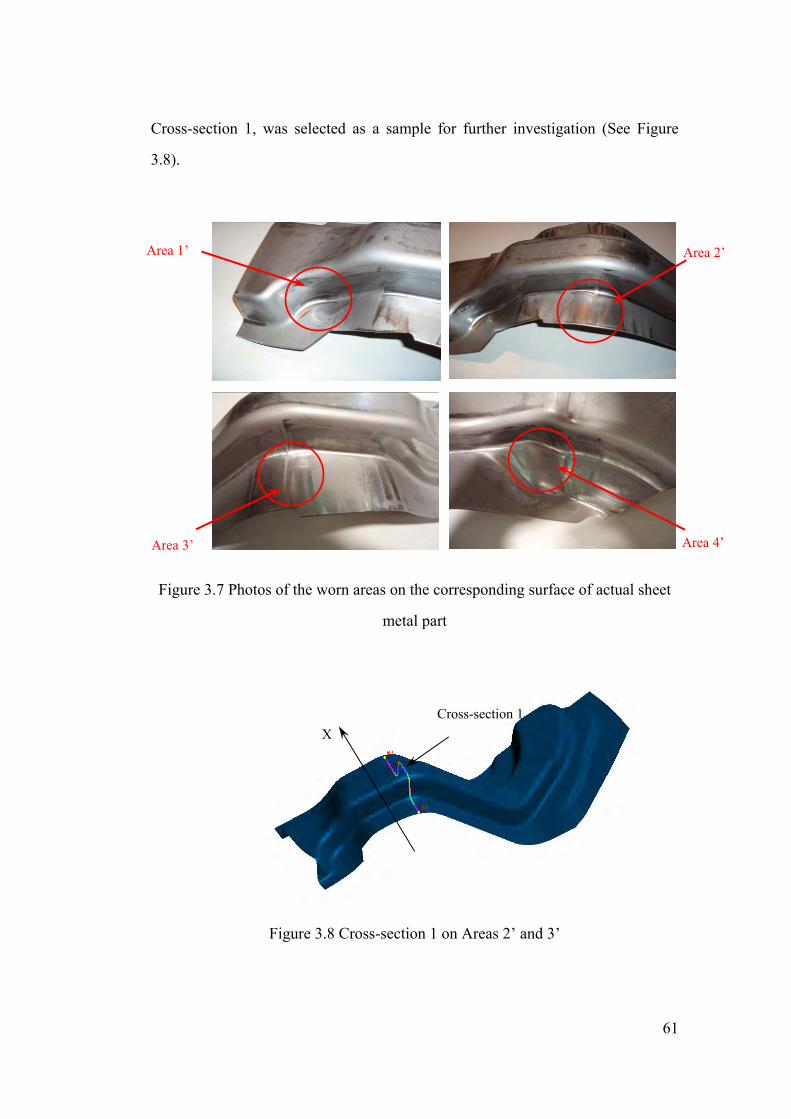
61
X
Area 1’ Area 2’
Area 3’ Area 4’
Cross-section 1, was selected as a sample for further investigation (See Figure
3.8).
Figure 3.7 Photos of the worn areas on the corresponding surface of actual sheet
metal part
Figure 3.8 Cross-section 1 on Areas 2’ and 3’
Cross-section 1
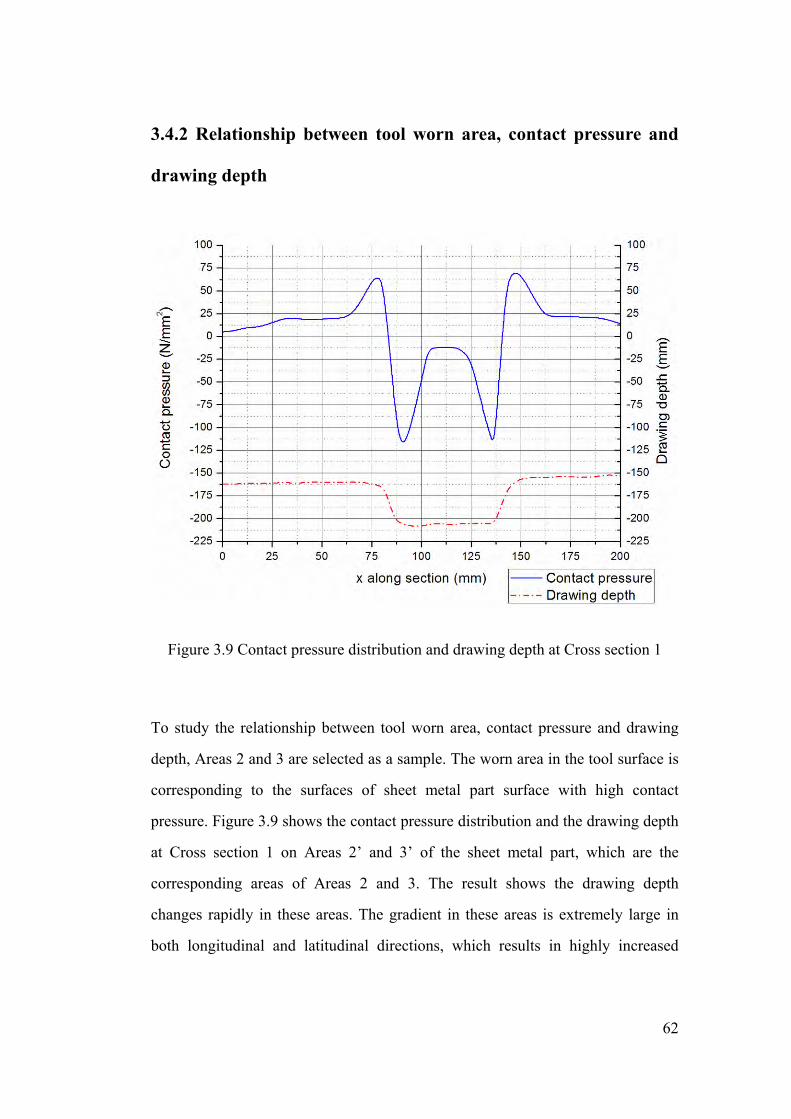
62
3.4.2 Relationship between tool worn area, contact pressure and
drawing depth
Figure 3.9 Contact pressure distribution and drawing depth at Cross section 1
To study the relationship between tool worn area, contact pressure and drawing
depth, Areas 2 and 3 are selected as a sample. The worn area in the tool surface is
corresponding to the surfaces of sheet metal part surface with high contact
pressure. Figure 3.9 shows the contact pressure distribution and the drawing depth
at Cross section 1 on Areas 2’ and 3’ of the sheet metal part, which are the
corresponding areas of Areas 2 and 3. The result shows the drawing depth
changes rapidly in these areas. The gradient in these areas is extremely large in
both longitudinal and latitudinal directions, which results in highly increased

63
sliding movement between the tool surface and the part surface, and accelerates
the formation of the worn area in both tool surface and sheet metal part surface.
From the simulation, it is concluded that the areas that are most sensitive to the
tool wear occur at the locations corresponding to the large gradient of drawing
depth, and these locations are also the areas with high contact pressure.
3.4.3 Comparison of contact pressure distribution for various
lubrication coefficients
Figure 3.10 plots various contact pressure distributions under different lubrication
coefficients based on the Coulomb Model. The lubrication coefficient is the
dynamic friction coefficient, which indicates that the frictional force is
proportional to the normal load. Two positive extrema of the contact pressure
along the section increased from 50 MPa to 90 MPa and from 67 MPa to 118 MP
as the lubrication coefficient rose from 0.05 to 0.15. The positive extrema were
located at Areas 2’ and 3’, which validates that Areas 2 and 3 were critical areas
sensitive to the tool wear. The variation of negative positive extrema is not as
significant as positive ones.
From Figure 3.10, it is noticed that the contact pressures at Area 3’ decreased
abnormally as the lubrication coefficient increased from 0.15 to 0.25. This was
caused by the split of Area 3’. Area 3’ began gradually splitting while the
lubrication coefficient was rising from 0.20, as the dry lubrication condition
blocked the smooth movement of the material flow. Considering the formability

64
of the workpiece, lower contact pressure and qualified formability could be
reached by selecting 0.10 as the lubrication coefficient.
Figure 3.10 Contact pressure distributions upon various lubrication coefficients
along Cross-section 1
(Binder pressure load is 4.5 MPa)
3.4.4 Comparison of contact pressure distribution upon various
binder pressure loads
To study the contact pressure distribution under various binder pressures, 3 MPa,
4.5 MPa and 6 MPa binder pressure loads were applied in the simulation,
respectively. Figure 3.11 shows that two positive extrema of the contact pressure
along the section rose from 55 MPa to 82 MPa and from 88 MPa to 115 MPa as
the pressure loads increased from 3 MPa to 6 MPa, which shows again that Areas
Area 2’
Area 3’

65
2 and 3 were extremely sensitive to the tool wear. The negative maximum of the
contact pressure remained at approximately -90 MPa to show it was not sensitive
to the variation of the pressure loads.
Under the condition of the same drawing depth, the large contact pressure
indicates the increased potential tool wear. However, the lower contact pressure,
i.e. lower binder pressure load, results in insufficient stretch of the workpiece. To
balance the tool wear and formability of the workpiece, 4.5 MPa was selected as
the binder pressure load.
Figure 3.11 Contact pressure distributions upon various binder pressure loads along
Cross-section 1
(Lubrication coefficient is 0.10)
Area 2’
Area 3’

66
3.4.5 Comparison of tool wear distribution upon various die
coating
Figure 3.12 illustrates sensitive tool worn areas on the die surface by the colour
red using various coating methods. As Areas 2 and 3 were most sensitive to the
tool wear, the maximum production volume until the occurrence of local wear
along cross-section 1 under various die coating methods is shown in Figure 3.13.
The binder pressure load used is 4.5 MPa and the lubrication coefficient is 0.10 in
these simulations. It is noted from Figures 3.12 and 3.13 that PVD steel coating
provides the least protection of the die and the local wear would appear in a short
time at Areas 2 and 3 when the production volume arrived at 40K. The die surface
was found to obtain high-quality protection using a CVD TiC 3D steel coating
and the maximum production volume without the wear being increased to 120K.
From the results of simulation, it is observed that a CVD TiC 3D steel coating was
highly recommended, as it postponed the tool wear appearance to the utmost
extent and extended the die-life, which could reduce the frequency of die
maintenance.
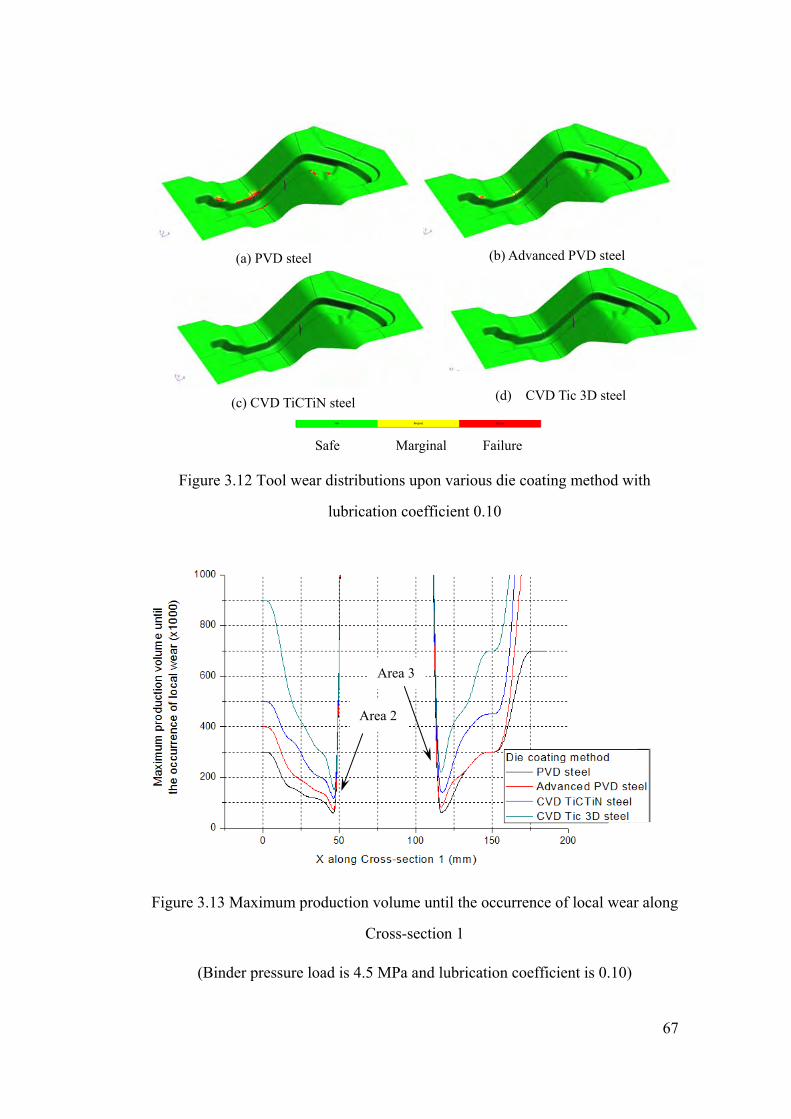
67
Safe Marginal Failure
(d) CVD Tic 3D steel
(a) PVD steel
(c) CVD TiCTiN steel
(b) Advanced PVD steel
Figure 3.12 Tool wear distributions upon various die coating method with
lubrication coefficient 0.10
Figure 3.13 Maximum production volume until the occurrence of local wear along
Cross-section 1
(Binder pressure load is 4.5 MPa and lubrication coefficient is 0.10)
Area 2
Area 3

68
3.5 Advantages and Limitations of AutoForm Software
Based on the case study of the GM Holden’s part, it was seen that AutoForm 4.1
software is able to highlight the location and relative severity of tool wear using
numerical simulations and analysing the contact pressure on the tool surfaces
during forming. Based on the case study, it is possible to use wear prediction tools
to locate tool worn areas. In terms of the simulations and tool wear predictions of
sheet metal stamping, the AutoForm 4.1 software has the following advantages:
(1) The software is specialised in the simulations of sheet metal stamping;
(2) Pre-processing of data is fully designed towards to the requirements of the
sheet metal stamping;
(3) Entire sequence is fully automatic and user-friendly;
(4) Creation of elements is automatic and fast;
(5) Computation time is reduced and acceptable.
However, it is found that the AutoForm software has a number of noticeable
limitations. One of them is the problem of accuracy. Figure 3.14 shows the
comparison of major strain results from AutoForm 4.1 and Abaqus 6.8 software
with experimental results for channel bending test under binder holder forces 12
KN and 36 KN [81]. The comparison done by other team members in this project
concluded that the AutoForm software does not predict strains with the same
accuracy as the Abaqus model [81]. In general AutoForm under predicts all values.
The likely reason for this is that the Abaqus model is significantly more detailed
with many small elements to increase the accuracy of the result, whereas the
AutoForm software does not support flexible elements creation. However, this

69
level of detail is not currently feasible for industrial sheet forming simulations due
to the time-constraints in setting up and running the simulation, but will be
extremely valuable during the development of tool wear prediction methods in
this work.
Figure 3.14 Comparison of major strain results from AutoForm and Abaqus
software with experimental results [81]
Besides the lesser accuracy of AutoForm software, there are a few other
limitations of the software:
(1) The pre-processing is less flexible and, especially, in the creation of elements.
(2) Although the post-processing of the simulation results is suitable for the
industrial simulations, it is significantly insufficient for the research work as
70
the simulation results cannot be easily retrieved and tabulated for external data
processing.
3.6 Summary
In this Chapter, the influences of the binder pressure load, lubrication coefficient
and coating on the tool wear distribution for a certain sheet metal stamping die
were investigated based on numerical simulations using AutoForm software. The
areas that were sensitive to the tool wear were identified in the initial simulation,
which were found to be in accordance with the phenomena observed from the
on-site production of the actual parts. From results obtained from simulations, the
lower binder pressure load, improved lubrication coefficient and coating were
selected, which could reduce the likelihood of too wear. Results have shown that
numerical simulation method using AutoForm can be used effectively in reduction
of lead-time in the tool wear prediction for automobile manufacturers. However,
due to lesser accuracy and limited support for the post-processing of AutoForm
software for the research purpose, Abaqus software is selected as the development
tool for the tool wear prediction modelling in the following chapters.

71
CHAPTER 4 NUMERICAL TOOL WEAR PREDICTION
MODELLING
4.1 Introduction
As the commercial specialised software AutoForm has limitations for the tool
wear prediction modelling as described in Section 3.5, in order to study tool wear
behaviours of a common stamping part, Abaqus 6.8 was used as pre-processing,
solution and post-processing tools to establish a numerical tool wear prediction
model. Abaqus 6.8 is a software package for the finite element analysis and design
developed by SIMULIA.
Abaqus software is an extremely popular, class-leading modular suite of FEA
software used across a broad spectrum of industries. Its open and flexible
simulation solutions provide a common platform for fast, efficient and
cost-effective product development, from design concept to final-stage testing and
performance validation. It provides the most complete and flexible solution to
help researchers and engineers understand the detailed behaviour of a complex
assembly, refine concepts for a new design, investigate the behaviour of new
materials, and simulate a discrete manufacturing process. The software suite
delivers accurate, robust, high-performance solutions for challenging nonlinear
problems, large-scale linear dynamics applications, and routine design simulations.
Its user programmable features, scripting and GUI customization features allow
proven methods to be captured and deployed to an enterprise, enabling more
design alternatives to be analysed in less time.

72
The deep drawing process for a common stamping part has large deformation
characteristics, thus a reliable nonlinear analysis tool is required for the simulation
of its drawing process. Abaqus is a pioneer in the discipline of nonlinear analysis.
Its nonlinear capabilities have evolved according to emerging analysis needs,
maturity of analysis methods and increased computing power. Abaqus includes a
full complement of nonlinear elements, material laws ranging from metal to
rubber, and the most comprehensive set of solvers available. It can handle even
the most complex assemblies especially those involving nonlinear contact and
large deformation.
In this chapter, pre-processing and solution procedures for establishment of tool
wear prediction model are presented in detail, while the post-processing, i.e.
results and discussion, will be described in a later chapter.
An assembly model for Abaqus according to a typical environment and structure
of a deep drawing process was created in Abaqus/CAE module. The model
consists of a die, a punch, a binder holder and a part. After defining material
properties of each part in the model, the model was meshed to produce nodes and
elements for the FEA followed by determined boundary conditions. The contact
characteristics between each component need to be defined as well. A series of
steps with loading was applied on the punch to drive the deep-drawing process to
stretch the part. These procedures are referred to as the pre-processing procedures.
After specifying parameters of the solution, Abaqus would solve the specified
problem.

73
4.2 Wear Work Calculation Along Die Radius Profile
In sheet metal stamping, adhesive wear and abrasive wear are two primary types
of wear. Adhesive wear is a type of wear due to localised bonding between
contacting solid surfaces leading to material transfer between two surfaces or loss
from either surface [7]. Holm [22] and Archard [23] concluded that adhesive wear
volume VAdhesive is generally proportional to the applied load F and sliding
distance s but inversely proportional to the hardness H of the surface being worn
away, so that,
Adhesive kFsVH
(4.1)
where k is the non-dimensional wear coefficient dependent on the materials in
contact and their cleanliness.
Abrasive wear on a die surface is a common phenomenon in sheet metal stamping
because the hardness of a die is larger than that of a sheet metal blank. In many
cases, the wear mechanism starts with adhesive wear, which generates wear
particles that are trapped at the interface, resulting in an abrasive wear [25]. A
simplified model for abrasive wear volume VAbrasive was developed by Rabinowicz
[26] as Eq. (4.2),
2 tanAbrasive
FsV
H (4.2)

74
where θ is roughness angle, H is the hardness of the softer surface and F is the
normal load.
Assuming k and tan are constant during sheet metal stamping, the total wear
volume V can be express as Eq. (4.5)
Adhesive Abrasive V V V
(4.3)
2tan
FsV cH
(4.4)
V KFs (4.5)
To apply Eq. (4.5) in the finite element analysis in the deep-drawing simulation,
an integral form of the equation is introduced. The wear work after a stroke with T
as the total time of stroke is expressed as Eq. (4.6) and (4.7):
0
T
tW Fv dtKA A
(4 .6)
0
T
t tW p v dt (4.7)
where v is the sliding velocity at the time point t and A is the area.

75
The finite element analysis for deep-drawing simulation is an incremental process
in Abaqus 6.8. The total time for a stroke is divided into n incremental segments.
Eq. (4.7) needs to be discretised in an incremental form, then the wear work Wθ on
the angle θ of the die radius after a stroke is given by the following equations:
, , 11
( )n
i i i ii
W p v t t
(4.8)
, ,1
n
i ii
W p s
(4.9)
Where pt is the normal contact pressure at time point t.
In the Abaqus simulations, the contact pressure on each element of the die radius
surface is obtained for each incremental segment. As the sliding movement of the
blank relative to the die radius surface of each element is not identical, due to the
stretch of the blank during the deep-drawing, the distance of the sliding movement
of the blank is not assumed to be same in each element. Thus, the distance is also
obtained for each incremental segment.

76
4.3 Finite Element Modelling
4.3.1 Geometry
To analyse the contact pressure and wear work distribution along the die radius
profile, a finite element model of the deep-drawing was established using Abaqus
6.8/CAE module. With Abaqus/CAE, the geometries of each component of the
model and its assembly can be quickly and efficiently created, edited, monitored,
diagnosed, and visualised before the execution of Abaqus analyses. Abaqus/CAE
supports familiar interactive computer-aided engineering concepts such as
feature-based, parametric modelling, interactive and scripted operation, and GUI
customisation.
In deep-drawing process, the tool (die, punch, blank holder) and blank were
symmetric about a plane along the centre of the channel, respectively, in all
aspects, including the geometry, materials, loadings and boundary conditions. To
take advantage of these symmetric characteristics and to reduce the size, scope
and processing time of the model, only a half of the model was created in the
analysis (Figure 4.1). A two-dimensional, plane strain model was used under the
assumption that there is no strain in the out-of-plane direction of the model. The
model consists of four distinct components: die, punch, blank holder and blank.
The blank was squeezed between the blank holder and the die. These four
components were assembled as a whole model. The dimensions and parameters of
the model are listed in Figure 4.2.
Although the tool components are much stiffer than the blank, they were modelled
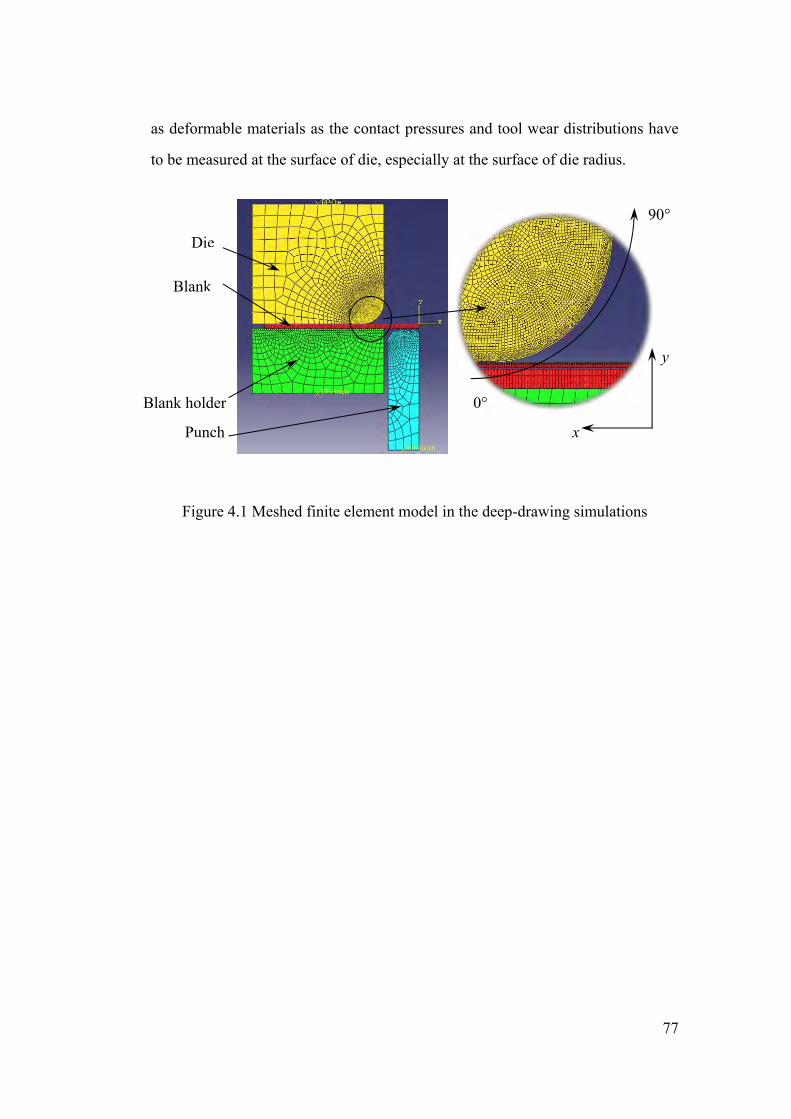
77
as deformable materials as the contact pressures and tool wear distributions have
to be measured at the surface of die, especially at the surface of die radius.
Figure 4.1 Meshed finite element model in the deep-drawing simulations
0°
90°
y
x
Die
Blank holder
Blank
Punch
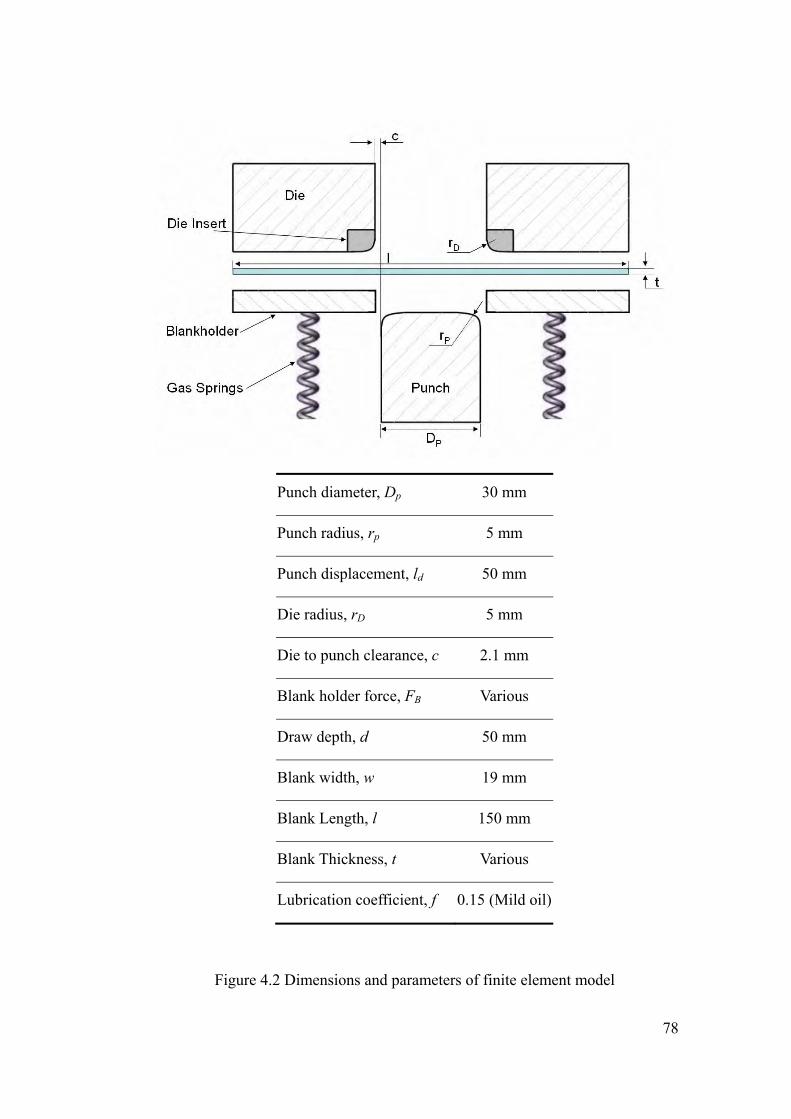
78
Punch diameter, Dp 30 mm
Punch radius, rp 5 mm
Punch displacement, ld 50 mm
Die radius, rD 5 mm
Die to punch clearance, c 2.1 mm
Blank holder force, FB Various
Draw depth, d 50 mm
Blank width, w 19 mm
Blank Length, l 150 mm
Blank Thickness, t Various
Lubrication coefficient, f 0.15 (Mild oil)
Figure 4.2 Dimensions and parameters of finite element model
79
4.3.2 Discretisation
Based on the geometry of the model, manual meshing was applied instead of
automatic meshing. This was because manual meshing gave more advanced
parameters to control the element shape, size and accuracy than automatic
meshing.
Before the model was meshed, the type of element was needed to be selected
according to several aspects of the model, such as the model's geometry, the type
of deformation, the loads being applied, etc. Due to the contact simulation
between the surfaces of each component, first-order elements or modified
second-order tetrahedral elements should be used for contact simulations. In
addition, significant bending of the blank is expected under the applied loading.
Fully integrated first-order elements exhibit shear locking when subjected to
bending deformation. Therefore, either reduced-integration or incompatible mode
elements should be used.
In this analysis, reduced-integration element with enhanced hourglass control
CPE4R was mainly selected to mesh the model. The reduced-integration element
helps decrease the analysis time, and enhanced hourglass control reduces the
possibility of hourglassing in the model. This type of element is suitable for the
large non-linear distortion in the finite element analysis. The die, punch, blank
holder and blank are set as two dimensional deformable parts. The whole model
was meshed mainly with four node plane strain reduced integration element
CPE4R. A few linear triangular plane strain elements CPE3 are used for the
tooling parts.

80
To ensure adequate accuracy and to save computational simulation time, the
elements of the die radius and top blank region are meshed more finely than those
of the rest of the model. The mesh sizes of the die radius and top blank are 0.03
mm × 0.03 mm and 0.05 mm × 0.1 mm, respectively.
4.3.3 Material properties
Various material properties were assigned to each component in the model,
respectively. For the purpose of the experimental validation, the material
properties as shown in Table 4.1 were used in the analysis.
Table 4.1 Material properties of mild steel blank and die [5]
Blank (Mild steel) Die
Material definition Elastic-plastic Elastic
Young’s Modulus, E 205 GPa 210 GPa
Poisson’s ratio, v 0.3 0.3
K 569.4508 MPa
e 0.268365
n 0.52493
The blank would undergo significant rotation as it is deformed. Reporting the
values of stress and strain in a coordinate system that rotates with the blank's
motion will make it much easier to interpret the results. Therefore, a local material

81
coordinate system that was aligned initially with the global coordinate system, but
moves with the elements as they deform, was created for the analysis.
4.3.4 Contact interaction
Contact interactions were defined between the top of the blank and the punch, the
top of the blank and the blank holder, and the bottom of the blank and the die.
Three contact pairs based on the “surface-to-surface contact (standard)” were
created between the top of the blank and the punch, the top of the blank and the
blank holder, and the bottom of the blank and the die, respectively, because large
deformation and relative sliding appeared between them, and exact locations of
contacting areas in interfaces were not known in advance.
Abaqus makes a distinction between analyses where the magnitude of sliding is
small and those where the magnitude of sliding may be finite. The “finite sliding”
contact behaviour was selected for sliding formulation in the definition of the
contact pairs as the magnitude of sliding between the blank and other components
should be considered as “finite” instead of “small”.
The master surface and slave surface were defined in terms of the stiffness of two
corresponding components. The softer surface was selected as the slave surface,
while the stiffer surface was selected as the master surface.
82
4.3.5 Analysis steps with constraints and loadings
Rigid body motion of the components before contact conditions constrains them
and sudden changes in contact conditions lead to severe discontinuity iterations as
Abaqus tries to establish the exact condition of all contact surfaces.
To remove rigid body motion, adequate constraints have to be applied to prevent
all rigid body motions of all the components in the model. This may mean using
boundary conditions initially to get the components into contact, instead of
applying loads directly. Using this approach may require more steps than
originally anticipated, but the solution of the problem can proceed more smoothly.
To eliminate sudden changes in contact conditions, therefore, though the
deep-drawing process is a continuous operation, the simulation run by Abaqus
need to be divided into several analysis steps to establish contact between
components in a reasonably smooth manner, avoiding large overclosures and
rapid changes in contact pressure. The simulation consisted of five steps. As the
material, geometric, and boundary nonlinearities were involved in the simulation,
general steps have to be used.
Step 1
This step was intended to establish firm contact between the blank and the blank
holder. In this step the endpoints of the midplane of the blank was fixed in the
vertical direction to prevent the blank from moving initially, and the blank holder
was pushed down onto the blank using a displacement boundary condition. Given

83
the quasi-static nature and nonlinear response of the analysis, a static, general Step
1 was created.
Step 2
Since contact was established between the blank and the blank holder and die in
the previous step, the constraint on the right end of the blank midplane is no
longer necessary and had to be removed in Step 2. Since the previous step
considered the effects of geometric nonlinearity, these effects would be included
automatically in this and all subsequent steps.
Step 3
The magnitude of the blank holder force needed to be introduced in the analysis.
In this step the boundary condition used to move the blank holder down would be
replaced with a force in Step 3.
Step 4
At the beginning of the analysis, the punch and the blank are separated to avoid
any interference while contact was established between the blank and the die and
blank holder. In this step the punch was moved up in the y direction just enough to
achieve contact with the blank. In addition, the vertical constraint on the left end
of the blank midplane was removed; and a small pressure was applied to the top
surface of the blank to pull it onto the surface of the punch.

84
Step 5
In the fifth and final step the pressure load applied to the blank was removed, and
the punch was moved up to complete the forming operation. Because of the
frictional sliding, the changing contact conditions, and the inelastic material
behavior, there was significant nonlinearity in this step. Therefore, the maximum
number of increments needed to be set as a large value 1000. The initial time
increment needed to be input as 0.0001, the total time period have to be
determined to 1.0, and the minimum time increment should be decreased to 1e–06.
With these settings Abaqus can take smaller time increments during the highly
nonlinear parts of the response without terminating the analysis.
4.3.6 Deformed and undeformed model
Figure 4.3 illustrates the undeformed model, the die, punch, binder holder and
blank are illustrated in yellow, blue, green and red, respectively. The punch keeps
at the initial position until Step 3 and the blank remains undeformed.

85
Figure 4.3 Undeformed model after Step 3
Figure 4.4 illustrates the deformed model after Step 4. The punch moves up to
establish the contact with the blank, but the blank still remains undeformed.
Die
Blank holder
Blank
Punch

86
Figure 4.4 Deformed model after Step 4
Figure 4.5 illustrates the deformed model during Step 5 in early stage. The punch
continues moving up to drive the blank begin covering the die radius portion from
0°.

87
Figure 4.5 Deformed model during Step 5 in early stage
Figure 4.6 illustrates the deformed model during Step 5 in middle stage. The
punch continues moving up to drive the blank covering whole die radius portion
from 0° to 90°.

88
Figure 4.6 Deformed model during Step 5 in middle stage
Figure 4.7 illustrates the deformed model during Step 5 in late stage. The punch
continues moving up to drive the blank covering whole die radius portion and the
wall of the die.

89
Figure 4.7 Deformed model during Step 5 in late stage
Figure 4.8 illustrates the fully-deformed model after Step 5. The punch moves up
to 50mm and blank is fully-deformed.

90
Figure 4.8 Fully-deformed model after Step 5
4.4 Summary
In this chapter, Abaqus 6.8 was used as pre-processing, solution and
post-processing tools to establish a numerical tool wear prediction model for
study of tool wear behaviours of a common stamping part. A customised wear
work calculation equation was developed based on Archard equation to be utilised
in the finite element analysis. In Abaqus/CAE module, an assembly model which
simulated a typical environment and structure of a deep drawing process was
91
created. The model consists of a die, a punch, a binder holder and a part. After
defining material properties of each part in the model, the model was meshed to
produce nodes and elements for the FEA followed by determined boundary
constraints and contact conditions. Five steps were applied in the analysis to
remove rigid body motion of the components before contact conditions constrain
them and sudden changes in contact conditions. After specifying parameters of the
solution, Abaqus would solve the specified problem.
92
CHAPTER 5 EXPERIMENTAL VALIDATION OF TOOL
WEAR PREDICTON MODEL
5.1 Introduction
To validate the numerical tool wear prediction model presented in Chapter 4, a
series of channel bending tests were conducted with a prescale film. Section 5.2
describes the experimental constraints. Section 5.3 introduces the working
principle of Fuji prescale film used in the experiments. Then, experimental
equipments are presented in Section 5.4, followed by experimental sequences in
Section 5.5. In Section 5.6, experimental results are discussed and compared with
the results obtained from the numerical simulations.
5.2 Experimental Constraints
The experiment was constrained by a number of key considerations defined by the
experimental environment, equipments availability and the research boundaries.
These constraints included:
(1) A 19×48 mm2 Fuji mono-sheet type prescale film was used in the
experimental set up as no pressure sensor, which could measure the real-time
contact pressures between two surfaces.
93
(2) A mild steel strip was used in the experiment instead of a DP steel strip. When
forming the DP steel, the high contact pressures led to the failure of the prescale
film. So it was necessary to use mild steel to reduce the contact pressures.
(3) Only maximum pressure was obtained from the experiment, as the prescale
film was only able to record the value of maximum contact pressures.
5.3 Fuji Prescale Film
5.3.1 Working principle of prescale film
Six types of prescale film are available to cover a wide range of pressure. Figure
5.1 summarises the film types and their corresponding pressure range [82]. A Fuji
Pre-scale Film consists of microcapsules filled with colour forming material.
When pressure is applied on the film, microcapsules are broken and distribution
and “density” of magenta colour is determined by true pressure distribution and
magnitude. When microcapsules are broken, their material is released and it reacts
with the colour developing material and this process will cause magenta colour
forming. The pre-scale films are designed with Particle Size Control (PSC)
Technology. Through PSC technology, microcapsules are designed to react to
various degrees of pressures, releasing the colour forming material at a density
corresponding to specific levels of applied pressure.
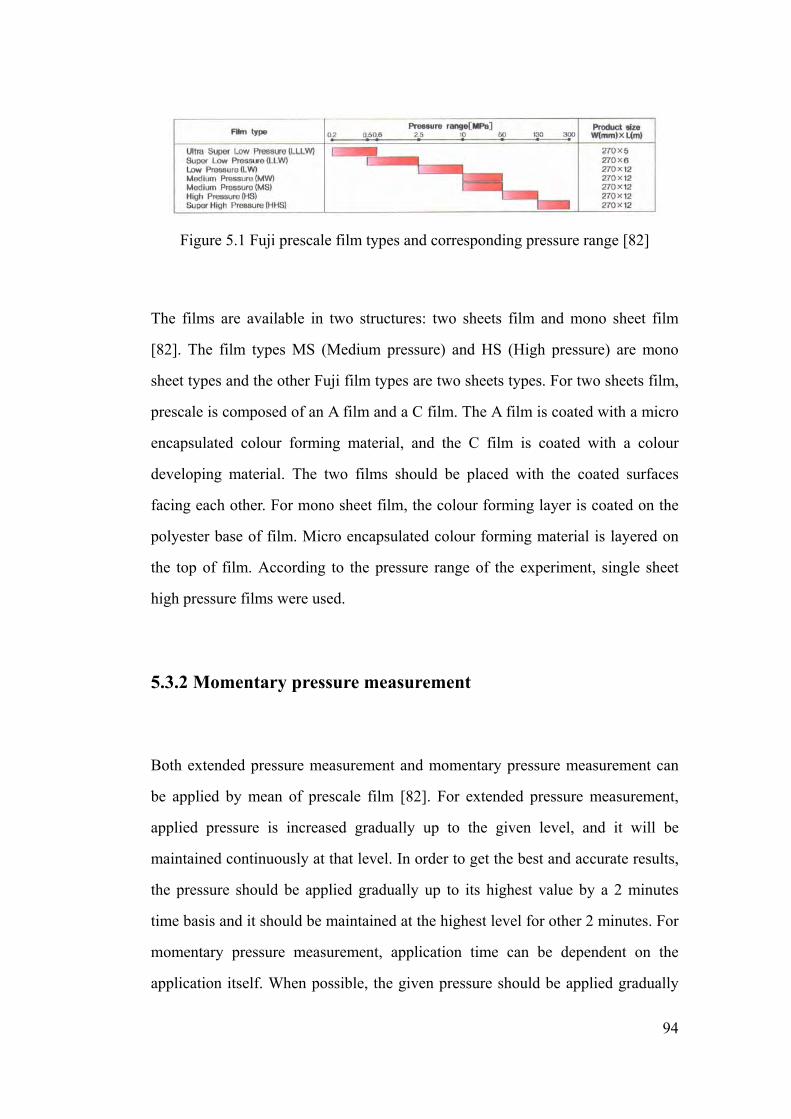
94
Figure 5.1 Fuji prescale film types and corresponding pressure range [82]
The films are available in two structures: two sheets film and mono sheet film
[82]. The film types MS (Medium pressure) and HS (High pressure) are mono
sheet types and the other Fuji film types are two sheets types. For two sheets film,
prescale is composed of an A film and a C film. The A film is coated with a micro
encapsulated colour forming material, and the C film is coated with a colour
developing material. The two films should be placed with the coated surfaces
facing each other. For mono sheet film, the colour forming layer is coated on the
polyester base of film. Micro encapsulated colour forming material is layered on
the top of film. According to the pressure range of the experiment, single sheet
high pressure films were used.
5.3.2 Momentary pressure measurement
Both extended pressure measurement and momentary pressure measurement can
be applied by mean of prescale film [82]. For extended pressure measurement,
applied pressure is increased gradually up to the given level, and it will be
maintained continuously at that level. In order to get the best and accurate results,
the pressure should be applied gradually up to its highest value by a 2 minutes
time basis and it should be maintained at the highest level for other 2 minutes. For
momentary pressure measurement, application time can be dependent on the
application itself. When possible, the given pressure should be applied gradually

95
up to its highest magnitude by a 5 seconds time basis, and it should be maintained
at the highest level for other 5 seconds.
As the momentary pressure measurement simulates the contact between the blank
and die radius more realistic than the extended pressure measurement, all
measurements in this experimental channel test are momentary pressure
measurement. To convert the obtained colour densities from the Fuji Pre-scale
films to a pressure, a momentary pressure chart as shown in Appendix B should
be used. The momentary pressure chart consists of several curves under various
determined temperatures and relative humidity. The proper curve can be selected
by determining the temperature and relative humidity first. With these values
known, the proper area corresponding to the proper pressure chart curve can be
selected from the chart.
5.4 Experimental Equipment
5.4.1 Erichsen sheet metal tester
A series of channel bend test was conducted in an Erichsen sheet metal tester
(Figure 5.2). Erichsen sheet metal tester is widely utilised at research,
development and in-process testing. Figure 5.3 shows the schematic of the tester.
It can increase drawing speed of the drawing punch, which, in addition to the
normal drawing speed range of 0 - 1,200 mm/min, can be adjusted in an infinitely
variable manner and independent of load, up to 3,000 mm/min. This is achieved
by using a separate oil circuit, fed by a pump with high volumetric displacement.
Contrary to the high speed attachment based on a nitrogen accumulator, here a

96
constant drawing speed behaviour is guaranteed over the total displacement of
150 mm. Various deep-drawing process parameters can be monitored from a PC
linked to the tester.
Figure 5.2 Erichsen sheet metal tester
Figure 5.3 Schematic of Erichsen sheet metal tester

97
5.4.2 Fuji mono-sheet type prescale film
Fuji mono-sheet type high pressure (HS) prescale films were used to measure the
maximum contact pressure between the die radius and blank by momentary
pressure measurement method.
5.4.3 Mild steel strip
The stress-strain curve of the mild steel was obtained from the tensile test
performed on an Instron 5567 Material Test Machine. A stress-strain curve was
then fitted using Eq. (5.1) that was subsequently used in the material setup for the
corresponding numerical simulation. Eq. (5.1) thus is the material equation for the
fitting of the strain-strain curve obtained by the experimental data. Table 5.1
summarises the material properties and fitted values of K, e, n of the mild steel
utilised in the channel bending tests.
nK e (5.1)
where σ is stress, ε is strain, and K, e, n are constants obtained from “curve”
fitting.

98
Table 5.1 Material properties and fitted values of K, e, n of mild steel
Blank (Mild steel)
Material definition Elastic-plastic
Young’s Modulus, E 205 GPa
Poisson’s ratio, v 0.3
K 569 MPa
e 0.268365
n 0.52493
5.5 Experimental Sequences
The temperature of the laboratory is 23° and the humidity is 58%. The
experimental channel bend tests are divided into six steps (Figure 5.4):
Step 1 A flat steel strip was continually formed into a channel section until 5
mm depth;
Step 2 Prescale film is placed on the flange surface of the steel strip, which was
contacted with the die radius portion of the die insert (Figure 5.5). To avoid
movement of the film, Vaseline was spread on the flange surface of the steel strip;
Step 3 The strip was then formed from 5 mm to 5.2 mm depth;
Step 4 The prescale film was removed, and the strip then continually formed to
a channel depth of 20 mm;

99
Step 5 Another unused prescale film was placed on the flange surface of the
steel strip as for Step 2;
Step 6 The strip was then formed from 20 mm to 20.2 mm depth.
(a) Step 1 (b) Step 2
(c) Step 3 (d) Step 4
(e) Step 5 (f) Step 6
Figure 5.4 Steps in channel test (black: mild steel strip, red: prescale films)
Figure 5.5 Placement of prescale film
100
The contact pressure distributions of forming 5.2 mm and 20.2 mm depth
channels were obtained from the various colour densities on the two prescale
films, respectively.
5.6 Experimental Results and Discussion
A comparison of the contact pressure distributions obtained from the experimental
channel bend test and the simulation is presented in Figure 5.6. Table 5.2
summaries the comparison of locations of contact pressure peaks from 0° angle
onward. The distinct strips identified from the prescale film indicate contact
pressure peaks. The density of red colour illustrates the values of the contact
pressure peak, however, the maximum value which can be determined is limited
to the maximum pressure that the prescale film can measure.
From the prescale film for the forming of the 5.2 mm depth channel, two distinct
pressure regions or stripes can be identified. The left stripe appears between 0 mm
and 1 mm from the start of the die radius (0°) and the right one is at 2 mm from
the start of the die radius. Compared with the sample chart of the colour densities,
the contact pressure indicated by the left right stripe exceeds 130 MPa, the highest
threshold of the measuring capability of the prescale film, and the contact pressure
of the next stripe is between 82 MPa and 98 MPa. The results from simulations
indicate that the first peak appears between 0 mm to 1 mm from 0° and its value is
205 MPa. The second peak is located at the position of 2 mm from 0° and its
value is 91 MPa.

101
Figure 5.6 Comparison of contact pressure distributions obtained from tests and
simulations
Two stripes can also be identified on the prescale film at a forming depth of 20.2
mm. The left stripe, between 0 mm and 1 mm from the start of the die radius, is
distinct and the contact pressure indicated by this strip exceeds 130 MPa. The
right one ranging from 3 mm to 6 mm is less distinct with a contact pressure from
50 MPa to 66 MPa. The results from the simulations reveal that the first peak of
contact pressure of 223 MPa appears between 0 mm and 1 mm from 0°, and the
second peak of contact pressure of 61 MPa is located between 3 mm and 6 mm
from 0°.
Table 5.2 Comparison of locations of contact pressure peaks from 0°
Mild steel strip forming range Peak Number
Location of contact pressure peaks from 0°On prescale film On simulation graph
5 mm to 5.2 mm First peak 0 – 1 mm 0 – 1 mm
Second peak 2 mm 2 mm
20 mm to 20.2 mm First peak 0 – 1 mm 0 – 1 mm
Second peak 3 – 6 mm 3 – 6 mm
Prescale film for 5.2 mm
drawing depth
Prescale film for 20.2 mm
drawing depth
50 66 82 98 114 130+ MPa
102
Comparing the results obtained from the prescale film with the results from the
simulation, it is concluded that the contact pressure distributions indicated by the
prescale films are consistent with those from the simulation.
5.7 Summary
In this chapter, a series of channel bending test were conducted with prescale film.
The experimental constraints were presented. The working principle of Fuji
prescale film used in the experiments was introduced. Experimental equipments
and experimental sequences were discussed. The experiments have validated the
numerical tool wear prediction model presented in Chapter 4 and shown that the
contact pressure distributions indicated by the prescale films are consistent with
those from the simulation.The numerical tool wear prediction model will be
utilised in the investigation of die radius profile on wear behaviour, the
investigation of control parameters on wear behaviour and the optimisation of die
radius profile as described in subsequent chapters.
103
CHAPTER 6 INVESTIGATION OF DIE RADIUS ARC
PROFILE ON WEAR BEHAVIOUR
6.1 Introduction
Tool geometry plays an important role in affecting the tool life of sheet metal
stamping of AHSS. However, very little work seems to have been done on
determination of exact die geometry to reduce tool wear in sheet metal stamping
of AHSS. This chapter presents the influences of die arc profile on wear
behaviour for AHSS. Section 6.2 illustrates variation of die radius profiles. In
Section 6.3, the effects of various geometries of radius arc profiles, including
standard circular profiles, high elliptical profiles, and flat elliptical profiles, on the
wear volume and contact pressure distribution along the radii are discussed.
6.2 Variation of Die Radius Profiles
Cases with various die radius profile were studied using the finite element tool
wear model as illustrated in Figure 6.1. The blank material is AHSS DP780 with a
width of 25 mm. Table 6.1 summarises the material properties of the blank and
the tools used in the model.

104
Table 6.1 Material properties of DP780 blank and die [5]
Blank (DP780) Die
Material definition Elastic-plastic Elastic
Young’s Modulus, E 205 GPa 210 GPa
Poisson’s ratio, v 0.3 0.3
Yield strength, 480 MPa -
Ultimate Tensile
Strength, 780 MPa -
Three regular types of the die radius profile (Table 6.2 and Figure 6.1) were
investigated in the simulations, including standard circular curves, high elliptical
curves and flat elliptical curves.
(a) (b) (c)
(a) Standard circular profile; (b) High elliptical profile; (c) Flat elliptical profile
Figure 6.1 Three regular types of die radius profile
CR15
CR10
CR5
FER15r5
FER10r5
FER5r5
(CR5)
HER5r15
HER5r10
HER5r5
(CR5)

105
Table 6.2 Various die radius profiles used in simulations
Case Number Shape of die radius Radius (mm)
CR5 Circular curve 5
CR10 Circular curve 10
CR15 Circular curve 15
Case Number Shape of die radius Radius in x
direction (mm)
Radius in y
direction (mm)
HER5r10 High elliptical curve 5 10
HER5r15 High elliptical curve 5 15
FER10r5 Flat elliptical curve 10 5
FER15r5 Flat elliptical curve 15 5
An assembly tool wear prediction model for Abaqus developed in Chapter 4 is
used for the investigation. The model consists of a die, a punch, a binder holder
and a part. After defining material properties of each part in the model, the model
was meshed to produce nodes and elements for the FEA followed by determined
boundary conditions. However, to obtain higher accuracy, the die radius arc was
meshed more finely. The contact characteristics between each component need to
be defined as well. A series of steps with loading was applied on the punch to
drive the deep-drawing process to stretch the part. These procedures are referred
to as the pre-processing procedures. After specifying parameters of the solution,
Abaqus would solve the specified problem. The tool wear work results are
obtained from the post-processing of the simulations.

106
6.3 Results and Discussion
6.3.1 Standard circular profiles
From wear work model of Eq (4.9), it is concluded that the contact pressure plays
a significant role in tool wear. Figures 6.2 – 6.4 show the contact pressure over the
die radius as a colour contour graph. Three cases, including CR5, CR10 and CR15,
are studied. With the standard circular profiles, the maximum contact pressure was
reduced as the radius increased. The maximum contact pressure applied on the die
radius with CR5 profile was 1130 MPa, which is approximately twice that of
CR15 profile. It is found that the colour contour for all three cases can be divided
into three distinct zones, which are caused by different mechanisms.
Zone 1 is located at the area near 0°. In this area, the blank is constrained by the
blank holder pressure and is restricted to slide over the die radius (Figure 6.5).
The contact pressure in this zone decreases as the die radius increases.
Zone 2 is a bold straight line from the bottom left corner to the upper right corner
in the contour plots. The slope of the line is related to the radius of the circular
profile. As the radius increased, so did the slope of the line. The high contact
pressure revealed in this zone is caused by the relative tangential sliding
movement between the blank and the die radius which results in the concentrated
contact force at the tangent point (Figure 6.5). Because the tangent point is
moving toward 90 ° during the punch travel instead of remaining fixed, the shape
of Zone 2 is shown as a straight line from bottom left to the upper right corner.
However, Zone 2 does not cross the entire die radius and entire punch travel as the

107
blank and the die radius completely overlap after a certain time point. The
maximum contact pressure was located at Zone 2.
Figure 6.2 Contact pressure over die radius with CR5 profile
Figure 6.3 Contact pressure over die radius with CR10 profile
Zone 2
Zone 1Angular interval of Zone
Zone 3
Zone 2
Zone 3
Zone 1 Angular interval of Zone 3

108
Figure 6.4 Contact pressure over die radius with CR15 profile
Figure 6.5 Cause of high contact pressure of standard circular profiles
The angular interval of Zone 3 was from 20° to 40° with various beginning and
ending angles depending on the radius of the profiles. The larger the radius, the
wider the angular interval was. As the radius increased from 5 mm to 15 mm, the
interval moved toward 90°. With the CR5 profile, the beginning angle was 10°
and the ending angle was 30°. The beginning and ending angles increase to 35°
and 60°, respectively, for the CR10 profile. As the radius increased to 15 mm radii,
the angular interval was located between 30° and 70°. The critical high contact
Zone 3
Angular interval of Zone 3
Zone 2
Zone 1
Zone 3
Zone 1 Zone 2

109
pressure in Zone 3 results from the relative sliding movement between the die
radius and the blank after the die radius and the blank completely overlap (Figure
6.5).
Figure 6.6 shows the wear work over the die radius with the standard circular
profiles. It is concluded that the maximum wear work is located at the zone near
0° and can be reduced by enlarging the radius of the circular profile. Besides the
maximum wear work, another peak value of the wear work occurs at the area
between 10° to 30°, 35° to 60°, and 30° to 70°, with CR5, CR10 and CR15
profiles, respectively. This is mainly caused by the relative tangential sliding
movement between the blank and the die radius.
Figure 6.6 Wear work over die radius with standard circular profiles

110
6.3.2 High elliptical profiles
Figures 6.7 and 6.8 show the contact pressure over die radius with high elliptical
profiles with y-radius of 10 mm and 15 mm respectively. Compared with the
standard circular profiles, the three zones are less distinct. Zone 1 with critical
high contact pressure is narrower than that of the standard circular profiles. It
suggests that the sharp curvature of the die radius near 0° leads to a concentration
of force and restriction of the steel strip from sliding freely (Figure 6.9). The
maximum contact pressure with HER5r15 and HER5r10 high elliptical profiles
are twice and three times as large as that of CR5 circular profile, respectively.
However, enlarging of the length of the y axis has no dominant influence on the
maximum contact pressure.
Figure 6.7 Contact pressure over die radius with HER5r10 profile
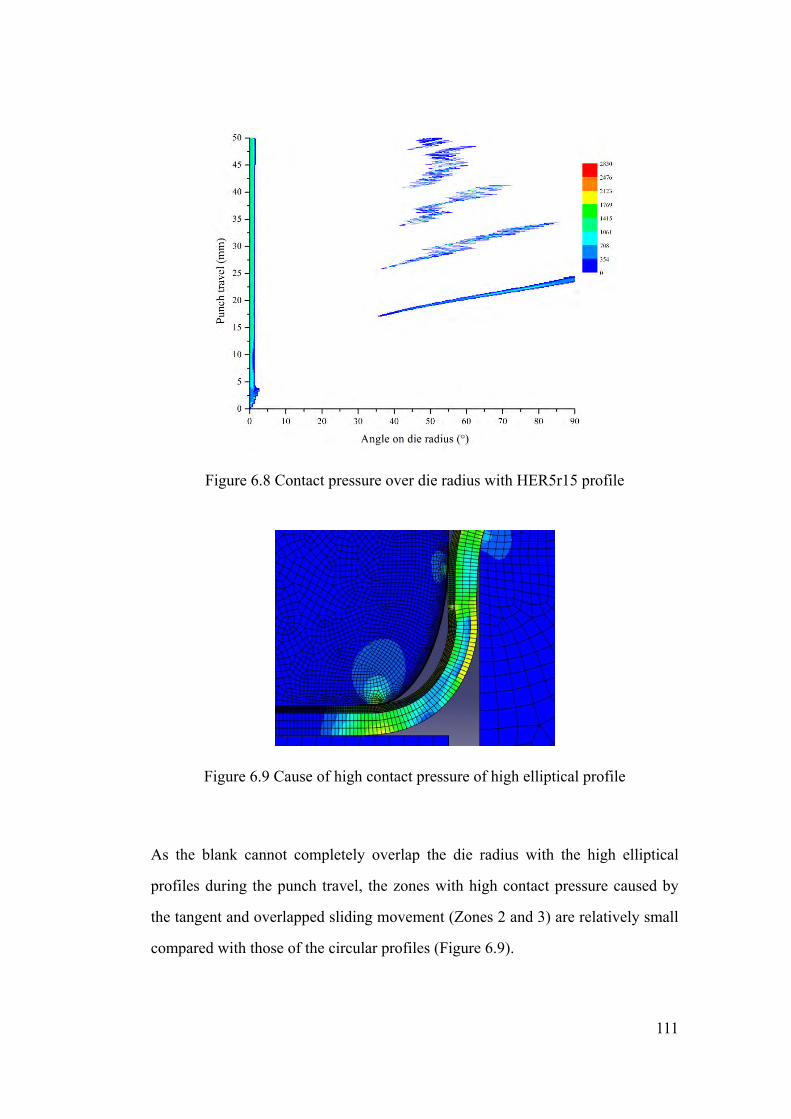
111
Figure 6.8 Contact pressure over die radius with HER5r15 profile
Figure 6.9 Cause of high contact pressure of high elliptical profile
As the blank cannot completely overlap the die radius with the high elliptical
profiles during the punch travel, the zones with high contact pressure caused by
the tangent and overlapped sliding movement (Zones 2 and 3) are relatively small
compared with those of the circular profiles (Figure 6.9).

112
Figure 6.10 shows the wear work over the die radius with high elliptical profiles.
The maximum wear work lies mainly at the zone near 0° with the high elliptical
profiles, which is approximately twice that of CR5 profile. It is noted that this
zone is the dominant wear location of the die radius with these profiles. However,
the profiles show very low wear work for almost all zones of the die radius.
Thus the application of high elliptical profiles seems to have a significant
influence on reducing the wear work at the area between 3° and 90°, compared
with that of the standard circular profile, despite the location of the peak moving
towards to 90°.
Figure 6.10 Wear work over die radius with high elliptical profile
6.3.3 Flat elliptical profiles
Figures 6.11 and 6.12 show the contact pressure over die radius with flat elliptical
profiles with x-radius of 10 mm and 15 mm respectively. The critical locations of
the high contact pressure of the flat elliptical profiles can also be divided into

113
three zones. Zones 1 and 2 are similar to those of the standard circular profiles.
Figure 6.11 Contact pressure over die radius with FER10r5 profile
Figure 6.12 Contact pressure over die radius with FER15r5 profile
Because of the larger contact area between the die and blank, the contact pressure

114
of Zone 1 is reduced (Figure 6.13). Zone 3 is located at the area near 90° with a
discrete character in values of the contact pressure. The maximum contact
pressure is located at Zone 3 due to the shape curvature of the area near 90°.
However, the increase of the length of the x axis has no significant influence on
the maximum contact pressure of the die radius with flat elliptical profiles.
Figure 6.13 Cause of high contact pressure of flat elliptical profile
Figure 6.14 Wear work over die radius with flat elliptical profiles

115
Figure 6.14 shows wear work over the die radius with the flat elliptical profiles. It
is noted that the maximum wear work of the flat elliptical profiles is located at the
zone near 90°. The zone near 0° is still a high tool wear location for the flat
elliptical profiles, but the values are lower than the high elliptical profiles and
radius profile. It is seen that increase of the length of the x axis can decrease the
tool wear near in the middle zones, but has no significant influence on another
peak near 90°.
6.4 Summary
This study investigated the influence of various die radius profiles on the tool
wear parameters, including contact pressure and accumulated wear work. The
following conclusions are drawn from the results:
(1) The colour contour of the high contact pressure on the die radius can be
divided into three distinct zones in all cases. Each zone reveals the different
characteristics of the cause and pattern of the high contact pressure as well as tool
wear. The reaction force caused by the blank is constrained by the blank holder
pressure and is restricted from sliding over the die radius. This results in a high
contact pressure in Zone 1. Relative tangential sliding movement between the die
and blank leads to high contact pressure in Zone 2. Critical contact pressure in
Zone 3 is produced by the overlapped movement of the die and blank.
(2) The dominant zone leading to maximum contact pressure and tool wear
severity depends on the geometry of die radius profile under the same material
and process conditions. Both Zones 1 and 2 are critical for the standard circular

116
profiles. However, Zones 1 and 3 play a significant role for high and flat elliptical
profiles, respectively.
(3) For standard circular profiles, the maximum contact pressure and tool work
drops significantly when the radius increases.
(4) For high elliptical profiles, the most critical high contact pressure and tool
wear work is located at the area near 0°. The high elliptical profiles produce low
wear work during 90% of the die radius zones than the standard circular profile or
flat elliptical. However, enlarging of the length of the y axis has no dominant
influence on the maximum contact pressure.
(5) For flat elliptical profiles, the area near 90° is critical for high contact
pressure and tool wear work. However, the profile does not provide better wear
work compared to other profiles. The increase of the length of the x axis has no
significant influence on the maximum contact pressure.
(6) There are two peaks of the accumulated tool wear work in all cases, but the
locations vary. The value and location of the peaks depends on the various
influences of the three zones with high contact pressure. The zone near 0° is the
common zone for server tool wear in all cases. However, for the flat elliptical
profile, the zone near 90° is the severest tool worn area.
(7) The geometry of draw die radius has a significant influence on the tool wear,
and standard circular and high elliptical curves can lead to the achievement of
reduced and uniform wear distribution along most of the zones of the draw die
radius arc.
(8) The results suggest that to minimise tool wear using this approach it would be
necessary to optimise the shape for a particular combination of circular and high
elliptical profiles in relation to the material type, thickness and forming process.
117
CHAPTER 7 INVESTIGATION OF CONTROL
PARAMETERS ON WEAR BEHAVIOUR
7.1 Introduction
Control parameters in stamping process do affect the distribution of wear
behaviour. The wear, especially adhesive wear, varies with the change of control
parameters including lubrication coefficient, material strength, and blank
thickness in deep-drawing process [5, 19, 64, 83]. However, previous work
regarding the influences of these control parameters on tool wear distribution
mainly focused on the circular die radius profile. To study the influences of
various control parameters on tool wear distribution for various die radius
geometries, this chapter investigates the effects of process control parameters on
the severity of wear in deep-drawing process using numerical simulations. Section
7.2 illustrates the types of control parameters and material properties used in this
study. In Section 7.3, the influence of these control parameters on tool wear work
with different die radius profiles, including a circular profile, a flat elliptical
profile and a high elliptical profile, is presented in detail.
7.2 Variation of Control Parameters
Cases with various control parameters for different die radius profile are studied
using the finite element tool wear model illustrated in Figure. 4.1. The material of
the blank strip is AHSS DP780 and the width of the blank strip is 25 mm. Table

118
7.1 summarises the material properties of blank and tools used in this
investigation.
Table 7.1 Material properties of DP780 blank and die [5]
Blank (DP780) Die
Material definition Elastic-plastic Elastic
Young’s Modulus, E 205 GPa 210 GPa
Poisson’s ratio, v 0.3 0.3
Yield strength, 480 MPa
Ultimate Tensile Strength, 780 MPa
Three types of the die radius profile (Table 7.2) and six control parameters (Table
7.3) were investigated in the simulations, including standard circular curves, high
elliptical curves and flat elliptical curves.
Table 7.2 Die radius profiles in simulations
Case Number Shape of die radiusRadius in x direction
(mm)
Radius in y direction
(mm)
CR5 Circular curve 5 5
F510 Flat elliptical curve 10 5
H510 High elliptical curve 5 10
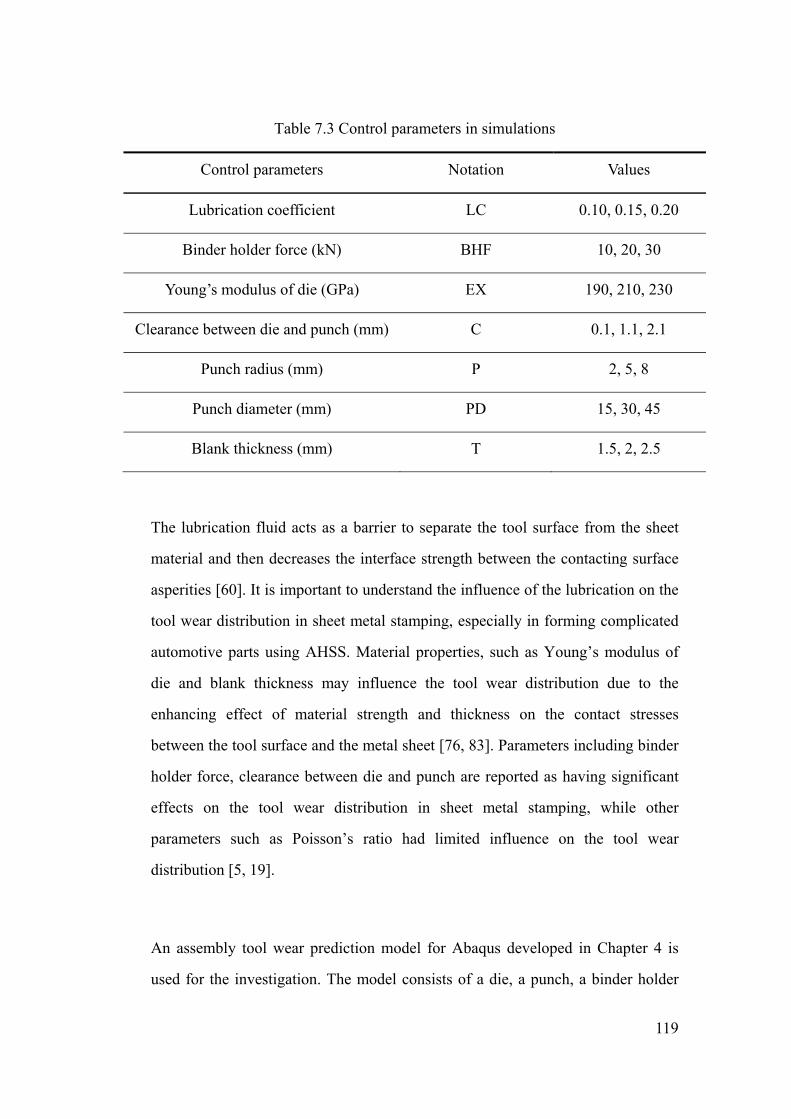
119
Table 7.3 Control parameters in simulations
Control parameters Notation Values
Lubrication coefficient LC 0.10, 0.15, 0.20
Binder holder force (kN) BHF 10, 20, 30
Young’s modulus of die (GPa) EX 190, 210, 230
Clearance between die and punch (mm) C 0.1, 1.1, 2.1
Punch radius (mm) P 2, 5, 8
Punch diameter (mm) PD 15, 30, 45
Blank thickness (mm) T 1.5, 2, 2.5
The lubrication fluid acts as a barrier to separate the tool surface from the sheet
material and then decreases the interface strength between the contacting surface
asperities [60]. It is important to understand the influence of the lubrication on the
tool wear distribution in sheet metal stamping, especially in forming complicated
automotive parts using AHSS. Material properties, such as Young’s modulus of
die and blank thickness may influence the tool wear distribution due to the
enhancing effect of material strength and thickness on the contact stresses
between the tool surface and the metal sheet [76, 83]. Parameters including binder
holder force, clearance between die and punch are reported as having significant
effects on the tool wear distribution in sheet metal stamping, while other
parameters such as Poisson’s ratio had limited influence on the tool wear
distribution [5, 19].
An assembly tool wear prediction model for Abaqus developed in Chapter 4 is
used for the investigation. The model consists of a die, a punch, a binder holder

120
and a part. After defining material properties of each part in the model, the model
was meshed to produce nodes and elements for the FEA followed by determined
boundary conditions. However, to minimise the computation time, the die radius
arc was discretised into 30 segments. The contact characteristics between each
component need to be defined as well. A series of steps with loading was applied
on the punch to drive the deep-drawing process to stretch the part. These
procedures are referred to as the pre-processing procedures. After specifying
parameters of the solution, Abaqus would solve the specified problem. The tool
wear work results are obtained from the post-processing of the simulations.
7.3 Results and Discussion
7.3.1 Lubrication coefficient
Figure 7.1(a) to Figure 7.1(c) show the variation of tool wear work over the
various die radii angles with lubrication coefficients (LC) 0.10, 0.15 and 0.20 for
three types of die radius profiles, i.e. circular profiles, flat elliptical profiles and
high elliptical profiles.
For the circular profiles, as shown in Figure 7.1(a), the wear work for all three
cases peaks at the location near 0° with similar values. It reflects that the
lubrication coefficient has less effect on the first peak of the wear work. However,
in all three cases, though the positions of the second peak are similar and range
from 30° to 50 °, the values vary. Higher lubrication coefficient leads to higher
wear work.

121
For the flat elliptical profiles, as shown in Figure 7.1(b), in all cases, the values of
the wear works are similar. The first peak appears at the location near 0°. Then the
values of the wear work reduce to near zero and climb dramatically to
approximately 25 GPamm at the location of 80°. The lubrication coefficient has
insignificant effects on the tool wear distribution for the flat elliptical profiles.
(a) Circular die radius
(b) Flat elliptical die radius (c) High elliptical die radius
Figure 7.1 Wear work over die radius with various lubrication coefficients for three
die radius arc profiles
For the high elliptical profiles, as shown in Figure 7.1(c), in all cases, the
maximum tool wear work rises dramatically at the zone near 0° which is

122
approximately two times larger than that of the circular profile. Then the values of
the wear work reduce sharply to near zero and the second peaks of all cases
appear after the location of 50° with relatively smaller values. The dominant worn
location of the flat elliptical profile is located near 90 °. It is concluded that the
lubrication coefficient has less effect on the first peak of wear work but can vary
the location of the second peak.
7.3.2 Binder holder force
Figure 7.2(a) to Figure 7.2(c) show the variation of tool wear work over the
various die radii angles with various binder holder forces (BH) 10 kN, 20 kN and
30 kN for the three types of die radius profiles.
For the circular profiles, in all cases, high binder holder pressure force causes high
wear work over the die radius, which results in the non-uniform tool wear pattern.
The first peaks of the wear work in all cases appear near the locations between 5°
and 10°. And then the wear work reduces to lower values. The locations of second
peaks in three cases vary between 20° and 40° and their values have small
differences as well.
The binder holder force also has no impact on the wear work for flat elliptical
profiles. The first peak of the wear work appears at 5° and then the wear work
decreases gradually to zero and climbs sharply again to the second peak near 80°.
The binder holder force also has no impact on the wear work for high elliptical
profiles. The first peak of the wear work appears at 3° which is approximately two

123
times larger than that of the circular profile. And then the wear work decreases
dramatically to zero and climbs again to the second peak at 70° with a smaller
value compared with the value of the first peak.
(a) Circular die radius
(b) Flat elliptical die radius (c) High elliptical die radius
Figure 7.2 Wear work over die radius with various binder holder forces for three die
radius arc profiles
7.3.3 Young's modulus of die
Figure 7.3(a) to Figure 7.3(c) show the variation of tool wear work over the

124
various die radio angles with various die materials for the three types of die radius
profiles. The variation in Young’s modulus (EX) 190 GPa, 210 GPa and 230 GPa
represents the variation in die materials. It is concluded that Young’s modulus of
the die material has no significant influence on wear work for all die radius
profiles.
(a) Circular die radius
(b) Flat elliptical die radius (c) High elliptical die radius
Figure 7.3 Wear work over die radius with various Young’s modulus of die for
three die radius arc profiles
For the circular profiles, the first peak of the wear work in all cases appears near

125
the location of 10°. And then the wear work reduces to a lower value. The
locations of second peaks in three cases are near 30° with relatively low values.
The Young’s modulus of die material has no impact on the wear work for flat
elliptical profiles. The first peak of the wear work appears at 5° and then the wear
work decreases gradually to zero and climbs sharply again to the second peak near
80°.
The Young’s modulus of die material has no impact on the wear work for high
elliptical profiles as well. The first peak of the wear work is approximately two
times larger than that of the circular profile, which appears at the 3°. And then the
wear work decreases dramatically to zero and climbs again to the second peak at
70° with a smaller value compared with the value of the first peak.
7.3.4 Clearance between die and punch
Figure 7.4(a) to Figure 7.4(c) show the variation of tool wear work over the
various die radii angles with various clearances between die and punch (C) 0.1
mm, 1.1 mm and 2.1 mm for the three types of die radius profiles.
The clearance has less impact on the wear work of the circular profiles, though it
can result in slight difference on the second peaks of wear works in the location
between 30° and 50°. However, it has no significant influence on the first peak of
the wear work.

126
However, the clearance has significant influences on the wear work of flat
elliptical profiles. Less clearance causes dramatically higher second peaks of the
wear works of these profiles on the location between 60° and 90°. However, it has
no noticeable effects on the first peak of the wear work.
(a) Circular die radius
(b) Flat elliptical die radius (c) High elliptical die radius
Figure 7.4 Wear work over die radius with various clearances between die and
punch for three die radius arc profiles
For the high elliptical profiles, the clearance has no remarkable influence on the
first peak of wear work. However, it has limited influence on the second peak of
the wear work. Larger clearance leads to the decreased second peak of the wear

127
work.
7.3.5 Punch radius
Figure 7.5(a) to Figure 7.5(c) show the variation of tool wear work over the
various die radii angles with various punch radius (P) 2 mm, 5 mm and 8 mm for
the three types of die radius profiles. It is concluded that punch radius has no
significant influence on wear work for all die radius profiles.
For the circular profiles, in all cases, the wear work peaks near the location of 10°.
And then the wear work decreases gradually. At the location near 30°, the wear
work of all three cases reach their second peaks with relatively low values.
The punch radius has no impact on the wear work for flat elliptical profiles. The
wear work achieves its first peak at 5° and then the wear work decreases gradually
to zero and climbs sharply again to the second peak near 80°.
The punch radius has no impact on the wear work for high elliptical profiles as
well. At the location of 3°, the wear work reaches its first peak, at which the value
is two times larger than that of the circular profile. And then the wear work
decreases significantly to zero and climbs again to the second peak at 70° with a
smaller value compared with the value of the first peak.

128
(a) Circular die radius
(b) Flat elliptical die radius (c) High elliptical die radius
(b) Flat elliptical die radius (c) High elliptical die radius
Figure 7.5 Wear work over die radius with various punch radius for three die radius
arc profiles
7.3.6 Punch diameter
Figure 7.6(a) to Figure 7.6(c) shows the variation of tool wear work over the
various die radii angles with various punch diameters (PD) 15 mm, 30 mm and 45
mm for the three types of die radius profiles.

129
For the circular profiles, the punch diameter has no significant effect on the wear
work. In all cases, the wear work peaks near the location of 10°. And then the
wear work decreases gradually. At the location near 30°, the wear work of all
three cases reach their second peaks with relatively low values.
(a) Circular die radius
(b) Flat elliptical die radius (c) High elliptical die radius
Figure 7.6 Wear work over die radius with various punch diameters for three die
radius arc profiles

130
The punch diameter has limited impact on the wear work for flat elliptical profiles.
The peak values of wear work with 30 mm punch diameter are slightly more than
those with 15 mm and 45 mm punch diameters. The wear work achieves its first
peak at 5° and then the wear work decreases gradually to zero and climbs sharply
again to the second peak near 80°.
The punch diameter has very slight influence on the wear work for high elliptical
profiles as well. The 30 mm punch diameter results in largest peak values in three
cases. At the location of 3°, the wear work reaches its first peak, at which the
value is two times larger than that of the circular profile. And then the wear work
decreases significantly to zero and climbs again to the second peak at 70° with a
smaller value compared with the value of the first peak.
7.3.7 Blank thickness
Figure 7.7(a) to Figure 7.7(c) show the variation of tool wear work over the
various die radii angles with various blank thicknesses (T) 1.5 mm, 2.0 mm and
2.5 mm for the three types of die radius profiles. It is noted that punch radius has
significant influences on the second peak value of wear work for all die radius
profiles.
For the circular profiles, in all cases, the wear work peaks near the location of 10°.
And then the wear work decreases gradually. The change of blank thickness has
limited effects on the first peak value. However, the increase of blank thickness
leads to higher second peak value of wear work.

131
For flat elliptical profile, the variation of thickness has less effect on the first peak
value. However, the variation of the thickness results in the change of locations
for the second peak values, at which the locations are ranging from 70° to 90°.
(a) Circular die radius
(b) Flat elliptical die radius (c) High elliptical die radius
Figure 7.7 Wear work over die radius with various blank thicknesses for three
die radius arc profiles
The variation of thickness also results in noticeable changes of the second peak,
both location and value, for the high elliptical profile. However, the influence of
the thickness on the first peak of the wear work is less significant compared with

132
that of the first peak.
7.4 Summary
It is concluded that various control parameters have different impacts on the tool
wear of die radius, depending on the specified die radius profile. Table 7.4
summarises the impact of these parameters. For the circular profile, lubrication
coefficient, binder holder force and blank thickness play critical roles in the wear
work distribution. Clearance between die and punch and blank thickness can
significantly affect the wear work distribution for the flat elliptical profiles.
Lubrication coefficient, clearance between die and punch and blank thickness are
three major factors which control the wear work distribution for the high elliptical
profiles.

133
Table 7.4 Impacts of control parameters on wear work
(S: Significant impact; L: Less impact; N: No impact)
Control parameters Circular profileFlat elliptical
profile
High elliptical
profile
Lubrication coefficient S N S
Binder holder force S N N
Young’s modulus of die N N N
Clearance between die and
punch L S S
Punch radius L N N
Punch diameter N L L
Blank thickness S S S

134
CHAPTER 8 OPTIMISATION OF DIE RADIUS
GEOMETRY
8.1 Introduction
In Chapter 6, it was concluded that to minimise tool wear using the approach of
varying tool radius profile, it would be necessary to optimise the shape for a
particular combination of circular and high elliptical profiles in relation to the
material type, thickness and forming process. This chapter presents a
methodology to optimise a die radius profile. For this, a specialised software
routine is developed and compiled for optimisation of die radius profiles to
minimise or achieve uniform contact pressure (wear distribution) using Python
computer programming language. Python computer programming language is the
programming tool supported by Abaqus. Section 8.2 presents the Graphical User
Interface of the specialised software routine. In Section 8.3, a detailed algorithm
for the optimisation is explained. A case study based on the algorithm is discussed
in Section 8.4.
8.2 Graphical User Interface
As Abaqus is commercial general finite element software, establishment of a tool
wear prediction model for a unique combination of geometries and control
parameters will require a time-consuming trial and error approach by designers.
To simplify the task, first a graphical user interface (GUI) is developed by Python
135
programming language. The use of GUI provides the following advantages:
(1) It dramatically decreases the time on the modelling to few minutes instead of
hours;
(2) It provides a convenient visualised GUI for designers to directly input their
specified geometric and control parameters instead of considering details of
the modelling;
(3) It ensures the consistency of all cases, such as the coordinate system, datum
surface and datum axis, and it guarantees the standard and accuracy of the
FEA simulations.
Figures 8.1-8.3 illustrate the GUI created using the Python computer
programming language. The GUI consisted of three tabs for geometry, process
parameters and simulation settings. In the tab named “Geometry”, designers can
input all geometric parameters of the model without considering detailed
modelling procedures. In the tab called “Process Parameters”, various control
parameters can be directly input into the corresponding spaces. And simulation
settings can also be specified in the “simulation setting” tab. The whole simulation
can then be automatically run by clicking the “OK” button. However, users can
always preview the model in advance by clicking the “Preview” button.

136
Figure 8.1 GUI for “Geometry” created using Python programming language

137
Figure 8.2 GUI for “Process Parameters” created using Python programming
language

138
Figure 8.3 GUI for “Simulation Setting” created using Python programming
language

139
8.3 Algorithm for Die Radius Optimisation
To optimise the die radius profile, a customised algorithm is developed and
applied in the optimisation process. The main point of the algorithm is to optimise
the die radius geometry by changing the effective radii along the die radius profile
through the iteration process.
Figure 8.4 Die radius profile
Figure 8.5 Accumulated wear work along die radius
A
node i
Ri,j
B
S
S
Wi - W

140
The initial geometry of the die radius is set as a standard circular profile as shown
in Figure 8.4. The whole profile is divided into n equal segments. Each division
point will be used as a node for meshing the profile in Abaqus. For example, point
i is also node i in the finite element model, where i = 0 ~ n. In the proposed
algorithm, the first point A and the last point B of the profile (See Figure 8.2) are
assumed to be fixed. It is assumed that after mth simulation, the optimised profile
is obtained, where j = 1 ~ m.
The algorithm will generate an optimised die radius profile. The optimised die
radius profile should provide a uniform wear work distribution at all points on die
radius angles.
Let us consider a case of an unoptimised wear work distribution profile as shown
in Figure 8.5. Let us consider that the optimised wear work distribution profile is a
uniform sinusoidal type of distribution as shown in Figure 8.5. This uniform
distribution profile has a maximum variation of magnitude of “S” with respect to
the mean line (red line) as shown in that figure. Let us define the following
parameters for the development of the proposed algorithms.
Ri,j – Effective radius on the node i in the simulation j
Wi.j – Accumulated wear work on the node i in the simulation j
W – Nominated average accumulated wear work required (Red line in Figure 8.3)
S – Maximum variation of accumulated wear work allowed
Si,j – Variation of accumulated wear work on the node i in the simulation j,
Si,j = Wi,j – W (Dash lines in Figure 8.5)

141
Figure 8.6 Flow chart of proposed algorithm
f i,j – Control coefficient for changing the effective radius
fi,j= k |Ri-Ri-1|
k – Constant defined by user to determine the control coefficient f
n – Number of segments along die radius profile
142
m – Number of simulations (If the number of simulations exceeds m and the
optimised result is still not found, the whole simulation is terminated)
The flow chart of the functioning of the algorithm is as shown in Figure 8.6.
According to this algorithm, the Abaqus simulation will take the input data and
work out the wear work for each point selected for the die radius profile of Figure
8.4.
Thus, after each simulation, the accumulated wear work is calculated for each
node. Effective radius of each node is then adjusted according to the difference
between the nominated average accumulated wear work and actual accumulated
wear work. If the accumulated wear work is much larger (exceeding the variation
allowed), the effective die radius would be decreased. If the accumulated wear
work is much smaller (below the variation allowed), the effective die radius would
be increased. If the accumulated wear work is averaged (within the variation
allowed), then the effective die radius would remain unchanged. This can be
written as follows:
If |Si,j| > S, then Ri,j+1 = Ri,j – f Si,j
If |Si,j| < S, then Ri,j+1 = Ri,j
The next simulation is run after the adjustment of effective die radii (the position
of nodes). The simulation will finish if the variation between the nominated
average accumulated wear work and actual accumulated wear work for all nodes
is within the maximum variation allowed, i.e. the accumulated wear work result
curve is within the space between two dash lines in Figure 8.5.

143
8.4 Case Study
8.4.1 Optimisation parameters settings
To apply the GUI and the algorithm developed in the previous sections, a case
study will be presented for the circular die profile. Circular curve with 5 mm die
radius, i.e. CR5 curve, is selected as the original un-optimised curve. The blank
material is AHSS DP780 with a width of 25 mm. Table 8.1 shows the material
properties of the blank and the tools.
Table 8.1 Material properties of DP780 blank and die
Blank (DP780) Die
Material definition Elastic-plastic Elastic
Young’s Modulus, E 205 GPa 210 GPa
Poisson’s ratio, v 0.3 0.3
Yield strength, 480 MPa -
Ultimate Tensile
Strength, 780 MPa -
The die radius curve is divided into 30 divisions (See Figure 8.7), and the
effective radius R at these 31 division points can be adjusted after each simulation.
After each simulation, the average accumulated wear work is calculated, and then
the effective radius R of these points is adjusted according to the prescribed

144
algorithm. Due to the time-consuming simulations (approximately 5 hours for
each single simulation), only 20 simulation loops are performed during the
optimisation. The optimised die radius profile will be selected from the results of
these simulations using lowest mean value.
Figure 8.7 Divisions of die radius profile
8.4.2 Results and discussion
Table 8.2 summaries the results of the simulation for the effective radius R at the
31 division points for CR5 curve and the optimised curve. Figure 8.8 illustrates
the positions of 31 division points of optimised curve.

145
Table 8.2 Effective radius R for CR5 and optimised curves
Point i RCR5 ROptimised Point i RCR5 ROptimised
1 5.000 5.000 17 5.000 5.112
2 5.000 4.987 18 5.000 5.119
3 5.000 4.977 19 5.000 5.133
4 5.000 4.981 20 5.000 5.148
5 5.000 4.990 21 5.000 5.152
6 5.000 5.012 22 5.000 5.161
7 5.000 5.025 23 5.000 5.157
8 5.000 5.046 24 5.000 5.141
9 5.000 5.058 25 5.000 5.120
10 5.000 5.063 26 5.000 5.094
11 5.000 5.072 27 5.000 5.060
12 5.000 5.081 28 5.000 5.032
13 5.000 5.083 29 5.000 5.017
14 5.000 5.084 30 5.000 5.007
15 5.000 5.091 31 5.000 5.000
16 5.000 5.105
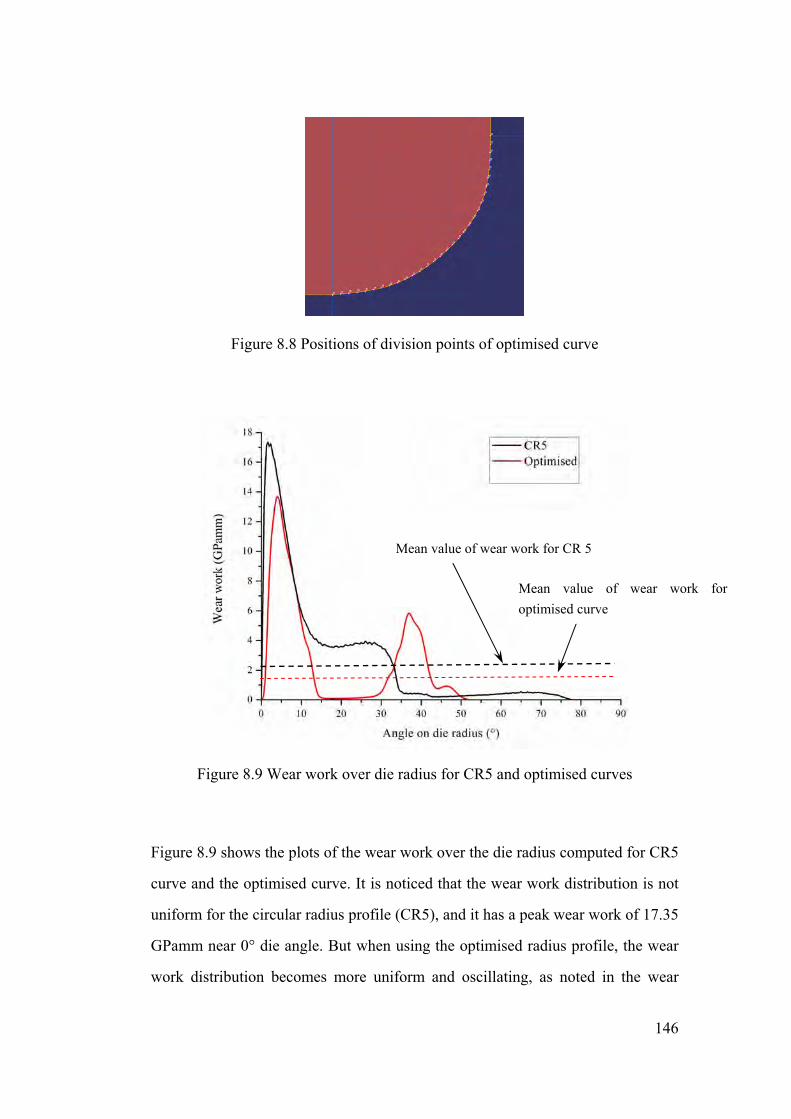
146
Figure 8.8 Positions of division points of optimised curve
Figure 8.9 Wear work over die radius for CR5 and optimised curves
Figure 8.9 shows the plots of the wear work over the die radius computed for CR5
curve and the optimised curve. It is noticed that the wear work distribution is not
uniform for the circular radius profile (CR5), and it has a peak wear work of 17.35
GPamm near 0° die angle. But when using the optimised radius profile, the wear
work distribution becomes more uniform and oscillating, as noted in the wear
Mean value of wear work for CR 5
Mean value of wear work for optimised curve
147
work distribution of Figure 8.9. It shows a peak of 13.81 GPamm at 5° die angle,
then goes down to near zero and peaks again with a magnitude of 6.08 GPamm at
37° die angle.
It is concluded that the maximum wear work was reduced from 17.34 GPamm to
13.81 GPamm. However, besides the reduction of the maximum wear work,
another peak value of the wear work occurs at the area between 30° to 50° with
the value of 6.08 GPamm. Though another peak value of the wear work appears
by applying the optimised die radius profile, the reduction of the maximum wear
work compensates it to achieve relative low average wear work.
Figure 8.9 also shows that the average wear work obtained from the optimised
radius profile is much lower than the average wear work given by the
un-optimised circular radius profile. Table 8.3 shows a comparison of maximum
wear works and average wear work obtained by the unoptimised circular profile
and optimised profile of the developed computer routine.
Table 8.3 Comparison of wear work of un-optimised circular profile with
optimised one
Die radius profile Maximum wear work
(GPamm)
Average wear work
(GPamm)
Un-optimised circular profile 17.34 2.02
Optimised profile 13.81 1.47
Due to the considerable computation time, it was not possible to work out wear
148
work distribution for high elliptical and flat elliptical die radius profile, but it is
concluded that the proposed methodology of the die radius optimisation will
deliver similar reduction on wear work distribution for these two geometries as
well.
8.5 Summary
In this chapter, to minimise and achieve uniform contact pressure (wear
distribution), a methodology based on a specialised software routine was
introduced for optimisation of die radius profiles using Python programming
language, which was fully integrated with Abaqus software. The algorithm
provides the following functions:
(1) To provide a user-friendly Graphical User Interface for pre-processing of
data input for users who have less experiences and skills;
(2) To optimise a die radius profile according to the control parameters that
users input.
The case study discussed in the chapter shows that the routine was suitable for
optimisation of a die radius profile, thought it may require time-consuming
iterative simulations in Abaqus software.

149
CHAPTER 9 CONCLUSIONS AND FURTHER
RESEARCH
9.1 Overview
This research has presented an investigation on the development of tool wear
prediction model to study the influences of draw die geometry on the wear
distribution over the draw die radius for AHSS material. The research also present
a methodology for optimising the draw die geometry to reduce wear using
numerical methods by developing a specialised software routine using Python
programming language and implemented in Abaqus finite element analysis
software.
9.2 Major Research Outcomes
Tool wear predictions on automotive sheet metal forming die and recommended
protections of the tool surface under the initial production conditions were
obtained from AutoForm simulation software. Effects of lubrication coefficients,
binder pressure loads and die coating on tool wear distributions were investigated
as well. It is concluded that the areas that are most sensitive to the tool wear occur
at the locations corresponding to the large gradient of drawing depth.
To study the tool wear distributions for more common stamping parts, a numerical
tool wear model was developed and applied using the commercial software

150
package Abaqus. Channel tests are carried out using an Erichsen sheet metal tester
with high pressure prescale films to verify the numerical model results.
Comparing the results obtained from the prescale film with the results from the
simulation, it is concluded that the contact pressure distributions indicated by the
prescale film are consistent with those from the simulation.
Various geometries of radius arc profiles, including standard circular profiles, high
elliptical profiles, and flat elliptical profiles, were numerically investigated using
the tool wear model developed, and the contact pressure distribution and tool wear
work along the radii were determined. The following conclusions were reached
from the investigations:
(1) The area (as plotted by colour contour) of the high contact pressure on the
die radius can be divided into three distinct zones of high pressure and tool
wear;
(2) The dominant zone leading to maximum contact pressure and tool wear
severity depends on the geometry of die radius profile under the same
material and process conditions;
(3) The geometry of draw die radius has a significant influence on the tool
wear and standard circular and elliptical curves can lead to the
achievement of reduced and uniform contact pressure distribution (wear
distribution) along most of zones of the draw die radius arc.
The results suggest that to minimise contact pressure and tool wear using this
approach it would be necessary to optimise the shape of the die for a particular
combination of material type, thickness and forming process.

151
Effects of control parameters, such as blank geometry, punch geometry,
deep-drawing process parameters, blank material and tool material, on wear
behaviour in deep-drawing for various shape of die radius were then investigated
to provide guidelines for impacts of these parameters.
A specialised software routine was then compiled for optimisation of die radius
profiles to minimise and achieve uniform contact pressure (wear distribution)
using Python programming language. The routine was fully integrated with
Abaqus software and has the following functions:
(1) To provide a user-friendly Graphical User Interface for pre-processing
data input for users who have less experiences and skills;
(2) To optimise a die radius profile according to the control parameters that
users input.
The following major research outcomes were achieved in this project:
(1) Prediction and identification of critical tool worn area on GM Holden’s sheet
metal forming die using AutoForm simulation software;
(2) Establishment of a numerical tool wear prediction model of deep-drawing
process using Abaqus simulation software for a common part and
experimental validation by a series of channel bending tests;
(3) Determination of the relationship between different die profile shape and tool
wear distribution for deep-drawing process;
(4) Determination of the relationship between different control parameters (with
the same type shape, e.g. elliptical, circular) and tool wear distribution for
deep-drawing process;

152
(5) Development of a specialised algorithm for achieving minimised and uniform
wear distribution by changing the die profile shape for deep-drawing process
using Python programming language.
9.3 Recommendations for Future Work
Future work can be focused on the tool wear prediction modelling which is
closely linked with:
Effect of lubricant;
Effect of alternative die material;
Effect of spring back.
Due to the limitation of the computation time, the simulation in this project is 2D.
In the future, with the high performance computer technology, the investigation,
modelling and prediction conducted in this project can be conducted using 3D
model, from which can be obtained the effects of the variation of geometries and
control parameters along z axis on the tool wear distribution.
The algorithm developed in Chapter 9 has a practical application for the
optimisation of the die radius profile in the industries. In the future, the practical
application of the algorithm in the industries can be studied in detail and a
manufacture system can be designed using the algorithm.

153
REFERENCES
[1] Z. Marciniak, J. L. Duncan, and S. J. Hu, Mechanics of sheet metal
forming, 2nd ed. Oxford: Butterworth-Heinemann, 2002.
[2] (2010, 1 June 2010). Stamping die. Available:
http://www.toyota-industries.com/product/auto/kouki/
[3] Automotive Sheet Steel Stamping Process Variation. Southfield: Auto/Steel
Partnership, 2000.
[4] M. Eriksen, "The influence of die geometry on tool wear in deep drawing,"
Wear, vol. 207, pp. 10-15, 1997.
[5] A. R. Shahani and I. Salehinia, "Analysis of wear in deep-drawing process
of a cylindrical cup," Journal of Materials Processing Technology, vol.
200, pp. 451-459, 2008.
[6] Z. Marciniak, J. L. Duncan, and S. J. Hu, Mechanics of sheet metal
forming, 2nd ed. Oxford: Butterworth-Heinemann, 1992.
[7] R. G. Bayer, Mechanical wear Fundamentals and testing. New York:
Marcel Dekker, 2004.
[8] M. A. Masen, "Abrasive tool wear in metal forming processes," PhD
Thesis, University of Twente, Enschede, 2004.
[9] E. Billur, "Die materials and wear in stamping AHSS Part I: die wear and
die coatings," Stamping Journal, vol. 14, pp. 8-9, 2010.
[10] Advance High Strength Steel Application Guidelines. Southfield: :
Auto/Steel Partnership, 2005.
[11] D. K. Mondal and R. M. Dey, "Effect of grain size on the microstructure
and mechanical properties of a C---Mn---V dual-phase steel," Materials

154
Science and Engineering: A, vol. 149, pp. 173-181, 1992.
[12] G. S. Huppi, D. K. Matlock, and G. Krauss, "An evaluation of the
importance of epitaxial ferrite in dual-phase steel microstructures," Scripta
Metallurgica, vol. 14, pp. 1239-1243, 1980.
[13] M. Erdogan and R. Priestner, "Effect of epitaxial ferrite on yielding and
plastic flow in dual phase steel in tension and compression," Materials
Science and Technology, vol. 15, pp. 1273-1284, 1999.
[14] R. O. Rocha, T. M. F. Melo, E. V. Pereloma, and D. B. Santos,
"Microstructural evolution at the initial stages of continuous annealing of
cold rolled dual-phase steel," Materials Science and Engineering A, vol.
391, pp. 296-304, 2005.
[15] U. Liedl, S. Traint, and E. A. Werner, "An unexpected feature of the
stress-strain diagram of dual-phase steel," Computational Materials
Science, vol. 25, pp. 122-128, 2002.
[16] P. Carlsson, "Surface Engineering in sheet metal forming," PhD Thesis,
Uppsala University, Uppsala, 2005.
[17] B. Casas, D. Marco, and I. Valls, "A New Generation of Tool Steels for
Shaping AHSS and UHSS," in Proceedings of the Materials Science &
Technology 2006 Conference, Cincinnati, 2006, pp. 780-788.
[18] O. Sandberg, P. Å. Bustad, B. Carlsson, M. Fällström, and T. Johansson,
"Characterization of tool wear in stamping of EHS and UHS steel sheets,"
in Proceedings of the International Conference on Recent Advances in
Manufacture and Use of Tools and Dies and Stamping of Steel Sheets,
Olofstrom, 2004, pp. 151-169.
[19] M. R. Jensen, F. F. Damborg, K. B. Nielsen, and J. Danckert, "Applying
the finite-element method for determination of tool wear in conventional

155
deep-drawing," Journal of Materials Processing Technology, vol. 83, pp.
98-105, 1998.
[20] R. G. Bayer, Engineering Design for Wear, 2nd ed. New York: Marcel
Dekker, 2004.
[21] T. A. Stolarski, Tribology in Machine Design. Oxford:
Butterworth-Heinemann, 2000.
[22] R. Holm, Electric Contacts. Stockholm: Hugo Gebers Forlag, 1946.
[23] J. F. Archard, "Contact and rubbing of flat surfaces," Journal of Applied
Physics, vol. 24, pp. 981-988, 1953.
[24] B. Bhushan, Introduction to Tribology. New York: John Wiley & Sons,
2002.
[25] B. Bhushan, R. E. Davis, and H. R. Kolar, "Metallurgical re-examination
of wear modes II: adhesive and abrasive," Thin Solid Films, vol. 123, pp.
113-126, 1985.
[26] E. Rabinowicz, Friction and Wear of Materials. New Yorks: John Wiley
and Sons, 1965.
[27] P. J. Blau and K. G. Budinski, "Development and use of ASTM standards
for wear testing," Wear, vol. 225-229, pp. 1159-1170, 1999.
[28] Y. Wan and Q. Xue, "Effect of antiwear and extreme pressure additives on
the wear of aluminium alloy in lubricated aluminium-on-steel contact,"
Tribology International, vol. 28, pp. 553-557, 1995.
[29] Standard Test Method for Wear Testing with a Pin-on-Disk Apparatus,
ASTM G99-05. West Conshohocken: ASTM International, 2010.
[30] E. Billur, "Continuing the look at die materials and wear in stamping
AHSS Part II: Tests for evaluating galling, wear of tool materials and
coatings," Stamping Journal, vol. 14, pp. 10-11, 2010.

156
[31] M. J. Alinger and C. J. Van Tyne, "Evolution of die surfaces during
repeated stretch-bend sheet steel deformation," Journal of Materials
Processing Technology, vol. 141, pp. 411-419, 2003.
[32] C. Boher, D. Attaf, L. Penazzi, and C. Levaillant, "Wear behaviour on the
radius portion of a die in deep-drawing: Identification, localisation and
evolution of the surface damage," Wear, vol. 259, pp. 1097-1108, 2005.
[33] A. Gåård, P. Krakhmalev, and J. Bergström, "Wear mechanisms in deep
drawing of carbon steel - Correlation to laboratory testing," Tribo Test, vol.
14, pp. 1-9, 2008.
[34] H. Kim, J. Sung, F. E. Goodwin, and T. Altan, "Investigation of galling in
forming galvanized advanced high strength steels (AHSSs) using the twist
compression test (TCT)," Journal of Materials Processing Technology, vol.
205, pp. 459-468, 2008.
[35] T. Sato and T. Besshi, "Anti-galling evaluation in aluminum sheet
forming," Journal of Materials Processing Technology, vol. 83, pp.
185-191, 1998.
[36] A. Nilsson, P. Gabrielson, and J. E. Ståhl, "Zinc-alloys as tool materials in
short-run sheet-metal forming processes: Experimental analysis of three
different zinc-alloys," Journal of Materials Processing Technology, vol.
125-126, pp. 806-813, 2002.
[37] M. Jonasson, T. Pulkkinen, L. Gunnarsson, and E. Schedin, "Comparative
study of shotblasted and electrical-discharge-textured rolls with regard to
frictional behavior of the rolled steel sheet surfaces," Wear, vol. 207, pp.
34-40, 1997.
[38] W. J. Wojtowicz, "Sliding friction test for metalworking lubricants,"
Lubrication Engineering, vol. 11, pp. 174-177, 1955.
157
[39] D. Hortig and D. Schmoeckel, "Analysis of local loads on the draw die
profile with regard to wear using the FEM and experimental
investigations," Journal of Materials Processing Technology, vol. 115, pp.
153-158, 2001.
[40] L. R. Sanchez, "Characterization of a measurement system for
reproducible friction testing on sheet metal under plane strain," Tribology
International, vol. 32, pp. 575-586, 1999.
[41] H. D. Nine, "Draw bead forces in sheet metal forming," in Proceedings of
a Symposium on Mechanics of Sheet Metal Forming: Behaviour and
Deformation Analysis, Warren, 1978, pp. 179-211.
[42] O. N. Cora, K. Namiki, and M. Koç, "Wear performance assessment of
alternative stamping die materials utilizing a novel test system," Wear, vol.
267, pp. 1123-1129, 2009.
[43] T. Skåre and F. Krantz, "Wear and frictional behaviour of high strength
steel in stamping monitored by acoustic emission technique," Wear, vol.
255, pp. 1471-1479.
[44] B. Sresomroeng, V. Premanond, P. Kaewtatip, A. Khantachawana, N. Koga,
and S. Watanabe, "Anti-adhesion performance of various nitride and DLC
films against high strength steel in metal forming operation," Diamond
and Related Materials, vol. 19, pp. 833-836, 2010.
[45] G. S. Fox-Rabinovich, S. C. Veldhuis, V. N. Scvortsov, L. S. Shuster, G. K.
Dosbaeva, and M. S. Migranov, "Elastic and plastic work of indentation as
a characteristic of wear behavior for cutting tools with nitride PVD
coatings," Thin Solid Films, vol. 469-470, pp. 505-512, 2004.
[46] G. Straffelini, G. Bizzotto, and V. Zanon, "Improving the wear resistance of
tools for stamping," Wear, vol. 269, pp. 693-697, 2010.

158
[47] J. L. Mo and M. H. Zhu, "Sliding tribological behaviors of PVD CrN and
AlCrN coatings against Si3N4 ceramic and pure titanium," Wear, vol. 267,
pp. 874-881, 2009.
[48] J. L. Mo, M. H. Zhu, B. Lei, Y. X. Leng, and N. Huang, "Comparison of
tribological behaviours of AlCrN and TiAlN coatings-Deposited by
physical vapor deposition," Wear, vol. 263, pp. 1423-1429, 2007.
[49] J. Vetter, E. Lugscheider, and S. S. Guerreiro, "(Cr:Al)N coatings
deposited by the cathodic vacuum arc evaporation," Surface and Coatings
Technology, vol. 98, pp. 1233-1239, 1998.
[50] L. Wang, X. Nie, J. Housden, E. Spain, J. C. Jiang, E. I. Meletis, A.
Leyland, and A. Matthews, "Material transfer phenomena and failure
mechanisms of a nanostructured Cr-Al-N coating in laboratory wear tests
and an industrial punch tool application," Surface and Coatings
Technology, vol. 203, pp. 816-821, 2008.
[51] T. Aizawa, E. Iwamura, and K. Itoh, "Nano-lamination in amorphous
carbon for tailored coating in micro-dry stamping of AISI-304 stainless
steel sheets," Surface and Coatings Technology, vol. 203, pp. 794-798,
2008.
[52] P. N. Silva, J. P. Dias, and A. Cavaleiro, "Performance of W-TI-(N) coated
pins in lubricated pin-on-disk tests," Surface and Coatings Technology, vol.
202, pp. 2338-2343, 2008.
[53] B. C. Schramm, H. Scheerer, H. Hoche, E. Broszeit, E. Abele, and C.
Berger, "Tribological properties and dry machining characteristics of
PVD-coated carbide inserts," Surface and Coatings Technology, vol.
188-189, pp. 623-629, 2004.
[54] S. Ortmann, A. Savan, Y. Gerbig, and H. Haefke, "In-process structuring
of CrN coatings, and its influenceon friction in dry and lubricated sliding,"

159
Wear, vol. 254, pp. 1099-1105, 2003.
[55] S. PalDey and S. C. Deevi, "Single layer and multilayer wear resistant
coatings of (Ti,Al)N: A review," Materials Science and Engineering A, vol.
342, pp. 58-79, 2003.
[56] H. K. Tönshoff and H. Seegers, "Influence of residual stress gradients on
the adhesion strength of sputtered hard coatings," Thin Solid Films, vol.
377-378, pp. 340-345, 2000.
[57] E. Van der Heide, M. Burlat, P. J. Bolt, and D. J. Schipper, "Wear of soft
tool materials in sliding contact with zinc-coated steel sheet," Journal of
Materials Processing Technology, vol. 141, pp. 197-201, 2003.
[58] J. D. Bressan, G. A. Battiston, R. Gerbasi, D. P. Daros, and L. M. Gilapa,
"Wear on tool steel AISI M2, D6 and 52100 coated with Al2O3 by the
MOCVD process," Journal of Materials Processing Technology, vol. 179,
pp. 81-86, 2006.
[59] O. N. Cora and M. Koç, "Experimental investigations on wear resistance
characteristics of alternative die materials for stamping of advanced
high-strength steels (AHSS)," International Journal of Machine Tools and
Manufacture, vol. 49, pp. 897-905, 2009.
[60] R. R. Hilsen and L. M. Bernick, "Relationship between Surface
Characteristics and Galling Index of Sheet Steel," ASTM Special Technical
Publication 647, pp. 220-237, 1978.
[61] H. Kim, J. H. Sung, R. Sivakumar, and T. Altan, "Evaluation of stamping
lubricants using the deep drawing test," International Journal of Machine
Tools and Manufacture, vol. 47, pp. 2120-2132, 2007.
[62] S. Chandrasekharan, H. Palaniswamy, N. Jain, G. Ngaile, and T. Altan,
"Evaluation of stamping lubricants at various temperature levels using the

160
ironing test," International Journal of Machine Tools and Manufacture,
vol. 45, pp. 379-388, 2005.
[63] A. Yanagida and A. Azushima, "Evaluation of coefficients of friction in
hot stamping by hot flat drawing test," CIRP Annals - Manufacturing
Technology, vol. 58, pp. 247-250, 2009.
[64] P. Deshmukh, M. Lovell, W. G. Sawyer, and A. Mobley, "On the friction
and wear performance of boric acid lubricant combinations in extended
duration operations," Wear, vol. 260, pp. 1295-1304, 2006.
[65] D. M. Rück, D. Boos, and I. G. Brown, "Improvement in wear
characteristics of steel tools by metal ion implantation," Nuclear Inst. and
Methods in Physics Research, B, vol. 80-81, pp. 233-236, 1993.
[66] J. Narojczyk, Z. Werner, and J. Piekoszewski, "Analysis of the wear
process of nitrogen implanted HSS stamping dies," Vacuum, vol. 63, pp.
691-695, 2001.
[67] J. H. C. de Souza and M. Liewald, "Analysis of the tribological behaviour
of polymer composite tool materials for sheet metal forming," Wear, vol.
268, pp. 241-248, 2010.
[68] M. H. Myint, J. Y. H. Fuh, Y. S. Wong, L. Lu, Z. D. Chen, and C. M. Choy,
"Evaluation of wear mechanisms of Y-TZP and tungsten carbide punches,"
Journal of Materials Processing Technology, vol. 140, pp. 460-464, 2003.
[69] G. N. Levy, R. Schindel, P. Schleiss, F. Micari, and L. Fratini, "On the use
of SLS tools in sheet metal stamping," CIRP Annals - Manufacturing
Technology, vol. 52, pp. 249-252, 2003.
[70] M. Pinto, A. D. Santos, P. Teixeira, and P. J. Bolt, "Study on the usability
and robustness of polymer and wood materials for tooling in sheet metal
forming," Journal of Materials Processing Technology, vol. 202, pp. 47-53,
161
2008.
[71] K. Ersoy-Nürnberg, G. Nürnberg, M. Golle, and H. Hoffmann, "Simulation
of wear on sheet metal forming tools-An energy approach," Wear, vol. 265,
pp. 1801-1807, 2008.
[72] R. Hambli, "Blanking tool wear modeling using the finite element
method," International Journal of Machine Tools and Manufacture, vol.
41, pp. 1815-1829, 2001.
[73] H. Hoffmann, C. Hwang, and K. Ersoy, "Advanced wear simulation in
sheet metal forming," CIRP Annals - Manufacturing Technology, vol. 54,
pp. 217-220, 2005.
[74] S. Christiansen and L. De Chiffre, "Topographic characterization of
progressive wear on deep drawing dies," Tribology Transactions, vol. 40,
pp. 346-352, 1997.
[75] M. P. Pereira, W. Yan, and B. F. Rolfe, "Contact pressure evolution and its
relation to wear in sheet metal forming," Wear, vol. 265, pp. 1687-1699,
2008.
[76] B. F. Kuvin, "Ford's New DP 600 Die Standards," Metal Forming
Magazine, vol. 40, pp. 20-22, 2006.
[77] AutoForm 4.1 user's manual. Zurich: AutoForm Engineering GmbH,
2007.
[78] (2007, 1 June 2010). AutoForm Software. Available:
http://www.autoform.com/products/index.html
[79] M. L. Wenner, "State-of-the-art of mathematical modelling of sheet metal
forming of automotive body panels," in Sheet Metal Stamping:
Development Applications, SP-1221, ed: Society of Automotive
Engineering (SAE), 1997, pp. 1-6.
162
[80] D. T. Llewellyn and R. C. Hudd, Steels: metallurgy and applications.
Oxford: Butterworth-Heinemann, 1998.
[81] M. Dingle and M. Weiss, "Milestone Report M010," AutoCRC, Melbourne,
2008.
[82] B. Sande, "Assessment of Fuji Pre-scale films in tyre/road contact surface
measurements," Eindhoven University of Technology, Eindhoven, 2007.
[83] M. Liljengren, K. Kjellsson, T. Johansson, and N. Asnafi, "Die materials,
hardening methods and surface coatings for forming of high extra high and
ultra high strength steel sheets (HSS/EHSS/UHSS)," in the Proceedings of
IDDRG International Deep Drawing Research Group, Porto, 2006, pp.
597-604.

163
APPENDIX A
LIST OF PUBLICATIONS
Peer-reviewed Journal Papers:
[1] X. Z. Wang and S. Masood, "Investigation of die radius arc profile on
wear behaviour in sheet metal processing of advanced high strength
steels," Materials & Design, vol. 32, pp. 1118-1128, 2011.
[2] X. Z. Wang and S. Masood, "A study on tool wear of sheet metal stamping
die using numerical method," Materials Science Forum, vol. 654-656, pp.
346-349, 2010.
[3] X. Z. Wang, S. H. Masood, and M. Dingle, "Numerical simulation and
optimisation of sheet metal forming for auto-body panel using AutoForm
software," Materials Science Forum, vol. 561-565, pp. 1911-1914, 2007.
Peer-reviewed Conferences Papers:
[4] X. Z. Wang, S. H. Masood, and M. Dingle, "An investigation on tool
wear prediction in automotive sheet metal stamping die using numerical
simulation," in the Proceedings of 2009 IAENG International Conference
on Industrial Engineering, Hong Kong, 2009, pp. 1942-1946.
[5] X. Z. Wang, S. H. Masood, and M. Dingle, "Tool wear prediction on
sheet metal forming die of automotive part based on numerical
simulation method," in the Proceedings of 5th Australasian Congress on
Applied Mechanics, Brisbane, 2007, pp. 360-365.

164
APPENDIX B
MOMENTARY PRESSURE CHART
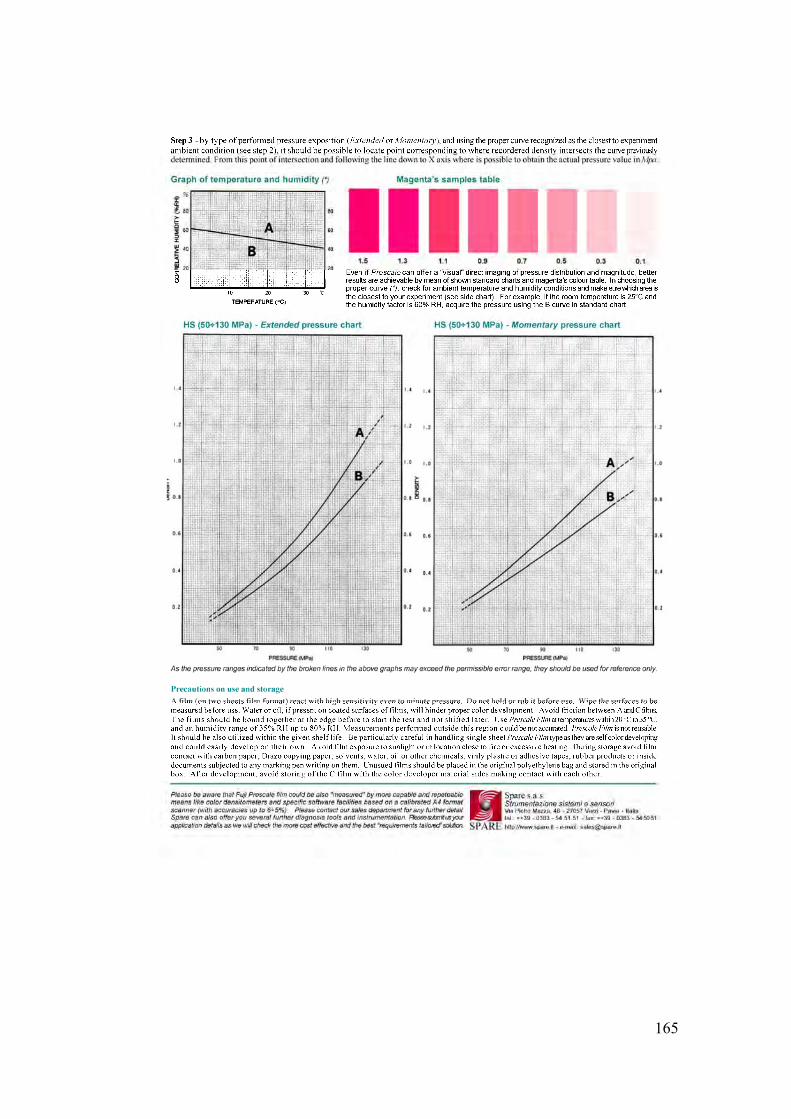
165


![A new approach for prediction of the wear loss of …...wear and friction are unavoidable [2]. Therefore, it is essential to make their surfaces resistant to wear [3]. Steel has been](https://img.dokumen.tips/doc/110x75/5fb88c7d402ced215857bdbd/a-new-approach-for-prediction-of-the-wear-loss-of-wear-and-friction-are-unavoidable.jpg)