Embed Size (px)
Citation preview

Too Constrained to Grow
Analysis of Firms’ Response to the Alleviation of Skill Shortages
Sara Signorelli
Paris School of Economics
Uppsala Immigration Lab workshop
26 - 27 May 2021
Sara Signorelli Too Constrained to Grow 0 / 18

Outline
1 Motivation
2 The Reform
3 Empirical Strategy
4 Results
5 Conclusion
Sara Signorelli Too Constrained to Grow -1 / 18

Outline
1 Motivation
2 The Reform
3 Empirical Strategy
4 Results
5 Conclusion
Sara Signorelli Too Constrained to Grow 0 / 18

A topical issue
Future of Work :
Ï 30% of jobs likely to change radically in next 20 years (OECD 2019).Ï Demand for some skills grows faster than supply → skill shortages.
Potential Solutions :
Ï Adaptation of school systems / development of life-long training.Ï Encourage immigration of high-skill workers with "rare" competencies.
Ongoing debate :
Ï France, 2011 : List reduction to prioritize French unemployed.Ï USA, 2020 : freeze of H-1B visas to protect American jobs.
... but little evaluation exists on whether selective immigration policiesare effective and on their consequences for firm performance.
Sara Signorelli Too Constrained to Grow 1 / 18

Objective
French reform encouraging immigration within list of occupations sufferingfrom skill shortages :
1 How do firms react to relaxation of their skill constraints ?Ï What is the cost associated with skill shortages ?Ï To what extent they are reduced by the policy ?
2 Are there spill-overs associated with high-skill immigration ?Ï Crowding-in of other types of employment ?
Ï Productivity gains ?
Ï Effects on firm creation & destruction ?
Sara Signorelli Too Constrained to Grow 2 / 18

Literature
Role of frictions in the labor market :Important determinants of employment, wages, firm performance (Hyatt andSpletzer, 2013 ; Jäger, 2016 ; Decker et al., 2018).
Skill shortages / mismatch (Ryoo and Rosen, 2004 ; Shimer, 2007 ; Bound etal., 2013 ; Restrepo, 2015).
Externalities with high-skill migration :Effect on firm performance (Kerr & Lincoln, 2010 ; Doran, Gelber & Isen,2014 ; Bound et al., 2015 ; Peri, Shih & Sparber, 2015 ; Beerli et al., 2018).
Effect on technology use / demand for other labor inputs (Lewis, 2011 ; Peri,2012 ; Dustmann and Glitz, 2015)
Contribution :Quasi-natural experiment relaxing constraints in specific occupations.
Rare setting to measure costs of frictions.
Effects at different levels of aggregation.
Sara Signorelli Too Constrained to Grow 3 / 18

Outline
1 Motivation
2 The Reform
3 Empirical Strategy
4 Results
5 Conclusion
Sara Signorelli Too Constrained to Grow 3 / 18

Procedure to hire a non-EU worker
Official processing time SMOE is 2 months, but can take longer in practice (OECD 2017)
For non-residents and residents without work permit (students)
Sara Signorelli Too Constrained to Grow 4 / 18

Reform
Abolishes 2 requirements :Ï Proof of extensive search for a resident candidate.
Ï Certification of high level of tightness from Employment Office.
→ Significant reduction in time and uncertainty !
Introduced in 2008, unchanged up to today 1 :
Ï 30 occupations characterized by high levels of tightness.
Ï Different sub-sample across regions.
tightness measurement tightness graphs
1. Except for temporary restriction in 2011 that only lasted 1 year.Sara Signorelli Too Constrained to Grow 5 / 18

Some examples of occupations included
Occupation Professional categorySales technician Technician/ForemanExecutive of financial audit Executive/EngineerComputer scientist Executive/EngineerOperations manager in insurance Technician/ForemanMechanic of construction machinery and agricultural machinery Technician/ForemanDriver of machinery for wood and furniture production Skilled blue collarArtisan of wood and furniture production Skilled blue collarTechnician of industrial planning and methods Technician/ForemanDraughtsman manager mechanical construction Technician/ForemanDraughtsman manager in electricity and elechtronics Executive/EngineerIndustrial draughtsman in electricity and elechtronics Technician/ForemanProduction technician in mechanic. construction and metallurgy Technician/ForemanConstruction surveyor Technician/ForemanHead of technical studies in construction Technician/ForemanSite supervisor for buildings and public work Technician/Foreman
Most concerned skills : electricity & electronics (4), mechanics & metal processing(4), construction (4), computer science (2).
Sectoral exposure
Sara Signorelli Too Constrained to Grow 6 / 18

Change in economy-wide employment structure
Share of reform occupations in employment
Sara Signorelli Too Constrained to Grow 7 / 18

Outline
1 Motivation
2 The Reform
3 Empirical Strategy
4 Results
5 Conclusion
Sara Signorelli Too Constrained to Grow 7 / 18

Data
Administrative data :
Ï Payroll Tax Records (DADS poste) 2005-2011 : detailed occupationand wage of all workers at establishment level.
Ï Financial records (FICUS-FARE ) 2005-2011 : sales, revenues, valueadded and capital stock at firm level.
→ Final sample : mono-establishment firms, >20 empl, private sectorexcept financial institutions.
Pôle Emploi data on tightness :
Ï Available at occupation × region level (used to define the reform).
Ï i) N. vacancies / N. qualified job seekers, ii) volume j. offers and evol.,iii) volume j. seekers and evol., iv) turnover job seekers, and v) sh. ofLT contracts in j. offers.
⇒ Tightnessor : composite index of 7 factors.
Sara Signorelli Too Constrained to Grow 8 / 18

Empirical Strategy
Ideally : firm level unmet demand for reform jobs, but unobservable.
Exposure to the reform :
Tighttrtzs =30∑o=1
ωozsΘor
Tighttrtzs : pre-reform tightness in employment zone z and sector s forreform occupations trt.
Θor : tightness in reform occupation o and region r in 2005-07.
ωozs : Employment weight of occupation o in sector s andemployment zone z in 2005-07.
→ Most exposed firms : firms operating in sectors and located in areaswhere shortages in reform jobs were the most severe.
Sara Signorelli Too Constrained to Grow 9 / 18

Estimation
DID with continuous treatment :
ln(Yizst)=β0+β1Tighttrtzs ∗postt+β2Tightotherzs ∗postt+γi +δzs+ωst+εizst
Yizst : outcome in firm i , empl. zone z , sector s, time t.
β1 : continuous treatment effect.
Controls :Ï Effect of tightness in non-reform occupations : Tightotherzs ∗posttÏ Firm FE (γi ), Empl. zone × sector FE (δzs), sector × year FE (ωst).
→ Identifying assumption : firms in same s located in z with similarlevels of overall tightness but different levels of tightness in reformoccupations would have evolved similarly without the policy change.
Sara Signorelli Too Constrained to Grow 10 / 18

Unconditional evidence on first stage
a) Total Ref. Employment b) Share Ref. Employment.
Summary Statistics
Sara Signorelli Too Constrained to Grow 11 / 18

Outline
1 Motivation
2 The Reform
3 Empirical Strategy
4 Results
5 Conclusion
Sara Signorelli Too Constrained to Grow 11 / 18

Event study graphs on first stage effect
Employment in reform occup. ↗ thanks to migrant empl. ↗.
Marginal effect at mean exposure : Table
Ï +1.6% in migrant reform employment after 3-4 years.Ï +4.6% in share of ref. occ. in total employment after 3-4 years.
Sara Signorelli Too Constrained to Grow 12 / 18

Event study graphs on performance
Marginal effect at mean exposure : Table
Ï +1.4% in total employment after 3-4 years.Ï +1.3% in revenues after 3-4 years.
Sara Signorelli Too Constrained to Grow 13 / 18

Event study graphs on performance
Marginal effect at mean exposure : Table
Ï +1.3% in value added after 3-4 years.Ï No effect on labor productivity.
Sara Signorelli Too Constrained to Grow 14 / 18

Other Results
Other outcomes :Ï No effect on capital stock (tangible & intangible). Table
Ï Crowding-in of non-reform executive & mid-level jobs. Table
Ï No effect on other job types (no crowding-out).Ï wages in reform occup. ↘ 2% (consistent with Signorelli, 2020) Table
Heterogeneity :
Ï Young and small firms ↗↗ size & revenues . Graph
Ï Low-productivity firms even ↗ labor productivity. Graph
Ï Firms in slack LM (low j-j mobility) also ↗ labor productivity. Graph
→ Reform had an equalizing effect !
Alternative identification :
Ï Direct measure of demand shocks : reform ↘ constraints by 2/3. slides
Sara Signorelli Too Constrained to Grow 15 / 18

Aggregate effects at employment zone × sector level
(1) (2) (3) (4) (5) (6)Log total
employmentLog revenues
Log valueadded
Log VA per workerfirm survival
ratefirm creation
rate
VARIABLES OLS OLS OLS OLS OLS OLS
Exposure * 2008-09 0.0891** 0.0944** 0.0996** 0.0488 0.0308* -0.0396**(0.0392) (0.0461) (0.0462) (0.0320) (0.0186) (0.0194)
Exposure * 2010-11 0.0806 0.0756 0.0866 0.00592 0.0303 -0.0152(0.0537) (0.0649) (0.0612) (0.0369) (0.0186) (0.0197)
Observations 60,810 59,507 59,337 58,994 60,849 60,849R-squared 0.944 0.943 0.934 0.763 0.236 0.276
Calculated marginal effect of reform at mean exposure (tightness=0.16)
Marginal effect ref. 2008-09 0.0143** 0.0151** 0.0159** 0.00781 0.00493* -0.00634**(0.00628) (0.00738) (0.00739) (0.00512) (0.00297) (0.00310)
Marginal effect ref. 2010-11 0.0129 0.0121 0.0139 0.000947 0.00484 -0.00244(0.00860) (0.0104) (0.00979) (0.00591) (0.00298) (0.00316)
Robust standard errors in parentheses *** p<0.01, ** p<0.05, * p<0.1Regressions aggregating outcomes at the employment zone x sector level. Employment zone x sector FE and sector x year FE are included but notreported. Period of analysis : 2005-2011. Exposure is measured as the average tightness in reform occupations observed within the sector and employmentzone.
Short-lived aggregate effects.Firm survival ↗, but firm creation ↘.
Sara Signorelli Too Constrained to Grow 16 / 18

Outline
1 Motivation
2 The Reform
3 Empirical Strategy
4 Results
5 Conclusion
Sara Signorelli Too Constrained to Grow 16 / 18

Conclusion
Skill shortages → costly bottlenecks in production !
Targeted migration policy → effective solution to relax constraints.
Positive Externalities :Ï Crowding-in of other high skill jobs.Ï Small, young and less productive firms benefit more than the average.
Drawbacks :Ï Aggregate effects are short-lived.Ï By allowing unproductive firms to survive → raise barriers to newentries !
Sara Signorelli Too Constrained to Grow 17 / 18

Thank you !
Sara Signorelli Too Constrained to Grow 18 / 18

References
Beerli, Andreas, Jan Ruffner, Michael Siegenthaler, and Giovanni Peri. 2018. “TheAbolition of Immigration Restrictions and the Performance of Firms and Workers :Evidence from Switzerland.” National Bureau of Economic Research.
Bound, John, Breno Braga, Joseph M Golden, and Sarah Turner. 2013. “Pathways toadjustment : The case of information technology workers.” American Economic Review.
Decker, Ryan A, John C Haltiwanger, Ron S Jarmin, and Javier Miranda. 2018.“Changing business dynamism and productivity : Shocks vs. responsiveness.” NationalBureau of Economic Research.
Doran, Kirk, Alexander Gelber, and Adam Isen. 2014. The effects of high-skilledimmigration on firms : Evidence from h-1b visa lotteries. National Bureau of EconomicResearch.
Dustmann, Christian, and Albrecht Glitz. 2015. “How do industries and firms respond tochanges in local labor supply ?” Journal of Labor Economics.
Hyatt, Henry R, and James R Spletzer. 2013. “The recent decline in employmentdynamics.” IZA Journal of Labor Economics.
Kerr, William R, and William F Lincoln. 2010. “The supply side of innovation : H-1Bvisa reforms and US ethnic invention.” Journal of Labor Economics.
Sara Signorelli Too Constrained to Grow 18 / 18

References
Lagakos, David, and Guillermo L Ordonez. 2011. “Which workers get insurance withinthe firm ?” Journal of Monetary Economics. Lewis, Ethan. 2011. “Immigration, skill mix,
and capital skill complementarity.” The Quarterly Journal of Economics.
OECD Employment Outlook (2019), The Future of Work.
Peri, Giovanni. 2012. “The effect of immigration on productivity : Evidence from USstates.” Review of Economics and Statistics.
Peri, Giovanni. 2016. “Immigrants, productivity, and labor markets.” Journal ofEconomic Perspectives.
Peri, Giovanni, Kevin Shih, and Chad Sparber. 2015. “STEM workers, H-1B visas, andproductivity in US cities.” Journal of Labor Economics.
Restrepo, Pascual. 2015. “Skill mismatch and structural unemployment.” MIT JobMarket Paper.
Ryoo, Jaewoo, and Sherwin Rosen. 2004. “The engineering labor market.” Journal ofpolitical economy.
Shimer, Robert. 2007. “Mismatch.” American Economic Review.
Sara Signorelli Too Constrained to Grow 18 / 18

Tightness in reform vs non-reform jobs
Back to main pres
Sara Signorelli Too Constrained to Grow 18 / 18

Tightness Indicators and definition of the list
Tightness indicators :Ï Collected by Employment Office every trimester.Ï Available by region (22) and by occupation (225 cat.).
Criteria used to define lists :1 Main tightness index : N. job offers / N. job seekers,2 volume and evolution of job offers,3 volume and evolution of job seekers,4 turnover rate job seekers,5 the share of long term contracts in job offers.
Back to main pres
Sara Signorelli Too Constrained to Grow 18 / 18

a) Sectoral distrib. of reform empl. b) Sectoral exp. to the reform
Back to main pres
Sara Signorelli Too Constrained to Grow 18 / 18

Summary Statistics
Overall SampleTertiles of tightness in reform
occupations
VARIABLES mean sd 1st 2nd 3rd
Share of reform occup. In empl. 0.09 0.17 0.08 0.08 0.13Share of migrants in ref. empl. 0.06 0.19 0.05 0.06 0.07Migrant reform empl. 0.39 3.10 0.33 0.31 0.58Native reform empl. 4.84 16.68 4.98 4.45 5.79Other employment 44.59 64.65 48.87 47.89 39.10Wage in ref. empl. (e2010) 22.0 12.5 20.4 22.9 22.6Wage in other empl. (e2010) 17.8 7.2 17.3 18.7 18.0Firm size 52.43 79.65 56 56 48Revenues (’000e2010) 12220 35517 11646 16349 9857Revenues per worker (’000e2010) 234 712 202 309 208Value added (’000e2010) 3167 7293 3118 3669 2970Value added per worker (’000e2010) 62 135 58 70 61Tangible assets (’000e2010) 4051 22519 4444 3842 4169Intangible assets (’000e2010) 617 3817 470 942 483Tightness in reform occupations (sec x zemp) 0.18 0.08 0.08 0.18 0.28Tightness in other occupations (sec x zemp) -0.04 0.07 -0.04 -0.06 -0.04
N. Obs. 414.573 141.919 139.064 133.185N. firms 74.469 25.261 25.464 24.411
Back to main pres
Sara Signorelli Too Constrained to Grow 18 / 18

Reduced Form Results - First Stage Effect
(1) (2) (3)
Share of reform empl.Log migrant ref.employment
Share of migrants inref. employment
VARIABLES OLS OLS OLS
Exposure * 2008-09 0.0158*** 0.0494*** 0.0152(0.00431) (0.0124) (0.0126)
Exposure * 2010-11 0.0233*** 0.0909*** 0.0418**(0.00692) (0.0189) (0.0189)
Observations 386,135 386,135 207,347R-squared 0.862 0.749 0.655
Calculated marginal effect of reform at mean exposure (tightness=0.18)
Marginal effect ref. 2008-09 0.00285*** 0.00889*** 0.00274(0.000775) (0.00223) (0.00226)
Marginal effect ref. 2010-11 0.00420*** 0.0164*** 0.00752**(0.00125) (0.00340) (0.00340)
Robust standard errors in parentheses *** p<0.01, ** p<0.05, * p<0.1Standard errors clustered at the employment zone x sector level. Controls for tightness in other occupationsinteracted with post reform period, firm FE, employment zone x sector FE and sector x year FE are includedbut not reported. Period of analysis : 2005-2011. Exposure is measured as the average tightness in reformoccupations observed within the sector and employment zone where the firm is located. The logarithm ofmigrant reform employment has been taken on the value+1 to keep the zeros in the analysis.
Back to main pres
Sara Signorelli Too Constrained to Grow 18 / 18

Reduced Form Results - Firm performance
(1) (2) (3) (4) (5) (6)
Log total employment Log revenues Log value addedLog VA per
workerLog intangible
assetsLog tangible
assets
VARIABLES OLS OLS OLS OLS OLS OLS
Exposure * 2008-09 0.0676*** 0.0514*** 0.0439** 0.0162 0.0357 0.0309(0.0224) (0.0180) (0.0216) (0.0241) (0.0393) (0.0257)
Exposure * 2010-11 0.0765*** 0.0724*** 0.0741*** 0.0243 0.0282 0.0374(0.0273) (0.0241) (0.0281) (0.0336) (0.0556) (0.0340)
Observations 385,623 372,559 369,143 361,774 335,565 363,560R-squared 0.844 0.953 0.905 0.777 0.951 0.965
Calculated marginal effect of reform at mean exposure (tightness=0.18)
Marginal effect ref. 2008-09 0.0122*** 0.00925*** 0.00790** 0.00292 0.00642 0.00557(0.00404) (0.00324) (0.00388) (0.00434) (0.00707) (0.00462)
Marginal effect ref. 2010-11 0.0138*** 0.0130*** 0.0133*** 0.00437 0.00507 0.00673(0.00492) (0.00433) (0.00506) (0.00604) (0.0100) (0.00611)
Robust standard errors in parentheses *** p<0.01, ** p<0.05, * p<0.1Standard errors clustered at the employment zone x sector level. firm FE, employment zone x sector FE and sector x year FE are included but not reported. Exposure ismeasured as the average tightness in reform occupations observed within the sector and employment zone where the firm is located. Period of analysis : 2005-2011.
Back to main pres
Sara Signorelli Too Constrained to Grow 18 / 18

Reduced Form Results - Crowding in
(1) (2) (3) (4) (5)Log non-reform employment
Total ExecutivesIntermediateprofessionals
Clerk andsalesmen
Blue collar workers
VARIABLES OLS OLS OLS OLS OLS
Exposure * 2008-09 0.0431* 0.0787*** 0.0348 0.0347 0.0187(0.0249) (0.0242) (0.0304) (0.0253) (0.0287)
Exposure * 2010-11 0.0217 0.0667* 0.108** 0.0188 0.0217(0.0300) (0.0350) (0.0419) (0.0348) (0.0410)
Observations 385,372 386,135 386,135 386,135 386,135R-squared 0.827 0.910 0.871 0.908 0.933
Calculated marginal effect of reform at mean exposure (tightness=0.18)
Marginal effect ref. 2008-09 0.00700* 0.0142*** 0.00627 0.00625 0.00337(0.00403) (0.00436) (0.00547) (0.00455) (0.00517)
Marginal effect ref. 2010-11 0.00267 0.0120* 0.0194** 0.00339 0.00391(0.00493) (0.00629) (0.00755) (0.00627) (0.00738)
Robust standard errors in parentheses *** p<0.01, ** p<0.05, * p<0.1Standard errors clustered at the employment zone x sector level. Controls for tightness in other occupations interacted with post reform period, firm FE,employment zone x sector FE and sector x year FE are included but not reported. Exposure is measured as the average tightness in reform occupationsobserved within the sector and employment zone where the firm is located. Period of analysis : 2005-2011. The logarithm of native and total reformemployment has been taken on the value+1 to keep the zeros in the analysis.
Back to main pres
Sara Signorelli Too Constrained to Grow 18 / 18
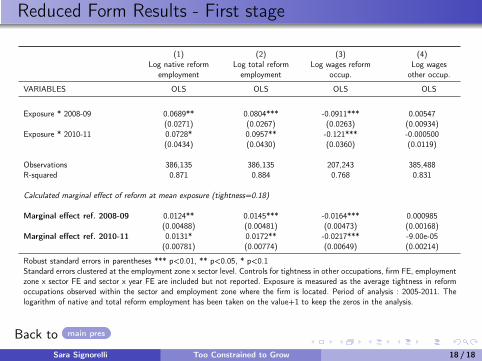
Reduced Form Results - First stage
(1) (2) (3) (4)Log native reform
employmentLog total reformemployment
Log wages reformoccup.
Log wagesother occup.
VARIABLES OLS OLS OLS OLS
Exposure * 2008-09 0.0689** 0.0804*** -0.0911*** 0.00547(0.0271) (0.0267) (0.0263) (0.00934)
Exposure * 2010-11 0.0728* 0.0957** -0.121*** -0.000500(0.0434) (0.0430) (0.0360) (0.0119)
Observations 386,135 386,135 207,243 385,488R-squared 0.871 0.884 0.768 0.831
Calculated marginal effect of reform at mean exposure (tightness=0.18)
Marginal effect ref. 2008-09 0.0124** 0.0145*** -0.0164*** 0.000985(0.00488) (0.00481) (0.00473) (0.00168)
Marginal effect ref. 2010-11 0.0131* 0.0172** -0.0217*** -9.00e-05(0.00781) (0.00774) (0.00649) (0.00214)
Robust standard errors in parentheses *** p<0.01, ** p<0.05, * p<0.1Standard errors clustered at the employment zone x sector level. Controls for tightness in other occupations, firm FE, employmentzone x sector FE and sector x year FE are included but not reported. Exposure is measured as the average tightness in reformoccupations observed within the sector and employment zone where the firm is located. Period of analysis : 2005-2011. Thelogarithm of native and total reform employment has been taken on the value+1 to keep the zeros in the analysis.
Back to main pres
Sara Signorelli Too Constrained to Grow 18 / 18

Elasticity main outcomes
(1) (2) (3) (4) (5) (6)
Log totalemployment
Log revenuesLog valueadded
Log VA perworker
Logintangibleassets
Log tangibleassets
VARIABLES 2SLS 2SLS 2SLS 2SLS 2SLS 2SLS
Log N. migrants in reform empl. 0.494** 0.646** 0.515** 0.163 0.569 0.409(0.204) (0.253) (0.248) (0.200) (0.459) (0.265)
Observations 67,909 68,705 67,713 66,510 62,719 67,349R-squared -0.564 -0.881 -0.390 -0.062 -0.230 -0.255RMSE 0.283 0.346 0.345 0.287 0.496 0.332K-P Wald F-statistic 14.70 13.45 14.91 15.76 12.64 13.97
Robust standard errors in parentheses *** p<0.01, ** p<0.05, * p<0.1Standard errors clustered at the firm level. Controls for tightness in other occupations interacted with post reform period as well asfirm FE, employment zone x sector FE and sector x year FE are included but not reported. The excluded instrument is the interactionbetween exposure, measured as the average tightness in reform occupations observed within the sector and employment zone wherethe firm is located, and the post reform period. To increase the strength of the instrument the sample is restricted to firms countingat least one migrant worker in reform occupations in at least one year over the period, and to the years 2005-2009 (effect on firsttwo years of reform).
Back to main pres
Sara Signorelli Too Constrained to Grow 18 / 18

Heterogeneous effects - firm size
Back to main pres
Sara Signorelli Too Constrained to Grow 18 / 18

Heterogeneous effects - firm age
Back to main pres
Sara Signorelli Too Constrained to Grow 18 / 18

Heterogeneous effects - firm productivity
Back to main pres
Sara Signorelli Too Constrained to Grow 18 / 18

Heterogeneous effects - j-j mobility in LM
Back to main pres
Sara Signorelli Too Constrained to Grow 18 / 18

Approach measuring directly sectoral demand shocks (1)
Before reform : firms more constrained → under-response in employment,over-response in wages.
After reform : Difference shrinks.
Sara Signorelli Too Constrained to Grow 18 / 18

Approach measuring directly sectoral demand shocks (2)
Exogenous changes in sector demand :
GDst =N∑c=1
Exportssc ,2002Exportss ,2002
GrGDPct
Changes in global demand for sector s proxied by weighted GDP growthmain importers. validation
Data source : UN Comtrade (weights), World Bank WDI (GDP growth).
Identification :
Yizst =β0+β1GDst ∗Tighttrtzs +β2Tighttrtzs ∗postt +β3GDst ∗Tighttrtzs ∗postt +γi +δzs +ωst +εizst
β1 expected < 0
β3 expected > 0
Sara Signorelli Too Constrained to Grow 18 / 18

First stage - sector shocks approach
(1) (2) (3) (4)Log totalreform
employment
Log otheremployment
Log wagesreform occup.
Log wagesother occup.
VARIABLES OLS OLS OLS OLS
GD * Exposure -0.247*** -0.0518 0.104*** -0.0150(0.0565) (0.0426) (0.0368) (0.0144)
Exposure * post 2008 -0.725*** -0.0502 0.265*** -0.0317(0.161) (0.112) (0.100) (0.0390)
GD * Exposure * post 2008 0.150*** 0.0796** -0.0709** 0.0133(0.0469) (0.0397) (0.0348) (0.0138)
Observations 186,897 186,223 116,430 186,301R-squared 0.878 0.830 0.764 0.801
Robust standard errors in parentheses *** p<0.01, ** p<0.05, * p<0.1
More constrained firms : less responsive on ref. employment, moreresponsive on ref. wages pre-reform.Gap in response shrinks by 2/3 after reform.
Sara Signorelli Too Constrained to Grow 18 / 18

Main outcomes - sector shocks approach
(1) (2) (3) (4) (5)
Log revenues Log value addedLog VA per
workerLog intangible
assetsLog tangible
assets
VARIABLES OLS OLS OLS OLS OLS
GD * Exposure -0.0959*** -0.0912*** -0.00171 -0.116* -0.0506(0.0298) (0.0353) (0.0295) (0.0636) (0.0348)
Exposure * post 2008 -0.202** -0.190** -0.0151 -0.259 -0.0584(0.0792) (0.0945) (0.0806) (0.165) (0.0868)
GD * Exposure * post 2008 0.0764*** 0.0694** -0.00553 0.104* 0.0571*(0.0285) (0.0336) (0.0294) (0.0605) (0.0328)
Observations 184,250 182,288 179,877 165,180 177,210R-squared 0.946 0.901 0.778 0.942 0.972
Robust standard errors in parentheses *** p<0.01, ** p<0.05, * p<0.1
Skill constraints hold back firm’s size, revenues, VA, and intangible assetspre-reform.Constraints relaxed after the reform.
Sara Signorelli Too Constrained to Grow 18 / 18

Validation of Proxy for Global Demand Changes
Significant correlation ∆GD - growth in sector employment.
Back to main pres
Sara Signorelli Too Constrained to Grow 18 / 18