Embed Size (px)
Citation preview

Tokyo Denki University
Summer Internship Report
Apurva Kumar
International Institute of Information Technology, Hyderabad
July 12th
2013
Professor in Charge
Haruo Isono

CONTENTS
Acknowledgements .................................................................................................................... ii
Overview .................................................................................................................................... 1
Practical Study 1:
Study of Visual Fatigue due to Blue-light Emission from LED-backlit LCD Displays ............ 2
Introduction ..................................................................................................................... 2 Experimental Methods .................................................................................................... 2 Measurement of Luminescence of Devices .................................................................... 2 Experimental Task and Measuring CFF variation .......................................................... 3 Experimental Results ...................................................................................................... 6 Conclusions ..................................................................................................................... 8
Practical Study 2:
Measurement of Cerebral blood flow when person is concentrating on
Reading, Speaking, Writing and Typing.................................................................................... 9 Introduction ..................................................................................................................... 9 Experimental Conditions ................................................................................................ 9 Experimental Methods .................................................................................................. 10 Measurement Results .................................................................................................... 12 Conclusions ................................................................................................................... 13
Technical Tours ....................................................................................................................... 14 Visit to NHK Science and Technical Research Labs .................................................... 14 Visit to 3D & Virtual Reality Exhibition ...................................................................... 16
Conclusion ............................................................................................................................... 17
A c k n o w l e d g e m e n t s | ii
ACKNOWLEDGEMENTS
There are a lot of people I want to thank who made this internship possible. It has been an
impressive and informative experience altogether. I consider myself very lucky and honored
to have so many wonderful people lead me through in completion of the projects.
I thank my honors guide in IIITH, Prof. PJ Narayanan for guiding me and encouraging me
to take up a research internship during the summer.
My deepest thanks to my uncle Dr. P Nagabhushan for helping me search for internship
opportunities and getting me in touch with Prof. Ichino Manabu in Tokyo Denki University
(TDU).
I thank Prof. Ichino for taking the time to consider my internship request and getting me in
touch with Prof. Haruo Isono (TDU), on the basis of my areas of interest.
Furthermore I want to thank all the students with whom I worked during my stay here.
They made sure that the language barrier between us was no hindrance in working together.
I am also grateful to my parents for all their support and whose stay here facilitated the
entire process of the internship.
Last but not the least I would like to thank Prof. Isono for giving me the wonderful
opportunity to pursue research studies and experiments under his guidance. My stay in TDU
and research internship activities has been an awesome and fun experience.

OVERVIEW
This report documents the work done during my summer internship at Tokyo Denki
University (TDU), under the guidance of Prof. Haruo Isono. The report shall give an
overview of the tasks performed during the period of the internship. I shall also talk briefly of
my visit to a few technical science exhibitions as part of the internship. The internship was
for the duration of two months, from May14th
2013 – July 12th
2013. Following is the
schedule of the internship program at TDU:
Schedule
1. Duration of stay in TDU: May14 (Tue) - July 12 (Fri)
2. Orientation: May 14 , PM 1:00-5:00
3. Laboratory work
a) Practical subject for study {1}:
“Study of visual fatigue due to Blue-light rays from LED-backlit LCD”
Tasks:
Measurement of blue-light emission from LCDs and OLED.
Measurement of visual fatigue while reading e-book readers.
Comparison of photobiological safety between LCDs and OLED.
Schedule: May 20 – June 7 (Three weeks)
b) Practical subject for study {2}:
“Measurement of Cerebral blood flow when person is concentrating on Reading,
Speaking, Writing and Typing”
Tasks:
Learning operation of a NIRS device.
Measurement of cerebral blood flow while reading, speaking, keyboard
typing & handcopying using NIRS device.
Processing of measurement data.
Schedule: June 10 – June 28 (Three weeks)
4. Technical tour of advanced information technology in Japan:
a) NHK Science and Technical Research Labs May 31 (Fri)
b) 3D & Virtual Reality Exhibition June 21(Fri)
5. Submission of final Internship Report Deadline : July 12

P r a c t i c a l S t u d y 1 | 2
PRACTICAL STUDY 1
STUDY OF VISUAL FATIGUE DUE TO BLUE-LIGHT EMISSION FROM LED-BACKLIT LCD
DISPLAYS
A. Introduction
There has been an exponential increase in the usage of electronic display devices all over
the world. People are constantly viewing a screen on their computers, tablets, mobiles etc. for
longer duration of time. Prolonged duration of viewing these devices leads to visual fatigue.
We aim to identify some of the factors for this visual fatigue and thereby facilitate to reduce
its effects in the future. This experiment was set up to analyze the relation between visual
fatigue and Blue-light emission from display devices.
We analyze the visual eye fatigue caused when viewing LCD and OLED displays by
measuring the Critical Flicker Fusion Frequency (CFF) while subjects are made to read from
these devices. We believe the reason for the fatigue is because of the high intensity emissions
from these displays in the Blue Light region. However, there are no previous research studies
on the same.
We measure the visual fatigue while reading on LCD and OLED displays in white and
sepia background mode. The LED backlit LCD displays and OLED displays used today have
a high intensity blue light emission. The question to be answered is weather Blue-light
emission truly affects visual fatigue.
B. Experimental Methods
The subjects comprised of all males, 20 – 22 years old. They were asked to read the e-book
“Steve Jobs” by Walter Isaacson on Ipad3 (LCD) and Galaxy 7.7 Plus (OLED) in the white
and sepia background modes; and the CFF was noted at regular intervals. All readings and
measurements were performed in maximum luminescence setting of the respected devices.
C. Measurement of Luminescence of Devices
We used the Minolta CS1000A Spectrometer to measure the luminescence of the Ipad3 and
Galaxy 7.7 Plus in white & sepia (Fig 2(a)) and also compare that with an LCD TV monitor
and CRT monitor. We also compared these with some common blue-light filters available in
the market. Below are some graphs computed with the obtained data:
Fig 1. Me measuring luminescence of LCD monitor using Minolta CS1000A Spectrometer

P r a c t i c a l S t u d y 1 | 3
a b
c d
e f
Fig 2. a) IPad 3 and Galaxy 7.7 Plus emission spectrum b) Filter emission spectrum
(c-f) IPad 3 & Galaxy 7.7 emission spectrums while using filter
D. Experimental Task and Measuring CFF variation
We measured the emission spectrum of these devices in different modes. The study then
examined visual fatigue when viewing these devices by objective assessment of change in
CFF and subjective assessments using questionnaires.
The subjects were made to read the e-book on both devices in each of the two modes. The
device was kept at a distance of 50cm from the eyes. The subject read for 90 minutes
followed by a 30 minute relaxation period. At the start of the experiment, and at 30 minute

P r a c t i c a l S t u d y 1 | 4
intervals, the subject measured his CFF. They also had to fill up a subjective evaluation form
at the start and end of the experiment.
Figure 3 shows the tester (Takei Kiki Kogyo Co. Ltd.) used to measure the CFF readings.
CFF means the number of flashes per second at which a flickering light just appears to be
continuous. The subjective measurement involved rating symptoms on a scale of -3(strongly
disagree) to 3(strongly agree). The list of symptoms is shown in Table 1.
Fig 3. A critical flicker fusion frequency (CFF) tester (Takei Kiki Kogyo Co. Ltd.)
TABLE I
SUBJECTIVE EVALUATION
No. SYMPTOM
1
Feeling drowsy
2 Feeling like lying down
3 Feeling like yawning
4 Low motivation
5 Whole body feels heavy
6 Anxious
7 Feeling depressed
8 Feeling restless
9 Feeling irritated
10
11
12
13
14
15
16
17
18
19
20
21
22
23
24
25
Scattered thinking
Headache
Heavy in the head
Feeling bad
Fuzzy in the head
Feeling dizzy
Heavy in the arm
Pain in the lower back
Pain in the hand/finger
Legs are heavy
Stiff in the shoulder
Blurry eyes
Eyes are tired
Pain in the eyes
Dry eyes
Things look Blurred

P r a c t i c a l S t u d y 1 | 5
We also calculated the effective Blue-light luminance (LB) at varying brightness in white
background mode on both devices. The formula for calculating LB is given as:
nm
nm
B LBL700
400
)()( (1)
Where, B(λ) is the blue-light hazard function(Fig 4) and L(λ) is the emission spectrum of
the device.
Fig 4. Blue-light hazard function
a b
c
Fig 5. a) IPad 3 emission spectrum at varying luminescence
b) Galaxy 7.7 Plus emission spectrum at varying luminescence
c) LB versus Luminescence graph for Ipad 3 and Galaxy 7.7 Plus
P r a c t i c a l S t u d y 1 | 6
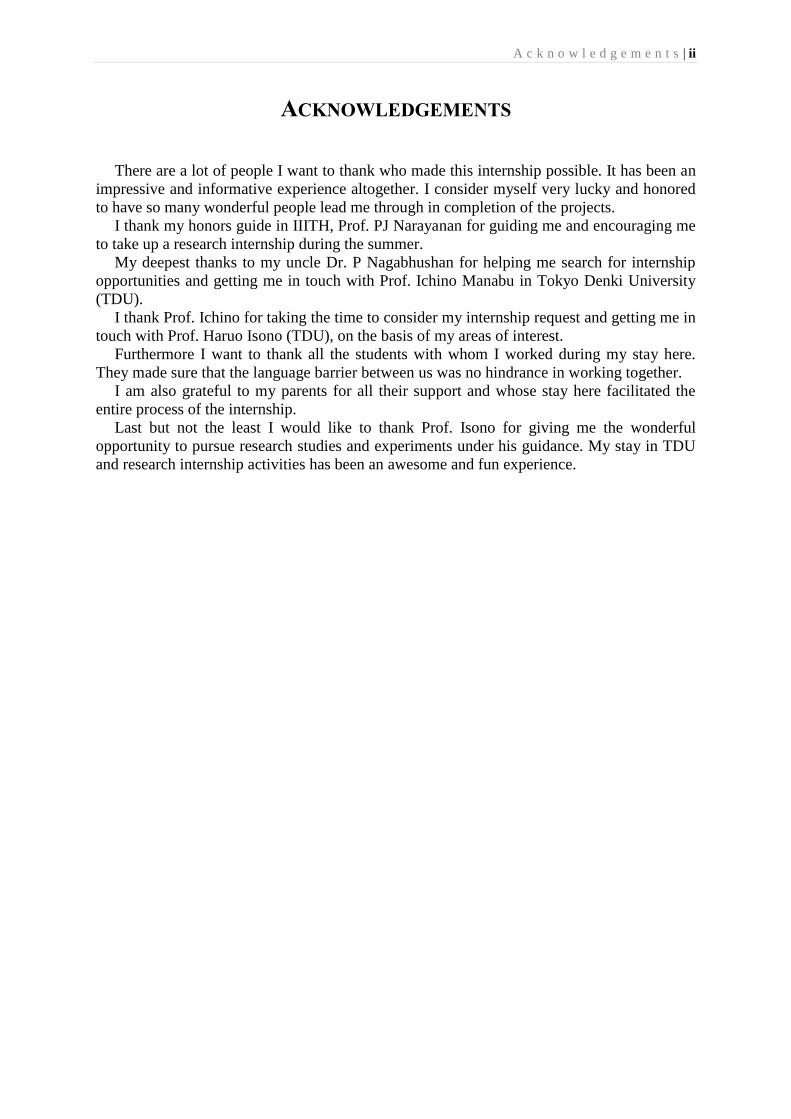
Fig 6. Picture of subjects performing the tasks
E. Experimental Results
We find that both the LCD and OLED displays have
a spectrum which has high blue light emission. A cause
of concern is that the peaks of the blue light hazard
function and the spectrum from these displays are very
near. The absolute luminescence of the LCD device
was much higher than the OLED device, but they both
followed a similar trend. By switching from white to
sepia mode, the blue light emission decreased slightly.
Figure 8 shows the CFF variation and subjective
evaluation graphs for all the test subjects. We find that
for majority of the subjects, according to the CFF
variation graph, the visual eye fatigue was lesser while
reading in sepia background as compared to white
background. The subjective evaluation of the
participants also suggested more eye strain, blurry
vision and tiredness in white background mode.
Figure 5a indicates a linear relation between LB and
luminescence of the device. Greater luminescence
implies more Blue-light emission and hence greater
visual fatigue.
Fig 7. Me graphing and analyzing
the initial raw data

P r a c t i c a l S t u d y 1 | 7
Fig 8. Some Relative CFF variation and Subjective Evaluation graphs for the test subjects

P r a c t i c a l S t u d y 1 | 8
In addition to all this, we also theoretically calculated the filter required to convert the
device(IPad/Galaxy) white background to sepia background at full luminescence. Figure 9
shows the plot for these values against some popular blue-light blocking filters found in the
market. We find that the Jins PC Glass is pretty close to the theoretical white to sepia filter
calculated for IPad 3. Using these various filters are also a good way to reduce the blue-light
emission and hence reduce visual fatigue.
Fig 9. Comparison of actual and theoretical Filter emission spectrum
F. Conclusions
Based on majority of the results, we conclude that Blue-light emission indeed affects visual
fatigue; higher Blue-light emission causes more strain to the eyes. To reduce visual fatigue
while using these devices, one must try to reduce the Blue-light luminescence. This can be
done by working in sepia mode & reducing screen luminescence or by using blue light
blocking filters. A combination of these would ensure much lesser visual fatigue, allowing
the user to work for longer hours with lesser strain on the eyes.
The study was conducted on a limited number of subjects. The data obtained was found to
vary from one subject to another. Also, OLED devices are relatively new and there is no
experimental data publically available for it. Future work includes gathering data from more
test subjects for both LCD and OLED displays so as to get more concise results.

P r a c t i c a l S t u d y 2 | 9
PRACTICAL STUDY 2
MEASUREMENT OF CEREBRAL BLOOD FLOW WHEN PERSON IS CONCENTRATING ON
READING, SPEAKING, WRITING AND TYPING
A. Introduction
The second practical study conducted was to measure the cerebral blood flow while
performing some daily routine tasks. By analyzing this data, we can get an insight as to which
tasks stimulate the brain more and which are more soothing and relaxing. Also, based on this
data, we can find out which method activates the brain more and hence can aid in better
memory and grasping power for students and adults alike.
Measuring brain activity and the activities that stimulate the brain have gained importance
over the years. This data is crucial in order to understand the mysteries of the human brain
and be able to analyze it and decode it. By this we can analyze which activities activate the
brain more and which ones are more relaxing. In this particular study, the cerebral blood flow
of the subjects are measured as they perform various day-to-day activities like reading,
speaking, writing and typing. The changed in blood flow in the prefrontal cortex was
measured using near-infrared spectroscopy (NIRS) device.
The experiment was conducted in three parts. The texts used for the different parts were
normal text on Manga from a Japanese guidebook, tensi jingo practice book and the Hannya
Shingyo (Buddhist Heart Sutra). Tensei jingo is a daily column of a national Japanese
newspaper. The workbook contains parts of these columns which the user has to rewrite in
the space provided below. In lower classes, Japanese students are made to write and practice
in these workbooks daily. Through this experiment we could find out whether this task of
writing and practicing the Japanese characters was helpful to the students. The Hannya
Shingyo is pretty famous among the Japanese people. It is considered sacred & important.
One of the goals of this task was to find out quantitatively, the effectiveness of chanting and
tracing the sutra in traditional conditions. The data gathered from all three parts can be used
in a various settings so as to impart maximal knowledge in the best way possible or to find
out effective ways to perform tasks with minimal load on the brain.
B. Experimental Conditions
a) NIRS Apparatus
The present study used an OEG-spO2 Optical Encephalography Unit (Spectratech Inc.) as
the optical imaging brain function-measuring device. Sites for measurement were 16 points in
the prefrontal cortex (Fig. 1). This device measures oxygenated hemoglobin concentration
(oxy-Hb), deoxygenated hemoglobin concentration (deoxy-Hb), and a combination of the two
as total hemoglobin concentration (total-Hb).

P r a c t i c a l S t u d y 2 | 10
a b
Fig 1. a) OEG-spO2 Optical Encephalography Unit (Spectratech Inc.)
b) Sites for measuring cerebral blood flow in the prefrontal cortex
b) Subjects
The test subjects comprised of 3 university students 20 – 22 years old, and one subject 65+
years old. Everyone performed the first part of the experiment, while only the latter
performed the other two parts.
C. Experimental Methods
This study comprises of three parts. In the first part, the subjects were asked to read, speak,
write and type the contents in a Japanese guide book which talked about Manga. The second
part involved tracing, reading and chanting the Hannya Shingyo. The tracing was done the
traditional way, using a paintbrush. Also, the chanting was done alongside a recording of a
professional Buddhist monk reciting the Sutra. In the third part, the subject performed
reading, speaking and writing from a Tensei Jingo practice book.
For all parts, each task was performed for 5 minutes with rest stimuli of 1 minute before
and after. For the Manga and Tensei Jingo content, for the rest stimuli, the subject observed a
cross shape in the center of a page; and for Hannya Shingyo, the subjects were to close their
eyes and meditate for the duration of the rest stimuli. Figure 2 shows the stimulus
presentation sequence for each task involved.
Fig 2. Presentation sequence of stimuli for each task
Left Right
Occipital Lobe
Frontal Lobe
15 12 9 6 3
16 13 10 7 4 1
14 11 8 5 2
5 min 1 min 1 min
Task Stimuli Rest Stimuli Rest Stimuli
Reading / Speaking
/ Writing / Typing + +

P r a c t i c a l S t u d y 2 | 11
a b c
Fig 3. a) A part of the text from Hannya Shingyo. b) Newspaper article showing school kids
practicing tensei jing.o
c) A page from tensei jingo practice book.
Fig 4. Picture of subjects at various stages of the task

P r a c t i c a l S t u d y 2 | 12
D. Measurement Results
This study used Z-score analysis, which has shown proven results in optical imaging brain
function data analysis. Z-scores were calculated with the formula shown below. A positive Z-
score means that the cerebral blood flow during Task stimulus is significantly greater than
that during Rest stimulus, implying that the brain is being activated.
) Rest)(Hb-Oxy (
Rest)(Hb-Oxy (Task)Hb-Oxyscore-Z
(1)
Figures 5, 6 & 7 show the Z-scores calculated for the three parts. According to the figure,
we find that in majority of the subjects, the activities which involved input using hand
(writing & typing) led to a significantly greater activation of the brain as compared to silent
reading. Brain activation while speaking was found to be dependent highly on the subject,
and also varied for the same subject while repeating the experiment.
Fig 5. Z-scores for each subject for tasks performed using Manga as text
P r a c t i c a l S t u d y 2 | 13
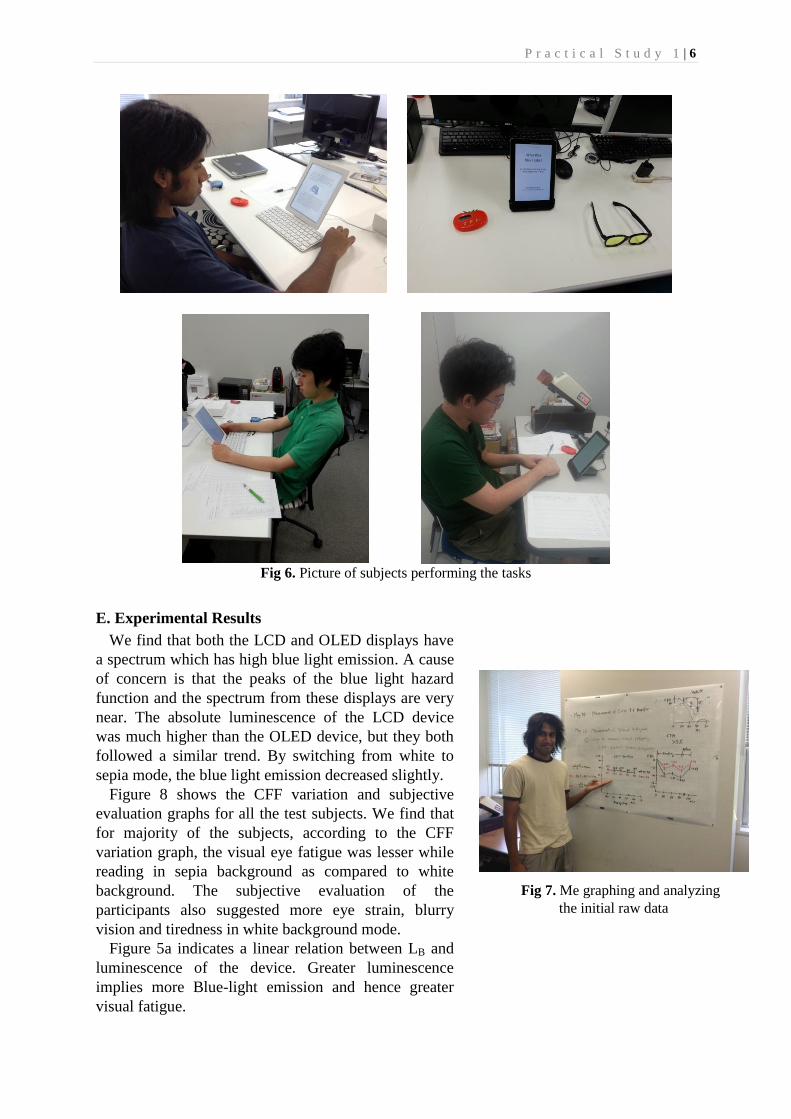
Fig 6. Z-scores for each subject for tasks performed using Hannya Shingyo as text
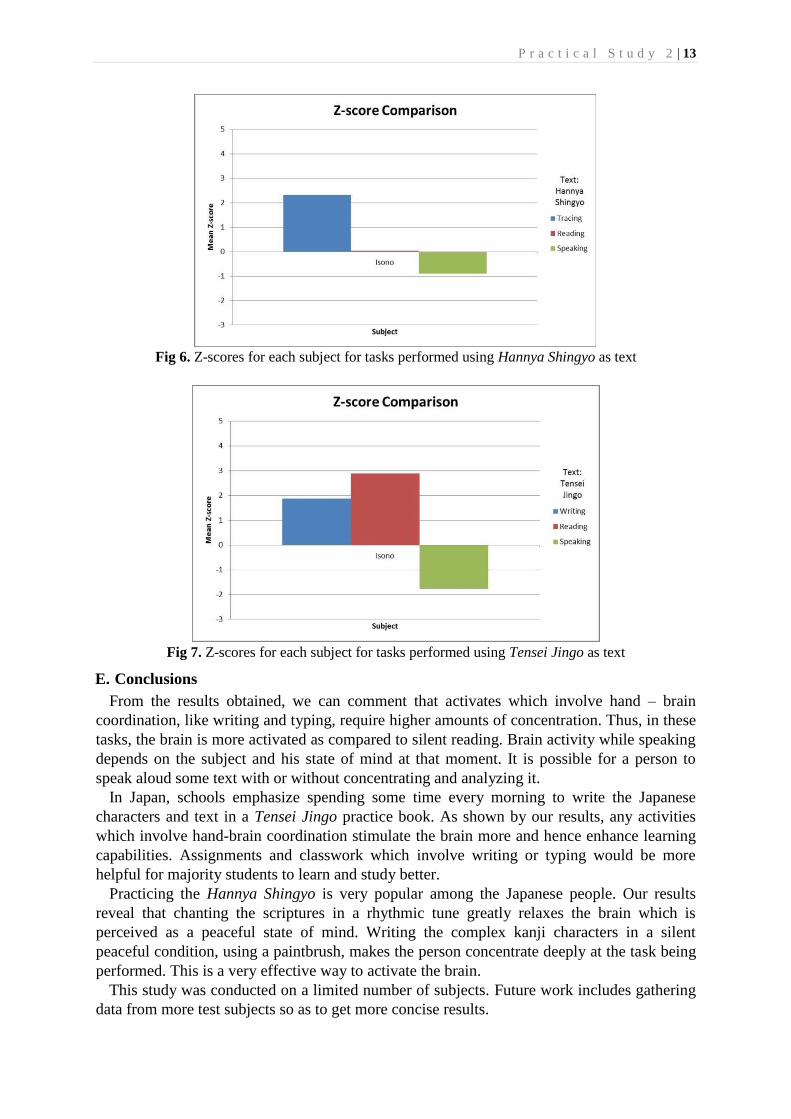
Fig 7. Z-scores for each subject for tasks performed using Tensei Jingo as text
E. Conclusions
From the results obtained, we can comment that activates which involve hand – brain
coordination, like writing and typing, require higher amounts of concentration. Thus, in these
tasks, the brain is more activated as compared to silent reading. Brain activity while speaking
depends on the subject and his state of mind at that moment. It is possible for a person to
speak aloud some text with or without concentrating and analyzing it.
In Japan, schools emphasize spending some time every morning to write the Japanese
characters and text in a Tensei Jingo practice book. As shown by our results, any activities
which involve hand-brain coordination stimulate the brain more and hence enhance learning
capabilities. Assignments and classwork which involve writing or typing would be more
helpful for majority students to learn and study better.
Practicing the Hannya Shingyo is very popular among the Japanese people. Our results
reveal that chanting the scriptures in a rhythmic tune greatly relaxes the brain which is
perceived as a peaceful state of mind. Writing the complex kanji characters in a silent
peaceful condition, using a paintbrush, makes the person concentrate deeply at the task being
performed. This is a very effective way to activate the brain.
This study was conducted on a limited number of subjects. Future work includes gathering
data from more test subjects so as to get more concise results.

T e c h n i c a l T o u r s | 14
TECHNICAL TOURS
As part of the internship program, I got the opportunity to visit some research open house
and international expos. This was a great experience as I got to know first-hand of the work
being carried out in these fields and the potential for future research activities. Also it was fun
to know about the technologies which we may be exposed to in the near future.
Visit to NHK Science and Technical Research Labs
On May 31st 2013, Prof. Isono and I went to the NHK Science and Technical Research
Labs (STRL) Open House. This year marked the 60th
anniversary of the start of TV
broadcasting in Japan. STRL has constantly tackled cutting-edge technologies, and has
contributed to the development of broadcasting technology in fields such as satellite
broadcasting, HDTV and digital broadcasting, both in Japan and overseas.
This year’s Open House introduced 37 latest research achievements. One of the major
features was the previews of Hybridcast. Hybridcast is the integration of broadcast and
broadband technologies and services. Also on demonstration were the core technologies of
Super Hi-Vision, which is aimed to enter its test broadcasting stage by 2016. On display was
the biggest ever super hi-vision display with a diagonal size greater than 200 inches. Another
display which caught my attention was the computer graphics-based sign language translation
system and the technology for integrating broadcasting with tactile feedback.
The above mentioned are just some of the various things I got to see at the event. Here are
some pictures I took:
Prof. Isono and me at the entrance of NHK STRL Open house

T e c h n i c a l T o u r s | 15
Concept and live demos of Hybridcast Technologies
A picture of a scene being shown on a Super Hi-Vision display. The image quality is so rich it’s hard
to tell that this is a picture of a screen.
Real-time graphic-based text to sign language conversion for weather forecast

T e c h n i c a l T o u r s | 16
Visit to 3D & Virtual Reality Exhibition
On June 21st 2013, Prof. Isono and I attended the 21
st annual 3D & Virtual Reality
Exhibition (IVR) held at Tokyo Big Sight. IVR is Japan’s top notch exhibition which offers a
great platform for the researchers and expertise groups to experience all kinds of latest 3D
technology and high definition image technology.
There were a couple of stalls by different companies displaying prototypes of handheld
Mixed Reality goggles. I tried out one of these devices at Cannon’s stall. Other things we
came across included No-glasses 3D displays, 3D space configurators. Next-system had on
display a prototype for a virtual Fashion system and Kinesys-taking advantage of Kinect to
operate and navigate seamlessly a PC screen from a distance. Also on display was 3D
anatomy program, a head mount thermal imager system, video projections on a sheet of fog
generated by a fog machine. There were some cost effective real-time finger tracking and
motion tracking technologies too. There were some stalls having AR based technologies;
stalls with different displays including dome displays; gesture cams; view trackers; and one
of the more fun things to try out was the game which simulated flying from the top of Tokyo
Sky Tree! Wearing the HEWDD-1080 head mount device by Crescent.inc, the experience
was very realistic and enjoyable!
In addition to the above exhibits there were many other stalls displaying interesting
technologies. I didn’t get time to click many pictures; I did however get back many
pamphlets (though most of them were in Japanese).
Tokyo Big Sight – venue for the 3D and VR Exhibition
Prototype of handheld Mixed Reality
goggles by Cannon
Interactive experience of HEWDD-1080
head mount device by Crescent.inc

C o n c l u s i o n | 17
CONCLUSION
The whole experience of working as a research intern at TDU was great. I have gained
new knowledge, skills and met new people. Everyone was very friendly and hospitable; it
was a joy working with them. By working on these research topics, I got a feel of what it is to
do some hands on research work. It helped give me an understanding of the potential of
research in the fields of display technology and human factors.
In addition to these practical studies, I was also taken to various technical tours and
international expos as part of the internship. This greatly helped expand my horizon on the
various kinds of work and research being pursued in the fields of computer vision, display
devices and 3D and Virtual reality.
Apart from the work related aspects, my stay at TDU has been very interesting. I have had
many outings with Prof. Isono and the other students I work with here which helped develop
a much closer bond with everyone.
All in all, the internship experience as a research assistant has been excellent and
enjoyable.