Embed Size (px)
Citation preview

Today
• Today: Finish Chapter 9, start Chapter 10
• Sections from Chapter 9: 9.1, 9.4, 9.5, 9.10 (know just class notes for these sections)
• Recommended Questions: 9.1, 9.8, 9.20, 9.23, 9.25

Assignment due Friday April 4
• Assignment: 9.21, 9.22, 9.24,4. In a simple random sample of size 1600 from a large population, 60% approved of the
President's job performance and 40% disapproved. Find a 95% confidence interval for the proportion of the entire population that approves of the President's job performance.
5. The EPA requires that snowmobiles in Northern Michigan average at least 100 kilometers
per liter of gasoline. A sample of 16 snowmobiles of a given make were tested over a 5000 kilometer course and the average number of kilometers per liter (X) was computed for each snowmobile. Assume that X is normally distributed. If the sample mean is 99.1 and sample variance is 1, find a 95% confidence interval for the average number of kilometers per liter. Would you conclude, from the interval that the snowmobile in in compliance with EPA regulations?
6. The amount of sewage and industrial pollution dumped into a body of water affects the
health of the water by reducing the amount of dissolved oxygen available for aquatic life. An average level 5.0 parts per million is considered marginal for supplying enough dissolved oxygen for fish. Weekly readings are taken from the same location in the river over a two month period downstream from a sewage treatment center. Give a 95\% confidence interval for the mean amount of dissolved oxygen available. Is there cause for concern?
Here are the data: 5.1, 4.9, 5.6, 4.2, 4.8, 4.5 5.3, 5.2

Example
• A recent CNN/USA Today/Gallup poll suggests that while Americans are clearly upset with France, one might characterize current Franco-American tensions more as a spat between siblings than the beginning of a war between mortal enemies
• The poll, conducted March 14-15, shows that 64% of Americans currently express an unfavorable view of France, while only about half that number, 34%, have a favorable view
• Results are based on telephone interviews with 1,007 national adults, aged 18+. For results based on the total sample of national adults, the margin of sampling error is ±3 percentage points
• What is missing?
How to Change the Width of a C.I.
•

Small Sample Confidence Intervals for Means
• When constructing large sample confidence intervals, have assumed:– The sample mean is approximately normal
– The sample variance is close to the population variance
• What is the sample size is not large?
• If the parent population is close to normal, the sample mean is likely to be close to normally distributed
• Z-score is almost distributed as a standard normal…just a little more spread out
Small Sample Confidence Intervals for Means

Example
• A poultry processing company has received a shipment of 2000 Cornish hens, and the firm's quality manager wishes to estimate the true average weight of the hens
•
• The firms goal is that the average weight of each hen should be at least 1 kg
• They take a sample of 20 hens, and the mean weight of hens from the sample is 985 g with a sample standard deviation of 200g.
• An approximate 95% confidence interval for the true mean weight of the hens is:

Example
• To assess the accuracy of a laboratory scale, a standard weight known to be 10 grams is weighed 5 times
• The reading are normally distributed with unknown mean and a standard deviation
• Mean result is 10.0023 grams with sample standard deviation of of 0.0002 grams
• Find a 90% confidence interval for the mean

Summary of C.I.’s
• Ideally, the interval contains the true parameter value
• In practice, not possible to guarantee because of sample to sample variation
• Instead, we compute the interval so that before sampling, the interval will contain the true value with high probability
• This high probability is called the confidence level of the interval
• The purpose of a confidence interval is to give a range of plausible values for the true population mean based on a sample taken from the population
• It does NOT give a range for individual values in the population

Summary of C.I.’s
• The confidence interval has two parts - the actual interval and the confidence level
• Should use the normal distribution based intervals when:
• Should use the T-distribution based intervals when:
• As you increase the confidence level, the multiplier increases and the interval gets wider. As you increase the sample size, the interval gets narrower.
Chapter 10 – Significance Testing
• Can use random samples to estimate characteristics of a distribution
• Can also collect data to help answer questions about a population
• Example:– Heights of one-year-old girls normally distributed with mean 30 inches and
standard deviation of 1.2 inches
– Company claims taking 500 mg of Vitamin C makes the girls taller
– How can we assess the company’s claim?

Significance Testing
• Significance testing is a statistical technique to test if a conjecture about a population parameter is true
• Has 5 Main Steps:– Null and Alternate Hypotheses
– Test Statistic
– Specification of an “extreme value”
– P-Value
– Decision based on pre-specified error rate

Hypotheses
• Hypotheses are statements about a population and is expressed in terms of the population parameters
• Begin by making an assumption of no change
– (Treatment has no effect)
• This statement is called the null hypothesis (H0)
• Test will be designed to assess evidence against H0

Hypotheses
• Hypothesis we suspect is true is called the alternate hypothesis (H1)
• Assume H0 is true, collect data and see if there is evidence against H0 and in favor of HA

Hypotheses
• Each hypothesis can be expressed in terms of a model (e.g., a normal distribution with mean greater than 30 inches)
• The hypotheses are made about a population of interest
• This is the population from which the sample is drawn

Example
• Heights of one-year-old girls normally distributed with mean 30 inches and standard deviation of 1.2 inches
• Company claims taking 500 mg of Vitamin C makes the girls taller
• H0:
• HA:
• Population:

Test Statistic
• Test statistic measures compatibility between H0 and the data
• It is based on 2 principles:
– based on estimate of the parameter that appears in the hypotheses
– measures distance of estimate from the hypothesized value
• When H0 is true, we expect the value of estimate to be close to parameter on average

Example (continued)
• Suppose a random sample of 100 baby girls are given 500 mg of vitamin C daily for 1 year
• Mean height of the girls after 1 year is 32 inches (estimates population mean)
• What is the distribution of if H0 is true?
• What is the distribution of if HA is true?
x
x

P-Value
• Assume that H0 is true
• The P-value is the the probability of observing a test statistic as extreme or more extreme than the value actually observed when H0 is true
• What does a small p-value imply?
• How small is small?

Example (continued)
• If H0 is true, the distribution of the sample mean is:
• What does “extreme” mean in this context?
• P-value=

Specification of Extreme Value
• How small must the p-value be to reject H0?
• Must decide which value of the test statistic give evidence in favor of H1
• Would like the probability of observing such values to be small when H0 is true
• The significance level of the test is:

Decision
• How small must the p-value be to reject H0?
• Must decide which value of the test statistic give evidence in favor of H1
• Would like the probability of observing such values to be small when H0 is true
• The significance level of the test is:

Example (continued):
• P-value=
• Significance level:
• Decision:

Hypothesis Testing is Similar to a Jury Trial
• H0: state of no change
• H1: condition believed to be true
• Collect data and compute test statistic
• Compute p-value
• Reject or do not reject H0 based on significance level
• Not Guilty
• Guilty
• Collect evidence
• Weigh evidence
• Decide if evidence is in favor of guilty beyond a reasonable doubt

• How do we interpret significance level
• Some common significance levels:
• Have we proven that H0 is true or false?
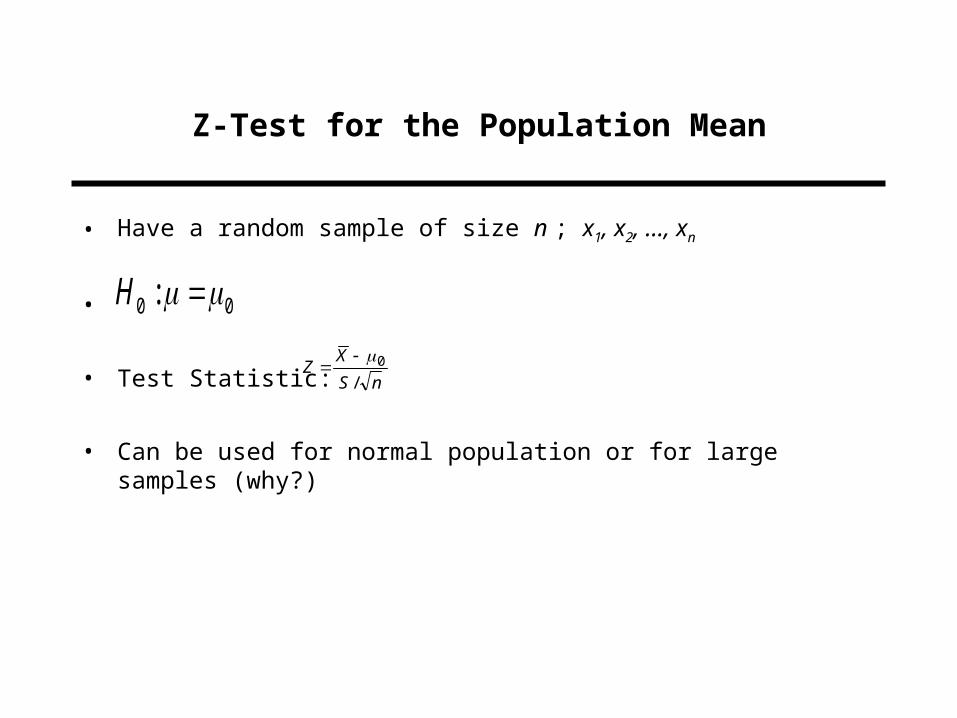
Z-Test for the Population Mean
• Have a random sample of size n ; x1, x2, …, xn
•
• Test Statistic:
• Can be used for normal population or for large samples (why?)
00 : H
nS
XZ
/0

Z-Test for the Population Mean (cont.)
• P-value depends on the alternative hypothesis:
–
–
–
)( value-p : : 01 zZPH
)( value-p : : 01 zZPH
|)| (2 value-p : : 01 zZPH

Example:
• Scientists believe that abused children show elevated levels of depression
• To test this assertion, as random sample of 50 abused children were given a Profile of Moods States (POMS) test
• The results showed a mean depression score of 17.3 and standard deviation of 5.4
• Test, at the 5% level, whether abused children have a higher mean depression that that of the general population (mean=15)

Example:
• A study titled “St. John’s Wort: Effect on CYP3A4 Activity” (Clinical Pharmacology and Therapeutics, 2000) reported a study that assesed urinary 6-beta-horoxycortisol/cortisol ratio in 12 subjects after 14 days of therapy with St. John’s Wort.
• The baseline mean ratio for the target population is 7.0 and the scientists wished to determine if the therapy resulted in increased a urinary 6-beta-horoxycortisol/cortisol ratio
• Using the data below, test this hypothesisPatient urinary 6-beta-
horoxycortisol/ cortisolratio
Patient urinary 6-beta-horoxycortisol/ cortisolratio
1 16.8 7 5.42 13.7 8 14.93 11.3 9 9.24 20.3 10 6.45 7.0 11 12.96 6.1 12 7.2