Embed Size (px)
Citation preview
UNIt 1 LANDFORMS AND LANDSCAPES
tOPIc 3
Landscapes formed by water
3.1 Overview 3.1.1 Introduction Water is one of the most powerful agents in creating landscapes. If you have ever been caught outside in a heavy downpour, walked through a fast-fl owing creek, or been dumped in the surf, then you have felt and seen the energy of fl owing water. It can knock you off your feet, move buildings and carve huge holes in the Earth’s surface. Landscapes created by water are found everywhere.
Starter questions 1 Use the Iguazu Falls weblink in the Resources tab to watch a video
of the Iguazu Falls, which highlights the power of fl owing water. a List as many adjectives as you can to describe the power of water. b Use these words to write a short performance poem or rap that beats with
the power and potential of water to change an environment or to shape a landscape. Perform these for your class.
2 Landscapes created by fl owing water can be both beautiful and dangerous. Identify two examples of each type of landscape and explain why you believe it to be beautiful or dangerous.
Inquiry sequence 3.1 Overview 38
3.2 Which landscapes are formed by water? 40
3.3 What is coastal erosion? 42
3.4 Which coastal landforms are created by deposition? 44
3.5 How are coasts changed? 46
3.6 What differences exist in coastal landforms between places? 48
3.7 How are coasts managed? 49
3.8 How do I undertake coastal fi eldwork? 51
3.9 skillBuilder : Constructing a fi eld sketch 53
3.10 What’s in a rip? 53
3.11 How does water form river landscapes? 55
3.12 How are river landscapes managed? 59
3.13 Which landscapes are formed by ice? 61
3.14 Do all rivers fl ow to the sea? 62
3.15 skillBuilder : Reading contour lines on a map 64
3.16 Review 65
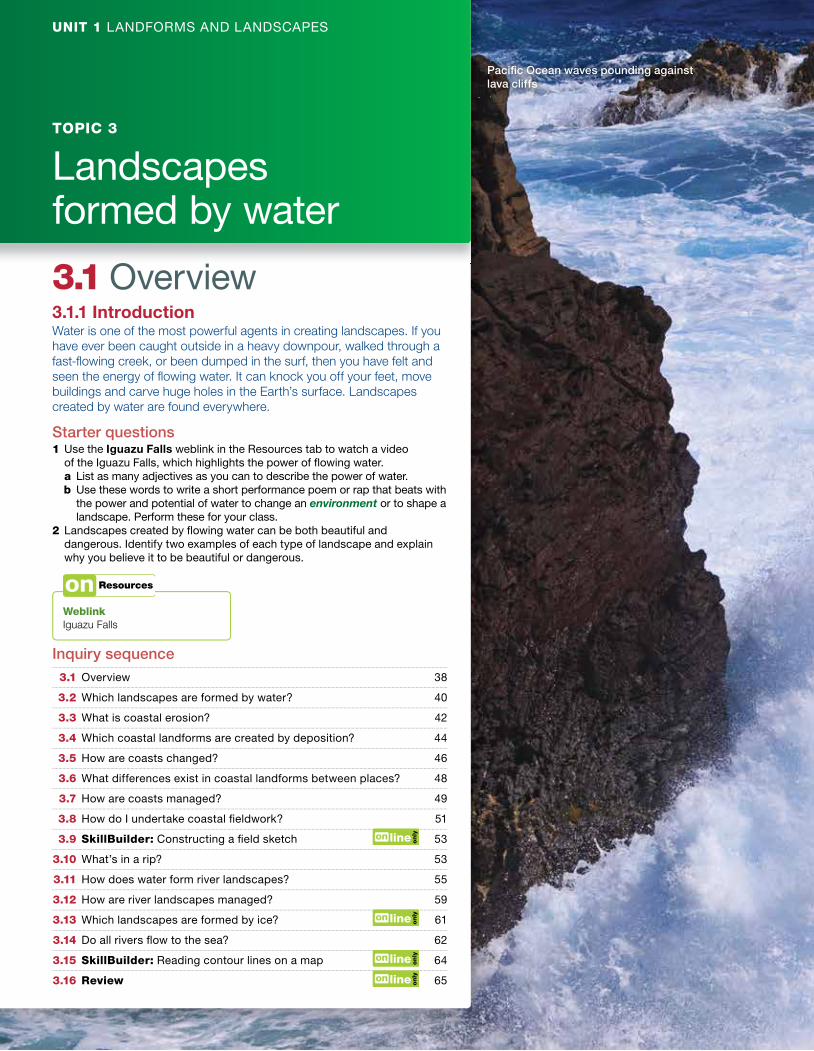
Pacifi c Ocean waves pounding against lava cliffs
Weblink Iguazu Falls
To access videos, interactivities, discussion widgets, image galleries, weblinks and more, go to www.jacplus.com.au
40 Jacaranda Geography Alive 8 for the Victorian Curriculum
3.2 Which landscapes are formed by water?3.2.1 How does water change landscape features?A torrent of gushing water can shift rocks, remove topsoil or shape river valleys. Gentle rain can change the chemical structure of any surface material, making it more likely that soil will be transported by the next heavy shower. In cold climates, frozen water in glaciers works like a slow-moving bulldozer to erode land and create unique landscape features. Once fresh water has made its way to the ocean, the power of waves creates coastal landscape features.
As you saw in topic 2, landscapes are predominantly changed or created by two processes: erosion and deposition. Water is one of the most powerful agents of change, causing erosion and deposi-tion, and thereby breaking up, moving and repositioning material across the Earth’s surface. In figure 2 you can see the power of water as it rushes over a rockface and carves pools in its hard surface. You may have seen pools of a similar shape carved by waves in rocky coastal landforms.
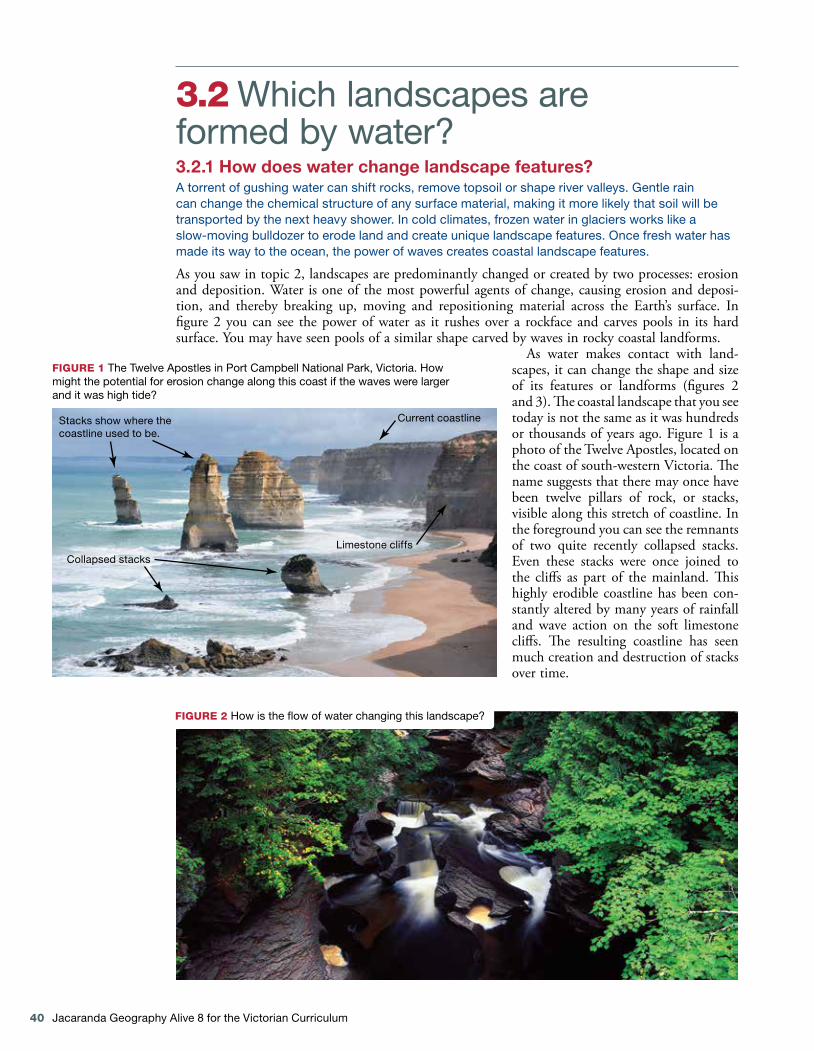
As water makes contact with land-scapes, it can change the shape and size of its features or landforms (figures 2 and 3). The coastal landscape that you see today is not the same as it was hundreds or thousands of years ago. Figure 1 is a photo of the Twelve Apostles, located on the coast of south-western Victoria. The name suggests that there may once have been twelve pillars of rock, or stacks, visible along this stretch of coastline. In the foreground you can see the remnants of two quite recently collapsed stacks. Even these stacks were once joined to the cliffs as part of the mainland. This highly erodible coastline has been con-stantly altered by many years of rainfall and wave action on the soft limestone cliffs. The resulting coastline has seen much creation and destruction of stacks over time.
FIGURE 1 The Twelve Apostles in Port Campbell National Park, Victoria. How might the potential for erosion change along this coast if the waves were larger and it was high tide?
FIGURE 2 How is the flow of water changing this landscape?
Stacks show where thecoastline used to be.
Current coastline
Limestone cliffsCollapsed stacks
Topic 3 Landscapes formed by water 41
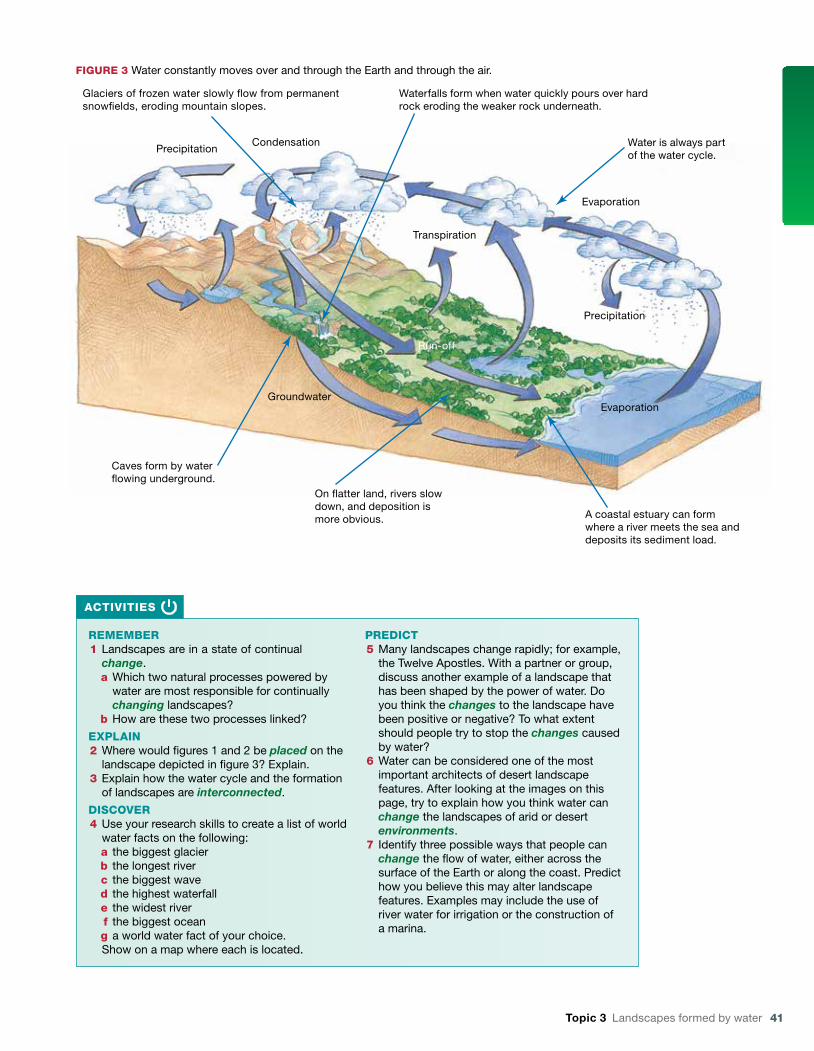
FIGURE 3 Water constantly moves over and through the Earth and through the air.
actIvItIEs
REMEMBER1 Landscapes are in a state of continual
change.a Which two natural processes powered by
water are most responsible for continually changing landscapes?
b How are these two processes linked?
EXPLaIN2 Where would figures 1 and 2 be placed on the
landscape depicted in figure 3? Explain.3 Explain how the water cycle and the formation
of landscapes are interconnected.
DIscOvER4 Use your research skills to create a list of world
water facts on the following:a the biggest glacierb the longest riverc the biggest waved the highest waterfalle the widest riverf the biggest oceang a world water fact of your choice.Show on a map where each is located.
PREDIct5 Many landscapes change rapidly; for example,
the Twelve Apostles. With a partner or group, discuss another example of a landscape that has been shaped by the power of water. Do you think the changes to the landscape have been positive or negative? To what extent should people try to stop the changes caused by water?
6 Water can be considered one of the most important architects of desert landscape features. After looking at the images on this page, try to explain how you think water can change the landscapes of arid or desert environments.
7 Identify three possible ways that people can change the flow of water, either across the surface of the Earth or along the coast. Predict how you believe this may alter landscape features. Examples may include the use of river water for irrigation or the construction of a marina.
Waterfalls form when water quickly pours over hardrock eroding the weaker rock underneath.
Water is always partof the water cycle.
A coastal estuary can formwhere a river meets the sea anddeposits its sediment load.
PrecipitationCondensation
Precipitation
Run-off
Transpiration
EvaporationGroundwater
Evaporation
Glaciers of frozen water slowly �ow from permanentsnow�elds, eroding mountain slopes.
On �atter land, rivers slowdown, and deposition ismore obvious.
Caves form by water�owing underground.

42 Jacaranda Geography Alive 8 for the Victorian Curriculum
Direction of watermovement
Backwash �lledwith sand
3.3 What is coastal erosion?3.3.1 How are coastal landscapes eroded?The coast is the zone or border between land and ocean. It is in this collision zone that the movement of sea water and the impact of the ocean on the land together create coastal landscapes. Coastal landscapes have landforms that are common to coastlines in different places around the world because they are built up or worn away in similar ways.
Powerful ocean waves crash onto rocky coastlines, wearing away the cliff base between the high and low tide marks. In figure 1 in subtopic 3.2, showing the Twelve Apostles, the most powerful wave impact on this coast would be to the seaward side of the stacks or rock pillars. Wave impact has progressively knocked over some stacks, and the rock that they were made from has eroded into sand, which now forms part of the beach at the cliff base.
Coastal erosion is mostly caused by waves moving sand and other material and energy to and from the beach. For example, you may have seen sand being churned up by the waves when you have been at the beach. The waves that wash on to the beach are called swash. Waves returning down the beach into the sea are called backwash. A powerful ocean swell created by offshore storms forms destructive waves. These are the waves that produce good surf, and dump you while you are swimming. As these waves rush back into the sea, the force of the water and sand they carry can make it difficult for you to get back onto the beach. Destructive waves often have a powerful backwash that can carry beach sand offshore. Figure 1 shows backwash filled with sand that is being moved from the beach.
However, not all aspects of coastal landscapes are solely created by the power of water. Other physical processes can also greatly affect the coastal landscape; for example, the tectonic force of earthquakes and volcanoes; changing sea levels; and human activities such as building roads, ports and houses, and damming rivers.
Which coastal landscape features are created by erosion?Features such as cliffs, headlands, bays, caves and stacks are all landforms found along an eroding coastline (figure 2). These features are formed by wave action and rainfall, which attack the cliffs and find points of weakness that are then eroded. Water running off a cliff face can carry eroded material into the sea below. When waves hit the cliff face, they undercut the base of the cliff to form a notch. As the notch increases in size, the undercut section of the cliff becomes unstable and falls into the sea.
Destructive waves can also alter a sandy coastline. They can remove sand from a beach, destroy the vegetation on dunes, and remove management features designed to protect landscape features.
swash the movement of water in a wave as it breaks onto a beach
backwash the movement of water from a broken wave as it runs down a beach returning to the ocean
destructive wave a large powerful storm wave that has a strong backwash
FIGURE 1 Backwash filled with sand.
Interactivitycoastal sculptureUse this interactivity to learn how coastal landscapes are formed.int-3124
Topic 3 Landscapes formed by water 43
Deepen your understanding of this topic with related case studies and questions. coastal processes
actIvItIEs
REMEMBER 1 What are three physical processes that have
infl uenced the creation of coastal landforms? 2 What are three human activities that have
infl uenced the creation of coastal landforms?
EXPLaIN 3 Create an annotated diagram that explains the
difference between swash and backwash. 4 Place the following landforms in the order in
which they would be created: a arch, cave, headland, stack b blowhole, cave, cliff.
DIscOvER 5 Watch the Stack formation weblink and/or
the Cliffed Coast weblink in the Resources tab. Take note of the process of erosion of a cliff face.
6 In a small group, create your own claymation or stop-motion movie, Prezi, or animated PowerPoint to show the changes that happen to a cliffed coast eroding to form a notch, cave, arch and stack.
7 Find an image of a sandy coastline that has recently been affected by destructive waves. Explain the process that has occurred. Use the terms swash and backwash in your explanation.
PREDIct 8 Most Australians live within an hour’s drive
of the coast, and many people either spend regular holidays on the coast or move to the coast in their retirement, for a ‘sea change’. How might the continually changing coastal landscape (as seen in fi gure 2) affect coastal housing and popular holiday places? Brainstorm this with a small group.
9 Identify, using a sketch map, how several of the changes identifi ed in question 8 might affect the coastal landscape of your favourite beach.
10 Do you think people will still feel the same way about a coastal landscape such as the Twelve Apostles when only two or three are still standing? How might the changing landscape affect the value or pleasure people get from visiting this place ? Write a short paragraph to comment.
tHINK 11 Rising sea levels, whether they are a naturally
occurring process or have resulted from human activity, will affect coastal landscapes. Use a diagram, with annotations, to explain how rising sea levels could change two of the landforms illustrated in fi gure 2.
Weblinks Stack formation Cliffed Coast
Beach
Headl
and
Beach
Sea cave
Wavecut platform
Bay
Sea stacks
Bay
Headland
Arch
Blowhole
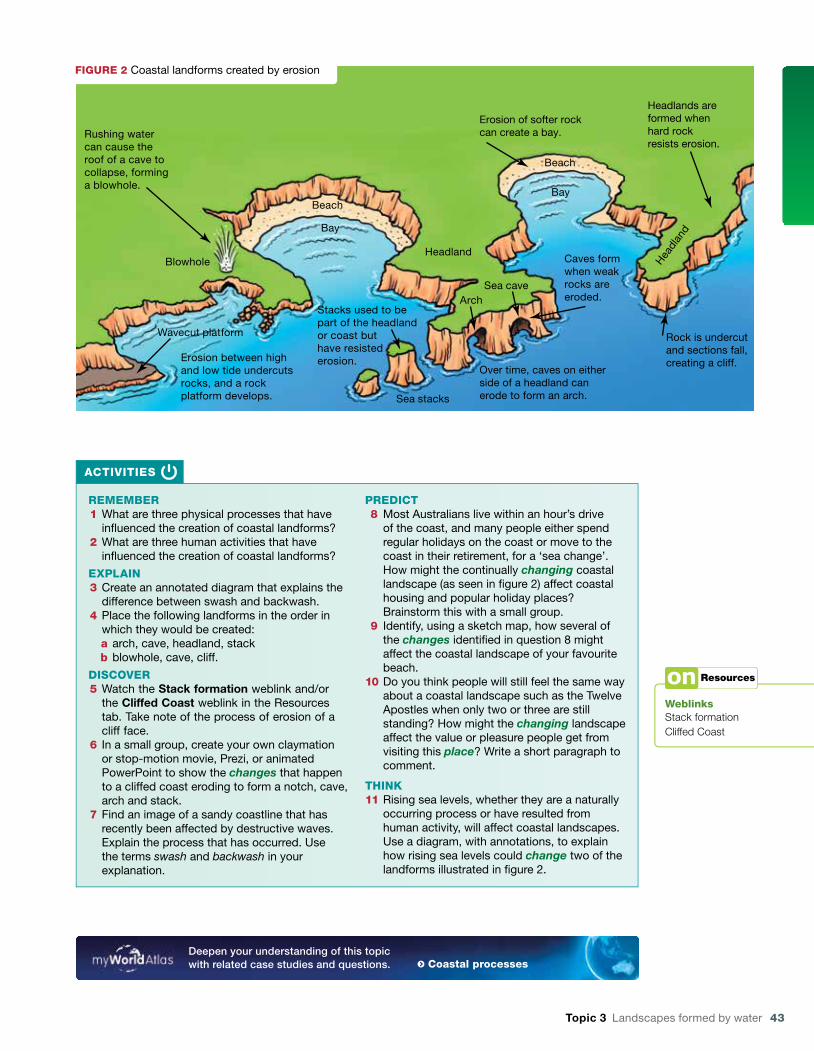
Rushing watercan cause theroof of a cave tocollapse, forminga blowhole.
Stacks used to bepart of the headlandor coast buthave resistederosion.Erosion between high
and low tide undercutsrocks, and a rockplatform develops.
Over time, caves on eitherside of a headland canerode to form an arch.
Rock is undercutand sections fall,creating a cliff.
Caves formwhen weakrocks areeroded.
Headlands areformed whenhard rockresists erosion.
Erosion of softer rockcan create a bay.
FIGURE 2 Coastal landforms created by erosion
44 Jacaranda Geography Alive 8 for the Victorian Curriculum
3.4 Which coastal landforms are created by deposition? 3.4.1 How are depositional coastal landforms formed? Not all waves are destructive. Some waves gently lap the shoreline. Smaller, gentler waves that carry less energy than destructive waves are known as constructive waves . The movement of these waves towards the land is more likely to push material such as sand and shells and deposit them on the beach, building new coastal features.
A beach is a good example of a depositional coastal landform (fi gure 1). Sand has been deposited and built up over a period of time. Constructive waves build coastal landscape features by reposi-tioning wave-born materials to also create spits, sand dunes and lagoons.
Th e coastal features created by deposition can be created only when material is brought onshore by the swash of constructive waves. Th e construction material is in the form of sand, shells, coral and pebbles. Th e source of the construction material may come from eroding cliff s, from an off shore source, or from rivers which, when they enter the sea, dump any material they were transporting.
Th is construction material is then shaped by prevailing winds. Figure 2 illustrates the cross-section of a beach formed when there is plenty of sand being pushed onshore by the swash. Th is construction material is dried by the sun and blown inland to create dunes.
Beach material can also be shifted by waves, which get their energy from the wind. Th e wind infl uences or directs the angle that waves move towards the coast. Waves come from the direction of the prevailing wind . Th is means that waves often move towards the shore at an angle, and their
constructive wave a gentle backwash that leads to material being deposited on land
prevailing wind the main direction from which the wind blows
Sea Beach
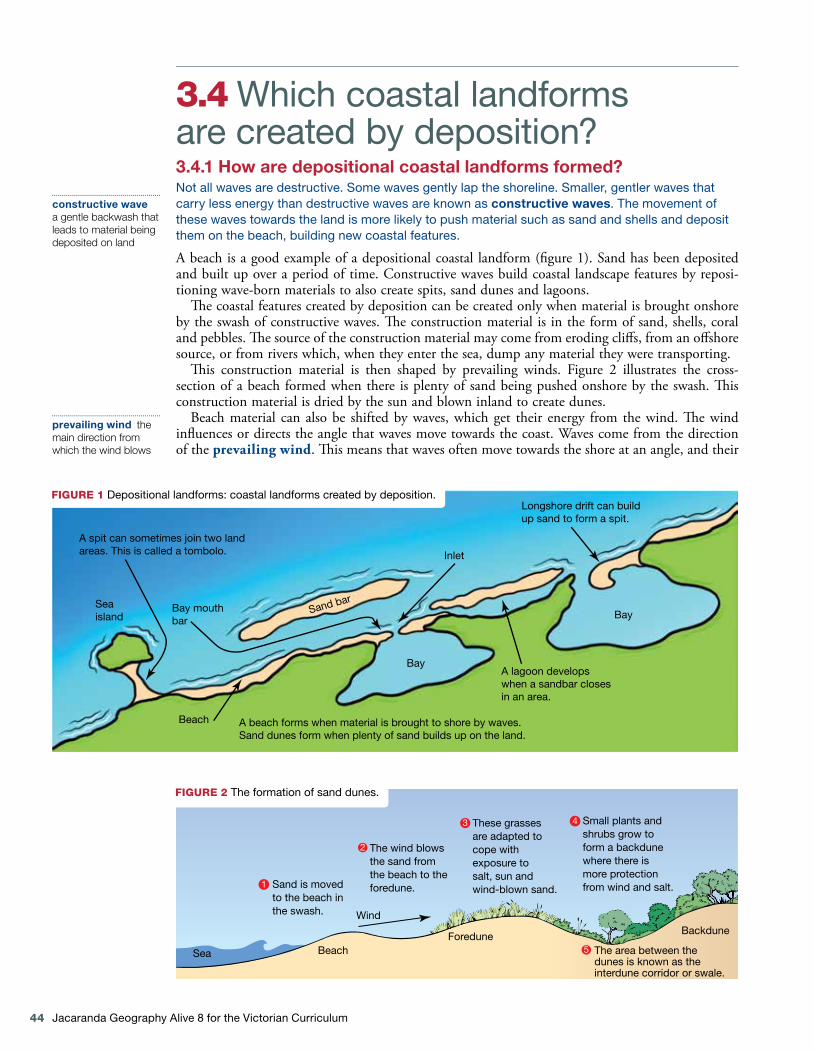
Sand is moved to the beach inthe swash.
The wind blowsthe sand fromthe beach to theforedune.
Foredune
These grassesare adapted tocope withexposure tosalt, sun andwind-blown sand.
Small plants andshrubs grow toform a backdunewhere there ismore protectionfrom wind and salt.
The area between thedunes is known as theinterdune corridor or swale.
BackduneWind
5
FIGURE 2 The formation of sand dunes.
Bay
Sand bar
Inlet
Beach
Seaisland
Bay mouthbar
A spit can sometimes join two landareas. This is called a tombolo.
A beach forms when material is brought to shore by waves.Sand dunes form when plenty of sand builds up on the land.
A lagoon developswhen a sandbar closesin an area.
Longshore drift can buildup sand to form a spit.
Bay
FIGURE 1 Depositional landforms: coastal landforms created by deposition.

Topic 3 Landscapes formed by water 45
swash pushes any material they are carrying onto the beach at an angle. As the backwash of the wave returns to the sea, its path takes the shortest possible route down the beach towards the water. This action is known as longshore drift, and it is shown in figure 3. Longshore drift moves mate-rial along the beach in a zigzag pattern that follows the direction of the prevailing wind. Longshore drift moves sand along the beach and creates spits and bars. If the prevailing wind changes direc-tion, then so does the direction of longshore drift.
actIvItIEs
REMEMBER1 Where does the material come from that builds beaches?2 Either scan and enlarge a copy of figure 4 or draw a sketch
of it, then label or annotate it to identify the depositional landform features of this coastal landscape.
EXPLaIN3 The formation of sand dunes cannot happen unless there is
plenty of sand in the swash to allow them to grow. Use the information in figure 2 to provide the evidence for you to agree or disagree with this statement.
4 How is weather involved in the formation of sand dune environments?
DIscOvER5 Use your atlas plus the internet to locate and name places
in Australia that have the following coastal landforms: a spit, a beach with dunes, a bay, a headland (point, cape or
promontory) and an estuary. Find four examples of each landform and mark them on a map. You could create a Google map of your results, with links to images of each feature.
tHINK6 a In which direction is sand moving on the beach in figure 3? b How will this beach change if the longshore drift
continues in this direction? c Redraw this diagram to show how the movement of sand
along this beach would change this environment if the prevailing wind changed to come from the south-west.
7 Referring to figure 2, sketch a new diagram to show what you think would happen to these sand dunes if a fire destroyed the vegetation on the foredune.
8 Describe how coastal landforms are the result of interconnections between the sea and the atmosphere.
FIGURE 3 The process of longshore drift.
Wave direction
Wave direction
Sea
Longshore drift
Beach
Movement of waveonto beach (swash)
Backwash
Direction beachmaterial is moved
KEY
0 500 m250
casE stUDy
the Murray mouth, south australiaThe Murray River is Australia’s most important river and the world’s sixteenth longest river. When water for home use and irrigation in the Murray–Darling Basin is not balanced by rainfall, the amount of water that reaches the river mouth decreases. This means that the deposition of longshore drift is stronger than the trickle of water reaching the mouth. In 2009, $24 million was allocated by the Federal government to dredge the mouth of the river in an effort to keep it open.
FIGURE 4 The depositional landforms of the coastal landscape at Tutukaka in Northland, New Zealand
46 Jacaranda Geography Alive 8 for the Victorian Curriculum
3.5 How are coasts changed?3.5.1 Who uses the coast?Coasts are very popular places for people to live near and visit. The first Europeans to Australia arrived by sea, and the first areas inhabited by the Europeans were within coastal landscapes. However, the increasing popularity of coastal environments can result in crowding, pollution, a loss of habitat, and the building of permanent structures in zones that should be allowed to undergo the natural changes of a coastal landscape.
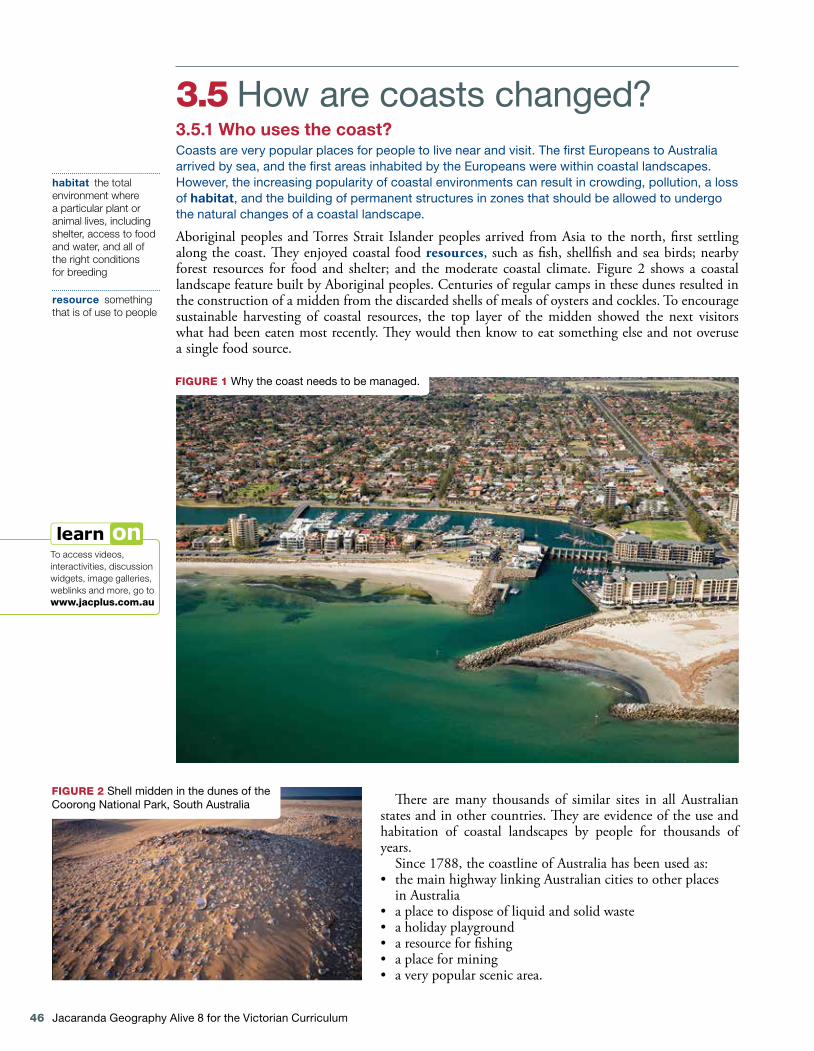
Aboriginal peoples and Torres Strait Islander peoples arrived from Asia to the north, first settling along the coast. They enjoyed coastal food resources, such as fish, shellfish and sea birds; nearby forest resources for food and shelter; and the moderate coastal climate. Figure 2 shows a coastal landscape feature built by Aboriginal peoples. Centuries of regular camps in these dunes resulted in the construction of a midden from the discarded shells of meals of oysters and cockles. To encourage sustainable harvesting of coastal resources, the top layer of the midden showed the next visitors what had been eaten most recently. They would then know to eat something else and not overuse a single food source.
FIGURE 1 Why the coast needs to be managed.
habitat the total environment where a particular plant or animal lives, including shelter, access to food and water, and all of the right conditions for breeding
resource something that is of use to people
There are many thousands of similar sites in all Australian states and in other countries. They are evidence of the use and habitation of coastal landscapes by people for thousands of years.
Since 1788, the coastline of Australia has been used as:• the main highway linking Australian cities to other places
in Australia• a place to dispose of liquid and solid waste• a holiday playground• a resource for fishing• a place for mining• a very popular scenic area.
FIGURE 2 Shell midden in the dunes of the Coorong National Park, South Australia
To access videos, interactivities, discussion widgets, image galleries, weblinks and more, go to www.jacplus.com.au

Topic 3 Landscapes formed by water 47
casE stUDy
cape WoolamaiCape Woolamai, Phillip Island is a well-known surf beach location in south-eastern Victoria. The Cape is pounded by the westerly swells off Bass Strait on its southern coast, and the Eastern Passage, entrance to Western Port Bay, protects its northern coast. Cape Woolamai was created when a build-up of sand joined the coast to a small granite outcrop with a tombolo or narrow sandy isthmus. This sandy environment was stabilised by many centuries of vegetation growth. Tourists, surfers and beach goers have used this place for many years and their use has affected the landscape quality. Walking and
driving on the dune vegetation has resulted in vegetation destruction and a number of blowouts along the dunes. The surf beach access tracks have eroded, with sand being blown inland and depleting the beach of sand. On the more protected northern side, sand surfing has destroyed vegetation. As can be seen in figure 3, a large section of dune vegetation has gone. People on surfboards skimming down the dune have caused this vegetation loss. The popularity of this place has seen the addition of an access road, large car park, boardwalks and protective fencing in an attempt to manage landscape degradation.
FIGURE 3 Human landscape degradation caused by sand surfing at Cape Woolamai Beach, Phillip Island.
3.5.2 Why does a coast need to be managed?The popularity of a coastal location, and the many competing ways people use it, means that it must be looked after to protect it from damage caused by overuse (see figure 1).
Coastal landscapes can also be changed by wave action from strong winds. The roads and buildings located on both rocky and sandy coasts are vulnerable to damage from attack by destructive waves.
However, it is possible to manage or protect the natural and built features of coastal landscapes from the physical processes that strive to alter them.
actIvItIEs
REMEMBER1 Why is it important for people to manage their
use of the coastal landscape?2 List as many examples of coastal use
and management as you can identify in figure 1.
EXPLaIN3 How did Aboriginal people protect the features
of the landscape along the coast?4 Why does the material that a coastal landscape
is made from affect the ability of water to shape it? Compare a cliffed coast like the Twelve Apostles to a surf beach with dunes. Refer to subtopics 3.2 and 3.4.
5 Carefully look at figure 3 and identify the evidence of human impact on this place.
6 How would the landscape management strategies of building a road, car park, boardwalks and protective fences reduce future landscape degradation of the dunes at Cape Woolamai?
tHINK7 Describe the interconnection between sand
surfing and vegetation loss on the Cape Woolamai dunes.
8 Write a paragraph to explain how attempts to reduce or manage coastal landscape destruction could reduce the recreational experience of visitors.
48 Jacaranda Geography Alive 8 for the Victorian Curriculum
3.6 What differences exist in coastal landforms between places?3.6.1 How do coastal landforms differ?Although coastal landforms can be similar in different parts of the world, they can also be very different. Some differences are climatic and some are geomorphic. Coastal landscapes are created by the interconnections between the sculpting power of the oceans, coastal topography and the material that is available to sculpt.
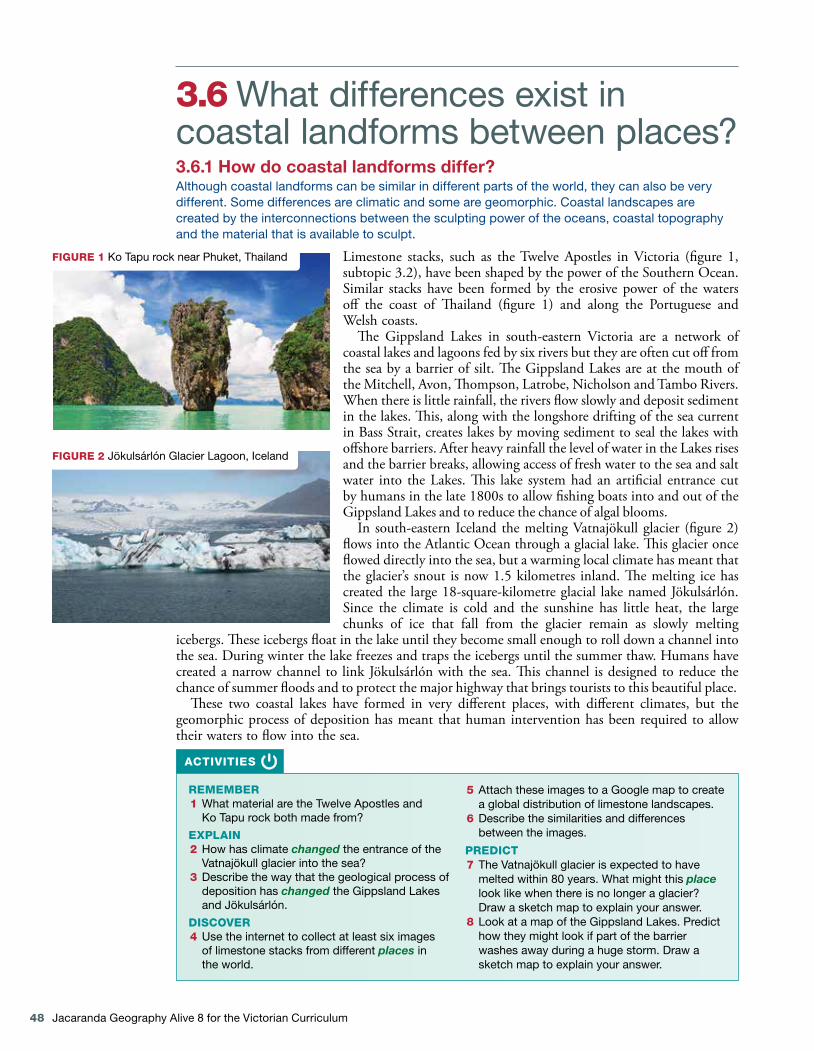
Limestone stacks, such as the Twelve Apostles in Victoria (figure 1, subtopic 3.2), have been shaped by the power of the Southern Ocean. Similar stacks have been formed by the erosive power of the waters off the coast of Thailand (figure 1) and along the Portuguese and Welsh coasts.
The Gippsland Lakes in south-eastern Victoria are a network of coastal lakes and lagoons fed by six rivers but they are often cut off from the sea by a barrier of silt. The Gippsland Lakes are at the mouth of the Mitchell, Avon, Thompson, Latrobe, Nicholson and Tambo Rivers. When there is little rainfall, the rivers flow slowly and deposit sediment in the lakes. This, along with the longshore drifting of the sea current in Bass Strait, creates lakes by moving sediment to seal the lakes with offshore barriers. After heavy rainfall the level of water in the Lakes rises and the barrier breaks, allowing access of fresh water to the sea and salt water into the Lakes. This lake system had an artificial entrance cut by humans in the late 1800s to allow fishing boats into and out of the Gippsland Lakes and to reduce the chance of algal blooms.
In south-eastern Iceland the melting Vatnajökull glacier (figure 2) flows into the Atlantic Ocean through a glacial lake. This glacier once flowed directly into the sea, but a warming local climate has meant that the glacier’s snout is now 1.5 kilometres inland. The melting ice has created the large 18-square-kilometre glacial lake named Jökulsárlón. Since the climate is cold and the sunshine has little heat, the large chunks of ice that fall from the glacier remain as slowly melting
icebergs. These icebergs float in the lake until they become small enough to roll down a channel into the sea. During winter the lake freezes and traps the icebergs until the summer thaw. Humans have created a narrow channel to link Jökulsárlón with the sea. This channel is designed to reduce the chance of summer floods and to protect the major highway that brings tourists to this beautiful place.
These two coastal lakes have formed in very different places, with different climates, but the geomorphic process of deposition has meant that human intervention has been required to allow their waters to flow into the sea.
FIGURE 1 Ko Tapu rock near Phuket, Thailand
FIGURE 2 Jökulsárlón Glacier Lagoon, Iceland
actIvItIEs
REMEMBER1 What material are the Twelve Apostles and
Ko Tapu rock both made from?
EXPLaIN2 How has climate changed the entrance of the
Vatnajökull glacier into the sea?3 Describe the way that the geological process of
deposition has changed the Gippsland Lakes and Jökulsárlón.
DIscOvER4 Use the internet to collect at least six images
of limestone stacks from different places in the world.
5 Attach these images to a Google map to create a global distribution of limestone landscapes.
6 Describe the similarities and differences between the images.
PREDIct7 The Vatnajökull glacier is expected to have
melted within 80 years. What might this place look like when there is no longer a glacier? Draw a sketch map to explain your answer.
8 Look at a map of the Gippsland Lakes. Predict how they might look if part of the barrier washes away during a huge storm. Draw a sketch map to explain your answer.
Topic 3 Landscapes formed by water 49
Rock wall
Groyne
Sea wall
Breakwater
3.7 How are coasts managed?3.7.1 How can a coast be managed?It is possible to reduce or slow the change to coastal landscapes if we understand the physical processes and human activities that cause it. While it is not possible to change the speed and direction of the wind or the number of months each year when destructive waves reach a shoreline, it is possible to redistribute or trap the sand shifted by storm waves or longshore drift. It is also possible to protect coastal houses and roads using barriers to reduce the direct impact of waves.
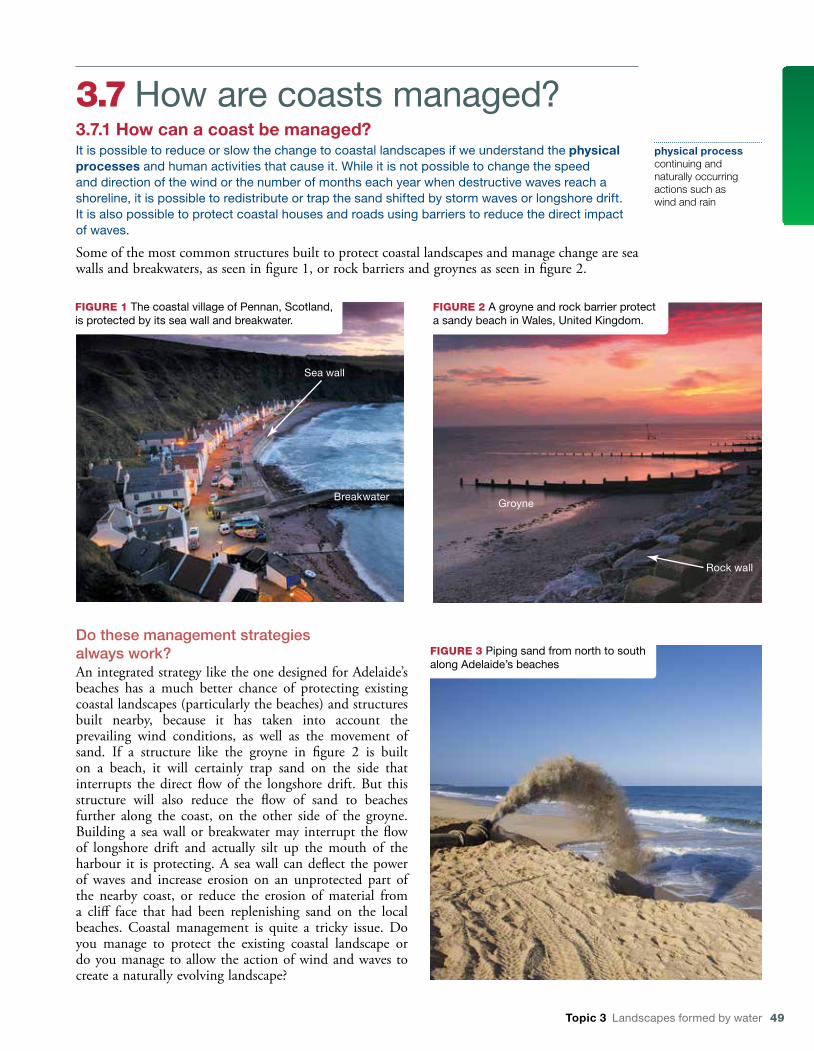
Some of the most common structures built to protect coastal landscapes and manage change are sea walls and breakwaters, as seen in figure 1, or rock barriers and groynes as seen in figure 2.
physical process continuing and naturally occurring actions such as wind and rain
FIGURE 1 The coastal village of Pennan, Scotland, is protected by its sea wall and breakwater.
FIGURE 2 A groyne and rock barrier protect a sandy beach in Wales, United Kingdom.
Do these management strategies always work?An integrated strategy like the one designed for Adelaide’s beaches has a much better chance of protecting existing coastal landscapes (particularly the beaches) and structures built nearby, because it has taken into account the prevailing wind conditions, as well as the movement of sand. If a structure like the groyne in figure 2 is built on a beach, it will certainly trap sand on the side that interrupts the direct flow of the longshore drift. But this structure will also reduce the flow of sand to beaches further along the coast, on the other side of the groyne. Building a sea wall or breakwater may interrupt the flow of longshore drift and actually silt up the mouth of the harbour it is protecting. A sea wall can deflect the power of waves and increase erosion on an unprotected part of the nearby coast, or reduce the erosion of material from a cliff face that had been replenishing sand on the local beaches. Coastal management is quite a tricky issue. Do you manage to protect the existing coastal landscape or do you manage to allow the action of wind and waves to create a naturally evolving landscape?
FIGURE 3 Piping sand from north to south along Adelaide’s beaches
50 Jacaranda Geography Alive 8 for the Victorian Curriculum
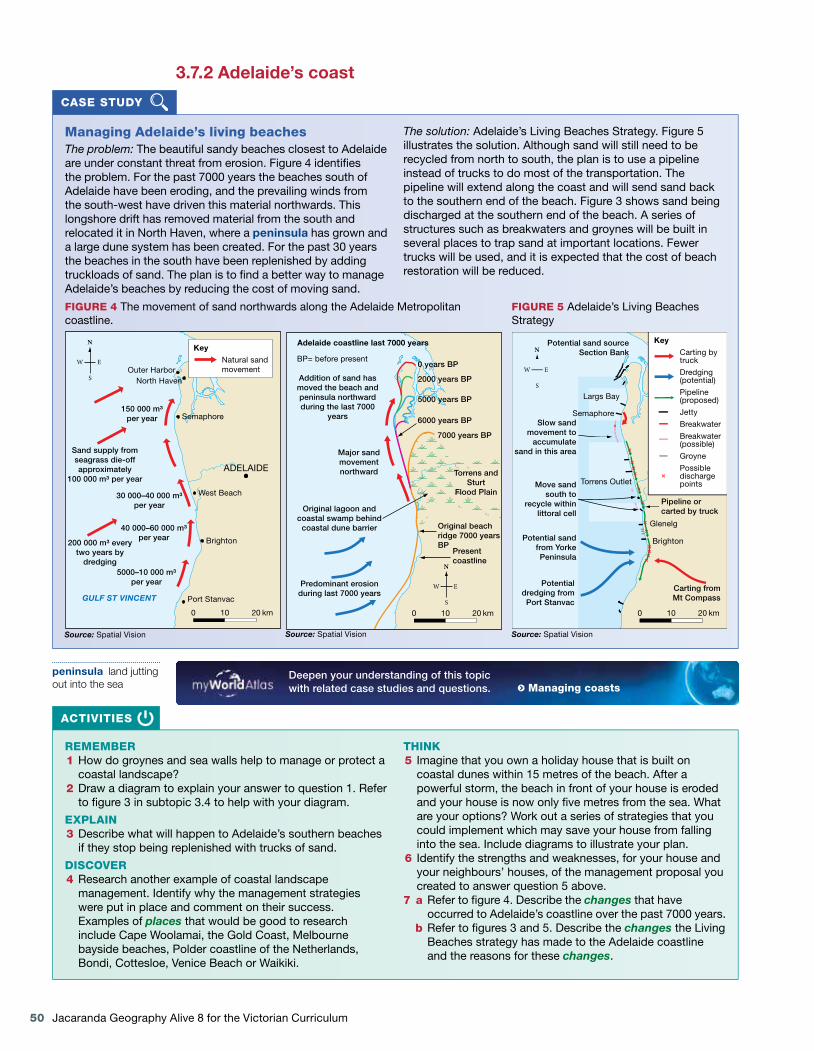
Managing adelaide’s living beaches The problem: The beautiful sandy beaches closest to Adelaide are under constant threat from erosion. Figure 4 identifi es the problem. For the past 7000 years the beaches south of Adelaide have been eroding, and the prevailing winds from the south-west have driven this material northwards. This longshore drift has removed material from the south and relocated it in North Haven, where a peninsula has grown and a large dune system has been created. For the past 30 years the beaches in the south have been replenished by adding truckloads of sand. The plan is to fi nd a better way to manage Adelaide’s beaches by reducing the cost of moving sand.
The solution: Adelaide’s Living Beaches Strategy. Figure 5 illustrates the solution. Although sand will still need to be recycled from north to south, the plan is to use a pipeline instead of trucks to do most of the transportation. The pipeline will extend along the coast and will send sand back to the southern end of the beach. Figure 3 shows sand being discharged at the southern end of the beach. A series of structures such as breakwaters and groynes will be built in several places to trap sand at important locations. Fewer trucks will be used, and it is expected that the cost of beach restoration will be reduced.
3.7.2 Adelaide’s coast
casE stUDy
actIvItIEs
REMEMBER 1 How do groynes and sea walls help to manage or protect a
coastal landscape? 2 Draw a diagram to explain your answer to question 1. Refer
to fi gure 3 in subtopic 3.4 to help with your diagram.
EXPLaIN 3 Describe what will happen to Adelaide’s southern beaches
if they stop being replenished with trucks of sand.
DIscOvER 4 Research another example of coastal landscape
management. Identify why the management strategies were put in place and comment on their success. Examples of places that would be good to research include Cape Woolamai, the Gold Coast, Melbourne bayside beaches, Polder coastline of the Netherlands, Bondi, Cottesloe, Venice Beach or Waikiki.
tHINK 5 Imagine that you own a holiday house that is built on
coastal dunes within 15 metres of the beach. After a powerful storm, the beach in front of your house is eroded and your house is now only fi ve metres from the sea. What are your options? Work out a series of strategies that you could implement which may save your house from falling into the sea. Include diagrams to illustrate your plan.
6 Identify the strengths and weaknesses, for your house and your neighbours’ houses, of the management proposal you created to answer question 5 above.
7 a Refer to fi gure 4. Describe the changes that have occurred to Adelaide’s coastline over the past 7000 years.
b Refer to fi gures 3 and 5. Describe the changes the Living Beaches strategy has made to the Adelaide coastline and the reasons for these changes .
Deepen your understanding of this topic with related case studies and questions. Managing coasts
peninsula land jutting out into the sea
FIGURE 5 Adelaide’s Living Beaches Strategy
FIGURE 4 The movement of sand northwards along the Adelaide Metropolitan coastline.
West Beach
Port Stanvac
ADELAIDE
North HavenOuter Harbor
Brighton
Semaphore
GULF ST VINCENT
5000–10 000 m³per year
40 000–60 000 m³per year
30 000–40 000 m³per year
150 000 m³per year
Sand supply fromseagrass die-offapproximately
100 000 m³ per year
200 000 m³ everytwo years by
dredging
Key
Natural sandmovement
0 10 km20
Source: Spatial Vision
Major sandmovementnorthward
Predominant erosionduring last 7000 years
Addition of sand hasmoved the beach andpeninsula northwardduring the last 7000
years
Adelaide coastline last 7000 years
0 years BP
2000 years BP
5000 years BP
6000 years BP
7000 years BP
Presentcoastline
Torrens andSturt
Flood Plain
Original beachridge 7000 yearsBP
Original lagoon andcoastal swamp behind
coastal dune barrier
BP= before present
0 10 km20
Source: Spatial Vision
Carting fromMt Compass
Brighton
Glenelg
Semaphore
Largs Bay
Torrens OutletMove sandsouth to
recycle withinlittoral cell
Potential sand sourceSection Bank
Potential sandfrom YorkePeninsula
Potentialdredging fromPort Stanvac
Slow sandmovement to
accumulatesand in this area
Pipeline orcarted by truck
Key
Carting bytruck
Dredging(potential)
Pipeline(proposed)
Jetty
Breakwater
Breakwater(possible)
Groyne
Possibledischargepoints
0 10 km20
Source: Spatial Vision
Carting fromMt Compass

Topic 3 Landscapes formed by water 51
3.8 How do I undertake coastal fieldwork?3.8.1 Your fieldwork taskThe best way to understand the physical processes and human activities that affect a specific coastal landscape is to visit it. A fieldwork activity will allow you to put the knowledge you have gained in the classroom into practice. Your fieldwork will also allow you to enjoy the coastal landscape in magnificent 3D.
Any coastal landscape would be suitable to investigate. Once a fieldwork site has been identified, there is quite a lot of planning that you should do before you get there.
What is your fieldwork task?Your task is to identify the landforms and dynamic nature of a coastal landscape and to recognise and assess the influence of people on it.
In class1. Prepare a base map of the fieldwork site or sites. On this base map, mark in the location of
the coastal landscape’s natural features (such as beach, rock, dunes, water, vegetation) and human features (such as seawall, groyne, steps, lawn, shelter, jetty). Using Google Maps or a topographic map is an excellent way of identifying the specific details of the coastal landscape.
2. Looking at the aerial shot on Google Maps will also allow you to see the pattern of the waves as they move to the shore. Does it look as if longshore drift is occurring on the day this image was taken?
On your field tripWhat do you need to do at the coast to collect your information?
It is good to work in groups to collect your data in the field. It is then possible for some students to take measurements and some to record. Sharing tasks means that there will be others with whom to discuss what you have recorded. On returning to class you can pool your observations.
human features structures built by people
Is longshore drift occurring? You canthrow a tennis ball, attached to
string, into the water and watch thepath it takes as it moves in and out.
Show the pattern on your map.
Are there areas where sand hasbeen built up? Measure thewidth of the sand at several
locations. Locate on your map.
Who uses the beach? Findevidence (e.g. signs, tracks
and litter).
Have structures worked toprotect the coast? Sketches orphotos can provide evidence.
Is there evidence ofconstructive wave action?Photograph or sketch this,locating and labelling it on
your map.Has depositionbeen in�uenced byhuman features?
What type of materialis the beach made of?
Features of a coastallandscape
Once at your �eldwork site,add the extra natural and humanfeatures you can now identify to
your base map.
Is there evidence of destructive waveaction? Are there landforms that are
a result of ongoing erosion?Photograph or sketch this, locating
and labelling it on your map.Does the backwash appear tobe stronger than the swash?
Is there evidence of materialthat has been eroded from
somewhere else?
Note the conditions on the day:wave height, wave frequency,
wind and temperature.
Note the change in the height ofthe tide between the time you
arrive and when you leave.
FIGURE 1 The information you need to collect at your fieldwork location
To access videos, interactivities, discussion widgets, image galleries, weblinks and more, go to www.jacplus.com.au

52 Jacaranda Geography Alive 8 for the Victorian Curriculum
You will need recording sheets, pencils, a digital or phone camera, tape measure, compass and maybe a clinometer. You could also collect information using data logging equipment, a GPS locator, weather recording equipment and notepads. Your group should decide what equipment is the most practical and relevant for collecting the data you need.
You may not be able to return to your fieldwork site, which means your data needs to be very detailed.• Alwaysrecordthelocationof
the information on your map.• Takephotosofthecoastal
landscape, including the landforms and human structures.
• Measuredistancesandheights.
• Drawfield sketches to remind you of details. Even when you have photographed something, a field sketch allows you to annotate the diagram so that you can remember important characteristics about how it was formed or the direction of longshore drift. Do not worry if you are not a gifted artist, as there are apps that allow you to convert your photos to sketches when you get back to class.
Back in classNow that you have collected your information in the field, you need to present your find-ings about the coastal landscape you visited.
There are many ways that you could present this infor-mation. Your fieldwork report could be presented as a poster, website, PowerPoint presen-tation, booklet, blog, movie, news report or podcast. Con-sider using Google Maps and uploading images of the sites you visited. You will need to present the data you collected and describe your findings.
field sketch a diagram with geographical features labelled or annotated
FIGURE 3 Field sketch
Source: Alex Rossimel.
FIGURE 4 Students on a fieldwork trip, measuring the slope of a sandy beach.
FIGURE 2 Investigating the rocky shores of a coastal landscape

Topic 3 Landscapes formed by water 53
3.9 SkillBuilder: Constructing a field sketch What are fi eld sketches? Field sketches are drawings completed during fi eldwork — geography outside the classroom. Field sketches allow a geographer to capture the main aspects of landscapes in order to edit the view, focusing on the important features and omitting the unnecessary information. FIGURE 1 Field sketch of Cape Schanck
Source : © Geography Teachers’ Association of Victoria Inc. Interaction , journal of the GTAV, June 1998. Illustration redrawn by Harry Slaghekke.
Rips
FIGURE 1 Rips at Bondi Beach, Sydney. Rips are often easier to identify from a height.
undertow the powerful fl ow of water in the waves as it returns to the sea
rip current a strong localised current that channels a fast-fl owing stream of water offshore
3.10 What’s in a rip? 3.10.1 What is a rip current? The movement of water within the coastal landscape can be hazardous to people as well as to coastal landforms.
If you have ever walked along a surf beach, you know about the uneven power of waves as the water returns to the ocean. Th is backwash can either be a gentle, non-threatening fl ow or it may be so powerful that it can be diffi cult for you to remain standing. Th e powerful fl ow of water returning to the sea is called undertow . If the seabed adjacent to the beach has an even slope, then the undertow is relatively harmless. Water returns to the sea and washes ashore in the next wave. Undertow can also take material from the beach and deposit it in the wave zone. If the seabed adjacent to the beach has an uneven topography, or shape, the undertow will be more threatening.
Where the fl ow of an undertow is concentrated, as occurs in a gap between off shore sandbars, or in a deeper seabed channel, this may result in the formation of a rip current . A rip current, or rip, is a strong current that runs off shore from the beach. If you are caught in a rip, it feels as if you are in a fast-moving river channel being whisked out to sea. Th e fast-moving water erodes a deep channel in the sea bed.
Go online to access:
• a clear step-by-step explanation to help you master the skill
• a model of what you are aiming for
• a checklist of key aspects of the skill
• a series of questions to help you apply the skill and to check your understanding.
eLessonWatch this video to learn how to construct a fi eld sketch.eles-1650
InteractivityUse this interactivity to learn how to construct a fi eld sketch.int-3146
54 Jacaranda Geography Alive 8 for the Victorian Curriculum
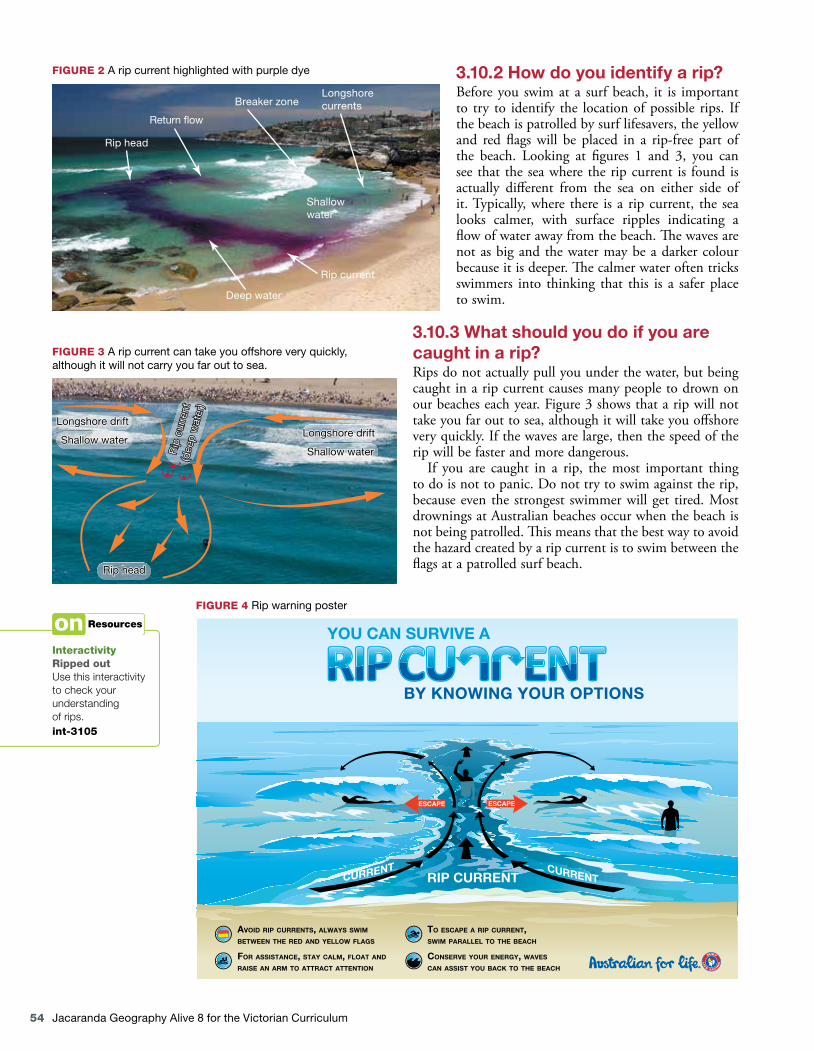
3.10.2 How do you identify a rip? Before you swim at a surf beach, it is important to try to identify the location of possible rips. If the beach is patrolled by surf lifesavers, the yellow and red fl ags will be placed in a rip-free part of the beach. Looking at fi gures 1 and 3, you can see that the sea where the rip current is found is actually diff erent from the sea on either side of it. Typically, where there is a rip current, the sea looks calmer, with surface ripples indicating a fl ow of water away from the beach. Th e waves are not as big and the water may be a darker colour because it is deeper. Th e calmer water often tricks swimmers into thinking that this is a safer place to swim.
3.10.3 What should you do if you are caught in a rip? Rips do not actually pull you under the water, but being caught in a rip current causes many people to drown on our beaches each year. Figure 3 shows that a rip will not take you far out to sea, although it will take you off shore very quickly. If the waves are large, then the speed of the rip will be faster and more dangerous.
If you are caught in a rip, the most important thing to do is not to panic. Do not try to swim against the rip, because even the strongest swimmer will get tired. Most drownings at Australian beaches occur when the beach is not being patrolled. Th is means that the best way to avoid the hazard created by a rip current is to swim between the fl ags at a patrolled surf beach.
FIGURE 2 A rip current highlighted with purple dye
Longshore driftLongshore drift
Shallow waterShallow waterLongshore driftLongshore drift
Shallow waterShallow water
Rip headRip head
Rip
cur
rent
(dee
p w
ater
)
Rip
cur
rent
(dee
p w
ater
)
FIGURE 3 A rip current can take you offshore very quickly, although it will not carry you far out to sea.
AVOID RIP CURRENTS, ALWAYS SWIM
BETWEEN THE RED AND YELLOW FLAGS
FOR ASSISTANCE, STAY CALM, FLOAT AND
RAISE AN ARM TO ATTRACT ATTENTION
TO ESCAPE A RIP CURRENT,SWIM PARALLEL TO THE BEACH
CONSERVE YOUR ENERGY, WAVES
CAN ASSIST YOU BACK TO THE BEACH
CURRENTCURRENTRIP CURRENT
YOU CAN SURVIVE A
BY KNOWING YOUR OPTIONS
ESCAPEESCAPE
FIGURE 4 Rip warning poster
Rip head
Breaker zone
Shallowwater
Rip current
Deep water
Longshorecurrents
Return �ow
InteractivityRipped outUse this interactivity to check your understanding of rips.int-3105

Topic 3 Landscapes formed by water 55
actIvItIEs
REMEMBER1 How is undertow different from a rip current?2 What colour are the flags used by lifesavers to
identify the safe part of a beach for swimming?
EXPLaIN3 Explain why a beach that has large waves
would have more powerful rip currents.4 Using the information illustrated in figure 4,
make a list of five things that you should do to ensure your safety if you are caught in a hazardous rip current.
5 If you are caught in a rip, explain why you should not try to swim towards the shore. Annotate a diagram of a rip to explain your answer.
DIscOvER6 True or false? Rip currents tend to have less
wave activity than surrounding areas.
7 What are the features of a rip current that make them potentially dangerous to swimmers?
8 Download several images of surf beaches from the net and annotate them to identify potential rip currents. Give reasons for the places you marked as rips.
tHINK9 Design a rips awareness campaign to warn
swimmers about the potential hazards caused by rip currents. It may be a campaign for television, radio or newspapers. Select the most effective campaign strategies and, as a class, make it your task to promote rip current awareness within your school.
10 Describe the scale of the rips in figure 1 in relation to the whole Bondi Beach region.
3.11 How does water form river landscapes?3.11.1 Moving waterErosion, transportation and deposition by running water are the main processes that create our landscapes. Some rivers, such as the Gordon River in Tasmania, are perennial; some, such as Coopers Creek in Queensland, are intermittent; others, such as the Colorado River in the United States, have eroded amazing landforms like the Grand Canyon.
Water is always on the move. It evaporates and becomes part of the water cycle; it rains and flows over the surface of the Earth and into streams that make their way to a sea, lake or ocean; and it soaks through the pores of rocks and soil into groundwater.
3.11.2 River systems and featuresA river is a natural feature, and what we see is the result of the interaction of a range of inputs and processes. All parts of the Earth are related to the formation of river landscapes. This includes the lithosphere (rocks and soil), the hydrosphere (water), the biosphere (plants and animals) and the atmosphere (temperature and water cycle). Changes can happen quickly and over a very long period of time. Changes at one location along a river can have an effect at other locations along the river.
Water flows downhill, and the source (the start) of a river will be at a higher altitude than its mouth (the end). As the water moves over the Earth’s surface, it erodes, transports and deposits material.
The volume of water and the speed of flow will influence the amount and type of work carried out by a river. A fast-flowing flooded river will erode enormous amounts of material and transport it downstream. As the speed or volume of the water decreases, much of the material it carries will be deposited.
perennial describes a stream that flows all year
intermittent describes a stream that does not always flow
groundwater water that seeps into soil and gaps in rocks
downstream nearer the mouth of a river, or going in the same direction as the current
Kilometres3000 4000 5000200010000 6000 7000
Nile River (Africa)Amazon River (South America)
Yangtze River (Asia)
Mississippi–Missouri (North America)
Murray–Darling (Australia)
Volga River (Europe)
FIGURE 1 Rivers of the world: the longest river on each continent.
To access videos, interactivities, discussion widgets, image galleries, weblinks and more, go to www.jacplus.com.au
56 Jacaranda Geography Alive 8 for the Victorian Curriculum
River mouth
Watershed
Riverformation
Waterfall
Upper course
Tributary
Lower course
Meanders
Floodplain
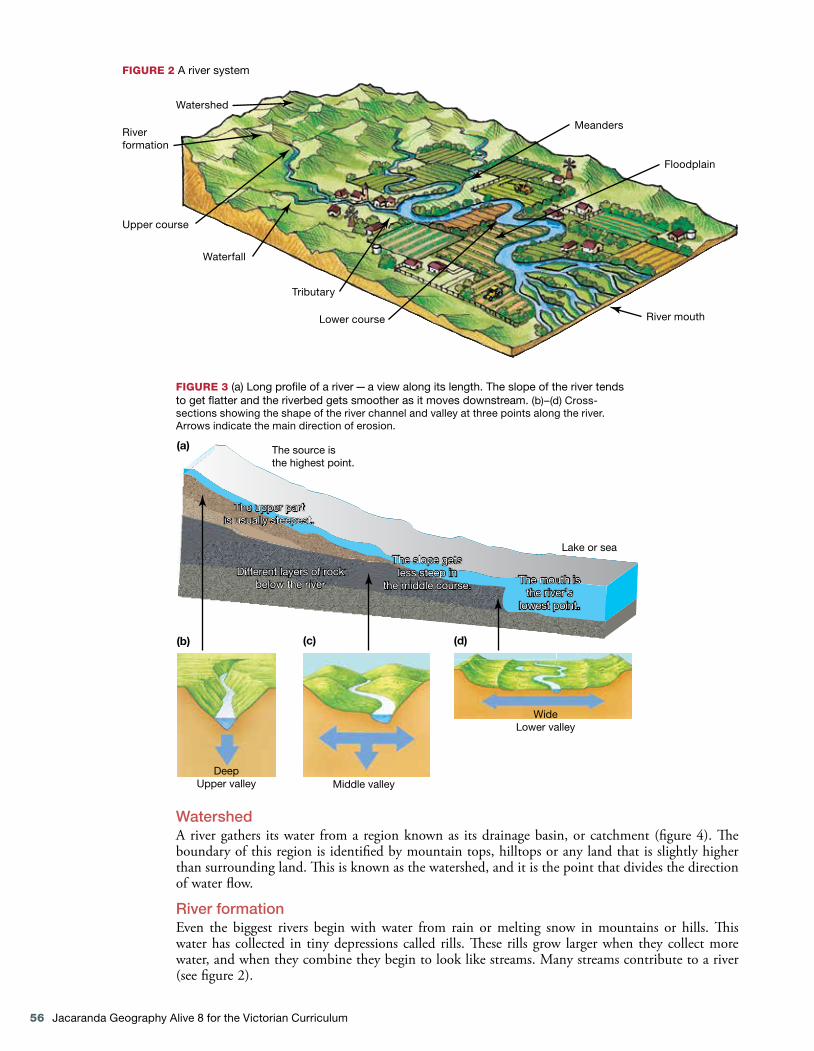
WatershedA river gathers its water from a region known as its drainage basin, or catchment (figure 4). The boundary of this region is identified by mountain tops, hilltops or any land that is slightly higher than surrounding land. This is known as the watershed, and it is the point that divides the direction of water flow.
River formationEven the biggest rivers begin with water from rain or melting snow in mountains or hills. This water has collected in tiny depressions called rills. These rills grow larger when they collect more water, and when they combine they begin to look like streams. Many streams contribute to a river (see figure 2).
FIGURE 2 A river system
Middle valley
The slope getsless steep in
the middle course. The mouth isthe river’s
lowest point.
Lake or sea
The source is the highest point.
DeepUpper valley
WideLower valley
(a)
(b) (c) (d)
Different layers of rockbelow the river
The upper partis usually steepest.
FIGURE 3 (a) Long profile of a river — a view along its length. The slope of the river tends to get flatter and the riverbed gets smoother as it moves downstream. (b)–(d) Cross-sections showing the shape of the river channel and valley at three points along the river. Arrows indicate the main direction of erosion.

Topic 3 Landscapes formed by water 57
One drainage basin can containmany smaller drainage basins.
Watershed
Source: Adapted from an image by RecycleWorks www.RecycleWorks.org
Upper courseWaters in a river channel flow over steeper slopes in the upper reaches. The force of rushing water on a steep slope cuts downwards and creates a V-shaped valley. The river then tends to follow a fairly straight course (see figure 3).
WaterfallWhen a river meets resistant rock, a waterfall can occur (see figure 5). If the river has to cross bands of resistant rock, rapids will form. The turbulent water flow in rapids is called white water. A plunge pool forms at the base of a waterfall when rocks and soil moved by the fast flowing water erode the banks and base of the river.
TributaryA river or stream that adds or contributes water to the main river is known as a tributary (see figure 6). The place where two rivers join is called the confluence.
MeandersOn flatter land, a river is wider than it is in the hills, and water added from tributaries has increased its volume (see figure 3). Much of the erosion is in a sideways direction, and the valley of a river is much wider. Sideways erosion causes meanders (curves) along its course (see figure 7). Over time, a meandering river will change the path it follows, as some bends become more obvious and some disappear. A meander that is cut off is called an oxbow lake.
FloodplainsFlooding over thousands of years creates floodplains. During a flood, the water flows over the banks of the river. Once outside the river, it slows down and deposits the alluvium it was transporting. This alluvium is often very fertile (see figure 2). These regions are highly suitable for farming and settlement (see figure 8).
tributary river or stream that flows into a larger river or body of water
Waterfall retreats.
Hard rock
Overhang
Plunge pool
Soft rock
Hard rockFallen rocks
Ridges of hardrock create anuneven slope.This createsrapids.
Steep-sidedgorge developsas waterfallretreats.
FIGURE 5 A waterfall
FIGURE 4 The watershed and catchment, or drainage basin of a river system.

58 Jacaranda Geography Alive 8 for the Victorian Curriculum
Queensland
New SouthWales
Darlin
g
River
W
arre
go
Riv
er N
ebin
e
C
reek
Par
oo
Riv
er
Condamine
River
Moo
nie
River
Barwon River
Namoi River
Marano
a R
iver
Castlereagh R
iver
Bogan R
iver
Balonne
River
Gwydir
Macq
uarie
River
Macintyre
River
River
Direction of �ow
Watershed
1000 200 km
Source: Spatial Vision
River mouthDeltas are found at the mouths of large rivers, like the Mississippi. A delta is formed when the river deposits its material faster than the sea can remove it. The material is a mix of mud, sand and clay. The river will sometimes split up into smaller streams to find its way through the deposited material. These little streams are called distributaries. We recognise three main shapes of delta: fan shaped, arrow shaped and bird-foot shaped. The shape is influenced by tides, ocean waves and the volume of sediment and river water.
Sometimes a river will have a wide mouth, where fresh water and salt water mix. This is known as an estuary.
FIGURE 6 Tributaries of the Darling River which, in turn, is a tributary of the Murray River.
InteractivityRiver carvingsUse this interactivity to learn how rivers shape our landscapes.int-3104
Soon-to-be oxbowlake with cut-off
Erosion
Oxbow lake
Meander
Deposition
FIGURE 7 The formation of a meander and oxbow lake.
FIGURE 8 Murray River meanders

Topic 3 Landscapes formed by water 59
Deepen your understanding of this topic with related case studies and questions. Fjords
actIvItIEs
REMEMBER 1 Refer to fi gure 1 and compare the scale
of Australia’s longest river with the world’s longest river.
2 Sketch the long profi le shown in fi gure 3 and label the source, the mouth and the direction the river fl ows.
3 What feature, other than water, has to be present for waterfalls and rapids to form? Refer to fi gure 5.
EXPLaIN 4 Explain how rivers are part of the water cycle. 5 Why do people settle and farm on fl oodplains?
DIscOvER 6 Identify a river that fl ows through the capital city
in one state or territory in Australia. Describe its source, any tributaries, and its mouth.
7 After some rain, investigate an area of bare ground on a small slope near school or home. Sketch the pattern that the rills have made. Identify the watershed and catchment for each rill.
8 Using Google Earth or an atlas, fi nd the Nile delta, the Ebro delta and the Mississippi delta. Draw a sketch and write a short description of the shape of each delta, presenting your fi ndings in a table.
PREDIct 9 Refer to fi gure 8. Sketch a diagram to show
the course of the meandering Murray River. Mark in the course that the river used to take. Predict and label where the next oxbow lake might form. Show the possible future course of the river.
10 What do you think will happen to deltas if sea levels rise?
11 Predict the changes that will occur to the waterfall in fi gure 5. Justify your answer.
tHINK 12 Produce a fl owchart or animation to explain
the formation of an oxbow lake, a delta, a waterfall or rapids.
13 Refer to the paragraph about meanders and to fi gures 3 and 7. Sketch a cross-section (like fi gure 3) of a river at a meander. This will show the shape of the riverbank on each side of the river. What are the advantages and disadvantages of living on each side of the river?
14 What changes will occur along a river if there is unusually high rainfall in its upper course? Think in terms of erosion and deposition.
3.12 How are river landscapes managed? 3.12.1 Mississippi River Rivers are vital. Plants and animals depend on their waters for survival. People also rely on rivers for their waters and have diverted rivers for fl ood control, irrigation, power generation, town water supplies, waste disposal and recreation.
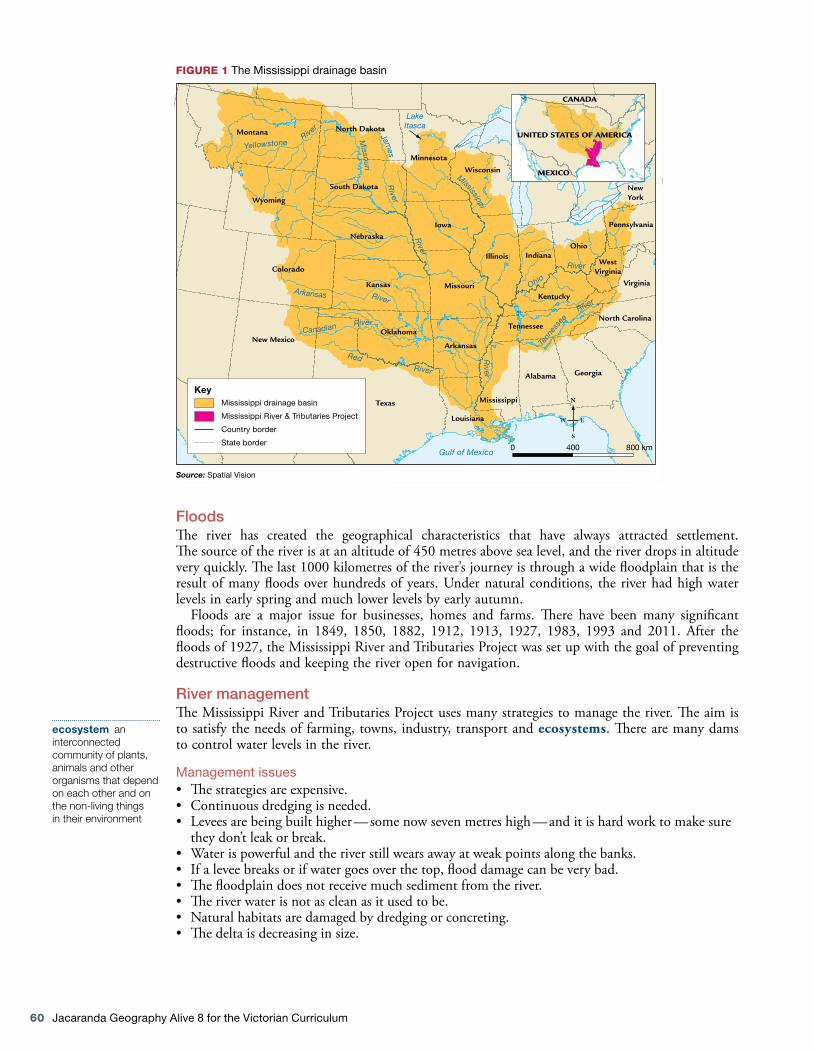
Th e mighty Mississippi River is approximately 3700 kilometres long and is the second longest in the United States. It fl ows through 10 states (see fi gure 1). Th e drainage basin, or catchment, for the river covers 40 per cent of the country, and includes all or part of 31 states and two Canadian provinces. Th e drainage system is made up of thousands of rivers and streams, including the Missouri.
Importance of the river Th e Mississippi has been a major contributor to the economic growth of the United States. • It is important for transporting goods, such as fuel, coal, gravel, chemicals, steel, cement and
farm produce. Th e barges on the river are able to connect to ocean shipping at Baton Rouge in Louisiana.
• It supplies water for cities and industries and irrigation for farming. • Much of its fl oodplain has been cleared for farmland. • Th e river basin also supports natural biodiversity. It has many species of mussels, 25 per cent
of all fi sh species in North America, and over 300 species of birds that use the river during migration and breeding.
barge a long fl at-bottomed boat used for transporting goods
To access videos, interactivities, discussion widgets, image galleries, weblinks and more, go to www.jacplus.com.au
60 Jacaranda Geography Alive 8 for the Victorian Curriculum
Mississippi
Oklahoma
Montana
New Mexico
Georgia
Missouri
Ohio
Virginia
Texas
Kansas
Tennessee
Arkansas
Illinois
North Carolina
Louisiana
Iowa
Minnesota
Indiana
Colorado
Kentucky
WestVirginia
North Dakota
Alabama
Nebraska
Wyoming
South Dakota
Pennsylvania
Wisconsin
NewYork
Gulf of Mexico
RedRiver
Canadian River
James
River
Arkansas River
YellowstoneRive
r
Ohio
River
Tenn
esse
eRiver
MississippiR
iver
Missouri
River
LakeItasca
KeyMississippi drainage basin
Mississippi River & Tributaries Project
Country border
State border0 400 800 km
CANADA
UNITED STATES OF AMERICA
MEXICO
Source: Spatial Vision
FIGURE 1 The Mississippi drainage basin
FloodsThe river has created the geographical characteristics that have always attracted settlement. The source of the river is at an altitude of 450 metres above sea level, and the river drops in altitude very quickly. The last 1000 kilometres of the river’s journey is through a wide floodplain that is the result of many floods over hundreds of years. Under natural conditions, the river had high water levels in early spring and much lower levels by early autumn.
Floods are a major issue for businesses, homes and farms. There have been many significant floods; for instance, in 1849, 1850, 1882, 1912, 1913, 1927, 1983, 1993 and 2011. After the floods of 1927, the Mississippi River and Tributaries Project was set up with the goal of preventing destructive floods and keeping the river open for navigation.
River managementThe Mississippi River and Tributaries Project uses many strategies to manage the river. The aim is to satisfy the needs of farming, towns, industry, transport and ecosystems. There are many dams to control water levels in the river.
Management issues• The strategies are expensive.• Continuous dredging is needed.• Levees are being built higher — some now seven metres high — and it is hard work to make sure
they don’t leak or break.• Water is powerful and the river still wears away at weak points along the banks.• If a levee breaks or if water goes over the top, flood damage can be very bad.• The floodplain does not receive much sediment from the river.• The river water is not as clean as it used to be.• Natural habitats are damaged by dredging or concreting.• The delta is decreasing in size.
ecosystem an interconnected community of plants, animals and other organisms that depend on each other and on the non-living things in their environment
Topic 3 Landscapes formed by water 61
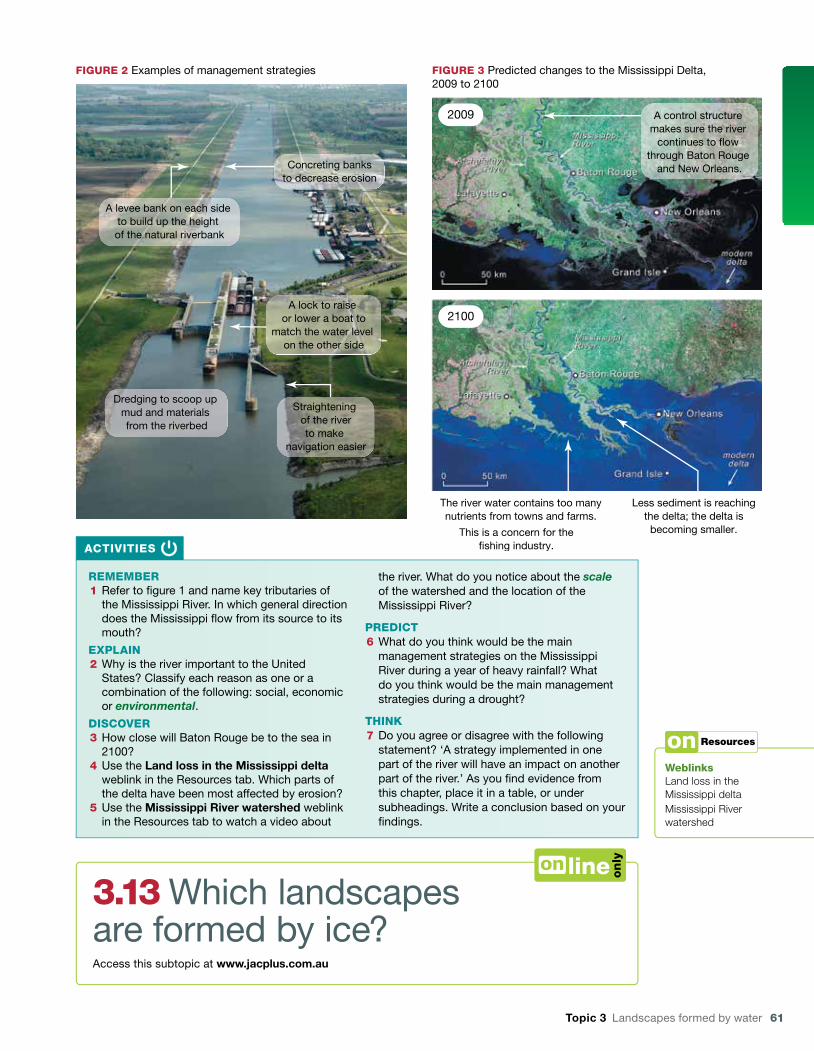
A levee bank on each side to build up the height of the natural riverbank
Dredging to scoop up mud and materials from the riverbed
A lock to raise or lower a boat to
match the water level on the other side
Straightening of the riverto make
navigation easier
Concreting banksto decrease erosion
FIGURE 2 Examples of management strategies
A control structure makes sure the river
continues to �ow through Baton Rouge
and New Orleans.
Less sediment is reachingthe delta; the delta is
becoming smaller.This is a concern for the�shing industry.
The river water contains too manynutrients from towns and farms.
2009
2100
FIGURE 3 Predicted changes to the Mississippi Delta, 2009 to 2100
actIvItIEs
REMEMBER 1 Refer to fi gure 1 and name key tributaries of
the Mississippi River. In which general direction does the Mississippi fl ow from its source to its mouth?
EXPLaIN 2 Why is the river important to the United
States? Classify each reason as one or a combination of the following: social, economic or environmental .
DIscOvER 3 How close will Baton Rouge be to the sea in
2100? 4 Use the Land loss in the Mississippi delta
weblink in the Resources tab. Which parts of the delta have been most affected by erosion?
5 Use the Mississippi River watershed weblink in the Resources tab to watch a video about
the river. What do you notice about the scale of the watershed and the location of the Mississippi River?
PREDIct 6 What do you think would be the main
management strategies on the Mississippi River during a year of heavy rainfall? What do you think would be the main management strategies during a drought?
tHINK 7 Do you agree or disagree with the following
statement? ‘A strategy implemented in one part of the river will have an impact on another part of the river.’ As you fi nd evidence from this chapter, place it in a table, or under subheadings. Write a conclusion based on your fi ndings.
Weblinks Land loss in the Mississippi delta Mississippi River watershed
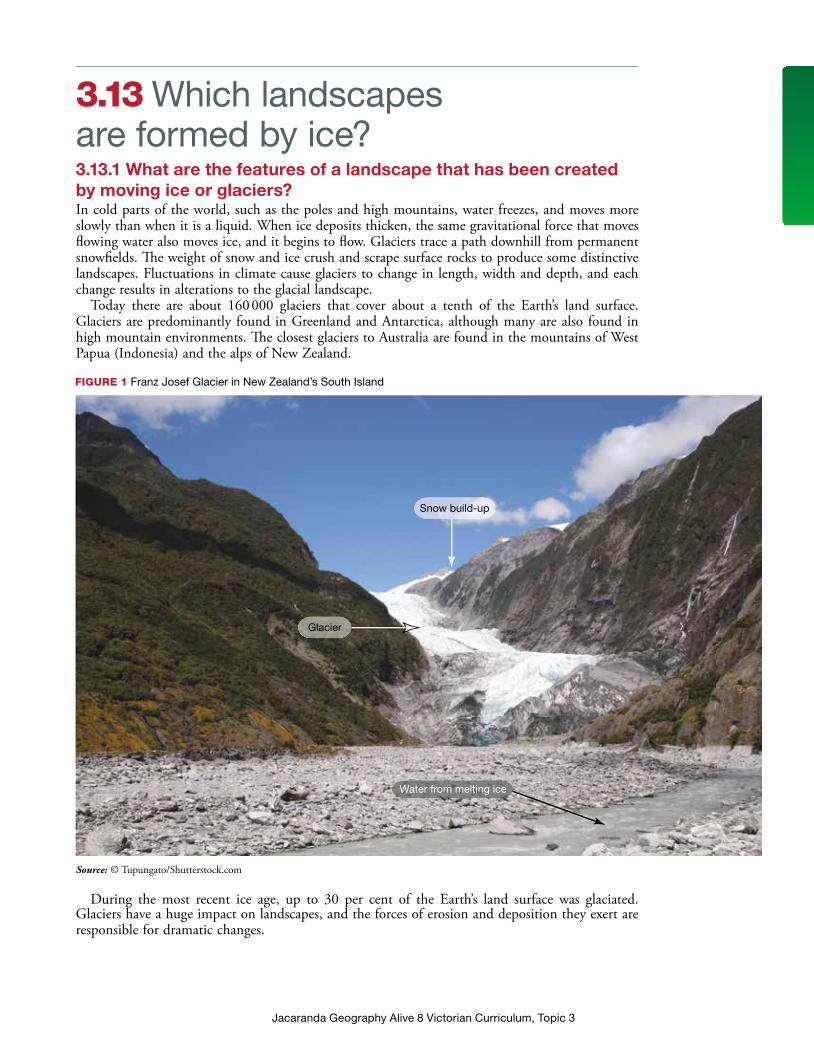
3.13 Which landscapes are formed by ice? Access this subtopic at www.jacplus.com.au
62 Jacaranda Geography Alive 8 for the Victorian Curriculum
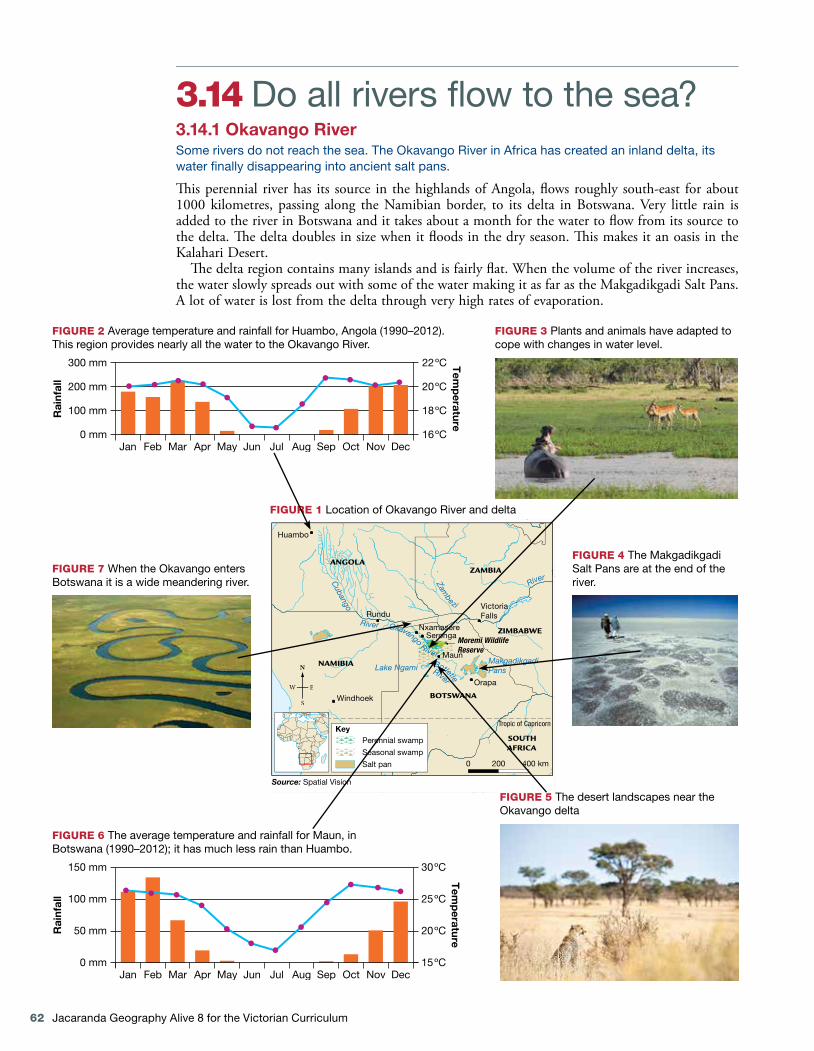
3.14 Do all rivers flow to the sea? 3.14.1 Okavango River Some rivers do not reach the sea. The Okavango River in Africa has created an inland delta, its water fi nally disappearing into ancient salt pans.
Th is perennial river has its source in the highlands of Angola, fl ows roughly south-east for about 1000 kilometres, passing along the Namibian border, to its delta in Botswana. Very little rain is added to the river in Botswana and it takes about a month for the water to fl ow from its source to the delta. Th e delta doubles in size when it fl oods in the dry season. Th is makes it an oasis in the Kalahari Desert.
Th e delta region contains many islands and is fairly fl at. When the volume of the river increases, the water slowly spreads out with some of the water making it as far as the Makgadikgadi Salt Pans. A lot of water is lost from the delta through very high rates of evaporation.
FIGURE 2 Average temperature and rainfall for Huambo, Angola (1990–2012). This region provides nearly all the water to the Okavango River.
Rai
nfal
l
Tem
perature
0 mm
100 mm
200 mm
300 mm
16ºC
18ºC
20ºC
22ºC
NovOctSepAugJulJunMayAprMarFebJan Dec
FIGURE 3 Plants and animals have adapted to cope with changes in water level.
FIGURE 1 Location of Okavango River and delta
FIGURE 7 When the Okavango enters Botswana it is a wide meandering river.
Rai
nfal
l
Tem
perature
0 mm
50 mm
100 mm
150 mm
15ºC
20ºC
25ºC
30ºC
NovOctSepAugJulJunMayAprMarFebJan Dec
FIGURE 6 The average temperature and rainfall for Maun, in Botswana (1990–2012); it has much less rain than Huambo.
FIGURE 5 The desert landscapes near the Okavango delta
FIGURE 4 The Makgadikgadi Salt Pans are at the end of the river.
Huambo
ZAMBIA
ZIMBABWE
SOUTHAFRICA
NAMIBIA
ANGOLA
BOTSWANA
Tropic of Capricorn
RunduVictoriaFalls
SerongaNxamasere
Maun
Windhoek
Orapa
Cubango River Okavango
Botletle
RiverZam
bezi
MakgadikgadiPansLake Ngami
River
River
Moremi WildlifeReserve
KeyPerennial swamp
Seasonal swamp
Salt pan 0 200 km400
Source: Spatial Vision
Topic 3 Landscapes formed by water 63
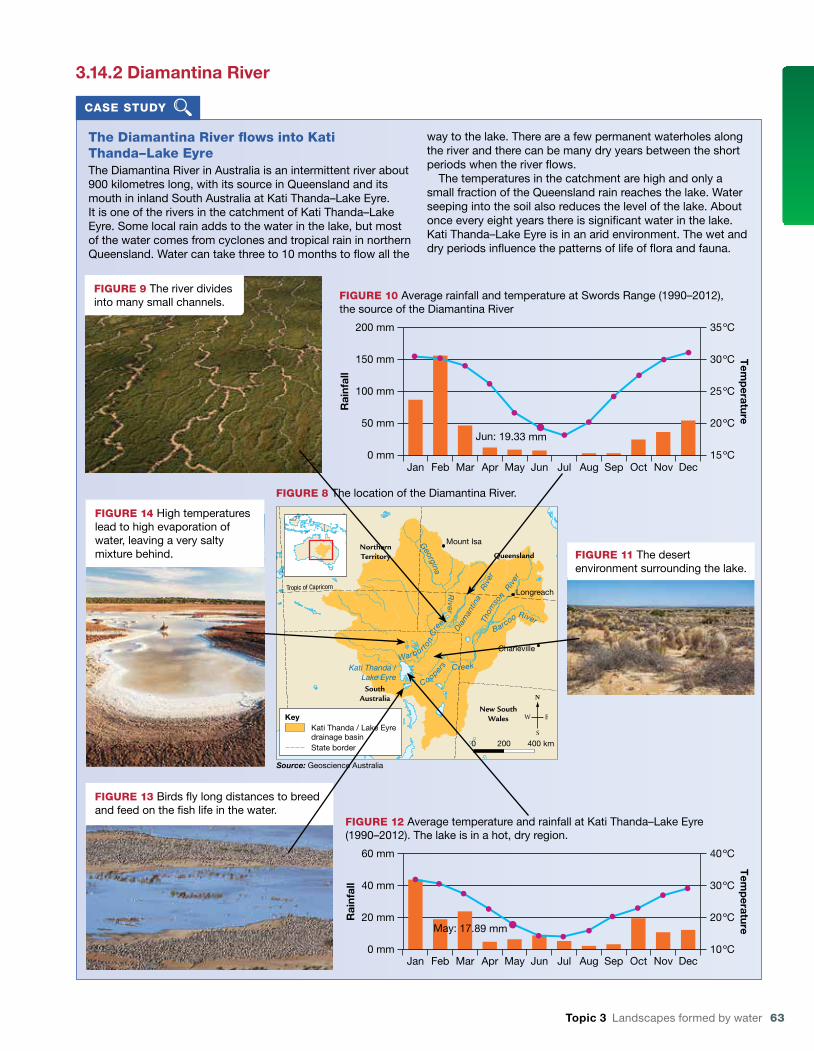
3.14.2 Diamantina River
the Diamantina River flows into Kati thanda–Lake EyreThe Diamantina River in Australia is an intermittent river about 900 kilometres long, with its source in Queensland and its mouth in inland South Australia at Kati Thanda–Lake Eyre. It is one of the rivers in the catchment of Kati Thanda–Lake Eyre. Some local rain adds to the water in the lake, but most of the water comes from cyclones and tropical rain in northern Queensland. Water can take three to 10 months to flow all the
way to the lake. There are a few permanent waterholes along the river and there can be many dry years between the short periods when the river flows. The temperatures in the catchment are high and only a small fraction of the Queensland rain reaches the lake. Water seeping into the soil also reduces the level of the lake. About once every eight years there is significant water in the lake. Kati Thanda–Lake Eyre is in an arid environment. The wet and dry periods influence the patterns of life of flora and fauna.
casE stUDy
Coopers
Barcoo RiverThom
so
n R
iver
Diam
antin
a R
iver
Georgina R
iver
Warburton
Cre
ek
Creek
Mount Isa
Longreach
Charleville
Kati Thanda /Lake Eyre
Tropic of Capricorn
NorthernTerritory
SouthAustralia
New SouthWales
Queensland
KeyKati Thanda / Lake Eyredrainage basinState border
Source: Geoscience Australia
Rai
nfal
l
Tem
perature
0 mm
20 mm
40 mm
60 mm
10ºC
20ºC
30ºC
40ºC
NovOctSepAugJulJunMay
May: 17.89 mm
AprMarFebJan Dec
FIGURE 12 Average temperature and rainfall at Kati Thanda–Lake Eyre (1990–2012). The lake is in a hot, dry region.
Rai
nfal
l
Tem
perature
0 mm
50 mm
100 mm
150 mm
15ºC
20ºC
25ºC
30ºC
200 mm 35ºC
NovOctSepAugJulJunMayAprMarFebJan Dec
Jun: 19.33 mm
FIGURE 10 Average rainfall and temperature at Swords Range (1990–2012), the source of the Diamantina River
FIGURE 8 The location of the Diamantina River.
FIGURE 9 The river divides into many small channels.
FIGURE 14 High temperatures lead to high evaporation of water, leaving a very salty mixture behind.
FIGURE 13 Birds fly long distances to breed and feed on the fish life in the water.
FIGURE 11 The desert environment surrounding the lake.

64 Jacaranda Geography Alive 8 for the Victorian Curriculum
actIvItIEs
REMEMBER1 What is the difference between the average
annual rainfall at the source and the mouth of the Diamantina River?
2 Describe the distribution of rain in a year at Huambo and at Swords Range.
3 Refer to figures 7 and 9 and describe the difference in the shape of the river channel.
EXPLaIN4 Distinguish between a perennial river and an
intermittent river.5 How is it possible that the Okavango delta
floods in the dry season?6 Refer to figures 3 and 13 and compare
the flora and fauna at the mouth of each river.
7 How does high temperature lead to water loss?
DIscOvER8 In which hemisphere are the Okavango and
Diamantina Rivers?9 In which continent is each river?
10 What is a cyclone? Name another place in Australia that is affected by cyclones.
11 Find out about one species that flourishes at Kati Thanda–Lake Eyre when the lake has water. How has this species adapted to the environment? What other species is it relying upon?
PREDIct12 The Okavango is the only permanent source
of water in Namibia. What would happen to the delta environment if Namibia diverted water from the river as it flows along its border? Think about the possible impact on people, on the environment and on the economy.
13 Changes to the climate are likely to make the Kati Thanda–Lake Eyre region hotter and drier. What impact will this have on the environment of the lake and the native species that flourish there?
tHINK14 Compare the Okavango River and the
Diamantina River. Present your findings in a visual manner to show similarities and differences. Consider characteristics such as the location of the river, length of river, rainfall at source, rainfall at mouth, perennial or intermittent nature, environment surrounding mouth, speed of flow, evaporation rate at mouth, water added along course, fauna at mouth, flora at the mouth, shape of the river channel and final end point of the river.
15 The Okavango Delta and Kati Thanda–Lake Eyre are both popular tourist destinations. Provide two reasons why you think people are attracted to these places. Which one has a permanent tourism industry? How is this possible? When would be the best time to visit each location?
3.15 SkillBuilder: Reading contour lines on a mapWhat are contour lines?Contour lines drawn on the map join all places of the same elevation (height) above sea level. Contour maps are used to show the relief (shape) of the land and the heights of the landscape. Maps with contour lines show the relief of the land and help people to identify features.
70
104
6050
4030
20N
0 1 2 km
FIGURE 1 How contour lines show the shape of the land.
Go online to access:
• a clear step-by-step explanation to help you master the skill
• a model of what you are aiming for
• a checklist of key aspects of the skill
• a series of questions to help you apply the skill and to check your understanding.
eLessonWatch this video to learn how to read contour lines on a map.eles-1651
InteractivityUse this interactivity to learn how to read contour lines on a map.int-3147

Topic 3 Landscapes formed by water 65
3.16 Review3.16.1 ReviewThe Review section contains a range of different questions and activities to help you revise and recall what you have learned, especially prior to a topic test.
3.16.2 ReflectThe Reflect section provides you with an opportunity to apply and extend your learning.
Access this subtopic at www.jacplus.com.au
To access videos, interactivities, discussion widgets, image galleries, weblinks and more, go to www.jacplus.com.au
Jacaranda Geography Alive 8 Victorian Curriculum, Topic 3
3.9 SkillBuilder: Constructing a field sketch3.9.1 Tell meWhat are field sketches?Field sketches are drawings completed during fieldwork — geography outside the classroom. Field sketches allow a geographer to capture the main aspects of landscapes in order to edit the view, focusing on the important features and omitting the unnecessary information. Field sketches are free-hand drawings with annotations. Colour may be added but is not a requirement. A field sketch aids our sense of observation and allows us to record and interpret environments. Following a few basic steps, everyone can construct a field sketch!
Why are field sketches useful?Field sketches capture the important information. You might think it is easier to take an image on your phone or with a camera, but you are then capturing the non-relevant data as well. By making a drawing in the field you are interpreting the environment, analysing the landscape and high-lighting a geographical understanding of what you see by careful and clear labelling.
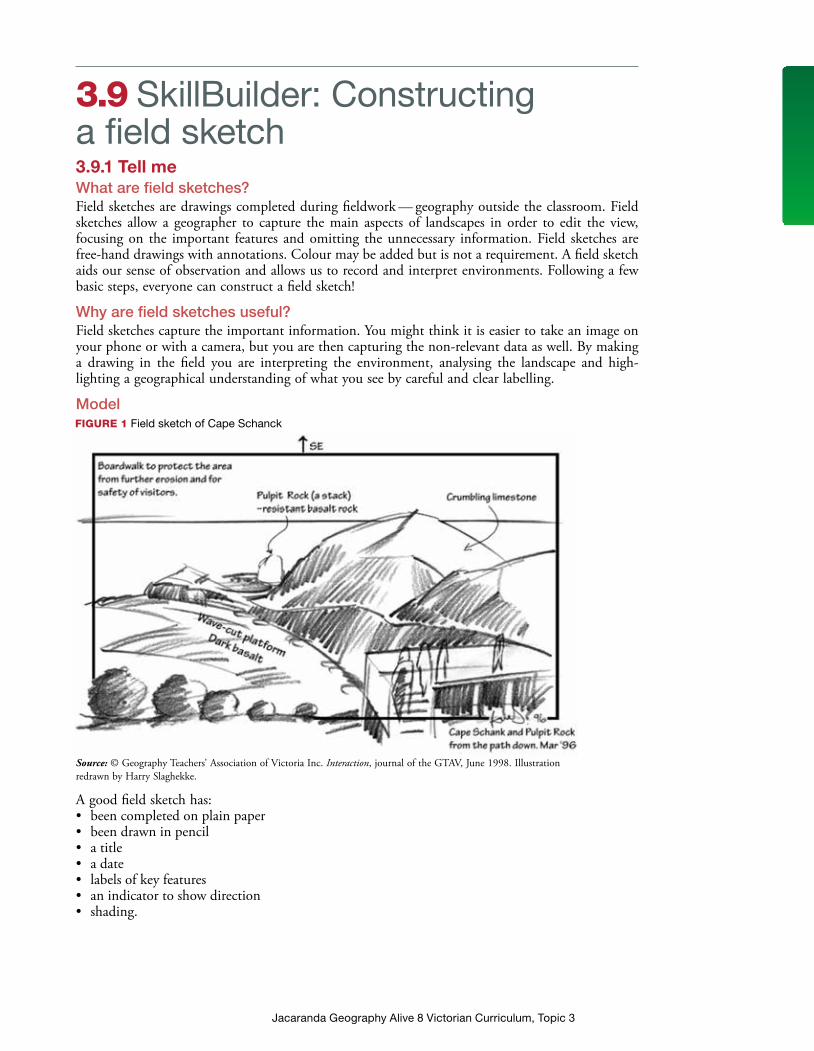
ModelFIGURE 1 Field sketch of Cape Schanck
A good field sketch has:• been completed on plain paper• been drawn in pencil• a title• a date• labels of key features• an indicator to show direction• shading.
Source: © Geography Teachers’ Association of Victoria Inc. Interaction, journal of the GTAV, June 1998. Illustration redrawn by Harry Slaghekke.
Jacaranda Geography Alive 8 Victorian Curriculum, Topic 3
3.9.2 Show meHow to complete a field sketchYou will need:• plain paper• a clipboard• a grey pencil (soft)• a ruler• an eraser.
Procedure:Here is an example of a coastal field sketch. To complete a coastal field sketch you need to be in a coastal environment. Any environment though can be sketched — natural or human-altered. You can choose an environment near you.STEP 1
Choose the field of view to be sketched; that is, ‘from this tree to that bend in the stairs’ (as in figure 1). Make yourself comfortable as you’ll need to stay in the one place while you complete the sketch.STEP 2
Partly close your eyes so that you are peeking at the world — all the small details will disappear and your eyes will focus on the main outlines. These main outlines are the first parts drawn. Practise looking at the environment.STEP 3
Attach your paper securely to the clipboard as wind plays havoc with field sketching. Using a pencil, draw a border (frame) in which you are going to sketch. Always draw in pencil and keep your eraser handy.STEP 4
Draw in the horizon as a baseline; that is, where the land meets the sky.STEP 5
Divide your sketch horizontally into three portions: background, middle ground and foreground (the closest to you).STEP 6
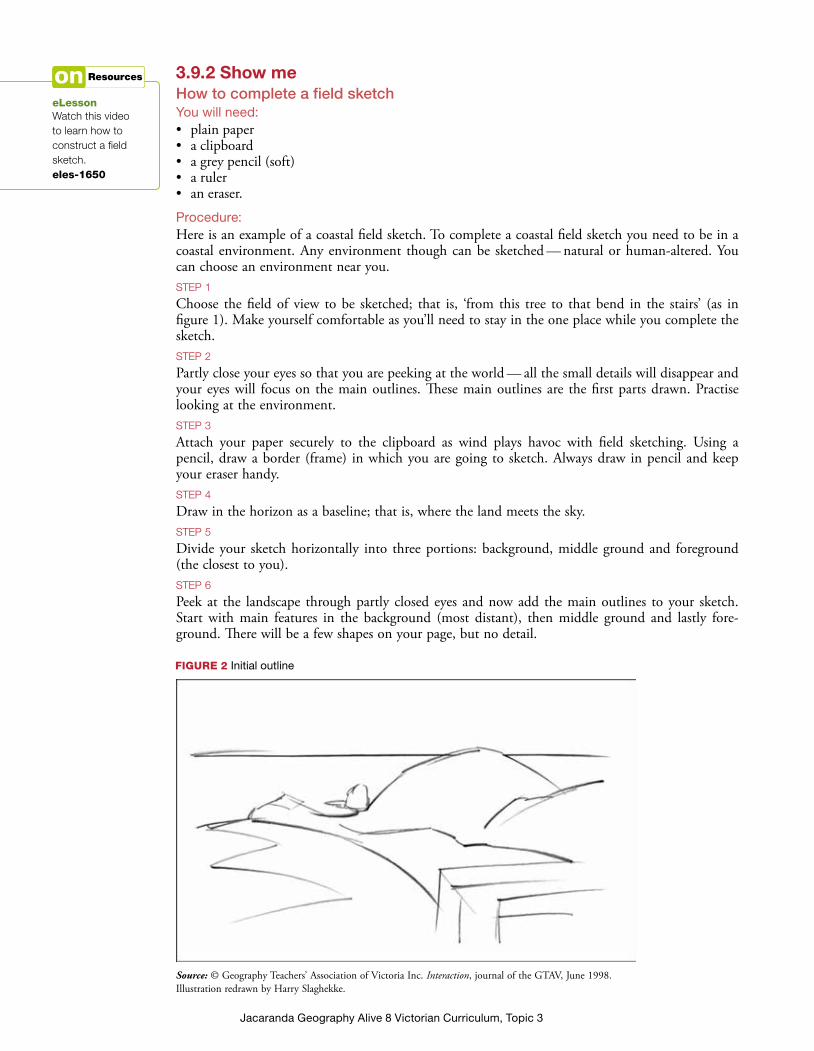
Peek at the landscape through partly closed eyes and now add the main outlines to your sketch. Start with main features in the background (most distant), then middle ground and lastly fore-ground. There will be a few shapes on your page, but no detail.
eLessonWatch this videoto learn how toconstruct a fieldsketch.eles-1650
FIGURE 2 Initial outline
Source: © Geography Teachers’ Association of Victoria Inc. Interaction, journal of the GTAV, June 1998. Illustration redrawn by Harry Slaghekke.
Jacaranda Geography Alive 8 Victorian Curriculum, Topic 3
STEP 7
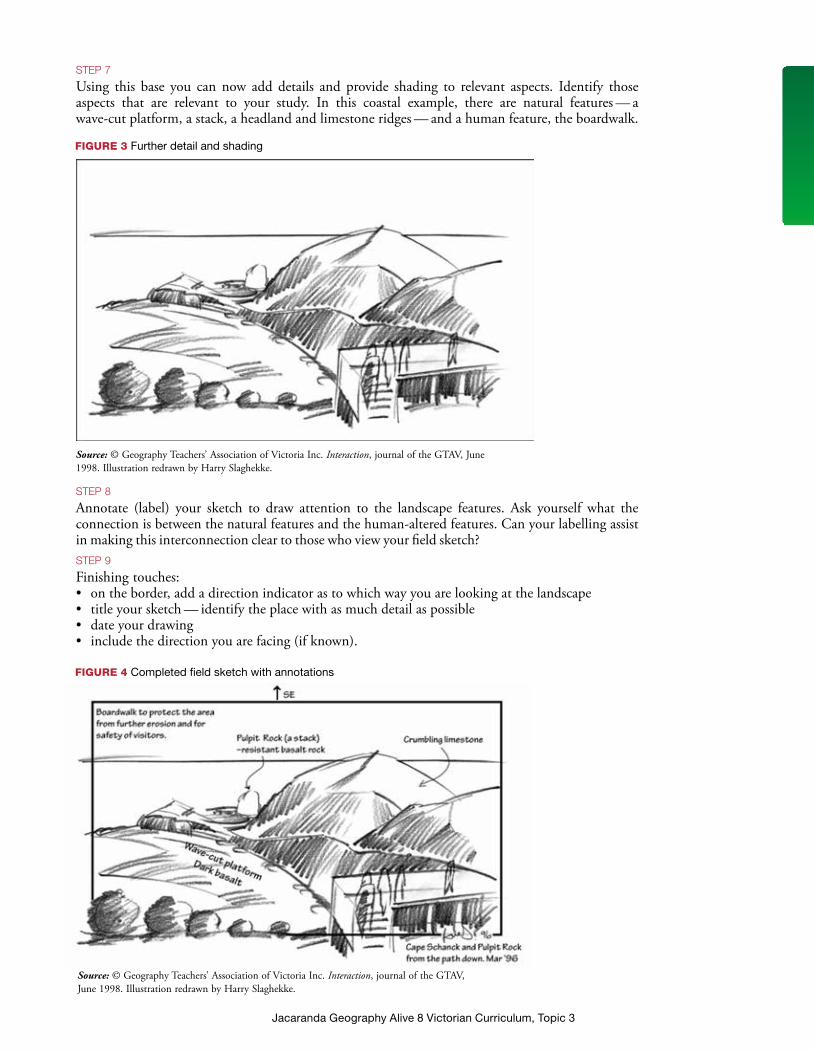
Using this base you can now add details and provide shading to relevant aspects. Identify those aspects that are relevant to your study. In this coastal example, there are natural features — a wave-cut platform, a stack, a headland and limestone ridges — and a human feature, the boardwalk.
FIGURE 3 Further detail and shading
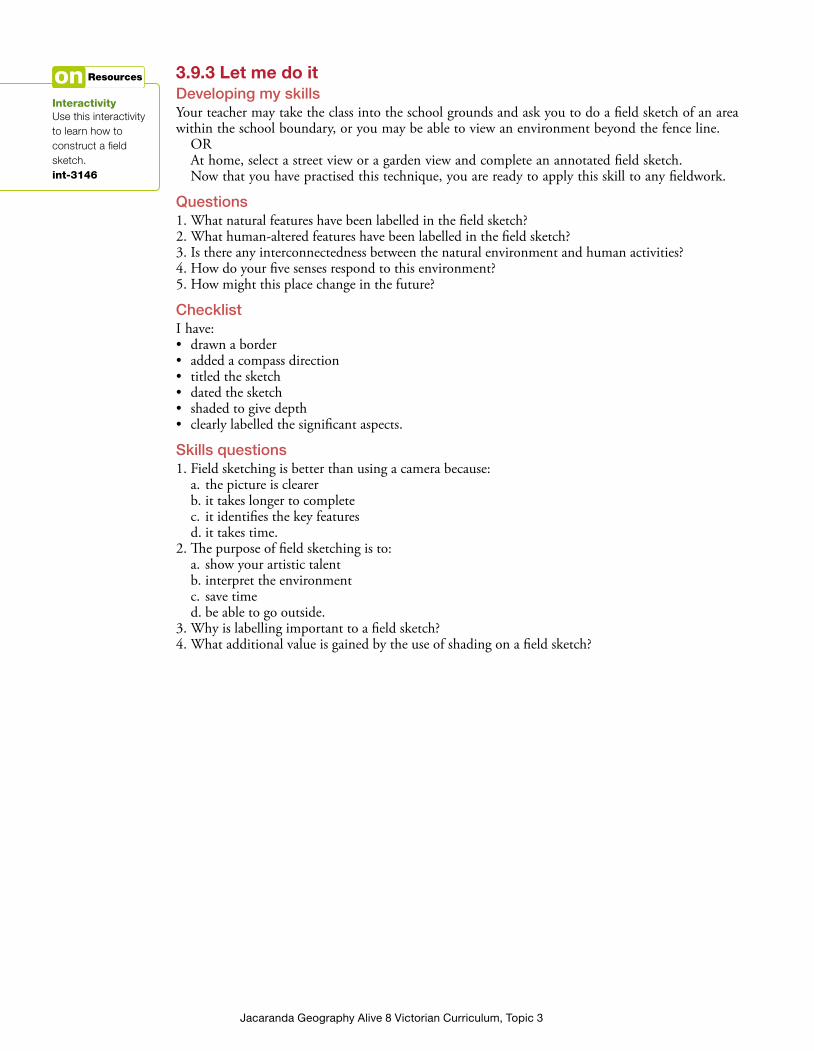
FIGURE 4 Completed field sketch with annotations
STEP 8
Annotate (label) your sketch to draw attention to the landscape features. Ask yourself what the connection is between the natural features and the human-altered features. Can your labelling assist in making this interconnection clear to those who view your field sketch?STEP 9
Finishing touches:• on the border, add a direction indicator as to which way you are looking at the landscape• title your sketch — identify the place with as much detail as possible• date your drawing• include the direction you are facing (if known).
Source: © Geography Teachers’ Association of Victoria Inc. Interaction, journal of the GTAV, June 1998. Illustration redrawn by Harry Slaghekke.
Source: © Geography Teachers’ Association of Victoria Inc. Interaction, journal of the GTAV, June 1998. Illustration redrawn by Harry Slaghekke.
Jacaranda Geography Alive 8 Victorian Curriculum, Topic 3
3.9.3 Let me do itDeveloping my skillsYour teacher may take the class into the school grounds and ask you to do a field sketch of an area within the school boundary, or you may be able to view an environment beyond the fence line.
ORAt home, select a street view or a garden view and complete an annotated field sketch.Now that you have practised this technique, you are ready to apply this skill to any fieldwork.
Questions1. What natural features have been labelled in the field sketch?2. What human-altered features have been labelled in the field sketch?3. Is there any interconnectedness between the natural environment and human activities?4. How do your five senses respond to this environment?5. How might this place change in the future?
ChecklistI have:• drawn a border• added a compass direction• titled the sketch• dated the sketch• shaded to give depth• clearly labelled the significant aspects.
Skills questions1. Field sketching is better than using a camera because:
a. the picture is clearerb. it takes longer to completec. it identifies the key featuresd. it takes time.
2. The purpose of field sketching is to:a. show your artistic talentb. interpret the environmentc. save timed. be able to go outside.
3. Why is labelling important to a field sketch?4. What additional value is gained by the use of shading on a field sketch?
InteractivityUse this interactivityto learn how toconstruct a fieldsketch.int-3146
Jacaranda Geography Alive 8 Victorian Curriculum, Topic 3
3.13 Which landscapes are formed by ice? 3.13.1 What are the features of a landscape that has been created by moving ice or glaciers? In cold parts of the world, such as the poles and high mountains, water freezes, and moves more slowly than when it is a liquid. When ice deposits thicken, the same gravitational force that moves fl owing water also moves ice, and it begins to fl ow. Glaciers trace a path downhill from permanent snowfi elds. Th e weight of snow and ice crush and scrape surface rocks to produce some distinctive landscapes. Fluctuations in climate cause glaciers to change in length, width and depth, and each change results in alterations to the glacial landscape.
Today there are about 160 000 glaciers that cover about a tenth of the Earth’s land surface. Glaciers are predominantly found in Greenland and Antarctica, although many are also found in high mountain environments. Th e closest glaciers to Australia are found in the mountains of West Papua (Indonesia) and the alps of New Zealand.
During the most recent ice age, up to 30 per cent of the Earth’s land surface was glaciated. Glaciers have a huge impact on landscapes, and the forces of erosion and deposition they exert are responsible for dramatic changes.
Snow build-up
Glacier
Water from melting ice
FIGURE 1 Franz Josef Glacier in New Zealand’s South Island
Source: © Tupungato/Shutterstock.com

Jacaranda Geography Alive 8 Victorian Curriculum, Topic 3
Freeze–thaw: rocks are broken up by repeated freezing and thawing of water in cracks
near the back wall of the glacier.
Plucking: the moving ice of the glacierpulls away blocks of rock onto which
it has become frozen.
Ice
Abrasion: rocks in a glacier work likesandpaper to smooth the rocks
they are moving over.
FIGURE 2 Three types of glacial erosion: plucking, abrasion and freeze–thaw
Arête
Main glacier
Tributary glaciermeeting main glacier
Truncated spurs
Subglacial moraine
Lateral moraine
Englacial moraine
Medial moraine
Path of main glacier
Horn
Cirques
FIGURE 3 A glacier flowing from its source in a permanent ice field towards its snout, which is the point where it starts to melt

Jacaranda Geography Alive 8 Victorian Curriculum, Topic 3
Moraine is any material carried by the glacier. This eroded material may have been picked up from the valley floor or it may have been eroded from the valley wall. Moraine comes in many sizes, from fine silt to very large boulders. As the glacier melts or retreats, it dumps its load of moraine because it no longer has the energy to push it down slope. Figures 2 and 3 illustrate the movement of the ice as it changes and shapes the environment.
3.13.2 Why are glaciers important?About three-quarters of the Earth’s fresh water is held in ice sheets and mountain glaciers. Glaciers serve as a natural regulator of regional water supplies. During periods of warm weather, or during dry seasons or droughts, glaciers melt quite quickly. Glaciers provide a water source that feeds rivers and streams. During cold, rainy seasons, glaciers produce less meltwater. They store the rainfall as ice and reduce the chance of a flash flood.
The small tropical glaciers of West Papua in the Moak Mountains of the western central highlands are likely to disappear within five to 10 years. Although these small glaciers are over 30 metres deep, they are quite short and are retreating at over seven metres per year. The loss of these glaciers will result in changes to the local environment.
Melting glaciers can affect agriculture, availability of fresh water, hydroelectric power, transportation and tourism. Over the years, settlements, farming and tourism have extended towards the edges of glaciers. If glaciers melt rapidly, then avalanches and flash floods will increasingly threaten lives and services in high mountain landscapes.
A 2007 report by the Intergovernmental Panel on Climate Change (IPCC) predicted that continued melt of Himalayan glaciers could increase the likelihood of floods over the next three decades, followed by a reduction in water supply to South Asia’s rivers.
moraine rocks of all shapes and sizes carried by a glacier
flash flood a flood that occurs very quickly, often without advance warning
0 3000 6000 km
Source: © NASA/JPL-Caltech/University of Colorado
FIGURE 4 The state of the world’s continental glaciers, not including polar glaciers. If their colour on the map is blue they are losing ice; if it is dark blue, they are losing a lot.
avalanche a sudden downhill movement of material, especially snow and ice
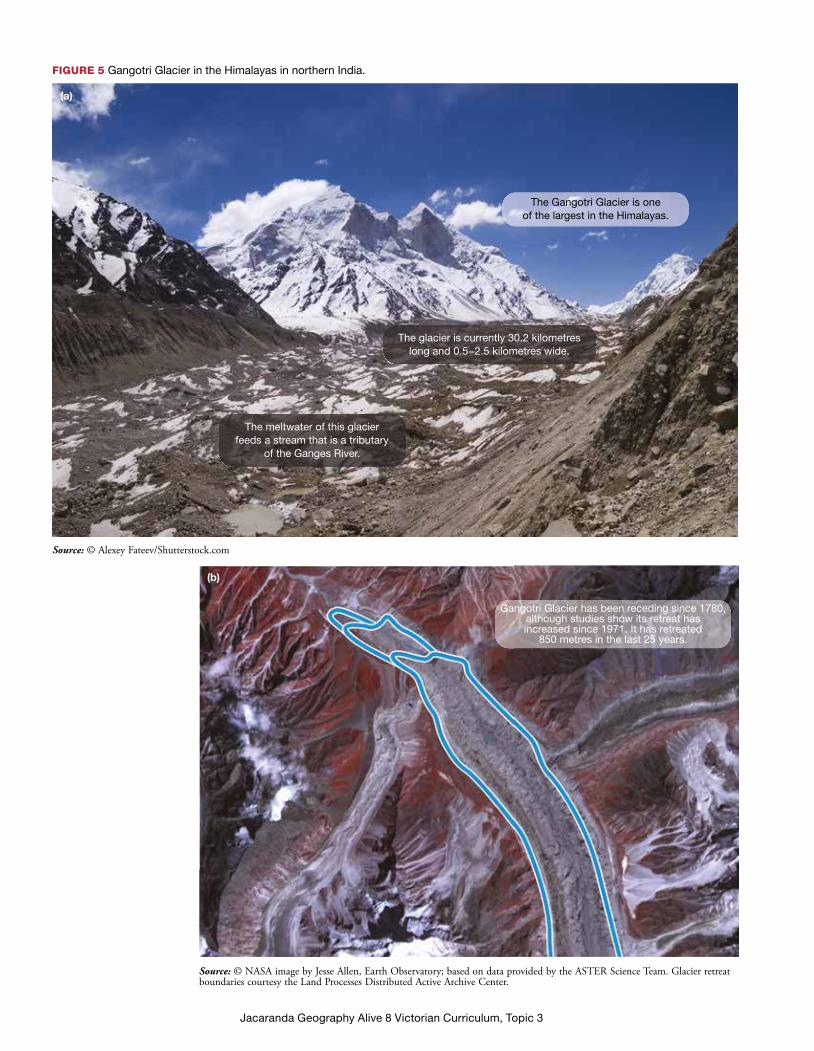
Jacaranda Geography Alive 8 Victorian Curriculum, Topic 3
The Gangotri Glacier is oneof the largest in the Himalayas.
The glacier is currently 30.2 kilometreslong and 0.5−2.5 kilometres wide.
The meltwater of this glacierfeeds a stream that is a tributary
of the Ganges River.
Gangotri Glacier has been receding since 1780,although studies show its retreat hasincreased since 1971. It has retreated
850 metres in the last 25 years.
Source: © NASA image by Jesse Allen, Earth Observatory; based on data provided by the ASTER Science Team. Glacier retreat boundaries courtesy the Land Processes Distributed Active Archive Center.
FIGURE 5 Gangotri Glacier in the Himalayas in northern India.
(a)
(b)
Source: © Alexey Fateev/Shutterstock.com
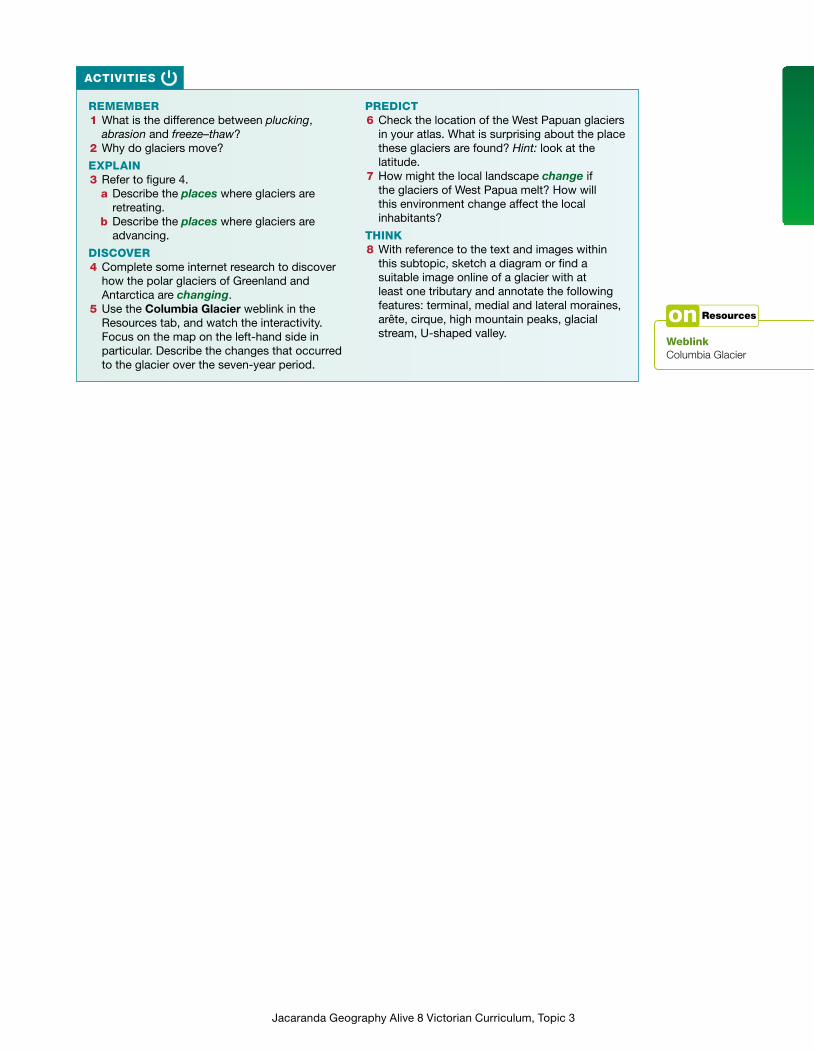
Jacaranda Geography Alive 8 Victorian Curriculum, Topic 3
ACTIVITIES
REMEMBER1 What is the difference between plucking,
abrasion and freeze–thaw?2 Why do glaciers move?
EXPLAIN3 Refer to figure 4.
a Describe the places where glaciers are retreating.
b Describe the places where glaciers are advancing.
DISCOVER4 Complete some internet research to discover
how the polar glaciers of Greenland and Antarctica are changing.
5 Use the Columbia Glacier weblink in the Resources tab, and watch the interactivity. Focus on the map on the left-hand side in particular. Describe the changes that occurred to the glacier over the seven-year period.
PREDICT6 Check the location of the West Papuan glaciers
in your atlas. What is surprising about the place these glaciers are found? Hint: look at the latitude.
7 How might the local landscape change if the glaciers of West Papua melt? How will this environment change affect the local inhabitants?
THINK8 With reference to the text and images within
this subtopic, sketch a diagram or find a suitable image online of a glacier with at least one tributary and annotate the following features: terminal, medial and lateral moraines, arête, cirque, high mountain peaks, glacial stream, U-shaped valley.
Weblink Columbia Glacier
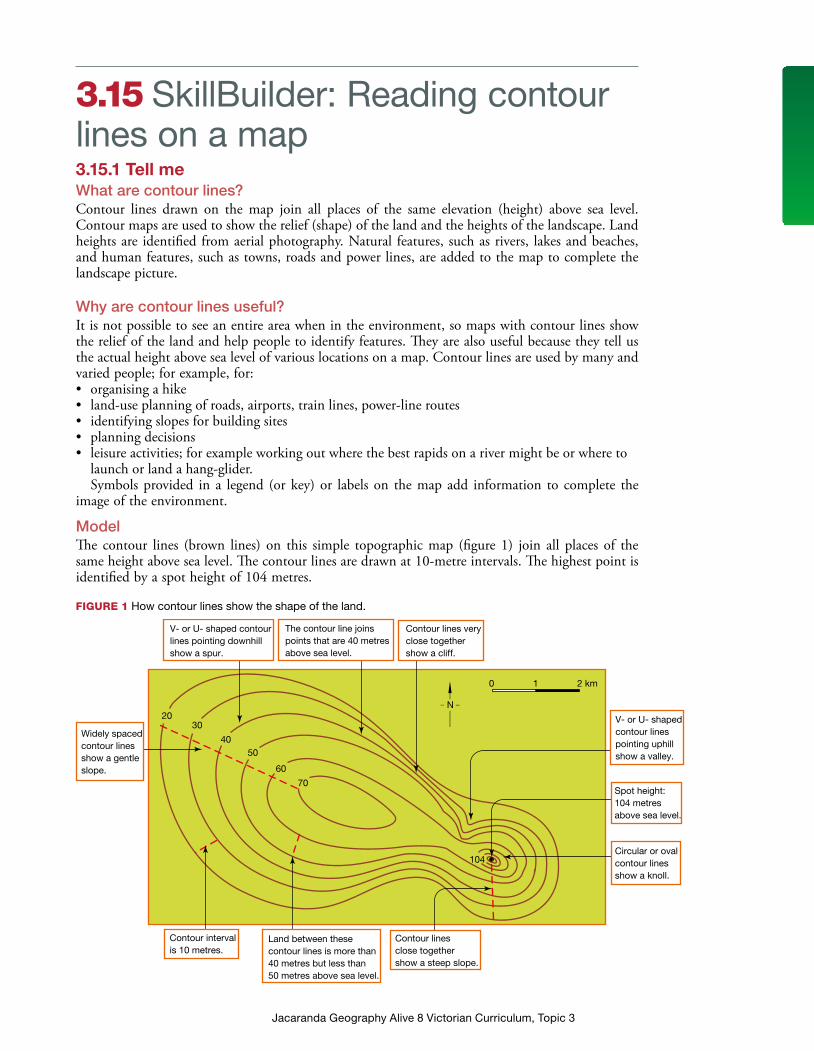
Jacaranda Geography Alive 8 Victorian Curriculum, Topic 3
3.15 SkillBuilder: Reading contour lines on a map3.15.1 Tell meWhat are contour lines?Contour lines drawn on the map join all places of the same elevation (height) above sea level. Contour maps are used to show the relief (shape) of the land and the heights of the landscape. Land heights are identified from aerial photography. Natural features, such as rivers, lakes and beaches, and human features, such as towns, roads and power lines, are added to the map to complete the landscape picture.
Why are contour lines useful?It is not possible to see an entire area when in the environment, so maps with contour lines show the relief of the land and help people to identify features. They are also useful because they tell us the actual height above sea level of various locations on a map. Contour lines are used by many and varied people; for example, for:• organising a hike• land-use planning of roads, airports, train lines, power-line routes• identifying slopes for building sites• planning decisions• leisure activities; for example working out where the best rapids on a river might be or where to
launch or land a hang-glider.Symbols provided in a legend (or key) or labels on the map add information to complete the
image of the environment.
ModelThe contour lines (brown lines) on this simple topographic map (figure 1) join all places of the same height above sea level. The contour lines are drawn at 10-metre intervals. The highest point is identified by a spot height of 104 metres.
70
104
60
5040
3020
N
Land between thesecontour lines is more than40 metres but less than50 metres above sea level.
Contour linesclose togethershow a steep slope.
0 1 2 km
Circular or ovalcontour linesshow a knoll.
Spot height:104 metresabove sea level.
Contour lines veryclose togethershow a cliff.
The contour line joinspoints that are 40 metres above sea level.
V- or U- shaped contourlines pointing downhillshow a spur.
Widely spacedcontour linesshow a gentleslope.
Contour intervalis 10 metres.
V- or U- shapedcontour linespointing uphillshow a valley.
FIGURE 1 How contour lines show the shape of the land.
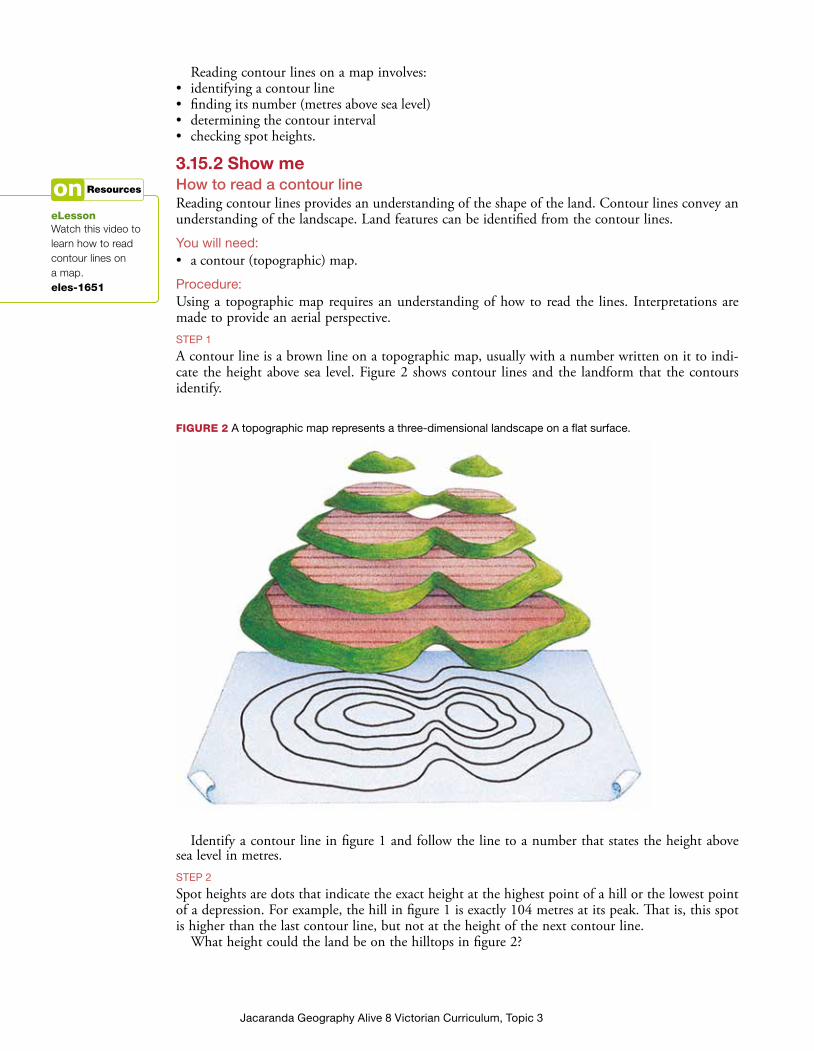
Jacaranda Geography Alive 8 Victorian Curriculum, Topic 3
Reading contour lines on a map involves:• identifying a contour line• finding its number (metres above sea level)• determining the contour interval• checking spot heights.
3.15.2 Show meHow to read a contour lineReading contour lines provides an understanding of the shape of the land. Contour lines convey an understanding of the landscape. Land features can be identified from the contour lines.
You will need:• a contour (topographic) map.
Procedure:Using a topographic map requires an understanding of how to read the lines. Interpretations are made to provide an aerial perspective.STEP 1
A contour line is a brown line on a topographic map, usually with a number written on it to indi-cate the height above sea level. Figure 2 shows contour lines and the landform that the contours identify.
Identify a contour line in figure 1 and follow the line to a number that states the height above sea level in metres.STEP 2
Spot heights are dots that indicate the exact height at the highest point of a hill or the lowest point of a depression. For example, the hill in figure 1 is exactly 104 metres at its peak. That is, this spot is higher than the last contour line, but not at the height of the next contour line.
What height could the land be on the hilltops in figure 2?
FIGURE 2 A topographic map represents a three-dimensional landscape on a flat surface.
eLessonWatch this video tolearn how to readcontour lines ona map.eles-1651

Jacaranda Geography Alive 8 Victorian Curriculum, Topic 3
STEP 3
The contour interval of a map is the difference in metres between each of the contour lines. This interval is consistent across a map.
If the contour lines are too close and the numbers can’t easily be written, then it is left to the reader to use the contour interval to calculate heights. The contour interval is often written in the legend as a guide. Check your skill on each of the maps here. The contour interval on figure 1 is 10 metres and on figure 2 it is 20 metres.
3.15.3 Let me do itDeveloping my skills
QuestionsUse figure 3 to answer these questions.1. What contour heights does the road from Highton to Booringa cross?2. Does the railway line follow fairly even land or does the train have to climb a steep slope?3. What is the contour interval on this map?4. What is the maximum height of Mount Erin at its peak?5. How would we know that Mount Erin is a hill if it was not labelled so?
ChecklistI have:• understood contour lines• understood contour intervals• understood spot heights.
SOSE 2 2ED FIG 01.01.01
Mt Erin
BOORINGA
HIGHTON
200
150
150
250
420 m
300
350
200
250
300
350
400
400
Railwaystation
A
D
C
B
10
9
8
7
6
5
4
3
2
1
A B C D E F G H I J K L M N O
Key
Built-up area
Railway
Unsealed road Lake
Swamp
Sealed road
Height in metres250
STEELTOWN
0 0.75 1.5 km
Source: MAPgraphics Pty Ltd, Brisbane
FIGURE 3 A simple topographic map of Mount Erin and surrounding areas
InteractivityUse this interactivityto learn how to readcontour lines ona map.int-3147
Jacaranda Geography Alive 8 Victorian Curriculum, Topic 3
Skills questions1. Contour lines show the:
a. amount of rainfallb. days of sunshinec. height between hillsd. height of the land above sea level.
2. A contour interval is:a. the width between the lines on the mapb. the difference in height between the lines on the mapc. a particular line on a topographic mapd. an exact spot height on a map.
3. Why are spot heights used on contour maps?4. How do contour lines let you imagine the landscape?

Jacaranda Geography Alive 8 Victorian Curriculum, Topic 3
3.16 Review3.16.1 Review1. Name four types of water features that shape the land.2. Place each of the following features into the correct column of the table below: arch, beach,
blowhole, cave, cliff, headland, lagoon, sand dune, spit, stack.
Features formed by erosion Features formed by deposition
FIGURE 1 Cross-section of stream at a meander
3. a. Why did Aboriginal and Torres Strait Islander peoples tend to live near the coast?b. How have coasts been used since 1788?
4. Describe two ways coasts are protected for use by people.5. a. What is the best way to avoid a rip current when swimming at the beach?
b. Identify two ways in which a rip current looks different from surrounding water.6. a. Refer to your fieldwork and explain the interconnection of physical processes and
human activities.b. Identify three ways in which you can record data while in the field.
7. a. What information can be shown by drawing a long profile of a river?b. What information can be shown by drawing a cross-section of a river?
8. Match these features to the upper, middle or lower course of a river: V-shaped valley, floodplain, estuary, waterfall, meander, delta.
9. Identify at least one economic, one environmental and one social reason for devising strategies to manage a river.
10. Name two places where glaciers are found.
3.16.2 Reflect11. a. What are the similarities between rivers and glaciers?
b. What are two differences between rivers and glaciers?c. What physical processes are carried out by both rivers and glaciers?d. Which of the physical processes you mentioned in (c) also occur at coastlines?
12. Refer to figure 1, which shows a sketch of a cross-section of a river at a meander.
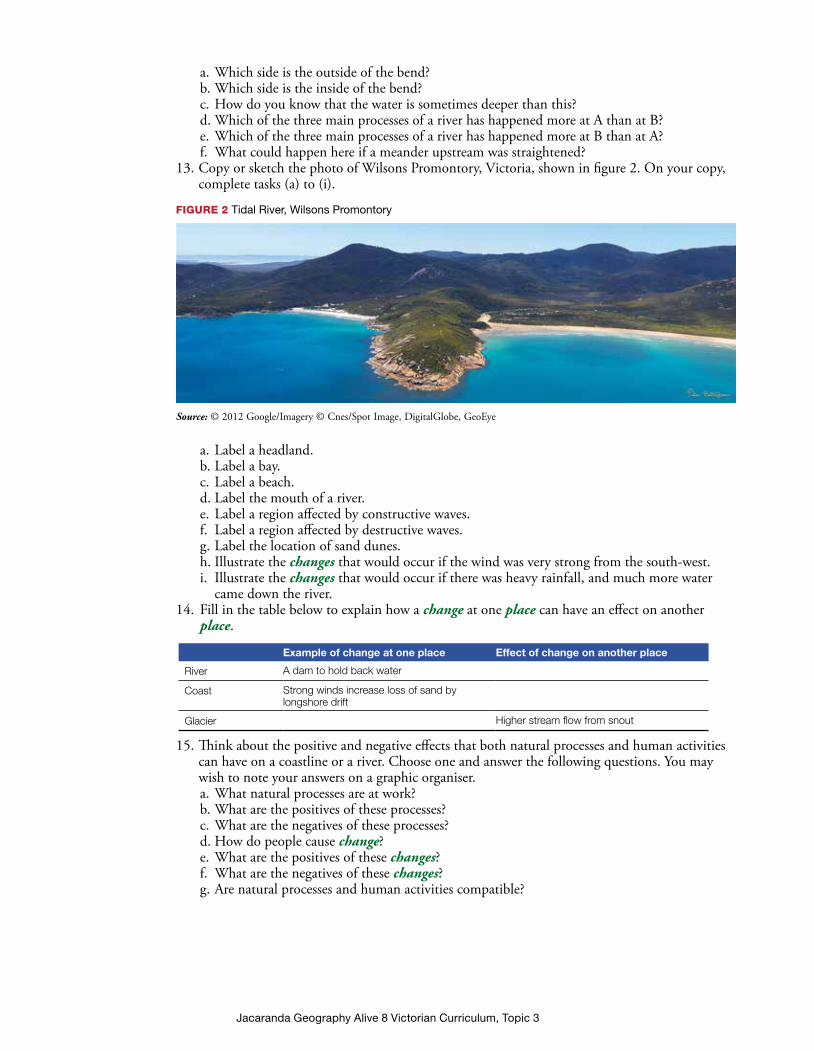
Jacaranda Geography Alive 8 Victorian Curriculum, Topic 3
a. Which side is the outside of the bend?b. Which side is the inside of the bend?c. How do you know that the water is sometimes deeper than this?d. Which of the three main processes of a river has happened more at A than at B?e. Which of the three main processes of a river has happened more at B than at A?f. What could happen here if a meander upstream was straightened?
13. Copy or sketch the photo of Wilsons Promontory, Victoria, shown in figure 2. On your copy, complete tasks (a) to (i).
a. Label a headland.b. Label a bay.c. Label a beach.d. Label the mouth of a river.e. Label a region affected by constructive waves.f. Label a region affected by destructive waves.g. Label the location of sand dunes.h. Illustrate the changes that would occur if the wind was very strong from the south-west.i. Illustrate the changes that would occur if there was heavy rainfall, and much more water
came down the river.14. Fill in the table below to explain how a change at one place can have an effect on another
place.
Example of change at one place Effect of change on another place
River A dam to hold back water
Coast Strong winds increase loss of sand by longshore drift
Glacier Higher stream flow from snout
15. Think about the positive and negative effects that both natural processes and human activities can have on a coastline or a river. Choose one and answer the following questions. You may wish to note your answers on a graphic organiser.a. What natural processes are at work?b. What are the positives of these processes?c. What are the negatives of these processes?d. How do people cause change?e. What are the positives of these changes?f. What are the negatives of these changes?g. Are natural processes and human activities compatible?
FIGURE 2 Tidal River, Wilsons Promontory
Source: © 2012 Google/Imagery © Cnes/Spot Image, DigitalGlobe, GeoEye