Embed Size (px)
Citation preview
Tobacco smoke extract modulates activity and expression
of monoamine oxidase and µ opioid receptor in cultured
human neuroblastoma cells.
A Thesis
Submitted to Victoria University of Wellington
in fulfillment of the requirements for the degree of
Doctor of Philosophy
in Biomedical Science
By
Amy Jane Lewis
Victoria University of Wellington
2010
- ii -
Abstract
Tobacco addiction is a major public health concern and is responsible for approximately five
million deaths globally each year. Although most current smokers express a desire to quit,
few are successful in their attempts. Nicotine is the primary neurobiologically active
component in tobacco smoke and acts through the nicotinic acetylcholine receptor (nAChR) to
sustain addiction. However, nicotine replacement therapies have proven to be remarkably
ineffective at helping smokers quit. This indicates that nicotine alone cannot fully account
for the intense and enduring nature of tobacco addiction. Previous research has provided
strong evidence that monoamine oxidase (MAO) enzymes and the endogenous opioid
system may also play a role in tobacco dependence.
The present study compared and contrasted the influence of nicotine and the non-
nicotine components of tobacco smoke on the enzyme activity of MAO-A and MAO-B.
Gene expression of MAO and the µ opioid receptor (MOR) in SH-SY5Y human
neuroblastoma and U-118 MG glioma cell lines was also investigated. Using a
kynuramine-based enzymatic assay adapted and optimised for this study, the MAO
inhibitory activity of tobacco-based samples were tested, including total particulate
matter (TPM) extracts from a range of New Zealand tobacco products, Quest® nicotine-
free cigarettes, and fluid from the RUYAN® Electronic cigarette. TPM from both standard
tobacco and Quest® significantly inhibited MAO-A and MAO–B activity in vitro and in
cultured cells. Differences between the types and brands of tobacco products were
observed. TPM derived from loose-leaf tobacco inhibited MAO enzymes more potently
than samples from manufactured cigarettes. This difference was attributed to a
significantly higher tar:nicotine ratio in loose-leaf tobacco. Standard TPM and Quest®
TPM also inhibited total MAO activity in SH-SY5Y cells treated for 24 hours; whereas the
weak activity in U-118 MG remained unchanged. However, MAO activity was highly
dependent on the cell culture conditions, with activity increasing in SH-SY5Y cells when
treated with a 5-day exposure regimen. This finding was unique to the present study.
The gene expression of MAO-A, MAO-B, and MOR was examined using a qRT-PCR assay.
All three genes were significantly up-regulated by standard and denicotinized TPM
extracts after a 5-day treatment regimen. This finding was correlated with an increase in
protein abundance for MOR, but not MAO-A or MAO-B, as assayed by Western blot. Up-
- iii -
regulation of MAO and MOR gene expression was abolished when cells were treated with
TPM extracts in conjunction with the nAChR antagonist mecamylamine, suggesting that
up-regulation of MAO and MOR genes was dependent, at least in part, on nAChR
signalling. Both standard TPM and TPM from denicotinized Quest® cigarettes induced
inhibition of MAO and up-regulation of MAO and MOR gene expression. This
demonstrates that non-nicotine compounds within tobacco smoke can significantly
influence the behaviour of cultured neuronal cells. Further research is required to fully
elucidate the mechanisms behind the MAO and MOR gene response, and a better
understanding of these mechanisms may provide a framework for the development of
novel smoking cessation therapies.

- iv -
Acknowledgements
I would like to acknowledge with gratitude and appreciation the help, guidance, and
support I have received from the following people in completing this thesis.
Dr John H. Miller, for his endless support, patience, and enthusiasm, and his invaluable help in
proof-reading and checking my many drafts. Also, Dr Penny Truman for her helpful ideas,
encouraging words of advice, and for seeing potential in places that I didn’t think to look.
Dr Donia Macartney-Coxson and Alice Johnstone for their expert knowledge and assistance
with the qRT-PCR experiments used in this thesis, and for generously providing training and
the use of their laboratory. Thanks also to Danny Kay for his assistance with cell culture, and
his ever-sunny disposition.
Dr Rod Lea and Michael Green for their preliminary work in developing and optimizing the
MAO-A and MAO-B PCR primers used in this study.
Dr Murray Laugesen, Health New Zealand Ltd, for supplying the RUYAN e-cigarette samples
tested in this study.
The academic staff in the School of Biological Sciences at Victoria University. In particular, I
would like to thank Dr Bronwyn Kivell and Dr Darren Day for your helpful tips and advice on
the real-time PCR experiments used in this thesis. Special thanks to Dr Bill Jordan, who offered
many well-timed words of support and encouragement.
Thanks to the technical and administration staff in the School of Biological Sciences, especially
Mary Murray, Sandra Taylor, and Patricia Stein, for all your hard work in ensuring I had access
to the resources I needed, and for chasing down my six-monthly reports.
The many students who have passed through the 6th floor lab, including Tim Sargeant, Anja
Wilmes, Kevin Crume, and Ryan Steel, for your friendship and enthusiasm.
My deepest gratitude for the generosity and support I received from my brothers, Kerry and
Casey, and the extraordinary patience and understanding from my mother and step-father.
Thanks especially to all of my friends, for your encouragement, support and understanding.
To my dearest friend Dean, and Ellen, for your unfailing friendship and generosity, and for
always believing I could do this! To Peter, for being so very understanding and supportive.
Thanks also to Andrea, Lisa, Liz, Sarah, Sass, Kelly, Sonja, and Bruce – I promise the neglect is
over now I’ve submitted!
This project was generously funded by research grants from the Wellington Medical Research
Foundation and the VUW/ESR Post-graduate Fellowship.
- v -
Table of Contents
Abstract…………………………………………………………………………………………………………………………. ii Acknowledgements………………………………………………………………………………………………………. iv Table of Contents………………………………………………………………………………………………………….. v List of Figures………………………………………………………………………………………………………………… xi List of Tables………………………………………………………………………………………………………………….. xiv Abbreviations………………………………………………………………………………………………………………… xv
Chapter One: Literature Review 1
1.1 Biochemistry and Mode of Action of Nicotine 3
1.2 Mechanisms of Addiction 9
1.3 Introduction to Monoamine Oxidase 13
1.3.1 General Introduction 13
1.3.2 Enzyme Structure 16
1.3.3 Gene Structure 17
1.3.4 Localization and Activity of Monoamine Oxidase 19
1.3.4.1 Localization in the Brain 19
1.3.4.2 Peripheral Localization 221
1.4 Inhibition of Monoamine Oxidase by Tobacco Smoke 23
1.4.1 MAO Inhibitors in Tobacco Smoke 27
1.4.2 MAO Inhibitors in Smoking Cessation 32
1.5 Introduction to the µ Opioid Receptor (MOR) 342
1.5.1 General Introduction 34
1.5.2 Structure, Function, and Localization 34
1.5.3 MOR and Tobacco 36
1.6 Aims 38
Chapter Two: General Methods 41
2.1 Cell Culture 41
2.1.1 SH-SY5Y Human Neuroblastoma 41
2.1.2 U-118 MG Human Glioma 42 2.1.3 Culture Conditions 43 2.1.4 Cell Passaging 43
2.2 Tobacco Particulate Exposures 44
2.2.1 Tobacco Particulate Matter Sample Collection 44
2.2.2 Cell Treatments and Exposures 45
2.3 Sample Preparation 46
- vi -
2.3.1 Protein Lysate Preparation 46
2.3.2 TriZol® Total RNA Extraction 47
2.3.3 Protein Concentration Assay 47
2.4 Monoamine Oxidase Activity Assays 47
2.4.1 Amplex® Red Monoamine Oxidase Activity Assay 48
2.4.2 Kynuramine Monoamine Oxidase Activity Assay 49
2.4.2.1 Kynuramine Microcentrifuge Tube Procedure 49
2.4.2.2 Kynuramine Microplate Procedure 50
2.5 Western Blotting 51
2.5.1 Polyacrylamide Gel Electrophoresis 51
2.5.2 Immunoblotting Procedure 51
2.5.3 Antibodies 52
2.6 Quantitative Real-Time PCR 54 2.6.1 mRNA Extraction 54 2.6.2 Reverse Transcription 55 2.6.3 Quantitative Real-Time PCR 56 2.6.4 PCR Primer Design and Validation 57 2.6.4.1 Agarose Gel Electrophoresis 59
2.7 Statistical Analysis 59
Chapter Three: Development of a fluorimetric MAO enzyme activity assay 60
3.1.1 Amplex Red Assay 61 3.1.2 Kynuramine Assay 62 3.1.3 Other MAO Assays 63 3.1.4 Objectives 63
3.2 Materials and Methods 64 3.2.1 Sample Preparation 64 3.2.1.1 Cultured Cell Lysates 64 3.2.1.2 Human Blood Platelets 65 32.1.3 Purified Recombinant MAO-A and MAO-B Enzymes 65 3.2.2 Invitrogen Amplex® Red Assay 65 3.2.2.1 Using Amplex Red for Differentiated SH-SY5Y Cells 66 3.2.3 Kynuramine Assay 67 3.2.3.1 Assessing Assay Variation 67 3.2.3.2 Measuring MAO Activity in Human Blood Platelets 68
3.3 Results 68 3.3.1 Amplex® Red Assay 68 3.3.1.1 Resorufin Standard Curve 68 3.3.1.2 Using Amplex Red for Differentiated SH-SY5Y Cells 69 3.3.1.3 Using Amplex Red to Distinguish MAO-A and MAO-B activity 70 3.3.1.4 Problems with the Amplex Red Assay 71 3.3.2 Kynuramine Assay 72 3.3.2.1 4-Hydroxyquinoline Standard Curve 72 3.3.2.2 Determination of Optimum Substrate Concentration 73
- vii -
3.3.2.3 Fluorescence Increases Proportionally with Increased Enzyme Concentrations 74
3.3.2.4 Kynuramine Reaction is Linear Over Time 74 3.3.2.5 Kynuramine Assay Variability 75 3.3.2.6 Measuring MAO Enzyme Activity with Kynuramine 76 3.3.2.7 Measuring MAO Activity in Blood Platelets 78
3.4 Discussion 79 3.4.1 Amplex Red Assay 79 3.4.1.1 Measuring MAO Activity in Differentiated SH-SY5Y Cells 79 3.4.1.2 Problems with the Amplex Red Assay 79 3.4.2 Kynuramine Assay 81 3.4.2.1 Measuring MAO Activity in Human Blood Platelets 83 3.4.3 Summary 83
Chapter Four: Inhibition of MAO Enzyme Activity by Tobacco Extracts 84
4.1.2 Objectives 87
4.2 Materials and Methods 88 4.2.1 Purified Recombinant MAO Enzymes 88 4.2.2 Kynuramine Assay 88 4.2.3 Tobacco Extract Exposures 89 4.2.4 Comparison of Nicotine, TPM, and Denicotinised TPM 90 4.2.5 Comparison of MAO Inhibition between Tobacco Products 91 4.2.6 RUYAN® Cartridge Exposures 92
4.3 Results 93 4.3.1 Effect of Nicotine on MAO-A and MAO-B 93 4.3.2 Comparison of Nicotine, TPM, and Denicotinised TPM 93 4.3.3 Comparison of Nicotine Yields Between Products 94 4.3.4 Comparison of MAO Inhibition Between Tobacco Products 96 4.3.4.1 MAO Concentration-Response for TPM Samples 96 4.3.5 RUYAN® Electronic Cigarette Exposures 102
4.4 Discussion 104 4.4.1 Effects of Nicotine and TPM on Monoamine Oxidase Enzymes 104 4.4.2 Comparing Nicotine and Tar Yields Between Tobacco Products 106 4.4.3 Comparing MAO Inhibition Between Tobacco Products 107 4.4.4 The RUYAN® Electronic Cigarette Does Not Inhibit MAO 109
Chapter Five: MAO inhibition in cultured cells exposed to tobacco
extracts 111 5.1.1 SH-SY5Y Neuroblastoma as a Model of Human Neuronal Function 111 5.1.2 Glial Cells and Tobacco Addiction 113 5.1.3 Objectives
114 5.2 Materials and Methods 115 5.2.1 Exposure to Tobacco Particulate Matter 115 5.2.1.1 Total MAO Activity in SH-SY5Y Cells 115 5.2.1.2 Total MAO Activity in U-118 MG Cells 116 5.2.2 Kynuramine MAO Activity Assay 116 5.2.2.1 Kynuramine Microcentrifuge Tube Assay 116
- viii -
5.2.2.2 Lineweaver-Burk Analysis 117
5.3 Results 118 5.3.1 Effects of Ethanol Exposure on Total MAO Activity in SH-SY5Y Cells 118 5.3.2 MAO Inhibition in SH-SY5Y Cells Treated with Tobacco Extracts 118 5.3.3 Tobacco Extract Exposure and Total MAO Activity in SH-SY5Y Cells
Over Time 121 5.3.4 Effects of Tobacco Extract Exposure on Total MAO Activity in U-118
MG Cells 125
5.4 Discussion 126 5.4.1 Effects of Ethanol Exposure on Total MAO Activity in SH-SY5Y Cells 126 5.4.2 Standard and De-nicotinized Tobacco Extracts Inhibit MAO in SH-SY5Y 126 5.4.3 Changes in Total MAO Activity in SH-SY5Y Cells Exposed to Tobacco
Compounds 128 5.4.4 Effects of Tobacco Extract Exposures on Total MAO Activity in U-118
MG Cells 131 5.4.5 Summary 132
Chapter Six: Tobacco extract exposure alters MAO gene expression 133
6.1.1 MAO Gene Studies and Smoking 133 6.1.2 Nicotine and Gene Expression 135 6.1.3 Quantitative Real-Time PCR 137 6.1.3.1 Data Manipulations and Calculations 140 6.1.4 Objectives 142
6.2 Materials and Methods 143 6.2.1 Tobacco Particulate Matter Exposures 143 6.2.1.1 MAO Gene Expression in SH-SY5Y Cells 143 6.2.1.2 MAO Gene Expression in U-118 MG Cells 144 6.2.1.3 Gene Expression in SH-SY5Y Cells Treated with Refreshed Media 144 6.2.1.4 Mecamylamine Exposures 145 6.2.2 Quantitative Real-Time PCR 145 6.2.2.1 Reference Genes 145 6.2.2.2 Primer Efficiency 145 6.2.2.3 Data Manipulation 146 6.2.3 Western Blotting 146
6.3 Results 147 6.3.1 Quantitative Real-Time PCR Validation 147 6.3.1.1 Primer Efficiency 147 6.3.1.2 Primer Specificity 148 6.3.1.2 Reference Genes 149 6.3.2 Effects of Ethanol Exposure on MAO-A and MAO-B Gene Expression 151 6.3.3 Effects of Tobacco Extract Exposure on MAO-A Gene Expression 152 6.3.4 Effects of Tobacco Extract Exposure on MAO-B Gene Expression 155 6.3.5 Gene Expression in U-118 MG Cells Treated with Tobacco Compounds 158 6.3.6 Mecamylamine Treatment 161 6.3.6.1 Effects of Mecamylamine 161 6.3.6.2 Validation of Mecamylamine Assay 163 6.3.6 Western Blotting 164
6.4 Discussion 166
- ix -
6.4.1 Effects of Ethanol on MAO-A and MAO-B Expression 166 6.4.2 Changes in MAO-A and –B Gene Expression Following Exposure to
Tobacco Compounds 166 6.4.3 Effects of Mecamylamine Treatment on MAO-A Gene Expression 169 6.4.4 MAO-A and MAO-B Gene Expression in U-118 MG Cells 170 6.4.5 Summary 172
Chapter Seven: Up-regulation of MOR gene expression following tobacco exposure 173
7.1.2 Drugs of Abuse 176 7.1.3 Objectives 179
7.2 Materials and Methods 180 7.2.1 Tobacco Particulate Exposures 180 7.2.1.2 5-day Refreshed Medium Exposure Groups 181 7.2.1.3 Mecamylamine Exposure Groups 181 7.2.2 Quantitative Real-Time PCR 181 7.2.3 Western Blotting 182 7.2.4 Data Analysis 182
7.3 Results 183 7.3.1 Validation of the qRT-PCR Assay 183 7.3.2 Effects of Ethanol Exposure on MOR Gene Expression 184 7.3.3 Effects of Tobacco Extract Exposure on MOR Gene Expression 185 7.3.3.1 Summary of Chnages in MOR Expression 187 7.3.4 Effects of Mecamylamine 188 7.3.5 Western Blotting 189
7.4 Discussion 190 7.4.1 Effects of Ethanol on MOR Gene Expression 190 7.4.2 Tobacco Extract Exposure Increases MOR Gene Expression in SH-SY5Y 191 7.4.3 MOR Up-regulation Following Tobacco Exposure is Dependent on
nAChR activation 193 7.4.4 Summary 195
Chapter Eight: General Discussion and Future Directions 196
8.1 Project Summary 196 8.2 Future Experiments 199 8.2.1 Investigate a Continuous Cell Culture Treatment Regimen 199 8.2.2 Identify the Neurobiologically Active Compounds in Tobacco Smoke 200 8.2.3 Elucidate the Mechanism of MAO Up-Regulation 200 8.2.4 Elucidate the Mechanism of MOR Up-Regulation 201 8.2.5 Do Tobacco Smoke Constituents Bind to or Activate MOR? 201 8.2.6 Remodel in vitro Experiments for Animal Studies 202
8.3 Towards Improved Smoking Cessation Therapies 203
References 205

- x -
Chapter Nine: Appendix 220
9.1 Buffers & Solutions 220
9.2 TPM Numbering Scheme 223 9.3 RUYAN® Cartridge Ingredients List 224 9.4 PCR Primer Efficiency Data 225
- xi -
Index of Figures
Chapter One
Fig. 1(a) Nicotinic acetylcholine receptor localization in the plasma membrane……………….. 4 Fig. 1(b) Pentameric arrangement of nAChR α and β subnits……………………………................... 4 Fig. 2 The effects of nicotine binding in neuronal cells…………………………………………………… 8 Fig. 3 The reaction catalyzed by monoamine oxidase…………………………………….................. 14 Fig. 4(a) Molecular schematic of monoamine oxidase A enzyme……………………………………….. 18 Fig. 4(b) Molecular schematic of monoamine oxidase B enzyme……………………………………….. 18 Fig. 5 Whole body PET scan of MAO-B activity in a smoker and non-smoker………………… 24
Chapter Two
Fig. 6(a) Magnification of SH-SY5Y human neuroblastoma cells………………………………………..... 42 Fig. 6(b) Magnification of U-118 MG human glioma cells ……………………………………………………. 42
Chapter Three
Fig. 7 Resorufin standard curve……………………………………………………………………………………….. 69 Fig. 8 Total MAO activity in SH-SY5Y cells differentiated with retinoic acid……………………… 69 Fig. 9(a) Inhibition of MAO subtypes in SH-SY5Y cells by Amplex Red inhibitors………………….. 70 Fig. 9(b) Inhibition of platelet MAO-B by pargyline………………………………………………………………. 70 Fig. 10 MAO activity measured in SH-SY5Y cell lysate by Amplex Red assay………………………. 71 Fig. 11(a) Standard curve of 4-hydroxyquinoline concentration…………………………………………….. 72 Fig. 11(b) Standard curve of 4-hydroxyquinoline concentration…………………………………………….. 72 Fig. 12(a) MAO-A activity versus substrate concentration for purified MAO-A enzyme…………. 73 Fig. 12(b) MAO-A activity versus substrate concentration for SH-SY5Y cell lysate………………….. 73 Fig. 13 SH-SY5Y lysate concentration versus assay fluorescence……………………………………….. 74 Fig. 14 Time course of MAO-A activity measured by kynuramine assay…………………………….. 75 Fig. 15(a) Between sample variation for untreated SH-SY5Y cell lysates………………………………… 76 Fig. 15(b) Total MAO activity in SH-SY5Y cell lysates measured on consecutive days…………….. 76 Fig. 16(a) Inhibition of MAO-A by clorgyline…………………………………………………………………………… 77 Fig. 16(b) Inhibition of MAO-B by pargyline…………………………………………………………………………… 77 Fig. 16(c) Inhibition of MAO-A by pargyline…………………………………………………………………………… 77 Fig. 16(d) Inhibition of MAO-B by clorgyline…………………………………………………………………………… 77 Fig. 17 Total platelet MAO-B activity in human smokers and non-smokers……………………….. 78
Chapter Four
Fig. 18 Component diagram of the E-cigarette………………………………………………………………….. 86 Fig. 19(a) Log-[nicotine] vs MAO-A activity……………………………………………………………………………. 93 Fig. 19(b) Log-[nicotine] vs MAO-B activity……………………………………………………………………………. 93 Fig. 20(a) MAO-A activity following treatment with tobacco extracts……………………………………. 94 Fig. 20(b) MAO-B activity following treatment with tobacco extracts……………………………………. 94 Fig. 21(a) Nicotine yield per cigarette for TPM derived from manufactured cigarettes and
hand-rolled tobacco cigarettes………………………………………………………………………………. 96 Fig. 21(b) Tar yield for TPM derived from manufactured cigarettes and hand-rolled
cigarettes………………………………………………………………………………………………………………. 96 Fig. 22(a) Comparison of dose:response curves for TPM samples derived from standard and
denicotinized cigarettes for MAO-A………………………………………………………………………. 97 Fig. 22(b) Comparison of dose:response curves for TPM samples derived from cigarettes and 97
- xii -
loose-leaf tobacco for MAO-A………………………………………………………………………………… Fig. 23 MAO-A enzyme activity following exposure to TPM extracts (4 µM nicotine)………… 99 Fig. 24 MAO-A inhibition following exposure to TPM samples normalized to 0.01 mg/mL
tar………………………………………………………………………………………………………………………….. 101 Fig. 25 MAO-A enzyme activity following exposure to TPM extracts (0.1 mg/mL tar)………… 102 Fig. 26(a) MAO-A activity following 15 mins exposure to RUYAN samples……………………………… 103 Fig. 26(b) MAO-B activity following 15 mins exposure to RUYAN samples……………………………… 103 Fig. 27(a) MAO-A activity following 60 mins exposure to RUYAN samples……………………………… 104 Fig. 27(b) MAO-B activity following 60 mins exposure to RUYAN samples……………………………… 104
Chapter Five
Fig. 28 Total MAO activity in SH-SY5Y cells treated with ethanol……………………………………….. 118 Fig. 29(a) Total MAO activity Vs. substrate concentration in SH-SY5Y cells treated for 3 days.. 119 Fig. 29(b) Total MAO activity Vs. substrate concentration in SH-SY5Y cells treated for 5 days.. 119 Fig. 30(a) Lineweaver-Burke plot of MAO activity in SH-SY5Y cells treated with tobacco
extracts for 5 days………………………………………………………………………………………………….. 120 Fig. 30(b) Lineweaver-Burke plot of MAO activity in SH-SY5Y cells treated with nicotine………. 120 Fig. 30(c) Lineweaver-Burke plot of MAO activity in SH-SY5Y cells treated with HTPM………….. 120 Fig. 30(d) Lineweaver-Burke plot of MAO activity in SH-SY5Y cells treated with QTPM………….. 120 Fig. 31 Total MAO activity in SH-SY5Y cells treated with tobacco extract for 24 hours………. 121 Fig. 32 Total MAO activity in SH-SY5Y cells treated with tobacco extract for 3 days…………… 122 Fig. 33 Total MAO activity in SH-SY5Y cells treated with tobacco extract for 5 days…………… 123 Fig. 34 Summary of changes on MAO activity over a 5-day treatment period……………………. 123 Fig. 35 MAO acitivity in SH-SY5Y cells treated with tobacco extracts by the refreshed
treatment regimen…………………………………………………………………………………………………. 124 Fig. 36 Summary of changes in MAO activity in SH-SY5Y cells treated with tobacco extract. 124 Fig. 37(a) MAO activity in U-118 MG cells treated with tobacco compounds for 5 days………… 125 Fig. 37(b) MAO activity in U-118 MG cells treated with tobacco compounds for 5 days
expressed as percent of control……………………………………………………………………………… 125
Chapter Six
Fig. 38(a) SH-SY5Y dilution sequence for POLR2F RT-PCR primers…………………………………………. 139 Fig. 38(b) POLR2F primer amplification efficiency plot…………………………………………………………… 139 Fig. 39 Representative RT-PCR dissociation curves for POLR2F, MAO-A, and MAO-B………… 148 Fig. 40(a) Electrophoretic bands of MAO-A PCR products……………………………………………………… 149 Fig. 40(b) Electrophoretic bands of MAO-B PCR products………………………………………………………. 149 Fig. 40(c) Electrophoretic bands of POLR2F PCR products……………………………………………………… 149 Fig. 41(a) Comparison of reference gene expression in SH-SY5Y cells……………………………………. 150 Fig. 41(b) Comparison of reference gene expression in SH-SY5Y cells……………………………………. 150 Fig. 42(a) Effects of ethanol treatment on MAO-A gene expression in SH-SY5Y cells……………… 152 Fig. 42(b) Effects of ethanol treatment on MAO-B gene expression in SH-SY5Y cells……………… 152 Fig. 43 Changes in MAO-A expression in SH-SY5Y following treatment with tobacco
compounds for 5 days continuously…………………………………………………………….………… 153 Fig. 44(a) MAO-A expression following treatment with nicotine by the refreshed regimen….. 154 Fig. 44(b) MAO-A expression following treatment with HTPM by the refreshed regimen……… 154 Fig. 44(c) MAO-A expression following treatment with QTPM by the refreshed regimen……… 154 Fig. 44(d) Summary of changes in MAO-A expression following treatment with the refreshed
regimen………………………………………………………………………………………………………………….. 154 Fig. 45 Comparison of MAO-A expression in cells treated continuously or by the refreshed
regimen………………..………………………………………………………………………………………………… 155 Fig. 46 Changes in MAO-B expression in SH-SY5Y following treatment with tobacco
compounds…………………………………………………………………………………….……………………… 156
- xiii -
Fig. 47(a) MAO-B expression following treatment with nicotine by the refreshed regimen…… 157 Fig. 47(b) MAO-B expression following treatment with HTPM by the refreshed regimen……... 157 Fig. 47(c) MAO-B expression following treatment with QTPM by the refreshed regimen……... 157 Fig. 47(d) Summary of changes in MAO-B expression following treatment with the refreshed
regimen………………………………………………………………………………………………………………….. 157 Fig. 48 Comparison of changes in MAO-B expression in cells treated continuously or by
the refreshed regimen….………………………………………………………………………………………… 158 Fig. 49(a) Gene expression levels of MAO-A in SH-SY5Y and U-118 MG cells.………………………… 158 Fig. 49(b) Gene expression levels of MAO-B in SH-SY5Y and U-118 MG cells.………………………… 158 Fig. 50(a) Expression of MAO-A in U-118 MG cells following ethanol exposure……………………… 159 Fig. 50(b) Expression of MAO-B in U-118 MG cells following ethanol exposure……………………… 159 Fig. 51(a) MAO-A Expression in U-118 MG cells following exposure to tobacco compounds…. 160 Fig. 51(b) MAO-B Expression in U-118 MG cells following exposure to tobacco compounds…. 160 Fig. 52 Changes in MAO-A expression following treatment with mecamylamine and
ethanol…………………………………………………………………………………………………………………… 162 Fig. 53 Changes in MAO-A gene expression following treatment with tobacco compounds
in conjunction with mecamylamine……………………………………………………………………….. 162 Fig. 54(a) eIF4A2 gene expression in cells treated with ethanol and mecamylamine……………… 164 Fig. 54(b) eIF4A2 gene expression in cells treated with nicotine and mecamylamine……………. 164 Fig. 55(a) Western blot of MAO-A staining from SH-SY5Y cells……………………………………………… 165 Fig. 55(b) Western blot of MAO-B staining from SH-SY5Y cells……………………………………………… 165 Fig. 55(c) Relative band densities on MAO-A Western blots………………………………………………….. 165 Fig. 55(d) Relative band densities on MAO-B Western blots………………………………………………….. 165
Chapter Seven
Fig. 56 Schematic diagram of dopamine and opioid interactions………………………………………. 178 Fig. 57(a) Representative RT-PCR melt-curve for MOR and POLR2F amplicons………………………. 183 Fig. 57(b) MOR PCR products identified by agarose gel electrophoresis………………………………… 183 Fig. 58 Changes in MOR gene expression in SH-SY5Y cells following ethanol treatment……. 184 Fig. 59 Changes in MOR gene expression in SH-SY5Y cells treated with tobacco extract for
up to 5 days……………………………………………………….…………………………………………………… 185 Fig. 60(a) Effect of nicotine exposure on MOR gene expression in SH-SY5Y cells…………………… 186 Fig. 60(b) Effect of HTPM exposure on MOR gene expression in SH-SY5Y cells……………………… 186 Fig. 60(c) Effect of QTPM exposure on MOR gene expression in SH-SY5Y cells……………………… 186 Fig. 60(d) Summary of changes in MOR gene expression in SH-SY5Y cells treated with
tobacco extracts…………………………………………………………………………………………………….. 186 Fig. 61 MOR expression in cells treated for 5 days continuously or by refreshed regimen... 188 Fig. 62(a) Changes in MOR gene expression following treatment with mecamylamine…………. 189 Fig. 62(b) MOR gene expression following treatment with mecamylamine and tobacco
extracts………………………………………………………………………………………………………………….. 189 Fig. 63(a) Western blot of MOR protein in treated SH-SY5Y cells…………………………………………… 190 Fig. 63(b) Western blot of β-tubulin housekeeping protein in treated SH-SY5Y cells……………… 190 Fig. 63(c) Relative electrophoretic band density for MOR-stained Western blots………………….. 190
Chapter Nine
Fig. 64(a) PCR Efficiency plot for MAO-A primers…………………………………………………………………… 225 Fig. 64(b) PCR Efficiency plot for MAO-B primers…………………………………………………………………… 225 Fig. 64(c) PCR Efficiency plot for POLR2F primers..………………………………………………………………… 226 Fig. 64(d) PCR Efficiency plot for M-RIP primers……..……………………………………………………………… 226 Fig. 64(e) PCR Efficiency plot for GAPDH primers…………………………………………………………………… 226 Fig. 64(f) PCR Efficiency plot for eIF4A2 primers.…………………………………………………………………… 226 Fig. 64(g) PCR Efficiency plot for MOR primers….…………………………………………………………………… 226

- xiv -
- xv -
Index of Tables Table 1 Therapeutic monoamine oxidase inhibitors………………………………………..…………………. 15 Table 2 Monoamine oxidase inhibitors identified in tobacco smoke…….…………..................... 31 Table 3 Primary antibodies used for Western blotting………………………………………………………… 53 Table 4 Secondary antibodies used for Western blotting……………………………………………………. 53 Table 5 Primer pairs used for qRT-PCR……………………………………………………………………………….. 58 Table 6 IC50 figures for clorgyline and pargyline inhibition………………………………………………….. 78 Table 7 Nicotine and tar data for cigarette brands tested…………………………………………………... 95 Table 8 Nicotine and tar data for loose-leaf tobacco brands tested……………………………………. 96 Table 9 MAO-A IC50 values of TPM samples and corresponding nicotine concentrations…… 98 Table 10 MAO-B IC50 values of TPM samples and corresponding nicotine concentrations…… 99 Table 11 Tar concentrations of TPM samples……………………………………………………………………….. 100 Table 12 Enzyme reaction parameters for treated SH-SY5Y cells………………………………………….. 121 Table 13 Efficiency of primer pairs used for qRT-PCR……………………………………………………………. 149 Table 14 MAO-A and MAO-B gene expression in ethanol treated SH-SY5Y cells…………………… 152 Table 15 Summary of changes in MAO-A gene expression in SH-SY5Y cells………………………….. 155 Table 16 Summary of changes in MAO-B gene expression in SH-SY5Y cells…………………………… 157 Table 17 Comparison of MAO-A and MAO-B gene expression in U-118 MG and SH-SY5Y
cells………………………………………………………………………………………………………………………… 161 Table 18 MAO-A expression in SH-SY5Y cells treated with tobacco extracts and
mecamylamine………………………………………………………………………………………………………. 163 Table 19 Summary of MOR expression in ethanol treated SH-SY5Y cells………………………………. 184 Table 20 Summary of MOR gene expression in TPM treated SH-SY5Y cells…………………………… 187 Table 21 TPM sample numbering scheme and abbreviations……………………………………………….. 223
- xvi -
Abbreviations
BSA Bovine serum albumin
CNS Central nervous system
DA Dopamine
Da Dalton
DAT Dopamine transporter
ddH2O Double-distilled water
DEPC Diethyl-pyro carbonate
DOR Delta Opioid Receptor
eIF4A2 Eukaryotic initiation factor 4A isoform 2
EtOH Ethanol
FCS Fetal Calf Serum
GABA Gamma-aminobutyric acid
GAPDH Glyceraldehyde-3-phosphate dehydrogenase
GC-MS/MS Gas chromatography with tandem mass spectrometry
HPLC High performance liquid chromatography
HTPM Total Particulate Matter extract from Holiday brand cigarettes
kb Kilobases
MAO Monoamine oxidase
MAO-A Monoamine oxidase A
MAO-B Monoamine oxidase B
MOR Mu Opioid Receptor
M-RIP Myosin phosphatase-Rho interacting protein
NAcc Nucleus Accumbens
nAChR Nicotinic Acetylcholine Receptor
NET Norepinephrine transporter
Nic Nicotine
Oprm Mu Opioid Receptor gene
PBS Phosphate Buffered Saline (refer Appendix I)
PCR Polymerase Chain Reaction
POLR2F Polymerase (RNA) II (DNA directed) polypeptide F
qRT-PCR Quantitative real-time polymerase chain reaction
QTPM Total Particulate Matter extract from Quest® denicotinized cigarettes
RPMI-1640 Roswell Park Memorial Institute medium solution-1640
RT Reverse Transcription
RT Room temperature
RT-PCR Reverse transcription - polymerase chain reaction
SDS Sodium Diodecyl Sulphate
TBS Tris Buffered Saline (refer Appendix I)
TPM Total Particulate Matter
VTA Ventral Tegmental Area
- 1 -
Chapter One: Literature Review
Smoking is the leading cause of preventable illness in the world today. It is well known that
cigarette smoking increases the risks of developing numerous disorders, including
cardiovascular disease, stroke, hypertension, cancer, and respiratory disease. These and
other smoking-related illnesses are responsible for approximately five million deaths globally
each year (N. L. Benowitz, 2008).
Effective smoking cessation aids are essential to assist in reducing the prevalence of cigarette
smoking and smoking-related illness. Nicotine replacement therapies (NRT) are the most
widely used form of pharmacological intervention, but have proven to be remarkably
unsuccessful (Balfour & Fagerstrom, 1996). Some studies report only 7% of participants
successfully quit smoking after 6 months treatment with NRT (Jarvik et al., 2000). This is
indicative of the complex nature of tobacco dependence and suggests that factors other than
addiction to nicotine are responsible for the establishment and maintenance of tobacco
addiction.
Anecdotal evidence suggests that tobacco smoking is one of the hardest addictions to break.
Some studies have reported that of those individuals who have smoked at least one cigarette
in their lifetime, almost one third will develop a dependence on tobacco (Okuyemi et al.,
2000). Although the majority of smokers have expressed a desire to give up smoking - surveys
show that up to 70% of smokers have made attempts to quit - few are successful in their
attempts. Nicotine is accepted as the principal neurobiologically active compound in a
cocktail of over 4000 chemical compounds found in tobacco smoke (Fowles & Dybing, 2003).
However; a number of the non-nicotinic compounds in tobacco smoke have been identified,
and show psychopharmacologically relevant activity in the brain.
Although little information is known about how these compounds may interact to influence
tobacco addition, it is well known that the activity of monoamine oxidase (MAO), a key player
in the neurochemistry of many behaviors, is significantly inhibited in tobacco smokers (J. S.
Fowler et al., 1996a; J. S. Fowler et al., 1996b). Cigarette smokers show lowered levels of
MAO activity in the brain and peripheral organs compared to ex-smokers and non-smokers.

- 2 -
Since in vitro studies have shown that nicotine alone does not inhibit MAO activity, other
neurobiologically active compounds in tobacco smoke must inhibit MAO. Investigations into
this phenomenon have identified several compounds within cigarette smoke that reversibly or
irreversibly inhibit MAOs, and it has been proposed that this inhibition of MAO activity may
contribute to the reinforcement of tobacco addiction. If this is indeed the case, MAO
inhibitors show potential as effective pharmaceutical aids to assist with smoking cessation.
Additionally, recent evidence has suggested an indirect role for the µ opioid receptor (MOR) in
reinforcing the addictive properties of nicotine and tobacco. MOR is directly involved in the
establishment and maintenance of dependence to many drugs of abuse, including cocaine,
and morphine, and may also contribute to tobacco dependence. This may occur through
MOR’s influence on the endogenous opioid system, which is known to be involved in addiction
reinforcement and reward.
The mechanisms by which tobacco dependence is established and reinforced are not yet well
understood, but may involve addictive compounds within cigarette smoke in addition to
nicotine, or compounds that augment the addiction potential of nicotine directly or indirectly,
such as through the inhibition of MAO. Further investigation into the effects of the non-
nicotinic components of tobacco smoke on addictive behaviors and the contribution of these
compounds to relapse following successful smoking cessation may in turn lead to the
development of more successful smoking cessation therapies.
- 3 -
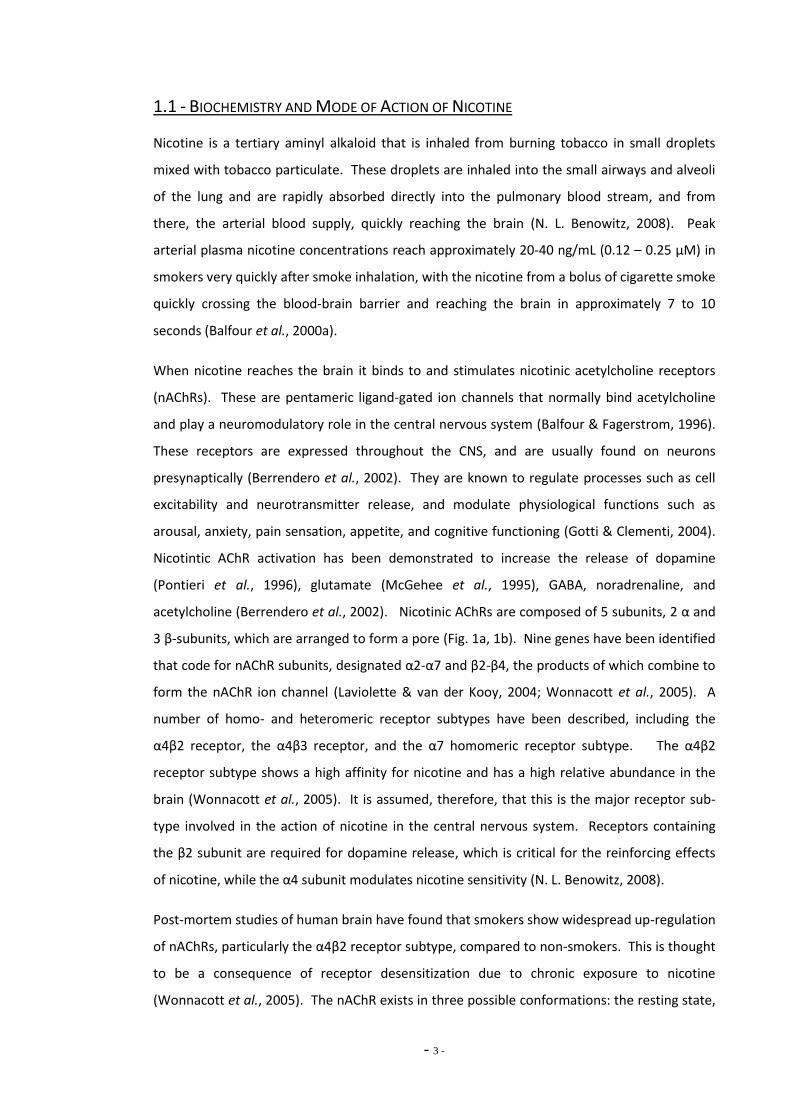
1.1 - BIOCHEMISTRY AND MODE OF ACTION OF NICOTINE
Nicotine is a tertiary aminyl alkaloid that is inhaled from burning tobacco in small droplets
mixed with tobacco particulate. These droplets are inhaled into the small airways and alveoli
of the lung and are rapidly absorbed directly into the pulmonary blood stream, and from
there, the arterial blood supply, quickly reaching the brain (N. L. Benowitz, 2008). Peak
arterial plasma nicotine concentrations reach approximately 20-40 ng/mL (0.12 – 0.25 µM) in
smokers very quickly after smoke inhalation, with the nicotine from a bolus of cigarette smoke
quickly crossing the blood-brain barrier and reaching the brain in approximately 7 to 10
seconds (Balfour et al., 2000a).
When nicotine reaches the brain it binds to and stimulates nicotinic acetylcholine receptors
(nAChRs). These are pentameric ligand-gated ion channels that normally bind acetylcholine
and play a neuromodulatory role in the central nervous system (Balfour & Fagerstrom, 1996).
These receptors are expressed throughout the CNS, and are usually found on neurons
presynaptically (Berrendero et al., 2002). They are known to regulate processes such as cell
excitability and neurotransmitter release, and modulate physiological functions such as
arousal, anxiety, pain sensation, appetite, and cognitive functioning (Gotti & Clementi, 2004).
Nicotintic AChR activation has been demonstrated to increase the release of dopamine
(Pontieri et al., 1996), glutamate (McGehee et al., 1995), GABA, noradrenaline, and
acetylcholine (Berrendero et al., 2002). Nicotinic AChRs are composed of 5 subunits, 2 α and
3 β-subunits, which are arranged to form a pore (Fig. 1a, 1b). Nine genes have been identified
that code for nAChR subunits, designated α2-α7 and β2-β4, the products of which combine to
form the nAChR ion channel (Laviolette & van der Kooy, 2004; Wonnacott et al., 2005). A
number of homo- and heteromeric receptor subtypes have been described, including the
α4β2 receptor, the α4β3 receptor, and the α7 homomeric receptor subtype. The α4β2
receptor subtype shows a high affinity for nicotine and has a high relative abundance in the
brain (Wonnacott et al., 2005). It is assumed, therefore, that this is the major receptor sub-
type involved in the action of nicotine in the central nervous system. Receptors containing
the β2 subunit are required for dopamine release, which is critical for the reinforcing effects
of nicotine, while the α4 subunit modulates nicotine sensitivity (N. L. Benowitz, 2008).
Post-mortem studies of human brain have found that smokers show widespread up-regulation
of nAChRs, particularly the α4β2 receptor subtype, compared to non-smokers. This is thought
to be a consequence of receptor desensitization due to chronic exposure to nicotine
(Wonnacott et al., 2005). The nAChR exists in three possible conformations: the resting state,

- 4 -
the active state and the desensitized state. The resting state receptor shows a low agonist
affinity and requires relatively high concentrations of nicotine to cause opening of the ion
channel. However, chronic stimulation of nAChRs with low concentrations of nicotine or
other agonists results in receptor desensitization, a state in which the receptor will no longer
respond to agonist binding. Desensitized receptors show a much higher affinity for nicotine
than resting receptors, and as a result, nicotine binding stabilizes the receptor in the
desensitized state (Quick & Lester, 2002). It has been proposed that receptor desensitization
on noradrenergic neurons may reduce the amount of noradrenaline released, and play a role
in the ‘tranquilizing’ effects of cigarette smoke reported by many smokers. Desensitization is
accompanied by an increase in receptor density due to a decreased rate of internalization and
degradation of the receptor. Studies in animals have confirmed that chronic nicotine
exposure causes desensitization of nAChRs (Wonnacott et al., 2005). It is thought that nAChR
desensitization and up-regulation may play a role in synaptic plasticity and learning, and likely
contributes to nicotine-mediated reward systems (Mansvelder et al., 2002; Quick & Lester,
2002).
(a) (a) (b)
Figure 1: (a) Diagrammatic representation of the nicotinic acetylcholine receptor subtype
localization in the plasma membrane. (b) α and β subunits of nicotinic acetylcholine receptors are
arranged in pentameric fashion to form a pore.
Nicotinic AChRs are found on the pre-synaptic cell membrane of many neurons, including
glutamatergic, dopaminergic, and noradrenergic neurons in the mesolimbic areas of the brain
(Laviolette & van der Kooy, 2004). Nicotine binds to pre-synaptic nAChRs through the α-
subunit of the receptor, which leads to a conformational change that opens the cation
channel. This causes the influx of Na+ , K+, and Ca2+ ions (Wonnacott et al., 2005), which in
turn leads to activation of voltage-dependent calcium channels, and further influx of Ca2+ ions
- 5 -
(N. L. Benowitz, 2008). Activation of neuronal nAChRs leads to the release of a host of
neurotransmitters, including dopamine, norepinephrine, serotonin, GABA, acetylcholine, and
β-endorphin. The various psychological and physiological effects of nicotine are mediated by
the downstream actions of these neurotransmitters. Physiologically, nicotine induces acute
increases in heart rate and blood pressure, vasoconstriction in the skin and coronary arteries,
and vasodilation in other areas, including skeletal muscle (Balfour et al., 2000a). However,
chronic nicotine use builds considerable tolerance to these physiological effects.
Psychologically, nicotine is known to elicit a pleasurable response, caused by increased
dopamine release. Additionally, nicotine increases arousal and cognitive enhancement,
through increases in norepinephrine and acetylcholine concentrations, and elevates mood,
and suppresses appetite due to increased serotonin release. It also reduces anxiety and pain
through GABA (γ-aminobutyric acid) and β-endorphin release (N. L. Benowitz, 2008).
Although nicotine causes complex changes in the concentrations of a number of
neurotransmitters in the brain, the dopaminergic system has been studied extensively
because of its proposed role in addictive behaviors. Nicotine is known to increase the
concentration of dopamine in the brain. Positron emission tomography (PET) scanning has
confirmed that dopamine activity is increased in the basal ganglia of smokers compared to
non-smokers (Salokangas et al., 2000), and that cigarette smoking elevates dopamine
concentrations in these mesolimbic brain areas (Barrett et al., 2004; Brody et al., 2004). This
has also been confirmed by microdialysis studies in animals, which have found that
physiologically relevant concentrations of nicotine increase extracellular dopamine
concentrations in the nucleus accumbens by two-fold (Di Chiara & Imperato, 1988; Pontieri et
al., 1996).
The mesolimbic areas of the brain include dopaminergic neurons projecting from the ventral
tegmental area (VTA) in the brainstem to the nucleus accumbens and caudate putamen (in
the striatum), prefrontal cortex, and amydala (Betz et al., 2000; Contet et al., 2004). Both high
and low affinity nAChRs have been identified on the cell bodies and terminals of dopaminergic
neurons in these regions (Balfour, 2002; Pontieri et al., 1996), as well as on inhibitory GABA-
ergic neurons and excitatory glutamatergic afferents that project to the VTA (Mansvelder et
al., 2002; Pidoplichko et al., 2004). Nicotine stimulates pre-synaptic nAChRs on dopaminergic
neurons in the ventral tegmental area (VTA) (Pidoplichko et al., 2004) – an area of the brain
known to be involved in addiction and reward mechanisms. These neurons project to the
shell of the nucleus accumbens, and their activation releases dopamine in that region

- 6 -
(Corrigall et al., 2000). The ability to cause dopamine overflow in the nucleus accumbens has
been linked to many drugs of abuse, including nicotine, amphetamine, and cocaine (Pontieri
et al., 1996), and is critical to the reinforcing properties of these drugs. It has been proposed
that this mechanism confers the addictive potential of the drugs, and these mechanisms will
be discussed in greater detail in section 1.2 of this thesis.
Nicotine activation of dopamine neurons in the VTA is enhanced by glutamatergic afferents,
and inhibited by GABA-ergic projections to this area (N. L. Benowitz, 2008). These
glutamatergic neurons express nAChRs that bind nicotine, and do not readily desensitize at
physiologically relevant concentrations, thus enhancing dopaminergic excitation. GABA-ergic
neurons projecting to the VTA inhibit dopamine excitation in this area; however, nicotine also
binds to nAChRs on these GABA-ergic neurons. These receptors are quickly desensitized by
nicotine, decreasing the GABA inhibition of dopamine neurons. These two mechanisms work
together to prolong the firing of dopaminergic neurons in response to nicotine (Pidoplichko et
al., 2004), potentially increasing nicotine’s addictive potential.
Chronic exposure to nicotine also causes a reduction in serotonin concentration in the
hippocampus (Balfour & Ridley, 2000). This reduction is limited strictly to the hippocampus
and is associated with reduced rates of serotonin synthesis. The consequences of this
localized serotonin reduction have yet to be elucidated; however, it has been proposed that
reduced serotonin may be associated with the reduced anxiety felt after smoking a cigarette,
as reported by smokers. Chronic reduction of serotonin release in the hippocampus causes
up-regulation of 5-HT1A receptors in this region, and stimulation of these receptors has been
implicated in the onset of anxiety. It has been proposed that upon cessation of smoking,
serotonin release is no longer suppressed by cigarette smoke. Thus, increased serotonin
levels stimulate 5HT1A receptors that are present at high density in the hippocampus (Balfour
& Ridley, 2000), causing the smoker to experience increased anxiety due to nicotine
withdrawal.
While nicotine binds to nAChRs, stimulating dopaminergic, serotonergic and noradrenergic
neurons to fire, and increases the concentrations of monoaminergic neurotransmitters in
areas of the brain associated with mood, pleasure, and reward, inhibition of the enzyme MAO
by compounds within cigarette smoke leads to further increases in the concentrations of
these neurotransmitters. Upon stimulation of nAChRs by nicotine, catecholamine
neurotransmitters such as dopamine and norepinephrine are released from the terminal
bouton of the neuron into the synaptic cleft (Salminen et al., 2004; Wonnacott et al., 2005).
- 7 -
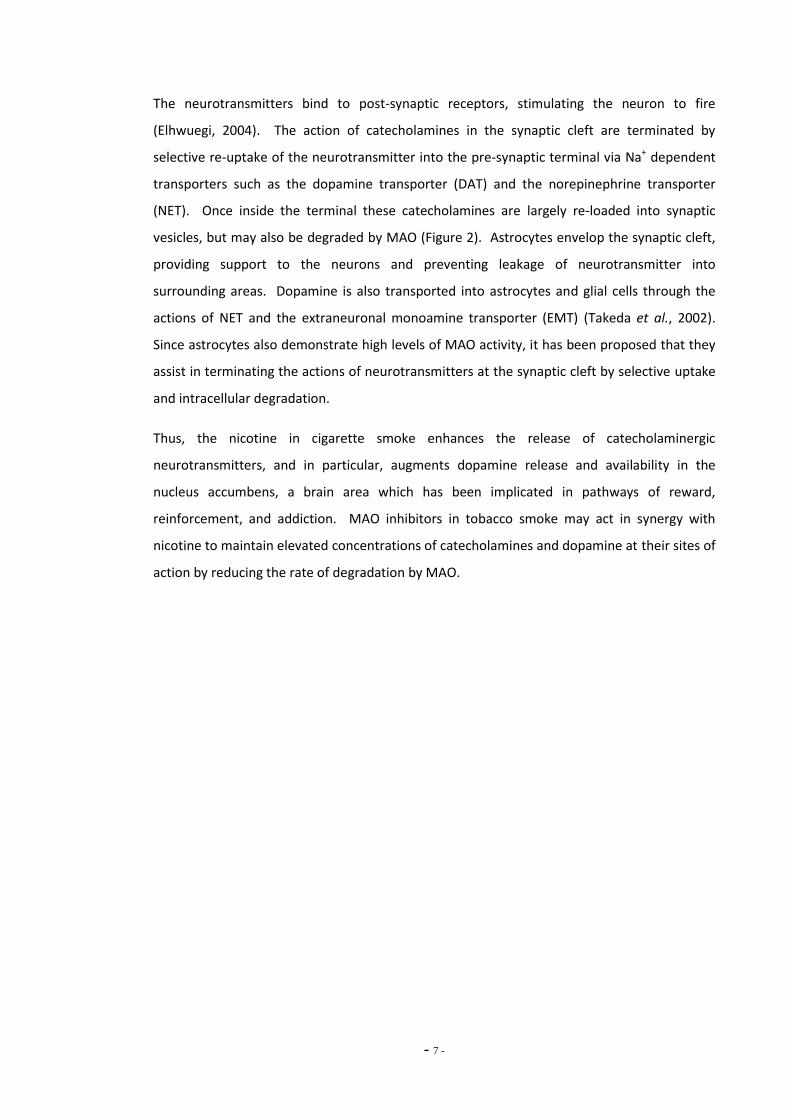
The neurotransmitters bind to post-synaptic receptors, stimulating the neuron to fire
(Elhwuegi, 2004). The action of catecholamines in the synaptic cleft are terminated by
selective re-uptake of the neurotransmitter into the pre-synaptic terminal via Na+ dependent
transporters such as the dopamine transporter (DAT) and the norepinephrine transporter
(NET). Once inside the terminal these catecholamines are largely re-loaded into synaptic
vesicles, but may also be degraded by MAO (Figure 2). Astrocytes envelop the synaptic cleft,
providing support to the neurons and preventing leakage of neurotransmitter into
surrounding areas. Dopamine is also transported into astrocytes and glial cells through the
actions of NET and the extraneuronal monoamine transporter (EMT) (Takeda et al., 2002).
Since astrocytes also demonstrate high levels of MAO activity, it has been proposed that they
assist in terminating the actions of neurotransmitters at the synaptic cleft by selective uptake
and intracellular degradation.
Thus, the nicotine in cigarette smoke enhances the release of catecholaminergic
neurotransmitters, and in particular, augments dopamine release and availability in the
nucleus accumbens, a brain area which has been implicated in pathways of reward,
reinforcement, and addiction. MAO inhibitors in tobacco smoke may act in synergy with
nicotine to maintain elevated concentrations of catecholamines and dopamine at their sites of
action by reducing the rate of degradation by MAO.
- 8 -
Figure 2: Nicotine binds to nAChRs, causing a conformational change and opening of the cation channel. Sodium,
potassium and calcium cations flow into the neuron, causing depolarization and neuronal firing. Dopamine released at
the synapse transmits the signal post-synaptically before reuptake by DAT. MAO acts to degrade dopamine in the
neuron or astrocytes which surround the synapse.
- 9 -
1.2 - MECHANISMS OF ADDICTION
Nicotine displays a number of psychopharmacological characteristics in common with other
addictive drugs, such as cocaine and amphetamines. Nicotine administration causes arousal
and increased locomotor activity and elicits pleasant or rewarding effects in the brain that
reinforce self-administration behavior. Following chronic exposure to nicotine, cessation of
administration causes a withdrawal syndrome that an addict seeks to avoid by continued
administration of the drug (Balfour, 2002; N. L. Benowitz, 2008). Interestingly, nicotine alone
is a relatively weak reinforcer in animal models of addiction compared to other drugs of abuse
such as amphetamine and cocaine (Benwell & Balfour, 1992). The neurobiological
mechanisms underpinning drug addiction and the psychoactive properties of nicotine are very
complex and knowledge of these mechanisms is still developing.
Drug addiction is best described as a chronic relapsing disorder of compulsive drug use
without a medical reason that results from gradual adaptations of the brain to repeated drug
exposure (Betz et al., 2000; Contet et al., 2004). Current understanding suggests that drug
addiction arises from repeated and abnormal stimulation of the brain’s natural reward
pathways by exogenous compounds, leading to deregulation of these reward pathways. This
manifests as drug dependence, tolerance, drug-seeking behaviour, drug-craving, and
withdrawal. The functioning of reward pathways in both natural and addiction paradigms
involves many neurotransmitter systems, including the dopaminergic system and the
endogenous opioid system – both of which have been studied extensively for their roles in
establishing and maintaining addiction.
Naturally reinforcing stimuli such as food, water, and sex have the ability to motivate complex
behaviours and increase dopamine transmission in the nucleus accumbens (Tanda & Di Chiara,
1998), an area of the brain that is intrinsically linked with mechanisms of reward and
reinforcement. Exogenous drugs abused by humans, including nicotine also induce dopamine
release in the nucleus accumbens (Balfour et al., 2000b; Pidoplichko et al., 1997; Pontieri et
al., 1996). It is widely held that drugs of abuse activate the same reward pathways and
neurotransmitter systems as natural reinforcers, but while natural reinforcers activate these
pathways through indirect peripheral sensory mechanisms, drugs of abuse activate these
pathways in the brain by direct neurochemical means (Tanda & Di Chiara, 1998). The direct
neurochemical activation of these pathways could explain why drugs like morphine, cocaine,
and nicotine are so addictive but food generally is not. These neurobiological mechanisms of
- 10 -
addiction, reward, and reinforcement have been studied by many methods, including direct
monitoring of the neurotransmitter systems involved, usually through microdialysis and
electrophysiology studies. Other types of investigation involve pharmacologic manipulation of
receptor systems, by careful application and comparison of the effects of agonists and
antagonists, as well as behavioural studies in animal models of addiction.
Although drugs abused by humans have diverse pharmacological properties (for example CNS
depressants, psychostimulants, and analgesics), and act primarily through varied mechanisms,
there is strong evidence that they all activate a common dopaminergic pathway that mediates
the rewarding properties of the drug, and establishes drug reinforcement and dependence.
Drugs of abuse elicit increased dopamine transmission in the nucleus accumbens, activating
the mesolimbic dopamine pathway. The mesolimbic areas of the brain include the nucleus
accumbens, caudate putamen, ventral tegmental area, substantia nigra, pre-frontal cortex,
and the basolateral amygdala (McGehee, 2006). Specifically, the dopamine pathway links the
ventral tegmental area in the midbrain with the nucleus accumbens in the striatum. These
brain regions are thought to mediate pleasure, motivation, and reward and facilitate
behavioural responses to rewarding stimuli (Balfour, 2002).
Dopamine plays a neuromodulatory role in the central nervous system and exerts its effects
through binding to the G-protein-coupled dopamine receptors D1 and D2. This important
neurotransmitter is thought to play different roles in mediating behaviour depending on the
brain area where it is released. The nucleus accumbens is an area of the midbrain that has
repeatedly been shown to be involved in mechanisms of reward and addiction. Natural
stimuli are known to increase dopamine transmission in this region, but drugs of abuse have
been shown to elicit larger and more prolonged increases in dopamine release. It is thought
that this promotes the acquisition of behaviours that result in drug administration and
establishment of dependence (Balfour, 2002).
Electrophysiological studies have shown that resting midbrain dopamine neurons fire at low
frequency (~4 Hz), maintaining dopaminergic tone (Britt & McGehee, 2008), but change to a
burst firing pattern in response to rewarding stimuli. This change to a rapid pattern of
neuronal firing overwhelms dopamine transporters (DAT) in the area, leading to increased
extracellular dopamine concentrations and dopamine overflow. In the striatum, nicotine has
been demonstrated to inhibit dopamine overflow induced by low-frequency neuronal firing
but elicits dopamine overflow by stimulating burst firing (Britt & McGehee, 2008).
Behavioural studies have shown a relationship between rapid burst firing in dopamine
- 11 -
neurons and discrete learning events. It is thought that burst firing and dopamine overflow in
the nucleus accumbens may contribute to the acquisition and establishment of drug
dependence.
The nucleus accumbens (NAcc) can be divided into two areas, the shell and the core, which
are anatomically and functionally distinct (Balfour, 2002). The shell is an extension of the
amygdala, which is associated with pathways of motivation and reward; whereas, the core is
related to the striatum and has neuronal projections to areas of the brain involved in motor
function control (Balfour et al., 2000b). It has been reported that drugs of abuse
preferentially increase dopamine transmission in the outer shell of the NAcc (Di Chiara et al.,
2004; Pontieri et al., 1996), and this is associated with the reinforcing potential of the drug. In
contrast, dopamine release in the core of the accumbens has been associated with the
behavioural sensitization of the locomotor effects induced by drugs of abuse. In common
with other psychostimulant drugs, nicotine causes increased locomotor activity in laboratory
animals at doses relevant to human use (Benwell & Balfour, 1992; Cadoni & Di Chiara, 2000).
Repeated exposures to nicotine progressively and significantly increase locomotor activity,
referred to as behavioral sensitization. Benwell & Balfour (1992) observed a dose-dependent
increase in locomotor activity in rats treated acutely with nicotine, increasing activity by 100-
150%. Following 5 days pre-treatment with nicotine, locomotor activity increased 300% in
rats given a challenge dose of nicotine, and extracellular dopamine concentrations in the
accumbens were measured at 200% of baseline by microdialysis. Cadoni & Di Chiara (2000)
later observed increased locomotor activity in nicotine pre-treated rats compared to saline
pre-treated animals, when given a challenge dose of nicotine. This was correlated with
significantly increased dopamine release in the accumbal core, when compared to saline-
pretreated rats. However, nicotine sensitized animals showed lower levels of dopamine
release in the shell of the accumbens compared to their saline treated counterparts (Cadoni &
Di Chiara, 2000).
While dopamine release in the shell of the accumbens has been correlated with self-
administration and reinforcement of drugs of abuse, it is still unclear what role this
mechanism might play in establishing addiction. It has previously been widely assumed that
this dopamine release mediates the pleasurable or euphoriant properties of psychostimulant
drugs; however, this view is changing (Balfour et al., 2000b). It has been suggested that the
primary role of dopamine increase in the accumbal shell is to facilitate stimulus-reward
associations and the attribution of positive incentive salience to neutral cues associated with
- 12 -
drug reward. That is, increased drug administration results in greater motivation and desire to
receive more drug reward. Balfour (2000b) and Di Chiara (1998) propose that addiction to
psychostimulant drugs is linked to overflow of dopamine in the nucleus accumbens that is
greater and more prolonged than that elicited by natural rewards, and as a result, cues and
activities associated with repeated drug-taking achieve abnormally strong salience.
Additionally, in a study conducted by Tanda and Di Chiara (1998) into the stimulation of
dopamine transmission in the rat nucleus accumbens it was postulated that dopamine release
in the nucleus accumbens was associated with relative novelty of the stimulus. This study
found dopamine release in the accumbens was elicited by nicotine administration, but also by
a novel palatable food source. It was noted that the dopamine response elicited by food
showed rapid habituation; whereas, the dopamine response to nicotine did not. Therefore,
Tanda & Di Chiara (1998) hypothesized that accumbal dopamine release was associated with
acquisition of reward motivation and positive motivational learning. This leads to otherwise
neutral stimuli becoming incentives for motivated behaviours as a result of their association
with the rewarding stimuli. That is, dopamine release in the accumbens may facilitate the
acquisition and maintenance of drug-seeking behaviours, in agreement with the previous
hypothesis stated by Balfour (2000b) and Di Chiara (1998). Tanda & Di Chiara (1998) suggest
that food is not generally an addictive stimulus because of the rapid habituation to this
stimulus, but in contrast, drugs of abuse activate dopamine transmission, causing greater and
more sustained overflow with repeated administration. This is thought to result in
strengthening of abnormal motivational learning processes resulting in drug-seeking behavior.
In addition to the dopamine hypothesis of dependence, it has been proposed that inhibition
of MAO by compounds in cigarette smoke contributes synergistically with nicotine to
reinforce addiction by maintaining increased dopamine concentrations in brain regions
associated with addiction and reinforcement. Recent in vivo research in rats has supported
this hypothesis (A. S. Villegier et al., 2003). In this study, behavioral sensitization was reported
in rats treated with D-amphetamine, nicotine, or nicotine in conjunction with the irreversible
MAO-B inhibitors pargyline or tranylcypromine. As discussed above, increased dopamine
release in the accumbens induced by D-amphetamine, nicotine, and other drugs of abuse
causes locomotor hyperactivity in rats, and repeated exposure causes behavioural
sensitization. Villegier et al. showed that a challenge dose of D-amphetamine induced
behavioral sensitization in pre-treated rats after up to 30 days withdrawal. However, 30 days
of withdrawal abolished behavioral sensitization in nicotine-treated rats. It was noted that
nicotine alone induced only a transient behavioral sensitization, but when nicotine was co-
- 13 -
administered with the MAO inhibitors tranylcypromine or pargyline, behavioral sensitization
to nicotine was maintained for up to 90 days. This suggests that MAO inhibitors may
contribute to the addictive potential of nicotine in tobacco dependence.
More recently, it was reported that inhibition of MAO significantly increased the motivation of
rats to self-administer nicotine (Guillem et al., 2005). This study utilized an animal self-
administration model in which rats are trained to perform a task (usually pressing a lever or
poking their nose through a hole) to receive a dose of drug through an indwelling catheter.
This model can be used to assess the relative reinforcing properties of drugs of abuse by
recording the number of lever presses the animal will perform in order to receive a drug
reward (Roth-Deri et al., 2008). Rats that were pre-treated with tranylcypromine and
phenelzine freely self-administered more nicotine than placebo-treated animals. It was also
noted that rats treated with MAO inhibitors were willing to work harder by performing more
lever presses to obtain a dose of nicotine than control rats. This study confirmed that MAO
inhibitors did not alter the pharmacodynamic properties of nicotine and did not interfere with
the psychostimulant action of nicotine, but they dramatically increased nicotine’s reinforcing
properties (Guillem et al., 2005). These results suggest that the MAO inhibitory action of non-
nicotinic compounds in tobacco smoke may act synergistically with nicotine to establish and
maintain tobacco dependence by increasing nicotine’s reinforcement potential.
1.3 - INTRODUCTION TO MONOAMINE OXIDASE
1.3.1 – General Introduction
Since the discovery that inhibitors of MAO have an anti-depressive effect (Edmondson et al.,
2004b; Pare & Sandler, 1959; Sainz, 1960), extensive research has been conducted into the
function and influence of these enzymes in the mammalian central nervous system.
Monoamine oxidases are flavin adenosine dinucleotide (FAD)-containing enzymes that are
integral proteins found in the mitochondrial outer membrane (Abell & Kwan, 2001; Binda et
al., 2002). MAO catalyses the oxidative deamination of many biogenic amines and plays a
vital role in the regulation of neurotransmitters in the mammalian central nervous system,
including regulation of synaptic concentrations of serotonin, dopamine, norepinephrine and
other catecholaminergic neurotransmitters. The concentrations of these neurotransmitters

- 14 -
contribute to the regulation of mood, movement, memory and arousal (Nagatsu, 2004). MAO
also has an important function in breaking down exogenous sympathomimetic amines
ingested in the diet, including tyramine, tryptamine and phenylethylamine (Abell & Kwan,
2001; Berry et al., 1994; Weyler et al., 1990).
In the reaction catalyzed by MAO the monoamine substrate binds to the active site on the
enzyme and is oxidised to an imine intermediate, with the covalently bound FAD being
reduced to FADH2. FADH2 then reacts with molecular oxygen and converted to FAD,
producing hydrogen peroxide as a by-product (Fig. 3). The imine dissociates from MAO and is
hydrolysed to form an aldehyde intermediate and NH4+ (Edmondson et al., 2009). The
aldehyde is then rapidly oxidized by aldehyde dehydrogenase or aldehyde reductase.
Figure 3: The reaction catalyzed by monoamine oxidase. A monoamine substrate is oxidatively
deaminated to form an aldehyde product with hydrogen peroxide as a by-product.
Two isoforms of MAO are known to exist in mammals, designated MAO-A and MAO-B. These
isoforms were originally distinguished by their differences in substrate and inhibitor
specificities. MAO-A preferentially deaminates serotonin and norepinephrine; whereas, MAO-
B catabolises phenylethylamine and benzylamine. Dopamine, tyramine and tryptamine are

- 15 -
metabolized by both isozymes, depending on enzyme and substrate concentrations (O'Carroll
et al., 1983). These substrate specificities are not absolute but are relative to the
concentration of substrate; thus, MAO-A and B substrate and inhibitor specificities overlap at
high substrate concentrations under favourable conditions (Berry et al., 1994; Konradi et al.,
1989). No compound has yet been identified that shows absolute specificity for either
isozyme. However, MAO-A is selectively and irreversibly inhibited by clorgyline and
moclobemide at low concentrations; whereas, MAO-B is specifically inactivated by deprenyl
and pargyline at low concentrations (Yamada & Yasuhara, 2004) (Table 1). Despite the
limitation of non-specificity at high concentrations, these inhibitors have been used
successfully to distinguish the activity of each enzyme in vivo and in vitro.
Dysfunction of MAO is thought to be associated with the etiology of a number of neurological
disorders, including Parkinson’s disease (Baron, 1986; Checkoway et al., 1998; Morens et al.,
1995), Alzheimer’s disease (Emilsson et al., 2002; Riederer et al., 2004), Huntington’s disease
(Sandler et al., 1981), major depression (Covey et al., 1997; J. E. Rose et al., 2001), and
schizophrenia (Simpson et al., 1999). MAO inhibitors are used therapeutically in humans for
treatment of severe depression and treatment of the symptoms and progression of
Parkinson’s and Alzheimer’s disease (Yamada & Yasuhara, 2004).
Table 1: Therapeutic monoamine oxidase inhibitors
Inhibitor Inhibition Clinical Application Reference
Phenelzine Non-selective, irreversible
Antidepressant (Guillem et al., 2005)
Tranylcypromine Non-selective, irreversible
Antidepressant (Youdim & Finberg, 1987)
Clorgyline MAO-A, irreversible
(Yamada & Yasuhara, 2004)
Moclobemide MAO-A, reversible Antidepressant; Alzheimer’s disease; Smoking cessation?
(Berlin et al., 1995a; Yamada & Yasuhara, 2004)
Deprenyl (selegiline)
MAO-B, irreversible
Parkinson’s disease; Alzheimer’s disease; Smoking cessation?
(Biberman et al., 2003; Sano et al., 1997; Yamada & Yasuhara, 2004; P. H. Yu et al., 1992)
Pargyline MAO-B, irreversible
(Yamada & Yasuhara, 2004)
- 16 -
1.3.2 - Enzyme Structure
The primary protein structures of MAO-A and B have been deduced from sequence data
following cDNA cloning. Both isozymes are highly conserved, with the amino acid sequences
of the two isoforms showing 70% sequence identity (Abell & Kwan, 2001; Bach et al., 1988).
Functional MAO-A and B proteins are thought to consist of two identical subunits each, with
molecular weights of 59 kDa and 58 kDa, respectively (Shih et al., 1999). FAD is covalently
bound to the enzyme, and is essential for enzyme function. Each subunit is bound to one FAD
molecule at a conserved pentapeptide sequence to form the active enzyme. The
pentapeptide sequence comprises the residues Ser-Gly-Gly-Cys-Tyr, with the FAD molecule
linked through the cysteine residue by a sulfhydryl bond. The FAD linkage site is located at
position 406 in MAO-A and 397 in MAO-B (Bach et al., 1988; Z. Y. Chen et al., 1991;
Edmondson et al., 2004a). This pentapeptide sequence is highly conserved in MAO proteins
between species.
Studies using site-directed mutagenesis have identified four highly conserved regions believed
to be vital for enzyme function (Shih et al., 1999). These comprise the FAD attachment site
described above, a putative substrate binding domain, an ADP binding β-α-β site, and a C-
terminal membrane-associated α-helix (Bach et al., 1988; Shih et al., 1999). The crystal
structure of MAO-B reveals that the C-terminal membrane-spanning α-helix anchors the
protein to the mitochondrial outer membrane (Binda et al., 2004).
The substrate binding domain is thought to be located at residues 178-221, and replacement
of residues 161-375 of MAO-A with those of MAO-B changes the substrate and inhibitor
specificity of the enzyme to those of the B isoform (Shih et al., 1999). Using rat MAO it was
found that substitution of Phe-208 in MAO-A with Ile, as found at this position in MAO-B, was
also sufficient to change the substrate selectivity of MAO-A to that of B, and the selectivity of
MAO-B to A if Ile was replaced with Phe at this position.
Although monoamine oxidases are integral membrane proteins found in the mitochondria,
they are coded for by two distinct genes on the X chromosome (Grimsby et al., 1991). It has
been confirmed that MAO is synthesized in the cytoplasm of the cell rather than in the
mitochondrion. The synthesized protein contains a C-terminal non-cleavable targeting
sequence that is inserted into the mitochondrial membrane by ubiquitin in an ATP-dependent
process (Mitoma & Ito, 1992; Zhuang et al., 1992). This 32-amino acid sequence forms the α-
helix that anchors the MAO protein to the mitochondrial membrane. Because of its vital
- 17 -
importance in enzyme function, this sequence is highly conserved between A and B isoforms
and between species (Binda et al., 2004; Edmondson et al., 2004b).
1.3.3 - Gene Structure
Human MAO-A and MAO-B are both located on the short arm of the X chromosome at
positions Xp11.23 and Xp22.1, respectively (K. Chen, 2004). The genes are arranged in tail-to-
tail orientation and show identical intron-exon organization, comprising 15 exons each
(Grimsby et al., 1991). This suggests that the MAO-A and B genes were derived by duplication
of a single ancestral gene. Exon 12, which codes for the FAD-binding region, has been
identified as the most highly conserved exon, showing 93.9% sequence identity between
MAO-A and B.
The MAO-A and B gene promoter regions are also highly conserved, sharing approximately
60% sequence homology. Both promoters consist of GC-rich regions; however, organization
of transcription elements between these two regions is notably different. The MAO-A
promoter consists of three Sp1 elements, shows bi-directional promoter activity, and lacks a
TATA box (Shih et al., 1999; Zhu et al., 1992). Three putative glucocorticoid response
elements have also been identified, explaining why MAO-A expression has been found to
increase after dexamethasone treatment. The MAO-B promoter contains two clusters of Sp1
elements separated by a CACCC motif (Zhu et al., 1992). It has been proposed that the
different organization of MAO-A and B promoter regions may underlie the observed
differences in tissue- and cell-specific expression (K. Chen, 2004; Zhu et al., 1992).
- 18 -
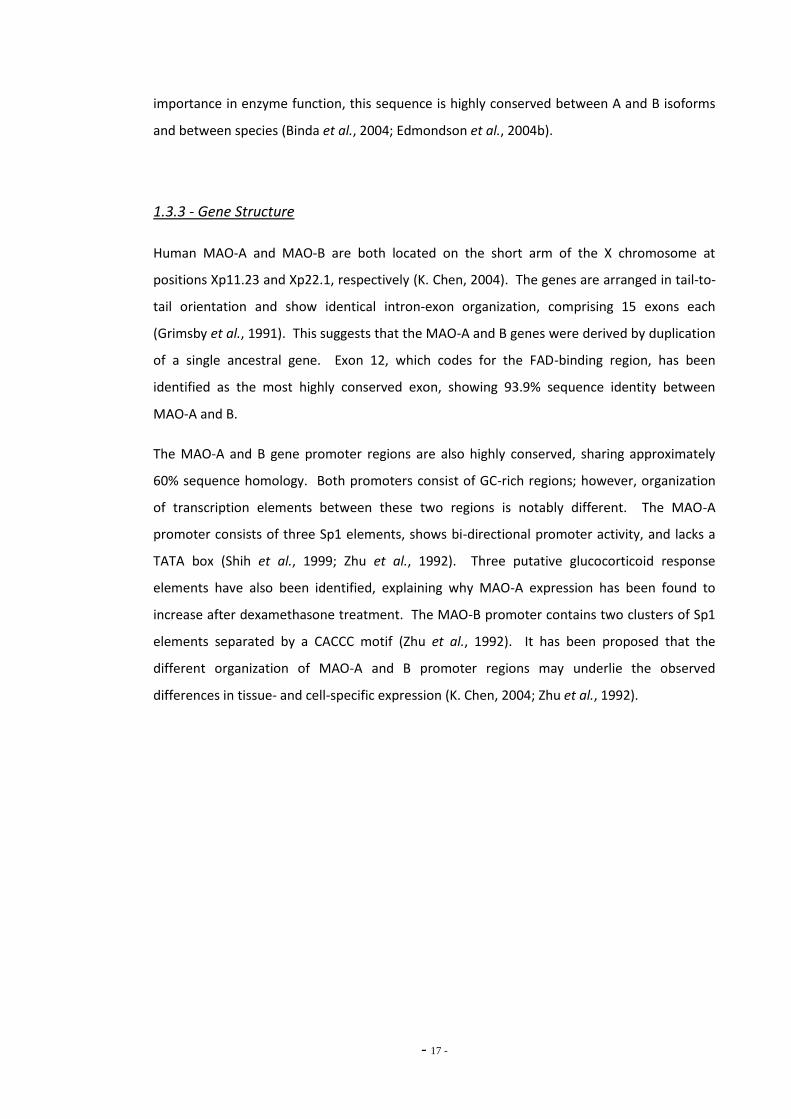
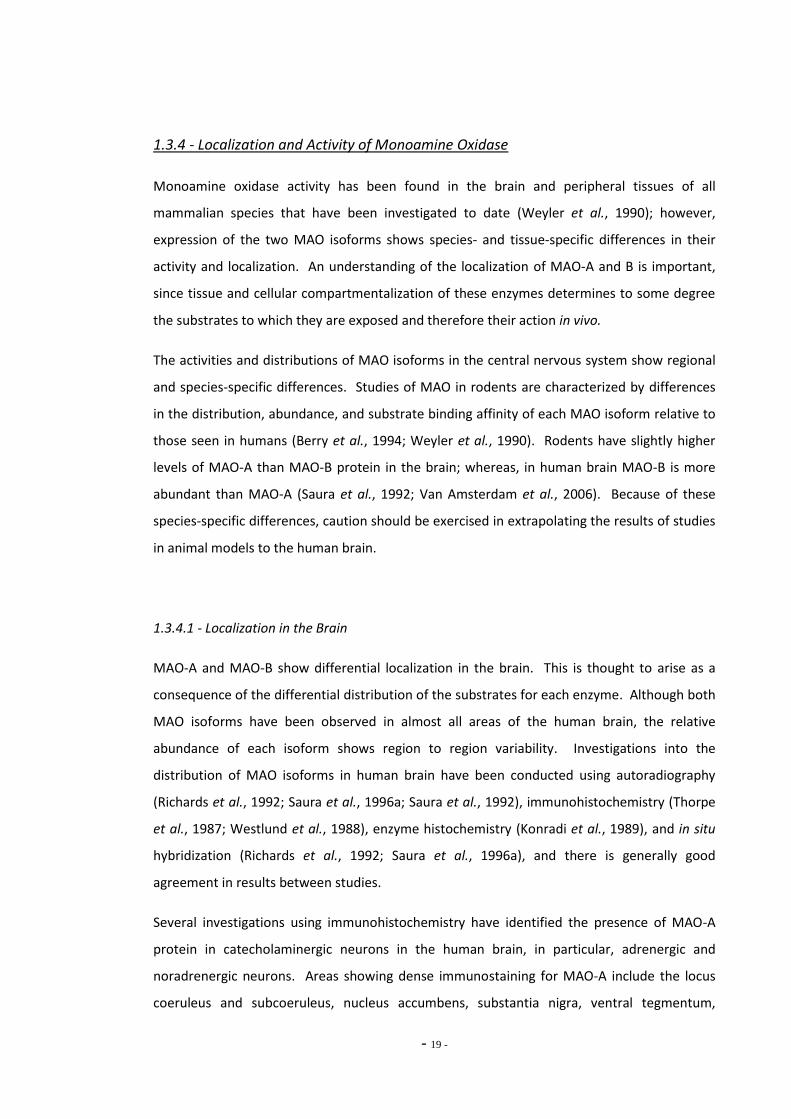
(a) (b)
Figure 4(a): Molecular schematic of monoamine oxidase A. Two MAO-
A units are positioned on top of each other, each with one molecule of
FAD bound.
(Reproduced from De Colibus et al. (2005) Three dimensional structure
of monoamine oxidase A (MAOA): relations to the structures of rat
MAOA and human MAOB. Proceedings of the National Academy of
Sciences, USA, 102(36), 12684-12689.)
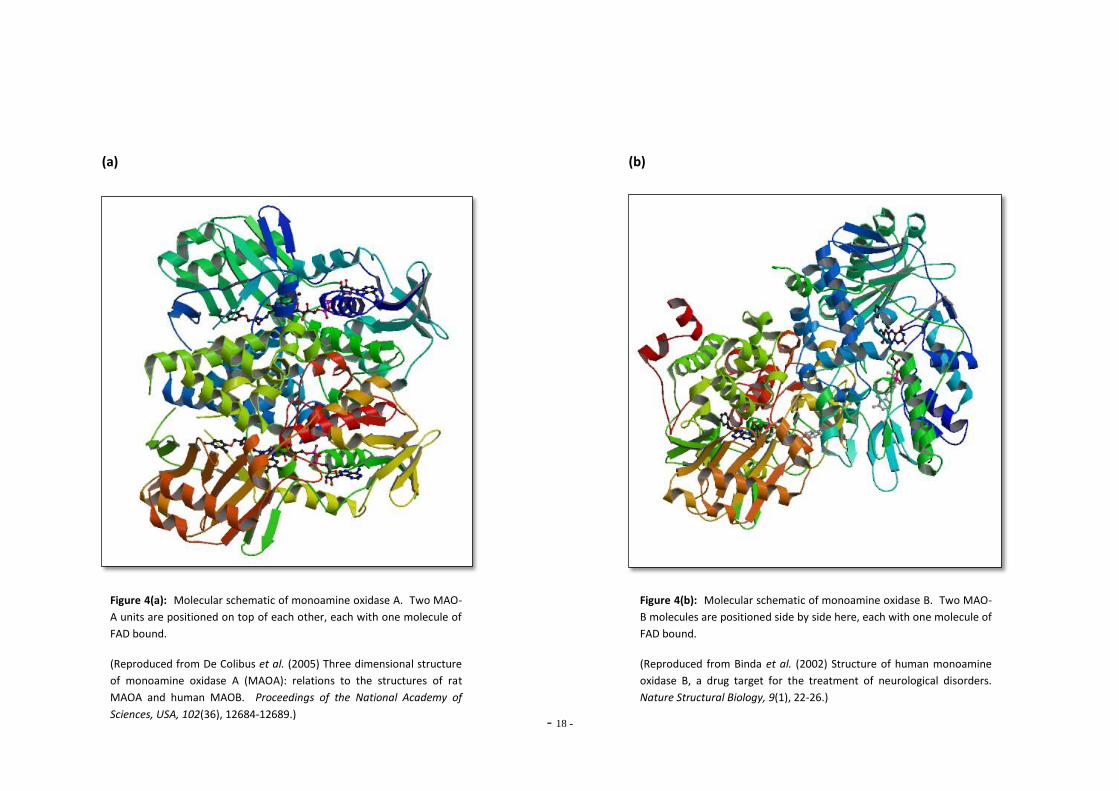
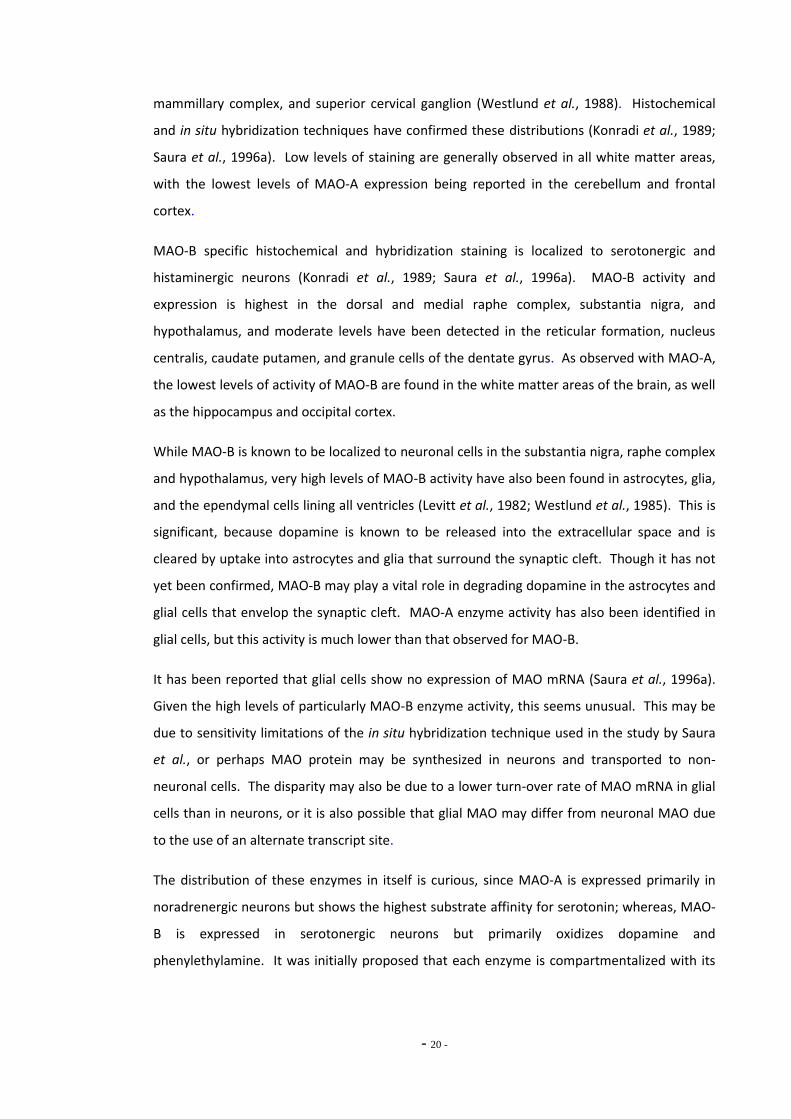
Figure 4(b): Molecular schematic of monoamine oxidase B. Two MAO-
B molecules are positioned side by side here, each with one molecule of
FAD bound.
(Reproduced from Binda et al. (2002) Structure of human monoamine
oxidase B, a drug target for the treatment of neurological disorders.
Nature Structural Biology, 9(1), 22-26.)
- 19 -
1.3.4 - Localization and Activity of Monoamine Oxidase
Monoamine oxidase activity has been found in the brain and peripheral tissues of all
mammalian species that have been investigated to date (Weyler et al., 1990); however,
expression of the two MAO isoforms shows species- and tissue-specific differences in their
activity and localization. An understanding of the localization of MAO-A and B is important,
since tissue and cellular compartmentalization of these enzymes determines to some degree
the substrates to which they are exposed and therefore their action in vivo.
The activities and distributions of MAO isoforms in the central nervous system show regional
and species-specific differences. Studies of MAO in rodents are characterized by differences
in the distribution, abundance, and substrate binding affinity of each MAO isoform relative to
those seen in humans (Berry et al., 1994; Weyler et al., 1990). Rodents have slightly higher
levels of MAO-A than MAO-B protein in the brain; whereas, in human brain MAO-B is more
abundant than MAO-A (Saura et al., 1992; Van Amsterdam et al., 2006). Because of these
species-specific differences, caution should be exercised in extrapolating the results of studies
in animal models to the human brain.
1.3.4.1 - Localization in the Brain
MAO-A and MAO-B show differential localization in the brain. This is thought to arise as a
consequence of the differential distribution of the substrates for each enzyme. Although both
MAO isoforms have been observed in almost all areas of the human brain, the relative
abundance of each isoform shows region to region variability. Investigations into the
distribution of MAO isoforms in human brain have been conducted using autoradiography
(Richards et al., 1992; Saura et al., 1996a; Saura et al., 1992), immunohistochemistry (Thorpe
et al., 1987; Westlund et al., 1988), enzyme histochemistry (Konradi et al., 1989), and in situ
hybridization (Richards et al., 1992; Saura et al., 1996a), and there is generally good
agreement in results between studies.
Several investigations using immunohistochemistry have identified the presence of MAO-A
protein in catecholaminergic neurons in the human brain, in particular, adrenergic and
noradrenergic neurons. Areas showing dense immunostaining for MAO-A include the locus
coeruleus and subcoeruleus, nucleus accumbens, substantia nigra, ventral tegmentum,
- 20 -
mammillary complex, and superior cervical ganglion (Westlund et al., 1988). Histochemical
and in situ hybridization techniques have confirmed these distributions (Konradi et al., 1989;
Saura et al., 1996a). Low levels of staining are generally observed in all white matter areas,
with the lowest levels of MAO-A expression being reported in the cerebellum and frontal
cortex.
MAO-B specific histochemical and hybridization staining is localized to serotonergic and
histaminergic neurons (Konradi et al., 1989; Saura et al., 1996a). MAO-B activity and
expression is highest in the dorsal and medial raphe complex, substantia nigra, and
hypothalamus, and moderate levels have been detected in the reticular formation, nucleus
centralis, caudate putamen, and granule cells of the dentate gyrus. As observed with MAO-A,
the lowest levels of activity of MAO-B are found in the white matter areas of the brain, as well
as the hippocampus and occipital cortex.
While MAO-B is known to be localized to neuronal cells in the substantia nigra, raphe complex
and hypothalamus, very high levels of MAO-B activity have also been found in astrocytes, glia,
and the ependymal cells lining all ventricles (Levitt et al., 1982; Westlund et al., 1985). This is
significant, because dopamine is known to be released into the extracellular space and is
cleared by uptake into astrocytes and glia that surround the synaptic cleft. Though it has not
yet been confirmed, MAO-B may play a vital role in degrading dopamine in the astrocytes and
glial cells that envelop the synaptic cleft. MAO-A enzyme activity has also been identified in
glial cells, but this activity is much lower than that observed for MAO-B.
It has been reported that glial cells show no expression of MAO mRNA (Saura et al., 1996a).
Given the high levels of particularly MAO-B enzyme activity, this seems unusual. This may be
due to sensitivity limitations of the in situ hybridization technique used in the study by Saura
et al., or perhaps MAO protein may be synthesized in neurons and transported to non-
neuronal cells. The disparity may also be due to a lower turn-over rate of MAO mRNA in glial
cells than in neurons, or it is also possible that glial MAO may differ from neuronal MAO due
to the use of an alternate transcript site.
The distribution of these enzymes in itself is curious, since MAO-A is expressed primarily in
noradrenergic neurons but shows the highest substrate affinity for serotonin; whereas, MAO-
B is expressed in serotonergic neurons but primarily oxidizes dopamine and
phenylethylamine. It was initially proposed that each enzyme is compartmentalized with its
- 21 -
preferred substrate in specific regions of the brain; however, evidence gathered to date
contradicts this hypothesis (Konradi et al., 1989).
MAO has been proposed to play two vital physiological roles in the brain. First, MAO may
facilitate uptake of monoamine neurotransmitters from the synaptic cleft into the neuron by
maintaining a low cytosolic concentration of these monoamines in neurons (Fig. 2); and
second, MAO may play a role in reducing the effects of neurotransmitters and other amines
that gain inappropriate entry into neurons. MAO may act to protect the neuron from
stimulation by extraneous amines that may interfere with uptake and storage of the natural
neurotransmitters (Richards et al., 1992; Thorpe et al., 1987). These mechanisms may also
ensure that dopaminergic neurons use only dopamine for neural transmission, and
serotonergic neurons only serotonin.
The role played by MAO in dopaminergic neural transmission has not been clearly defined,
and there is some contention over which MAO isoform degrades this important
neurotransmitter. The dopaminergic system mediates many vital neurological systems and is
involved in mechanisms of reward and addiction (Di Chiara et al., 2004; Pontieri et al., 1996).
In vitro studies have confirmed that dopamine is a substrate for both MAO-A and MAO-B, with
Km values of approximately 240 µM and 128 µM, respectively (Edmondson et al., 2009). While
MAO-A preferentially degrades dopamine in the rodent, it is generally accepted that
dopamine is metabolized by both enzymes in the human brain (O'Carroll et al., 1983) and that
both isoforms will oxidize dopamine in proportion to their enzyme concentrations (Oreland,
1993).
While moderate levels of MAO-A mRNA have been detected in dopaminergic neurons of the
substantia nigra and ventral tegmentum in rodents (Jahng et al., 1997), this distribution has
yet to be confirmed in human brain. A number of histochemical studies have failed to find
MAO activity of either isoform localized within dopaminergic neurons in humans (Konradi et
al., 1989; Saura et al., 1996a). Another study detected very small amounts of MAO-A in
dopaminergic neurons of the substantia nigra; however, the concentration of MAO-A was so
small as to be unlikely to influence dopamine concentrations in these neurons (Westlund et
al., 1988).
Because of its localization to the ventricular surfaces, blood vessels and capillaries where the
blood brain barrier is known to be located, it has also been suggested that MAO plays an
important role in the maintenance of the blood-brain barrier (Konradi et al., 1989; Westlund
- 22 -
et al., 1988). MAO has been shown to play a significant role in the degradation of dietary
amines in peripheral organs, and the high levels of MAO activity in the brain may reflect a
mechanism for breaking down potentially harmful amines before they can damage neurons or
interfere with neuronal signalling.
1.3.4.2 - Peripheral Localization
Extensive study into the peripheral localization of MAO enzymes in a number of animal
systems and in humans has found MAO activity in all cell types except erythrocytes. Most
tissues show expression of both MAO-A and MAO-B protein and mRNA; however, the relative
abundance of each isozyme varies on a tissue to tissue basis (Ramonet et al., 2003; Rodriguez
et al., 2001; Sivasubramaniam et al., 2003). For example, human blood platelets and
lymphocytes express only MAO-B (Thorpe et al., 1987); whereas, human placenta and
intestine express predominantly MAO-A (Grimsby et al., 1990). High expression of both MAO-
A and B has been observed in the stomach, liver, kidney, and heart (Rodriguez et al., 2001;
Saura et al., 1996b) where it is thought the enzyme plays a role in degrading potentially
harmful dietary amines (Sandler et al., 1981; Thorpe et al., 1987). This theory is supported by
the so-called ‘Cheese effect’ experienced by patients initially trialing irreversible MAO
inhibitors such as tranylcypromine. Tranylcypromine was the first MAO-inhibitor
antidepressant used clinically, and while it showed some efficacy as an antidepressant, the
irreversible inhibition of both MAO isoforms led to severe hypertensive crisis due to tyramine
accumulation following ingestion of tyramine-rich foods (Holschneider & Shih, 2000; Weyler
et al., 1990; Youdim & Finberg, 1987). This strongly suggests that intestinal MAO plays a vital
role in protecting the body against sympathomimetic dietary amines.
Immunocytochemical investigation has also found extensive staining for MAO-A protein in the
human placenta, in contrast to MAO-B which showed little activity above baseline (Thorpe et
al., 1987). Northern blot analysis has confirmed these high levels of MAO-A mRNA in human
placenta, but no MAO-B mRNA was detected (Grimsby et al., 1990). However,
immunoprecipitation of the enzyme has provided evidence of very low levels of MAO-B
enzyme in human placenta (Thorpe et al., 1987). Placental MAO-A activity is localized to the
syncytiotrophoblast layer, between the maternal and fetal circulatory systems, and it has
been proposed that these high concentrations of MAO-A serve to protect the fetus from toxic
amines in the maternal blood supply. MAO activity may indeed be vital to survival of the fetus
- 23 -
in mammals, since the MAO inhibitor pargyline causes abortion in both rats and humans when
infused into amniotic fluid at high concentrations (Thorpe et al., 1987). Human liver also
shows high levels of MAO-A and MAO-B activity. In the liver, MAO detoxifies circulating
amines that may be harmful to the brain or that may perturb normal physiology (e.g.
sympathomimetic amines) (Thorpe et al., 1987).
Thus, in addition to its vital role in mediating neurotransmitter concentrations in the brain,
MAO also appears to be essential in many peripheral organs, providing defense against
potentially toxic amine compounds ingested in the diet and produced by normal metabolism
(Sandler et al., 1981).
1.4 - INHIBITION OF MAO BY TOBACCO SMOKE
Many studies have reported an association between tobacco smoke and reduced MAO
activity in the brain and peripheral organs. In vivo and in vitro studies have confirmed that
cigarette smoke inhibits MAO activity (Berlin et al., 1995b; J. S. Fowler et al., 2003; Oreland et
al., 1981; J. E. Rose et al., 2001), although the mechanism of this inhibition has not yet been
elucidated. Chronic exposure to physiological concentrations of nicotine has no effect on the
activity of MAO-A or MAO-B in rat brain, suggesting that the inhibition of MAO activity is not
nicotine related (Castagnoli et al., 2002). Although nicotine shows some weak inhibition of
MAO, this occurs only at concentrations 2000 times those found in chronic heavy smokers and
is therefore unlikely to be physiologically relevant (Oreland et al., 1981). Although nicotine
itself does not inhibit the action of MAO, a number of other compounds in tobacco smoke
show potent inhibitory activity toward MAO-A and B.
The activity of MAO-A and B was investigated in the brain and peripheral organs of human
smokers and non-smokers in several comprehensive studies by Fowler et al. (1996a, b; 2000;
2003a, b). Radio-labeled clorgyline was administered to smokers and non-smokers to
visualize the activity of MAO-A in the brain by positron emission tomography (PET) scanning
(J. S. Fowler et al., 1996b). It was found that smokers showed between 22% and 38% less
MAO-A activity in some brain regions than non-smokers. The occipital cortex showed the
greatest reduction in MAO-A activity with 38% inhibition, followed by the temporal cortex and
cerebellum, each inhibited by 29%. The basal ganglia showed the least inhibition at 22%. The
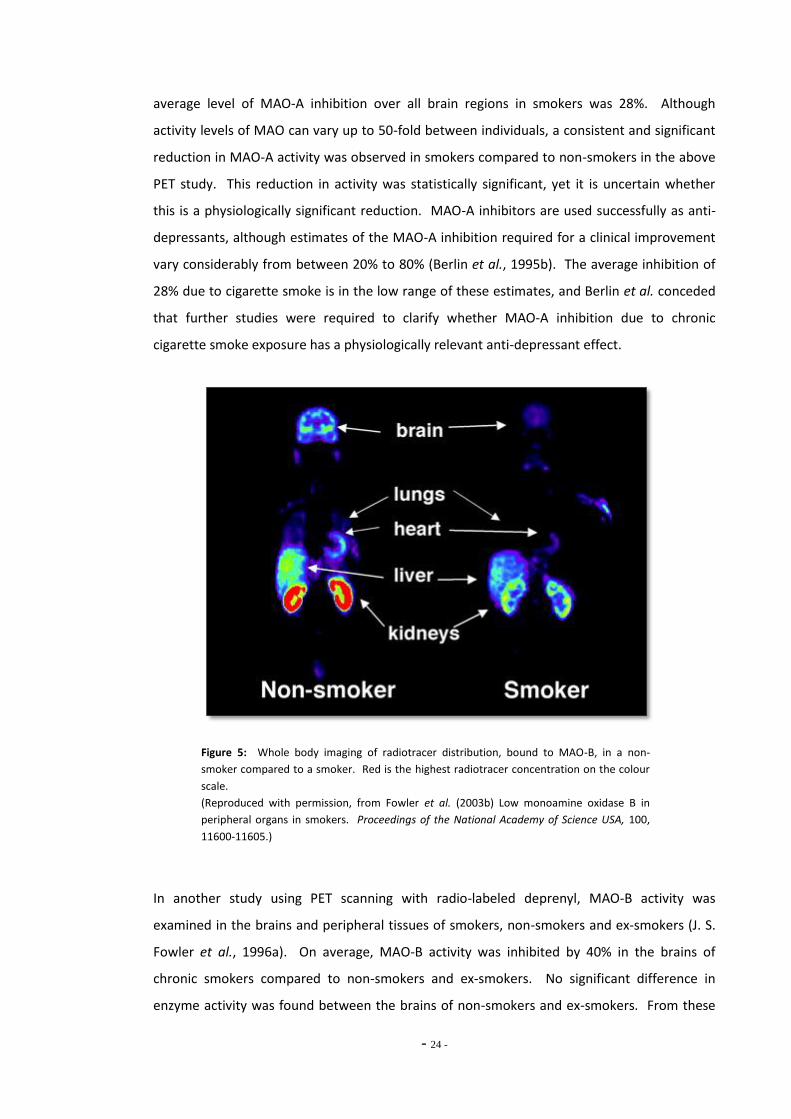
- 24 -
average level of MAO-A inhibition over all brain regions in smokers was 28%. Although
activity levels of MAO can vary up to 50-fold between individuals, a consistent and significant
reduction in MAO-A activity was observed in smokers compared to non-smokers in the above
PET study. This reduction in activity was statistically significant, yet it is uncertain whether
this is a physiologically significant reduction. MAO-A inhibitors are used successfully as anti-
depressants, although estimates of the MAO-A inhibition required for a clinical improvement
vary considerably from between 20% to 80% (Berlin et al., 1995b). The average inhibition of
28% due to cigarette smoke is in the low range of these estimates, and Berlin et al. conceded
that further studies were required to clarify whether MAO-A inhibition due to chronic
cigarette smoke exposure has a physiologically relevant anti-depressant effect.
Figure 5: Whole body imaging of radiotracer distribution, bound to MAO-B, in a non-
smoker compared to a smoker. Red is the highest radiotracer concentration on the colour
scale.
(Reproduced with permission, from Fowler et al. (2003b) Low monoamine oxidase B in
peripheral organs in smokers. Proceedings of the National Academy of Science USA, 100,
11600-11605.)
In another study using PET scanning with radio-labeled deprenyl, MAO-B activity was
examined in the brains and peripheral tissues of smokers, non-smokers and ex-smokers (J. S.
Fowler et al., 1996a). On average, MAO-B activity was inhibited by 40% in the brains of
chronic smokers compared to non-smokers and ex-smokers. No significant difference in
enzyme activity was found between the brains of non-smokers and ex-smokers. From these
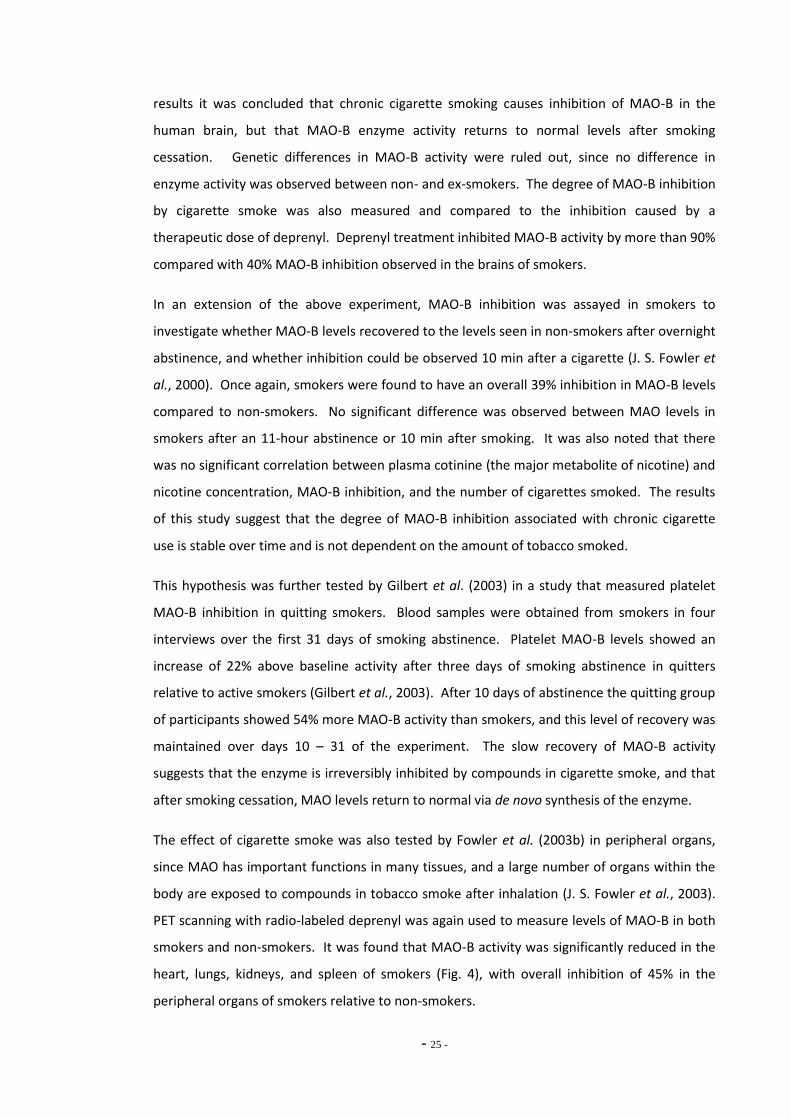
- 25 -
results it was concluded that chronic cigarette smoking causes inhibition of MAO-B in the
human brain, but that MAO-B enzyme activity returns to normal levels after smoking
cessation. Genetic differences in MAO-B activity were ruled out, since no difference in
enzyme activity was observed between non- and ex-smokers. The degree of MAO-B inhibition
by cigarette smoke was also measured and compared to the inhibition caused by a
therapeutic dose of deprenyl. Deprenyl treatment inhibited MAO-B activity by more than 90%
compared with 40% MAO-B inhibition observed in the brains of smokers.
In an extension of the above experiment, MAO-B inhibition was assayed in smokers to
investigate whether MAO-B levels recovered to the levels seen in non-smokers after overnight
abstinence, and whether inhibition could be observed 10 min after a cigarette (J. S. Fowler et
al., 2000). Once again, smokers were found to have an overall 39% inhibition in MAO-B levels
compared to non-smokers. No significant difference was observed between MAO levels in
smokers after an 11-hour abstinence or 10 min after smoking. It was also noted that there
was no significant correlation between plasma cotinine (the major metabolite of nicotine) and
nicotine concentration, MAO-B inhibition, and the number of cigarettes smoked. The results
of this study suggest that the degree of MAO-B inhibition associated with chronic cigarette
use is stable over time and is not dependent on the amount of tobacco smoked.
This hypothesis was further tested by Gilbert et al. (2003) in a study that measured platelet
MAO-B inhibition in quitting smokers. Blood samples were obtained from smokers in four
interviews over the first 31 days of smoking abstinence. Platelet MAO-B levels showed an
increase of 22% above baseline activity after three days of smoking abstinence in quitters
relative to active smokers (Gilbert et al., 2003). After 10 days of abstinence the quitting group
of participants showed 54% more MAO-B activity than smokers, and this level of recovery was
maintained over days 10 – 31 of the experiment. The slow recovery of MAO-B activity
suggests that the enzyme is irreversibly inhibited by compounds in cigarette smoke, and that
after smoking cessation, MAO levels return to normal via de novo synthesis of the enzyme.
The effect of cigarette smoke was also tested by Fowler et al. (2003b) in peripheral organs,
since MAO has important functions in many tissues, and a large number of organs within the
body are exposed to compounds in tobacco smoke after inhalation (J. S. Fowler et al., 2003).
PET scanning with radio-labeled deprenyl was again used to measure levels of MAO-B in both
smokers and non-smokers. It was found that MAO-B activity was significantly reduced in the
heart, lungs, kidneys, and spleen of smokers (Fig. 4), with overall inhibition of 45% in the
peripheral organs of smokers relative to non-smokers.
- 26 -
A recent study on the peripheral activity of MAO-A found that smokers showed a 50%
decrease in lung MAO-A compared to non-smokers (J. S. Fowler et al., 2005). This is a
significant change, since MAO-A plays a protective role in the lung by degrading locally
released norepinephrine and other circulating amines. Fowler et al. proposed that lung MAO-
A inhibition may augment nicotine-induced increases in norepinephrine concentration,
contributing to some of the peripheral physiological effects of tobacco smoking.
It is not yet known what effect MAO-B inhibition has on the functioning of peripheral organs;
however, it is expected that inhibition of these enzymes would have a profound effect on
normal function, as seen with the ‘Cheese effect’ described earlier. Catecholamines are major
signalling molecules, playing vital roles in the physiology of the heart, peripheral circulation,
and kidneys. In addition, inhibition of MAO in the gut is thought to cause accumulation of
tyramine, which has a strong sympathomimetic action.
The long-term consequences of MAO inhibition by cigarette smoke are not known; however,
epidemiological studies have shown a strong inverse correlation between cigarette smoking
and Parkinson’s disease (PD) (Morens et al., 1995). Treatment with the MAO-B inhibitor
deprenyl slows the progression of PD and improves many of the symptoms associated with
this neurological disorder. This suggests that compounds in cigarette smoke may have a
protective effect against the development of PD. Therapeutic MAO inhibitors have proven to
be effective in preventing onset of Parkinsonian symptoms in mouse models and are being
trialed as human therapeutics to alleviate symptoms in Parkinson’s sufferers. Thus,
identification of the MAO inhibitory compounds in cigarette smoke may not only aid in the
development of more effective smoking cessation therapies but may also lead to more
effective treatments for PD.
The evidence gathered to date convincingly suggests that MAO-A and MAO-B are inhibited by
compounds in cigarette smoke in both a reversible and irreversible fashion (Table 2). Studies
into the significance of this inhibition are currently being undertaken in a number of
laboratories, and MAO inhibition could prove to be an important factor in the establishment
and reinforcement of tobacco addiction. Identification of the non-nicotine compounds in
tobacco smoke that inhibit MAO activity is a complex task and is still under investigation.
- 27 -
1.4.1 - MAO Inhibitors in Tobacco Smoke
Although plasma concentrations of nicotine, cotinine and cyanide and their metabolites are
elevated in cigarette smokers, none of these compounds has been linked with any MAO
inhibitory action. As previously discussed, nicotine is a poor MAO inhibitor, especially at
physiological concentrations (Oreland et al., 1981). A number of studies have identified and
characterized several compounds in cigarette smoke that inhibit both MAO-A and MAO-B in a
reversible or irreversible manner (Table 2). Characterization of these compounds is
important, as their identification will further our understanding of the neurobiology of
tobacco addiction and may eventually lead to the development of improved smoking
cessation strategies.
In an early study, the MAO inhibitory action of tobacco smoke and tobacco leaf extracts was
tested in preparations of rat lung MAO (P. H. Yu & Boulton, 1987). It was found that
unidentified compounds within cigarette smoke and leaf extracts irreversibly inhibited the
action of MAO-A and MAO-B. The tobacco smoke extract showed greater inhibitory action on
MAO than leaf extracts, and total inactivation of MAO was achieved using high concentrations
of tobacco smoke extract. It was deduced from kinetic studies that these compounds
displayed a mixed type of inhibition of MAO, that is, that MAO was inhibited both
competitively and non-competitively.
More recent investigations by other research groups attempting to identify MAO inhibitors in
cigarette smoke have met with some success. Castagnoli et al. (2003) identified 2,3,6-
trimethyl-1,4-naphthoquinone (TMN) in tobacco smoke, and this compound was found to
inhibit both MAO-A and B activity in a mouse model. However, high concentrations of TMN
were required to induce this inhibition. While this compound may contribute to some of the
effects of tobacco smoke on MAO activity and dopamine concentrations, it is likely that there
are also other compounds that inhibit MAO activity in tobacco smoke.
The inhibitory properties of tobacco leaf and smoke extracts in vitro were also investigated in
rat mitochondrial preparations (Castagnoli et al., 2002). Extracts of tobacco leaf were found
to inhibit MAO-B by 34%; whereas, treatment with tobacco smoke extracts inhibited MAO-B
by 93%. Although it is difficult to directly relate a leaf extract to a smoke extract, these results
suggest that combustion of tobacco leaf may activate some inert compounds in the tobacco,
increasing their capacity to inhibit MAO, or that some MAO inhibitors may be more active in
the gaseous phase. This study also identified three inhibitory compounds within cigarette
smoke following extraction, fractionation, and electron impact gas chromatography mass
- 28 -
spectrometry (GC-EIMS) analysis. These compounds included farnesylacetone, and two
others not yet fully characterized (Castagnoli et al., 2002). Further fractionation of tobacco
smoke components by Khalil et al. (2006) identified farnesol as a significant inhibitor of MAO
enzyme activity. Farnesol was found to potently inhibit human liver MAO-B with a Ki of 800
nM, but had no activity against MAO-A at concentrations up to 10 µM (A. A. Khalil et al.,
2006).
2-Naphthylamine is a well-known carcinogen found in cigarette smoke (Hauptmann & Shih,
2001) that also inhibits brain MAO activity. Mitochondria isolated from mouse brain were
pre-treated with 2-naphthylamine before incubation with a MAO-A or B selective substrate. A
concentration-dependent inhibition of both MAO-A and B was observed after treatment with
this compound. It was also noted that 2-naphthylamine preferentially inhibited MAO-B. The
authors conceded that it was uncertain whether 2-naphthylamine was able to cross the blood-
brain barrier to inhibit MAO in the brain, and therefore questioned whether the inhibition
induced by this compound was physiologically relevant.
There is convincing evidence that acetaldehyde, one of the major constituents of tobacco
smoke, may play a number of pro-addictive roles in the etiology of tobacco dependence
(Talhout et al., 2007). Acetaldehyde is produced by the combustion of polysaccharides in
tobacco and has been shown to have potent reinforcing properties, particularly on dopamine
neurons in the ventral tegmental area. The primary metabolite of ethanol, acetaldehyde, has
been studied extensively for its contribution to the reinforcement of ethanol administration,
and more recently acetaldehyde has been examined for a potential role in tobacco
dependence. While acetaldehyde has been shown to have reinforcing effects on its own, it is
also involved in the formation of a number of biologically active compounds produced from
the condensation between acetaldehyde and biogenic amines. Significantly, a number of
these compounds have been demonstrated to have MAO inhibitory activity.
β-carbolines are one such group of compounds, formed from the reaction between
acetaldehyde and the indoleamines, serotonin, tryptamine, and tryptophan (Talhout et al.,
2007). A recent study has identified two of these β-carbolines, harman and norharman, as
potent inhibitors of MAO activity (Herraiz & Chaparro, 2005). These compounds were isolated
from tobacco smoke by HPLC and identified using GC-MS. Norharman was found to
competitively inhibit MAO-B in vitro; whereas, harman showed no inhibition of MAO-B. Both
β-carbolines proved to be potent competitive inhibitors of MAO-A activity with IC50 values in
the nanomolar range. Harman proved to be the more potent of the two (Herraiz & Chaparro,
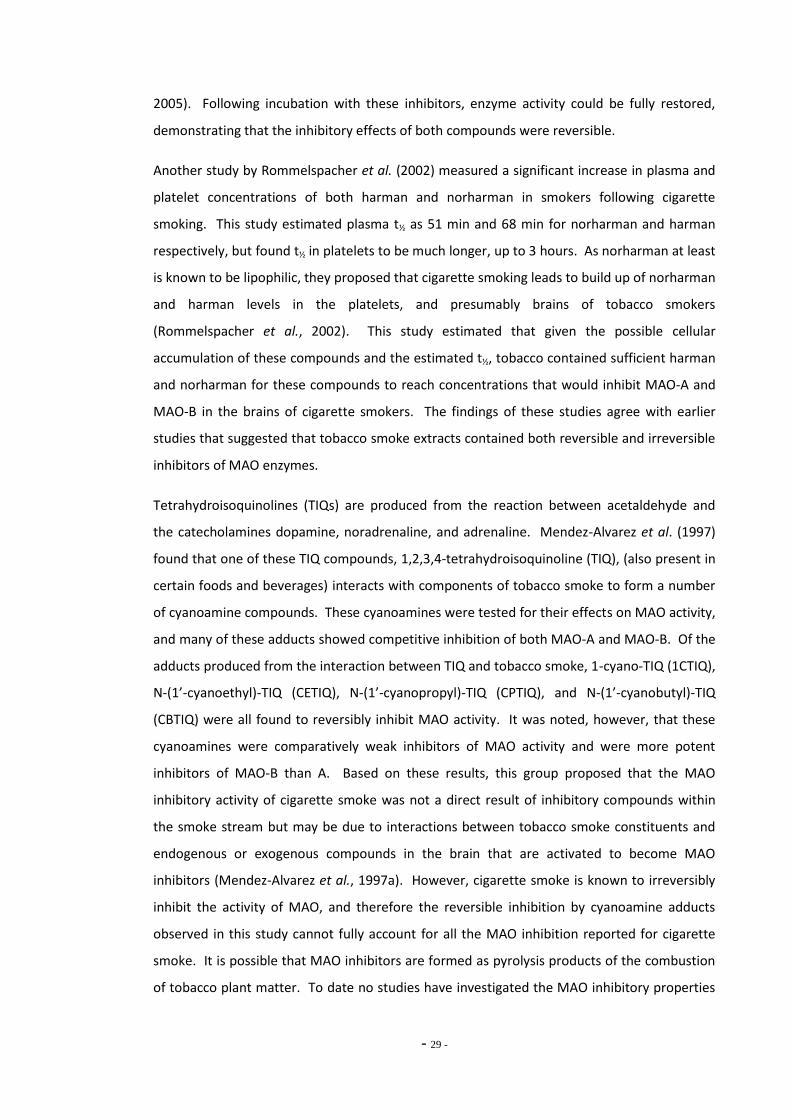
- 29 -
2005). Following incubation with these inhibitors, enzyme activity could be fully restored,
demonstrating that the inhibitory effects of both compounds were reversible.
Another study by Rommelspacher et al. (2002) measured a significant increase in plasma and
platelet concentrations of both harman and norharman in smokers following cigarette
smoking. This study estimated plasma t½ as 51 min and 68 min for norharman and harman
respectively, but found t½ in platelets to be much longer, up to 3 hours. As norharman at least
is known to be lipophilic, they proposed that cigarette smoking leads to build up of norharman
and harman levels in the platelets, and presumably brains of tobacco smokers
(Rommelspacher et al., 2002). This study estimated that given the possible cellular
accumulation of these compounds and the estimated t½, tobacco contained sufficient harman
and norharman for these compounds to reach concentrations that would inhibit MAO-A and
MAO-B in the brains of cigarette smokers. The findings of these studies agree with earlier
studies that suggested that tobacco smoke extracts contained both reversible and irreversible
inhibitors of MAO enzymes.
Tetrahydroisoquinolines (TIQs) are produced from the reaction between acetaldehyde and
the catecholamines dopamine, noradrenaline, and adrenaline. Mendez-Alvarez et al. (1997)
found that one of these TIQ compounds, 1,2,3,4-tetrahydroisoquinoline (TIQ), (also present in
certain foods and beverages) interacts with components of tobacco smoke to form a number
of cyanoamine compounds. These cyanoamines were tested for their effects on MAO activity,
and many of these adducts showed competitive inhibition of both MAO-A and MAO-B. Of the
adducts produced from the interaction between TIQ and tobacco smoke, 1-cyano-TIQ (1CTIQ),
N-(1’-cyanoethyl)-TIQ (CETIQ), N-(1’-cyanopropyl)-TIQ (CPTIQ), and N-(1’-cyanobutyl)-TIQ
(CBTIQ) were all found to reversibly inhibit MAO activity. It was noted, however, that these
cyanoamines were comparatively weak inhibitors of MAO activity and were more potent
inhibitors of MAO-B than A. Based on these results, this group proposed that the MAO
inhibitory activity of cigarette smoke was not a direct result of inhibitory compounds within
the smoke stream but may be due to interactions between tobacco smoke constituents and
endogenous or exogenous compounds in the brain that are activated to become MAO
inhibitors (Mendez-Alvarez et al., 1997a). However, cigarette smoke is known to irreversibly
inhibit the activity of MAO, and therefore the reversible inhibition by cyanoamine adducts
observed in this study cannot fully account for all the MAO inhibition reported for cigarette
smoke. It is possible that MAO inhibitors are formed as pyrolysis products of the combustion
of tobacco plant matter. To date no studies have investigated the MAO inhibitory properties
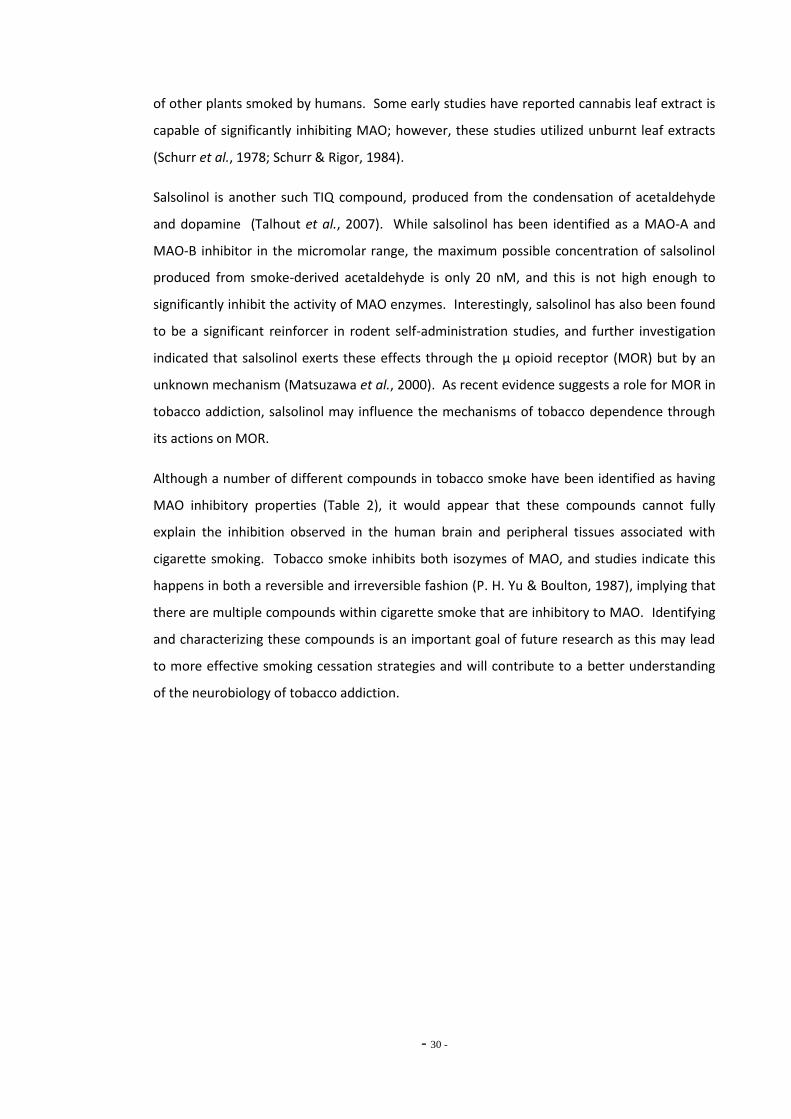
- 30 -
of other plants smoked by humans. Some early studies have reported cannabis leaf extract is
capable of significantly inhibiting MAO; however, these studies utilized unburnt leaf extracts
(Schurr et al., 1978; Schurr & Rigor, 1984).
Salsolinol is another such TIQ compound, produced from the condensation of acetaldehyde
and dopamine (Talhout et al., 2007). While salsolinol has been identified as a MAO-A and
MAO-B inhibitor in the micromolar range, the maximum possible concentration of salsolinol
produced from smoke-derived acetaldehyde is only 20 nM, and this is not high enough to
significantly inhibit the activity of MAO enzymes. Interestingly, salsolinol has also been found
to be a significant reinforcer in rodent self-administration studies, and further investigation
indicated that salsolinol exerts these effects through the µ opioid receptor (MOR) but by an
unknown mechanism (Matsuzawa et al., 2000). As recent evidence suggests a role for MOR in
tobacco addiction, salsolinol may influence the mechanisms of tobacco dependence through
its actions on MOR.
Although a number of different compounds in tobacco smoke have been identified as having
MAO inhibitory properties (Table 2), it would appear that these compounds cannot fully
explain the inhibition observed in the human brain and peripheral tissues associated with
cigarette smoking. Tobacco smoke inhibits both isozymes of MAO, and studies indicate this
happens in both a reversible and irreversible fashion (P. H. Yu & Boulton, 1987), implying that
there are multiple compounds within cigarette smoke that are inhibitory to MAO. Identifying
and characterizing these compounds is an important goal of future research as this may lead
to more effective smoking cessation strategies and will contribute to a better understanding
of the neurobiology of tobacco addiction.
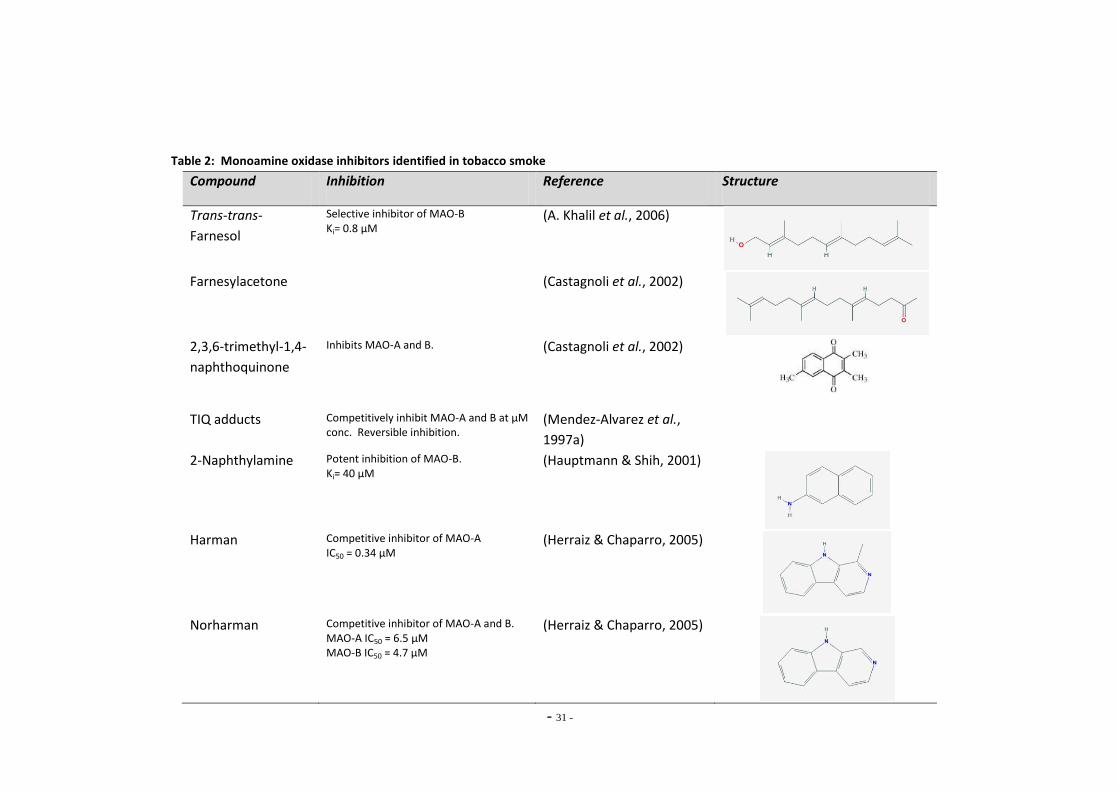
- 31 -
Table 2: Monoamine oxidase inhibitors identified in tobacco smoke
Compound Inhibition Reference Structure
Trans-trans-
Farnesol
Selective inhibitor of MAO-B Ki= 0.8 µM
(A. Khalil et al., 2006)
Farnesylacetone (Castagnoli et al., 2002)
2,3,6-trimethyl-1,4-
naphthoquinone
Inhibits MAO-A and B.
(Castagnoli et al., 2002)
TIQ adducts Competitively inhibit MAO-A and B at µM
conc. Reversible inhibition. (Mendez-Alvarez et al.,
1997a)
2-Naphthylamine Potent inhibition of MAO-B. Ki= 40 µM
(Hauptmann & Shih, 2001)
Harman Competitive inhibitor of MAO-A
IC50 = 0.34 µM (Herraiz & Chaparro, 2005)
Norharman Competitive inhibitor of MAO-A and B.
MAO-A IC50 = 6.5 µM MAO-B IC50 = 4.7 µM
(Herraiz & Chaparro, 2005)
- 32 -
1.4.2 - MAO Inhibitors in Smoking Cessation Therapy
The majority of cigarette smokers express a desire to quit smoking, but few smokers are
successful in their attempts to quit, and most quitters show a high rate of relapse. Smokers
who have tried repeatedly to quit and failed commonly turn to pharmacotherapy for
assistance. At present pharmacotherapy for treating tobacco addiction is relatively limited,
and these treatments predominantly involve different forms of nicotine replacement therapy
(NRT). NRT is available as a gum, transdermal patch, nasal spray, or inhaler. These products
are designed to pharmacologically replace the nicotine derived from cigarette smoke while
the smoker breaks the behavioural cues which accompany smoking. These forms of NRT show
differing levels of efficacy; however, their efficacy is thought to be limited by the mechanism
of nicotine delivery. Nicotine inhaled in a bolus of cigarette smoke can reach the brain in
approximately 10 sec. Drug delivery speed is thought to be a crucial factor in the
effectiveness of NRT, yet currently no form of NRT can match the delivery speed of the
cigarette, nor the rapid pharmacological effect of smoke administration. Most smokers report
NRT to be much less satisfying than cigarette smoke.
In the United States, bupropion is presently the only non-nicotine drug approved for smoking
cessation treatment by the FDA and is marketed under the name ‘Zyban’. Bupropion is
administered to the smoker as a sustained-release 300 mg per day tablet, and therapy is
started 7 days prior to quitting (George & O'Malley, 2004). Bupropion is thought to inhibit
dopamine and noradrenaline transport and reuptake by competing with neuronal
transporters (George & O'Malley, 2004; Xue & Domino, 2007) and thus increase synaptic
dopamine concentrations. The efficacy of bupropion as a smoking cessation aid has been
demonstrated in clinical laboratory studies; however, it is expensive and only shows limited
success in many smokers.
The lack of success with current pharmacological treatments indicates that the development
of more effective strategies to treat nicotine dependence is required. MAO inhibitors
administered alone or as adjunct therapy with nicotine replacement regimes are being trialed
as aids to smoking cessation (Berlin et al., 1995a; George et al., 2003). Since tobacco smoke
irreversibly inhibits MAO, therapeutic administration of MAO inhibitors may assist smoking
cessation by mimicking the effect of cigarette smoke on MAO, thus, diminishing the severity
of withdrawal symptoms.
Moclobemide, which has previously been used to treat depression, is a reversible inhibitor of
MAO-A. It is currently being trialed alone and in conjunction with NRT in dependent smokers
- 33 -
to assist quitting. In a randomized double-blind study, moclobemide was administered to
heavily dependent smokers to assist with smoking cessation (Berlin et al., 1995a).
Moclobemide treatment was maintained for three months after the quit day, and it was found
that 25% of dependent smokers using moclobemide reported that they remained abstinent
after a year compared with 16% abstinence in a group of smokers who received placebo
(Berlin et al., 1995a). This abstinence rate did not drop significantly, even after moclobemide
treatment was stopped. It was proposed that the effectiveness of moclobemide in assisting
smoking cessation was due to its ability to manage withdrawal symptoms, including
depression and dysphoria.
MAO-B inhibitors have also been trialed as smoking cessation aids, including selegiline
hydrochloride (deprenyl), an irreversible MAO-B inhibitor that has been used in the treatment
of PD and Alzheimer’s disease (Sano et al., 1997). In a double-blind placebo controlled trial,
selegiline was found to increase smoking cessation success rates at least as effectively as NRT
(George et al., 2003). Selegiline was administered to dependent smokers attempting to quit
for 2 weeks prior and 6 weeks after their nominated quit date. Smoking abstinence after 6
months was reported as 20% for participants treated with selegiline and only 5% for those
receiving placebo. The authors reported that while the rates of smoking cessation were lower
than those seen in trials of bupropion, they were comparable to the results seen with NRT.
Additionally, a randomized double-blind study trialing selegiline in conjunction with NRT
patches found that smoking cessation rates after one year in the group that had received
selegiline were double the cessation rates seen in the group receiving NRT and placebo
(Biberman et al., 2003). Continued abstinence in the group receiving NRT and selegiline and
the group receiving NRT and placebo were 25% and 11%, respectively. Although this
difference was not found to be statistically significant, it showed a trend that may be
exploited for future smoking cessation therapies. Administration of MAO inhibitors in
conjunction with NRT could dramatically increase smoking quit rates once an appropriate
dosage and treatment regimen is established.
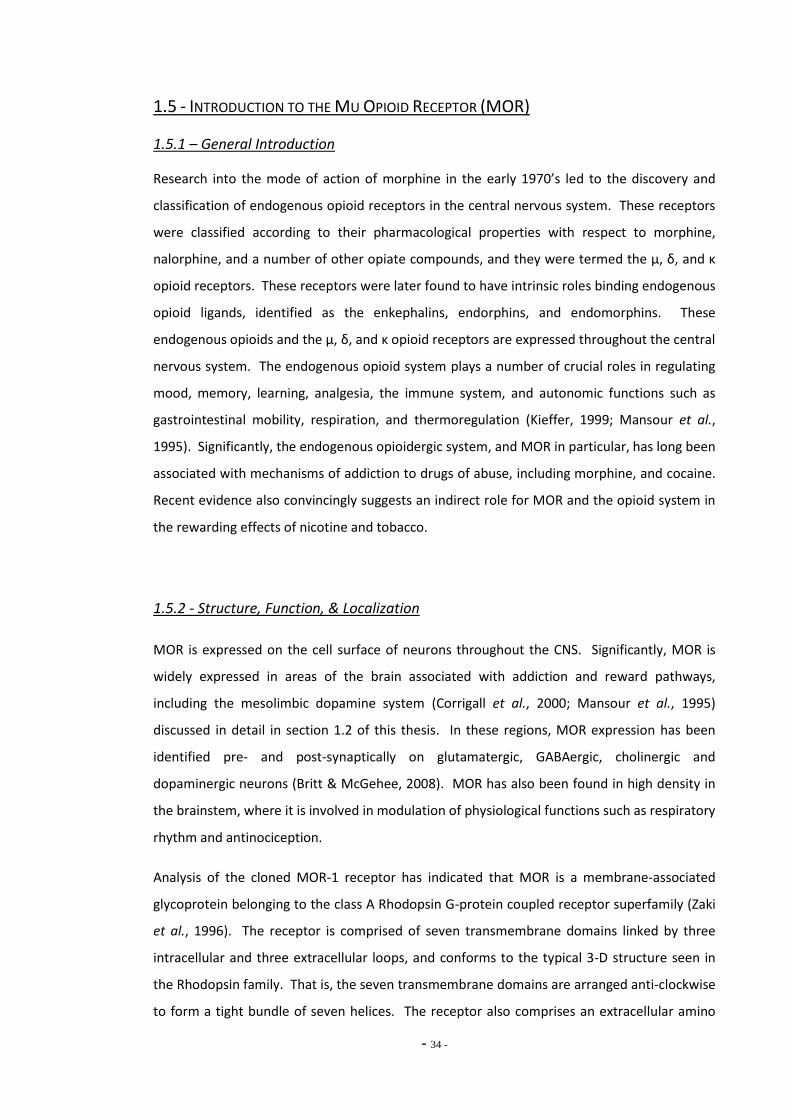
- 34 -
1.5 - INTRODUCTION TO THE MU OPIOID RECEPTOR (MOR)
1.5.1 – General Introduction
Research into the mode of action of morphine in the early 1970’s led to the discovery and
classification of endogenous opioid receptors in the central nervous system. These receptors
were classified according to their pharmacological properties with respect to morphine,
nalorphine, and a number of other opiate compounds, and they were termed the µ, δ, and κ
opioid receptors. These receptors were later found to have intrinsic roles binding endogenous
opioid ligands, identified as the enkephalins, endorphins, and endomorphins. These
endogenous opioids and the µ, δ, and κ opioid receptors are expressed throughout the central
nervous system. The endogenous opioid system plays a number of crucial roles in regulating
mood, memory, learning, analgesia, the immune system, and autonomic functions such as
gastrointestinal mobility, respiration, and thermoregulation (Kieffer, 1999; Mansour et al.,
1995). Significantly, the endogenous opioidergic system, and MOR in particular, has long been
associated with mechanisms of addiction to drugs of abuse, including morphine, and cocaine.
Recent evidence also convincingly suggests an indirect role for MOR and the opioid system in
the rewarding effects of nicotine and tobacco.
1.5.2 - Structure, Function, & Localization
MOR is expressed on the cell surface of neurons throughout the CNS. Significantly, MOR is
widely expressed in areas of the brain associated with addiction and reward pathways,
including the mesolimbic dopamine system (Corrigall et al., 2000; Mansour et al., 1995)
discussed in detail in section 1.2 of this thesis. In these regions, MOR expression has been
identified pre- and post-synaptically on glutamatergic, GABAergic, cholinergic and
dopaminergic neurons (Britt & McGehee, 2008). MOR has also been found in high density in
the brainstem, where it is involved in modulation of physiological functions such as respiratory
rhythm and antinociception.
Analysis of the cloned MOR-1 receptor has indicated that MOR is a membrane-associated
glycoprotein belonging to the class A Rhodopsin G-protein coupled receptor superfamily (Zaki
et al., 1996). The receptor is comprised of seven transmembrane domains linked by three
intracellular and three extracellular loops, and conforms to the typical 3-D structure seen in
the Rhodopsin family. That is, the seven transmembrane domains are arranged anti-clockwise
to form a tight bundle of seven helices. The receptor also comprises an extracellular amino

- 35 -
terminus that exhibits five putative sites of N-linked glycosylation and an intracellular C-
terminus. The cloned human MOR-1 receptor cDNA predicts a protein of 400 amino acids
with a molecular weight of approximately 58 kDa before post-translational modification
(Minami & Satoh, 1995). MOR shares approximately 60% amino acid sequence identity with
the δ and κ receptors, being most conserved through the membrane-spanning regions; while,
the extracellular regions show the most divergence (Waldhoer et al., 2004). In humans, the
MOR gene, Oprm, is located on the long arm of chromosome 6. The gene comprises 8 introns,
that are alternatively spliced to produce at least 10 identified splice variants (Pan et al., 2005).
The longest splice variant, MOR-1, encodes the main MOR isoform. All the splice variants
described to date contain exons 1, 2 and 3 which encode the amino-terminus and all seven
transmembrane domains. As the amino-terminus and transmembrane domains comprise the
ligand binding pocket of MOR, the splice variants show similar ligand specificities and binding
affinities (Pan et al., 2005).
Opioid substrates bind to MOR on the extracellular side, causing receptor activation and
coupling with G-proteins on the intracellular surface of the plasma membrane. Activated G-
proteins regulate the actions of a number of second messenger intracellular signaling
molecules, including adenylyl cyclase, phosphatidylinositol 3-kinase, MAP kinase, and calcium
channels (Christoffers et al., 2003; Law et al., 2000). Acute exposure to MOR agonists causes
receptor activation, followed by receptor desensitization, the latter caused by uncoupling of
the receptor to the G-protein by receptor phosphorylation (Waldhoer et al., 2004). Chronic
stimulation of MOR by opioid agonists generally results in internalization of the receptor via
clathrin-coated pits and proteolytic degradation, causing an observed down-regulation of
MOR. Binding of opioid peptides to MOR results in a number of physiological effects,
including antinociception, euphoria, respiratory depression, and inhibition of gastrointestinal
mobility. The binding of exogenous opioid receptor agonists, such as morphine, induces these
same effects, with constipation and respiratory depression being well documented side
effects of opiate drug abuse.
The natural substrates for the opioid receptors are families of opioid peptides, the
enkephalins, dynorphins, endorphins, and endomorphins. The most likely natural ligands for
MOR are β-endorphin, and endomorphin which show high affinity for the receptor (Kieffer,
1999; Waldhoer et al., 2004; Zadina et al., 1997). Endomorphin is found in high
concentrations in the amygdala and nucleus accumbens (Fichna et al., 2007); while, β-
endorphin neurons are located mainly in the pituitary gland and hypothalamus and project to
- 36 -
the ventral tegmental area and nucleus accumbens (Roth-Deri et al., 2008). As MOR agonists,
these peptides display behavioural and physiological effects similar to morphine. They are
readily self-administered and elicit place preference when used in animal experiments (Roth-
Deri et al., 2008). Many drugs of dependence have been shown to induce release of β-
endorphin following administration. It is through mediating the actions of these opioid
peptides that MOR is presumed to influence motivation and reward pathways and the
mechanisms of drug dependence.
1.5.3 - MOR and Tobacco
Several studies have reported associations between the endogenous opioid system and
nicotine; however, the mechanisms underlying this association are not yet well characterized
(Walters et al., 2005). An opioid link in tobacco addiction was first postulated when it was
noted that the MOR antagonist naloxone reduced the smoking behavior and tobacco craving
in human smokers (Karras & Kane, 1980). Wewers et al. (1998) also reported that human
smokers receiving a dose of the MOR antagonist naltrexone smoked less cigarettes over a 3
day period than a group receiving placebo treatment (Wewers et al., 1998). Animal studies
have reported that naloxone blocks the antinociceptive effect of nicotine observed in mice
and also attenuates nicotine withdrawal symptoms such as chattering teeth, gasping, and
tremors in nicotine-dependent animals. Naloxonazine, another MOR antagonist, has also
been shown to block nicotine-induced antinociception in mice (Simons et al., 2005). These
results strongly suggest the involvement of MOR in mediating the antinociceptive and other
physiological effects of nicotine that have been reported previously.
Extensive pharmacological and molecular studies have been conducted into the function and
influence of MOR and the opioid system, which was summarized in section 1.5.2. These
studies have confirmed that the endogenous opioid system influences the reinforcement of
morphine, heroin, and many other drugs of abuse (Contet et al., 2004). Importantly, it has
been demonstrated that reinforcement and reward of ethanol, cannabis, and nicotine is also
abolished or significantly attenuated in knock-out mice lacking MOR. Studies utilizing MOR
knock-out mice have reported that these mutant mice show no increase in pain tolerance
following administration of nicotine at doses that induce antinociception in controls. This
confirms the previous finding that MOR is linked to nicotine antinociception in animals. MOR
knock-out mice also show no conditioned place preference to nicotine reward, nor do they
- 37 -
learn to self-administer nicotine (Berrendero et al., 2002). This suggests that MOR is required
not only for nicotine antinociception, but also to mediate the rewarding properties of
nicotine. The mechanism by which MOR influences nicotine reward has not been elucidated,
but a role for endogenous opioid peptides in this process has been proposed.
Tanda & Di Chiara (1998) demonstrated that MOR activation in the ventral tegmental area is
required for nicotine-induced dopamine overflow in the nucleus accumbens. They showed a
significant increase in dopamine release in the accumbens following administration of nicotine
in rats. This dopamine increase was abolished in rats pre-treated with the selective MOR
antagonist naloxonazine, applied directly to the ventral tegmental area (Tanda & Di Chiara,
1998). This study hypothesized that endogenous µ-opioid tone modulates the activation of
dopamine under basal conditions, and that drugs of abuse increase opioid tone, leading to
disinhibition of mesolimbic neurons and resulting in dopamine release. The suggestion that
MOR may be modulating the various effects of nicotine by mediating the action of β-
endorphin and other opioid peptides is an appealing one, as nicotine has been shown to
evoke β-endorphin release in humans and laboratory animals. Β-endorphin is an agonist for
MOR and shares a number of properties in common with other MOR agonists discussed here.
That is, β-endorphin is readily self-administered by laboratory animals and induces a
conditioned place preference. In humans, a significant increase in plasma β-endorphin
concentrations was recorded following nicotine treatment (Pomerleau et al., 1983b).
Davenport et al. (1990) provided convincing evidence that nicotine administration caused
endogenous MOR peptide release. Mice were treated with nicotine before receiving a dose of
β-funaltrexamine, an irreversible MOR antagonist. Nicotine pre-treatment attenuated β-
funaltrexamine antagonism, suggesting that nicotine administration had caused the release of
endogenous opioid peptides that had bound and activated MOR and blocked β-
funaltrexamine binding (Davenport et al., 1990). Additionally, Boyadjieva & Sarkar (1997)
demonstrated the secretion of β-endorphin from primary cultured rat hypothalamic neurons
stimulated with nicotine. Acute nicotine administration induced increased β-endorphin
release of up to 500% of control. However; this effect showed rapid desensitization to chronic
nicotine stimulation, as β-endorphin release returned to baseline levels after 24 hours
stimulation (Boyadjieva & Sarkar, 1997). Spanagel et al. (1990) showed that β-endorphin
administration caused an increase in dopamine release and metabolism in the nucleus
accumbens of rats in a dose-dependent manner. This effect was abolished in rats pre-treated
with the MOR specific antagonist D-Pen-Cys-Tyr-D-Trp-Orn-Thr-Pen-Thr-NH2 (CTOP). Thus,
they confirmed that β-endorphin induces dopamine overflow in the nucleus accumbens and
- 38 -
exerts this effect through MOR (Spanagel et al., 1990). To summarise, MOR is thought to be
involved in nicotine reward through its role in mediating the actions of endogenous opioid
peptides. Nicotine binding to nAChRs causes release of β-endorphin and other opioid
peptides. These bind to MOR located on neurons in the VTA, which in turn leads to dopamine
release in the nucleus accumbens.
Non-nicotine compounds in tobacco smoke may also influence the brain reward pathways
mediated by MOR. Salsolinol is a condensation product of the reaction between dopamine
and acetaldehyde, large quantities of which are found in tobacco smoke. It induces naloxone-
sensitive antinociception in rodents and shows rewarding properties in conditioned place
preference studies and self-administration paradigms (Matsuzawa et al., 2000). It also
induces an increase in locomotor activity, thought to be associated with the rewarding
properties of drugs of abuse. Salsolinol has been studied as a potential neurochemical factor
in alcoholism and has been reported to activate the opioid system, although its potential role
in tobacco dependence has yet to be determined (Talhout et al., 2007).
The evidence reviewed above strongly suggests a critical role for MOR and endogenous opioid
signalling in mediating the rewarding and reinforcing properties of nicotine. There is also
reason to believe that the non-nicotine components of tobacco smoke may modulate the
influence of the opioid system on nicotine reward and reinforcement. However, the details
and mechanisms of action of the endogenous opioid system and the role of MOR in tobacco
dependence have yet to be elucidated, and more research in this area is warranted.
1.6 - AIMS
Nicotine has long been held as the principal neurobiologically active compound in tobacco
smoke and has been studied extensively as the primary biological influence on tobacco
addiction. However, there is a growing body of evidence that suggests that other compounds
within tobacco smoke may also influence addiction in direct and indirect ways. Changes in
MAO enzyme activity have been linked to tobacco addiction. Cigarette smoking reduces MAO
activity throughout the body, in particular in regions of the brain associated with reward-
oriented behaviors. Many studies are currently attempting to identify MAO inhibitory
- 39 -
compounds in tobacco smoke, and these MAO inhibitors may provide promising options for a
new generation of pharmacotherapies for tobacco dependence. Ongoing research into the
role of MAO in the CNS and the influence of monoamine oxidase inhibitors is required for a
more complete understanding of the mechanisms of tobacco dependence. Recent evidence
also suggests the indirect involvement of the endogenous opioid system in mediating the
rewarding properties of tobacco, potentially through the action of MOR. Further research is
required to elucidate the role that endogenous opioid peptides and MOR play following
exposure to tobacco smoke.
The present study aimed to investigate, compare, and contrast the influence of tobacco and
the non-nicotine components of tobacco with nicotine on the function and gene expression of
several neurobiologically relevant drug targets in neuronal and glial cell lines in an attempt to
identify non-nicotine effects on these cells that may influence tobacco addiction. In
particular, this research hoped to identify changes in monoamine oxidase enzyme activity
following in vitro exposure to nicotine, standard tobacco particulates, and denicotinized
tobacco particulates after several different treatment regimens. It was proposed that a
detailed knowledge of the differences in MAO response to nicotine, tobacco extracts and
denicotinized tobacco extracts may help elucidate the role that MAO inhibitors play in tobacco
addiction.
MAO gene expression in response to nicotine and tobacco exposures was also investigated in
vitro. Much research has been conducted into the effects of tobacco smoke on the activity of
MAO-A and MAO-B, but few studies have investigated gene expression following exposure to
these compounds. This project investigated whether there was an effect on MAO-A and
MAO-B gene expression in vitro following exposure to nicotine and tobacco particulate
extracts. Additionally, this study aimed to investigate differences between neuronal cells and
glial cells in their responses to nicotine and tobacco exposure. Primarily, differences in MAO
activity and gene expression between neuronal and glial cells were examined. Because glial
cells are known to display strong MAO activity in vivo, and recent evidence suggests a putative
role for glia in establishment of drug dependence, this study hoped to determine whether an
in vitro model of glial cell function (U-118 MG) responded differently to a neuronal cell model
(SH-SY5Y) when exposed to tobacco extracts.
Recent evidence confirmed that opioid mechanisms play a role in the neuronal systems
mediating reward and reinforcement. Research has also suggested involvement of the
endogenous opioid system and MOR in contributing to the addictive properties of tobacco

- 40 -
smoke. The present study intended to characterize gene expression of MOR in response to
nicotine and tobacco extract exposure with the aim of providing insights into the role of MOR
in establishing and maintaining tobacco addiction.
Ultimately, the aims of this thesis were to examine the non-nicotine-mediated effects of
tobacco smoke on important neural pathways implicated in reward and reinforcement and to
determine how these may pertain to tobacco addiction. It was thought that a deeper
understanding of the non-nicotine effects of tobacco smoke will in turn lead to promising
developments and improvements in tobacco cessation therapies.
- 41 -
Chapter Two: General Methods
2.1 – CELL CULTURE
This thesis describes studied designed to examine the effects of tobacco compounds in vitro.
The majority of experiments that make up the body of this thesis were conducted on cultured
human cells, which were selected as models of human neuronal and glial cell functioning. The
methods used to culture and maintain these cell lines are outlined below.
2.1.1 - SH-SY5Y Human Neuroblastoma
SH-SY5Y cells are a human neuroblastoma cell sub-line cloned from the SK-N-SH
neuroblastoma cell line. The SK-N-SH neuroblastomacell line was established in 1970 from a
metastatic bone tumour isolated from a 4-year old female patient. The SH-SY5Y cells grow as
a mixture of adherent and free-floating cells, with an epithelial morphology. Adherent cells
grow in clusters of neuroblastic cells which are stellate in appearance, and display short, fine
processes.
The SH-SY5Y cell line was selected for this study as it is a commonly used model of neuronal
cell behavior and physiology. Many studies have been conducted previously examining the
response of SH-SY5Y cells to nicotine and tobacco extracts (Ambrose et al., 2007; Dunckley &
Lukas, 2006; Sokolova et al., 2005), and using this cell line as the primary experimental
organism for this study allows direct comparison with these previously published experiments.
SH-SY5Y cells were not treated with retinoic acid in this study, and undifferentiated cells were
used for all experiments.
Frozen stocks of SH-SY5Y were obtained from the American Type Tissue Collection facility
(Catalogue no. CRL 2266). These cells were grown in Roswell Park Memorial Institute 1640
medium (RPMI-1640, GIBCO, Invitrogen, CA, USA) supplemented with 10% heat-inactivated
fetal calf serum (FCS, v/v), 50 U/mL penicillin G, and 50 µg/mL streptomycin sulphate (all
sourced from GibcoBRL, Invitrogen Life Sciences Inc. CA, USA). Culture and passage conditions
are described in detail in section 2.1.3.

- 42 -
(a) (b)
Figure 6: (a) SH-SY5Y human neuroblastoma cells grown in culture, at low density. Viewed at 400x
magnification. (b) U-118 MG human glioma cells grown at moderate density. Viewed at 400x
magnification. Scale bars represent 100 μm.
2.1.2 - U-118 MG Human Glioma
U-118 MG cells are derived from a human glioblastoma cell line obtained from a malignant
primary glioma isolated from the brain of a 50 year old male patient. The cells grow densely
and adherently with a mixed morphology, and display long, fine processes.
Recently, research has been conducted toward understanding the role of glial cells in brain
function, addiction mechanisms and the impact of drugs of abuse. To date, most studies of
the effects of nicotine and tobacco on glial cells have examined their in vivo activity. A human
in vitro model of glial cell functioning was sought to compare with the neuronal SH-SY5Y cells
in this study. The U-118 MG cell line was chosen from the American Type Tissue Collection
facility (Catalogue no. HTB-15) as it showed only minor cytogenetic abnormalities in
comparison with other glioma cell lines, and could be cultured under the same conditions as
the SH-SY5Y cell line. Additionally, studies had reported that the U-118 MG cell line expresses
acidic glial fibrillary protein (Feindt et al., 1995) – an accepted marker for glial and astrocytic
cells - and so it was thought that U-118 MG may provide a useful in vitro model of glial cell
function to investigate the effects of tobacco and nicotine on monoamine oxidase enzymes
and opioid receptors.
U-118 MG cells were cultured in RPMI-1640 medium, supplemented with 10% heat-
inactivated FCS, 50 U/mL penicillin, and 50 µg/mL streptomycin sulphate, as described below.
- 43 -
2.1.3 – Culture Conditions
Cells frozen in RPMI-1640 growth medium containing 10% DMSO (Sigma-Aldrich Co. St Louis,
USA) were stored in liquid nitrogen. When required, frozen cells were removed from liquid
nitrogen storage and thawed rapidly in a 37°C water bath. Thawed cells were then added to 5
mL of RPMI-1640 culture medium (GIBCO, Invitrogen Ltd, CA, USA), supplemented with 10%
(v/v) heat-inactivated fetal calf serum (FCS), 50 units/mL penicillin G sodium, and 50 µg/mL
streptomycin sulphate (all sourced from GibcoBRL, Invitrogen Life Sciences Inc.). Cells
suspended in media were then centrifuged at room temperature (RT) for 5 min at 300 x g
using a Sigma 3-16 benchtop centrifuge. The medium supernatant was removed from the cell
pellet by aspiration, and the pellet was resuspended in fresh pre-warmed feeding medium.
SH-SY5Y and U-118 MG cells were seeded initially in 50 mL filter-capped cell culture flasks
(Greiner Bio-one) and grown directly on the polystyrene inner surface of the flasks. SH-SY5Y
cells displayed a doubling time of approximately 24 hours, while U-118 MG cells multiplied
slightly faster. The U-118 MG cells could also grow to much higher densities than SH-SY5Y.
When grown at high density U-118 cells displayed a long, thin morphology, but growing at
high density was avoided, as the cells became difficult to detach from the polystyrene
substrate. When cell numbers had increased to approximately 90% confluence, cultures were
passaged, and the cells seeded in larger 250 mL or 650 mL filter-capped polystyrene culture
flasks (Greiner Bio-one). Flasks of cells were incubated at 37°C in a humidified, 5% CO2
atmosphere in a Heraeus incubator (model HeraCell), and the cells were passaged every 3-7
days, or when they reached 90% confluence. The RPMI 1640 medium was replaced in flasks
of growing cells every 5 days, or as required.
2.1.4 – Cell Passaging
Cell cultures were fed and passaged in a horizontal laminar flow cabinet (Biological safety
cabinet class II, AES Environmental Inc.). Before use, the laminar flow cabinet was sterilized
with UV light for 15 min, and the inner surfaces wiped with 70% ethanol. Culture medium was
removed from flasks of near-confluent cells by aspiration, and the cells were rinsed with 250
µL of 0.05% trypsin/0.53 mM EDTA solution (Invitrogen Life Sciences, Ltd. CA, USA) for 30 sec.
The trypsin solution was removed by aspiration, and a further 450 µL of fresh trypsin solution
was added to the culture flasks. Cultures were incubated with the trypsin solution for 3 – 10
min, or until most cells had detached from the flask surface. The inner flask surface was then
- 44 -
rinsed with 5 mL of fresh, pre-warmed medium, and any remaining adherent cells were
detached by tituration with a pipette, or very gentle agitation with a plastic cell scraper
(Greiner Bio-one). The cell suspension was then transferred into a 15 mL polystyrene
centrifuge tube (Greiner Bio-one, GmbH. Germany) and centrifuged at 300 x g in a Sigma 3-16
benchtop centrifuge for 5 min to pellet the cells. The medium supernatant was removed by
aspiration, and the cell pellet resuspended in fresh pre-warmed feeding medium. Cells were
then reseeded in sterile 600 mL polystyrene culture flasks at a ratio of approximately 1:5 – 1:8
dilution.
2.2 – TOBACCO PARTICULATE EXPOSURES
Cultured SH-SY5Y and U-118 MG cells were exposed to tobacco particulate extracts over a
number of different treatment regimens. These specific treatment regimens will be discussed
in detail in the experimental chapters of this thesis, but the general methods used for the
preparation of the TPM and exposure of the cells are detailed below.
2.2.1 - Tobacco Particulate Matter Sample Collection
Several different tobacco types and brands were selected for analysis in this study. Tobacco
particulate matter extracts from these cigarette and loose tobacco samples were kindly
supplied by the Population and Environmental Health group at Environmental Science and
Research (ESR), Kenepuru Science Centre, Porirua, New Zealand.
The majority of the experiments in this thesis compare the effects of two brands of cigarette.
These are Holiday Special Filter® - a leading brand of cigarette sold in New Zealand and Quest®
3 Nicotine-Free cigarettes (Vector Tobacco Inc. NC, USA) – marketed as a low-nicotine
alternative to tobacco in several states of the US. Holiday® brand cigarettes yield less than 1.2
mg nicotine and less than 16 mg of tar in each cigarette and the Quest® cigarettes yield no
more than 0.05 mg of nicotine and 10 mg tar per cigarette, as reported on the cardboard
cigarette packets.
The collection and extraction of all tobacco particulate samples was conducted by ESR
Kenepuru Science Centre as follows.
- 45 -
Cigarette and tobacco samples were sent to Labstat International, Inc. (Kitchener, Canada)
where they were burnt and the smoke collected and extracted by smoking machines. The
total particulate matter (TPM), which includes nicotine, represents the solid combustion
products of tobacco that are inhaled by a smoker. This TPM was collected onto Ø92 mm
Cambridge paper filter pads using the ISO 3308 method (Ambrose et al., 2007). Each filter
typically comprised the TPM collected from twenty cigarettes, and was accurately weighed
before and after TPM collection. This data was used by Labstat to report on the amount of tar
collected on each filter. The filters containing the TPM were sent back to the ESR Kenepuru
Science Centre and stored at -20°C until extraction.
To extract the TPM from the Cambridge filters, the paper filters were cut into quarters and
placed in glass extraction tubes. Absolute ethanol was added (4 mL) to each filter, and the
tubes were then vortexed and sonicated to allow thorough penetration of the filter paper by
the ethanol. The solvent was decanted into a sterile 15 mL polypropylene reaction tube
(Greiner Bio-one, GmbH. Germany), and this process was repeated a further 5 times, using 2
mL aliquots of ethanol. Ethanol was chosen as the extraction solvent to allow capture of as
many volatile compounds from the tar as possible. The solvent fractions were pooled and
assayed for nicotine concentration by ESR Kenepuru, using an Agilent 5973N gas
chromatograph. An HP-5MS (30 m, 0.32 mm I.D., 0.25 mm film thickness) gas chromatograph
column was used, and equipped with a post-column split to a mass spectrometer and nitrogen
phosphorous detector. The mass spectrometer confirmed the presence of nicotine and the
nitrogen phosphorous detector was used for quantitation. The nicotine concentration of the
Holiday® Special Filter TPM (denoted HTPM) was measured to be 1.058 mg/mL (6.523 mM);
and the Quest® Nicotine Free TPM (denoted QTPM) contained 0.056 mg/mL of nicotine (0.271
mM). Quantification of the nicotine concentration in each TPM extract enabled direct
comparison of TPM effects with a nicotine standard, prepared at the same nicotine
concentration (Ambrose et al., 2007).
2.2.2 - Cell Treatments and Exposures
Batches of 650 mL or 250 mL culture flasks of SH-SY5Y and U-118 MG cells were grown to near
confluence in the presence of added volumes of ethanol, purified nicotine, and TPM, from
both Holiday® and Quest® brand cigarettes.
- 46 -
Cell flasks were treated with appropriate volumes of nicotine and TPM to give a final
concentration of 0.2 µM nicotine in the medium. As the QTPM and ethanol could not be
titrated to a known nicotine concentration, volumes of QTPM and ethanol equal to the
volumes of nicotine and TPM used were added to these treatment flasks. The volume of
ethanol added to each flask was kept constant to control for any cellular effects induced by
ethanol. Flasks of untreated SH-SY5Y and U-118 MG cells were prepared as controls as well,
to determine the effect of ethanol exposure on the cells. Cells were exposed to
concentrations of these extracts for 1, 3, or 5 days, as described in the individual experimental
chapters of this thesis. The cells were then harvested and either lysed for enzyme activity
measurements and Western blotting analysis, or treated with TRIzol® reagent for PCR analysis.
2.3 – SAMPLE PREPARATION
Many of the experiments described in this thesis aimed to compare the protein activity and
gene expression profile of treated cells with respect to MAO enzymes or MOR. In order to
maintain the relationship between protein and gene expression between samples and reduce
the sample variation, the samples used for these experiments were prepared from the same
flasks of treated cells. That is, flasks of cells were grown and exposed to tobacco compounds
and upon harvesting, cells were divided so that some were prepared for RNA extraction and
the rest lysed for protein analysis. The methods used for these preparations are detailed
below.
2.3.1 – Protein Lysate Preparation
Flasks of SH-SY5Y and U-118 MG cells previously treated with tobacco compounds were
detached from the flask surface with trypsin and centrifuged, as described above. The cell
pellet was then resuspended in complete medium (RPMI 1640, 10% foetal calf serum, 1%
Penstrep) in 15 mL plastic centrifuge tubes (Greiner Bio-one GmbH. Germany), and cell
numbers were assessed by haemocytometer to determine the concentration of cells in
suspension.
- 47 -
The cell suspension was centrifuged at 300 x g as before for 5 min and the medium
supernatant removed by aspiration. The cell pellet was then resuspended in 50 – 200 µL of
lysis buffer (1 mM MgCl2, 2mM EGTA, 1% Nonidet P40, 50 mM Tris) and homogenized by
tituration with a pipette. The cell lysate solution was removed to a clean, sterile 1.5 mL
microcentrifuge tube and centrifuged at 13,000 g for 10 min at 4°C in an Eppendorf benchtop
centrifuge to pellet any insoluble components. Lysates were immediately frozen and stored at
-80°C until assayed for MAO-A and MAO-B enzyme activity or used for Western blotting.
2.3.2 – TriZol® Total RNA Extraction
After assessing the cell concentration by haemocytometer, appropriate aliquots of the cell
suspension were transferred to sterile 1.5 mL microcentrifuge tubes to give approximately 1 x
106 cells per tube. The microcentrifuge tubes were then centrifuged at room temperature
(RT) for 5 min at 300 g in a Sigma 1-14 benchtop centrifuge. The medium supernatant was
removed by aspiration, and TRIzol® reagent (Invitrogen Ltd., CA, USA) was added to the cell
pellet. Volumes of 1 mL of TRIzol® per 1 x 10⁶ cells were used, and the cell pellet was lysed
and dispersed with repeated pipetting to give a homogeneous solution. Cell lysates prepared
with TRIzol® were then frozen at -80°C for up to 3 months, until required for RNA extraction.
2.3.3 - Protein Concentration Assay
Cell lysates prepared with lysis buffer and stored at -80°C were thawed and assayed for total
protein concentration using a BCA protein assay kit (Pierce. Rockford, IL, USA.). The kit
instructions were followed exactly for the microwell plate procedure. Briefly, a small aliquot
of lysate was diluted 1:10 with sodium phosphate buffer (50 mM sodium phosphate, 150 mM
sodium chloride, pH 7.4), and 25 µL samples of the diluted lysate were assayed in triplicate.
Bovine serum albumin (BSA) protein standards were prepared at concentrations of 0 - 2000
µg/mL. The protein standards and samples (25 µL) were incubated with 200 µL of working
BCA reagent each at 37°C for 30 - 60 min and allowed to cool to room temperature before the
absorbance was recorded at 562 nm with a Versamax microplate reader (Molecular Devices,
Sunnyvale, CA, USA). The absorbance of the protein standards was used to construct a
standard curve for estimation of the total protein concentration of the lysate samples.
- 48 -
2.4 – MONOAMINE OXIDASE ACTIVITY ASSAYS
Measurement of the monoamine oxidase enzyme activity in cultured human cells comprised a
major part of the experimental work for this project. Two different assays were tested and
compared for their reliability, sensitivity, and appropriateness for the experiments required.
The first of these was the Amplex Red® monoamine oxidase enzyme assay, obtained
commercially from Molecular Probes, Ltd (Eugene, OR, USA). Additionally, a modified method
of the monoamine oxidase enzyme assay utilizing the fluorescent MAO substrate kynuramine
as reported by Morinan and Garrett (1985) was developed and optimized. The kynuramine
assay was used for the bulk of the MAO enzyme experiments reported here, and further
adapted and refined as required. These reactions were used to assess the MAO enzyme
activity in total cell lysates, and in purified recombinant MAO-A and MAO-B enzymes,
obtained commercially from Sigma-Aldrich, Inc (St Louis, MO, USA). The procedures used to
conduct the Amplex Red® and Kynurmaine assays are described below.
2.4.1 - Amplex® Red Monoamine Oxidase Activity Assay
The Amplex® Red Monoamine Oxidase Assay kit (Molecular Probes, A12214) was trialed for
measuring MAO-A and MAO-B enzyme activity in cultured cells. The manufacturer’s
instructions were followed exactly. Briefly, cell lysates were prepared as described above
(Section 2.3.1), and assayed for total protein concentration using the BCA assay kit. Protein
lysate solutions were diluted to a known standard concentration with 1X Reaction Buffer, and
100 µL aliquots of diluted lysate were added to the wells of a black 96-well microplate
(Greiner BioOne GmbH, Germany). A positive control was prepared by diluting a 3% hydrogen
peroxide solution to 10 µM in reaction buffer, and 100 µL of this solution was added to a well
in the microplate. The Amplex® Red working solution was prepared (400 µM Amplex® Red
reagent, 2 U/mL horseradish peroxidase, 2 mM p-tyramine substrate), and the reaction was
initiated by addition of 100 µL of Amplex® Red working solution to each 100 µL sample (a total
volume of 200 µL per well). Reactions were incubated in the dark at ambient RT for between
30 min and 2 hours.
The Amplex Red® enzyme assay allowed differentiation of MAO-A and MAO-B activity through
the inclusion of different enzyme inhibitors in the assay working solution. Depending on
- 49 -
which MAO enzyme was being measured, the Amplex Red® working solution also contained
0.5 µM pargyline for measuring MAO-A activity, or 0.5 µM clorgyline when measuring MAO-B
activity.
A standard curve was prepared by diluting a resorufin solution to appropriate concentrations,
and 200 µL of each resorufin standard was added to the micro-well plate prior to measuring
fluorescence. Fluorescence was measured in a SpectraMax Gemini fluorescence multiplate
reader (Molecular Devices Ltd., CA, USA.) using an excitation wavelength of 560 nM and
emission detection at 590 nm. Measurements were taken either at one final time point (end-
point measurement), or once every 2 min over the course of the total reaction incubation
time (up to 2 hrs, for kinetic measurements).
2.4.2 - Kynuramine Monoamine Oxidase Activity Assay
The kynuramine monoamine oxidase activity assay employed in this study adapted a method
previously described by Morinan and Garrett (1985). Modifications to the reported protocol
were made to streamline the assay and allow for higher throughput of test samples. This
involved adapting the assay for use with smaller volumes and for analysis in a 96-well plate.
The different formats of the kynuramine assay used in this study are described below.
2.4.2.1 – Kynuramine Microcentrifuge Tube Procedure
Previously prepared and quantified cell lysates or purified MAO-A or MAO-B human
recombinant enzyme (Sigma) were thawed at room temperature and maintained on ice until
required for testing. Aliquots of 100 µL of cell lysate or MAO enzyme were added to 870 µL of
sodium phosphate buffer (50 mM sodium phosphate, 150 mM sodium chloride, pH 7.4) in a
1.5 mL plastic microcentrifuge tube (Eppendorf, GmbH. Hamburg, Germany). The solutions
were incubated in a 37°C water bath for 5 min to equilibrate the reaction temperatures. The
assay reaction was started with addition of a 30 µL aliquot of 3.07 mM kynuramine
hydrobromide (Sigma-Aldrich, Inc. St Louis, MO, USA) to each reaction tube (a total reaction
volume of 1 mL). Addition of the kynuramine substrate was carefully timed, and the reaction
tubes were returned to the water bath and incubated at 37°C for 15–60 min. The reaction
was terminated by addition of 300 µL of 0.4 M perchloric acid (Sigma-Aldrich, Inc. St Louis,
MO, USA.), to deactivate and precipitate the proteins. The reaction tubes were then
- 50 -
centrifuged at 13,000 g for 30 sec at 4°C in an Eppendorf refrigerated benchtop centrifuge to
pellet any precipitated proteins, as insoluble proteins interfere with the fluorescence
measurement.
Between three and five 100 µL aliquots of each reaction solution were added to the wells of a
sterile black polystyrene 96-well microwell plate (Greiner Bio-one GmbH, Germany). Dilutions
of a 4-hydroxyquinoline reference standard were prepared (0 – 5000 nM) and added in
triplicate to the micro-well plate to construct a standard curve. NaOH (200 µL of 1 M) solution
was added to each well to cause the 4-hydroxyquinoline product to fluoresce. The micro-well
plate was tapped gently several times to ensure adequate mixing of samples before recording
fluorescence. Fluorescence was measured immediately using a SpectraMax Gemini
spectrophotometer, at 318 nm excitation and 380 nm emission wavelengths, respectively.
The 4-hydroxyquinoline standard curve was used to quantitate the concentration of product
present in each well, and these data were used to calculate the MAO activity of each sample.
2.4.2.2 – Kynuramine Microplate Procedure
The micro-tube assay described above was further refined and adapted to be carried out
entirely in a 96-well plate format. This allowed higher-throughput of TPM samples to test for
MAO inhibition. This method was used as a bio-assay to test TPM samples from different
tobacco sources for their effects on the activity of human recombinant MAO-A (Cat. M7316)
and MAO-B (Cat. M7441) enzymes, sourced commercially (Sigma-Aldrich, Inc. St Louis, MO,
USA).
Previously prepared TPM extracts were diluted to working concentrations with sodium
phosphate buffer (pH 7.4) in sterile plastic microcentrifuge tubes. A constant ethanol
concentration of 0.05% was maintained in these solutions to control for the effects of ethanol
on the activity of MAO enzymes. TPM dilutions were added in triplicate to the wells of a black
polystyrene 96-well micro-plate (Greiner BioOne, GmbH. Germany) in 100 µL aliquots. A 4-
hydroxyquinoline reference standard was diluted over a range of concentrations to generate a
standard curve, and 200 µL aliquots of each standard were added to the micro-well plate in
triplicate by pipette. A 0.307 mM working solution of kynuramine dihydrobromide was
prepared in sodium phosphate buffer (50 mM sodium phosphate, 150 mM sodium chloride,
pH 7.4), and 60 µL of this solution was added to each reaction well on the plate. Frozen
aliquots of human recombinant MAO-A or MAO-B (Sigma-Aldrich) were reconstituted to 125
µg/mL by addition of sodium phosphate buffer. The micro-plate reactions were started by
- 51 -
addition of 40 µL of diluted MAO-A or MAO-B enzyme to each reaction well. To allow for
auto-fluorescence of the TPM samples, reaction wells containing diluted TPM, kynuramine
working solution, and sodium phosphate buffer in place of the MAO enzyme were also
prepared. The microwell plate was then covered with aluminium foil to protect it from light,
and the plate was incubated at 37°C in a Hereaus Christ Hera-Cell incubator for 30 min.
The reaction was terminated by addition of 75 µL of 2.5 M NaOH to each reaction well and
reference standard well. This had the dual effect of inactivating the enzyme and causing the
4-hydroxyquinoline product to fluoresce in excess alkali solution. The 96-well plate was then
analysed for fluorescence immediately with an Optima® fluorescent spectrophotometer using
excitation and emission wavelengths of 320 nm and 380 nm, respectively. The 4-
hydroxyquinoline standards were used to construct a standard curve that was used to
quantitate the concentration of product present in each well. Data from reactions that
included dilutions of TPM were compared to a control reaction performed with 0.05% ethanol
in place of TPM, to determine the percentage inhibition of MAO enzyme by the TPM extract.
2.5 – WESTERN BLOTTING
2.5.1 - Polyacrylamide Gel Electrophoresis
Protein samples of 20 – 100 µg were prepared for electrophoresis by adding appropriate
volumes of lysate to 2.5 µL 4x LDS sample buffer, and 1 µL of 10x reducing agent (both
NuPAGE®products from Invitrogen Co., Carlsbad CA, USA). Protein samples were then heated
at 70°C for 10 min on a dry heating block and allowed to cool. Prepared samples and a 7 µL
aliquot of Precision Plus® (BioRad, Hercules CA., USA) molecular weight protein standard were
loaded into the wells of a 1.0 mm 8-14% polyacrylamide NuPAGE® protein gel (Invitrogen Co).
Gels and loaded proteins were electrophoresed for 1 hr at 200 V in an Invitrogen XCell Mini-
gel tank filled with electrophoresis tank buffer (NuPAGE® MOPS SDS Running Buffer,
Invitrogen Co. CA, USA). A 500 µL aliquot of NuPAGE antioxidant was added to the centre
chamber of the tank, as per the manufacturer’s instructions.
2.5.2 - Immunoblotting Procedure
- 52 -
Immobilon FL polyvinylidene difluoride (PVDF) membrane (Millipore Corp, Billerica, MA, USA)
was cut to the same dimensions as the Invitrogen mini-gel. The PVDF was then soaked for 5
min in 100% methanol and rinsed with ddH2O before use. The membrane, blotting paper (3
mm thickness), and blotting pads were soaked in Western transfer buffer (refer to Appendix I)
for 15 min, and the blotting apparatus (TransBlot® cell, BioRad, Hercules CA, USA) was
assembled (see Appendix).
An icepack and a magnetic stirrer bar were added to the TransBlot® tank, before the tank was
filled with Western transfer buffer, to ensure adequate cooling of the apparatus. Proteins
present in the mini-gel were transferred to the membrane at 4°C for 3 hr at 400 mA. On
completion of the transfer, the apparatus was disassembled and the polyacrylamide gel
stained in 0.025% R-250 Coomassie brilliant blue overnight to check for efficient protein
transfer. The PVDF membrane was rinsed with ddH2O, soaked for 5 min in T-TBS (refer to
Appendix I), and blocked overnight in a 5% non-fat milk powder solution (Anchor Milk, NZ) in
T-TBS at 4°C on a rocker platform.
After overnight blocking, the membrane was rinsed and washed in T-TBS in triplicate for 5 min
each wash. The membrane was then incubated with 2 mL of primary antibody solution (see
section 2.5.5) diluted in T-TBS. Antibodies for the house-keeping protein β-tubulin were
included in the primary antibody solutions also. The PVDF membrane was exposed to the
primary antibody solution for 4 hr on a rocker platform at ambient RT before rinsing and
washing three times with T-TBS. The membrane was then incubated with the appropriate
secondary antibody conjugated to a Cy™-5 fluorophore, as described in section 2.5.5. The
secondary antibodies were diluted in T-TBS and applied to the PVDF membrane, before
incubating on a rocker platform for one hr at RT.
Immunostained PVDF membranes were then washed 4 times with T-TBS before being
visualized on a Fuji-Film FLA-5100 fluorescent scanner. The fluorescence generated by the
Cy™-5 conjugated secondary antibodies was recorded using the red 635 nm filter, and Cy™-3
stained blots were visualized with the green 532 nm filter, each producing a 16-bit grayscale
TIFF image file. The images obtained from the fluorescent scanner were then used for
densitometry analysis with ImageJ software (ImageJ v1.34s, Wayne Rasband, National
Institutes of Health, USA), using the integrated pixel density method. The molecular weights
of resolved bands were estimated by comparison with the known sizes of the molecular
weight markers.
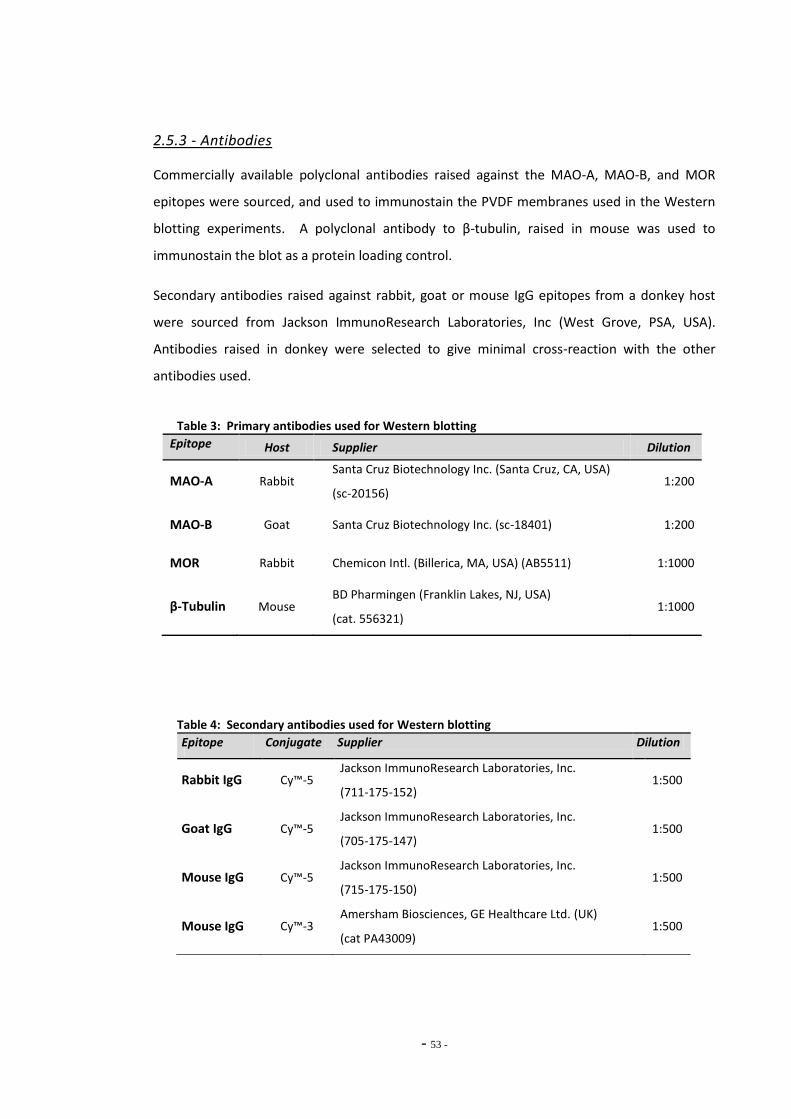
- 53 -
2.5.3 - Antibodies
Commercially available polyclonal antibodies raised against the MAO-A, MAO-B, and MOR
epitopes were sourced, and used to immunostain the PVDF membranes used in the Western
blotting experiments. A polyclonal antibody to β-tubulin, raised in mouse was used to
immunostain the blot as a protein loading control.
Secondary antibodies raised against rabbit, goat or mouse IgG epitopes from a donkey host
were sourced from Jackson ImmunoResearch Laboratories, Inc (West Grove, PSA, USA).
Antibodies raised in donkey were selected to give minimal cross-reaction with the other
antibodies used.
Table 3: Primary antibodies used for Western blotting
Epitope Host Supplier Dilution
MAO-A Rabbit Santa Cruz Biotechnology Inc. (Santa Cruz, CA, USA)
(sc-20156) 1:200
MAO-B Goat Santa Cruz Biotechnology Inc. (sc-18401) 1:200
MOR Rabbit Chemicon Intl. (Billerica, MA, USA) (AB5511) 1:1000
β-Tubulin Mouse BD Pharmingen (Franklin Lakes, NJ, USA)
(cat. 556321) 1:1000
Table 4: Secondary antibodies used for Western blotting
Epitope Conjugate Supplier Dilution
Rabbit IgG Cy™-5 Jackson ImmunoResearch Laboratories, Inc.
(711-175-152) 1:500
Goat IgG Cy™-5 Jackson ImmunoResearch Laboratories, Inc.
(705-175-147) 1:500
Mouse IgG Cy™-5 Jackson ImmunoResearch Laboratories, Inc.
(715-175-150) 1:500
Mouse IgG Cy™-3 Amersham Biosciences, GE Healthcare Ltd. (UK)
(cat PA43009) 1:500
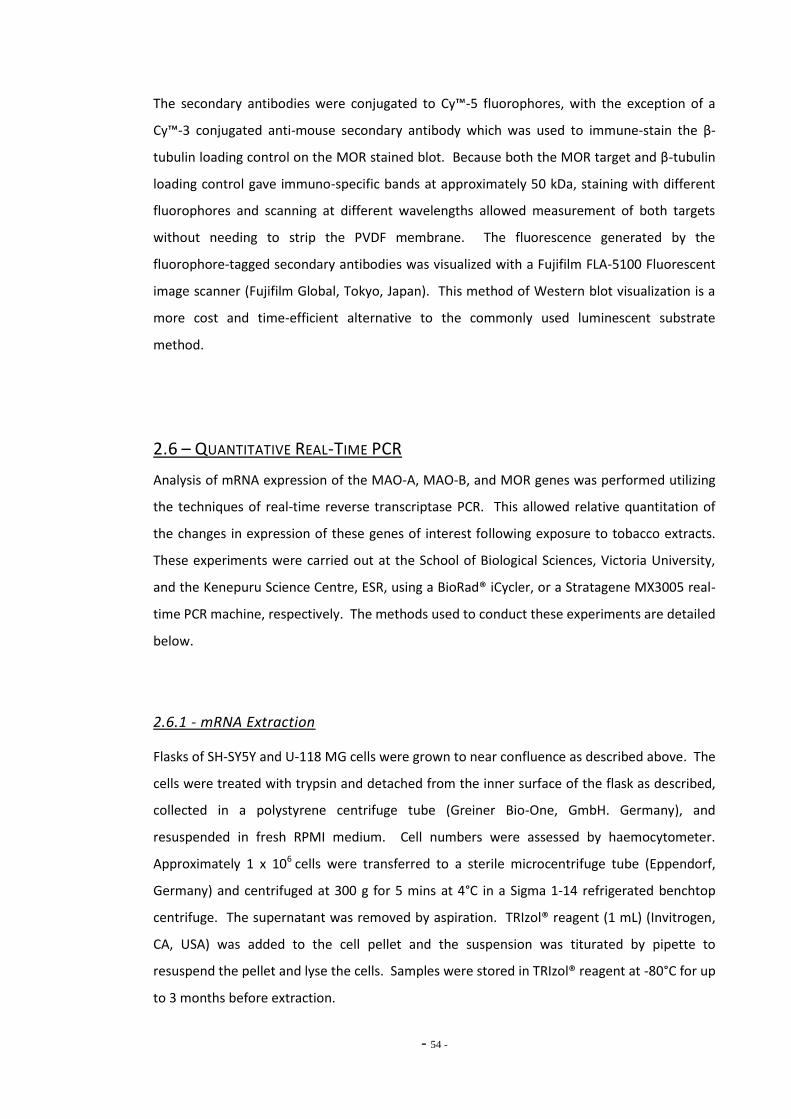
- 54 -
The secondary antibodies were conjugated to Cy™-5 fluorophores, with the exception of a
Cy™-3 conjugated anti-mouse secondary antibody which was used to immune-stain the β-
tubulin loading control on the MOR stained blot. Because both the MOR target and β-tubulin
loading control gave immuno-specific bands at approximately 50 kDa, staining with different
fluorophores and scanning at different wavelengths allowed measurement of both targets
without needing to strip the PVDF membrane. The fluorescence generated by the
fluorophore-tagged secondary antibodies was visualized with a Fujifilm FLA-5100 Fluorescent
image scanner (Fujifilm Global, Tokyo, Japan). This method of Western blot visualization is a
more cost and time-efficient alternative to the commonly used luminescent substrate
method.
2.6 – QUANTITATIVE REAL-TIME PCR
Analysis of mRNA expression of the MAO-A, MAO-B, and MOR genes was performed utilizing
the techniques of real-time reverse transcriptase PCR. This allowed relative quantitation of
the changes in expression of these genes of interest following exposure to tobacco extracts.
These experiments were carried out at the School of Biological Sciences, Victoria University,
and the Kenepuru Science Centre, ESR, using a BioRad® iCycler, or a Stratagene MX3005 real-
time PCR machine, respectively. The methods used to conduct these experiments are detailed
below.
2.6.1 - mRNA Extraction
Flasks of SH-SY5Y and U-118 MG cells were grown to near confluence as described above. The
cells were treated with trypsin and detached from the inner surface of the flask as described,
collected in a polystyrene centrifuge tube (Greiner Bio-One, GmbH. Germany), and
resuspended in fresh RPMI medium. Cell numbers were assessed by haemocytometer.
Approximately 1 x 10⁶ cells were transferred to a sterile microcentrifuge tube (Eppendorf,
Germany) and centrifuged at 300 g for 5 mins at 4°C in a Sigma 1-14 refrigerated benchtop
centrifuge. The supernatant was removed by aspiration. TRIzol® reagent (1 mL) (Invitrogen,
CA, USA) was added to the cell pellet and the suspension was titurated by pipette to
resuspend the pellet and lyse the cells. Samples were stored in TRIzol® reagent at -80°C for up
to 3 months before extraction.
- 55 -
To maintain the quality and integrity of extracted RNA, precautions were taken to avoid
contamination of the samples with RNases that would degrade the sample. These precautions
included using only sterile, certified RNase-free pipette tips and micro-centrifuge tubes in all
RNA extraction and handling procedures.
To extract frozen samples stored in TRIzol® reagent, the samples were first thawed at RT for
15 min. A 200 µL aliquot of molecular grade chloroform (Sigma-Aldrich, NZ) was added to
each tube and the tubes shaken vigorously by hand for 15 sec. Samples were incubated at RT
for 3 min and then centrifuged at 10,000 g for 15 min at 4°C (Sigma 1-14 benchtop centrifuge).
The upper aqueous colourless phase containing the RNA was carefully removed by pipette and
transferred to sterile, labeled microcentrifuge tubes (Eppendorf, Germany). Absolute ethanol
(500 µL) was added to each tube to precipitate the RNA, and the solutions were incubated at
RT for 10 min.
The samples were then applied to RNA spin cartridges from the Invitrogen Micro-to-Midi RNA
Purification kit® and the kit instructions followed exactly. Briefly, the samples were
centrifuged in the spin cartridges for 15 sec at 12,000 g, and the ethanol flow-through was
discarded. The spin cartridge was then sequentially washed with the kit wash buffers and
centrifuged for 15 sec at 12,000 g, discarding the buffer flow-through between each wash.
The cartridge was reassembled with an RNA recovery tube, and total RNA was eluted off the
spin cartridge filter into 60 µL of DEPC-treated RNase-free water. Total RNA extracts were
stored at -80°C until required for reverse transcription.
2.6.2 - Reverse Transcription
RNA extracts were tested for concentration and purity with a Nanodrop ND-1000
spectrophotometer, and tested for degradation using an RNA 6000 Nano kit for the Agilent
2100 Bioanalyzer (Agilent Technologies, Inc., USA). The Bioanalyzer is a micro-fluidics based
platform which allows rapid gel analysis of RNA samples, giving values for calculated RNA
concentration, and RNA Integrity Number (RIN). The RIN is a measure of the quality and
integrity of the RNA sample scored out of 10.0, and lower RIN scores indicate partial or
significant RNA degradation. For the experiments conducted for this thesis, only RNA samples
with an RIN score greater than 9.0, an OD260/OD280 ratio greater than 1.8, and a
concentration greater than 80 ng/µL were used for qRT-PCR experiments. This ensured that
the RNA used was of very high quality and purity.
- 56 -
An iScript® cDNA Synthesis kit (BioRad Ltd. Berkely, CA, USA) was used to synthesize first-
strand cDNA from the purified RNA samples. The iScript cDNA synthesis kit allows priming of
total RNA using oligo-dTs. This method was chosen to amplify the RNA for this study instead
of using gene specific primers, since the mRNA for several genes was to be amplified from
each RNA sample. Oligo-dT priming allows the amplification of several RNA targets from the
same sample. The iScript kit also provides Reverse Transcriptase pre-blended with RNase
inhibitors to eliminate RNA degradation by RNases. When preparing the RT reactions the
manufacturer’s instructions were followed exactly. Briefly, 500 ng of purified total RNA was
added to 4 µL of 5x iScript reaction mix and 1 µL of iScript reverse transcriptase. Sufficient
nuclease-free water was added to bring the reaction mixture to a 20 µL final volume. The
reaction tubes were incubated for 5 min on a 25°C dry heat block, and then for 30 min at 42°C.
Reverse transcription reactions were terminated by incubating the tubes at 85°C for 5 min,
then chilling on ice. Synthesized cDNA was stored at -20°C for up to 3 months before being
used for PCR analysis.
2.6.3 - Quantitative Real-Time PCR
Quantitative PCR was conducted on either the BioRad iCycler® instrument, or the Stratagene
MX3005 instrument using the fluorescent, double-stranded DNA-specific dye SYBR Green.
This allows real-time monitoring of the increase in PCR product after every amplification cycle,
based on the increase in SYBR Green fluorescence.
Previously prepared cDNA template (1 µL) was added to a Platinum SYBR Green qPCR
SuperMix-UDG (Invitrogen, 11733-046). For the iCycler® instrument, this supermix comprised
50% SYBR Green, 20 nM fluorescein, and 200 nM primers to give a total reaction volume of 25
µL. Addition of fluorescein is necessary for the PCR detection system used by the iCycler
instrument to measure background fluorescence (well factors). Background fluorescence is
measured in individual wells at the initiation of each PCR experiment and used to correct for
non-uniformity in fluorescence. For the Stratagene instrument, the SYBR-Green supermix was
comprised of 50% SYBR Green, 200 nM primers, and the fluorescein was replaced with 50 nM
ROX dye, for measurement of well factors, as per the manufacturer’s instructions.
Reaction mixtures were added to thin-walled polypropylene PCR strip tubes, and the strips
mounted in the real-time PCR instrument. Samples were amplified using a pre-set protocol
- 57 -
with the following cycling conditions. The cycling protocol began with an initial step of 50°C
for 2 min prior to amplification to activate uracil-N-glycosylase (included in the SYBR Green
SuperMix) which degrades any contaminating RNA template. The cDNA was denatured for 2
min at 95°C, and amplification was carried out over 35 cycles of 95°C for 15 sec
(denaturation); 60°C for 30 sec (annealing); 72°C for 30 sec (elongation). The cycling protocol
was completed with a melt curve sequence which analysed the temperature at which the PCR
products dissociated. This step was performed as a check for PCR product specificity. PCR
products were then held at 4°C until removed from the PCR instrument. A primer annealing
temperature of 60°C was used for all primer sets.
2.6.4 – PCR Primer Design and Validation
Primers specific for the amplification of the genes of interest to this study were designed and
synthesized or supplied as described below.
DNA-directed RNA polymerase II subunit F (POLR2F) was selected as a reference gene based
on the findings of a study to identify reference genes in SH-SY5Y cells that would be suitable
for qRT-PCR (Hoerndli et al., 2004). The primer pair sequence for POLR2F was sourced from
Hoerndli et al. (2004), and the primer specificity was analysed and validated as for the other
primers, as described above. These primers amplify a 65 bp segment of the human POLR2F
gene, which lies within exon 5. The amplicon runs from position 383 to 438 of the mRNA
transcript. Stable expression of POLR2F was validated by comparison to two other house-
keeper genes, Glyceraldehyde-3-Phosphate dehydrogenase (GAPDH) and Myosin
phosphatase-Rho interacting protein (M-RIP), as described in section 6.3.1.2 of this thesis.
GAPDH and M-RIP primer sequences were also sourced from Hoerndli et al. (2004).
Primer pairs for human MAO-A and MAO-B had been previously designed and validated by
Michael Green and Dr Rod Lea at ESR Kenepuru Science Centre. The MAO-A primers amplify a
457 bp section of the MAO-A gene, which spans an area of the gene running from exon 8 to
exon 13. This section runs from position 1002 to position 1458 of the mRNA transcript. The
MAO-B primers amplify a 104 bp segment of the human MAO-B mRNA, from position 1288 to
position 1391. This PCR product spans exons 11 and 12 of the human MAO-B gene. The
specificity of these primers to the intended genes was confirmed by BLAST search for the
predicted amplicon. Primer specificity was further checked by analysis of the PCR products by
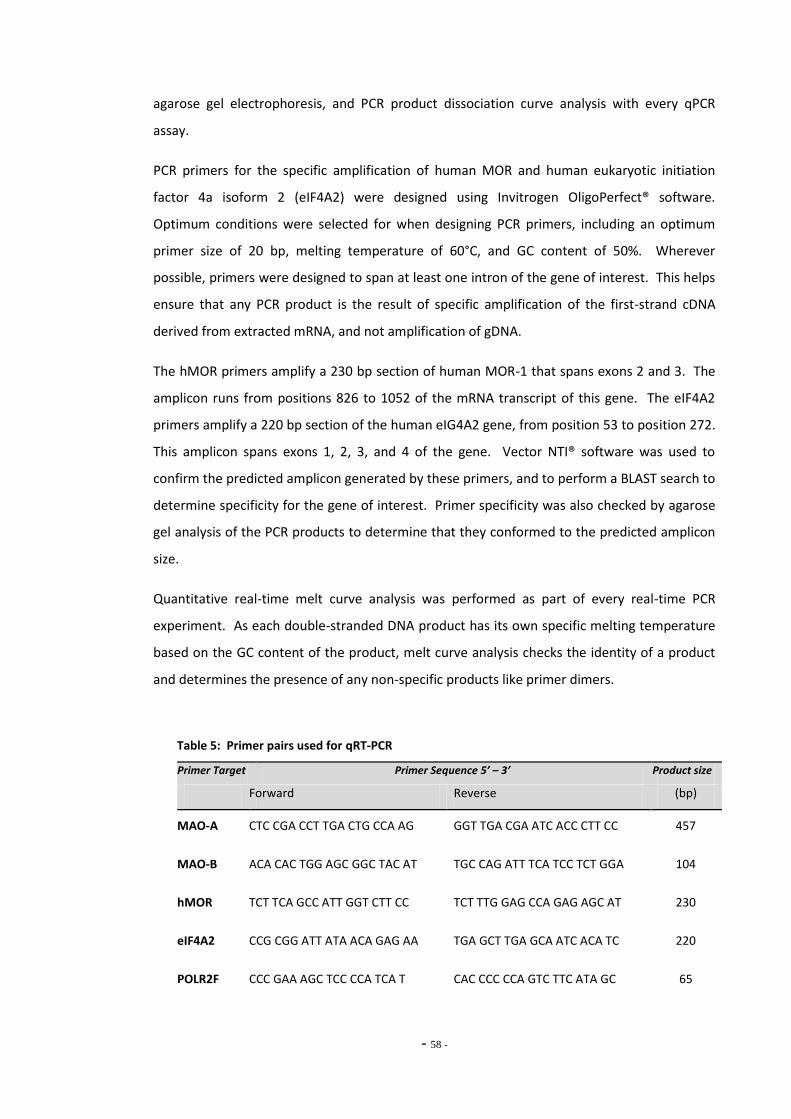
- 58 -
agarose gel electrophoresis, and PCR product dissociation curve analysis with every qPCR
assay.
PCR primers for the specific amplification of human MOR and human eukaryotic initiation
factor 4a isoform 2 (eIF4A2) were designed using Invitrogen OligoPerfect® software.
Optimum conditions were selected for when designing PCR primers, including an optimum
primer size of 20 bp, melting temperature of 60°C, and GC content of 50%. Wherever
possible, primers were designed to span at least one intron of the gene of interest. This helps
ensure that any PCR product is the result of specific amplification of the first-strand cDNA
derived from extracted mRNA, and not amplification of gDNA.
The hMOR primers amplify a 230 bp section of human MOR-1 that spans exons 2 and 3. The
amplicon runs from positions 826 to 1052 of the mRNA transcript of this gene. The eIF4A2
primers amplify a 220 bp section of the human eIG4A2 gene, from position 53 to position 272.
This amplicon spans exons 1, 2, 3, and 4 of the gene. Vector NTI® software was used to
confirm the predicted amplicon generated by these primers, and to perform a BLAST search to
determine specificity for the gene of interest. Primer specificity was also checked by agarose
gel analysis of the PCR products to determine that they conformed to the predicted amplicon
size.
Quantitative real-time melt curve analysis was performed as part of every real-time PCR
experiment. As each double-stranded DNA product has its own specific melting temperature
based on the GC content of the product, melt curve analysis checks the identity of a product
and determines the presence of any non-specific products like primer dimers.
Table 5: Primer pairs used for qRT-PCR
Primer Target Primer Sequence 5’ – 3’ Product size
Forward Reverse (bp)
MAO-A CTC CGA CCT TGA CTG CCA AG GGT TGA CGA ATC ACC CTT CC 457
MAO-B ACA CAC TGG AGC GGC TAC AT TGC CAG ATT TCA TCC TCT GGA 104
hMOR TCT TCA GCC ATT GGT CTT CC TCT TTG GAG CCA GAG AGC AT 230
eIF4A2 CCG CGG ATT ATA ACA GAG AA TGA GCT TGA GCA ATC ACA TC 220
POLR2F CCC GAA AGC TCC CCA TCA T CAC CCC CCA GTC TTC ATA GC 65

- 59 -
GAPDH ATT CCA CCC ATG GCA AAT TC GGG ATT TCC ATT GAT GAC AAG C 71
M-RIP ATC TCA GCC ATC GAA GCC AT TGG CTC TTC TCC AGC TCC C 68
- 60 -
2.6.4.1 - Agarose Gel Electrophoresis
After amplification by conventional or real-time PCR, cDNA samples were analysed by agarose
gel electrophoresis to determine the size of the amplicon. Sufficient 5x DNA loading dye was
added to the DNA samples to give a final concentration of 1x loading dye before the samples
were pipetted into the wells of a 1% agarose gel containing 1 µg/mL of ethidium bromide. A 7
µL aliquot of 1kb+ DNA ladder (100 – 1000 bp, Invitrogen) was loaded onto the agarose gel
also, to serve as a molecular weight standard. Electrophoresis was performed at 100 V for
approximately 45 min, or until the dye front had migrated sufficiently through the gel.
The gels were checked for DNA bands by visualization with a UV-transilluminator (UVP, Inc.
Upland, CA), before capturing a digital photograph of the gel with a Kodak® Gel Logic 100
digital imaging system.
2.7 – STATISTICAL ANALYSIS
Statistical analyses and tests on all data were performed using Graphpad Prism v5.0
(Graphpad software, Inc. San Diego, CA). Tests performed included student’s t-tests, and one-
and two-way Analysis of Variance (ANOVA), with relevant post-hoc tests including the
Bonferroni multiple comparison post-test and Dunnett’s post-test. Dose-response
relationships and enzyme reactions were analysed by non-linear regression analysis, as noted.
Graphpad Prism v5.0 and Microsoft Excel 2007 were used for graphing and data manipulation.
The details of the tests performed will be described with the results of the individual
experimental chapters of this thesis.
- 61 -
Chapter Three: Development of a fluorimetric MAO enzyme activity assay
The aim of a major part of this study was to assess the effects of tobacco compounds on the
enzymatic activities of MAO-A and MAO-B under a number of different conditions. To obtain
meaningful data on the effects of tobacco on MAO activity, a fast, sensitive, and robust
quantitative enzymatic assay was required. Because this study intended to test a large
number of samples from various extracts and tissue, the preferred assay method needed to
be suitable for rapid, high-throughput processing of these samples.
Historically, a number of different methods have been developed and employed to detect and
quantify the activity of MAO enzymes in vitro and in vivo. Many of these studies have utilized
radio-labelled MAO substrates to measure enzyme activity. For example, O’Carroll et al.
(1983) used [14C]-dopamine as a substrate for MAO in human brain tissue homogenates,
measuring the accumulation of the deaminated radio-labelled products. The study also
employed the inhibitors l-deprenyl and clorgyline to distinguish between the activity of MAO-
A and MAO-B, respectively. Yu & Boulton (1987) assessed the inhibition of MAO in rat lung
homogenates following tobacco smoke exposure with a similar radio-chemical assay that used
different substrates to differentiate MAO-A from MAO-B activity. Radio-labelled 5-
hydroxytryptamine and β-phenylethylamine were the substrates used for MAO-A and MAO-B,
respectively. Similarly, Hauptmann & Shih (2001) measured inhibition of MAO-A and MAO-B
in rat mitochondrial preparations using [14C]-serotonin and [14C]-phenylethylamine, and Rose
et al. (2001) measured MAO-B activity in human blood platelets using [14C]-benzylamine.
While radio-chemical assays are sensitive and can be designed to use the enzyme’s native
substrates, many laboratories prefer to avoid the added inconvenience of working with
radioactive isotopes. Other quantitative MAO enzyme assays exploit various characteristics of
the deamination reaction catalysed by MAO. As discussed earlier (section 1.3.1), MAO
requires molecular oxygen to oxidize monoamine substrates to an aldehyde intermediate,
producing hydrogen peroxide as a by-product. Several studies have directly assessed MAO
- 62 -
activity through measuring the consumption of oxygen by the enzyme using a polarographic
oxygen electrode (Krueger & Singer, 1993; Sweetman & Weetman, 1969). This method is
reportedly very accurate and reproducible, but is unsuitable for rapid high-throughput testing
of large numbers of samples.
3.1.1 - Amplex Red Assay
The Amplex® Red assay described by Zhou & Panchuk-Voloshina (1997) measures
accumulation of the hydrogen peroxide by-product produced during the MAO deamination
reaction to quantitate enzyme activity. Amplex® Red (N-acetyl-3,7-dihydroxyphenoxazine) is a
highly sensitive fluorescent probe which, in the presence of horseradish peroxidase, is
converted by hydrogen peroxide to the stable fluorescent product resorufin. The assay has
been developed as a commercially available kit for the fluorimetric measurement of MAO
enzyme activity (Molecular Probes Ltd., Invitrogen). The Amplex® Red assay can be
performed in a 96-well microplate format which is suitable for high-throughput testing, and
the kit design allows measurement of enzyme activity at the reaction end-point or
continuously for kinetic measurements. The fluorescent product detected in this assay –
resorufin - has a fluorescence maximum of approximately 585 nm, giving this assay the
advantage of being largely unaffected by autofluorescence in most biological samples. The kit
has been designed to selectively distinguish between the activity of MAO-A and MAO-B
through the use of the selective MAO-A and MAO-B inhibitors clorgyline and pargyline,
respectively.
The Amplex Red 96-well microplate kit has been used to test MAO enzyme activity in a
number of different enzyme preparations with good sensitivity. Zhou & Panchuk-Voloshina
(1997) reported the measurement of MAO-B activity from 0.0125 U/mL of purified MAO-B
enzyme, and the detection of MAO-A and MAO-B enzyme activity from bovine brain
homogenates containing 200 µg of total protein per reaction. Snell et al. (2002) successfully
used the Amplex® Red kit to examine MAO-B activity in human blood platelets using 15 µg of
total protein per well. Another study by Guang & Du (2006) distinguished MAO-A and MAO-B
enzyme activity in rat brain mitochondrial homogenates with a final protein concentration of
0.2 mg/mL, using serotonin as a substrate for MAO-A and benzylamine as a substrate for
MAO-B.

- 63 -
3.1.2 – Kynuramine Assay
Although the Amplex® Red kit is reportedly very sensitive, it measures MAO enzyme activity
indirectly via a coupled reaction, which increases the complexity of the assay and can
complicate data interpretation. The kynuramine assay is another commonly used fluorimetric
assay that measures the activity of MAO directly, rather than through a coupled reaction.
Kynuramine is a substrate for both MAO-A (Km = 42 µM) and MAO-B (Km = 26 µM) (Yan et al.,
2004), which catalyze the deamination of kynuramine to the product 4-hydroxyquinoline (4-
HQ), also known as quinolinol. 4-HQ fluoresces in the presence of strong alkali conditions at
an excitation wavelength of 318 nm and an emission wavelength of 380 nm (Massey &
Churchich, 1977).
The kynuramine assay was first described by Kraml (1965), and revised by Morinan & Garrett
(1985), who significantly increased the sensitivity of the assay. Morinan & Garrett (1985)
measured MAO activity in rat brain homogenates and tested the effects of a number of
selective and non-selective MAO inhibitors. They detected MAO activity in homogenates
using 500 µg total protein per reaction, and reported the lower limit of detection for pure 4-
HQ product as 500 fM. A number of other studies have used variations of the basic
kynuramine assay such as Mahmood et al. (1994) who assayed rat brain homogenates for
MAO-B activity following exposure to selegiline, a selective MAO-B inhibitor. In addition,
Mendez-Alvarez, et al. (1997b) used kynuramine to measure the inhibition of MAO-A and
MAO-B in rat brain mitochondria in response to treatment with a number of compounds
isolated from tobacco smoke, and Rommelspacher, et al. (2002) measured MAO-B activity in
the blood platelets of human smokers.
More recently, the kynuramine assay has been developed further to provide more
sophisticated detection of the 4-HQ fluorescent product. Yan et al. (2004) incubated human
recombinant MAO-A and MAO-B enzymes with kynuramine in 96-well microplates before
analyzing the reactions for 4-HQ concentration by liquid chromatography with tandem mass
spectrometry (LC/MS/MS). They state their method provides a highly sensitive and specific
assay that can be used for high through-put screening of MAO inhibitors. Herraiz & Chaparro
(2005) also used recombinant human MAO-A and MAO-B with kynuramine and detected the
4-HQ reaction product using reverse phase high performance liquid chromatography (RP-
HPLC) and fluorescence detection. They successfully used their modified technique to
determine whether two compounds isolated from tobacco smoke extract inhibited MAO
enzymes.
- 64 -
3.1.3 – Other MAO Assays
Other more sophisticated methods have also been recently developed to assay for MAO
enzyme activity. The MAO Glo® assay (Promega Corporation, WI) uses a derivative of beetle
luciferin as a substrate for MAO, and the reaction product emits light with addition of
luciferase. Like the Amplex Red® kit, this assay is performed in a 96-well microplate, making it
suitable for high-throughput testing, and it claims greater sensitivity and stability of the
luminescent signal. Chen et al. (2005) describe the development of a stable, irreversible
fluorogenic redox switch specifically designed to be a substrate for MAO-A and MAO-B, which
they validated by detecting MAO-A and MAO-B in human placental mitochondria and bovine
liver mitochondria preparations, respectively. However, this assay has not yet been used to
collect data on biological samples.
Zitova et al. (2009) developed an assay to measure oxygen consumption by the MAO reaction
using the Roche LightCycler® detection platform, which was originally developed for
quantitative PCR. Their respirometric assay used low volume reactions (20 µL) of human
recombinant MAO-A and MAO-B with dopamine or benzylamine as substrate, and the
reaction was carried out in glass capillary tubes on the LightCycler® system. MitoXpress, a
macromolecular oxygen probe, was used to detect changes in molecular oxygen in the
reactions. This innovative approach is reportedly more sensitive than other fluorescence-
based oxygen consumption assays and can accurately monitor the activity of other oxygenase
enzymes, such as cytochrome P450 (CYP) and cyclo-oxygenase (COX).
In summary, many different methods have been described for quantitative assessment of the
activity of MAO enzymes. To accurately measure changes in MAO enzyme activity following
exposure to tobacco compounds, the present study required an assay that was robust,
sensitive, and selective for MAO activity. The selected assay needed to be rapid and relatively
inexpensive to make it suitable for high-throughput screening of numerous samples derived
from several different tissues.
3.1.4 - Objectives
The aim of the experiments in this chapter was to assess the effectiveness, reliability and
sensitivity of a high-throughput assay for measuring changes in the activity of MAO-A and
MAO-B enzymes in a number of different biological samples. The commercially available
Amplex® Red monoamine oxidase assay was trialed initially, but gave mixed results (see
- 65 -
Results, section 3.3.1). The kynuramine assay was then developed by making appropriate
modifications to published protocols and by thorough testing of the reaction parameters. A
number of tests were used to validate the accuracy and reliability of the kynuramine assay,
and the results were briefly compared to those achieved with the Amplex Red assay. The
kynuramine assay was then used to assess MAO inhibition in a pilot study of human blood
platelet samples to demonstrate the use of the assay as a proof of the concept.
The assessment of each of these assays led to the optimization of the methods that were
subsequently used extensively throughout this study. The more consistent and repeatable
kynuramine assay system was used to measure the activity of purified recombinant MAO
enzymes and enzymes in lysates of cultured cells exposed to tobacco products.
3.2 - MATERIALS AND METHODS
3.2.1 - Sample Preparation
The MAO enzyme activity assays used in these experiments were tested and optimized using
several different sources of MAO-A and MAO-B enzyme. These included cell lysates prepared
from cultured SH-SY5Y neuroblastoma cells, cultured U-118 MG glioma cells, human
peripheral blood platelets, and purified recombinant MAO-A and MAO-B enzymes. These
samples were prepared as described below.
3.2.1.1 - Cultured Cell Lysates
Cell lysates were prepared from cultured SH-SY5Y neuroblastoma and U-118 MG glioma cell
lines as described in section 2.3.1. Briefly, cells were pelleted by centrifugation and
resuspended in lysis buffer (1 mM MgCl2, 2 mM EGTA, 1% Nonidet P40, 50 mM Tris), before
storage at -80°C. When required for testing, lysates were thawed at RT for 10 mins and
assayed for total protein content using a BCA assay (see section 2.3.3). Protein samples were
then diluted to appropriate working concentrations with sodium phosphate buffer (50 mM
sodium phosphate, 150 mM sodium chloride, pH 7.0) before testing.
- 66 -
3.2.1.2 - Human Blood Platelets
Venous blood samples were drawn from human subjects by a trained phlebotomist into 5 mL
vacutainer tubes. The samples were immediately centrifuged at 600 x g at 4°C for 4 mins in a
Sigma 3-16 benchtop centrifuge to separate red blood cells from the platelet-rich plasma. The
plasma layer was transferred by pipette to a clean, sterile microcentrifuge tube and
centrifuged at 10,000 x g at 4°C for 5 mins to pellet the platelets. The plasma supernatant was
removed by aspiration, and the platelet pellet was stored at -80°C until required. The platelet
pellet was then resuspended in sodium phosphate buffer and assayed for total protein
content by BCA assay. Platelet samples were then diluted with sodium phosphate buffer to
appropriate protein concentrations before measurement of MAO activity.
3.2.1.3 - Purified Recombinant MAO-A and MAO-B Enzymes
Purified human recombinant MAO-A (Cat. M7316) and MAO-B (Cat. M7441) enzymes (5
mg/mL) were purchased from Sigma-Aldrich, Inc. for use in this study. Vials of frozen enzyme
were shipped on dry ice and immediately transferred to a -80°C freezer on arrival. The vials
were then thawed rapidly by hand and maintained on ice while the protein solutions were
pipetted in 10 µL aliquots into sterile microcentrifuge tubes. These aliquots were then
returned to the freezer and stored at -80°C until required. Before use, aliquots were thawed
rapidly and diluted to working concentrations with sodium phosphate buffer.
3.2.2 - Invitrogen Amplex® Red Assay
The Amplex® Red Monoamine Oxidase Assay kit (Molecular Probes, A12214) was purchased
from Invitrogen. The manufacturer’s instructions were followed exactly and are described in
detail in section 2.4.1 of this thesis. Briefly, prepared lysates were diluted with 1x reaction
buffer, and 100 µL aliquots of diluted lysate were added in triplicate to the wells of a black 96-
well microplate (Greiner BioOne). Wells containing 100 µL of 10 µM hydrogen peroxide or 1x
reaction buffer were also included as positive and negative controls, respectively. The
Amplex® Red working solution was prepared (400 µM Amplex® Red reagent, 2 U/mL
horseradish peroxidase, 2 mM p-tyramine substrate, ± 1 µM inhibitor), and the reaction was
- 67 -
initiated by addition of 100 µL of Amplex® Red working solution to each 100 µL sample. A
negative control containing aliquots of cell lysate, reaction buffer, and Amplex Red working
solution without the p-tyramine substrate was included for all experiments. Reactions (200
µL) were incubated at RT in the dark for between 30 mins and 2 hours.
The Amplex® Red assay allows the measurement of both MAO-A and MAO-B enzyme activity
through the use of different inhibitors. When measuring MAO-A activity, 0.5 µM pargyline
was included to inhibit MAO-B, and when measuring MAO-B activity the reaction buffer
contained 0.5 µM clorgyline to inhibit MAO-A. When measuring total MAO enzyme activity,
no inhibitor was included in the reactions.
Fluorescence was measured with a SpectraMax Gemini fluorescence spectrophotometer
(Molecular Instruments Ltd), using a kinetic measurement protocol. Fluorescence was
measured once every 2 mins over the duration of the incubation period using an excitation
wavelength of 560 nm and emission detection at 590 nm.
The resorufin reference standard provided with the kit reagents was diluted over the range
from 0.5 µM to 20 µM, and aliquots of these standards were included in each microwell plate.
The fluorescence of these standards was measured once at the start of the reaction, and was
then used to construct a standard curve to quantitate the concentration of resorufin product
present in each well, and thus the MAO activity of each sample.
3.2.2.1 – Using Amplex Red to Assess MAO Activity in Differentiated SH-SY5Y Cells
Amplex Red was used in early experiments with SH-SY5Y human neuroblastoma cells to
measure changes in MAO enzyme activity following differentiation with retinoic acid. SH-SY5Y
cells were sub-cultured into 250 mL tissue culture flasks at known densities according to the
methods described in section 2.1. The cells were incubated in growth media overnight and
allowed to adhere to the substrate before addition of retinoic acid (RA) to a final
concentration of 10 µM. The growing cells were then incubated with RA for 1, 5, 7, or 10
days, refreshing the medium and RA solution every 4 days. The cells were then harvested and
prepared as previously described (section 3.2.1) before each sample was tested in triplicate
with the Amplex Red assay for MAO-A activity, MAO-B activity, and total MAO activity.
- 68 -
3.2.3 - Kynuramine Assay
The modified kynuramine assay used in these experiments is described in detail in section
2.4.2 of this thesis. The experimental protocol for this assay is described briefly below.
Samples of known protein concentration were dispensed in 100 µL aliquots to 1.5 mL
microcentrifuge tubes containing 870 µL of sodium phosphate buffer (50 mM sodium
phosphate, 150 mM sodium chloride, pH 7.4). These sample solutions were incubated in a
37°C water bath for 5 mins to equilibrate to the reaction temperature. The assay reaction was
initiated by addition of a 30 µL aliquot of kynuramine hydrobromide (Sigma-Aldrich, Inc) to
each reaction tube, giving a total reaction volume of 1 mL. Reactions nominally contained
3.07 mM kynuramine substrate unless otherwise stated. The reaction tubes were then
returned to the water bath and incubated at 37°C for 15–60 min. The enzyme reaction was
terminated by addition of 300 µL of 0.4 M perchloric acid (Sigma-Aldrich, Inc), and the
reaction tubes were then centrifuged at 13,000 x g for 30 sec at 4°C in an Eppendorf
refrigerated benchtop centrifuge.
Following centrifugation, 100 µL aliquots of each supernatant were added in triplicate to the
wells of a sterile black polystyrene 96-well microwell plate (Greiner Bio-one). Dilutions of a 4-
HQ reference standard were prepared (0 – 5000 nM) and added in triplicate to the micro-well
plate to construct a standard curve. NaOH (200 µL of 1 M solution) was added to each well,
and fluorescence was measured immediately using a SpectraMax Gemini spectrophotometer
at 318 nm excitation and 380 nm emission wavelengths. The 4-HQ standard curve was used
to quantitate the concentration of product present in each well.
3.2.3.1 – Assessing Assay Variation
Variation can arise and influence an enzymatic assay from a number of sources. These include
biological variation in the activity of the enzyme in the source sample (between-sample
variation) and the inherent variability of the assay procedure due to inaccuracies in pipetting,
timing, and incubation temperature.
To assess the between-sample variability of the kynuramine assay, total MAO-A activity was
measured in untreated SH-SH5Y cell lysates assayed independently of each other, and the
results compiled to examine the spread of the data.
- 69 -
To examine variability of the assay itself, three independently prepared untreated SH-SY5Y
lysates were prepared by harvesting and lysing the cells as described above (section 3.2.1.1),
and the lysates assayed for total protein concentration. Each lysate was then divided evenly
between two microcentrifuge tubes and the samples were then frozen at -80°C and stored for
up to a month before testing. One of each prepared lysate was removed from the freezer and
tested for total MAO activity in triplicate according to the standard protocol described. On
the following day, the remaining aliquots of each lysate were tested for total MAO activity in
triplicate, and the results from each assay were compared.
3.2.3.2 – Measuring MAO Activity in Human Blood Platelets
To assess the application of the modified kynuramine assay for measuring MAO activity in
human tissue samples, a pilot study was conducted to measure the total MAO activity in blood
platelets of smoking and non-smoking volunteers sourced from the Environmental Science
and Research (ESR) Kenepuru Science Centre. The cohort comprised 16 non-smokers (5 males
and 11 females), and 2 smokers (both female), ranging in age from 26 years to 59 years old.
No attempts to recruit age or gender matched subject groups were made. Biometric data and
a detailed smoking history were collected for all participants, and written informed consent
was obtained from all subjects prior to their inclusion in the study. All procedures were
approved by ESR’s internal ethics committee, and by the Central Region Ethics Committee,
New Zealand.
3.3 - RESULTS
3.3.1 - Amplex Red® Assay (Invitrogen)
3.3.1.1 – Resorufin Standard Curve
The resorufin reference standard was diluted over the concentration range from 0.5 µM to 20
µM to construct a standard curve (Fig 7). Fluorescence from the diluted standards gave a
sigmoidal-shaped standard curve over the concentration range tested, rather than the
expected linear relationship. Fluorescence increased linearly at low concentrations of
resorufin, up to 3 µM, before flattening out at concentrations above 5 µM. According to the
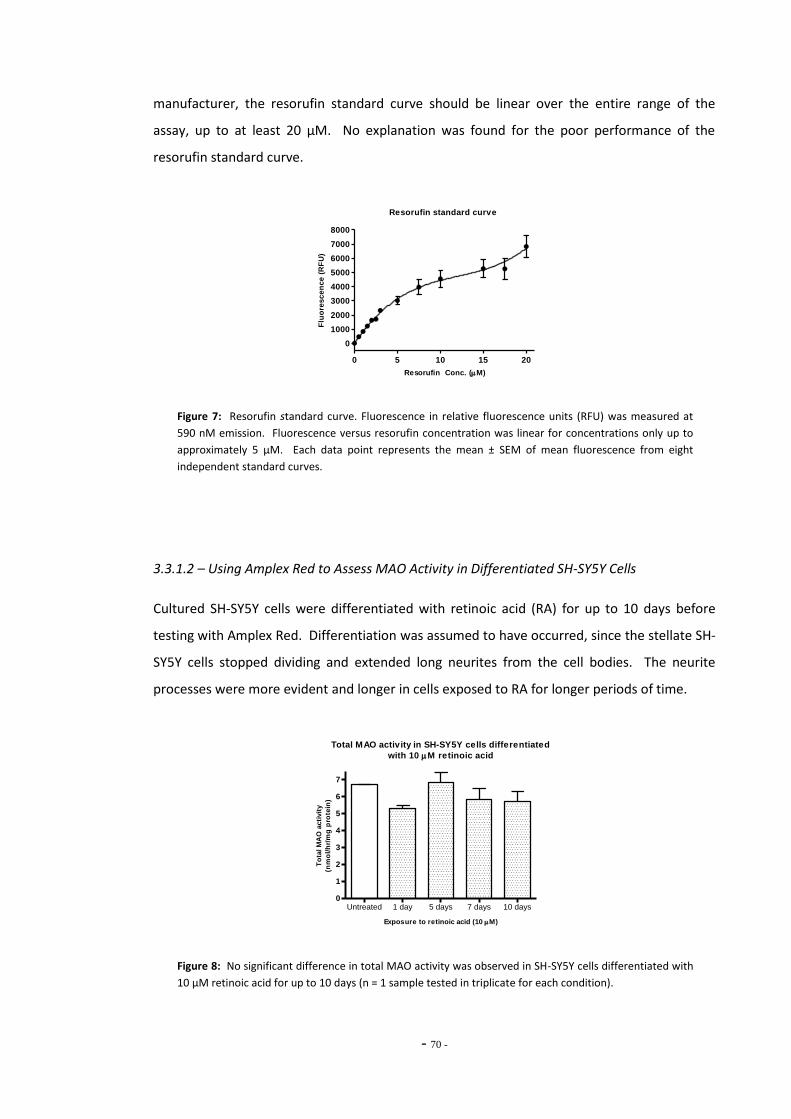
- 70 -
manufacturer, the resorufin standard curve should be linear over the entire range of the
assay, up to at least 20 µM. No explanation was found for the poor performance of the
resorufin standard curve.
Resorufin standard curve
0 5 10 15 20
0
1000
2000
3000
4000
5000
6000
7000
8000
Resorufin Conc. (M)
Flu
ore
sc
en
ce
(R
FU
)
Figure 7: Resorufin standard curve. Fluorescence in relative fluorescence units (RFU) was measured at
590 nM emission. Fluorescence versus resorufin concentration was linear for concentrations only up to
approximately 5 µM. Each data point represents the mean ± SEM of mean fluorescence from eight
independent standard curves.
3.3.1.2 – Using Amplex Red to Assess MAO Activity in Differentiated SH-SY5Y Cells
Cultured SH-SY5Y cells were differentiated with retinoic acid (RA) for up to 10 days before
testing with Amplex Red. Differentiation was assumed to have occurred, since the stellate SH-
SY5Y cells stopped dividing and extended long neurites from the cell bodies. The neurite
processes were more evident and longer in cells exposed to RA for longer periods of time.
Total MAO activity in SH-SY5Y cells differentiated
with 10 M retinoic acid
Untreated 1 day 5 days 7 days 10 days0
1
2
3
4
5
6
7
Exposure to retinoic acid (10 M)
To
tal M
AO
acti
vit
y
(nm
ol/
hr/
mg
pro
tein
)
Figure 8: No significant difference in total MAO activity was observed in SH-SY5Y cells differentiated with
10 µM retinoic acid for up to 10 days (n = 1 sample tested in triplicate for each condition).

- 71 -
Although cell morphology changed, this study found no significant differences in total MAO
enzyme activity in SH-SY5Y cells following differentiation with retinoic acid for up to ten days
(Fig. 8). However, this experiment was conducted successfully only once, as the Amplex Red
assay gave very low MAO activity in other SH-SY5Y lysates tested. The reason for these sub-
threshold values in other lysates is not known.
3.3.1.3 – Using Amplex Red to Distinguish MAO-A and MAO-B Activity in SH-SY5Y Cells
The Amplex Red assay allows for the differentiation of MAO-A and MAO-B enzyme activities
through the inclusion of the selective, irreversible inhibitors clorgyline and pargyline.
Attempts were made to measure the contribution of MAO-A and MAO-B activity to the total
MAO enzyme activity of SH-SY5Y cells, but unfortunately the results obtained were unreliable
and inconsistent. Measures of MAO-A and MAO-B activities in SH-SY5Y lysates did not sum to
the total MAO activity measured for that particular lysate (Fig. 9a). This suggests that cross
inhibition was occurring; that is, clorgyline was partially inhibiting MAO-B, as well as MAO-A,
and pargyline was partially inhibiting MAO-A as well as MAO-B. This experiment was repeated
several times with both untreated SH-SY5Y cells and cells treated with RA. Measurements of
total MAO activity were highly inconsistent between samples, and the measured MAO-A and
MAO-B activities never summed to account for total MAO activity. The sum of the two
enzyme activities was only about 60% of the total MAO activity measured in the absence of
inhibitors.
(a) (b)
Inhibition of MAO subtypes in SH-SY5Y cellsby Amplex Red Assay Inhibitors
Total MAO MAO-A MAO-B Both Inhib-2
0
2
4
6
8
MA
O A
cti
vit
y
(nm
ol/
hr/
mg
pro
tein
)
Inhibition of Platelet MAO-B by Pargyline
-3 -2 -1 0 1 2 3 40.0
0.5
1.0
1.5
2.0
2.5
3.0
Log [Pargyline] nM
MA
O-B
ac
tiv
ity
(nm
ol/
hr/
mg
pro
tein
)
Figure 9: (a) Example measurements of total MAO, MAO-A, and MAO-B in SH-SY5Y cell lysate by
including no inhibitor, 0.5 µM pargyline, or 0.5 µM clorgyline, respectively. MAO-A activity was measured
as 3.7 ±0.31 nmol/hr/mg protein, and MAO-B was measured as 1.1 ± 0.16 nmol/hr/mg protein. Total
MAO measurement was 7.9 ± 0.16 nmol/hr/mg protein (n = 1 sample tested in triplicate for each
condition). (b) MAO-B inhibitor pargyline did not completely inhibit MAO-B activity in human blood
platelets, even at concentrations 10 times higher than recommended by the assay protocol. Each data
point represents the mean ± SEM of five replicate reactions tested in a single experiment.
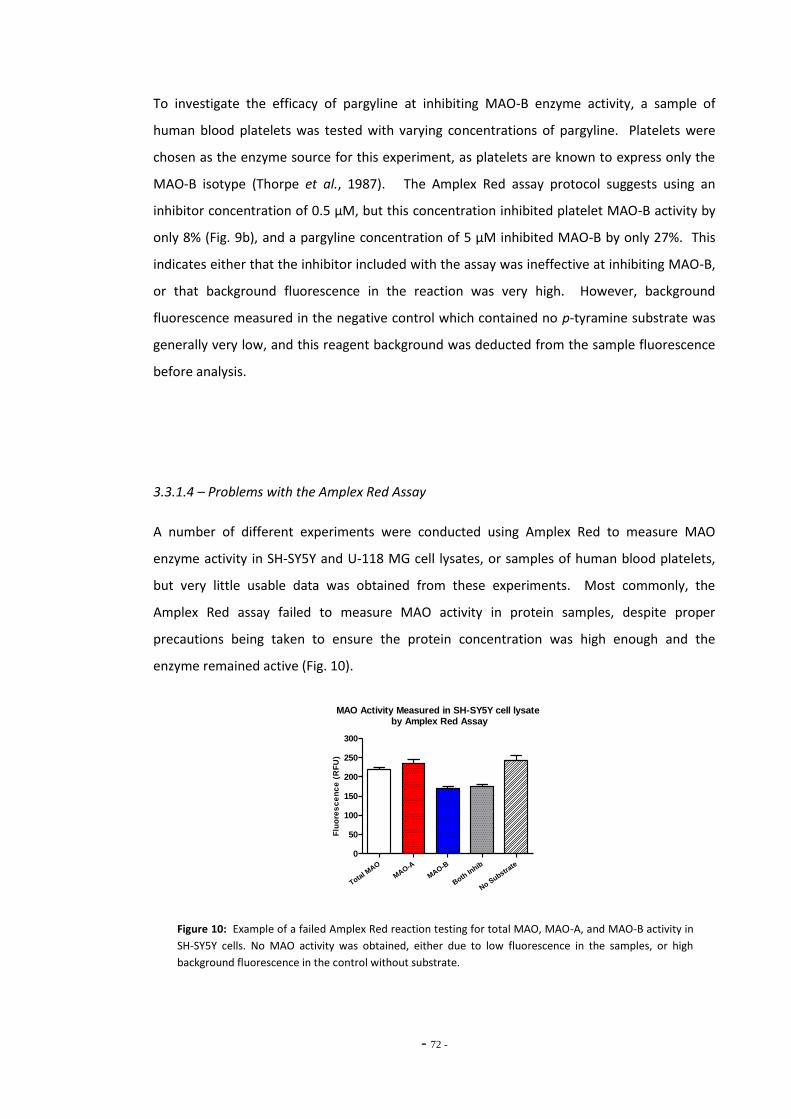
- 72 -
To investigate the efficacy of pargyline at inhibiting MAO-B enzyme activity, a sample of
human blood platelets was tested with varying concentrations of pargyline. Platelets were
chosen as the enzyme source for this experiment, as platelets are known to express only the
MAO-B isotype (Thorpe et al., 1987). The Amplex Red assay protocol suggests using an
inhibitor concentration of 0.5 µM, but this concentration inhibited platelet MAO-B activity by
only 8% (Fig. 9b), and a pargyline concentration of 5 µM inhibited MAO-B by only 27%. This
indicates either that the inhibitor included with the assay was ineffective at inhibiting MAO-B,
or that background fluorescence in the reaction was very high. However, background
fluorescence measured in the negative control which contained no p-tyramine substrate was
generally very low, and this reagent background was deducted from the sample fluorescence
before analysis.
3.3.1.4 – Problems with the Amplex Red Assay
A number of different experiments were conducted using Amplex Red to measure MAO
enzyme activity in SH-SY5Y and U-118 MG cell lysates, or samples of human blood platelets,
but very little usable data was obtained from these experiments. Most commonly, the
Amplex Red assay failed to measure MAO activity in protein samples, despite proper
precautions being taken to ensure the protein concentration was high enough and the
enzyme remained active (Fig. 10).
MAO Activity Measured in SH-SY5Y cell lysate by Amplex Red Assay
Total M
AO
MAO-A
MAO-B
Both In
hib
No Substra
te
0
50
100
150
200
250
300
Flu
ore
sc
en
ce
(R
FU
)
Figure 10: Example of a failed Amplex Red reaction testing for total MAO, MAO-A, and MAO-B activity in
SH-SY5Y cells. No MAO activity was obtained, either due to low fluorescence in the samples, or high
background fluorescence in the control without substrate.
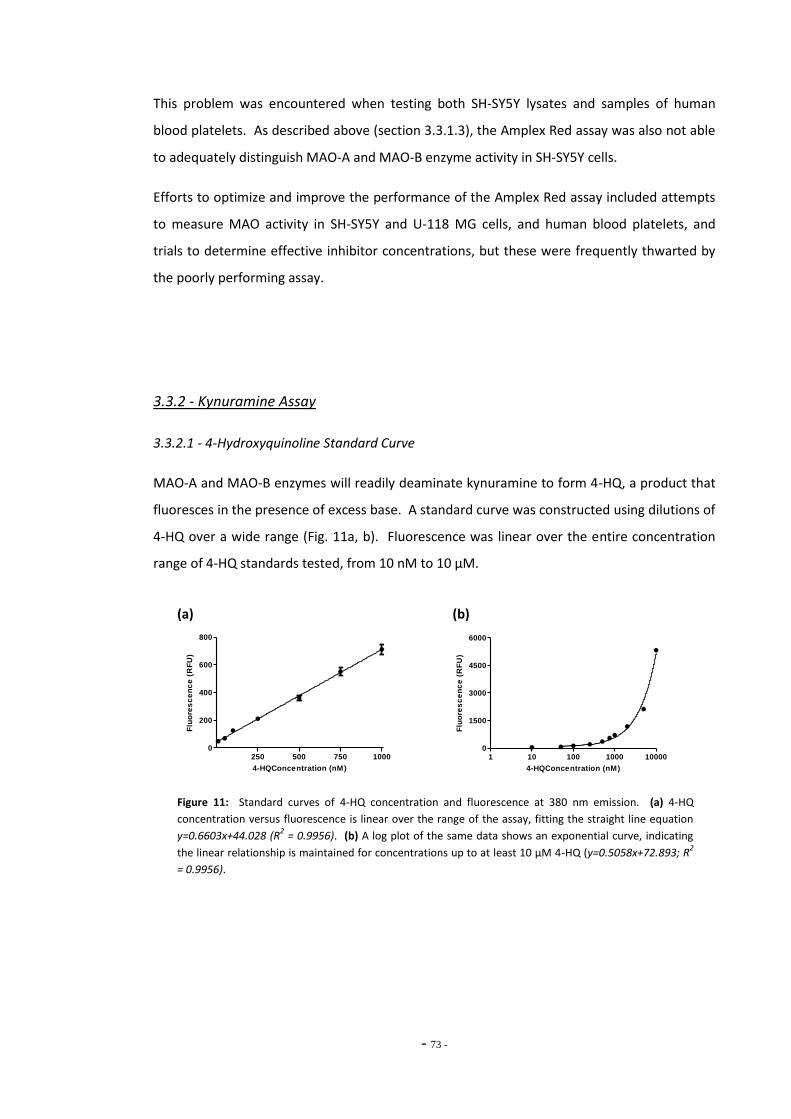
- 73 -
This problem was encountered when testing both SH-SY5Y lysates and samples of human
blood platelets. As described above (section 3.3.1.3), the Amplex Red assay was also not able
to adequately distinguish MAO-A and MAO-B enzyme activity in SH-SY5Y cells.
Efforts to optimize and improve the performance of the Amplex Red assay included attempts
to measure MAO activity in SH-SY5Y and U-118 MG cells, and human blood platelets, and
trials to determine effective inhibitor concentrations, but these were frequently thwarted by
the poorly performing assay.
3.3.2 - Kynuramine Assay
3.3.2.1 - 4-Hydroxyquinoline Standard Curve
MAO-A and MAO-B enzymes will readily deaminate kynuramine to form 4-HQ, a product that
fluoresces in the presence of excess base. A standard curve was constructed using dilutions of
4-HQ over a wide range (Fig. 11a, b). Fluorescence was linear over the entire concentration
range of 4-HQ standards tested, from 10 nM to 10 µM.
(a) (b)
250 500 750 10000
200
400
600
800
4-HQConcentration (nM)
Flu
ore
sc
en
ce
(R
FU
)
1 10 100 1000 100000
1500
3000
4500
6000
4-HQConcentration (nM)
Flu
ore
sc
en
ce
(R
FU
)
Figure 11: Standard curves of 4-HQ concentration and fluorescence at 380 nm emission. (a) 4-HQ
concentration versus fluorescence is linear over the range of the assay, fitting the straight line equation
y=0.6603x+44.028 (R2 = 0.9956). (b) A log plot of the same data shows an exponential curve, indicating
the linear relationship is maintained for concentrations up to at least 10 μM 4-HQ (y=0.5058x+72.893; R2
= 0.9956).
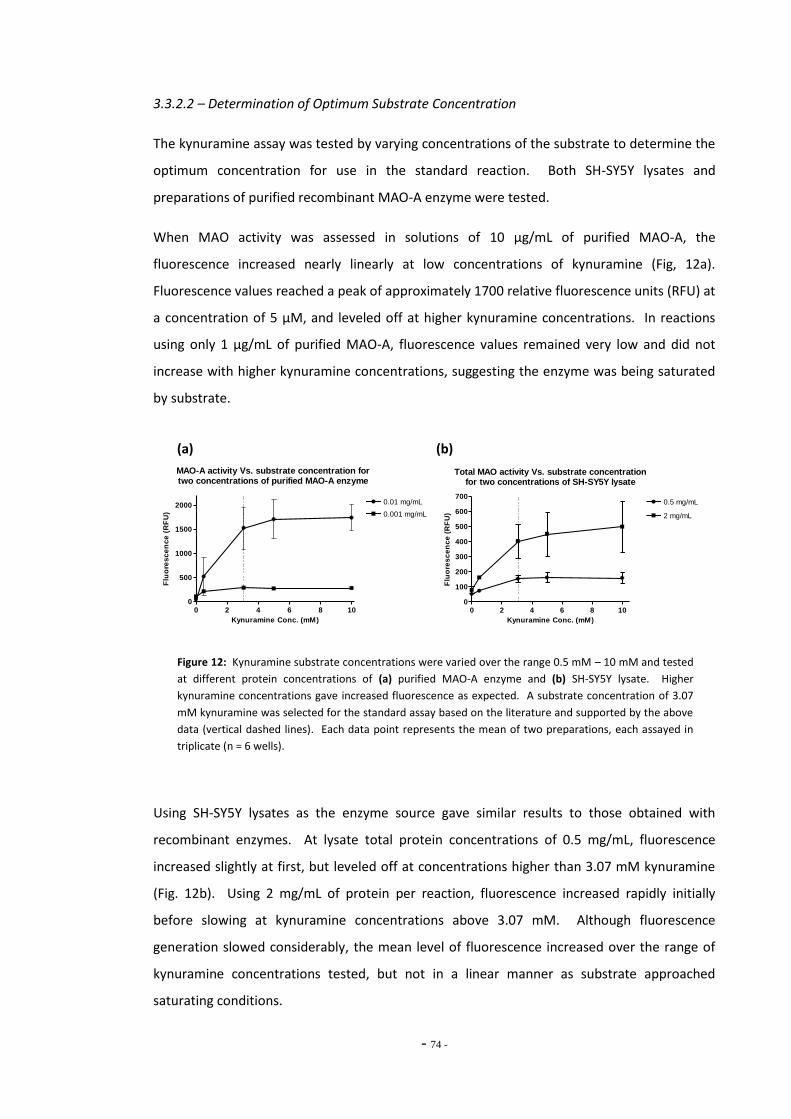
- 74 -
3.3.2.2 – Determination of Optimum Substrate Concentration
The kynuramine assay was tested by varying concentrations of the substrate to determine the
optimum concentration for use in the standard reaction. Both SH-SY5Y lysates and
preparations of purified recombinant MAO-A enzyme were tested.
When MAO activity was assessed in solutions of 10 µg/mL of purified MAO-A, the
fluorescence increased nearly linearly at low concentrations of kynuramine (Fig, 12a).
Fluorescence values reached a peak of approximately 1700 relative fluorescence units (RFU) at
a concentration of 5 µM, and leveled off at higher kynuramine concentrations. In reactions
using only 1 µg/mL of purified MAO-A, fluorescence values remained very low and did not
increase with higher kynuramine concentrations, suggesting the enzyme was being saturated
by substrate.
(a) (b)
MAO-A activity Vs. substrate concentration fortwo concentrations of purified MAO-A enzyme
0 2 4 6 8 100
500
1000
1500
2000 0.01 mg/mL
0.001 mg/mL
Kynuramine Conc. (mM)
Flu
ore
sc
en
ce
(R
FU
)
Total MAO activity Vs. substrate concentrationfor two concentrations of SH-SY5Y lysate
0 2 4 6 8 100
100
200
300
400
500
600
7000.5 mg/mL
2 mg/mL
Kynuramine Conc. (mM)
Flu
ore
sc
en
ce
(R
FU
)
Figure 12: Kynuramine substrate concentrations were varied over the range 0.5 mM – 10 mM and tested
at different protein concentrations of (a) purified MAO-A enzyme and (b) SH-SY5Y lysate. Higher
kynuramine concentrations gave increased fluorescence as expected. A substrate concentration of 3.07
mM kynuramine was selected for the standard assay based on the literature and supported by the above
data (vertical dashed lines). Each data point represents the mean of two preparations, each assayed in
triplicate (n = 6 wells).
Using SH-SY5Y lysates as the enzyme source gave similar results to those obtained with
recombinant enzymes. At lysate total protein concentrations of 0.5 mg/mL, fluorescence
increased slightly at first, but leveled off at concentrations higher than 3.07 mM kynuramine
(Fig. 12b). Using 2 mg/mL of protein per reaction, fluorescence increased rapidly initially
before slowing at kynuramine concentrations above 3.07 mM. Although fluorescence
generation slowed considerably, the mean level of fluorescence increased over the range of
kynuramine concentrations tested, but not in a linear manner as substrate approached
saturating conditions.
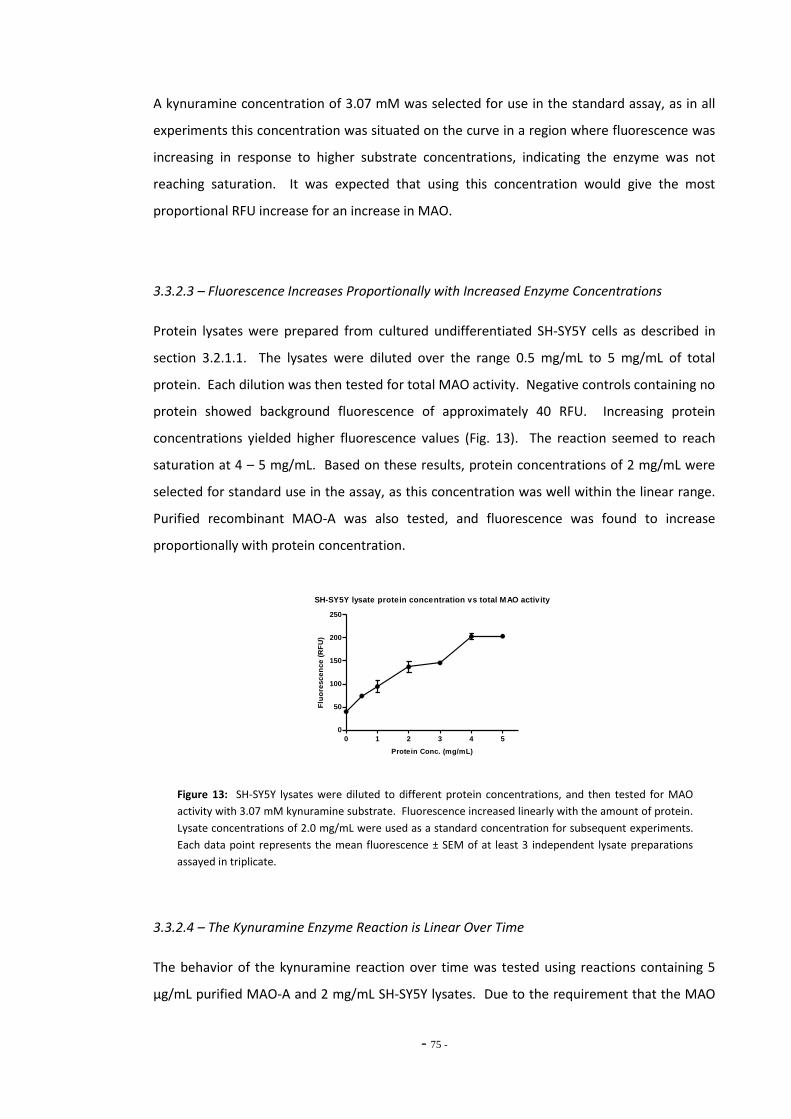
- 75 -
A kynuramine concentration of 3.07 mM was selected for use in the standard assay, as in all
experiments this concentration was situated on the curve in a region where fluorescence was
increasing in response to higher substrate concentrations, indicating the enzyme was not
reaching saturation. It was expected that using this concentration would give the most
proportional RFU increase for an increase in MAO.
3.3.2.3 – Fluorescence Increases Proportionally with Increased Enzyme Concentrations
Protein lysates were prepared from cultured undifferentiated SH-SY5Y cells as described in
section 3.2.1.1. The lysates were diluted over the range 0.5 mg/mL to 5 mg/mL of total
protein. Each dilution was then tested for total MAO activity. Negative controls containing no
protein showed background fluorescence of approximately 40 RFU. Increasing protein
concentrations yielded higher fluorescence values (Fig. 13). The reaction seemed to reach
saturation at 4 – 5 mg/mL. Based on these results, protein concentrations of 2 mg/mL were
selected for standard use in the assay, as this concentration was well within the linear range.
Purified recombinant MAO-A was also tested, and fluorescence was found to increase
proportionally with protein concentration.
SH-SY5Y lysate protein concentration vs total MAO activity
0 1 2 3 4 5
0
50
100
150
200
250
Protein Conc. (mg/mL)
Flu
ore
sc
en
ce
(R
FU
)
Figure 13: SH-SY5Y lysates were diluted to different protein concentrations, and then tested for MAO
activity with 3.07 mM kynuramine substrate. Fluorescence increased linearly with the amount of protein.
Lysate concentrations of 2.0 mg/mL were used as a standard concentration for subsequent experiments.
Each data point represents the mean fluorescence ± SEM of at least 3 independent lysate preparations
assayed in triplicate.
3.3.2.4 – The Kynuramine Enzyme Reaction is Linear Over Time
The behavior of the kynuramine reaction over time was tested using reactions containing 5
µg/mL purified MAO-A and 2 mg/mL SH-SY5Y lysates. Due to the requirement that the MAO
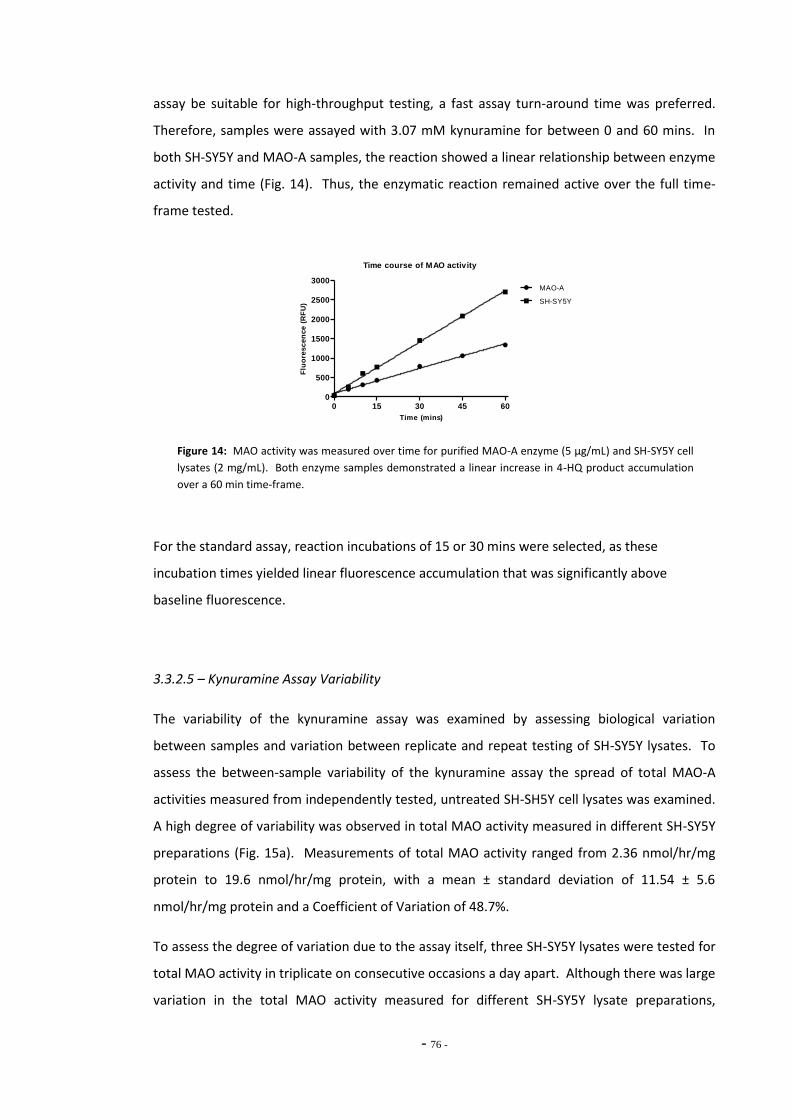
- 76 -
assay be suitable for high-throughput testing, a fast assay turn-around time was preferred.
Therefore, samples were assayed with 3.07 mM kynuramine for between 0 and 60 mins. In
both SH-SY5Y and MAO-A samples, the reaction showed a linear relationship between enzyme
activity and time (Fig. 14). Thus, the enzymatic reaction remained active over the full time-
frame tested.
Time course of MAO activity
0 15 30 45 600
500
1000
1500
2000
2500
3000MAO-A
SH-SY5Y
Time (mins)
Flu
ore
sc
en
ce
(R
FU
)
Figure 14: MAO activity was measured over time for purified MAO-A enzyme (5 µg/mL) and SH-SY5Y cell
lysates (2 mg/mL). Both enzyme samples demonstrated a linear increase in 4-HQ product accumulation
over a 60 min time-frame.
For the standard assay, reaction incubations of 15 or 30 mins were selected, as these
incubation times yielded linear fluorescence accumulation that was significantly above
baseline fluorescence.
3.3.2.5 – Kynuramine Assay Variability
The variability of the kynuramine assay was examined by assessing biological variation
between samples and variation between replicate and repeat testing of SH-SY5Y lysates. To
assess the between-sample variability of the kynuramine assay the spread of total MAO-A
activities measured from independently tested, untreated SH-SH5Y cell lysates was examined.
A high degree of variability was observed in total MAO activity measured in different SH-SY5Y
preparations (Fig. 15a). Measurements of total MAO activity ranged from 2.36 nmol/hr/mg
protein to 19.6 nmol/hr/mg protein, with a mean ± standard deviation of 11.54 ± 5.6
nmol/hr/mg protein and a Coefficient of Variation of 48.7%.
To assess the degree of variation due to the assay itself, three SH-SY5Y lysates were tested for
total MAO activity in triplicate on consecutive occasions a day apart. Although there was large
variation in the total MAO activity measured for different SH-SY5Y lysate preparations,
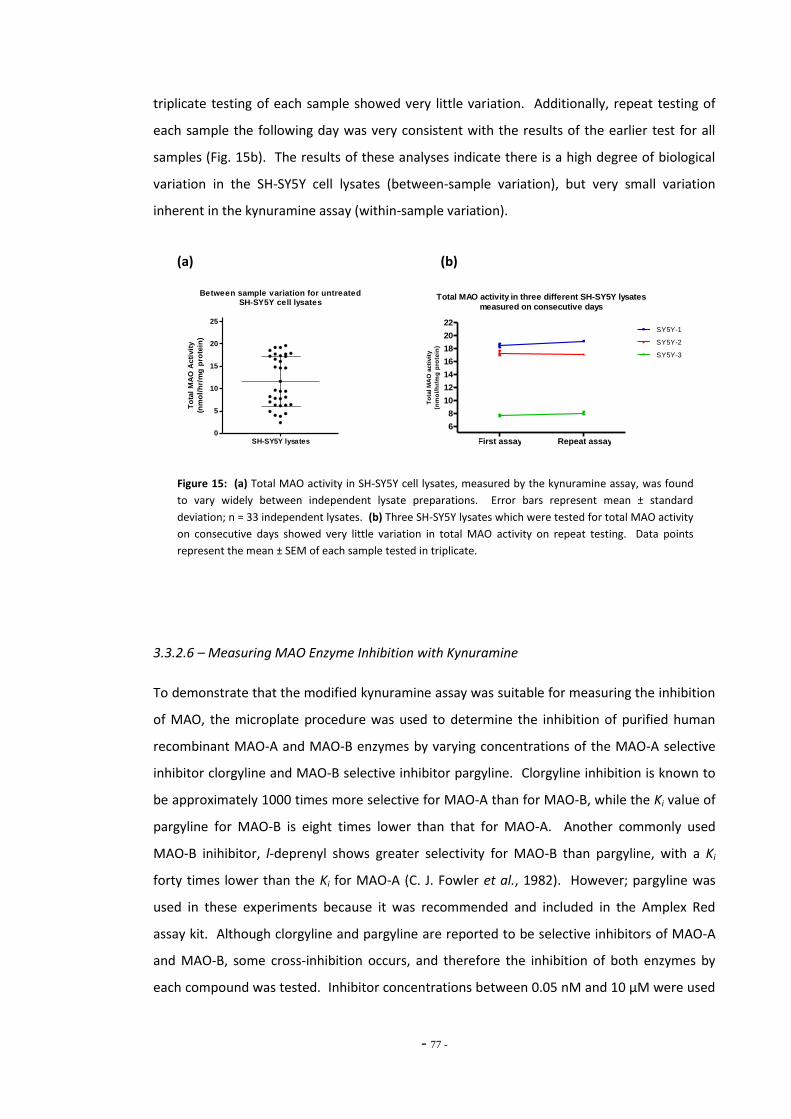
- 77 -
triplicate testing of each sample showed very little variation. Additionally, repeat testing of
each sample the following day was very consistent with the results of the earlier test for all
samples (Fig. 15b). The results of these analyses indicate there is a high degree of biological
variation in the SH-SY5Y cell lysates (between-sample variation), but very small variation
inherent in the kynuramine assay (within-sample variation).
(a) (b)
Between sample variation for untreatedSH-SY5Y cell lysates
SH-SY5Y lysates0
5
10
15
20
25
To
tal
MA
O A
cti
vit
y
(nm
ol/
hr/
mg
pro
tein
)
Total MAO activity in three different SH-SY5Y lysates
measured on consecutive days
First assay Repeat assay
6
8
10
12
14
16
18
20
22SY5Y-1
SY5Y-2
SY5Y-3
To
tal M
AO
acti
vit
y
(nm
ol/
hr/
mg
pro
tein
)
Figure 15: (a) Total MAO activity in SH-SY5Y cell lysates, measured by the kynuramine assay, was found
to vary widely between independent lysate preparations. Error bars represent mean ± standard
deviation; n = 33 independent lysates. (b) Three SH-SY5Y lysates which were tested for total MAO activity
on consecutive days showed very little variation in total MAO activity on repeat testing. Data points
represent the mean ± SEM of each sample tested in triplicate.
3.3.2.6 – Measuring MAO Enzyme Inhibition with Kynuramine
To demonstrate that the modified kynuramine assay was suitable for measuring the inhibition
of MAO, the microplate procedure was used to determine the inhibition of purified human
recombinant MAO-A and MAO-B enzymes by varying concentrations of the MAO-A selective
inhibitor clorgyline and MAO-B selective inhibitor pargyline. Clorgyline inhibition is known to
be approximately 1000 times more selective for MAO-A than for MAO-B, while the Ki value of
pargyline for MAO-B is eight times lower than that for MAO-A. Another commonly used
MAO-B inihibitor, l-deprenyl shows greater selectivity for MAO-B than pargyline, with a Ki
forty times lower than the Ki for MAO-A (C. J. Fowler et al., 1982). However; pargyline was
used in these experiments because it was recommended and included in the Amplex Red
assay kit. Although clorgyline and pargyline are reported to be selective inhibitors of MAO-A
and MAO-B, some cross-inhibition occurs, and therefore the inhibition of both enzymes by
each compound was tested. Inhibitor concentrations between 0.05 nM and 10 µM were used
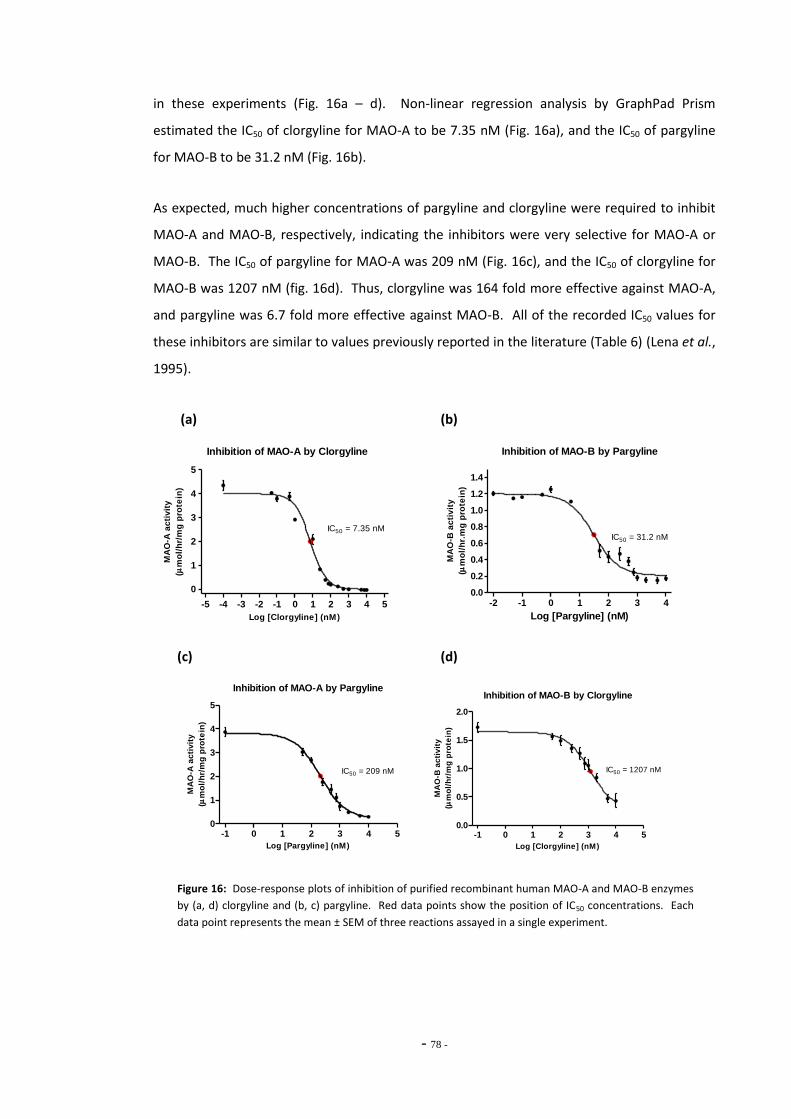
- 78 -
in these experiments (Fig. 16a – d). Non-linear regression analysis by GraphPad Prism
estimated the IC50 of clorgyline for MAO-A to be 7.35 nM (Fig. 16a), and the IC50 of pargyline
for MAO-B to be 31.2 nM (Fig. 16b).
As expected, much higher concentrations of pargyline and clorgyline were required to inhibit
MAO-A and MAO-B, respectively, indicating the inhibitors were very selective for MAO-A or
MAO-B. The IC50 of pargyline for MAO-A was 209 nM (Fig. 16c), and the IC50 of clorgyline for
MAO-B was 1207 nM (fig. 16d). Thus, clorgyline was 164 fold more effective against MAO-A,
and pargyline was 6.7 fold more effective against MAO-B. All of the recorded IC50 values for
these inhibitors are similar to values previously reported in the literature (Table 6) (Lena et al.,
1995).
(a) (b)
Inhibition of MAO-A by Clorgyline
-5 -4 -3 -2 -1 0 1 2 3 4 5
0
1
2
3
4
5
IC50 = 7.35 nM
Log [Clorgyline] (nM)
MA
O-A
ac
tiv
ity
(m
ol/
hr/
mg
pro
tein
)
Inhibition of MAO-B by Pargyline
-2 -1 0 1 2 3 40.0
0.2
0.4
0.6
0.8
1.0
1.2
1.4
IC50 = 31.2 nM
Log [Pargyline] (nM)
MA
O-B
ac
tiv
ity
(m
ol/
hr.
mg
pro
tein
)
(c) (d)
Inhibition of MAO-A by Pargyline
-1 0 1 2 3 4 50
1
2
3
4
5
IC50 = 209 nM
Log [Pargyline] (nM)
MA
O-A
ac
tiv
ity
(m
ol/
hr/
mg
pro
tein
)
Inhibition of MAO-B by Clorgyline
-1 0 1 2 3 4 50.0
0.5
1.0
1.5
2.0
IC50 = 1207 nM
Log [Clorgyline] (nM)
MA
O-B
ac
tiv
ity
(m
ol/
hr/
mg
pro
tein
)
Figure 16: Dose-response plots of inhibition of purified recombinant human MAO-A and MAO-B enzymes
by (a, d) clorgyline and (b, c) pargyline. Red data points show the position of IC50 concentrations. Each
data point represents the mean ± SEM of three reactions assayed in a single experiment.
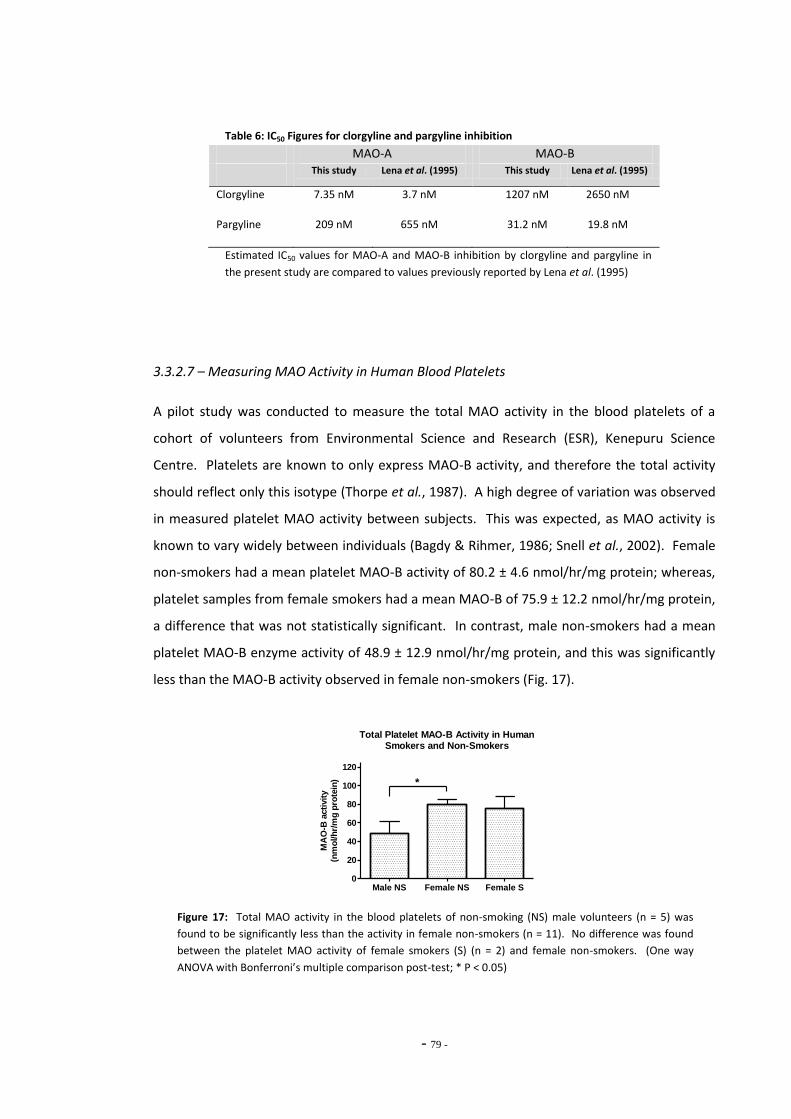
- 79 -
Table 6: IC50 Figures for clorgyline and pargyline inhibition
MAO-A MAO-B
This study Lena et al. (1995) This study Lena et al. (1995)
Clorgyline 7.35 nM 3.7 nM 1207 nM 2650 nM
Pargyline 209 nM 655 nM 31.2 nM 19.8 nM
Estimated IC50 values for MAO-A and MAO-B inhibition by clorgyline and pargyline in
the present study are compared to values previously reported by Lena et al. (1995)
3.3.2.7 – Measuring MAO Activity in Human Blood Platelets
A pilot study was conducted to measure the total MAO activity in the blood platelets of a
cohort of volunteers from Environmental Science and Research (ESR), Kenepuru Science
Centre. Platelets are known to only express MAO-B activity, and therefore the total activity
should reflect only this isotype (Thorpe et al., 1987). A high degree of variation was observed
in measured platelet MAO activity between subjects. This was expected, as MAO activity is
known to vary widely between individuals (Bagdy & Rihmer, 1986; Snell et al., 2002). Female
non-smokers had a mean platelet MAO-B activity of 80.2 ± 4.6 nmol/hr/mg protein; whereas,
platelet samples from female smokers had a mean MAO-B of 75.9 ± 12.2 nmol/hr/mg protein,
a difference that was not statistically significant. In contrast, male non-smokers had a mean
platelet MAO-B enzyme activity of 48.9 ± 12.9 nmol/hr/mg protein, and this was significantly
less than the MAO-B activity observed in female non-smokers (Fig. 17).
Total Platelet MAO-B Activity in HumanSmokers and Non-Smokers
Male NS Female NS Female S0
20
40
60
80
100
120
*
MA
O-B
acti
vit
y
(nm
ol/h
r/m
g p
rote
in)
Figure 17: Total MAO activity in the blood platelets of non-smoking (NS) male volunteers (n = 5) was
found to be significantly less than the activity in female non-smokers (n = 11). No difference was found
between the platelet MAO activity of female smokers (S) (n = 2) and female non-smokers. (One way
ANOVA with Bonferroni’s multiple comparison post-test; * P < 0.05)
- 80 -
3.4 - DISCUSSION
3.4.1 – Amplex Red Assay
3.4.1.1 – Measuring MAO Activity in Differentiated SH-SY5Y cells
SH-SY5Y cells were differentiated using retinoic acid (RA) to determine whether differentiation
had any effect on the expression of MAO enzymes. Testing of lysates prepared from
differentiated cells with the Amplex Red Assay suggested that differentiation neither
increased nor decreased total MAO expression in this cell line, although the experiment was
successfully performed only once, due to the unreliable performance of the Amplex Red
assay. Although a number of batches of cells were differentiated with RA for periods up to 14
days and tested with Amplex Red, no usable results were obtained due to high levels of
background fluorescence.
A previous study by Ino et al. (1986) examined changes in MAO-A activity in SH-SY5Y cells
differentiated with RA for up to 5 weeks. They found MAO-A activity did not significantly
increase at any time point shorter than 5 weeks, and activity after 5 weeks of RA treatment
increased MAO-A activity by 56% (Ino et al., 1986). This suggests that the MAO activity was
unlikely to have increased in the 7-day differentiation period used in this study. Since this
study measured total MAO activity in undifferentiated SH-SY5Y by both Amplex Red and
Kynuramine assays, differentiating the cells to achieve only a modest increase in enzyme
activity was not deemed to be worthwhile. Furthermore, the experiments proposed for this
study required many flasks of cells, and large numbers of cells were needed in each flask to
generate protein lysates of sufficient total protein concentration for testing of MAO activity.
Because cell differentiation involves the arrest of cell proliferation, treating cells with RA
meant it was difficult to culture sufficient cell numbers for each experiment. Due to the
difficulty and time required to culture adequate numbers of differentiated cells, and the
preliminary evidence from this study that differentiation did not significantly alter MAO
activity, the decision was made not to work with differentiated SH-SY5Y cells. Thus,
undifferentiated cells were used for all subsequent experiments in this study.
3.4.1.2 – Problems with the Amplex Red Assay
The Invitrogen® Amplex Red Assay was found to be very problematic to use and very
unreliable. The resorufin standard curve was non-linear, reactions frequently displayed high
- 81 -
background fluorescence, or very low levels of fluorescence, and the inclusion of MAO
inhibitors was unsuccessful at distinguishing MAO-A and MAO-B activity.
Problems encountered with the standard curve and inconsistent fluorescence suggests that
the resorufin fluorescent product may not have been stable in the assay reactions used. The
Invitrogen Amplex Red package insert advises that all kit reagents should be protected from
light, and used promptly to avoid any degradation of the reagents. All appropriate
precautions to ensure viability of the kit reagents were taken. The pack insert also stated that
resorufin is unstable in the presence of thiol compounds, such as dithiothreitol (DTT) or β-
mercaptoethanol, which are commonly used in cell lysate buffers. The present study
specifically chose a cell lysate buffer (see Appendix 9.1) that did not contain these compounds
to avoid any interactions with resorufin. Therefore, the cause of the inconsistent or unstable
fluorescent product remains to be determined.
Problems distinguishing MAO-A and MAO-B through the use of selective inhibitors were likely
due to the use of p-tyramine as a substrate for the reaction. The Amplex Red package insert
recommends using benzylamine as a substrate when measuring MAO-B activity, and to use p-
tyramine when measuring MAO-A or total MAO activity, since p-tyramine is a substrate for
both enzyme isoforms. The present study measured total MAO activity, and attempted to
determine the proportion of activity contributed by each isotype. To achieve this, p-tyramine
was used for all reactions, since the reaction with benzylamine would have different kinetic
parameters to p-tyramine, and it would be difficult to compare MAO-B activity measured
using benzylamine to the total MAO activity measured with p-tyramine. Because p-tyramine
was used as the substrate for all MAO reactions, concentrations of the MAO inhibitors
clorgyline and pargyline needed to be carefully titrated to avoid any cross-inhibition.
Reactions with SH-SY5Y cell lysates showed that at the 0.5 µM inhibitor concentrations
suggested by the Amplex Red package insert, a high degree of cross-inhibition occurred (Fig.
9a). Attempts to find inhibitor concentrations suitable to inhibit the selected isotype without
inhibiting the other isotype were unsuccessful, due to the unreliable nature of this assay. A
sample of human blood platelets was prepared and titrated against concentrations of
pargyline in an attempt to determine the lowest pargyline concentration that would
completely inhibit MAO-B activity (Fig. 9b). Unfortunately even the highest inhibitor
concentrations were unable to eliminate all MAO activity in the platelet sample. This
demonstrates either that pargyline was not a potent inhibitor of MAO-B, or that there were
high levels of background or non-MAO-specific fluorescence in the samples tested.
- 82 -
High levels of background or non-specific fluorescence in platelet preparations may be due to
the activity of semicarbazide-sensitive amine oxidase (SSAO), another enzyme that
metabolizes p-tyramine, producing H202 as a byproduct. SSAO is found ubiquitously in blood
plasma and all vascularised tissues (O'Sullivan et al., 2004). The Amplex Red assay is known to
detect activity of this enzyme, and SSAO is not inhibited by clorgyline or pargyline. Although
reasonable efforts were made to isolate blood platelets from plasma, it is likely the platelet
pellet had some plasma contamination. Although the Amplex Red kit claims to be suitable for
measuring MAO activity in blood samples, it offers no solution for avoiding plasma
contamination with SSAO enzyme activity.
Additionally, because Amplex Red assesses MAO enzymatic activity indirectly by measuring
production of the H2O2 by-product, it is possible that other cellular processes that generate
H2O2 were contributing to the high background fluorescence observed in SH-SY5Y lysates.
H2O2 is generated by many different cellular mechanisms, and these would lead to false
positive results or high background fluorescence. Ideally, an assay that is capable of
measuring MAO activity by direct deamination of a substrate is preferred.
In summary, although the Invitrogen Amplex Red assay kit claims to provide a highly sensitive
one-step method for the measurement of MAO enzyme activity, the present study found the
assay to be highly unreliable and inconsistent. Brief attempts were made to optimize the
assay, but these were unsuccessful and were finally abandoned due to the unreliability and
high cost of the assay.
3.4.2 – Kynuramine Assay
The kynuramine assay offers a number of considerable advantages over the previously tested
Amplex Red assay. As discussed above, the Amplex Red assay measures MAO activity
indirectly through the detection of H2O2 in an HRP-coupled reaction. In contrast, kynuramine
is a substrate for both MAO-A and MAO-B, and enzyme activity is measured directly through
the accumulation of 4-HQ, the fluorescent product of kynuramine deamination. The
kynuramine reaction is less complex and is not subject to interference from other cellular
processes that may generate H2O2.
- 83 -
The experiments planned for this study required the testing of a large number of biological
samples, and so a suitable high-throughput assay was needed. This experimenter found the
Amplex Red assay to be time consuming to prepare due to a large number of reagent dilutions
required in the assay protocol, and the long incubation time (1-3 hrs) of the reaction.
Conversely, the kynuramine assay reaction tubes and micro-well plates were relatively simple
to prepare, and the assay worked well with incubation times of 30 mins. Additionally, the cost
of reagents for the kynuramine assay was almost 50 times less expensive than the per-test
cost of the Amplex Red kit. Because the kynuramine assay was easier to set up, faster to run,
and less expensive than the Amplex red kit, the kynuramine assay was more suitable for the
high-throughput testing required for this study.
The most significant advantage of the kynuramine assay over Amplex Red was that the
kynuramine assay proved to be much more reliable. While many problems were encountered
with the Amplex Red assay that meant accurate measures of MAO activity could not be
obtained, the kynuramine assay yielded MAO-dependent measures of fluorescence at all
times. The reliability of the assay made the optimization of the assay for the standard
microtube protocol, and adaptation and optimization of the micro-well plate protocol,
reasonably straightforward and these measurements were able to be conducted in a timely
manner. The kynuramine assay was then successfully used to measure total MAO activity in
cultured cell lysates and human platelet samples and the dose-response of MAO inhibitors to
purified recombinant enzymes. The results from these experiments demonstrated that the
kynuramine assay is a robust, sensitive, and selective assay for MAO activity.
A significant advantage offered by the Amplex Red assay was its ability to distinguish MAO-A
and MAO-B activity in cell lysates, although this study found the assay protocol to be
unsuitable for this purpose. Unfortunately, the kynuramine assay cannot easily distinguish
the activity of MAO-A and –B, since kynuramine is a substrate for both enzymes. It is possible
that clorgyline and pargyline could be added to the kynuramine reactions to inhibit MAO-A
and MAO-B, respectively. However, the concentrations of these inhibitors would need to be
very carefully controlled to correctly inhibit the enzyme and avoid problems with cross-
inhibition. The present study chose not to attempt to optimize these inhibitor concentrations,
as it was considered too complex and time consuming. Instead, the kynuramine assay was
used to assess changes in total MAO activity in SH-SY5Y and U-118 MG cell homogenates.
- 84 -
3.4.2.1 – Measuring MAO Activity in Human Blood Platelets
This study successfully demonstrated that the kynuramine assay could be used to measure
MAO activity in human tissue samples, such as blood platelets. Total MAO activity in human
platelets was determined and found to be significantly greater in non-smoking female
volunteers than their non-smoking male counterparts. This is consistent with previously
published findings of a number of studies that showed women display higher platelet MAO
activity than men (Coccini et al., 2002; M. Harro et al., 2001; Snell et al., 2002). Snell et al.
(2002) also reported that the MAO-B protein concentration in platelets from female subjects
was significantly greater than in males. They found specific activity of the enzyme was no
different between males and females; therefore, the increased activity in women was due to
higher concentrations of enzyme in women’s platelets.
A number of other studies have reported smokers to have lower MAO activity than non-
smokers (Berlin et al., 1995b; J. S. Fowler et al., 2003; J. S. Fowler et al., 1996a; J. S. Fowler et
al., 1996b; Launay et al., 2009); however, this study found no difference in the total platelet
MAO activity of female smokers compared to female non-smokers. No significant conclusions
can be drawn from these data, as the cohort studied included only two female smokers.
3.4.3 – Summary
This study initially trialed the Invitrogen Amplex Red MAO activity test kit for the
measurement of MAO-A and MAO-B in cultured cell lysates. However, this assay was too
unreliable, giving inconsistent and variable results, and was too costly to undertake extensive
optimization experiments. In contrast, the kynuramine assay performed consistently, and
proved to be sensitive and robust while being relatively inexpensive, but lacks easy
differentiation of MAO-A and MAO-B isotype activity.
- 85 -
Chapter Four: Inhibition of MAO Enzyme Activity by Tobacco Extracts
As discussed earlier (section 1.4), many studies have reported inhibition of MAO enzymes
in a complex manner by tobacco compounds, and this has been tested over a number of
different experimental paradigms. Many of these studies have examined the effects of
tobacco on whole organisms. For example, Fowler et al. used PET scanning to determine
that activity of MAO enzymes was reduced in the brains and peripheral organs of
smokers compared to non-smokers (J. S. Fowler et al., 2003; J. S. Fowler et al., 2005; J. S.
Fowler et al., 2000), and Gilbert et al. measured inhibition of MAO-B in blood platelets of
smokers attempting to quit (Gilbert et al., 2003). These studies examined the gross
effects of whole tobacco on very complex systems. Studies in humans and animal models
have been very useful in identifying the overall consequences of tobacco exposure, but
the inherent complexity in whole organism experiments means it can be difficult to tease
out the exact nature of the MAO inhibition induced by tobacco compounds. These
compounds are subject to many homeostatic and physiological mechanisms, which can
mask or perturb the specific effects of tobacco compounds on MAO enzymes.
The effects of tobacco extract on MAO have been more closely examined in less complex
experimental systems. For example, Yu & Boulton (1987) used rat lung homogenates to
determine that compounds in cigarette smoke and leaf extracts irreversibly inhibit MAO.
Castagnoli et al. (2002), Mendez-Alvarez et al. (1997a), and Hauptman & Shih (2001)
demonstrated inhibition of MAO-A and MAO-B by tobacco compounds in rat brain
mitochondrial preparations, and Khalil et al. (2000) used human mitochondrial
preparations to assess the MAO inhibitory potential of a naphthoquinone compound
isolated from tobacco leaves. While these experimental systems are less complex than
whole organisms, many non-specific interactions are still possible due to the
heterogeneous nature of the protein preparations used. Recently, purified human
recombinant MAO-A and MAO-B enzymes have become commercially available, and
these purified enzymes offer the opportunity to test tobacco extracts in a very simple
- 86 -
experimental system. This allows examination of the direct inhibition of MAO-A and
MAO-B by tobacco compounds in the absence of any confounding or interfering
interactions, and this may give a clearer indication of the nature of MAO inhibition
induced by tobacco extracts. For example, Herraiz & Chaparro (2005) used purified
MAO-A and MAO-B enzyme solutions to test the inhibitory potential of cigarette smoke
solutions and found that tobacco smoke extracts inhibited MAO-A competitively and
exhibited a mixed-type inhibition for MAO-B.
However, the interaction between TPM and MAO-A and MAO-B is likely to be quite
complex. Smoking tobacco is formulated from the dried leaves of the tobacco plant and
contains over 4000 different compounds. Many of these have yet to be characterized,
and as described earlier (see section 1.4), a number of different compounds with MAO
inhibitory action have been identified in tobacco smoke. Additionally, no two tobacco
samples will be exactly the same, as the compounds present within the tobacco plant are
subject to subtle changes and variations depending on the regional conditions,
agricultural practices, and variety of the tobacco plant. Different methods of tobacco
treatment and preparation also mean there can be quite significant differences in the
composition of any given tobacco sample.
To date, relatively little research has examined the differences in composition between
various types or brands of tobacco. A study of forty-eight brands of filtered cigarettes
produced by Philip Morris USA Inc. compared differences in the mainstream smoke yield
for over forty tobacco smoke constituents (Counts et al., 2004), and several other studies
have examined differences in selected tobacco compounds. Rickert et al. (1985)
compared the nicotine, carbon monoxide, and tar content of several brands of
manufactured cigarettes, hand-rolled cigarettes, and cigars available on the Canadian
market, finding that smoke tar and nicotine yields were greatest in cigars, followed by
hand-rolled cigarettes and manufactured cigarettes, in that order. More recently, Calafat
et al. (2004) examined the tar, nicotine, and carbon monoxide (CO) yields of mainstream
cigarette smoke from 77 different cigarette brands purchased in 35 countries. They
reported that mean tar, nicotine, and CO smoke yields varied widely between brands and
also varied by region. Given that it has been recognized that there are inherent
differences in the composition of tobacco smoke, it can be inferred that these
composition differences may have an impact on the effects of different tobacco smokes.
For example, while studies have examined the effects of cigarette smoke on the activity
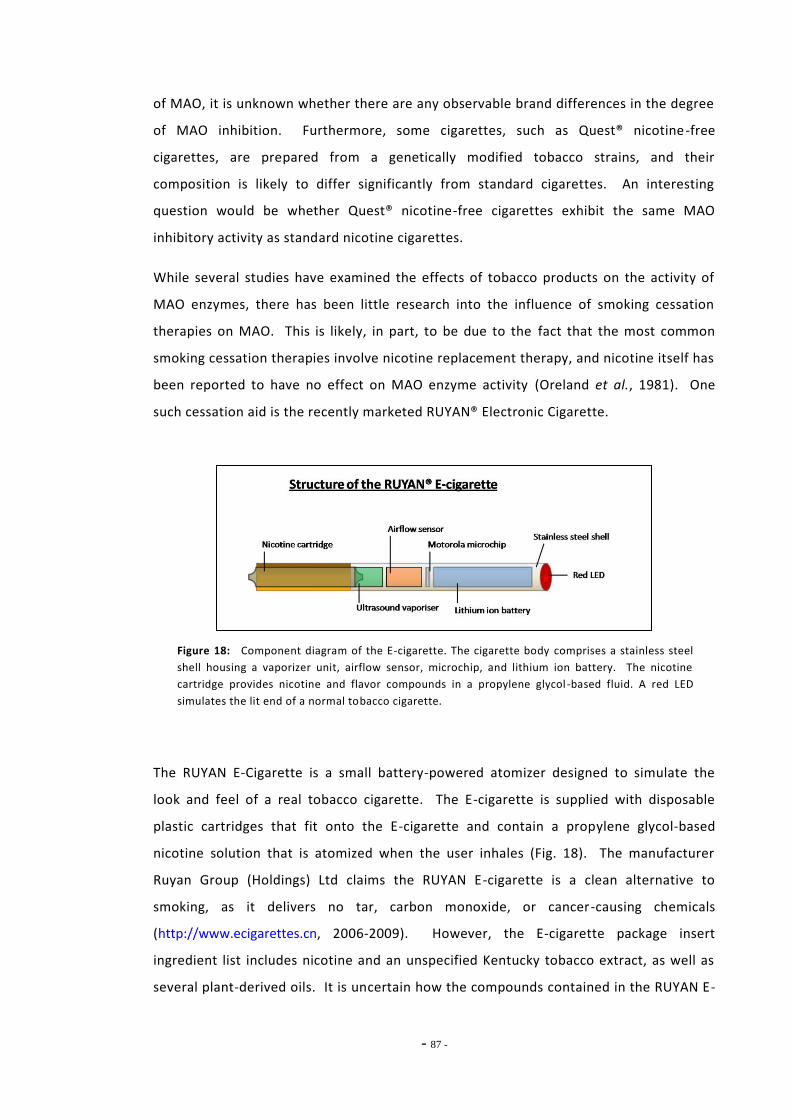
- 87 -
of MAO, it is unknown whether there are any observable brand differences in the degree
of MAO inhibition. Furthermore, some cigarettes, such as Quest® nicotine-free
cigarettes, are prepared from a genetically modified tobacco strains, and their
composition is likely to differ significantly from standard cigarettes. An interesting
question would be whether Quest® nicotine-free cigarettes exhibit the same MAO
inhibitory activity as standard nicotine cigarettes.
While several studies have examined the effects of tobacco products on the activity of
MAO enzymes, there has been little research into the influence of smoking cessation
therapies on MAO. This is likely, in part, to be due to the fact that the most common
smoking cessation therapies involve nicotine replacement therapy, and nicotine itself has
been reported to have no effect on MAO enzyme activity (Oreland et al., 1981). One
such cessation aid is the recently marketed RUYAN® Electronic Cigarette.
Figure 18: Component diagram of the E-cigarette. The cigarette body comprises a stainless steel
shell housing a vaporizer unit, airflow sensor, microchip, and lithium ion battery. The nicotine
cartridge provides nicotine and flavor compounds in a propylene glycol -based fluid. A red LED
simulates the lit end of a normal tobacco cigarette.
The RUYAN E-Cigarette is a small battery-powered atomizer designed to simulate the
look and feel of a real tobacco cigarette. The E-cigarette is supplied with disposable
plastic cartridges that fit onto the E-cigarette and contain a propylene glycol-based
nicotine solution that is atomized when the user inhales (Fig. 18). The manufacturer
Ruyan Group (Holdings) Ltd claims the RUYAN E-cigarette is a clean alternative to
smoking, as it delivers no tar, carbon monoxide, or cancer-causing chemicals
(http://www.ecigarettes.cn, 2006-2009). However, the E-cigarette package insert
ingredient list includes nicotine and an unspecified Kentucky tobacco extract, as well as
several plant-derived oils. It is uncertain how the compounds contained in the RUYAN E-
- 88 -
cigarette affect users of this device, or whether the tobacco extract contained in the
cartridge formulation might influence MAO in a manner similar to standard tobacco . To
date there have been few published studies conducted on the effects of the RUYAN E-
cigarette, or its efficacy as a smoking cessation aid (Pauly et al., 2007). Bullen et al.
(2010) reported that the Ruyan E-cigarette reduced study participants’ desire to smoke
and tobacco withdrawal symptoms to a degree similar to that seen with the Nicorette®
nicotine inhalator (manufactured by Pfizer Health AB, Helsingborg, Sweden), but further
research is required into the safety and efficacy of this device as a smoking cessation aid.
4.1.2 - Objectives
The present study investigated the inhibition of purified recombinant MAO enzymes in
response to treatment with nicotine and a number of tobacco extracts. The aim of these
experiments was to determine if TPM inhibited MAO-A and/or MAO-B in vitro, and to
measure the extent of this inhibition. Several previous studies have demonstrated MAO
inhibition by tobacco smoke extracts (Castagnoli et al., 2002; Herraiz & Chaparro, 2005;
Mendez-Alvarez et al., 1997a; P. H. Yu & Boulton, 1987). The present study aimed to replicate
some of the previously reported results using TPM extracts prepared from cigarette and
tobacco products commercially available in New Zealand. It was hoped that these
experiments would identify whether any difference or variation existed in MAO inhibitory
activity between different brands and preparations of tobacco product. In addition, these
experiments were designed to test whether non-nicotine tobacco components showed any
MAO inhibitory activity. To test this, TPM derived from de-nicotinized and low-nicotine
content cigarettes was tested for MAO inhibition as well.
The present study also examined the differences in the MAO inhibitory properties of TPM
derived from the mainstream smoke of standard cigarettes compared to cigarettes hand-
rolled from fine-cut tobacco. Eight popular brands of cigarette sold in New Zealand were
compared with five brands of loose-leaf tobacco with regard to their nicotine yield, tar yield,
and MAO-A and MAO-B inhibitory activity.
Samples taken from the RUYAN® Electronic Cigarette were also tested for MAO-A and MAO-B
inhibitory activity, to determine if the RUYAN® has any effect on MAO, and to compare these
samples with the inhibitory effects of complete tobacco TPM.
- 89 -
4.2 - MATERIALS AND METHODS
The activity of MAO-A and MAO-B enzymes was tested in response to exposure to a
number of different tobacco and nicotine products. The activity of purified recombinant
MAO-A and MAO-B enzymes following treatment with tobacco extracts was measured
using the modified kynuramine micro-well plate assay. This assay was developed
specifically for use in this study and is described in detail in Chapter Three of this thesis.
4.2.1 - Purified Recombinant MAO Enzymes
Purified human recombinant MAO-A and MAO-B enzymes were purchased from Sigma
Aldrich (Cat. # M7316 and M7441, respectively). These enzymes had been prepared in an
insect baculovirus expression vector and purified. The purified enzyme was supplied as a
5.0 mg/mL protein solution in 100 mM potassium phosphate, pH 7.4., 0.25 M sucrose, 0.1
mM EDTA, and 5% glycerol. Vials of enzyme solution were shipped on dry ice from the
supplier and stored at -80°C to maintain enzyme activity. Enzyme stocks were thawed
quickly and maintained on ice while 10 µL aliquots were removed to microcentr ifuge
tubes. These aliquots were then stored at -80°C until required.
4.2.2 - Kynuramine Assay
The modified kynuramine micro-well plate method described in section 2.4.2.1 was used to
test the effect of purified nicotine and tobacco TPM extracts on the activity of MAO-A and
MAO-B enzymes. Briefly, TPM extracts were diluted to relevant working concentrations with
sodium phosphate buffer (pH 7.4), maintaining an ethanol concentration of 0.5% to control
for any effects of the ethanol solvent. The diluted TPM solutions were pipetted in 100 µL
aliquots into the wells of a black polystyrene 96-well microplate in triplicate, before addition
of 60 µL of 0.307 mM kynuramine dihydrobromide. The assay reaction was started with the
addition of 40 µL of 125 µg/mL human recombinant MAO-A or MAO-B enzyme. The
microplates were then covered with aluminium foil to protect the reaction from light, and the
plates were incubated in the dark at 37°C for 30 mins. The reaction was terminated by
- 90 -
addition of 75 µL of 2.5 M NaOH to each well, and the fluorescent products of the reaction
were measured using an Optima fluorescence spectrophotometer at excitation and emission
wavelengths of 320 nm and 380 nm, respectively.
Relative fluorescence of the reactions was compared to the fluorescence of 4-
hydroxyquinoline reference standards that were diluted over the range of 10 nM to 1 µM and
incubated in tandem with the test samples. Additionally, negative control wells that
contained sodium phosphate buffer in place of MAO enzyme, in addition to diluted TPM and
kynuramine were prepared and incubated with the reactions. The fluorescence data from
these negative control wells was used to correct for any auto-fluorescence of the TPM
extracts.
MAO-A inhibition was confirmed by testing the MAO-A activity concentration-response to
clorgyline, a well-known MAO-A inhibitor, over the range of 1 pM to 10 µM clorgyline.
Similarly, MAO-B inhibition was also confirmed by testing the concentration-response of the
enzyme to the MAO-B inhibitor pargyline, using the same inhibitor concentration range as for
clorgyline.
4.2.3 - Tobacco Extract Exposures
TPM filters were prepared by Labstat International, Inc. (Kitchener, Canada) as described
in section 2.2.1. These filters were prepared from a range of different cigarettes and
loose-leaf tobacco products, comprising eight different cigarette brands (Table 7) and
five different loose-leaf tobacco brands (Table 8) that are commercially available for sale
in New Zealand. Additionally, TPM filters were also prepared from low nicotine and
nicotine-free Quest® cigarettes – Quest 1 and Quest 3, respectively. Quest nicotine-free
cigarettes are prepared from tobacco strains that have been genetically modified to
prevent the expression of nicotine. These cigarettes are not commercially available in
New Zealand and were a gift from the manufacturer (Vector Tobacco Ltd., North
Carolina, USA). The cigarette and tobacco samples were burnt and the smoke extracted
and collected onto paper filter pads by smoking machines (Labstat, Canada. See section
2.2.1). Cigarette samples were collected at a ratio of between 13 and 20 cigarettes per
filter, and filters were weighed before an after collection to determine the mass of tar
- 91 -
collected. Loose-leaf tobacco samples were hand-rolled, using commercially available
tobacco wrap papers and cellulose acetate filter tips, into cigarettes containing 900 mg of
tobacco. TPM from these hand-rolled cigarettes was then collected at a ratio of 6-7
cigarettes per paper filter pad. One TPM sample was collected from each of the brands
tested, with the exception of the Holiday® Regular cigarette and the Park Drive tobacco
products. For each of these products two samples were prepared from cigarettes or
tobacco originating from different batches of the same brand.
After TPM collection by Labstat in Canada, the filters were sent to the ESR Kenepuru
Science Centre with information about the extraction process, which included the
number of cigarettes extracted per filter and the weighed mass of tar on each filter. On
arrival each filter was catalogued with a unique sample number for tracking purposes
(Appendix 9.2). Each filter was then extracted into ethanol, as described in section 2.2.1,
in an effort to preserve as many volatile components in the tobacco smoke as possible. These
extracts were then assayed for nicotine concentration using an Agilent 5973N gas
chromatograph. The measured nicotine concentration and tar mass were then used to
calculate the amount of nicotine and tar per cigarette, and these figures were compared
to the manufacturers’ reported data as printed on the packets of cigarettes and tobacco
(Table 7 and Table 8, respectively).
The effect of ethanol on the enzymatic reaction was carefully controlled for, since
previous testing had indicated that ethanol concentrations of greater than 0.5%
significantly inhibited MAO enzyme activity (Y.-L. Lim & P. Truman, Pers. Comms.). TPM
concentrations used for testing were limited to a maximum of 0.25% ethanol in the final
reaction to avoid this inhibition due to ethanol. Dilute absolute ethanol was added to
the reactions when necessary to maintain a constant ethanol concentration of 0.25% in
all reactions.
4.2.4 – Comparison of Nicotine, TPM, and Denicotinized TPM
Initial enzyme experiments compared the effects of TPM from Quest nicotine-free cigarettes
with TPM from Holiday Special Filter cigarettes. The latter brand was selected as
representative of standard TPM. For these reactions the Holiday TPM (HTPM) sample was
- 92 -
diluted to a final concentration of 0.2 µM nicotine, and the Quest TPM (QTPM) sample was
diluted to the same degree. These two samples were tested alongside purified nicotine and
an ethanol vehicle control to determine the effects of these extracts on the activity of MAO-A
and MAO-B.
Each experiment involved testing MAO-A or MAO-B activity in the presence of the ethanol
control, 0.2 µM purified nicotine, HTPM, and QTPM. Each condition was tested in triplicate.
MAO-A enzyme activity in response to the test compounds was tested in 8 separate
experiments, and MAO-B was tested over 7 experiments. Kynuramine fluorescence data from
replicate reactions was averaged, and the mean values used in further analysis and
calculations.
4.2.5 – Comparison of MAO Inhibition Between Tobacco Products
TPM samples from all cigarette and loose-leaf tobacco brands selected for this study
were used to determine the concentration-response profile for MAO-A and MAO-B
enzyme activity. Each TPM sample was tested for its effect on MAO inhibition at 7
dilutions over the range 0.0001% to 0.25% TPM, and each dilution was tested in
triplicate. The data gathered in these experiments were analyzed with GraphPad Prism
software, and a concentration-response curve was used to estimate the IC50 for every
TPM sample tested, and the nicotine concentration at which MAO activity was inhibited
by 50% was calculated for each TPM sample. This nicotine concentration was then used
to compare any differences in MAO-A and MAO-B inhibition between different brands of
cigarettes, different brands of loose-leaf tobacco, differences between cigarettes and
loose-leaf tobacco, and differences between standard cigarettes and low-nicotine or
nicotine-free Quest® cigarettes.
To validate that the calculated IC50 values accurately represented the inhibitory
properties of the test samples, each TPM sample was retested (in triplicate) for MAO-A
inhibition at an arbitrary nicotine concentration (4 µM nicotine). The degree of MAO -A
inhibition measured in this experiment was then compared to the expected inhibit ion as
predicted by the IC50 and concentration-response curve data. Each TPM sample was then
further tested for MAO-A inhibition at an arbitrary tar concentration (0.01 mg/mL), and
- 93 -
the measured inhibition compared to the predicted inhibition at that tar concentration.
These test procedures were used to provide data on the best way to estimate TPM
concentrations between different samples.
4.2.6 - RUYAN® Cartridge Exposures
Samples of the nicotine solution in RUYAN® electronic cigarette cartridges were used to
test the inhibitory activity of this product in a brief pilot study. Two RUYAN cartridges
were received in sealed capsules from Dr M. Laugeson (Health New Zealand Ltd.
Christchurch, NZ). These were marked with the known nicotine concentrations of 0 and
6 mg/mL. Each cartridge was disassembled, and the solution-soaked glass wool filter was
removed from the capsule. The solution was transferred to a clean, sterile plastic
centrifuge tube, and the filter was carefully squeezed and centrifuged for 5 mins at
10,000 x g to recover as much of the cartridge solution as possible.
Information from the manufacturer indicated that the cartridge solution contained
nicotine and tobacco flavourings and extracts in a propylene glycol base. These solutions
were diluted to working concentrations with distilled water before testing. The RUYAN 6
sample was diluted to final reaction concentrations of 0.2 µM or 2 µM nicotine, and the
RUYAN 0 sample was equivalently diluted.
The RUYAN samples were tested for MAO-A and MAO-B inhibitory activity, initially at
concentrations equivalent to 0.2 µM nicotine and a reaction incubation time of 15 mins
(7 experiments, each comprising triplicate reactions). Subsequently, the effects of the
RUYAN 0 and RUYAN 6 samples on MAO-A and MAO-B were also examined at higher
sample concentrations (2 µM nicotine or equivalent; 4 experiments in triplicate), and for
longer reaction durations (60 mins; three experiments in triplicate). Fluorescence data
from replicate reactions were averaged, and the means used in further analysis.
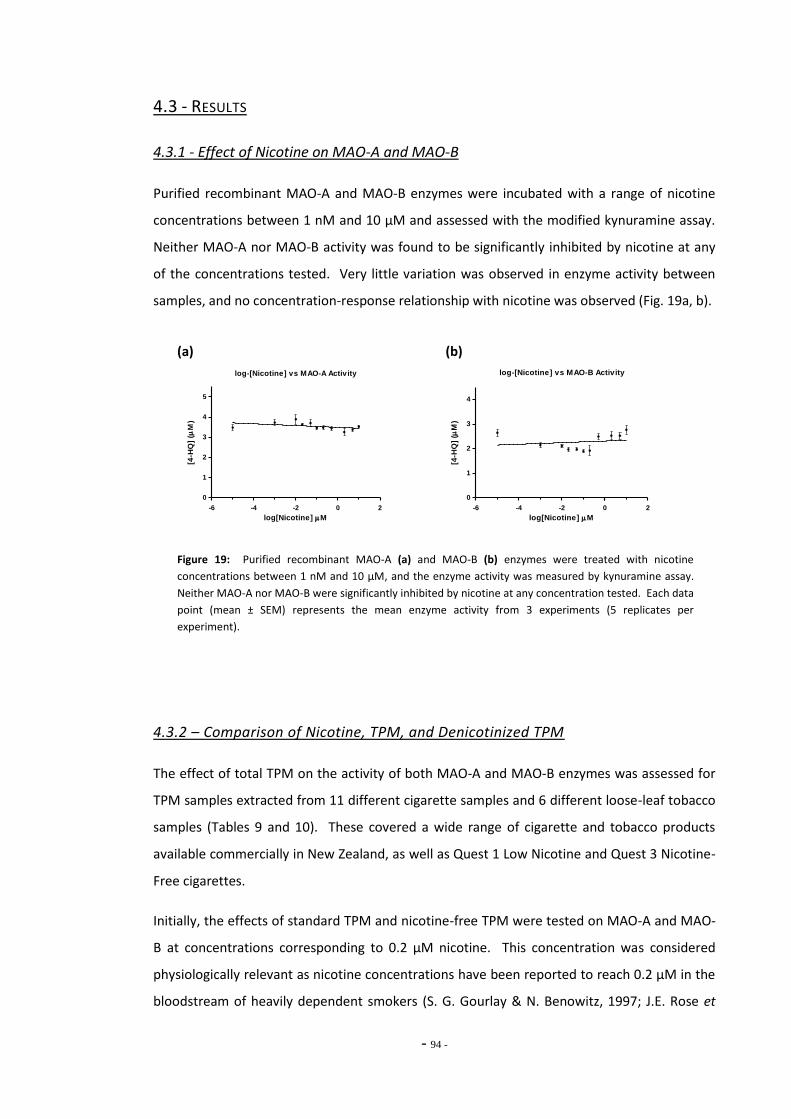
- 94 -
4.3 - RESULTS
4.3.1 - Effect of Nicotine on MAO-A and MAO-B
Purified recombinant MAO-A and MAO-B enzymes were incubated with a range of nicotine
concentrations between 1 nM and 10 µM and assessed with the modified kynuramine assay.
Neither MAO-A nor MAO-B activity was found to be significantly inhibited by nicotine at any
of the concentrations tested. Very little variation was observed in enzyme activity between
samples, and no concentration-response relationship with nicotine was observed (Fig. 19a, b).
(a) (b)
log-[Nicotine] vs MAO-A Activity
-6 -4 -2 0 2
0
1
2
3
4
5
log[Nicotine] M
[4-H
Q]
(M
)
log-[Nicotine] vs MAO-B Activity
-6 -4 -2 0 2
0
1
2
3
4
log[Nicotine] M
[4-H
Q]
(M
)
Figure 19: Purified recombinant MAO-A (a) and MAO-B (b) enzymes were treated with nicotine
concentrations between 1 nM and 10 µM, and the enzyme activity was measured by kynuramine assay.
Neither MAO-A nor MAO-B were significantly inhibited by nicotine at any concentration tested. Each data
point (mean ± SEM) represents the mean enzyme activity from 3 experiments (5 replicates per
experiment).
4.3.2 – Comparison of Nicotine, TPM, and Denicotinized TPM
The effect of total TPM on the activity of both MAO-A and MAO-B enzymes was assessed for
TPM samples extracted from 11 different cigarette samples and 6 different loose-leaf tobacco
samples (Tables 9 and 10). These covered a wide range of cigarette and tobacco products
available commercially in New Zealand, as well as Quest 1 Low Nicotine and Quest 3 Nicotine-
Free cigarettes.
Initially, the effects of standard TPM and nicotine-free TPM were tested on MAO-A and MAO-
B at concentrations corresponding to 0.2 µM nicotine. This concentration was considered
physiologically relevant as nicotine concentrations have been reported to reach 0.2 µM in the
bloodstream of heavily dependent smokers (S. G. Gourlay & N. Benowitz, 1997; J.E. Rose et
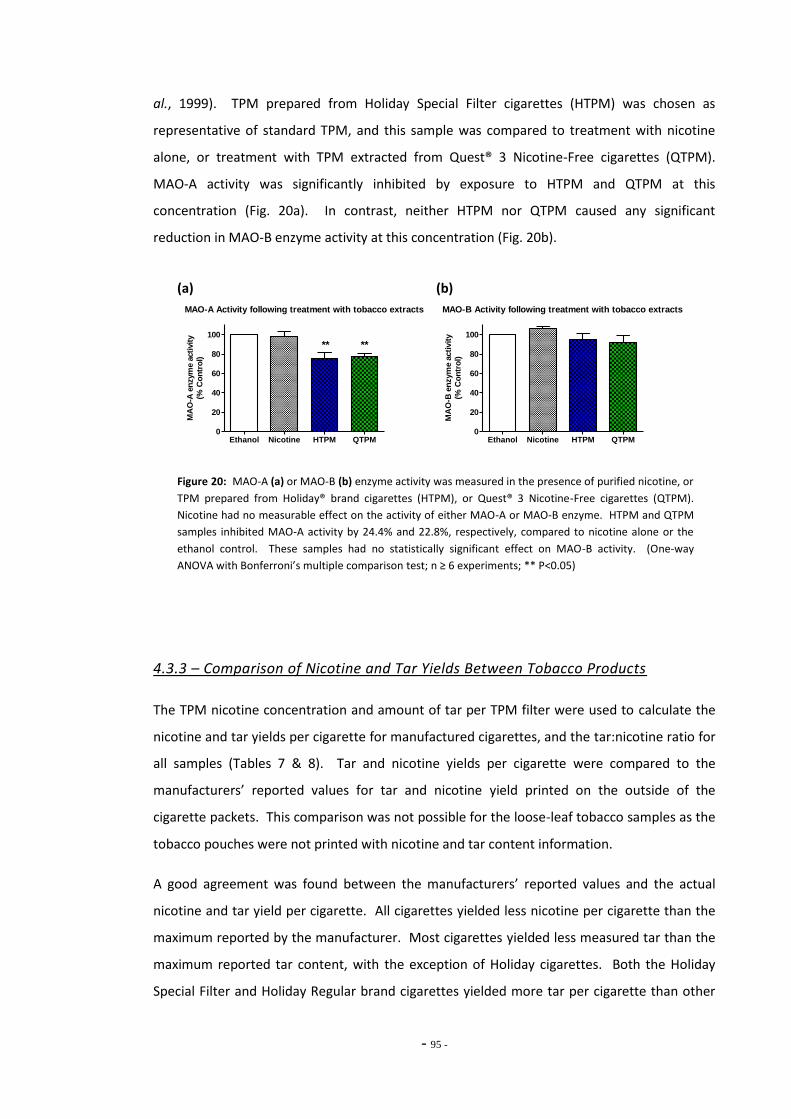
- 95 -
al., 1999). TPM prepared from Holiday Special Filter cigarettes (HTPM) was chosen as
representative of standard TPM, and this sample was compared to treatment with nicotine
alone, or treatment with TPM extracted from Quest® 3 Nicotine-Free cigarettes (QTPM).
MAO-A activity was significantly inhibited by exposure to HTPM and QTPM at this
concentration (Fig. 20a). In contrast, neither HTPM nor QTPM caused any significant
reduction in MAO-B enzyme activity at this concentration (Fig. 20b).
(a) (b)
MAO-A Activity following treatment with tobacco extracts
Ethanol Nicotine HTPM QTPM0
20
40
60
80
100
** **
MA
O-A
en
zym
e a
cti
vit
y
(% C
on
tro
l)
MAO-B Activity following treatment with tobacco extracts
Ethanol Nicotine HTPM QTPM0
20
40
60
80
100
MA
O-B
en
zym
e a
cti
vit
y
(% C
on
tro
l)
Figure 20: MAO-A (a) or MAO-B (b) enzyme activity was measured in the presence of purified nicotine, or
TPM prepared from Holiday® brand cigarettes (HTPM), or Quest® 3 Nicotine-Free cigarettes (QTPM).
Nicotine had no measurable effect on the activity of either MAO-A or MAO-B enzyme. HTPM and QTPM
samples inhibited MAO-A activity by 24.4% and 22.8%, respectively, compared to nicotine alone or the
ethanol control. These samples had no statistically significant effect on MAO-B activity. (One-way
ANOVA with Bonferroni’s multiple comparison test; n ≥ 6 experiments; ** P<0.05)
4.3.3 – Comparison of Nicotine and Tar Yields Between Tobacco Products
The TPM nicotine concentration and amount of tar per TPM filter were used to calculate the
nicotine and tar yields per cigarette for manufactured cigarettes, and the tar:nicotine ratio for
all samples (Tables 7 & 8). Tar and nicotine yields per cigarette were compared to the
manufacturers’ reported values for tar and nicotine yield printed on the outside of the
cigarette packets. This comparison was not possible for the loose-leaf tobacco samples as the
tobacco pouches were not printed with nicotine and tar content information.
A good agreement was found between the manufacturers’ reported values and the actual
nicotine and tar yield per cigarette. All cigarettes yielded less nicotine per cigarette than the
maximum reported by the manufacturer. Most cigarettes yielded less measured tar than the
maximum reported tar content, with the exception of Holiday cigarettes. Both the Holiday
Special Filter and Holiday Regular brand cigarettes yielded more tar per cigarette than other
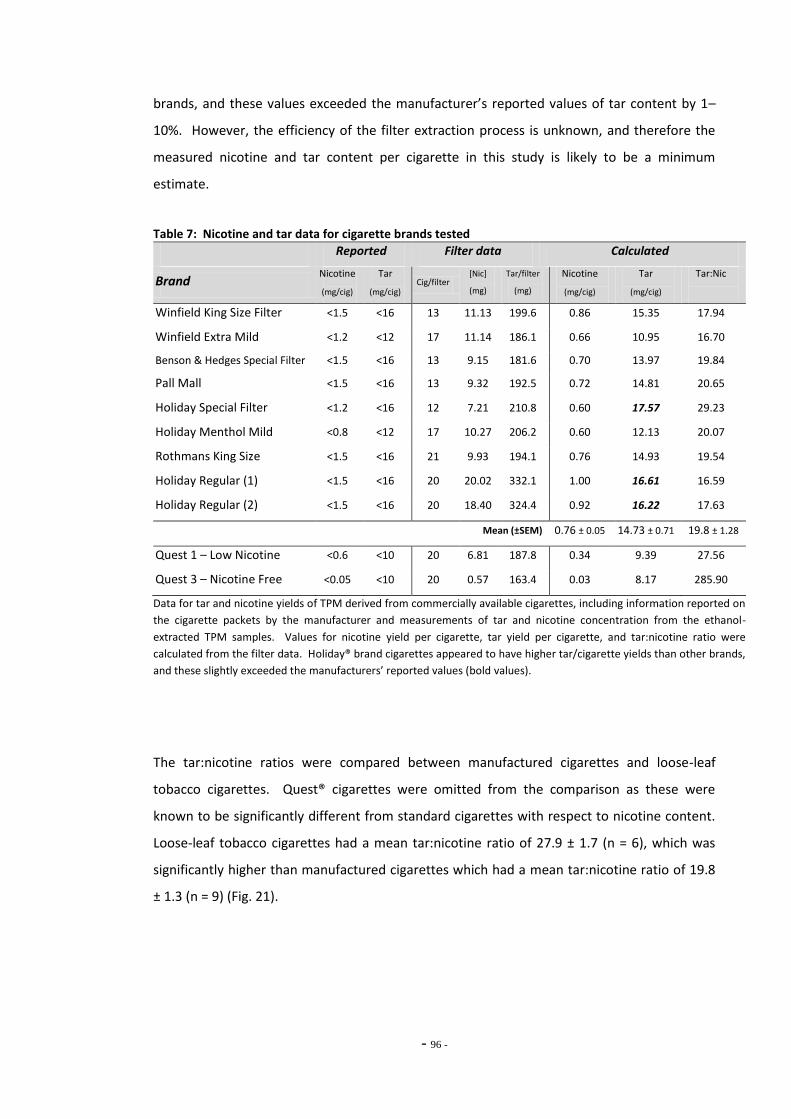
- 96 -
brands, and these values exceeded the manufacturer’s reported values of tar content by 1–
10%. However, the efficiency of the filter extraction process is unknown, and therefore the
measured nicotine and tar content per cigarette in this study is likely to be a minimum
estimate.
Table 7: Nicotine and tar data for cigarette brands tested
Reported Filter data Calculated
Brand Nicotine
(mg/cig)
Tar
(mg/cig) Cig/filter
[Nic]
(mg)
Tar/filter
(mg)
Nicotine
(mg/cig)
Tar
(mg/cig)
Tar:Nic
Winfield King Size Filter <1.5 <16 13 11.13 199.6 0.86 15.35 17.94
Winfield Extra Mild <1.2 <12 17 11.14 186.1 0.66 10.95 16.70
Benson & Hedges Special Filter <1.5 <16 13 9.15 181.6 0.70 13.97 19.84
Pall Mall <1.5 <16 13 9.32 192.5 0.72 14.81 20.65
Holiday Special Filter <1.2 <16 12 7.21 210.8 0.60 17.57 29.23
Holiday Menthol Mild <0.8 <12 17 10.27 206.2 0.60 12.13 20.07
Rothmans King Size <1.5 <16 21 9.93 194.1 0.76 14.93 19.54
Holiday Regular (1) <1.5 <16 20 20.02 332.1 1.00 16.61 16.59
Holiday Regular (2) <1.5 <16 20 18.40 324.4 0.92 16.22 17.63
Mean (±SEM) 0.76 ± 0.05 14.73 ± 0.71 19.8 ± 1.28
Quest 1 – Low Nicotine <0.6 <10 20 6.81 187.8 0.34 9.39 27.56
Quest 3 – Nicotine Free <0.05 <10 20 0.57 163.4 0.03 8.17 285.90
Data for tar and nicotine yields of TPM derived from commercially available cigarettes, including information reported on
the cigarette packets by the manufacturer and measurements of tar and nicotine concentration from the ethanol-
extracted TPM samples. Values for nicotine yield per cigarette, tar yield per cigarette, and tar:nicotine ratio were
calculated from the filter data. Holiday® brand cigarettes appeared to have higher tar/cigarette yields than other brands,
and these slightly exceeded the manufacturers’ reported values (bold values).
The tar:nicotine ratios were compared between manufactured cigarettes and loose-leaf
tobacco cigarettes. Quest® cigarettes were omitted from the comparison as these were
known to be significantly different from standard cigarettes with respect to nicotine content.
Loose-leaf tobacco cigarettes had a mean tar:nicotine ratio of 27.9 ± 1.7 (n = 6), which was
significantly higher than manufactured cigarettes which had a mean tar:nicotine ratio of 19.8
± 1.3 (n = 9) (Fig. 21).
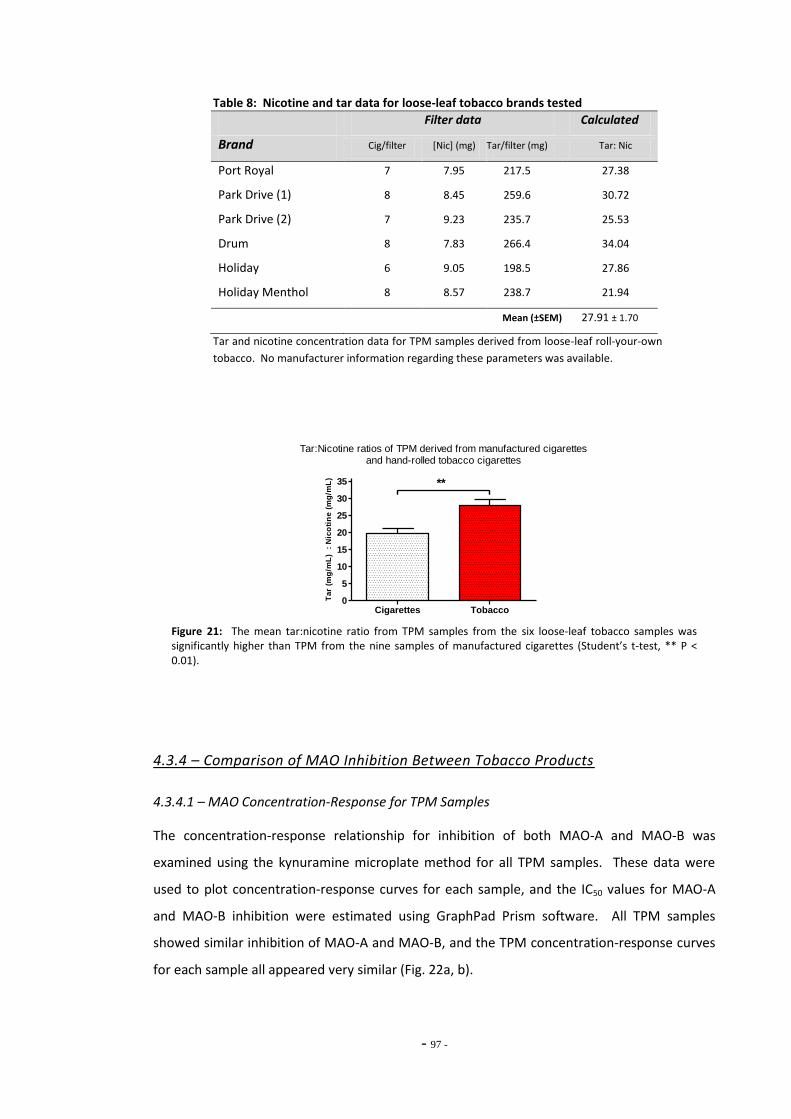
- 97 -
Table 8: Nicotine and tar data for loose-leaf tobacco brands tested
Filter data Calculated
Brand Cig/filter [Nic] (mg) Tar/filter (mg) Tar: Nic
Port Royal 7 7.95 217.5 27.38
Park Drive (1) 8 8.45 259.6 30.72
Park Drive (2) 7 9.23 235.7 25.53
Drum 8 7.83 266.4 34.04
Holiday 6 9.05 198.5 27.86
Holiday Menthol 8 8.57 238.7 21.94
Mean (±SEM) 27.91 ± 1.70
Tar and nicotine concentration data for TPM samples derived from loose-leaf roll-your-own
tobacco. No manufacturer information regarding these parameters was available.
Tar:Nicotine ratios of TPM derived from manufactured cigarettesand hand-rolled tobacco cigarettes
Cigarettes Tobacco0
5
10
15
20
25
30
35 **
Ta
r (m
g/m
L)
: N
ico
tin
e (
mg
/mL
)
Figure 21: The mean tar:nicotine ratio from TPM samples from the six loose-leaf tobacco samples was significantly higher than TPM from the nine samples of manufactured cigarettes (Student’s t-test, ** P < 0.01).
4.3.4 – Comparison of MAO Inhibition Between Tobacco Products
4.3.4.1 – MAO Concentration-Response for TPM Samples
The concentration-response relationship for inhibition of both MAO-A and MAO-B was
examined using the kynuramine microplate method for all TPM samples. These data were
used to plot concentration-response curves for each sample, and the IC50 values for MAO-A
and MAO-B inhibition were estimated using GraphPad Prism software. All TPM samples
showed similar inhibition of MAO-A and MAO-B, and the TPM concentration-response curves
for each sample all appeared very similar (Fig. 22a, b).
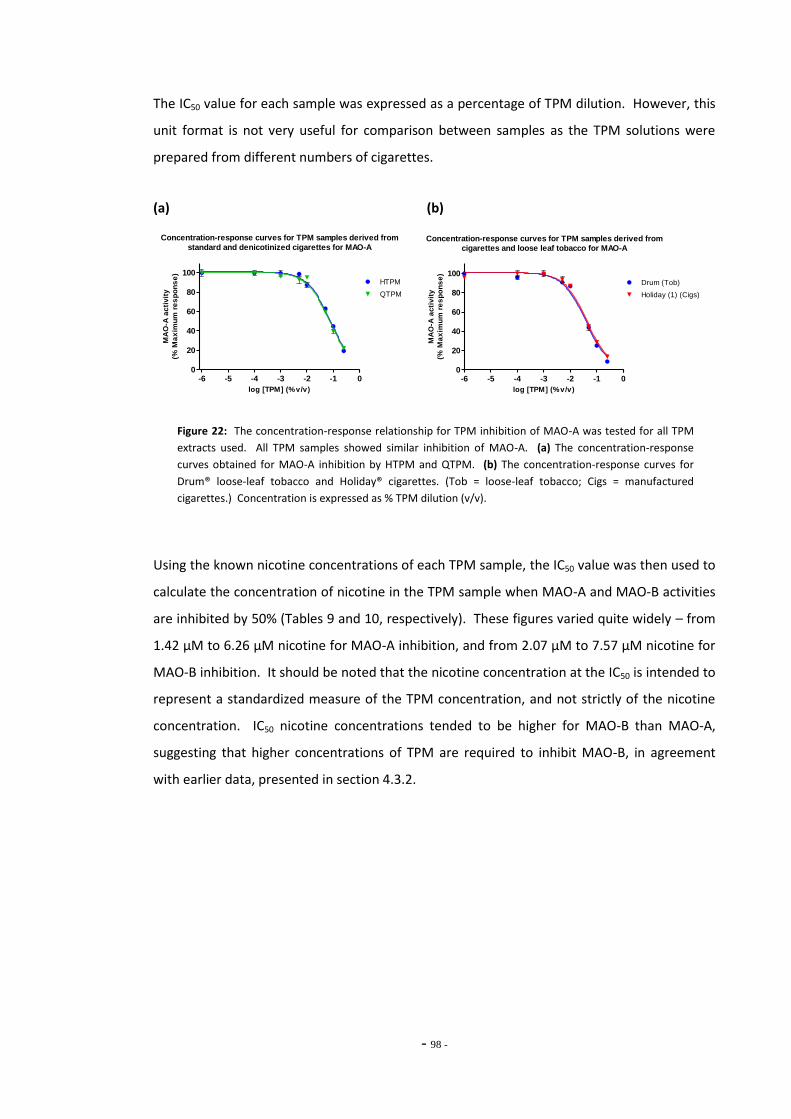
- 98 -
The IC50 value for each sample was expressed as a percentage of TPM dilution. However, this
unit format is not very useful for comparison between samples as the TPM solutions were
prepared from different numbers of cigarettes.
(a) (b)
Concentration-response curves for TPM samples derived from
standard and denicotinized cigarettes for MAO-A
-6 -5 -4 -3 -2 -1 00
20
40
60
80
100HTPM
QTPM
log [TPM] (% v/v)
MA
O-A
ac
tiv
ity
(% M
ax
imu
m r
es
po
ns
e)
Concentration-response curves for TPM samples derived from
cigarettes and loose leaf tobacco for MAO-A
-6 -5 -4 -3 -2 -1 00
20
40
60
80
100Drum (Tob)
Holiday (1) (Cigs)
log [TPM] (% v/v)
MA
O-A
ac
tiv
ity
(% M
ax
imu
m r
es
po
ns
e)
Figure 22: The concentration-response relationship for TPM inhibition of MAO-A was tested for all TPM
extracts used. All TPM samples showed similar inhibition of MAO-A. (a) The concentration-response
curves obtained for MAO-A inhibition by HTPM and QTPM. (b) The concentration-response curves for
Drum® loose-leaf tobacco and Holiday® cigarettes. (Tob = loose-leaf tobacco; Cigs = manufactured
cigarettes.) Concentration is expressed as % TPM dilution (v/v).
Using the known nicotine concentrations of each TPM sample, the IC50 value was then used to
calculate the concentration of nicotine in the TPM sample when MAO-A and MAO-B activities
are inhibited by 50% (Tables 9 and 10, respectively). These figures varied quite widely – from
1.42 µM to 6.26 µM nicotine for MAO-A inhibition, and from 2.07 µM to 7.57 µM nicotine for
MAO-B inhibition. It should be noted that the nicotine concentration at the IC50 is intended to
represent a standardized measure of the TPM concentration, and not strictly of the nicotine
concentration. IC50 nicotine concentrations tended to be higher for MAO-B than MAO-A,
suggesting that higher concentrations of TPM are required to inhibit MAO-B, in agreement
with earlier data, presented in section 4.3.2.
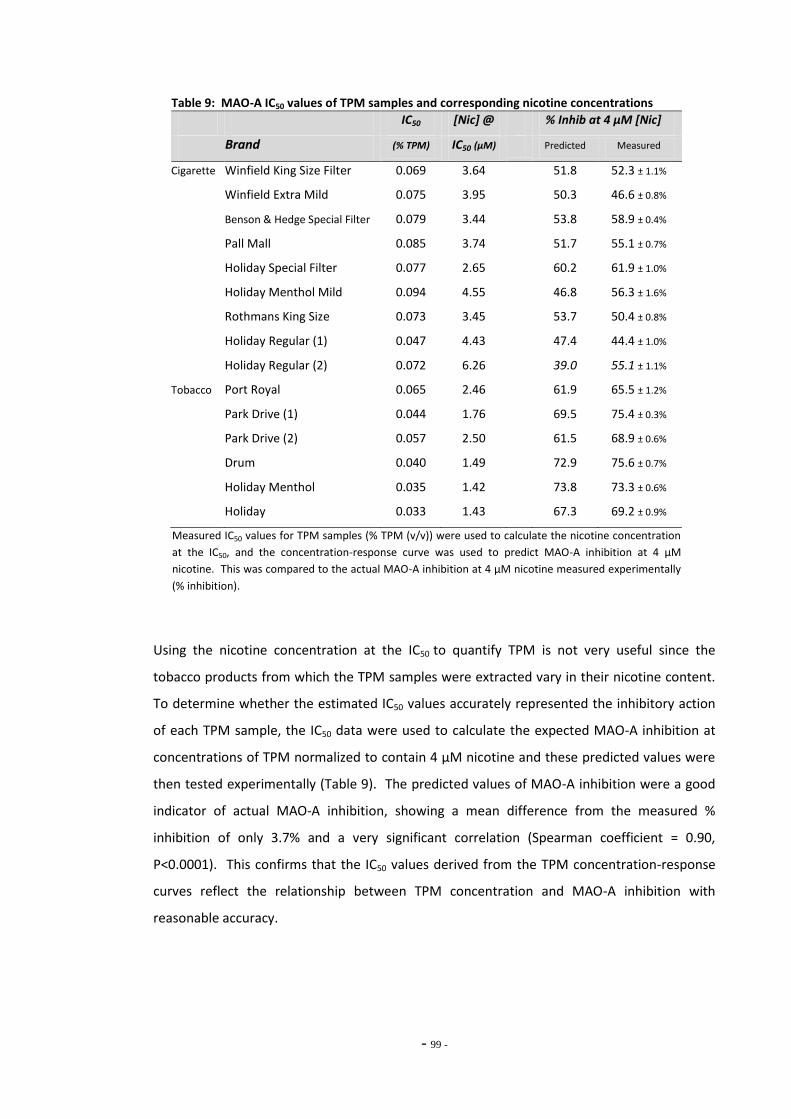
- 99 -
Table 9: MAO-A IC50 values of TPM samples and corresponding nicotine concentrations
IC50 [Nic] @ % Inhib at 4 μM *Nic+
Brand (% TPM) IC50 (μM) Predicted Measured
Cigarette Winfield King Size Filter 0.069 3.64 51.8 52.3 ± 1.1%
Winfield Extra Mild 0.075 3.95 50.3 46.6 ± 0.8%
Benson & Hedge Special Filter 0.079 3.44 53.8 58.9 ± 0.4%
Pall Mall 0.085 3.74 51.7 55.1 ± 0.7%
Holiday Special Filter 0.077 2.65 60.2 61.9 ± 1.0%
Holiday Menthol Mild 0.094 4.55 46.8 56.3 ± 1.6%
Rothmans King Size 0.073 3.45 53.7 50.4 ± 0.8%
Holiday Regular (1) 0.047 4.43 47.4 44.4 ± 1.0%
Holiday Regular (2) 0.072 6.26 39.0 55.1 ± 1.1%
Tobacco Port Royal 0.065 2.46 61.9 65.5 ± 1.2%
Park Drive (1) 0.044 1.76 69.5 75.4 ± 0.3%
Park Drive (2) 0.057 2.50 61.5 68.9 ± 0.6%
Drum 0.040 1.49 72.9 75.6 ± 0.7%
Holiday Menthol 0.035 1.42 73.8 73.3 ± 0.6%
Holiday 0.033 1.43 67.3 69.2 ± 0.9%
Measured IC50 values for TPM samples (% TPM (v/v)) were used to calculate the nicotine concentration
at the IC50, and the concentration-response curve was used to predict MAO-A inhibition at 4 μM
nicotine. This was compared to the actual MAO-A inhibition at 4 μM nicotine measured experimentally
(% inhibition).
Using the nicotine concentration at the IC50 to quantify TPM is not very useful since the
tobacco products from which the TPM samples were extracted vary in their nicotine content.
To determine whether the estimated IC50 values accurately represented the inhibitory action
of each TPM sample, the IC50 data were used to calculate the expected MAO-A inhibition at
concentrations of TPM normalized to contain 4 μM nicotine and these predicted values were
then tested experimentally (Table 9). The predicted values of MAO-A inhibition were a good
indicator of actual MAO-A inhibition, showing a mean difference from the measured %
inhibition of only 3.7% and a very significant correlation (Spearman coefficient = 0.90,
P<0.0001). This confirms that the IC50 values derived from the TPM concentration-response
curves reflect the relationship between TPM concentration and MAO-A inhibition with
reasonable accuracy.
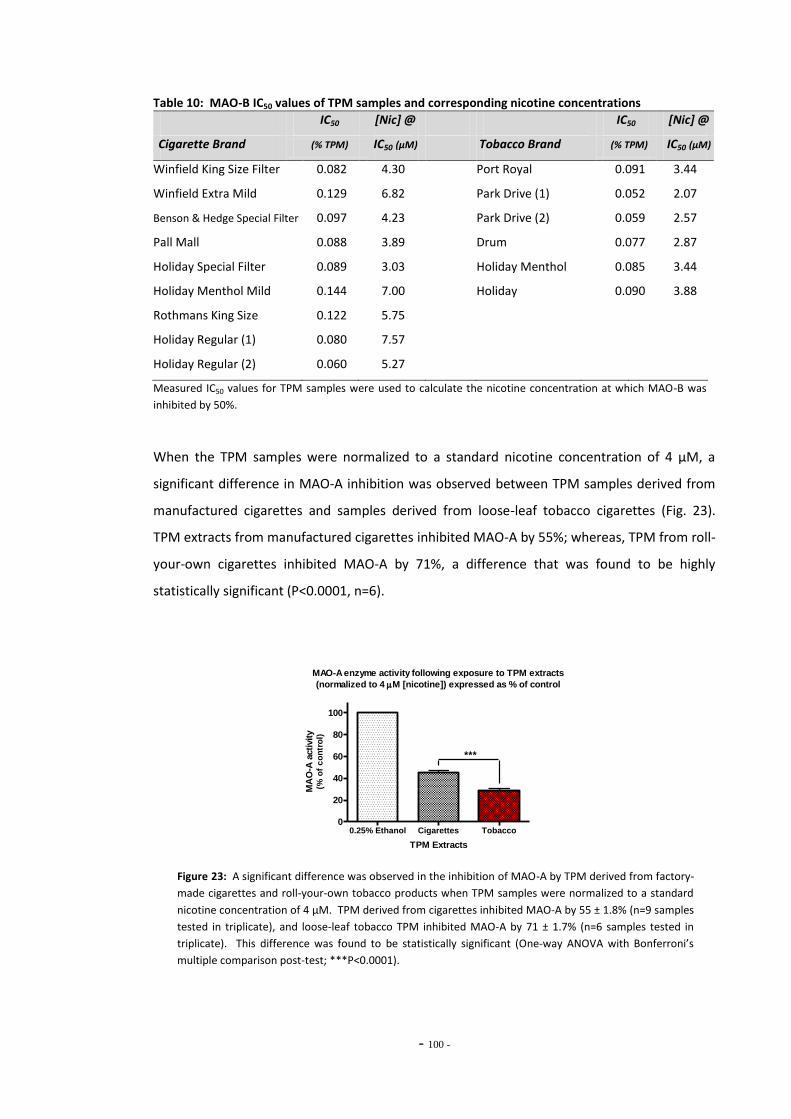
- 100 -
Table 10: MAO-B IC50 values of TPM samples and corresponding nicotine concentrations
IC50 [Nic] @ IC50 [Nic] @
Cigarette Brand (% TPM) IC50 (μM) Tobacco Brand (% TPM) IC50 (µM)
Winfield King Size Filter 0.082 4.30 Port Royal 0.091 3.44
Winfield Extra Mild 0.129 6.82 Park Drive (1) 0.052 2.07
Benson & Hedge Special Filter 0.097 4.23 Park Drive (2) 0.059 2.57
Pall Mall 0.088 3.89 Drum 0.077 2.87
Holiday Special Filter 0.089 3.03 Holiday Menthol 0.085 3.44
Holiday Menthol Mild 0.144 7.00 Holiday 0.090 3.88
Rothmans King Size 0.122 5.75
Holiday Regular (1) 0.080 7.57
Holiday Regular (2) 0.060 5.27
Measured IC50 values for TPM samples were used to calculate the nicotine concentration at which MAO-B was
inhibited by 50%.
When the TPM samples were normalized to a standard nicotine concentration of 4 µM, a
significant difference in MAO-A inhibition was observed between TPM samples derived from
manufactured cigarettes and samples derived from loose-leaf tobacco cigarettes (Fig. 23).
TPM extracts from manufactured cigarettes inhibited MAO-A by 55%; whereas, TPM from roll-
your-own cigarettes inhibited MAO-A by 71%, a difference that was found to be highly
statistically significant (P<0.0001, n=6).
MAO-A enzyme activity following exposure to TPM extracts
(normalized to 4 M [nicotine]) expressed as % of control
0.25% Ethanol Cigarettes Tobacco0
20
40
60
80
100
***
TPM Extracts
MA
O-A
acti
vit
y(%
of
co
ntr
ol)
Figure 23: A significant difference was observed in the inhibition of MAO-A by TPM derived from factory-
made cigarettes and roll-your-own tobacco products when TPM samples were normalized to a standard
nicotine concentration of 4 μM. TPM derived from cigarettes inhibited MAO-A by 55 ± 1.8% (n=9 samples
tested in triplicate), and loose-leaf tobacco TPM inhibited MAO-A by 71 ± 1.7% (n=6 samples tested in
triplicate). This difference was found to be statistically significant (One-way ANOVA with Bonferroni’s
multiple comparison post-test; ***P<0.0001).
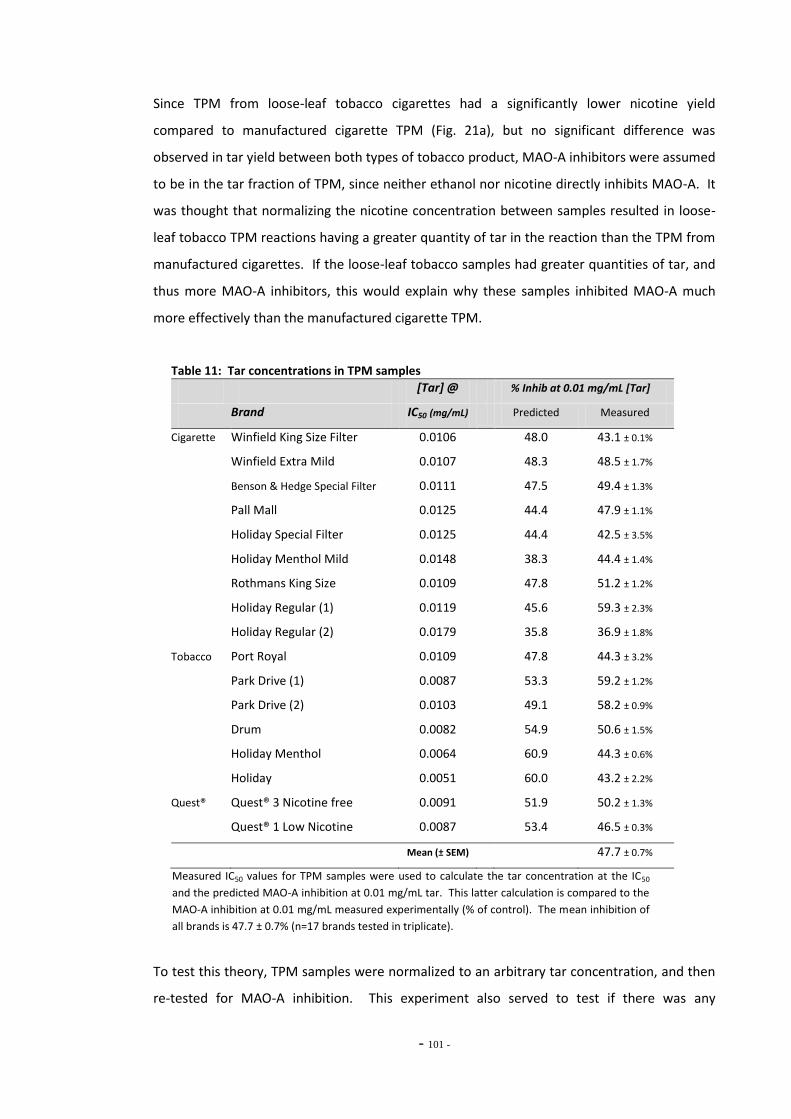
- 101 -
Since TPM from loose-leaf tobacco cigarettes had a significantly lower nicotine yield
compared to manufactured cigarette TPM (Fig. 21a), but no significant difference was
observed in tar yield between both types of tobacco product, MAO-A inhibitors were assumed
to be in the tar fraction of TPM, since neither ethanol nor nicotine directly inhibits MAO-A. It
was thought that normalizing the nicotine concentration between samples resulted in loose-
leaf tobacco TPM reactions having a greater quantity of tar in the reaction than the TPM from
manufactured cigarettes. If the loose-leaf tobacco samples had greater quantities of tar, and
thus more MAO-A inhibitors, this would explain why these samples inhibited MAO-A much
more effectively than the manufactured cigarette TPM.
Table 11: Tar concentrations in TPM samples
[Tar] @ % Inhib at 0.01 mg/mL [Tar]
Brand IC50 (mg/mL) Predicted Measured
Cigarette Winfield King Size Filter 0.0106 48.0 43.1 ± 0.1%
Winfield Extra Mild 0.0107 48.3 48.5 ± 1.7%
Benson & Hedge Special Filter 0.0111 47.5 49.4 ± 1.3%
Pall Mall 0.0125 44.4 47.9 ± 1.1%
Holiday Special Filter 0.0125 44.4 42.5 ± 3.5%
Holiday Menthol Mild 0.0148 38.3 44.4 ± 1.4%
Rothmans King Size 0.0109 47.8 51.2 ± 1.2%
Holiday Regular (1) 0.0119 45.6 59.3 ± 2.3%
Holiday Regular (2) 0.0179 35.8 36.9 ± 1.8%
Tobacco Port Royal 0.0109 47.8 44.3 ± 3.2%
Park Drive (1) 0.0087 53.3 59.2 ± 1.2%
Park Drive (2) 0.0103 49.1 58.2 ± 0.9%
Drum 0.0082 54.9 50.6 ± 1.5%
Holiday Menthol 0.0064 60.9 44.3 ± 0.6%
Holiday 0.0051 60.0 43.2 ± 2.2%
Quest® Quest® 3 Nicotine free 0.0091 51.9 50.2 ± 1.3%
Quest® 1 Low Nicotine 0.0087 53.4 46.5 ± 0.3%
Mean (± SEM) 47.7 ± 0.7%
Measured IC50 values for TPM samples were used to calculate the tar concentration at the IC50
and the predicted MAO-A inhibition at 0.01 mg/mL tar. This latter calculation is compared to the
MAO-A inhibition at 0.01 mg/mL measured experimentally (% of control). The mean inhibition of
all brands is 47.7 ± 0.7% (n=17 brands tested in triplicate).
To test this theory, TPM samples were normalized to an arbitrary tar concentration, and then
re-tested for MAO-A inhibition. This experiment also served to test if there was any
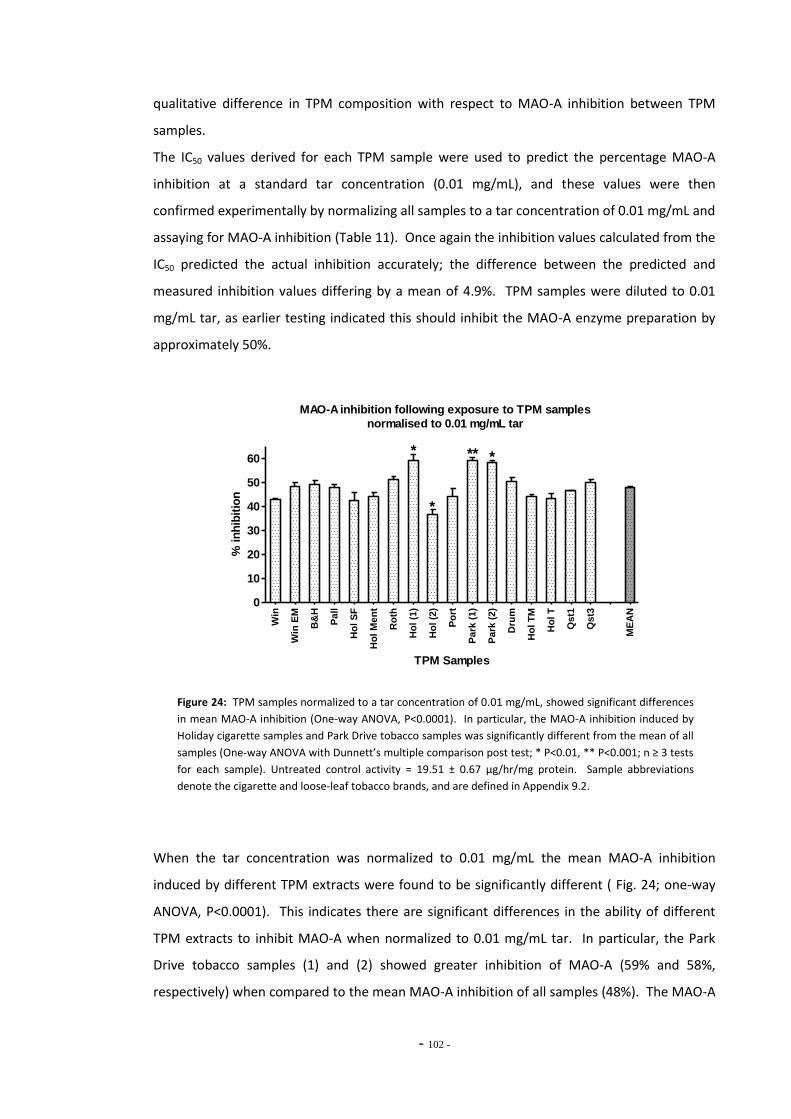
- 102 -
qualitative difference in TPM composition with respect to MAO-A inhibition between TPM
samples.
The IC50 values derived for each TPM sample were used to predict the percentage MAO-A
inhibition at a standard tar concentration (0.01 mg/mL), and these values were then
confirmed experimentally by normalizing all samples to a tar concentration of 0.01 mg/mL and
assaying for MAO-A inhibition (Table 11). Once again the inhibition values calculated from the
IC50 predicted the actual inhibition accurately; the difference between the predicted and
measured inhibition values differing by a mean of 4.9%. TPM samples were diluted to 0.01
mg/mL tar, as earlier testing indicated this should inhibit the MAO-A enzyme preparation by
approximately 50%.
MAO-A inhibition following exposure to TPM samples
normalised to 0.01 mg/mL tar
Win
Win
EM
B&
H
Pa
ll
Ho
l S
F
Ho
l M
en
t
Ro
th
Ho
l (1
)
Ho
l (2
)
Po
rt
Pa
rk (
1)
Pa
rk (
2)
Dru
m
Ho
l T
M
Ho
l T
Qs
t1
Qs
t3
ME
AN
0
10
20
30
40
50
60*
*
***
TPM Samples
% in
hib
itio
n
Figure 24: TPM samples normalized to a tar concentration of 0.01 mg/mL, showed significant differences
in mean MAO-A inhibition (One-way ANOVA, P<0.0001). In particular, the MAO-A inhibition induced by
Holiday cigarette samples and Park Drive tobacco samples was significantly different from the mean of all
samples (One-way ANOVA with Dunnett’s multiple comparison post test; * P<0.01, ** P<0.001; n ≥ 3 tests
for each sample). Untreated control activity = 19.51 ± 0.67 µg/hr/mg protein. Sample abbreviations
denote the cigarette and loose-leaf tobacco brands, and are defined in Appendix 9.2.
When the tar concentration was normalized to 0.01 mg/mL the mean MAO-A inhibition
induced by different TPM extracts were found to be significantly different ( Fig. 24; one-way
ANOVA, P<0.0001). This indicates there are significant differences in the ability of different
TPM extracts to inhibit MAO-A when normalized to 0.01 mg/mL tar. In particular, the Park
Drive tobacco samples (1) and (2) showed greater inhibition of MAO-A (59% and 58%,
respectively) when compared to the mean MAO-A inhibition of all samples (48%). The MAO-A
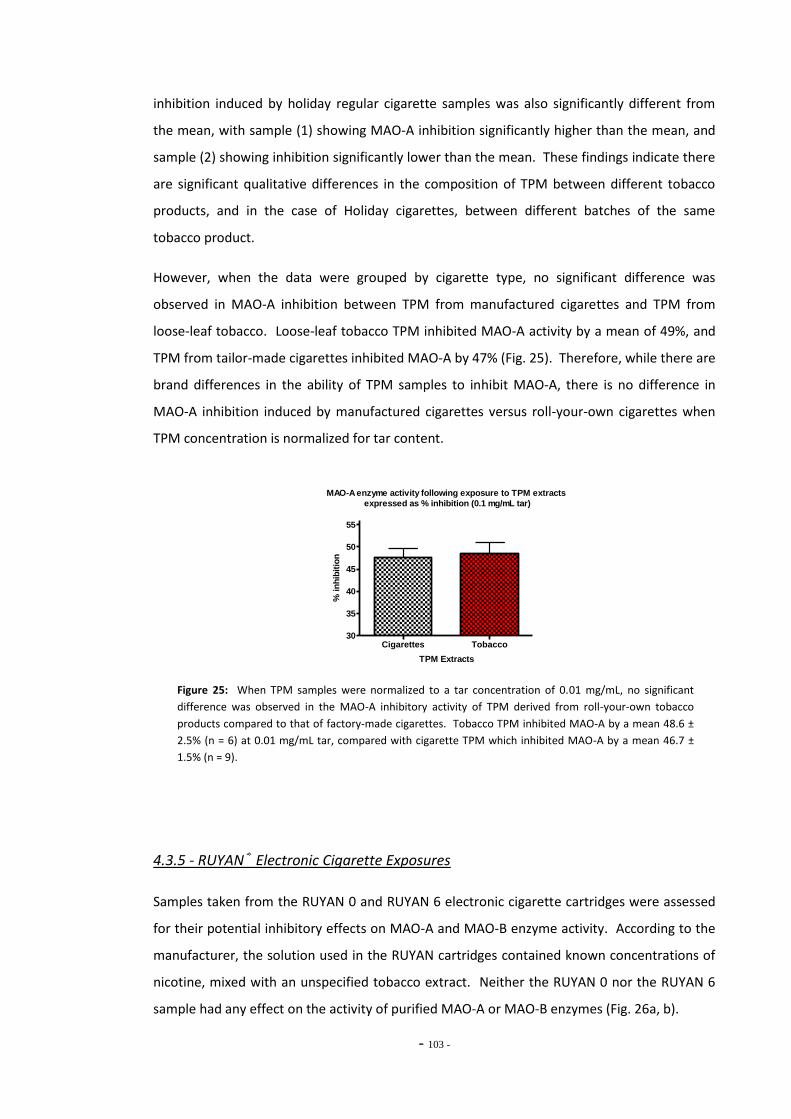
- 103 -
inhibition induced by holiday regular cigarette samples was also significantly different from
the mean, with sample (1) showing MAO-A inhibition significantly higher than the mean, and
sample (2) showing inhibition significantly lower than the mean. These findings indicate there
are significant qualitative differences in the composition of TPM between different tobacco
products, and in the case of Holiday cigarettes, between different batches of the same
tobacco product.
However, when the data were grouped by cigarette type, no significant difference was
observed in MAO-A inhibition between TPM from manufactured cigarettes and TPM from
loose-leaf tobacco. Loose-leaf tobacco TPM inhibited MAO-A activity by a mean of 49%, and
TPM from tailor-made cigarettes inhibited MAO-A by 47% (Fig. 25). Therefore, while there are
brand differences in the ability of TPM samples to inhibit MAO-A, there is no difference in
MAO-A inhibition induced by manufactured cigarettes versus roll-your-own cigarettes when
TPM concentration is normalized for tar content.
MAO-A enzyme activity following exposure to TPM extracts
expressed as % inhibition (0.1 mg/mL tar)
Cigarettes Tobacco30
35
40
45
50
55
TPM Extracts
% in
hib
itio
n
Figure 25: When TPM samples were normalized to a tar concentration of 0.01 mg/mL, no significant
difference was observed in the MAO-A inhibitory activity of TPM derived from roll-your-own tobacco
products compared to that of factory-made cigarettes. Tobacco TPM inhibited MAO-A by a mean 48.6 ±
2.5% (n = 6) at 0.01 mg/mL tar, compared with cigarette TPM which inhibited MAO-A by a mean 46.7 ±
1.5% (n = 9).
4.3.5 - RUYAN® Electronic Cigarette Exposures
Samples taken from the RUYAN 0 and RUYAN 6 electronic cigarette cartridges were assessed
for their potential inhibitory effects on MAO-A and MAO-B enzyme activity. According to the
manufacturer, the solution used in the RUYAN cartridges contained known concentrations of
nicotine, mixed with an unspecified tobacco extract. Neither the RUYAN 0 nor the RUYAN 6
sample had any effect on the activity of purified MAO-A or MAO-B enzymes (Fig. 26a, b).
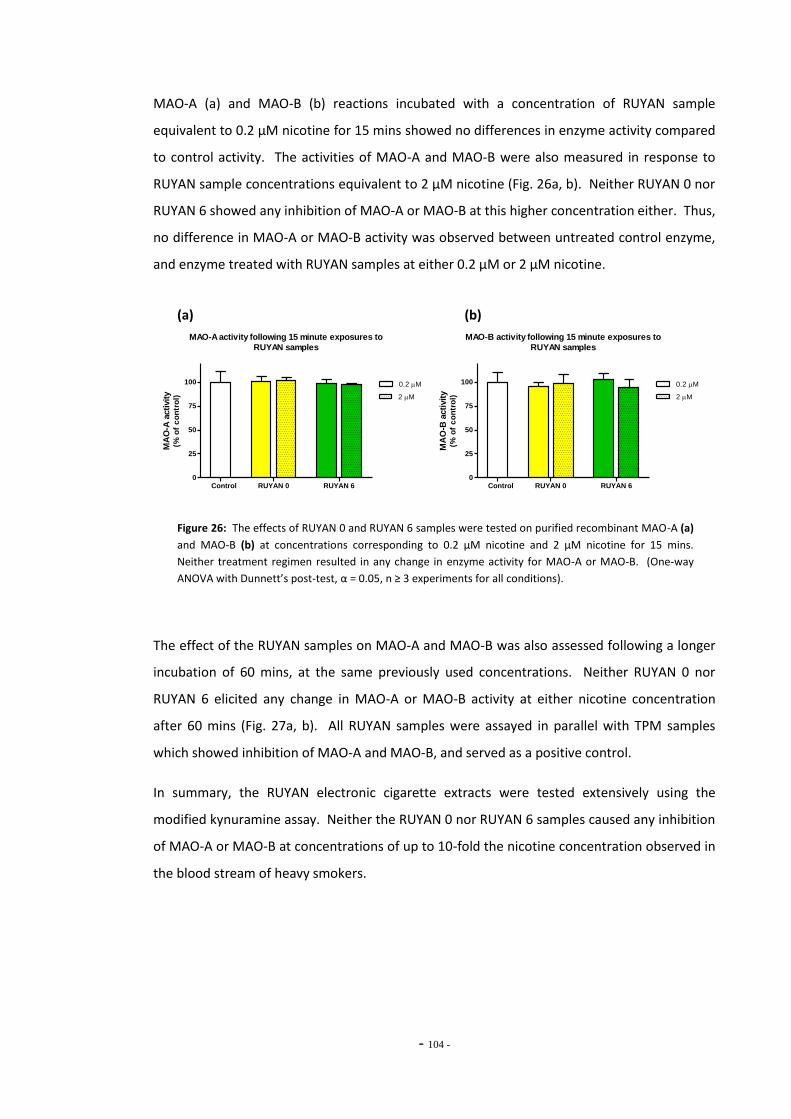
- 104 -
MAO-A (a) and MAO-B (b) reactions incubated with a concentration of RUYAN sample
equivalent to 0.2 µM nicotine for 15 mins showed no differences in enzyme activity compared
to control activity. The activities of MAO-A and MAO-B were also measured in response to
RUYAN sample concentrations equivalent to 2 µM nicotine (Fig. 26a, b). Neither RUYAN 0 nor
RUYAN 6 showed any inhibition of MAO-A or MAO-B at this higher concentration either. Thus,
no difference in MAO-A or MAO-B activity was observed between untreated control enzyme,
and enzyme treated with RUYAN samples at either 0.2 µM or 2 µM nicotine.
(a) (b)
MAO-A activity following 15 minute exposures to
RUYAN samples
Control RUYAN 0 RUYAN 60
25
50
75
100 0.2 M
2 M
MA
O-A
acti
vit
y(%
of
co
ntr
ol)
MAO-B activity following 15 minute exposures to
RUYAN samples
Control RUYAN 0 RUYAN 60
25
50
75
100 0.2 M
2 M
MA
O-B
acti
vit
y(%
of
co
ntr
ol)
Figure 26: The effects of RUYAN 0 and RUYAN 6 samples were tested on purified recombinant MAO-A (a)
and MAO-B (b) at concentrations corresponding to 0.2 µM nicotine and 2 µM nicotine for 15 mins.
Neither treatment regimen resulted in any change in enzyme activity for MAO-A or MAO-B. (One-way
ANOVA with Dunnett’s post-test, α = 0.05, n ≥ 3 experiments for all conditions).
The effect of the RUYAN samples on MAO-A and MAO-B was also assessed following a longer
incubation of 60 mins, at the same previously used concentrations. Neither RUYAN 0 nor
RUYAN 6 elicited any change in MAO-A or MAO-B activity at either nicotine concentration
after 60 mins (Fig. 27a, b). All RUYAN samples were assayed in parallel with TPM samples
which showed inhibition of MAO-A and MAO-B, and served as a positive control.
In summary, the RUYAN electronic cigarette extracts were tested extensively using the
modified kynuramine assay. Neither the RUYAN 0 nor RUYAN 6 samples caused any inhibition
of MAO-A or MAO-B at concentrations of up to 10-fold the nicotine concentration observed in
the blood stream of heavy smokers.
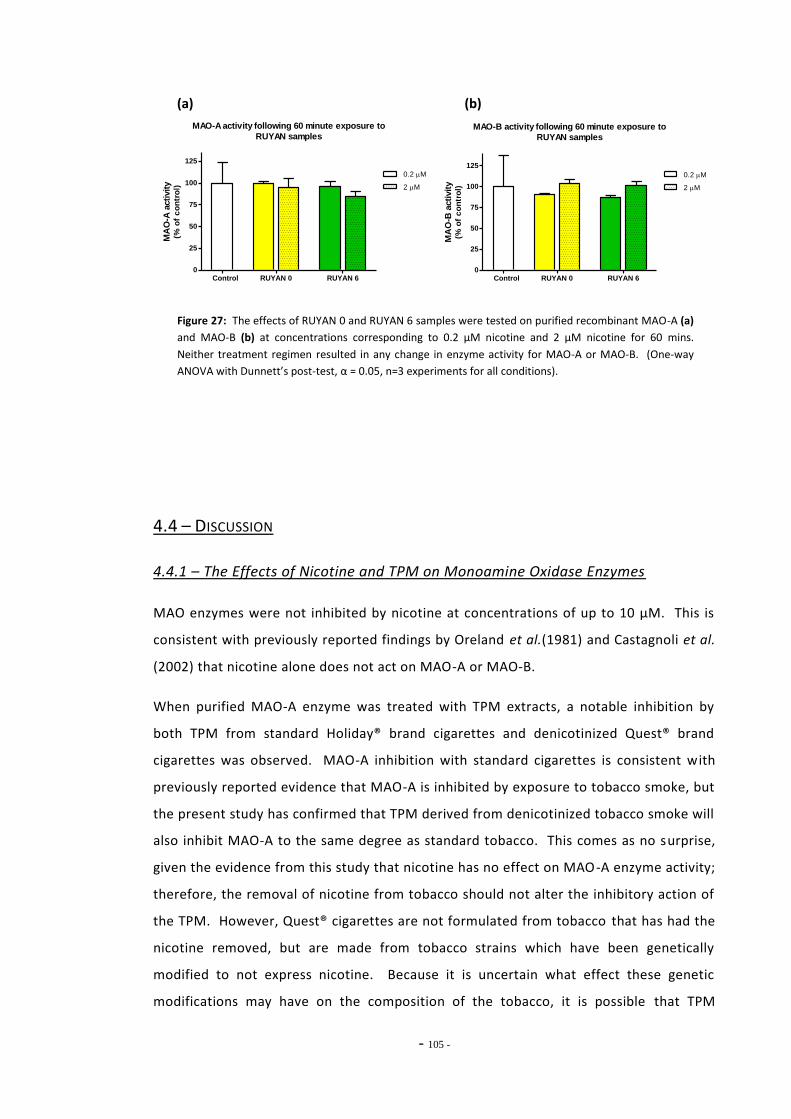
- 105 -
(a) (b)
MAO-A activity following 60 minute exposure to
RUYAN samples
Control RUYAN 0 RUYAN 60
25
50
75
100
125
0.2 M
2 M
MA
O-A
acti
vit
y(%
of
co
ntr
ol)
MAO-B activity following 60 minute exposure to
RUYAN samples
Control RUYAN 0 RUYAN 60
25
50
75
100
125
0.2 M
2 M
MA
O-B
acti
vit
y(%
of
co
ntr
ol)
Figure 27: The effects of RUYAN 0 and RUYAN 6 samples were tested on purified recombinant MAO-A (a)
and MAO-B (b) at concentrations corresponding to 0.2 µM nicotine and 2 µM nicotine for 60 mins.
Neither treatment regimen resulted in any change in enzyme activity for MAO-A or MAO-B. (One-way
ANOVA with Dunnett’s post-test, α = 0.05, n=3 experiments for all conditions).
4.4 – DISCUSSION
4.4.1 – The Effects of Nicotine and TPM on Monoamine Oxidase Enzymes
MAO enzymes were not inhibited by nicotine at concentrations of up to 10 µM. This is
consistent with previously reported findings by Oreland et al.(1981) and Castagnoli et al.
(2002) that nicotine alone does not act on MAO-A or MAO-B.
When purified MAO-A enzyme was treated with TPM extracts, a notable inhibition by
both TPM from standard Holiday® brand cigarettes and denicotinized Quest® brand
cigarettes was observed. MAO-A inhibition with standard cigarettes is consistent with
previously reported evidence that MAO-A is inhibited by exposure to tobacco smoke, but
the present study has confirmed that TPM derived from denicotinized tobacco smoke will
also inhibit MAO-A to the same degree as standard tobacco. This comes as no surprise,
given the evidence from this study that nicotine has no effect on MAO-A enzyme activity;
therefore, the removal of nicotine from tobacco should not alter the inhibitory action of
the TPM. However, Quest® cigarettes are not formulated from tobacco that has had the
nicotine removed, but are made from tobacco strains which have been genetically
modified to not express nicotine. Because it is uncertain what effect these genetic
modifications may have on the composition of the tobacco, it is possible that TPM
- 106 -
derived from these cigarettes may have significantly different MAO-A inhibitory activity
to standard TPM. This was not the case, however, as Quest® TPM was found to inhibit
MAO-A by the same degree as Holiday® TPM (23%, and 24%, respectively), providing
evidence that non-nicotine components of tobacco smoke are the cause of MAOA
inhibition.
While Holiday® and Quest® TPM seemed to modestly reduce the activity of MAO-B
compared to untreated enzyme at the concentrations tested, this difference was not
statistically significant. The concentration-response analysis of MAO-B enzyme treated
with TPM samples indicated that TPM caused inhibition of MAO-B, but the IC50 values for
MAO-B inhibition were higher than those for MAO-A. This means higher concentrations
of TPM were required to inhibit MAO-B than MAO-A, and may be due to lower
concentrations of MAO-B inhibitors in the TPM samples, or less potent inhibition by the
active compounds.
This finding is notable, as several previous studies have reported inhibition of MAO-B by
standard tobacco extracts. Yu & Boulton (1987) prepared a cigarette smoke solution by
bubbling mainstream smoke through a phosphate buffer solution. They found that
cigarette smoke solution significantly inhibited both MAO-A and MAO-B in rat
mitochondrial preparations and rat lung tissue, noting that MAO-A showed greater
inhibition than MAO-B. Using a similar method, Castagnoli et al. (2002) prepared
tobacco smoke solutions by bubbling cigarette smoke through a phosphate buffer or
hexane solution, and found that both solutions significantly inhibited MAO -B prepared
from baboon liver mitochondria. Herraiz and Chaparro (2005) also reported that a
cigarette smoke solution inhibited the enzyme activity of human recombinant MAO-A
and MAO-B enzymes, and also found that MAO-A showed slightly more inhibition than
MAO-B. These results are consistent with those of the present study.
None of the above studies made any attempt to quantify the concentration of the
tobacco smoke solutions. It is likely that the tobacco smoke extracts used in those
studies were much more concentrated than the solution used in the present study,
leading to greater MAO-B inhibition, as the present study diluted the tobacco extract to a
concentration that was physiologically relevant to human smokers. The tobacco smoke
extract used in the present study was prepared from mainstream smoke particulates
collected by filter through a smoking machine, while in each of the above experiments
mainstream cigarette smoke was passed through a buffer solution to collect the tobacco
- 107 -
smoke samples. It is also possible therefore that the collection method used by these
studies may have captured some volatile or gaseous inhibitors of MAO-B that were not
collected by the present method.
Although Holiday® and Quest® TPM extract did not significantly inhibit recombinant
MAO-B enzyme at TPM concentrations containing 0.2 µM nicotine (or equivalent), the
concentration-response analysis demonstrated that these extracts inhibited MAO-B at
higher concentrations. Overall, the results of this study are in agreement with previously
reported experiments (Herraiz & Chaparro, 2005; P. H. Yu & Boulton, 1987) that found
tobacco smoke extract contained MAO-A and -B inhibitors, and was a more potent
inhibitor of MAO-A than MAO-B.
4.4.2 – Comparing Nicotine and Tar Yields Between Different Tobacco Products
Because of the heterogeneous nature of tobacco, quantifying the TPM samples derived
from tobacco samples proved difficult. Very little information was available on the
composition or concentration of the TPM extracts, except for the mass of tar collected on
the filter, the number of cigarettes collected on each filter, and the nicotine
concentration of the TPM extracts, as measured by GC-MS. Because there was variation
in the number of cigarettes per filter, and the manufacturers’ reported nicotine yield per
cigarette, it was difficult to ascertain the most appropriate way to measure TPM
concentration. The nicotine concentration was used because it had been accurately
measured by GC-MS. Tar concentrations for each TPM sample were also calculated from
the measurements of tar mass collected on the filters.
TPM extracts from loose-leaf tobacco cigarettes had significantly higher tar:nicotine
ratios than manufactured cigarettes, indicating loose-leaf tobacco TPMs generally had
lower nicotine concentrations and higher tar concentrations than manufactured cigarette
TPM samples. Thus, when TPM samples were normalized to contain 4 µM nicotine, the
loose-leaf tobacco samples contained a higher proportion of tar than the manufactured
cigarettes. Similarly, when tar concentration was controlled for, TPM samples from
loose-leaf tobacco cigarettes contained proportionally less nicotine than TPM samples
from manufactured cigarettes.
- 108 -
It should be noted that filter ventilation and cigarette paper porosity were not controlled
for when preparing TPM samples for this study. Both of these factors have been found to
be significant in affecting mainstream smoke yields (Stephens, 2007). The porosity and
permeability of the cigarette wrap papers can increase ventilation while puffing, while
chemical additives in the paper manufacturing process can increase cigarette burn rate,
both of which reduce measured nicotine and tar yields. The cellulose acetate filters used
in cigarettes to remove particulates from mainstream smoke, which also reduces nicotine
and tar yields, and ventilated filters reduce these yields even further (Stephens, 2007). It
is not known whether the cigarette wrap papers and filters used to roll the loose-leaf
tobacco cigarettes have similar porosity and ventilation characteristics to those used in
manufactured cigarettes; and it is also not known how similar the manufactured
cigarette brands are to each other with respect to these factors.
When the tar concentration was normalized to 0.01 mg/mL, the mean MAO-A inhibition
induced by different TPM extracts was found to be significantly different (Fig. 24; one-way
ANOVA, P<0.0001). This indicates there are significant differences in the ability of different
TPM extracts to inhibit MAO-A when normalized to 0.01 mg/mL tar. In particular, the Park
Drive tobacco samples (1) and (2) showed greater inhibition of MAO-A (59% and 58%,
respectively) compared to the mean MAO-A inhibition of all samples (48%). The MAO-A
inhibition induced by Holiday regular cigarette samples was also significantly different from
the mean, with sample (1) showing MAO-A inhibition significantly higher than the mean, and
sample (2) showing inhibition significantly lower than the mean. These findings indicate there
are significant qualitative differences in the composition of TPM between different tobacco
products, and in the case of Holiday cigarettes, between different batches of the same
tobacco product.
4.4.3 – Comparing MAO Inhibition Between Different Tobacco Products
A significant amount of variation was observed in the inhibitory potential of different
brands of cigarettes and tobacco products (Fig. 24). This finding indicates that there are
significant qualitative differences in the composition of TPM samples between different
tobacco products, with respect to MAO inhibitors. TPM samples prepared from two
different batches of Holiday brand cigarettes induced significantly greater, and lesser
- 109 -
inihibition of MAO-A when compared to the mean of all samples. This demonstrates that
there are also significant batch-to-batch differences in the MAO inhibitory potential of
some cigarette brands. However, it should be noted that the data presented in Figure 24
are the mean MAO-A inhibition of individual TPM samples tested in triplicate. A more
accurate and robust way to examine tobacco brand differences would be to prepare
multiple independent TPM samples for each brand, however this option was not
available to the present study due to the cost involved in generating the TPM filters.
Significant differences in the inhibition of MAO-A were also observed when comparing
different types of tobacco product. When nicotine concentration was controlled, TPM
samples from loose-leaf tobacco cigarettes showed significantly greater inhibition of
MAO-A than manufactured cigarette TPMs. As discussed above, loose-leaf tobacco
cigarettes were found to have a greater tar:nicotine ratio than manufactured cigarettes.
This suggests that smokers of manufactured cigarettes may receive higher doses of
nicotine than smokers of loose-leaf tobacco roll-your-own (RYO) cigarettes, and/or RYO
smokers may receive higher doses of tar.
Studies on the puffing behavior of users of loose-leaf tobacco cigarettes, or RYO
cigarettes, suggest that RYO smokers are likely to be exposed to higher tar
concentrations. Laugesen et al. (2009) reported that although RYO smokers used less
tobacco in their cigarettes (approx. 500 mg/cigarette) than manufactured cigarettes
(approx. 700 mg/cigarette), they smoked more intensively by puffing more frequently
and for longer periods than manufactured cigarette smokers, resulting in significantly
greater exposure to tobacco smoke than manufactured cigarette smokers. An earlier
study of RYO smokers found that although there was a wide variation in the weight of
tobacco used per cigarette, the mean nicotine and tar yields per cigarette were similar to
those of manufactured cigarettes (Darrall & Figgins, 1998). Furthermore, a number of
studies have shown that when smoking low-nicotine yield cigarettes, smokers will modify
their puffing behavior by taking longer, deeper puffs to compensate for the reduced
nicotine delivery (N. Benowitz et al., 2009; Scherer, 1999).
Taken together, these results suggest that smokers of loose-leaf tobacco smoke their
RYO cigarettes more intensively to obtain similar nicotine yields to those found in
manufactured cigarettes. In the present study, loose-leaf tobacco TPMs had a greater
tar:nicotine ratio than manufactured cigarettes, indicating that when nicotine
concentration is controlled, TPM from loose-leaf tobacco samples has a higher tar
- 110 -
concentration than manufactured cigarettes, and thus a correspondingly higher
concentration of MAO inhibitors. This explains why loose-leaf tobacco TPMs inhibited
MAO-A more effectively than manufactured cigarette TPM samples (Fig. 23). When tar
concentration was controlled for, no significant difference was observed in MAO -A
inhibition between manufactured or loose-leaf tobacco cigarette TPMs (Fig. 25), which
indicates that loose-leaf tobacco TPM caused greater MAO-A inhibition due to greater tar
concentrations, and not due to higher inhibitor concentrations in the tar itself.
Therefore, users of loose-leaf tobacco cigarettes smoke are likely to be exposed to higher
concentrations of tar and monoamine oxidase inhibitors than smokers of standard
cigarettes. Exposure to higher concentrations of carcinogens and other harmful
compounds known to be present in the tar fraction of cigarette smoke is also likely.
Further studies into the smoking behavior of RYO cigarette smokers are warranted to
confirm these findings. This could be tested by measuring levels of a number of
biomarkers, such as cotinine (the major metabolite of nicotine) and 4-
(methylnitrosamino)-1-(3-pyridyl)-1-butanol (NNAL, a carcinogen and metabolite of
tobacco-specific nitrosamine) (N. Benowitz et al., 2009) and by comparing levels of these
compounds between smokers of loose-leaf tobacco and manufactured cigarettes.
Additionally, it would be interesting to compare platelet MAO-B inhibition in loose-leaf
tobacco smokers to manufactured cigarette smokers. To date, there has been little
research into RYO cigarette smokers, but they represent a growing proportion of the
smoking population in New Zealand (Laugesen et al., 2009).
4.4.4 – The RUYAN® Electronic Cigarette Does Not Inhibit MAO
The cartridge fluid from the RUYAN E-cigarette was found to have no effect on the
activity of either MAO-A or MAO-B. This is consistent with the cartridge fluid not being a
tobacco-derived product. The RUYAN ingredients list contained a number of unspecified
plant extracts (see Appendix 9.3) including vanilla extract, sweet fennel oil, geranium oil,
and Kentucky tobacco extract. The composition of these plant extracts is unknown, and it
is possible some may contain compounds that can inhibit MAO, particularly the tobacco
extract. Since no MAO inhibition was measured, if there are inhibitors present in the
cartridge formulation they are at sub-threshold concentrations.
- 111 -
The present study tested the cartridge fluid of RUYAN E-cigarettes at concentrations
corresponding to 0.2 µM and 2 µM nicotine. These concentrations were chosen because
they represent the approximate physiological concentration of nicotine in the
bloodstream of a smoker (0.2 µM), and a ten-fold higher concentration (2 µM); however,
it is not known whether these nicotine concentrations are relevant to people using the
RUYAN E-cigarette. Because there is a paucity of published data on the E-cigarette, it is
not known whether the E-cigarette shares the same pharmacokinetic profile as tobacco
cigarettes; however, Bullen et al. (2010) found the pharmacokinetic profile of the RUYAN
E-cigarette to be more similar to a nicotine inhalator than a tobacco cigarette. Their
study reported that the bloodstream nicotine concentrations achieved by users of the E-
cigarette are considerably lower than those of regular cigarette smokers. A safety report
on the RUYAN E-cigarette suggested that the device may deliver only a tenth of the
nicotine that tobacco cigarettes do (Laugesen, 2008); however, an evaluation by the US
Food & Drug Administration found large variations in the amount of nicotine delivered by
E-cigarettes (Westenberger, 2009).
The E-cigarette is not considered a legitimate smoking cessation device by the World
Health Organization (WHO). Because there have been no reported rigorous, peer -
reviewed studies demonstrating that the E-cigarette is a safe and effective form of
nicotine replacement therapy, WHO has stated that clinical studies and toxicity analyses
are required before the organization can consider the device a smoking cessation aid
(WHO, 2008). It is beyond the scope of this study to comment on the safety of the E-
cigarette, or its efficacy as a smoking cessation aid, but the present study found that the
RUYAN E-cigarette cartridge fluid had no effect on the activity of MAO-A or MAO-B
enzymes at the concentrations tested.
- 112 -
Chapter Five: MAO inhibition in cultured cells exposed to tobacco extracts
5.1.1 – SH-SY5Y Neuroblastoma as a Model of Human Neuronal Function
The SH-SY5Y human neuroblastoma cell line has widely been used as an effective model of in
vitro neuronal cell functioning and physiology. These cells display many of the same
biochemical properties as human dopaminergic neurons in vivo, including the expression of
functional muscarinic receptors, neuronal nAChRs, and µ and δ opioid receptors (2001;
Vaughan et al., 1995). Since SH-SY5Y is an immortalized cell line, they are relatively easy to
culture and care for, and cultures will continuously proliferate to provide large numbers of
cells for different experiments (Constantinescu et al., 2007). This cell line has been used
widely to provide biochemical insights into diverse neurobiological functions at a cellular level
including mechanisms of addiction, neurotoxicity and apoptosis, and the etiology of
neurodegenerative disorders like Alzheimer’s and Parkinson’s diseases.
Because SH-SY5Y cells are known to express catecholamine neurotransmitters (Pahlman et al.,
1995; Vaughan et al., 1995), neuronal nAChRs (Ambrose et al., 2007; Lukas et al., 1993), and
display MAO-A and MAO-B activity (Ekblom et al., 1996), they have been a popular in vitro
model with which to study the effects of nicotine and tobacco on human neurons. A number
of studies have already examined the response of SH-SY5Y cells to nicotine and tobacco
extracts. Peng et al. (1997) demonstrated that chronic exposure to nicotine induced a
significant up-regulation of nAChR subtypes, while Vaughan et al. (1993) demonstrated that
nAChR agonists cause membrane depolarization and noradrenaline release in SH-SY5Y.
Sokolova et al. (2005) used voltage clamp experiments to examine the desensitization of
nAChR in SH-SY5Y cells due to nicotine. They reported that the nAChR on SH-SY5Y were
readily desensitized by nicotine, but retained a small degree of electrophysiological
responsiveness even to chronically administered nicotine concentrations. In our laboratory,
Ambrose et al. (2007) measured the up-regulation of nAChR in SH-SY5Y cells in response to
treatment with tobacco particulate matter (TPM) samples or nicotine alone. They reported a
- 113 -
significant up-regulation of nAChRs in cells treated with both nicotine and TPM, but
importantly, TPM was found to induce a greater up-regulation of these receptors than
nicotine alone. This demonstrates that non-nicotine components of tobacco smoke are
important up-regulators of nAChRs, and may influence tobacco dependence. A series of
experiments by Dunckley & Lukas (2003, 2006) investigated changes in gene expression in SH-
SY5Y cells using micro-array and qRT-PCR technology. They reported changes in the
expression of 17 different genes with diverse cellular functions in SH-SY5Y cells after 1 hour
exposure to nicotine and another 84 different genes after 24 hours exposure to nicotine.
Their study confirmed that these changes in gene expression were dependent on the
activation of nAChRs, demonstrating that nicotine alters the expression of a diverse range of
genes through binding to nAChRs.
While a number of investigators have used SH-SY5Y to examine cellular changes due to
nicotine or tobacco exposure, no studies have yet investigated the effects of tobacco smoke
compounds on the MAO activity of SH-SY5Y cells. To date, studies of these enzymes in SH-
SY5Y have largely focused on their role in the neuroprotective properties of clinical MAO
inhibitors as treatments for Parkinson’s and Alzheimer’s diseases. However, using
concentrations of ethanol relevant to human alcoholism, Ekblom et al. (1996) measured
changes in MAO-A and MAO-B gene expression and enzyme activity in SH-SY5Y
neuroblastoma and 1242 MG glioma cells. They reported a greater than 150% increase in
MAO-B gene expression in 1242 MG glioma, and a more than 80% increase in MAO-B
expression in SH-SY5Y treated for 24 hours with 100 mM ethanol. However, MAO-B enzyme
activity was not altered by ethanol exposure in SH-SY5Y, and increased only slightly in 1242
MG cells. Neither gene expression nor enzyme activity of MAO-A was affected by ethanol
exposure in 1242 MG or SH-SY5Y cells.
Because SH-SY5Y has been widely used to study the effects of nicotine on nAChRs,
acetylcholine release, and gene expression, and has been demonstrated to express MAO
enzymes, this cell line was chosen as in vitro model to examine the effects of tobacco smoke
extracts on monoamine oxidase enzyme activity.
- 114 -
5.1.2 – Glial Cells and Tobacco Addiction
Glial cells and astrocytes play significant roles in a number of vital processes in the central
nervous system, including synaptogenesis, regulation of neuronal function, and
neuroplasticity (Lawrence et al., 2007). They assist in the regulation of neurotransmission and
the metabolism of neurotransmitters, and are regarded as integral modulators of synaptic
function (Sharma & Vijayaraghavan, 2002).
There is growing evidence that astrocytes integrate neuronal activity in the central nervous
system by detecting activity at the synapse, and propagating signaling to other neurons to
modulate activity at remote synapses (for a review see Vijayaraghavan (2009)). Therefore,
given the intimate role that glia and astrocytes play in mediating neuronal and synaptic
activity, it is possible that changes in neuronal function due to the actions of drugs of abuse
may also affect glial and astrocytic functioning, and vice versa.
Glial cells express a number of neurotransmitter transporters including the dopamine
transporter (DAT) (Meng et al., 1999), serotonin transporter (SERT) (Inazu et al., 2001),
norepinephrine transporter (NET) (Takeda et al., 2002), and the extra-neuronal monoamine
transporter (EMT) (Inazu et al., 2003), as well as GABA and glutamate transporters (Schousboe
et al., 2004). Studies have also shown that glia express high levels of monoamine oxidase
activity in the brain (Levitt et al., 1982; Westlund et al., 1988) where they are believed to play
a critical role in regulating synaptic neurotransmitter concentrations. Interestingly, glial cells
also express a number of important receptor proteins, including the cannabinoid receptor CB-
1 (Stella, 2004), functional µ and δ opioid receptors (Watkins et al., 2005), and the nAChRs
(Ono et al., 2008; Sharma & Vijayaraghavan, 2002). Recent studies have suggested that glial
functioning may be altered by exposure to drugs of abuse, which may subsequently lead to
changes in neuronal function (Lawrence et al., 2007; Vijayaraghavan, 2009). At present, little
is known about the effects of drug abuse on glial cells and glial-neuronal signalling, or what
role these cells might play in the establishment or maintenance of addiction, but this is a
rapidly emerging area of research (Vijayaraghavan, 2009).
Several studies have already examined the effects of nicotine and tobacco on glial function.
For example, Knackstedt et al. (2009) reported that the glial glutamate transporter protein
GLT-1 was down-regulated in the nucleus accumbens of rats self-administering nicotine. They
reported that GLT-1 is also down-regulated in the nucleus accumbens after cocaine
administration, and speculated that this protein may be relevant to the development and
- 115 -
maintenance of drug dependence. Teaktong et al. (2003) reported a significant down-
regulation in the abundance of astrocytic α7 nAChRs in the brains of human smokers and ex-
smokers, compared to non-smokers. Another study by Mazzio et al. (2005) examined the
effects of cigarette smoke condensates (CSC) on the activity of MAO and inducible nitric oxide
synthase (iNOS) in rat C6 glioma cells to investigate the mechanisms responsible for tobacco’s
neuroprotective action against Parkinson’s disease. They found that condensates from
standard tobacco Marlboro cigarettes and 2R4F Kentucky reference cigarettes both
significantly inhibited iNOS activity and total MAO activity. Both CSCs induced a mixed type
inhibition of total MAO in glial cells, although the study noted that concentrations of CSCs that
inhibited MAO in C6 glioma cells were toxic to N2A neuroblastoma. The viability of C6 cells
exposed to these concentrations was not tested.
Thus, evidence reported to date suggests that glial cell function is altered by exposure to
nicotine and tobacco smoke, and this effect may play a role in tobacco dependence.
However, much more research into the effects of tobacco smoke on glial function and glial-
neuronal interactions is required to fully elucidate what role these cells might play in addiction
mechanisms.
5.1.3 – Objectives
The aim of the experiments in this chapter was to determine if tobacco extracts inhibit the
activity of MAO enzymes in cultured neuronal and glial cells to the same degree as seen with
isolated human recombinant enzymes (Chapter Four).
Cultured SH-SY5Y human neuroblastoma cells and U-118 MG human glioma cells were
exposed to tobacco extracts derived from Holiday® brand cigarettes (HTPM) and Quest®
denicotinized cigarettes (QTPM), as well as to nicotine alone. Holiday® brand cigarettes were
chosen as representative of standard tobacco cigarettes available in New Zealand, as they
were the highest volume selling cigarette in New Zealand at the commencement of the study
(Fowles, 2003). Quest® cigarettes were chosen to investigate whether there was any
difference in the MAO inhibition induced in cultured cells by denicotinized cigarettes
compared to standard tobacco cigarettes.
- 116 -
The SH-SY5Y cell line was chosen for this study to allow direct comparisons to be made with
previously published experiments examining the response of SH-SY5Y to nicotine and tobacco
extracts. The U-118 MG cell line was selected as the in vitro model of human glial cell function
because it could be cultured under the same conditions as the SH-SY5Y cell line. Its glial origin
is evidenced by its expression of glial fibrillary acidic protein (GFAP) (Feindt et al., 1995) – a
glial and astrocytic cell marker.
SH-SY5Y cells and U-118 MG cells were exposed to tobacco extracts for up to five days to
determine if total MAO activity was sensitive to acute and prolonged exposure to tobacco
compounds. Based on the results reported in Chapter 4, it was expected that exposure to
HTPM and QTPM would inhibit total MAO activity in both of these cells lines.
5.2 - MATERIALS AND METHODS
5.2.1 – Exposure to Tobacco Particulate Matter
The kynuramine assay, as described in Chapter 3 of this thesis, was used to measure total
MAO enzyme activity in SH-SY5Y neuroblastoma cells and U-118 MG glioma cells following
exposure to tobacco compounds. Cells were grown and cultured according to the methods
described in section 2.1.
5.2.1.1 – Total MAO Activity in SH-SY5Y Cells
Total MAO activity was measured in SH-SY5Y neuroblastoma cells treated with ethanol,
nicotine, TPM from Holiday® brand cigarettes (HTPM), and TPM from Quest® denicotinized
cigarettes (QTPM) for 1, 3, and 5 days continuously. SH-SY5Y cells were cultured in 600 mL
culture flasks, and cells were allowed to adhere to the flask surface for at least a day before
being treated. For each experiment, cells received nicotine or HTPM to a final concentration
of 0.2 µM nicotine, and equivalent volumes of ethanol or QTPM (9.8 µL per 30 mL media;
0.03% final concentration ethanol) were administered. Untreated SH-SY5Y cells served as a
control. Extracts were added directly to the cell culture medium, and the cells were
- 117 -
maintained in this medium for 1, 3, or 5 days without changing the medium (continuous
treatment regimen; cont.). At the completion of the exposure regimen, the cells were
harvested and lysates prepared according to the methods described in section 2.3.1 of this
thesis.
Flasks of cells treated with a) ethanol, b) nicotine, C) HTPM and d) QTPMs were exposed for 1
day, 3 days, and 5 days without disruption before harvesting. Additionally, cells were also
prepared for another treatment regimen (refreshed treatment regimen; ref.) which
attempted to maintain more constant concentrations of test compounds in culture. Cultured
cells received ethanol, nicotine, HTPM, and QTPM at the concentrations previously described
and were incubated for 3 days continuously, at which time the medium in the flasks was
removed by aspiration and replaced with fresh culture medium supplemented with new
aliquots of ethanol, nicotine, HTPM, or QTPM. The cultures were then returned to the
incubator for a further 2 days before being harvested and lysed.
5.2.1.2 – Total MAO Activity in U-118 MG Cells
Total MAO activity was also measured in U-118 MG glioma cells treated with ethanol,
nicotine, HTPM, and QTPM for 5 days continuously. The U-118 cells were cultured according
to the protocol described in section 2.1. Flasks of cells treated with a) ethanol, b) nicotine, c)
HTPM, and d) QTPM were prepared, and incubated for 5 days continuously, without
disruption (continuous treatment regimen). Nicotine and HTPM were added to a final
concentration of 0.2 µM nicotine, and ethanol and QTPM were added at equivalent volumes
as described above. At the completion of the treatment period the cells were harvested and
lysed as described in section 2.3.1.
5.2.2 – Kynuramine MAO Activity Assay
5.2.2.1 – Kynuramine Microcentrifuge Tube Assay
The kynuramine MAO activity assay was used to measure the total MAO enzyme activity in
lysates prepared from SH-SY5Y and U-118 MG cells exposed to tobacco compounds using the
microcentrifuge tube protocol described in section 2.4.2.1. Briefly, cell lysates were

- 118 -
quantified with respect to total protein concentration using a BCA protein assay kit (Pierce.
Rockford, IL, USA.) and diluted to working concentrations with sodium phosphate buffer (50
mM sodium phosphate, 150 mM sodium chloride, pH 7.4). Cell lysates were added to 1.5 mL
plastic microcentrifuge tubes in 100 µL aliquots, and 870 µL of sodium phosphate buffer was
added. The microcentrifuge tubes were then incubated in a 37°C water bath for 5 mins to
equilibrate the reaction temperatures. The assay reaction was started with the addition of a
30 µL aliquot of kynuramine hydrobromide (Sigma-Aldrich, Inc.), diluted to a working
concentration of 3.07 mM unless otherwise stated. Reaction tubes were returned to the
water bath and incubated at 37°C for 30 mins. The reaction was terminated by addition of
300 µL of 0.4 M perchloric acid (Sigma-Aldrich, Inc.) to each tube, and the tubes were then
centrifuged at 13,000 x g for 30 sec at 4°C to pellet any precipitated proteins.
Each reaction solution was aliquoted (100 µL) into the wells of a black polystyrene 96-well
microwell plate (Greiner Bio-one) in triplicate. The 4-hydroxyquinoline (4-HQ) reference
standard was diluted over the range 0 – 5000 nM, and 100 µL aliquots of each standard were
added in triplicate to different wells of the microwell plate to construct a standard curve.
NaOH (200 µL of a 1 M solution) was added to each well to induce fluorescence of the 4-HQ
product, and the fluorescence was measured immediately at 318 nm excitation and 380 nm
emission wavelengths with a SpectraMax Gemini spectrophotometer. A standard curve was
plotted from the 4-HQ reference standard fluorescence data, and this was used to quantitate
the concentration of product formed for each sample.
5.2.2.2 – Lineweaver-Burk Analysis
SH-SY5Y cell lysates from cells treated with tobacco compounds for 3 or 5 days were used to
measure total MAO activity in response to varied kynuramine concentrations. The data from
these experiments was used to derive a Lineweaver-Burk plot to examine the nature of MAO
inhibition induced by the TPM samples. Two samples each of cells treated with a) ethanol, b)
nicotine, c) HTPM, and d) QTPM for three days, and two samples each of cells treated for five
days continuously were used. Each sample was assayed in triplicate using kynuramine
concentrations of 0.25 µM, 0.75 µM, 3.07 µM, and 7.50 µM.
Double reciprocal data were derived, and GraphPad Prism v5.0 (Graphpad software, Inc. San
Diego, CA, USA) was used to plot Lineweaver-Burk plots for SH-SY5Y cells treated with tobacco
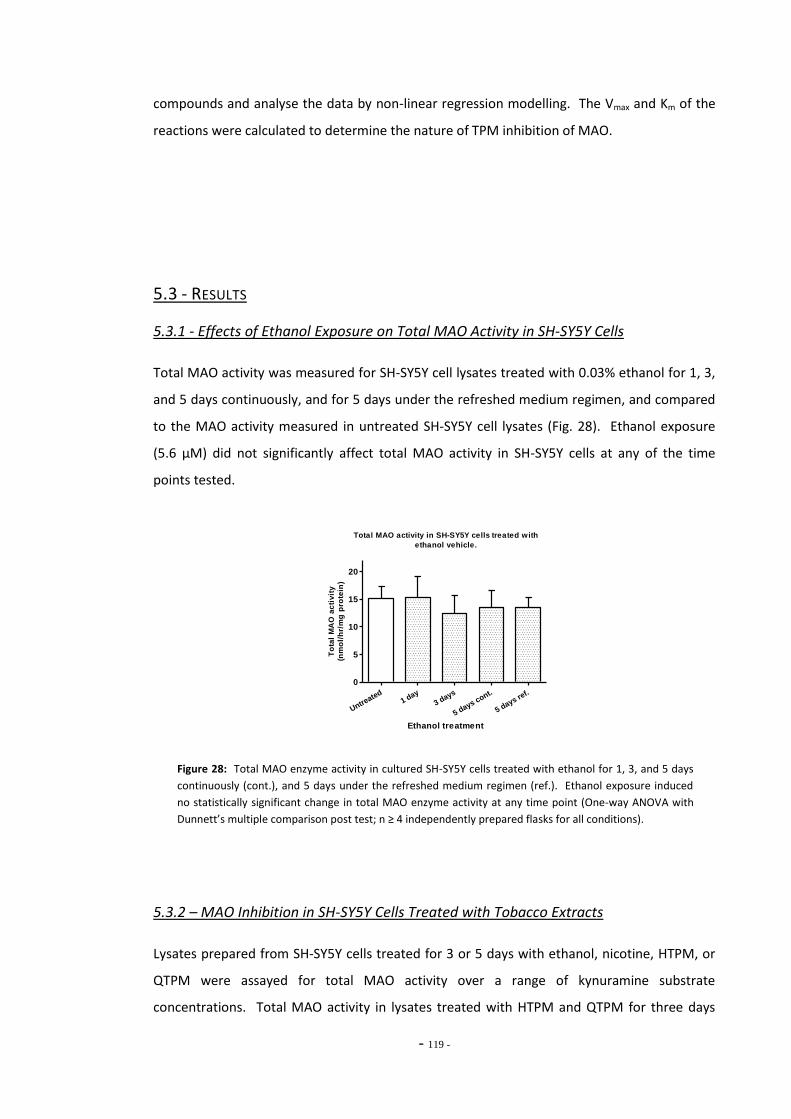
- 119 -
compounds and analyse the data by non-linear regression modelling. The Vmax and Km of the
reactions were calculated to determine the nature of TPM inhibition of MAO.
5.3 - RESULTS
5.3.1 - Effects of Ethanol Exposure on Total MAO Activity in SH-SY5Y Cells
Total MAO activity was measured for SH-SY5Y cell lysates treated with 0.03% ethanol for 1, 3,
and 5 days continuously, and for 5 days under the refreshed medium regimen, and compared
to the MAO activity measured in untreated SH-SY5Y cell lysates (Fig. 28). Ethanol exposure
(5.6 µM) did not significantly affect total MAO activity in SH-SY5Y cells at any of the time
points tested.
Total MAO activity in SH-SY5Y cells treated with
ethanol vehicle.
Untreated
1 day
3 days
5 days cont.
5 days ref.
0
5
10
15
20
Ethanol treatment
To
tal
MA
O a
cti
vit
y
(nm
ol/
hr/
mg
pro
tein
)
Figure 28: Total MAO enzyme activity in cultured SH-SY5Y cells treated with ethanol for 1, 3, and 5 days
continuously (cont.), and 5 days under the refreshed medium regimen (ref.). Ethanol exposure induced
no statistically significant change in total MAO enzyme activity at any time point (One-way ANOVA with
Dunnett’s multiple comparison post test; n ≥ 4 independently prepared flasks for all conditions).
5.3.2 – MAO Inhibition in SH-SY5Y Cells Treated with Tobacco Extracts
Lysates prepared from SH-SY5Y cells treated for 3 or 5 days with ethanol, nicotine, HTPM, or
QTPM were assayed for total MAO activity over a range of kynuramine substrate
concentrations. Total MAO activity in lysates treated with HTPM and QTPM for three days
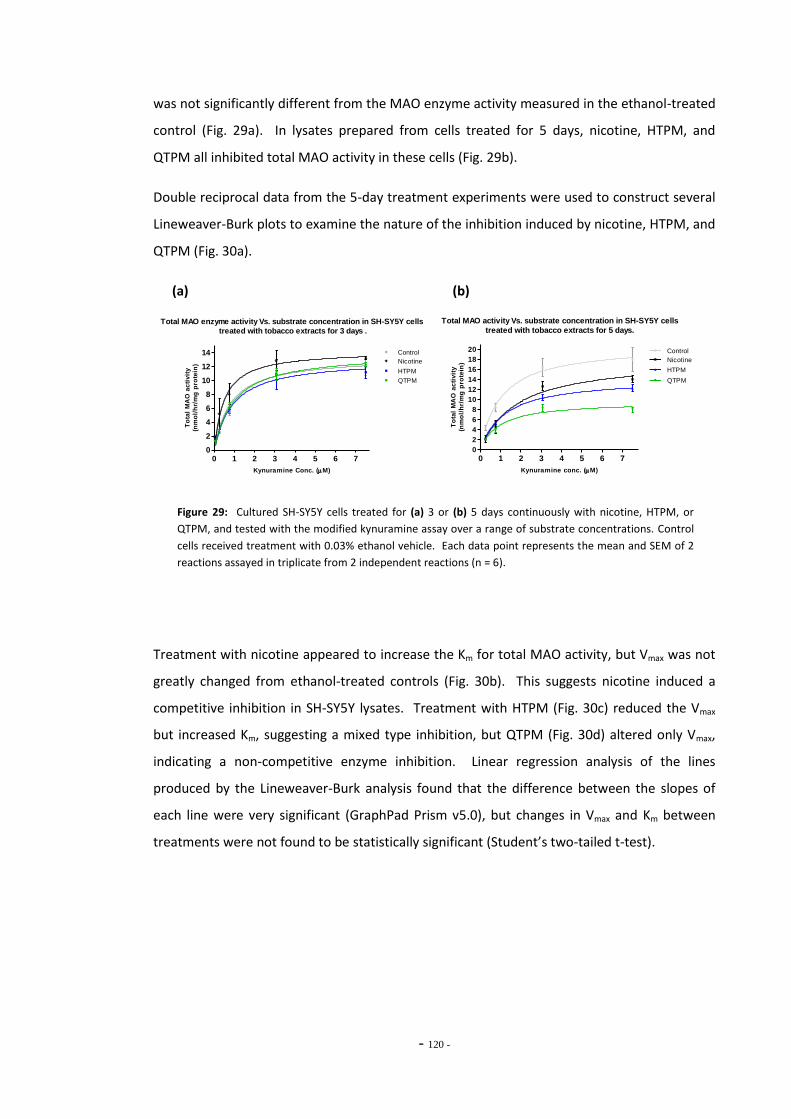
- 120 -
was not significantly different from the MAO enzyme activity measured in the ethanol-treated
control (Fig. 29a). In lysates prepared from cells treated for 5 days, nicotine, HTPM, and
QTPM all inhibited total MAO activity in these cells (Fig. 29b).
Double reciprocal data from the 5-day treatment experiments were used to construct several
Lineweaver-Burk plots to examine the nature of the inhibition induced by nicotine, HTPM, and
QTPM (Fig. 30a).
(a) (b)
Total MAO enzyme activity Vs. substrate concentration in SH-SY5Y cells
treated with tobacco extracts for 3 days .
0 1 2 3 4 5 6 70
2
4
6
8
10
12
14 Control
HTPM
QTPM
Nicotine
Kynuramine Conc. (M)
To
tal
MA
O a
cti
vit
y
(nm
ol/
hr/
mg
pro
tein
)
Total MAO activity Vs. substrate concentration in SH-SY5Y cells
treated with tobacco extracts for 5 days.
0 1 2 3 4 5 6 70
2
4
6
8
10
12
14
16
18
20 Control
HTPM
Nicotine
QTPM
Kynuramine conc. (M)
To
tal
MA
O a
cti
vit
y
(nm
ol/
hr/
mg
pro
tein
)
Figure 29: Cultured SH-SY5Y cells treated for (a) 3 or (b) 5 days continuously with nicotine, HTPM, or
QTPM, and tested with the modified kynuramine assay over a range of substrate concentrations. Control
cells received treatment with 0.03% ethanol vehicle. Each data point represents the mean and SEM of 2
reactions assayed in triplicate from 2 independent reactions (n = 6).
Treatment with nicotine appeared to increase the Km for total MAO activity, but Vmax was not
greatly changed from ethanol-treated controls (Fig. 30b). This suggests nicotine induced a
competitive inhibition in SH-SY5Y lysates. Treatment with HTPM (Fig. 30c) reduced the Vmax
but increased Km, suggesting a mixed type inhibition, but QTPM (Fig. 30d) altered only Vmax,
indicating a non-competitive enzyme inhibition. Linear regression analysis of the lines
produced by the Lineweaver-Burk analysis found that the difference between the slopes of
each line were very significant (GraphPad Prism v5.0), but changes in Vmax and Km between
treatments were not found to be statistically significant (Student’s two-tailed t-test).

- 121 -
(a)
Lineweaver-Burk plot of Total MAO activity in SH-SY5Y cellstreated with tobacco extracts for 5 days.
-1 0 1 2 3 4
0.1
0.2
0.3
0.4
0.5 Control
Nicotine
HTPM
QTPM
1/[kynuramine] (M)1
/en
zy
me
ac
tiv
ity
(nm
ol/
hr/
mg
pro
t.)
(b) (c)
Lineweaver-Burk plot of total MAO activity in SH-SY5Y cellstreated with nicotine for 5 days.
-1 0 1 2 3 4
0.1
0.2
0.3
0.4
0.5 Control
Nicotine
1/[kynuramine] (M)
1/e
nzy
me
ac
tiv
ity
(nm
ol/
hr/
mg
pro
t.)
Lineweaver-Burk plot of total MAO activity in SH-SY5Y cellstreated with HTPM for 5 days.
-1 0 1 2 3 4
0.1
0.2
0.3
0.4
0.5 Control
HTPM
1/[kynuramine] (M)
1/e
nzy
me
ac
tiv
ity
(nm
ol/
hr/
mg
pro
t.)
(d)
Lineweaver-Burk plot of total MAO activity in SH-SY5Y cellstreated with QTPM for 5 days.
-1 0 1 2 3 4
0.1
0.2
0.3
0.4
0.5 Control
QTPM
1/[kynuramine] (M)
1/e
nzy
me
ac
tiv
ity
(nm
ol/
hr/
mg
pro
t.)
Figure 30: (a) Lineweaver-Burk plot for the data presented in Figure 29b. (b) Five days of nicotine
treatment resulted in competitive inhibition of total MAO, while exposure to HTPM induced a mixed type
inhibition (c), and exposure to QTPM non-competitively inhibited total MAO in SH-SY5Y cells (d). Control
cells received treatment with 0.03% ethanol vehicle. Each data point represents the mean and SEM of 2
reactions assayed in triplicate in 2 independent experiments (n = 6).
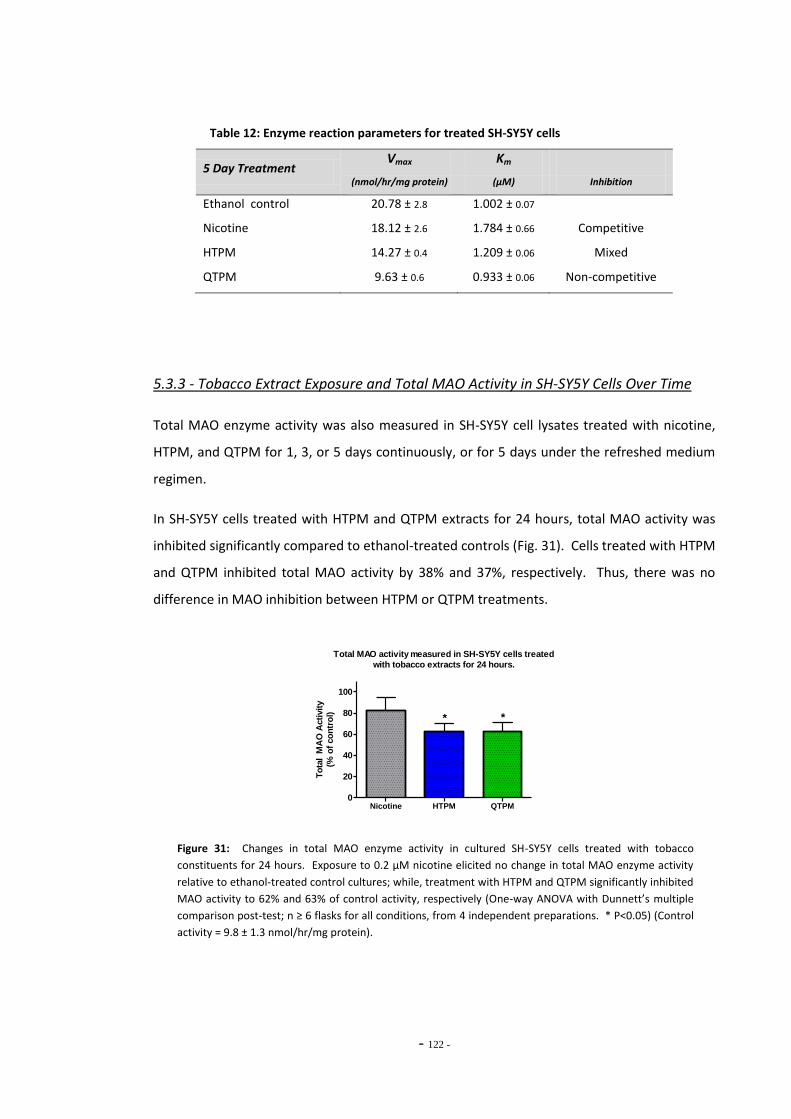
- 122 -
Table 12: Enzyme reaction parameters for treated SH-SY5Y cells
5 Day Treatment Vmax Km
(nmol/hr/mg protein) (µM) Inhibition
Ethanol control 20.78 ± 2.8 1.002 ± 0.07
Nicotine 18.12 ± 2.6 1.784 ± 0.66 Competitive
HTPM 14.27 ± 0.4 1.209 ± 0.06 Mixed
QTPM 9.63 ± 0.6 0.933 ± 0.06 Non-competitive
5.3.3 - Tobacco Extract Exposure and Total MAO Activity in SH-SY5Y Cells Over Time
Total MAO enzyme activity was also measured in SH-SY5Y cell lysates treated with nicotine,
HTPM, and QTPM for 1, 3, or 5 days continuously, or for 5 days under the refreshed medium
regimen.
In SH-SY5Y cells treated with HTPM and QTPM extracts for 24 hours, total MAO activity was
inhibited significantly compared to ethanol-treated controls (Fig. 31). Cells treated with HTPM
and QTPM inhibited total MAO activity by 38% and 37%, respectively. Thus, there was no
difference in MAO inhibition between HTPM or QTPM treatments.
Total MAO activity measured in SH-SY5Y cells treated
with tobacco extracts for 24 hours.
Nicotine HTPM QTPM0
20
40
60
80
100
* *
To
tal M
AO
Acti
vit
y
(% o
f co
ntr
ol)
Figure 31: Changes in total MAO enzyme activity in cultured SH-SY5Y cells treated with tobacco
constituents for 24 hours. Exposure to 0.2 μM nicotine elicited no change in total MAO enzyme activity
relative to ethanol-treated control cultures; while, treatment with HTPM and QTPM significantly inhibited
MAO activity to 62% and 63% of control activity, respectively (One-way ANOVA with Dunnett’s multiple
comparison post-test; n ≥ 6 flasks for all conditions, from 4 independent preparations. * P<0.05) (Control
activity = 9.8 ± 1.3 nmol/hr/mg protein).
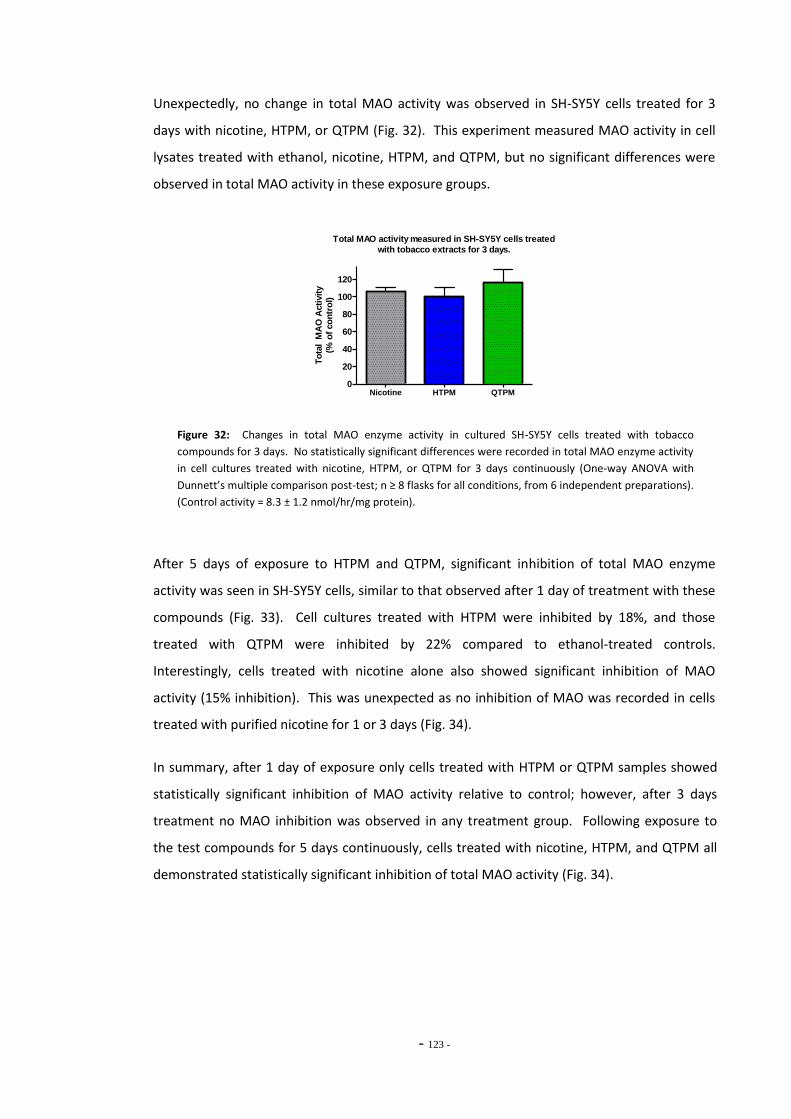
- 123 -
Unexpectedly, no change in total MAO activity was observed in SH-SY5Y cells treated for 3
days with nicotine, HTPM, or QTPM (Fig. 32). This experiment measured MAO activity in cell
lysates treated with ethanol, nicotine, HTPM, and QTPM, but no significant differences were
observed in total MAO activity in these exposure groups.
Total MAO activity measured in SH-SY5Y cells treated
with tobacco extracts for 3 days.
Nicotine HTPM QTPM0
20
40
60
80
100
120
To
tal M
AO
Acti
vit
y
(% o
f co
ntr
ol)
Figure 32: Changes in total MAO enzyme activity in cultured SH-SY5Y cells treated with tobacco
compounds for 3 days. No statistically significant differences were recorded in total MAO enzyme activity
in cell cultures treated with nicotine, HTPM, or QTPM for 3 days continuously (One-way ANOVA with
Dunnett’s multiple comparison post-test; n ≥ 8 flasks for all conditions, from 6 independent preparations).
(Control activity = 8.3 ± 1.2 nmol/hr/mg protein).
After 5 days of exposure to HTPM and QTPM, significant inhibition of total MAO enzyme
activity was seen in SH-SY5Y cells, similar to that observed after 1 day of treatment with these
compounds (Fig. 33). Cell cultures treated with HTPM were inhibited by 18%, and those
treated with QTPM were inhibited by 22% compared to ethanol-treated controls.
Interestingly, cells treated with nicotine alone also showed significant inhibition of MAO
activity (15% inhibition). This was unexpected as no inhibition of MAO was recorded in cells
treated with purified nicotine for 1 or 3 days (Fig. 34).
In summary, after 1 day of exposure only cells treated with HTPM or QTPM samples showed
statistically significant inhibition of MAO activity relative to control; however, after 3 days
treatment no MAO inhibition was observed in any treatment group. Following exposure to
the test compounds for 5 days continuously, cells treated with nicotine, HTPM, and QTPM all
demonstrated statistically significant inhibition of total MAO activity (Fig. 34).
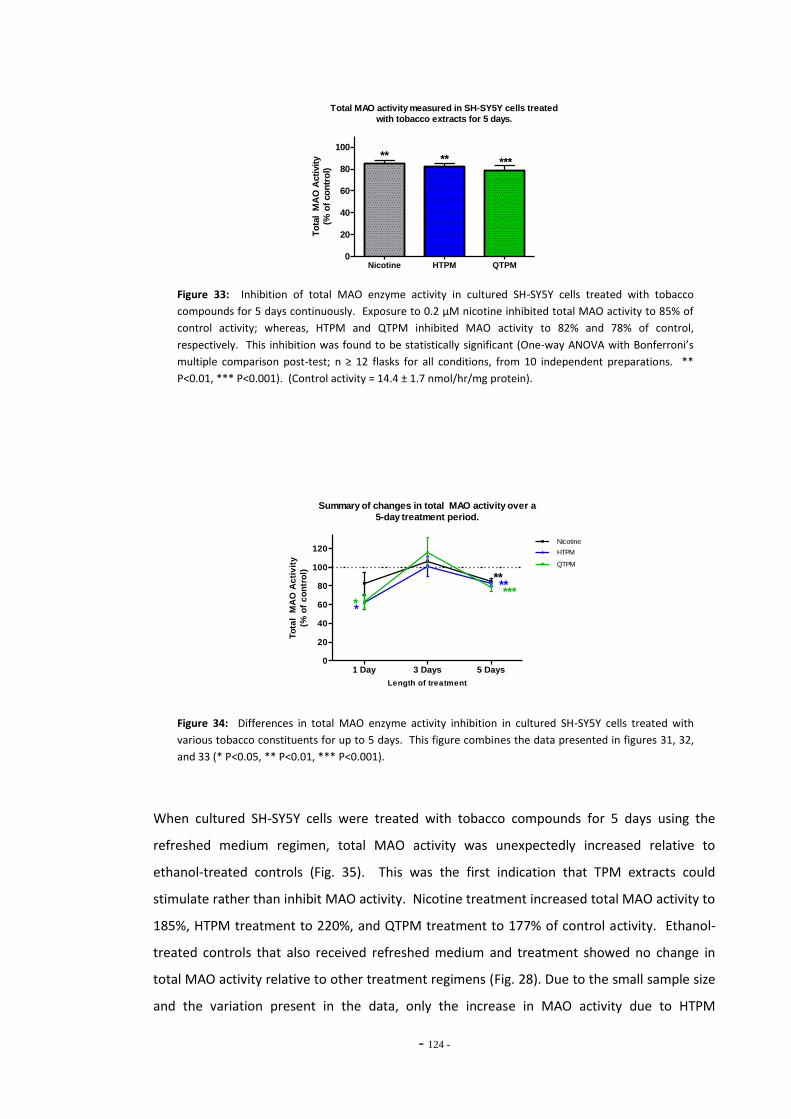
- 124 -
Total MAO activity measured in SH-SY5Y cells treated
with tobacco extracts for 5 days.
Nicotine HTPM QTPM0
20
40
60
80
100** ** ***
To
tal M
AO
Acti
vit
y
(% o
f co
ntr
ol)
Figure 33: Inhibition of total MAO enzyme activity in cultured SH-SY5Y cells treated with tobacco
compounds for 5 days continuously. Exposure to 0.2 μM nicotine inhibited total MAO activity to 85% of
control activity; whereas, HTPM and QTPM inhibited MAO activity to 82% and 78% of control,
respectively. This inhibition was found to be statistically significant (One-way ANOVA with Bonferroni’s
multiple comparison post-test; n ≥ 12 flasks for all conditions, from 10 independent preparations. **
P<0.01, *** P<0.001). (Control activity = 14.4 ± 1.7 nmol/hr/mg protein).
Summary of changes in total MAO activity over a
5-day treatment period.
1 Day 3 Days 5 Days0
20
40
60
80
100
120Nicotine
HTPM
QTPM
**
*****
**
Length of treatment
To
tal
MA
O A
cti
vit
y
(% o
f c
on
tro
l)
Figure 34: Differences in total MAO enzyme activity inhibition in cultured SH-SY5Y cells treated with
various tobacco constituents for up to 5 days. This figure combines the data presented in figures 31, 32,
and 33 (* P<0.05, ** P<0.01, *** P<0.001).
When cultured SH-SY5Y cells were treated with tobacco compounds for 5 days using the
refreshed medium regimen, total MAO activity was unexpectedly increased relative to
ethanol-treated controls (Fig. 35). This was the first indication that TPM extracts could
stimulate rather than inhibit MAO activity. Nicotine treatment increased total MAO activity to
185%, HTPM treatment to 220%, and QTPM treatment to 177% of control activity. Ethanol-
treated controls that also received refreshed medium and treatment showed no change in
total MAO activity relative to other treatment regimens (Fig. 28). Due to the small sample size
and the variation present in the data, only the increase in MAO activity due to HTPM
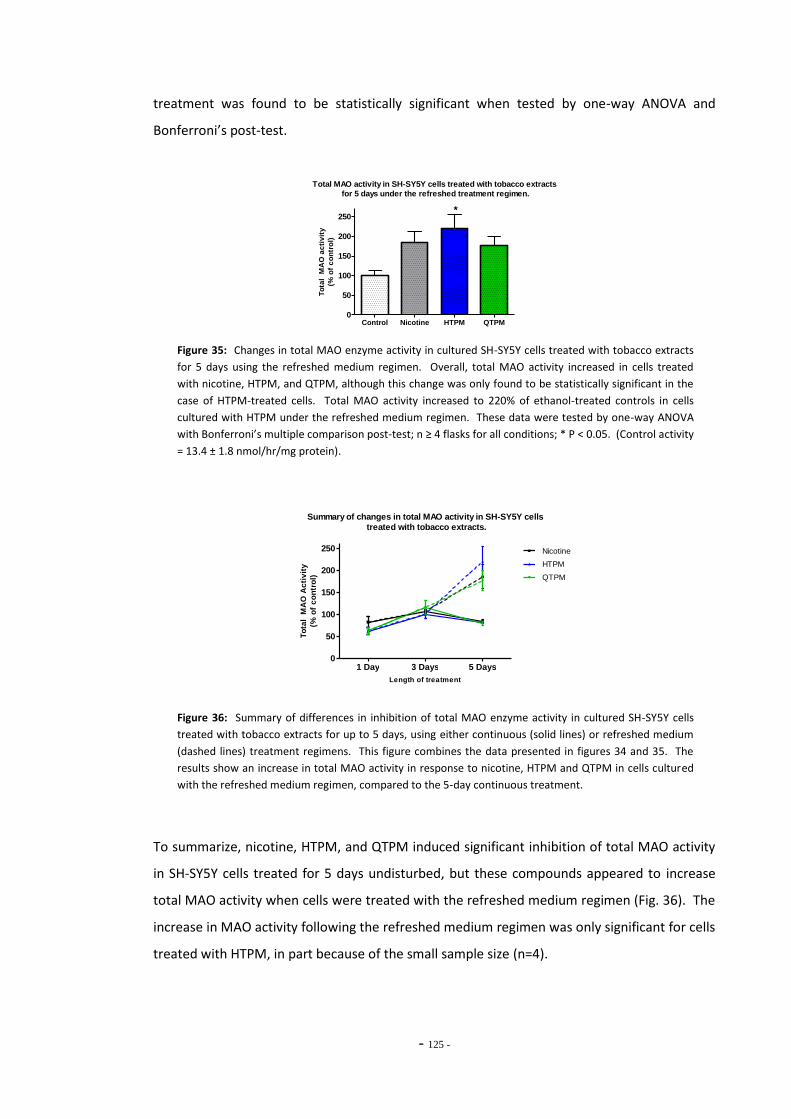
- 125 -
treatment was found to be statistically significant when tested by one-way ANOVA and
Bonferroni’s post-test.
Total MAO activity in SH-SY5Y cells treated with tobacco extracts
for 5 days under the refreshed treatment regimen.
Control Nicotine HTPM QTPM0
50
100
150
200
250*
To
tal
MA
O a
cti
vit
y
(% o
f c
on
tro
l)
Figure 35: Changes in total MAO enzyme activity in cultured SH-SY5Y cells treated with tobacco extracts
for 5 days using the refreshed medium regimen. Overall, total MAO activity increased in cells treated
with nicotine, HTPM, and QTPM, although this change was only found to be statistically significant in the
case of HTPM-treated cells. Total MAO activity increased to 220% of ethanol-treated controls in cells
cultured with HTPM under the refreshed medium regimen. These data were tested by one-way ANOVA
with Bonferroni’s multiple comparison post-test; n ≥ 4 flasks for all conditions; * P < 0.05. (Control activity
= 13.4 ± 1.8 nmol/hr/mg protein).
Summary of changes in total MAO activity in SH-SY5Y cells
treated with tobacco extracts.
1 Day 3 Days 5 Days0
50
100
150
200
250 Nicotine
HTPM
QTPM
Length of treatment
To
tal
MA
O A
cti
vit
y
(% o
f c
on
tro
l)
Figure 36: Summary of differences in inhibition of total MAO enzyme activity in cultured SH-SY5Y cells
treated with tobacco extracts for up to 5 days, using either continuous (solid lines) or refreshed medium
(dashed lines) treatment regimens. This figure combines the data presented in figures 34 and 35. The
results show an increase in total MAO activity in response to nicotine, HTPM and QTPM in cells cultured
with the refreshed medium regimen, compared to the 5-day continuous treatment.
To summarize, nicotine, HTPM, and QTPM induced significant inhibition of total MAO activity
in SH-SY5Y cells treated for 5 days undisturbed, but these compounds appeared to increase
total MAO activity when cells were treated with the refreshed medium regimen (Fig. 36). The
increase in MAO activity following the refreshed medium regimen was only significant for cells
treated with HTPM, in part because of the small sample size (n=4).
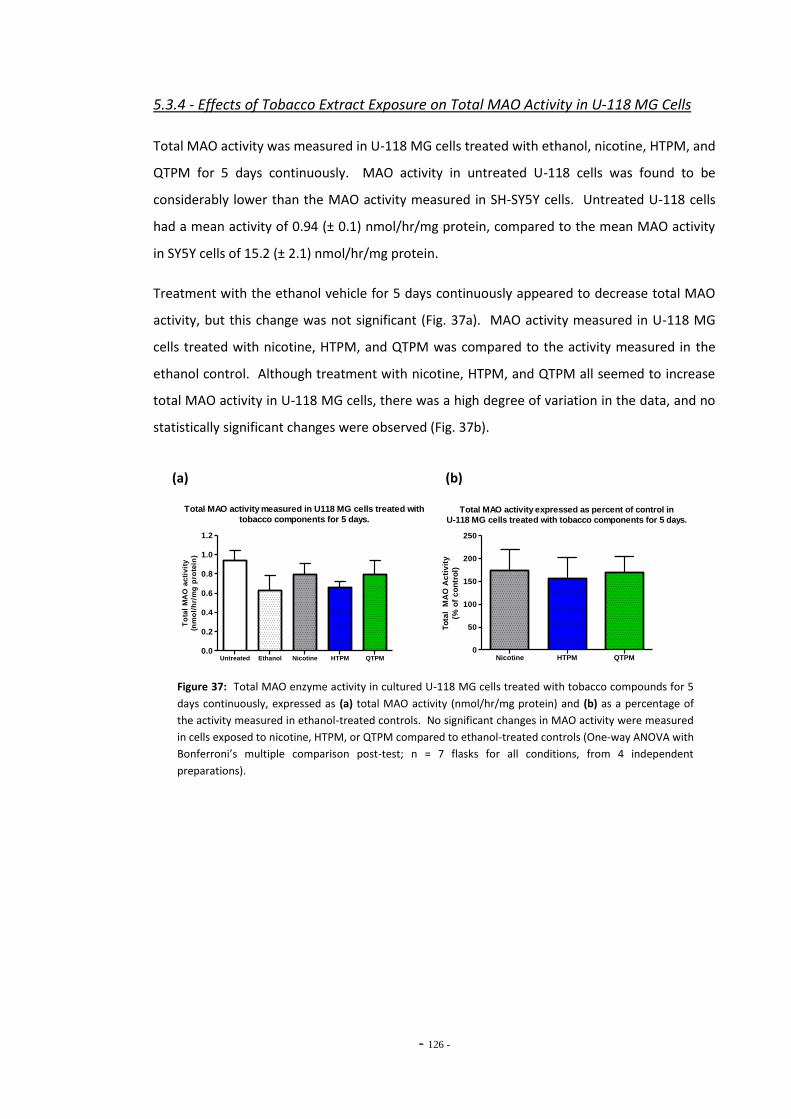
- 126 -
5.3.4 - Effects of Tobacco Extract Exposure on Total MAO Activity in U-118 MG Cells
Total MAO activity was measured in U-118 MG cells treated with ethanol, nicotine, HTPM, and
QTPM for 5 days continuously. MAO activity in untreated U-118 cells was found to be
considerably lower than the MAO activity measured in SH-SY5Y cells. Untreated U-118 cells
had a mean activity of 0.94 (± 0.1) nmol/hr/mg protein, compared to the mean MAO activity
in SY5Y cells of 15.2 (± 2.1) nmol/hr/mg protein.
Treatment with the ethanol vehicle for 5 days continuously appeared to decrease total MAO
activity, but this change was not significant (Fig. 37a). MAO activity measured in U-118 MG
cells treated with nicotine, HTPM, and QTPM was compared to the activity measured in the
ethanol control. Although treatment with nicotine, HTPM, and QTPM all seemed to increase
total MAO activity in U-118 MG cells, there was a high degree of variation in the data, and no
statistically significant changes were observed (Fig. 37b).
(a) (b)
Total MAO activity measured in U118 MG cells treated with
tobacco components for 5 days.
Untreated Ethanol Nicotine HTPM QTPM0.0
0.2
0.4
0.6
0.8
1.0
1.2
To
tal
MA
O a
cti
vit
y
(nm
ol/
hr/
mg
pro
tein
)
Total MAO activity expressed as percent of control in
U-118 MG cells treated with tobacco components for 5 days.
Nicotine HTPM QTPM0
50
100
150
200
250
To
tal
MA
O A
cti
vit
y
(% o
f c
on
tro
l)
Figure 37: Total MAO enzyme activity in cultured U-118 MG cells treated with tobacco compounds for 5
days continuously, expressed as (a) total MAO activity (nmol/hr/mg protein) and (b) as a percentage of
the activity measured in ethanol-treated controls. No significant changes in MAO activity were measured
in cells exposed to nicotine, HTPM, or QTPM compared to ethanol-treated controls (One-way ANOVA with
Bonferroni’s multiple comparison post-test; n = 7 flasks for all conditions, from 4 independent
preparations).
- 127 -
5.4 - DISCUSSION
5.4.1 - Effects of Ethanol Exposure on Total MAO Activity in SH-SY5Y Cells
Ethanol had no effect on total MAO enzyme activity in SH-SY5Y cells under any of the
treatment regimens. This confirmed that the ethanol vehicle used to solubilize the TPM
samples did not contribute to inhibition of MAO in this cell line. These results a re in
agreement with Ekblom et al. (1996) who also reported no influence of ethanol on the
activity of MAO, although that study exposed SH-SY5Y to much higher ethanol
concentrations (100 mM, compared to 5.6 mM in the present study). Some variation was
seen in the measures of total MAO activity, but these were comparable to the variation
in activity seen in untreated cells (Fig. 28). This variation is thought to represent natural
biological variation in MAO activity between cultures of SH-SY5Y cells, and variation
inherent in the assay.
5.4.2 – Standard and De-Nicotinized Tobacco Extracts Inhibit MAO in SH-SY5Y
SH-SY5Y human neuroblastoma cells exposed to HTPM and denicotinized QTPM tobacco
smoke extracts for 5 days continuously showed significant inhibition of total MAO.
Standard tobacco smoke extract has previously been reported to inhibit MAO activity
(Castagnoli et al., 2002; Mazzio et al., 2005; P. H. Yu & Boulton, 1987), but the present
study is the first to demonstrate that denicotinized tobacco extract inhibits MAO to the
same degree as standard tobacco. This finding further confirms the theory that non-
nicotine components of mainstream tobacco smoke are responsible for MAO inhibition.
This result also suggests that smokers of denicotinized Quest® cigarettes are likely to
have reduced levels of brain and peripheral MAO enzyme activity, similar to smokers of
standard tobacco cigarettes.
Lineweaver-Burk and non-linear regression analyses were used to examine the type of
inhibition induced by nicotine and tobacco extracts in SH-SY5Y cells treated for 5 days.
HTPM appeared to induce a mixed-type inhibition, which is consistent with previous
published studies. Yu and Boulton (1987) and Mazzio et al. (2005) both reported that
cigarette smoke extracts induced a mixed-type inhibition of rat lung MAO and total MAO
in C6 glioma, respectively. Herraiz and Chaparro (2005) examined inhibition of purified
MAO-A and –B enzymes, and found cigarette smoke extracts competitively inhibited
- 128 -
MAO-A, but inhibited MAO-B by a mixed-type inhibition. The present study was unable
to distinguish between MAO-A and MAO-B activity in the SH-SY5Y lysates, but the results
obtained are still consistent with these previous studies.
Denicotinized QTPM also inhibited total MAO, but the type of inhibition was non -
competitive. This finding was unexpected. QTPM was presumed to be similar in
composition to HTPM but without the nicotine content, and thus, was expected to
contain the same MAO inhibitors as standard tobacco. The finding that QTPM induces a
different type of MAO inhibition than HTPM could suggest that some MAO inhibitors
present in HTPM are absent in QTPM. This would suggest that although QTPM inhibits
total MAO to the same degree as HTPM in cultured cells, a different cohort of MAO
inhibitors may be responsible for the inhibition, accounting for the different type of
inhibition observed. There is some evidence to support this theory, as a study examining
the chemical composition of TPM from Quest nicotine-free cigarettes reported Quest
cigarettes contained significantly greater concentrations of 2-naphthylamine than the
2R4F reference cigarettes (J. Chen et al., 2008). 2-Naphthylamine is a carcinogen found
in high concentrations in cigarette smoke, and is known to inhibit MAO-A and MAO-B by
a mixed-type inhibition (Hauptmann & Shih, 2001).
Differences in the inhibition data for HTPM and QTPM could also be due to the difficulty
in interpreting the kinetic enzyme data for total MAO activity. Studies of enzyme
inhibition kinetics are usually performed by exposing a single enzyme of a known
concentration to a range of substrate concentrations in the presence or absence of a
single inhibitor. The present study used whole cell homogenates that contained both
MAO-A and –B enzymes, and cells were treated with TPM samples that are known to
contain a number of different MAO inhibitors. Total protein concentration was used to
quantify the cell homogenate, and assumes that the concentration of MAO enzyme
within the homogenates is equal between samples. However, it is possible that exposure
to HTPM or QTPM may have down-regulated MAO in SH-SY5Y cells, and these lysates
may not have the same concentration of MAO enzyme as untreated cells. Therefore, the
Lineweaver-Burk analysis performed in the present study represents the inhibition of two
enzymes (MAO-A and MAO-B) by multiple different inhibitors in TPM. The present
experiment is similar to that described by Mazzio et al. (2005), in which whole C6 rat
glioma cells were exposed to cigarette smoke condensates, and both competitive and
non-competitive inhibition was measured in these cells.
- 129 -
In the present study, exposure to purified nicotine also inhibited total MAO activity
compared to control cells. This finding was unexpected, since previous studies have
reported that nicotine has no direct effect on the activity of MAO enzymes (Castagnoli et
al., 2002; Oreland et al., 1981). Kinetic analysis showed nicotine induced a competitive
inhibition of total MAO in SH-SY5Y cells, but the present study also examined the effects
of nicotine on purified MAO-A and MAO-B enzymes, and found that nicotine induced no
inhibition in these preparations (section 4.3.1). Nicotine is known to cause increased
release of dopamine, serotonin, and norepinephrine in vitro, and in the brain (Balfour &
Fagerstrom, 1996; N. L. Benowitz, 2008; Di Chiara & Imperato, 1988; Pontieri et al., 1996;
Rao et al., 2003; Vaughan et al., 1995; Wonnacott et al., 2005), and these catecholamines
are natural substrates for MAO-A and MAO-B enzymes. It is possible that exposure to
nicotine has increased concentrations of these neurotransmitters in the prepared cell
lysates, and these natural substrates for MAO-A and MAO-B may compete with the
kynuramine substrate used in this assay. Therefore, the decrease in 4-HQ fluorescent
product may not reflect MAO-A or MAO-B inhibition, but that the native substrates for
MAO-A and MAO-B are competing with the kynuramine assay substrate.
If this is the case, it could be argued that some of the inhibition induced by HTPM and
QTPM after 5 days treatment was also due to kynuramine competition with native
substrates. However, Lineweaver-Burk analysis of the inhibition of total MAO by HTPM
and QTPM shows the inhibition type to be mixed, ie: competitive and non-competitive.
This is in agreement with earlier studies that have reported a mixed-type of inhibition
induced by tobacco compounds, as discussed above. Furthermore, the QTPM sample
contains no nicotine, and therefore the decreased 4-HQ product formation observed in
SH-SY5Y cells treated with QTPM must be due to inhibition of MAO, unless non-nicotine
compounds in QTPM are also stimulating increased neurotransmitter release.
5.4.3 – Changes in Total MAO Activity in SH-SY5Y Cells Exposed to Tobacco Compounds
As expected, short-term one-day exposures to both HTPM and QTPM inhibited the total
MAO activity of SH-SY5Y cells in culture. This is consistent with other studies that have
reported inhibition of MAO-A and MAO-B after short-term exposures to tobacco smoke
extracts (Castagnoli et al., 2002; Mazzio et al., 2005; P. H. Yu & Boulton, 1987).
- 130 -
Furthermore, this study has confirmed that tobacco smoke extracts inhibit MAO enzymes
at concentrations relevant to human tobacco consumption. Previous studies have used
much higher concentrations of tobacco smoke extract, or made no attempt to quantify
the compounds in the extract. In the present study SH-SY5Y cells were exposed to a
concentration of HTPM that contained 0.2 µM nicotine. This concentration is very similar
to the concentrations of nicotine attained in the blood stream of heavily dependent
human smokers (S. G. Gourlay & N. L. Benowitz, 1997; J.E. Rose et al., 1999). This study
confirmed that MAO is inhibited by short-term exposure to tobacco smoke compounds at
concentrations attained by human smoking behavior. This is also true of the
denicotinized QTPM sample, which inhibited total MAO to the same degree as HTPM
after a one-day exposure period.
MAO activity results after longer exposure periods are more difficult to explain. While
HTPM and QTPM inhibited MAO activity after a one-day exposure, no inhibition was
recorded in cells treated for three days continuously. This may be a result of natural
variation in MAO activity from culture to culture, as earlier experiments demonstrated
there was a high degree of variation in the levels of MAO activity in SH-SY5Y cells (section
3.3.2.5). It is also possible that after three days incubation with TPM the cells had
metabolized or inactivated the MAO inhibitors in the TPM samples, allowing MAO activity
to return to baseline. However, after five days continuous treatment, MAO activity was
significantly inhibited in cells treated with HTPM, QTPM, and nicotine. As discussed
above (section 5.3.2), inhibition by nicotine is potentially an artifact of the kynuramine
substrate competing with natural MAO substrates, while inhibition due to TPM samples
is presumed to be genuine. The present study did not test to determine if concentrations
of ethanol and TPM compounds remained stable over the treatment period. A study by
D’Addario et al. (2008) measured ethanol treatment concentrations in SH-SY5Y cell
cultures over time and reported that ethanol concentrations decreased by 23% after 72
hrs in cells treated with 10 mM ethanol at day 0. Therefore, it is possible that ethanol or
TPM concentrations fell over time due to metabolism by the cells. To determine if the
cultured cells are metabolizing the active compounds within the TPM samples would be
problematic, as the active MAO inhibitors need first to be identified. However, to
determine if the general TPM sample is being metabolized by the cells, small aliquots of
the culture media could be sampled at regular time intervals, and assayed by GC-MS for
nicotine, cotinine, or tobacco-specific nitrosamine concentrations.
- 131 -
It is also possible that healthy cells exposed to TPM for three days up-regulated MAO
protein levels in response to inhibition by the TPM, but cells exposed for five days began
to suffer from nutrient depletion and accumulation of metabolites. These factors may
have interfered with the cells’ ability to respond to TPM in a similar manner to healthier
cells. In fact, the present study did find some evidence that TPM and QTPM samples
induced an up-regulation of MAO gene expression, which will be discussed in Chapter Six
of this thesis.
In an effort to ensure that the concentration of TPM compounds remained stable over
the treatment period, SH-SY5Y cells were also exposed to TPM by a refreshed 5-day
treatment regimen in which the culture medium was replaced with fresh medium after 3
days incubation, and a fresh aliquot of TPM was added. The cells were then incubated
for a further two days before harvesting. Unexpectedly, total MAO activity increased in
cells treated with this regimen. This apparent stimulation of MAO activity is difficult to
explain, but it is evident that the cell culture conditions have a crucial effect on MAO
enzyme activity. Cells treated with tobacco compounds for five days continuously
without a medium change will have been impacted by reduced nutrients and the
accumulation of metabolites in the culture media, and are likely to be less healthy than
cells treated with the refreshed medium regimen. The data gathered in the present
study suggests that healthier, more nourished SH-SY5Y cells may respond to tobacco
extract exposure by increasing MAO enzyme activity.
To provide a clearer picture of the response of cultured SH-SY5Y cells to tobacco
compounds, it would be useful to eliminate the confounding effects of the cell culture
conditions. This could be achieved by employing a continuous perfusion culture system,
as described by Constantinescu et al. (2007). Constantinescu et al. maintained small
cultures of differentiated SH-SY5Y cells for up to two months by using a peristaltic pump
to constantly refresh the cell medium. However, these methods would be prohibitively
expensive for a study like the present one, due to the large numbers of cells required for
experiments. It would also be interesting to repeat the experiments in this chapter with
fully differentiated SH-SY5Y cells, as these would be expected to have a more neuronal
phenotype (Constantinescu et al., 2007; Pahlman et al., 1990), and may more accurately
represent a model of human neurons.
Another possible explanation for the somewhat inconsistent MAO inhibition observed in
SH-SY5Y cells could be contamination with other bio-active compounds from the
- 132 -
disposable laboratory plasticware used in this study. McDonald et al. (2008) reported
that plastic processing additives used in the manufacture of disposable plastic laboratory
tubes can leach into biological media and solvents, and leachates from several brands of
plastic tubes were found to significantly inhibit or significantly increase MAO-B enzyme
activity. The present study ensured all plasticware used for experiments was clean and
sterile, but made no effort to control the brand of plasticware used. It is unknown what
effect, if any, the use of disposable plasticware may have had on the results of this study.
5.4.4 - Effects of Tobacco Extract Exposure on Total MAO Activity in U-118 MG Cells
Previous studies have reported that human glia and astrocytes exhibit high levels of MAO
activity (Mazzio et al., 2005; Westlund et al., 1988). This study confirmed that MAO
activity is present in cultured human U-118 MG glioma cells, although the activity was
only 6% of the activity measured in undifferentiated SH-SY5Y neuroblastoma cells. The
reactions with U-118 MG cell lysates gave very low fluorescence, near the limits of
detection for this assay. Since previously reported evidence shows human glial cells to
have a high level of MAO activity, this suggests that the U-118 MG cell line may not be a
suitable model to investigate the behavior of MAO in glial cells. This is in agreement with
Ekblom et al. (1993), who reported high levels of MAO-B activity in highly differentiated
astrocytes in primary culture, but glioblasts showed very low MAO-B activity. In another
study, Ekblom et al. (1996) measured MAO enzyme activity in human 1242 MG glioma
cells and reported these cells had MAO-A and MAO-B activity of approximately 6.8
nmol/hr/mg protein and 3.6 nmol/hr/mg protein, respectively. Mazzio et al. (2005)
reported rat C6 glioma cells had a total MAO activity of approximately 30 nmol/hr/mg
protein. It would be useful to compare the total MAO activity in cultured U-118 MG cells
to MAO activity measured in another immortalized human glioma cell line, although
there are few reported studies examining MAO activity in cultured human glioma.
As described previously (section 5.1.1) Ekblom et al. (1996) used the 1242 MG glioma cell
line to investigate the effects of ethanol and other psychoactive drugs on MAO enzymes
in culture, and reported a significant increase in MAO-B activity. However, this cell line
was not available to the experimenter, and no supplier could be found. The C6 rat
glioma cell line is a more commonly used model of astrocyte and glial function, and

- 133 -
Mazzio et al. (2005) demonstrated that cigarette smoke samples inhibited MAO in this
cell line. However, C6 rat glioma cells were not used in the present study because it is not a
human cell line. Studies have shown that the biochemistry of animal-derived cell lines differ
considerably from human cell lines (Constantinescu et al., 2007), and C6 cells have been
shown to exhibit marked differences from human glia (Olson et al., 1992). The present study
aimed to use the cell models most relevant to human smoking.
Treatment of U-118 MG cells with nicotine, HTPM, and QTPM for 5 days had no
significant effect on MAO activity in these cells. However, because MAO activity in this
cell line was near the limits of detection of the kynuramine assay, it is possible that some
inhibition of MAO may have occurred but was not detected by this assay.
5.4.5 – Summary
Consistent with the results reported in Chapter Four of this thesis, both HTPM and
denicotinized QTPM significantly inhibited total MAO activity in SH-SH5Y cells.
However, inhibition of MAO seemed to be highly dependent on the cell culture
conditions, and the results suggest that SH-SY5Y cells may up-regulate MAO activity or
expression in response to MAO inhibition. While MAO activity was detected in the U-
118 MG cell line, activity was very low and no inhibition was observed. This suggests
that this cell line may not be a suitable model for glial functioning, as MAO activity has
previously been reported in human glia and astrocytes.

- 134 -
Chapter Six: Tobacco extract exposure alters MAO gene expression
A number of studies have investigated the effects of nicotine and tobacco smoke on the
activity of MAO enzyme activity in humans and animal models of addiction; however, there
has not yet been any significant investigation into the effect of nicotine or tobacco on the
gene expression of MAO. As discussed in Chapter One, tobacco exposure causes inhibition of
MAO-A and MAO-B enzyme activity, and it is also possible that changes in MAO gene
expression may occur following exposure to tobacco smoke. The present study and several
others have found that inhibition of MAO enzyme activity appears to be reversible; therefore,
changes in MAO gene expression may account for the longer term reductions in MAO activity
observed in smokers.
Several microarray studies have investigated general changes in gene expression following
treatment with nicotine, but none of these have examined MAO-A or MAO-B specifically. The
present study aimed to characterize the gene expression of MAO-A and MAO-B in cultured
SH-SY5Y cells in response to nicotine and tobacco smoke exposure, utilizing quantitative real-
time RT-PCR.
6.1.1 - MAO Gene Studies and Smoking
Investigation of human MAO genes with respect to smoking has largely focused on identifying
genetic markers of addiction. It has been proposed that genetic factors account for up to 70%
of the likelihood of becoming a smoker (Heath et al., 1999), and this genetic predisposition is
most likely determined by multiple genes. It has been theorized that individual differences in
MAO enzyme expression and activity may contribute to genetic susceptibility to becoming a
smoker and could influence the ability of a smoker to quit. These differences may be partly
determined by genetic polymorphisms in the MAO genes. Several polymorphisms of the
MAO-A and MAO-B genes have been identified in humans, and these polymorphisms appear
- 135 -
to have some functional significance. It has been suggested that genetic polymorphisms may
be relevant to the etiology of smoking behaviour, causing differences in individual MAO
protein levels and activity. Some evidence has been reported that both high and low levels of
MAO may influence smoking and quitting behaviors (J. Harro et al., 2004).
A variable number of tandem repeat (VNTR) polymorphism has been identified in the human
MAO-A promoter region that affects transcription of the gene (Ito et al., 2003). The
polymorphism is located 1.2 kb upstream of the MAO-A protein coding region, and alleles
have been found with 1, 2, 3, 3.5, 4 or 5 copies of a 30 bp repeated sequence. These alleles
display differing frequencies between different ethnic groups. Alleles with 3.5 or 4 repeats
are transcribed with greater efficiency than other alleles, suggesting there is an ‘optimum
length’ of the MAO-A promoter. This polymorphism may play a role in the susceptibility of an
individual to cigarette addiction, since a reduced risk of being a smoker was reported for
females carrying the 4 repeat allele; whereas, males with the 4 repeat allele showed increased
risk of being a smoker. An explanation of these apparently contradictory findings is not yet
available.
Another polymorphism at position 644 in intron 13 of the human MAO-B gene has been
associated with significantly reduced enzyme activity in the human brain, but increased
activity in blood platelets. This polymorphism involves the substitution of an adenine base at
position 644 for a guanine base (Checkoway et al., 1998). The G allele also displays
differences in allele frequency between ethnic groups, with 20% of Asian populations and 40%
of Caucasian populations displaying this allele (Tan et al., 2003). The G allele has greater
transcriptional activity than the A allele (Costa-Mallen et al., 2005) and has also been
associated with a slightly increased risk of Parkinson’s disease in Caucasian populations (Tan
et al., 2003). A recent study investigating this polymorphism in conjunction with the TaqIB
polymorphism in the dopamine D2 receptor gene (DRD2) found a strong association between
the DRD2/644A haplotype and smoking behavior in men (Costa-Mallen et al., 2005). It was
reported that 82% of men with this haplotype were current or ex-smokers, compared to 46%
of men with the same DRD2 allele and the 644G allele. A convincing case was made for an
interaction between these two genes in predisposing to smoking behaviour in men.
Interpretation of the results of these studies is complex, since the polymorphism occurs in the
non-coding region of the gene and does not affect the amino acid sequence of the protein
(Checkoway et al., 1998). An explanation for how this polymorphism may alter MAO-B gene
expression has not been proposed.
- 136 -
Additionally, the VNTR and 644G polymorphisms may act together to influence smoking
behaviour. The association between MAO-A/B haplotype and smoking behavior has been
examined, and some evidence exists to suggest that both polymorphisms may predispose to
the smoking habit. Ito et al (2003) investigated this link in a Japanese population and found
that males with a 3-repeat/644G haplotype began smoking at a later age than males with
other haplotypes, and men with the 4-repeat allele were found to have a significantly
increased risk of nicotine dependence. Further investigation is required to confirm the
association between these alleles and an increased risk of smoking behavior, and to identify
the mechanisms by which these polymorphisms influence transcription of MAO-A and B
genes.
While a significant amount of research has been conducted into the genetic differences
between smokers, the effects of nicotine or tobacco smoke exposure on the expression of
MAO-A or MAO-B genes has yet to be examined. Tobacco smoke is a mixture of over 4000
different compounds, and it is likely that some of these compounds can alter the expression of
the MAO-A or MAO-B genes. Considering the likely involvement of MAO in the establishment
and maintenance of tobacco dependence, it is possible that any alteration in MAO gene
regulation or expression induced by tobacco smoke constituents will influence the role that
MAO plays in the cell’s response to tobacco. As such, this area presents an important gap in
the current understanding of tobacco and MAO interaction.
6.1.2 – Nicotine and Gene Expression
Nicotine is known to modulate the expression of many genes involved in diverse cellular
functions (Dunckley & Lukas, 2003, 2006). Some of these include tyrosine hydroxylase, which
is involved in catecholamine synthesis, and the immediate early genes c-fos, c-jun, and junB
(Pelto-Huikko et al., 1995). These immediate early genes act as transcription factors and may
lead to nicotine-induced regulation of many genes (Dunckley & Lukas, 2003).
A study into the effects of nicotine on SH-SY5Y cells used microarray technology to identify
novel nicotine-regulated genes in SH-SY5Y cells (Dunckley & Lukas, 2003). A gene library of
approximately 5000 fluorescently labeled cDNA transcripts was assembled from untreated SH-
SY5Y cells, and from cells treated with 1 mM nicotine for 1 hour. Nicotine consistently altered
the expression of 17 different genes. It was noted that the gene expression changes identified
- 137 -
were of generally low magnitude, showing up-regulation of only 26-38%, and down-regulation
of 21-55%. RT-PCR was used to confirm the results of the microarray analysis, and to
determine whether nAChR activation was required to regulate these genes. SH-SY5Y cells
were then treated with nicotine in the presence of d-tubocurarine (d-TC), a non-specific
nAChR antagonist, and assayed by RT-PCR. Treatment with d-TC blocked or reversed the
nicotine-induced changes in mRNA expression for all of the genes tested. The authors
concluded that nAChR activation was required for the nicotine-dependent modulation of gene
expression, and that these changes in gene expression were a result of nicotine binding to the
nAChRs.
In a later experiment by the same group, microarray analysis was used to identify changes in
gene expression arising from longer-term exposure to nicotine in SH-SY5Y cells (Dunckley &
Lukas, 2006). Cells were treated with 1 mM nicotine for 24 hours, and microarray analysis
used to identify changes in expression of at least 160 different genes in this cell line. These
effects were observed in genes involved in many diverse cellular functions, including binding,
metabolism, catalytic activity, and physiological processes. Some of the genes affected
included eukaryotic translation initiation factor 4A isoform 2 (eIF4A2), contactin 1, and son of
sevenless homolog 1 (SOS1), which were up-regulated, and ubiquitin-conjugating enzymes,
glyceraldehyde-3-phosphate dehydrogenase (GAPDH), stress-induced-phosphoprotein 1
(STIP1) and Parkin which were down-regulated. Once again, real-time PCR was used to
determine if the observed changes in gene expression were dependent on the activation of
nAChR-mediated signaling pathways, this time using the nAChR antagonists α-cobratoxin and
mecamylamine, in addition to d-TC. It was confirmed that in most cases nAChR antagonists
were able to reverse the alteration in gene expression induced by nicotine alone, suggesting
that observed changes in gene expression were a result of nAChR-mediated signaling
pathways, and dependent on nicotine binding.
The results reported in these experiments indicate that nicotine exposure can modulate the
expression of a diverse range of genes with varied functional significance. However to date,
no studies have specifically investigated the effects of nicotine or tobacco on MAO-A or MAO-
B transcription.
- 138 -
6.1.3 - Quantitative Real-Time PCR
Reverse transcription real-time PCR has proven to be one of the most sensitive, accurate, and
rapid methods for the quantitative analysis of gene expression. It offers several advantages
over other gene expression methodologies like Northern blot analysis, reporter gene
transfection, or end-point PCR, as it shows greater sensitivity, better reproducibility and is less
labour intensive. The high sensitivity of real-time RT-PCR allows quantification of low-
abundance transcripts and accurate detection of subtle changes in gene expression.
The protocol for a quantitative RT-PCR reaction involves isolating mRNA from biological
samples and first performing a reverse transcription reaction to transcribe the mRNA to cDNA.
The cDNA is then used as a template and amplified by PCR. Real-time QPCR instruments
monitor the accumulation of amplicon in the PCR reaction after each successive cycle with the
use of fluorescent probes and dyes such as the intercalating dye SYBR Green I. SYBR Green I
binds specifically to the minor groove in the double stranded DNA helix, and fluoresces
intensely when bound. As the PCR reaction progresses the concentration of double-stranded
DNA increases causing a corresponding increase in the intensity of SYBR Green I fluorescence.
A PCR is characterized by three phases of amplicon accumulation. The exponential phase
occurs at the start of the reaction when reagents are not limiting and the concentration of
PCR product increases exponentially. This is followed by the linear phase, when product
formation slows to a linear increase as PCR reagents become limited. As the reaction
progresses some reagents will become depleted or the polymerase enzyme may become
inactivated. At this point no more PCR product will be formed, and the PCR will reach the
plateau phase. During the exponential phase fluorescence intensity increases proportionally
as the amount of amplicon doubles with each successive cycle of the reaction. It is in this
phase of the reaction that real-time qPCR instruments measure the accumulation of
fluorescence. The first cycle at which the fluorescence produced by target amplification can
be distinguished from baseline fluorescence is termed the threshold cycle or Ct, and is the
main metric unit used in real-time PCR analysis. The Ct value can be directly correlated to the
initial target concentration in the reaction - the greater the amount of initial target cDNA, the
earlier the Ct value for that sample (Fig. 38a). The qPCR fluorescence threshold is usually set
by the proprietary software used to operate each real-time PCR instrument and is based on
the level of baseline fluorescence. The fluorescent threshold is set at a point where all
samples show an exponential increase in fluorescence that can be distinguished from
background fluorescence (Yuan et al., 2006).
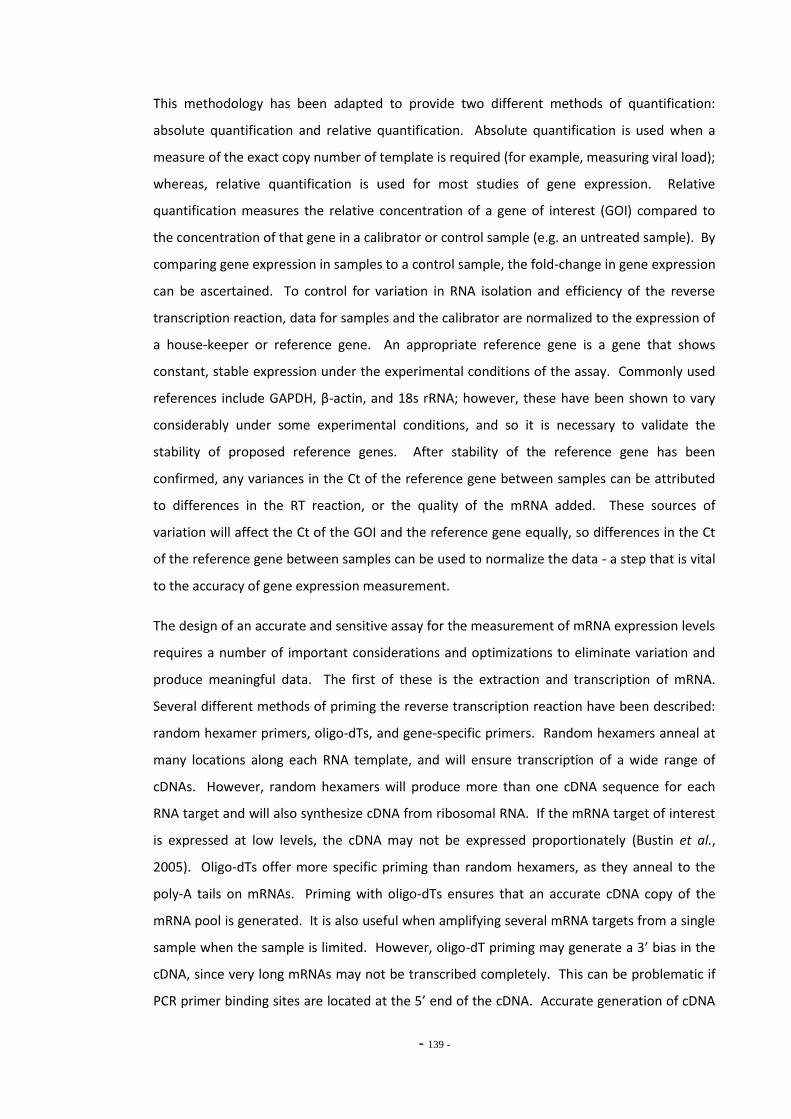
- 139 -
This methodology has been adapted to provide two different methods of quantification:
absolute quantification and relative quantification. Absolute quantification is used when a
measure of the exact copy number of template is required (for example, measuring viral load);
whereas, relative quantification is used for most studies of gene expression. Relative
quantification measures the relative concentration of a gene of interest (GOI) compared to
the concentration of that gene in a calibrator or control sample (e.g. an untreated sample). By
comparing gene expression in samples to a control sample, the fold-change in gene expression
can be ascertained. To control for variation in RNA isolation and efficiency of the reverse
transcription reaction, data for samples and the calibrator are normalized to the expression of
a house-keeper or reference gene. An appropriate reference gene is a gene that shows
constant, stable expression under the experimental conditions of the assay. Commonly used
references include GAPDH, β-actin, and 18s rRNA; however, these have been shown to vary
considerably under some experimental conditions, and so it is necessary to validate the
stability of proposed reference genes. After stability of the reference gene has been
confirmed, any variances in the Ct of the reference gene between samples can be attributed
to differences in the RT reaction, or the quality of the mRNA added. These sources of
variation will affect the Ct of the GOI and the reference gene equally, so differences in the Ct
of the reference gene between samples can be used to normalize the data - a step that is vital
to the accuracy of gene expression measurement.
The design of an accurate and sensitive assay for the measurement of mRNA expression levels
requires a number of important considerations and optimizations to eliminate variation and
produce meaningful data. The first of these is the extraction and transcription of mRNA.
Several different methods of priming the reverse transcription reaction have been described:
random hexamer primers, oligo-dTs, and gene-specific primers. Random hexamers anneal at
many locations along each RNA template, and will ensure transcription of a wide range of
cDNAs. However, random hexamers will produce more than one cDNA sequence for each
RNA target and will also synthesize cDNA from ribosomal RNA. If the mRNA target of interest
is expressed at low levels, the cDNA may not be expressed proportionately (Bustin et al.,
2005). Oligo-dTs offer more specific priming than random hexamers, as they anneal to the
poly-A tails on mRNAs. Priming with oligo-dTs ensures that an accurate cDNA copy of the
mRNA pool is generated. It is also useful when amplifying several mRNA targets from a single
sample when the sample is limited. However, oligo-dT priming may generate a 3’ bias in the
cDNA, since very long mRNAs may not be transcribed completely. This can be problematic if
PCR primer binding sites are located at the 5’ end of the cDNA. Accurate generation of cDNA
- 140 -
using oligo-dTs also requires full-length RNA of good quality, so it is good practice to test the
integrity of extracted RNA when using oligo-dTs. Gene specific primers offer the most specific
option for cDNA priming, but because an RT reaction needs to be performed with different
specific primers for each gene of interest, this method can be quite wasteful when working
with limited samples or multiple GOIs.
Another vital consideration in the optimization of an accurate qPCR assay is the efficiency with
which the customized primers are priming the PCR reaction. The basic principle used to
analyze real-time PCR data assumes that the number of cycles required to reach threshold
fluorescence correlates with initial target concentration, and this can only be accurately
measured if the PCR reaction is operating at 100% efficiency - that is, when each PCR cycle
results in a doubling of the target amplicon.
(a) (b)
Figure 38: (a) SYBR Green I fluorescence versus Cycle number for a serially diluted sample of SH-SY5Y cDNA
amplified using the POLR2F specific primers. Each dilution was assayed in duplicate. Note the more dilute
samples reach threshold fluorescent (blue horizintal line) after a greater number of amplification cycles. These
data can be used to derive an amplification efficiency plot (b), the slope of which is used to determine the
percentage efficiency of the amplification reaction. In this case, the reaction primed with the POLR2F primers
procedes with an efficiency of 101.8%.
The efficiency of a qPCR reaction can be determined by constructing a standard curve using a
positive control template (Fig. 38b). Generally, a sample positive for the template of interest
is serially diluted over several orders of magnitude encompassing the expected range of the
experimental samples and then amplified using the experimental PCR protocol and
customized primers. The Ct value of each dilution is plotted against the logarithm-
transformed template dilution, and should yield a linear fit. When a base 10 logarithm is
used, the slope should be between -3.1 and -3.6, indicating 90-110% reaction efficiency. A
y = -3.2803x + 19.57R² = 0.9992
0
5
10
15
20
25
30
35
40
-5 -4 -3 -2 -1 0
Ct
Log (cDNA dilution)
POLR2F Amplification Efficiency

- 141 -
low reaction efficiency may be corrected by optimizing the primer or magnesium
concentration; whereas, efficiency values above 100% may indicate the formation of primer
dimers, or non-specific amplification.
The presence of non-specific PCR products or primer dimers can be checked using a PCR
product melt curve analysis after every PCR run. Analysis of the melt curve can determine if
anything other than the gene of interest is amplified. A melt curve is generated by the qPCR
instrument which anneals all PCR products at 55°C and incrementally increases the
temperature while recording the changes in fluorescence intensity. Fluorescence intensity of
the SYBR Green I dye will fall rapidly at the temperature at which the double-stranded PCR
product dissociates. These data can be used to plot raw fluorescence against temperature, or
more commonly the negative first derivative of raw fluorescence versus temperature. This
second plot will show the melting temperatures of different PCR products as individual peaks
located at distinct temperatures. A specific and well-optimized qPCR assay will show the
presence of a single, narrow, homogeneous peak. Primer dimers and non-specific
amplification products can be identified by the presence of additional peaks on the melt curve
located at different temperatures. Because SYBR Green I binds to all double-stranded DNA
the presence of non-specific products in a qPCR reaction render the assay inaccurate, and the
Ct data cannot be trusted for quantification purposes.
An ideal qPCR assay requires careful optimization and validation, but will amplify a single
specific PCR product reliably and reproducibly. Once these results are achieved, qPCR can be
used to sensitively and quantitatively detect changes in gene expression.
6.1.3.1 – Data Manipulations and Calculations
Determining fold-changes in mRNA expression using quantitative RT-PCR requires some
calculation and data manipulation of the Ct metric recorded. A commonly used
transformation of the data is the 2-ΔΔCt method (Livak & Schmittgen, 2001). This method is
used to calculate relative changes in gene expression by comparing the Ct values of the GOI in
the treated sample with the GOI in the calibrator sample (untreated control) and uses the Ct
values of the reference gene in each to normalize the data.

- 142 -
The first calculation made is ΔCt, which is defined as the threshold cycle of the gene of
interest, minus the threshold cycle of the reference gene, or
ΔCT = CTGOI – CTREF
From here, the difference in ΔCt between the unknown sample and the calibrator (or
untreated) sample are compared as
ΔΔCT = ΔCTUNK - ΔCTCAL
The negative reciprocal of the ΔΔCt figure is taken and raised as an exponent of 2 to give the
quantitation of the target, normalized to an endogenous reference gene relative to a
calibrator (Livak & Schmittgen, 2001). This figure is known as the Relative Quantitation or RQ,
and expresses fold change in gene expression relative to the calibrator. For example, a
sample with an RQ of 1.0 shows the same level of gene expression as the calibrator. An RQ of
0.5 indicates a sample with 50% less expression than the calibrator; while a sample with an RQ
of 1.75 has 75% more expression than the calibrator.
However, for the 2-ΔΔCt calculation to be valid, the amplification efficiencies of the GOI and
reference gene primers are assumed to be equal, and near 100%. When amplification
efficiencies are unequal or significantly below 100% the calculated RQ could be very different
from actual gene expression. As the PCR efficiencies of the primers used in this study were
not equal, a modified analysis of the 2-ΔΔCt method was used to correct for this (Yuan et al.,
2006; Yuan et al., 2008). The efficiency-adjusted ΔΔCt method uses many of the same
calculations as the original 2-ΔΔCt approach but allows correction for differences in the PCR
efficiency of the reactions. Thus, this method uses the same calculation for ΔΔCt described
above, but first corrects each Ct value with the Percentage Amplification Efficiency (PAE).
Therefore, the equation for the efficiency adjusted ΔΔCt method is:
ΔΔCTADJUST = ((CTGOI_UNK X PAEGOI) - (CTREF_UNK X PAEREF)) - ((CTGOI_CAL X PAEGOI) - (CTREF_CAL X PAEREF))
PAE is estimated by linear regression of an efficiency standard curve, described above. Ct is
plotted against the logarithm-base-2 transformation of the concentration, and the slope of a
line fit to this plot is the PAE.
The efficiency-adjusted ΔΔCt value can then be transformed into the Relative Quantitation
(RQ) figure as described above.
- 143 -
6.1.4 – Objectives
The aim of the present study was to use quantitative real-time PCR to investigate the effects
of nicotine and tobacco extracts on the expression of MAO-A and MAO-B genes in cultured
SH-SY5Y human neuroblastoma cells.
Cultured SH-SY5Y cells were exposed to nicotine, HTPM, and QTPM over a number of different
treatment regimens before harvesting the total RNA from the cells. The mRNA was
transcribed to cDNA and assayed by real-time PCR. It was proposed that non-nicotine
compounds within TPM may down-regulate the expression of MAO-A or MAO-B, contributing
to the inhibition of these enzymes observed in chronic human smokers. If this hypothesis is
correct, it was expected that exposure to denicotinized TPM (QTPM) would induce down-
regulation of the MAO-A or –B genes, similar to that seen after exposure to standard HTPM.
Based on the literature, nicotine alone was not expected to change MAO-A or MAO-B gene
expression.
The approach used by Dunckley & Lukas (2006) was adapted to determine if changes in MAO-
A gene expression following HTPM exposure were independent of any action of nicotine on
the cells. Cultures of SH-SY5Y were also exposed to HTPM and denicotinized QTPM in the
presence of mecamylamine, a non-specific nAChR antagonist. As discussed in section 6.1.2,
Dunckley & Lukas used mecamylamine to determine the nAChR-dependent basis of changes in
expression of a number of genes. The present study aimed to use mecamylamine inhibition to
investigate the nature of the changes in MAO-A and MAO-B gene expression specifically. It
was expected that changes in MAO gene expression in SH-SY5Y cells would be independent of
the actions of the nAChRs, since no direct interaction between nicotine and MAO-A or MAO-B
has previously been reported. Therefore, mecamylamine inhibition of nAChRs should have no
effect on the changes in gene expression observed in response to HTPM or denicotinized
QTPM.
Thus the overall aims of this study were twofold: to investigate whether nicotine or tobacco
extracts altered the expression of MAO-A or MAO-B, and to determine if any changes
observed were dependent on nAChR activation.
- 144 -
6.2 - MATERIALS AND METHODS
6.2.1 – Tobacco Particulate Matter Exposures
The expression of MAO-A and MAO-B mRNA was investigated in SH-SY5Y and U-118 MG cells
following exposure to tobacco compounds. Cells were grown and maintained according to the
protocol described in section 2.1. Several different treatment regimens were used to study
the cellular responses to these exposures, as detailed below.
6.2.1.1 – MAO Gene Expression in SH-SY5Y Cells
Batches of five 600 mL culture flasks of SH-SY5Y cells were sub-cultured at low density and
grown to near confluence in the presence of ethanol, purified nicotine, TPM from standard
cigarettes (HTPM), and TPM from denicotinized tobacco (QTPM). The cells received nicotine
or HTPM to a total final concentration of 0.2 µM nicotine, and equivalent volumes of ethanol
or QTPM were used (9.8 μL per 30 mL of media; 0.03% ethanol). These extracts were added
directly to the cell culture medium, and the cells were maintained in this exposure medium
without disruption for 1, 3, or 5 days. After harvesting the cells, total RNA was extracted
according to the methods described in section 2.6.1, and cell samples were assayed for
changes in gene expression.
For this experiment, 4 flasks each of a) ethanol-exposed, b) nicotine-exposed, c) HTPM-
exposed, and d) QTPM-exposed cells were treated for 1 day before harvesting and RNA
extraction. Seven flasks of each treatment group were exposed for 3 days, and 16 flasks of
each treatment group were prepared for the 5-day time point. The 5-day exposures were
expected to show the maximal response, and therefore more replicates of this treatment
were prepared.
The mRNA extracted from these treated cells was transcribed into cDNA according to the
protocol described in section 2.6.2, and assayed by real-time PCR using the methods described
in 2.6.3. Each sample was assayed in duplicate at least twice, and the mean Ct value of these
replicates was used for the analysis.

- 145 -
6.2.1.2 - MAO Gene Expression in U-118 MG Cells
Changes in MAO-A and MAO-B gene expression in U-118 MG cells were also investigated.
Cells were cultured according to the methods described in section 2.1. U-118 MG gene
expression was examined at the continuous 5-day treatment regimen as it was hoped it
would show the maximal response to treatment.
For this experiment, 8 flasks of each treatment condition were exposed to ethanol, nicotine,
HTPM, and QTPM. Nicotine and HTPM were added to a final nicotine concentration of 0.2
µM, and ethanol and QTPM were added at equivalent volumes, as described above. The cells
were exposed for 5 days continuously, without disruption and without any changes of the
medium. This is the same regimen used to treat SH-SY5Y cells exposed for 5 days
continuously.
At the completion of the treatment regimen the cells were harvested, and the total RNA was
extracted and transcribed to cDNA according to the methods described in section 2.6.2. The
resulting cDNA samples were then assayed by real-time PCR in duplicate, on two separate
occasions.
6.2.1.3 - Gene Expression in SH-SY5Y Cells Treated with Refreshed Media
Analysis of the data obtained from the 1, 3, and 5 day exposure groups of SH-SY5Y cells
showed that many treatments induced a change in gene expression after 3 days treatment,
yet the expression fell back to near control levels after 5 days treatment. There was some
concern that this might indicate that the ethanol, nicotine, HTPM, and QTPM compounds
were being metabolized and degraded by the cells. Hence, a fourth treatment regimen was
subsequently added to the experiment, in which cultured SH-SY5Y cells were treated with
ethanol, nicotine, HTPM and QTPM as in the previous experiment, but the medium in the
flasks was replaced at day 3. On day 3, the culture medium was removed by aspiration and
replaced with fresh culture medium supplemented with ethanol, nicotine, HTPM, or QTPM.
Cell cultures were then returned to the incubator for a further 2 days before harvesting for
total RNA. This treatment regimen was used to try to maintain the exposure conditions at a
constant concentration. Six flasks of each treatment group were prepared for this
experiment, and each sample was assayed for MAO-A and MAO-B gene expression in
duplicate.
- 146 -
6.2.1.4 – Mecamylamine Exposures
In addition to the nicotine and TPM exposure regimens described above, SH-SY5Y cells were
also treated with these tobacco compounds in the presence of the nAChR antagonist
mecamylamine. Mecamylamine inhibits the action of all nAChR subunits non-specifically.
Untreated stocks of SH-SY5Y cells were grown to near-confluence in culture medium and
mecamylamine (reconstituted in distilled H2O) was added to give a final concentration of 10
µM. Relevant volumes of nicotine, HTPM, and QTPM were also added to the medium to give
final nicotine concentrations of 0.2 µM or equivalent volumes of treatment, as described
above. Control flasks receiving treatment with mecamylamine only, or mecamylamine in the
presence of ethanol, were incubated in parallel with the nicotine and TPM treated samples.
After the addition of mecamylamine and tobacco compounds, the treated cells were
incubated for 3 days undisturbed. At the completion of the exposures, the flasks of cells were
prepared for total RNA extraction as described above.
6.2.2 - Quantitative Real-Time PCR
6.2.2.1 - Reference Genes
DNA-directed RNA polymerase II subunit F (POLR2F) was selected as a reference or house-
keeping gene for all qRT-PCR experiments based on the findings of Hoerndli et al (2004), who
presented a list of suitable reference genes for use in SH-SY5Y cells. The stable expression of
this gene was verified against two other house-keeping genes: GAPDH and M-RIP. All three
genes were amplified in SH-SY5Y cells exposed to all treatments over all treatment regimens
according to the qRT-PCR protocol described in section 2.6 of this thesis. Gene expression was
compared between genes and analyzed using geNorm v3.5 software.
6.2.2.2 - Primer Efficiency
To test the PCR efficiency of the selected primer pairs a standard curve was prepared for each
pair using cDNA transcribed from 2 μg/μL total RNA from SH-SY5Y cells. SH-SY5Y cDNA was
serially diluted with dH2O over the range 1 – 256 fold. Dilutions of cDNA were amplified in
duplicate using the relevant primer concentrations according to the protocol described in
section 2.6 of this thesis.
- 147 -
Upon completion of the assay, Microsoft Excel 2007 was used to plot the mean Ct values for
each dilution against the logarithm-base-10 transformed dilution factor. Linear regression
analysis was used to fit a straight line to the data. The PCR efficiency was calculated from the
slope of this line using the equation:
Efficiency = 10(-1/slope) – 1
where slope refers to the slope of the plot of the logarithm-base-10 transformed template
dilution versus Ct value (Peters et al., 2004) described in section 6.1.3.
6.2.2.3 - Data Manipulation
The adjusted ΔΔCt method described in section 6.1.3.2 was used to calculate RQ for all the
quantitative RT-PCR experiments in this thesis. This method was chosen to correct for
differences in amplification efficiency between primers to achieve a more accurate picture of
the changes in gene expression observed. The reference gene used for all experiments was
POLR2F. For analysis of the effects of ethanol, gene expression in ethanol-treated cells was
compared to that in untreated cells which served as the calibrator. When gene expression in
nicotine, HTPM, or QTPM treated cells was analyzed, ethanol treated cells were used as the
calibrator. Because nicotine, HTPM and QTPM samples all contained ethanol, the ethanol
treated cells were used as the calibrator to control for any effects of the ethanol vehicle.
6.2.3 – Western Blotting
The abundance of MAO-A and MAO-B following nicotine and TPM treatments were estimated
from Western blots of the cell extracts. Western blotting was performed on cell protein
lysates collected at the same time the cell cultures were harvested for total RNA. These
protein lysates were probed for MAO-A and MAO-B-specific immuno-staining and analyzed by
densitometry on a semi-quantitative basis. This was to determine if observed changes in MAO
gene expression were correlated with corresponding changes in MAO protein abundance.
Lysates prepared from cells receiving the 5-day refreshed treatment regimen were used for
this experiment, as these cells showed the greatest change in MAO gene expression.
- 148 -
Some flasks exposed using the 5 day refreshed regimen did not yield enough cells for both
RNA extraction and preparation of a protein lysate, and so the sample group available for
Western blotting was smaller than that used for quantitative RT-PCR. Four samples each of
ethanol, nicotine, HTPM, and QTPM treated cells were assayed by Western blot. One of each
treatment was assayed per blot, for a total of four independent experiments.
Western blots for MAO-A were immunostained using a rabbit polyclonal antibody (Santa Cruz
Biotechnology Inc; sc-20156) raised against amino acids 458 - 527 of the human MAO-A
protein. MAO-B protein was detected using a goat polyclonal antibody (Santa Cruz
Biotechnology Inc; sc-18401) specific for a C-terminus peptide sequence of human MAO-B. A
mouse polyclonal anti-β-tubulin antibody (BD Pharmingen; cat. 556321) was used on both MAO-
A and MAO-B blots to serve as a protein loading control. The MAO-A antibody produces a
specific band at 61 kDa, the MAO-B antibody yields a 60 kDa band, and the β-tubulin antibody
produces a band at 50 kDa. MAO-A and MAO-B were visualized with Cy®-5 labeled anti-rabbit
(Jackson ImmunoResearch Inc; 711-175-152) and anti-goat (Jackson ImmunoResearch Inc;
705-175-147) secondary antibodies respectively, and β-tubulin was visualized with a Cy®-5
labeled anti-mouse antibody (Jackson ImmunoResearch Inc; 715-175-150). The fluorescence
from these was measured using the Fujifilm FLA-5100 imaging system (Fuji Photo Film Co.,
Ltd) with a 635 nm laser and the DBR1/R665 emission filter. Densitometry was performed
with ImageJ v3.5 software (Wayne Rasbond, National Institutes of Health, USA) using an
integrated pixel density method. Specific Western blotting procedures are detailed in section
2.5 of this thesis.
6.3 – RESULTS
6.3.1 - Quantitative Real-Time PCR Validation
6.3.1.1 – Primer Efficiency
Efficiency of the PCR reaction with all primer pairs was good and did not vary significantly
from 100% (Table 13). PCR primers which give a reaction efficiency over 90% are preferred for
quantitative analysis; whereas, efficiencies above 100% indicate the formation of primer
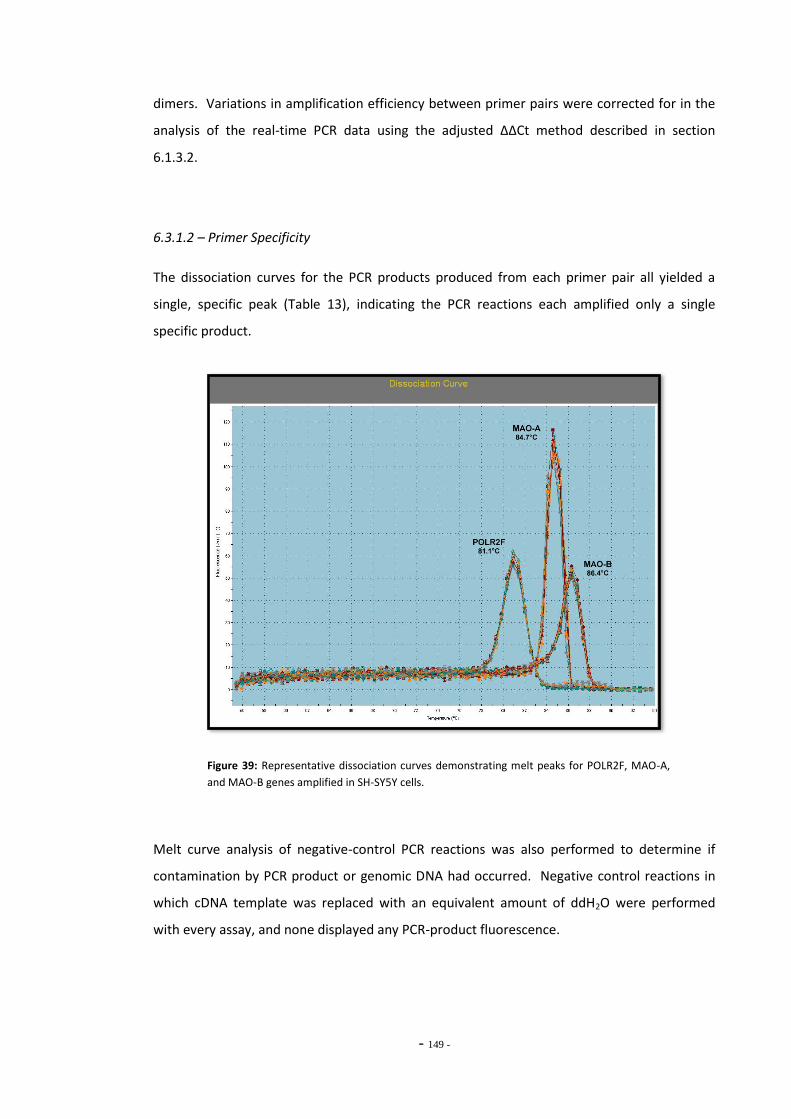
- 149 -
dimers. Variations in amplification efficiency between primer pairs were corrected for in the
analysis of the real-time PCR data using the adjusted ΔΔCt method described in section
6.1.3.2.
6.3.1.2 – Primer Specificity
The dissociation curves for the PCR products produced from each primer pair all yielded a
single, specific peak (Table 13), indicating the PCR reactions each amplified only a single
specific product.
Figure 39: Representative dissociation curves demonstrating melt peaks for POLR2F, MAO-A,
and MAO-B genes amplified in SH-SY5Y cells.
Melt curve analysis of negative-control PCR reactions was also performed to determine if
contamination by PCR product or genomic DNA had occurred. Negative control reactions in
which cDNA template was replaced with an equivalent amount of ddH2O were performed
with every assay, and none displayed any PCR-product fluorescence.
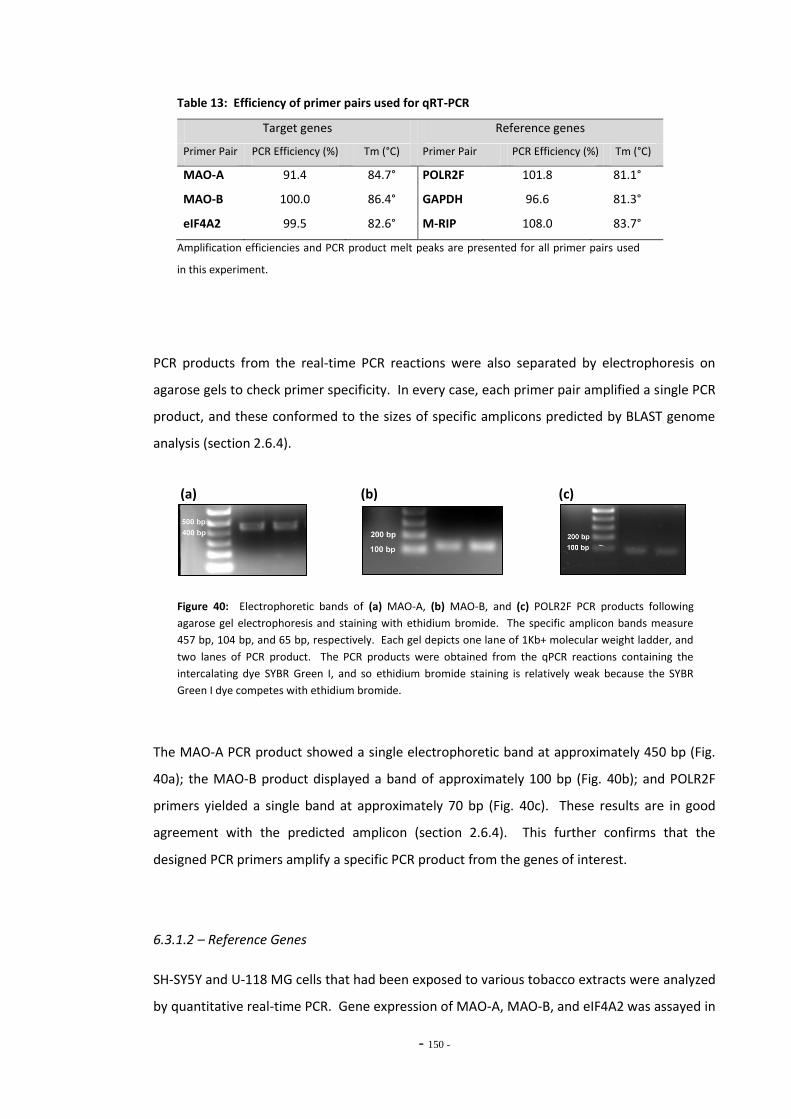
- 150 -
Table 13: Efficiency of primer pairs used for qRT-PCR
Target genes Reference genes
Primer Pair PCR Efficiency (%) Tm (°C) Primer Pair PCR Efficiency (%) Tm (°C)
MAO-A 91.4 84.7° POLR2F 101.8 81.1°
MAO-B 100.0 86.4° GAPDH 96.6 81.3°
eIF4A2 99.5 82.6° M-RIP 108.0 83.7°
Amplification efficiencies and PCR product melt peaks are presented for all primer pairs used
in this experiment.
PCR products from the real-time PCR reactions were also separated by electrophoresis on
agarose gels to check primer specificity. In every case, each primer pair amplified a single PCR
product, and these conformed to the sizes of specific amplicons predicted by BLAST genome
analysis (section 2.6.4).
(a) (b) (c)
Figure 40: Electrophoretic bands of (a) MAO-A, (b) MAO-B, and (c) POLR2F PCR products following
agarose gel electrophoresis and staining with ethidium bromide. The specific amplicon bands measure
457 bp, 104 bp, and 65 bp, respectively. Each gel depicts one lane of 1Kb+ molecular weight ladder, and
two lanes of PCR product. The PCR products were obtained from the qPCR reactions containing the
intercalating dye SYBR Green I, and so ethidium bromide staining is relatively weak because the SYBR
Green I dye competes with ethidium bromide.
The MAO-A PCR product showed a single electrophoretic band at approximately 450 bp (Fig.
40a); the MAO-B product displayed a band of approximately 100 bp (Fig. 40b); and POLR2F
primers yielded a single band at approximately 70 bp (Fig. 40c). These results are in good
agreement with the predicted amplicon (section 2.6.4). This further confirms that the
designed PCR primers amplify a specific PCR product from the genes of interest.
6.3.1.2 – Reference Genes
SH-SY5Y and U-118 MG cells that had been exposed to various tobacco extracts were analyzed
by quantitative real-time PCR. Gene expression of MAO-A, MAO-B, and eIF4A2 was assayed in
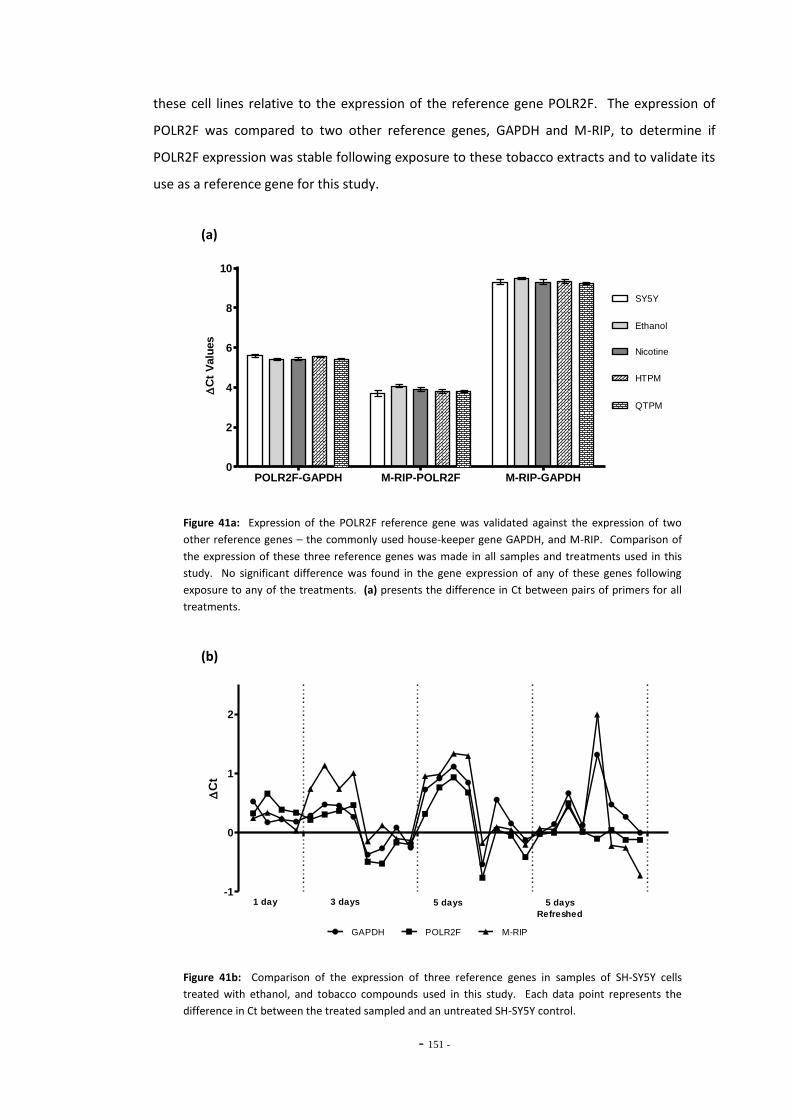
- 151 -
these cell lines relative to the expression of the reference gene POLR2F. The expression of
POLR2F was compared to two other reference genes, GAPDH and M-RIP, to determine if
POLR2F expression was stable following exposure to these tobacco extracts and to validate its
use as a reference gene for this study.
(a)
POLR2F-GAPDH M-RIP-POLR2F M-RIP-GAPDH0
2
4
6
8
10
SY5Y
Ethanol
Nicotine
HTPM
QTPM
C
t V
alu
es
Figure 41a: Expression of the POLR2F reference gene was validated against the expression of two
other reference genes – the commonly used house-keeper gene GAPDH, and M-RIP. Comparison of
the expression of these three reference genes was made in all samples and treatments used in this
study. No significant difference was found in the gene expression of any of these genes following
exposure to any of the treatments. (a) presents the difference in Ct between pairs of primers for all
treatments.
(b)
-1
0
1
2
GAPDH POLR2F M-RIP
1 day 3 days 5 days 5 days
Refreshed
C
t
Figure 41b: Comparison of the expression of three reference genes in samples of SH-SY5Y cells
treated with ethanol, and tobacco compounds used in this study. Each data point represents the
difference in Ct between the treated sampled and an untreated SH-SY5Y control.

- 152 -
The expression of POLR2F was not found to vary following exposure to ethanol, nicotine,
HTPM, or QTPM. Cell samples from all treatment groups were tested to determine if
treatment induced changes in the expression of these genes. The difference in Ct value
between reference genes was compared for all three possible reference gene combinations,
and no significant differences were observed (Fig. 41a). The Ct values for cDNA samples from
treated cells were also normalized by subtracting the mean Ct value recorded in untreated
samples. These values for POLR2F, GAPDH, and M-RIP were compared visually (Fig. 41b) and
showed good general agreement. Trends in POLR2F and GAPDH expression levels were very
closely matched, while M-RIP showed slightly greater variability. The slight deviations from
the mean Ct of untreated samples are a reflection of the inherent variation in the instrument,
pipettes and PCR enzyme activity.
Finally, Ct data for all three reference genes were analyzed with the geNorm v3.5 software.
The geNorm software comprises a collection of VBA macros for Microsoft Excel that
determines the most stable reference gene from a given set of tested candidate genes. It
calculates an average stability variable M, by determining variation of the expression ratio for
every pair of reference genes tested. Genes with the most stable expression have the lowest
M values. POLR2F was found to be the most stable reference gene, with an M value of 0.025;
while, GAPDH and M-RIP had M values of 0.027 and 0.026, respectively. Together, these tests
confirm the stability of POLR2F in SH-SY5Y cells and validate the use of POLR2F as an
appropriate reference gene for this study.
6.3.2 – Effects of Ethanol Exposure on MAO-A & MAO-B Gene Expression
As described earlier, all TPM extracts used in this study were collected in absolute ethanol to
retain as many of the volatile compounds as possible. This meant that cells treated with TPM
were also exposed to 5.6 mM ethanol during the exposure period. Ethanol has been reported
to affect the gene expression of MAO-B in vitro (Ekblom et al., 1996). To control for any
effects due to ethanol, the purified nicotine standard was reconstituted in ethanol, and
vehicle controls treated with ethanol alone were prepared. The effect of ethanol exposure on
the expression of MAO-A and MAO-B was then examined.
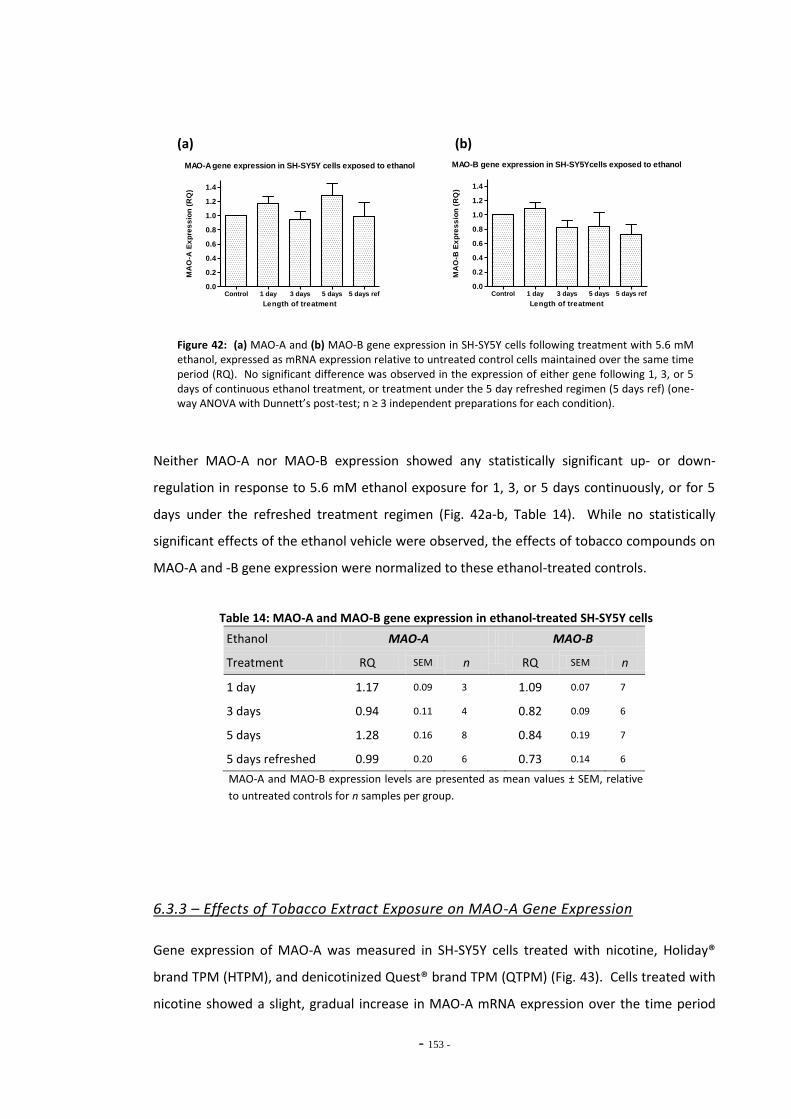
- 153 -
(a) (b)
MAO-A gene expression in SH-SY5Y cells exposed to ethanol
Control 1 day 3 days 5 days 5 days ref0.0
0.2
0.4
0.6
0.8
1.0
1.2
1.4
Length of treatment
MA
O-A
Ex
pre
ss
ion
(R
Q)
MAO-B gene expression in SH-SY5Ycells exposed to ethanol
Control 1 day 3 days 5 days 5 days ref0.0
0.2
0.4
0.6
0.8
1.0
1.2
1.4
Length of treatment
MA
O-B
Ex
pre
ss
ion
(R
Q)
Figure 42: (a) MAO-A and (b) MAO-B gene expression in SH-SY5Y cells following treatment with 5.6 mM ethanol, expressed as mRNA expression relative to untreated control cells maintained over the same time period (RQ). No significant difference was observed in the expression of either gene following 1, 3, or 5 days of continuous ethanol treatment, or treatment under the 5 day refreshed regimen (5 days ref) (one-way ANOVA with Dunnett’s post-test; n ≥ 3 independent preparations for each condition).
Neither MAO-A nor MAO-B expression showed any statistically significant up- or down-
regulation in response to 5.6 mM ethanol exposure for 1, 3, or 5 days continuously, or for 5
days under the refreshed treatment regimen (Fig. 42a-b, Table 14). While no statistically
significant effects of the ethanol vehicle were observed, the effects of tobacco compounds on
MAO-A and -B gene expression were normalized to these ethanol-treated controls.
Table 14: MAO-A and MAO-B gene expression in ethanol-treated SH-SY5Y cells
Ethanol MAO-A MAO-B
Treatment RQ SEM n RQ SEM n
1 day 1.17 0.09 3 1.09 0.07 7
3 days 0.94 0.11 4 0.82 0.09 6
5 days 1.28 0.16 8 0.84 0.19 7
5 days refreshed 0.99 0.20 6 0.73 0.14 6
MAO-A and MAO-B expression levels are presented as mean values ± SEM, relative
to untreated controls for n samples per group.
6.3.3 – Effects of Tobacco Extract Exposure on MAO-A Gene Expression
Gene expression of MAO-A was measured in SH-SY5Y cells treated with nicotine, Holiday®
brand TPM (HTPM), and denicotinized Quest® brand TPM (QTPM) (Fig. 43). Cells treated with
nicotine showed a slight, gradual increase in MAO-A mRNA expression over the time period
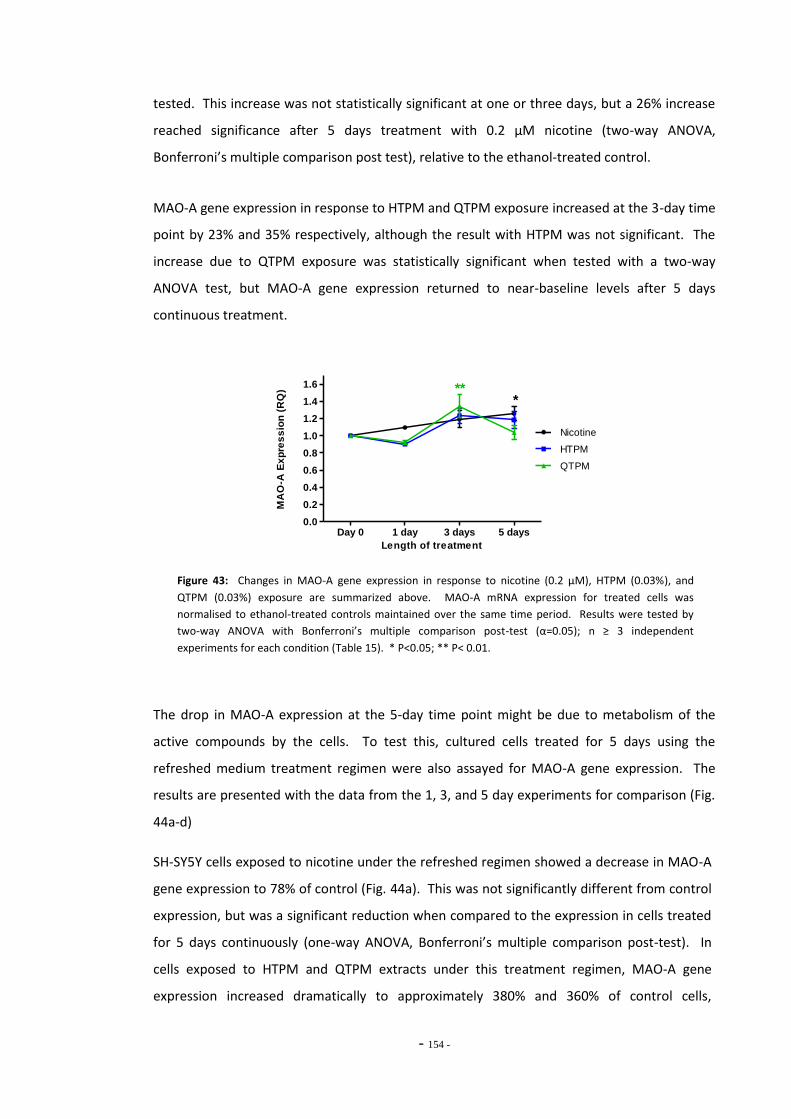
- 154 -
tested. This increase was not statistically significant at one or three days, but a 26% increase
reached significance after 5 days treatment with 0.2 μM nicotine (two-way ANOVA,
Bonferroni’s multiple comparison post test), relative to the ethanol-treated control.
MAO-A gene expression in response to HTPM and QTPM exposure increased at the 3-day time
point by 23% and 35% respectively, although the result with HTPM was not significant. The
increase due to QTPM exposure was statistically significant when tested with a two-way
ANOVA test, but MAO-A gene expression returned to near-baseline levels after 5 days
continuous treatment.
Day 0 1 day 3 days 5 days0.0
0.2
0.4
0.6
0.8
1.0
1.2
1.4
1.6
Nicotine
HTPM
QTPM
***
Length of treatment
MA
O-A
Ex
pre
ss
ion
(R
Q)
Figure 43: Changes in MAO-A gene expression in response to nicotine (0.2 μM), HTPM (0.03%), and
QTPM (0.03%) exposure are summarized above. MAO-A mRNA expression for treated cells was
normalised to ethanol-treated controls maintained over the same time period. Results were tested by
two-way ANOVA with Bonferroni’s multiple comparison post-test (α=0.05); n ≥ 3 independent
experiments for each condition (Table 15). * P<0.05; ** P< 0.01.
The drop in MAO-A expression at the 5-day time point might be due to metabolism of the
active compounds by the cells. To test this, cultured cells treated for 5 days using the
refreshed medium treatment regimen were also assayed for MAO-A gene expression. The
results are presented with the data from the 1, 3, and 5 day experiments for comparison (Fig.
44a-d)
SH-SY5Y cells exposed to nicotine under the refreshed regimen showed a decrease in MAO-A
gene expression to 78% of control (Fig. 44a). This was not significantly different from control
expression, but was a significant reduction when compared to the expression in cells treated
for 5 days continuously (one-way ANOVA, Bonferroni’s multiple comparison post-test). In
cells exposed to HTPM and QTPM extracts under this treatment regimen, MAO-A gene
expression increased dramatically to approximately 380% and 360% of control cells,
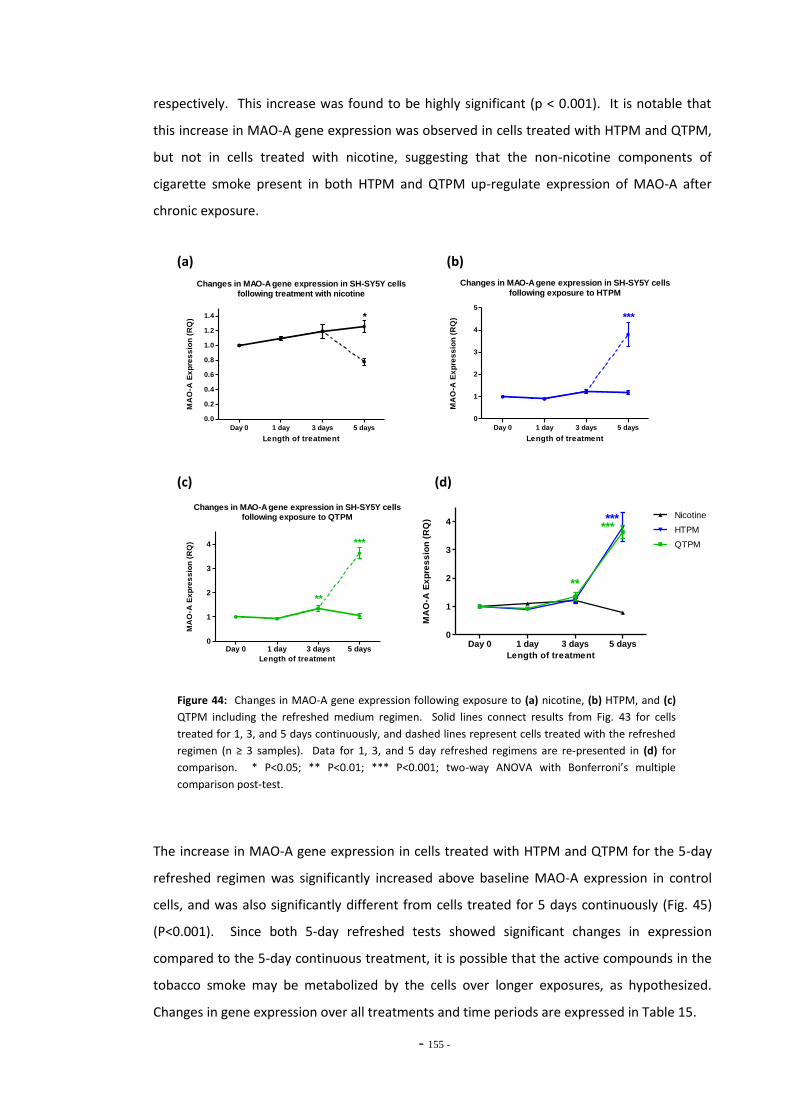
- 155 -
respectively. This increase was found to be highly significant (p < 0.001). It is notable that
this increase in MAO-A gene expression was observed in cells treated with HTPM and QTPM,
but not in cells treated with nicotine, suggesting that the non-nicotine components of
cigarette smoke present in both HTPM and QTPM up-regulate expression of MAO-A after
chronic exposure.
(a) (b)
Changes in MAO-A gene expression in SH-SY5Y cells
following treatment with nicotine
Day 0 1 day 3 days 5 days
0.0
0.2
0.4
0.6
0.8
1.0
1.2
1.4 *
Length of treatment
MA
O-A
Ex
pre
ss
ion
(R
Q)
Changes in MAO-A gene expression in SH-SY5Y cells
following exposure to HTPM
Day 0 1 day 3 days 5 days
0
1
2
3
4
5
***
Length of treatment
MA
O-A
Ex
pre
ss
ion
(R
Q)
(c) (d)
Changes in MAO-A gene expression in SH-SY5Y cells
following exposure to QTPM
Day 0 1 day 3 days 5 days0
1
2
3
4 ***
**
Length of treatment
MA
O-A
Ex
pre
ss
ion
(R
Q)
Day 0 1 day 3 days 5 days0
1
2
3
4Nicotine
HTPM
QTPM
******
**
Length of treatment
MA
O-A
Ex
pre
ss
ion
(R
Q)
Figure 44: Changes in MAO-A gene expression following exposure to (a) nicotine, (b) HTPM, and (c)
QTPM including the refreshed medium regimen. Solid lines connect results from Fig. 43 for cells
treated for 1, 3, and 5 days continuously, and dashed lines represent cells treated with the refreshed
regimen (n ≥ 3 samples). Data for 1, 3, and 5 day refreshed regimens are re-presented in (d) for
comparison. * P<0.05; ** P<0.01; *** P<0.001; two-way ANOVA with Bonferroni’s multiple
comparison post-test.
The increase in MAO-A gene expression in cells treated with HTPM and QTPM for the 5-day
refreshed regimen was significantly increased above baseline MAO-A expression in control
cells, and was also significantly different from cells treated for 5 days continuously (Fig. 45)
(P<0.001). Since both 5-day refreshed tests showed significant changes in expression
compared to the 5-day continuous treatment, it is possible that the active compounds in the
tobacco smoke may be metabolized by the cells over longer exposures, as hypothesized.
Changes in gene expression over all treatments and time periods are expressed in Table 15.
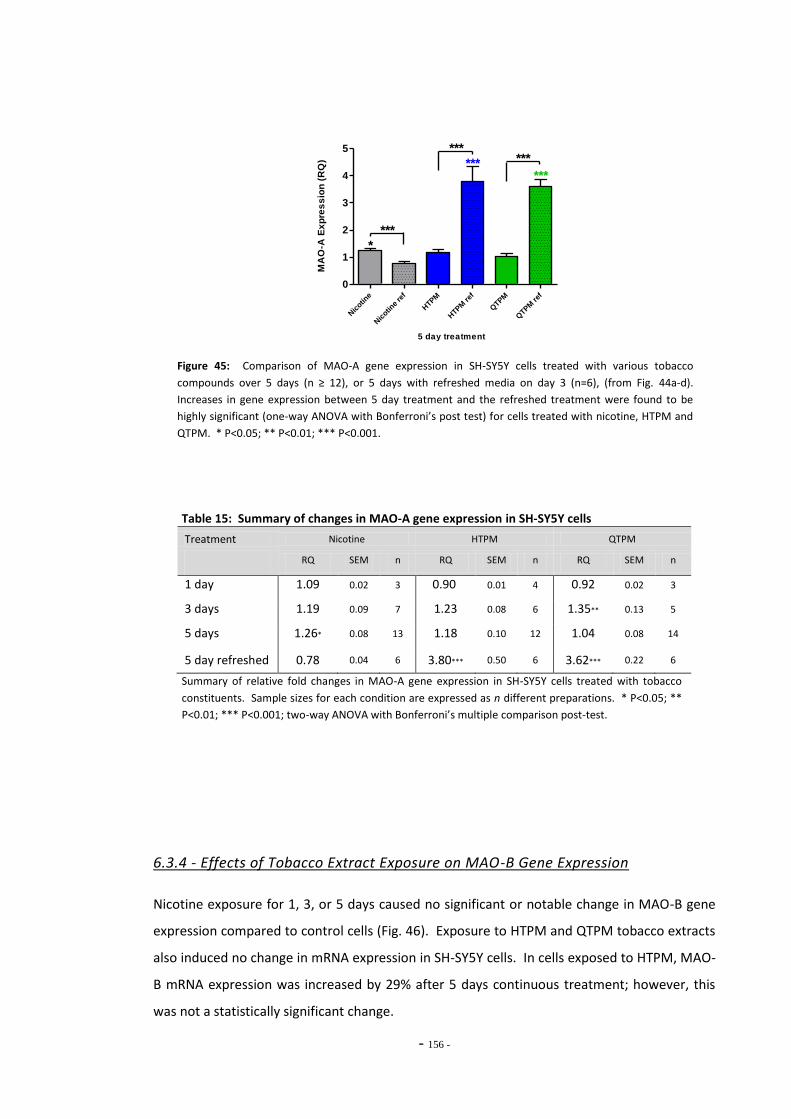
- 156 -
Nic
otine
Nic
otine
ref
HTP
M
HTP
M ref
QTP
M
QTP
M ref
0
1
2
3
4
5
******
*
******
***
5 day treatment
MA
O-A
Ex
pre
ss
ion
(R
Q)
Figure 45: Comparison of MAO-A gene expression in SH-SY5Y cells treated with various tobacco
compounds over 5 days (n ≥ 12), or 5 days with refreshed media on day 3 (n=6), (from Fig. 44a-d).
Increases in gene expression between 5 day treatment and the refreshed treatment were found to be
highly significant (one-way ANOVA with Bonferroni’s post test) for cells treated with nicotine, HTPM and
QTPM. * P<0.05; ** P<0.01; *** P<0.001.
Table 15: Summary of changes in MAO-A gene expression in SH-SY5Y cells
Treatment Nicotine HTPM QTPM
RQ SEM n RQ SEM n RQ SEM n
1 day 1.09 0.02 3 0.90 0.01 4 0.92 0.02 3
3 days 1.19 0.09 7 1.23 0.08 6 1.35** 0.13 5
5 days 1.26* 0.08 13 1.18 0.10 12 1.04 0.08 14
5 day refreshed 0.78 0.04 6 3.80*** 0.50 6 3.62*** 0.22 6
Summary of relative fold changes in MAO-A gene expression in SH-SY5Y cells treated with tobacco
constituents. Sample sizes for each condition are expressed as n different preparations. * P<0.05; **
P<0.01; *** P<0.001; two-way ANOVA with Bonferroni’s multiple comparison post-test.
6.3.4 - Effects of Tobacco Extract Exposure on MAO-B Gene Expression
Nicotine exposure for 1, 3, or 5 days caused no significant or notable change in MAO-B gene
expression compared to control cells (Fig. 46). Exposure to HTPM and QTPM tobacco extracts
also induced no change in mRNA expression in SH-SY5Y cells. In cells exposed to HTPM, MAO-
B mRNA expression was increased by 29% after 5 days continuous treatment; however, this
was not a statistically significant change.

- 157 -
Day
0
1 day
3 day
s
5 day
s
0.0
0.5
1.0
1.5
Nicotine
TPM
QTPM
Length of treatment
MA
O-B
ex
pre
ss
ion
(R
Q)
Figure 46: MAO-B mRNA levels measured by qRT-PCR in cells exposed to nicotine (0.2 µM), HTPM, and
QTPM are compared. MAO-B mRNA expression for treated cells was normalised to ethanol-treated
controls maintained over the same time period. No statistically significant results were observed in any
treatment for 1, 3, or 5 days (two-way ANOVA with Bonferroni’s post-test; α=0.05, n ≥ 5 independent
preparations for each condition).
MAO-B gene expression was also examined in cells treated with nicotine, HTPM and QTPM for
5 days after refreshing the medium at day 3. When SH-SY5Y cells were exposed to nicotine
under the refreshed medium regimen, mean MAO-B expression decreased slightly to 83% of
baseline expression (Fig. 47a). This is similar to the effect on MAO-A expression. MAO-B
mRNA expression increased significantly to 270% of baseline levels in cells treated with HTPM
over the 5 day refreshed treatment (Fig. 47b). This increase in gene expression was highly
significant (one-way ANOVA, Bonferroni’s multiple comparison post-test). This effect was also
observed in cells treated with QTPM for the refreshed regimen, which showed a 260%
increase in expression (Fig. 47c). This pattern of MAO-B gene expression changes is similar to
the changes observed in MAO-A expression when cells were treated with tobacco extracts
using the same treatment regimen. This suggests that compounds within the tobacco extracts
induce increases in MAO-B mRNA expression, but nicotine does not.
Since the 5-day refreshed medium exposure induced larger changes in MAO-B gene
expression than the 5-day continuous treatment, this could suggest that the active
components in TPM are lost after 3 days in culture. Changes in relative MAO-B gene
expression following all treatments are summarized in Table 16.
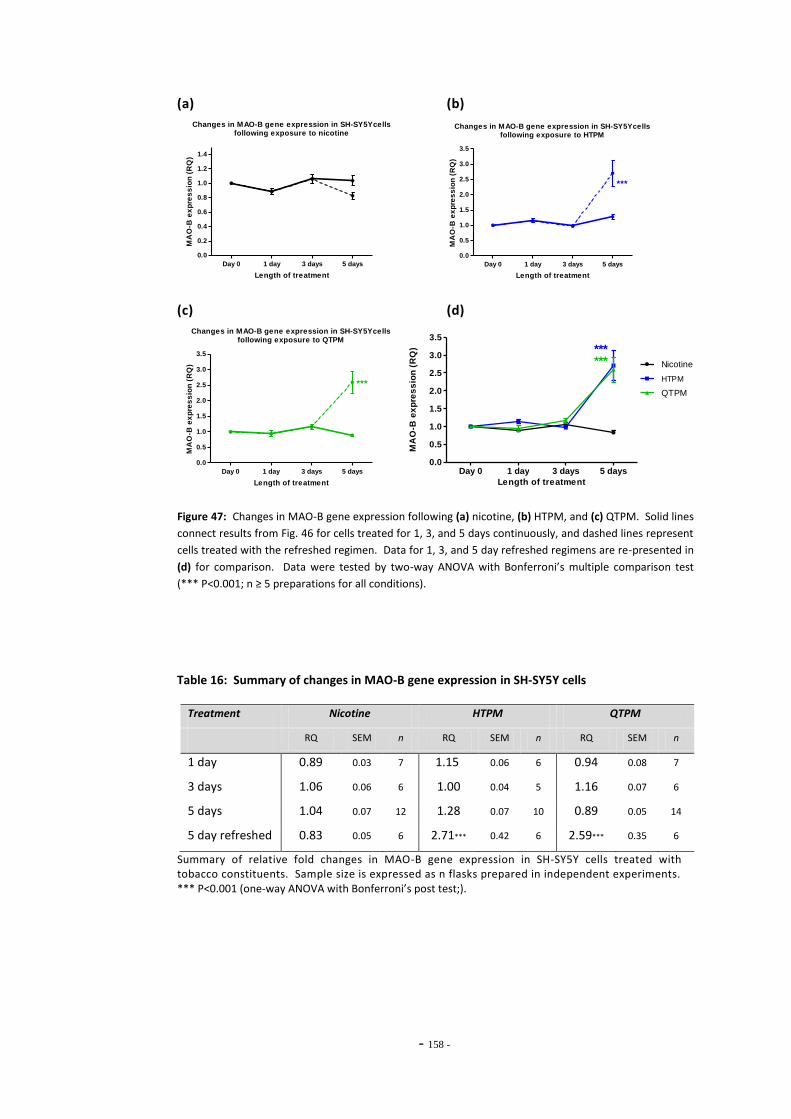
- 158 -
(a) (b)
Changes in MAO-B gene expression in SH-SY5Ycellsfollowing exposure to nicotine
Day 0 1 day 3 days 5 days
0.0
0.2
0.4
0.6
0.8
1.0
1.2
1.4
Length of treatment
MA
O-B
ex
pre
ss
ion
(R
Q)
Changes in MAO-B gene expression in SH-SY5Ycellsfollowing exposure to HTPM
Day 0 1 day 3 days 5 days
0.0
0.5
1.0
1.5
2.0
2.5
3.0
3.5
***
Length of treatment
MA
O-B
ex
pre
ss
ion
(R
Q)
(c) (d)
Changes in MAO-B gene expression in SH-SY5Ycellsfollowing exposure to QTPM
Day 0 1 day 3 days 5 days
0.0
0.5
1.0
1.5
2.0
2.5
3.0
3.5
***
Length of treatment
MA
O-B
ex
pre
ss
ion
(R
Q)
Day 0 1 day 3 days 5 days0.0
0.5
1.0
1.5
2.0
2.5
3.0
3.5
Nicotine
HTPM
QTPM
******
Length of treatment
MA
O-B
ex
pre
ss
ion
(R
Q)
Figure 47: Changes in MAO-B gene expression following (a) nicotine, (b) HTPM, and (c) QTPM. Solid lines
connect results from Fig. 46 for cells treated for 1, 3, and 5 days continuously, and dashed lines represent
cells treated with the refreshed regimen. Data for 1, 3, and 5 day refreshed regimens are re-presented in
(d) for comparison. Data were tested by two-way ANOVA with Bonferroni’s multiple comparison test
(*** P<0.001; n ≥ 5 preparations for all conditions).
Table 16: Summary of changes in MAO-B gene expression in SH-SY5Y cells
Summary of relative fold changes in MAO-B gene expression in SH-SY5Y cells treated with tobacco constituents. Sample size is expressed as n flasks prepared in independent experiments.
*** P<0.001 (one-way ANOVA with Bonferroni’s post test;).
Treatment Nicotine HTPM QTPM
RQ SEM n RQ SEM n RQ SEM n
1 day 0.89 0.03 7 1.15 0.06 6 0.94 0.08 7
3 days 1.06 0.06 6 1.00 0.04 5 1.16 0.07 6
5 days 1.04 0.07 12 1.28 0.07 10 0.89 0.05 14
5 day refreshed 0.83 0.05 6 2.71*** 0.42 6 2.59*** 0.35 6
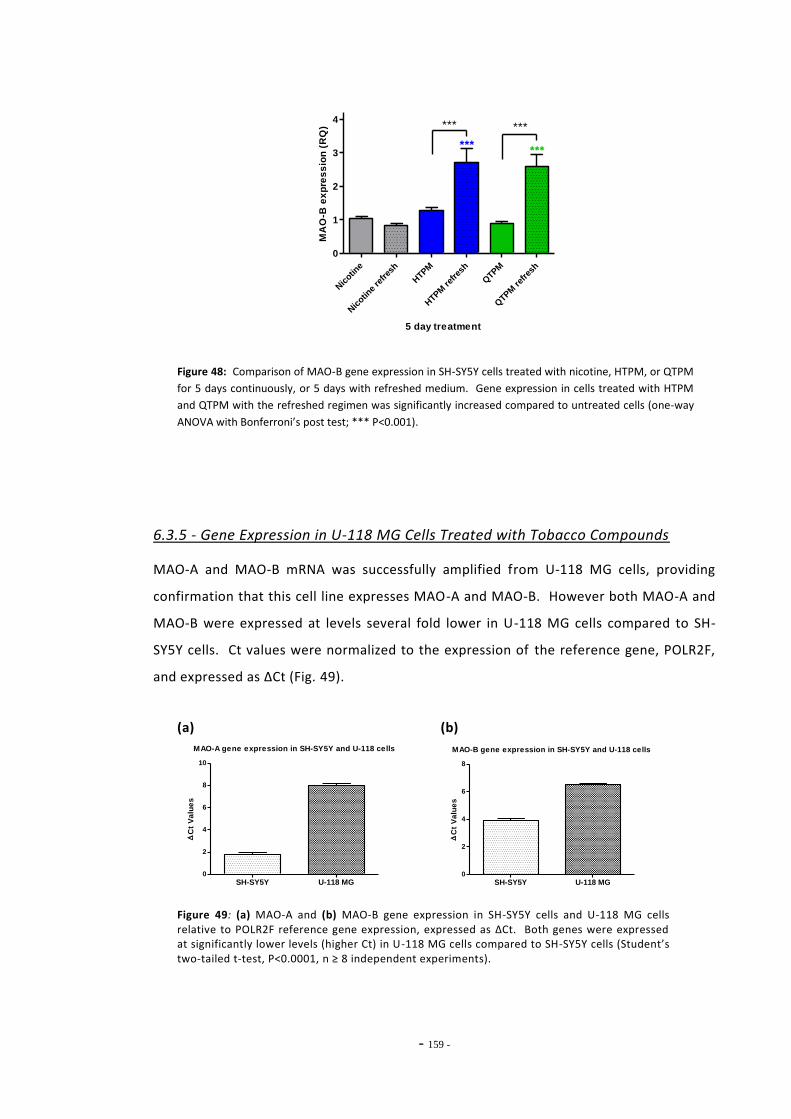
- 159 -
Nic
otine
Nic
otine
refres
h
HTP
M
HTP
M ref
resh
QTP
M
QTP
M ref
resh
0
1
2
3
4
******
*** ***
5 day treatmentM
AO
-B e
xp
res
sio
n (
RQ
)
Figure 48: Comparison of MAO-B gene expression in SH-SY5Y cells treated with nicotine, HTPM, or QTPM
for 5 days continuously, or 5 days with refreshed medium. Gene expression in cells treated with HTPM
and QTPM with the refreshed regimen was significantly increased compared to untreated cells (one-way
ANOVA with Bonferroni’s post test; *** P<0.001).
6.3.5 - Gene Expression in U-118 MG Cells Treated with Tobacco Compounds
MAO-A and MAO-B mRNA was successfully amplified from U-118 MG cells, providing
confirmation that this cell line expresses MAO-A and MAO-B. However both MAO-A and
MAO-B were expressed at levels several fold lower in U-118 MG cells compared to SH-
SY5Y cells. Ct values were normalized to the expression of the reference gene, POLR2F,
and expressed as ΔCt (Fig. 49).
(a) (b)
MAO-A gene expression in SH-SY5Y and U-118 cells
SH-SY5Y U-118 MG0
2
4
6
8
10
C
t V
alu
es
MAO-B gene expression in SH-SY5Y and U-118 cells
SH-SY5Y U-118 MG0
2
4
6
8
C
t V
alu
es
Figure 49: (a) MAO-A and (b) MAO-B gene expression in SH-SY5Y cells and U-118 MG cells relative to POLR2F reference gene expression, expressed as ΔCt. Both genes were expressed at significantly lower levels (higher Ct) in U-118 MG cells compared to SH-SY5Y cells (Student’s two-tailed t-test, P<0.0001, n ≥ 8 independent experiments).
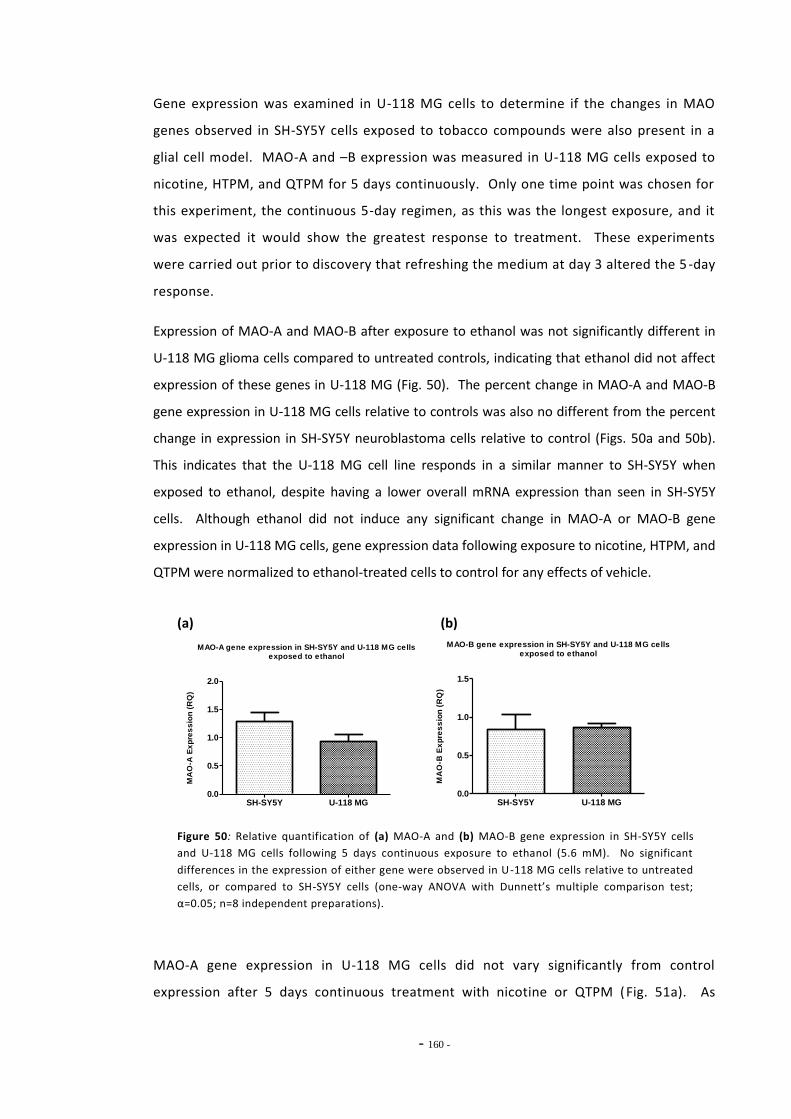
- 160 -
Gene expression was examined in U-118 MG cells to determine if the changes in MAO
genes observed in SH-SY5Y cells exposed to tobacco compounds were also present in a
glial cell model. MAO-A and –B expression was measured in U-118 MG cells exposed to
nicotine, HTPM, and QTPM for 5 days continuously. Only one time point was chosen for
this experiment, the continuous 5-day regimen, as this was the longest exposure, and it
was expected it would show the greatest response to treatment. These experiments
were carried out prior to discovery that refreshing the medium at day 3 altered the 5 -day
response.
Expression of MAO-A and MAO-B after exposure to ethanol was not significantly different in
U-118 MG glioma cells compared to untreated controls, indicating that ethanol did not affect
expression of these genes in U-118 MG (Fig. 50). The percent change in MAO-A and MAO-B
gene expression in U-118 MG cells relative to controls was also no different from the percent
change in expression in SH-SY5Y neuroblastoma cells relative to control (Figs. 50a and 50b).
This indicates that the U-118 MG cell line responds in a similar manner to SH-SY5Y when
exposed to ethanol, despite having a lower overall mRNA expression than seen in SH-SY5Y
cells. Although ethanol did not induce any significant change in MAO-A or MAO-B gene
expression in U-118 MG cells, gene expression data following exposure to nicotine, HTPM, and
QTPM were normalized to ethanol-treated cells to control for any effects of vehicle.
(a) (b)
MAO-A gene expression in SH-SY5Y and U-118 MG cellsexposed to ethanol
SH-SY5Y U-118 MG0.0
0.5
1.0
1.5
2.0
MA
O-A
Ex
pre
ss
ion
(R
Q)
MAO-B gene expression in SH-SY5Y and U-118 MG cellsexposed to ethanol
SH-SY5Y U-118 MG0.0
0.5
1.0
1.5
MA
O-B
Ex
pre
ss
ion
(R
Q)
Figure 50: Relative quantification of (a) MAO-A and (b) MAO-B gene expression in SH-SY5Y cells
and U-118 MG cells following 5 days continuous exposure to ethanol (5.6 mM). No significant
differences in the expression of either gene were observed in U-118 MG cells relative to untreated
cells, or compared to SH-SY5Y cells (one-way ANOVA with Dunnett’s multiple comparison test;
α=0.05; n=8 independent preparations).
MAO-A gene expression in U-118 MG cells did not vary significantly from control
expression after 5 days continuous treatment with nicotine or QTPM (Fig. 51a). As
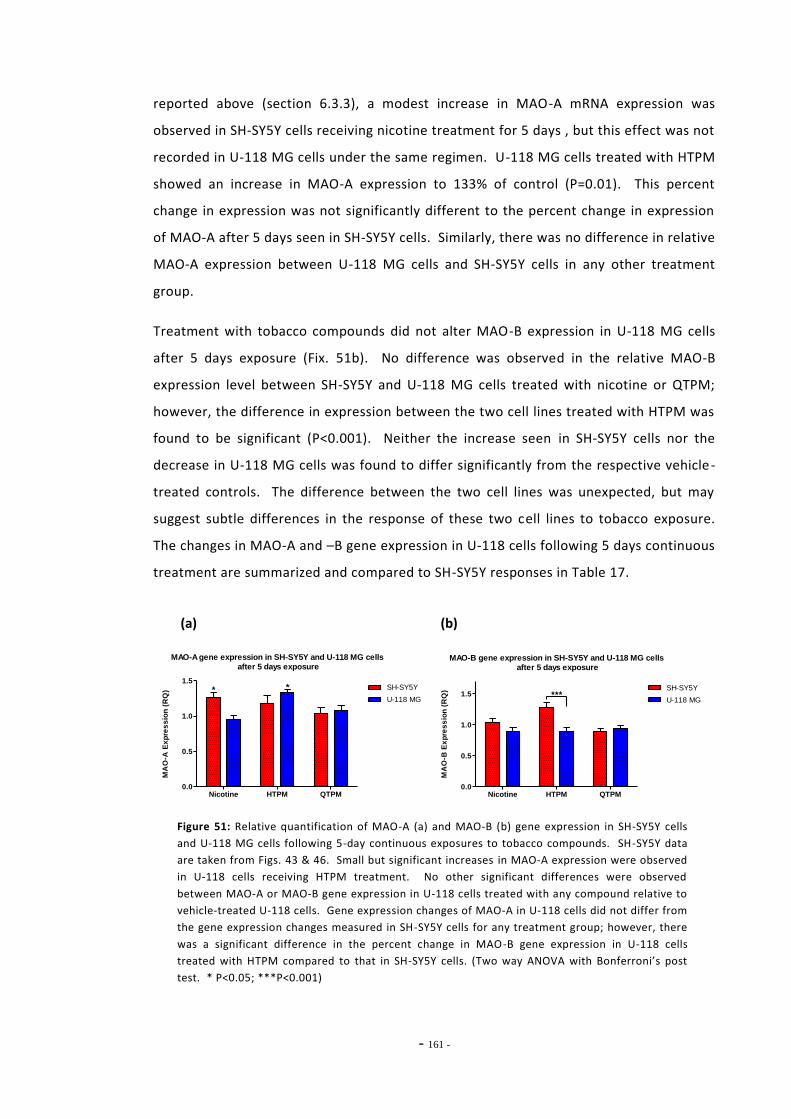
- 161 -
reported above (section 6.3.3), a modest increase in MAO-A mRNA expression was
observed in SH-SY5Y cells receiving nicotine treatment for 5 days , but this effect was not
recorded in U-118 MG cells under the same regimen. U-118 MG cells treated with HTPM
showed an increase in MAO-A expression to 133% of control (P=0.01). This percent
change in expression was not significantly different to the percent change in expression
of MAO-A after 5 days seen in SH-SY5Y cells. Similarly, there was no difference in relative
MAO-A expression between U-118 MG cells and SH-SY5Y cells in any other treatment
group.
Treatment with tobacco compounds did not alter MAO-B expression in U-118 MG cells
after 5 days exposure (Fix. 51b). No difference was observed in the relative MAO-B
expression level between SH-SY5Y and U-118 MG cells treated with nicotine or QTPM;
however, the difference in expression between the two cell lines treated with HTPM was
found to be significant (P<0.001). Neither the increase seen in SH-SY5Y cells nor the
decrease in U-118 MG cells was found to differ significantly from the respective vehicle -
treated controls. The difference between the two cell lines was unexpected, but may
suggest subtle differences in the response of these two cell lines to tobacco exposure.
The changes in MAO-A and –B gene expression in U-118 cells following 5 days continuous
treatment are summarized and compared to SH-SY5Y responses in Table 17.
(a) (b)
MAO-A gene expression in SH-SY5Y and U-118 MG cells
after 5 days exposure
Nicotine HTPM QTPM0.0
0.5
1.0
1.5SH-SY5Y
U-118 MG
* *
MA
O-A
Ex
pre
ss
ion
(R
Q)
MAO-B gene expression in SH-SY5Y and U-118 MG cells
after 5 days exposure
Nicotine HTPM QTPM0.0
0.5
1.0
1.5SH-SY5Y
U-118 MG***
MA
O-B
Ex
pre
ss
ion
(R
Q)
Figure 51: Relative quantification of MAO-A (a) and MAO-B (b) gene expression in SH-SY5Y cells
and U-118 MG cells following 5-day continuous exposures to tobacco compounds. SH-SY5Y data
are taken from Figs. 43 & 46. Small but significant increases in MAO-A expression were observed
in U-118 cells receiving HTPM treatment. No other significant differences were observed
between MAO-A or MAO-B gene expression in U-118 cells treated with any compound relative to
vehicle-treated U-118 cells. Gene expression changes of MAO-A in U-118 cells did not differ from
the gene expression changes measured in SH-SY5Y cells for any treatment group; however, there
was a significant difference in the percent change in MAO-B gene expression in U-118 cells
treated with HTPM compared to that in SH-SY5Y cells. (Two way ANOVA with Bonferroni’s post
test. * P<0.05; ***P<0.001)
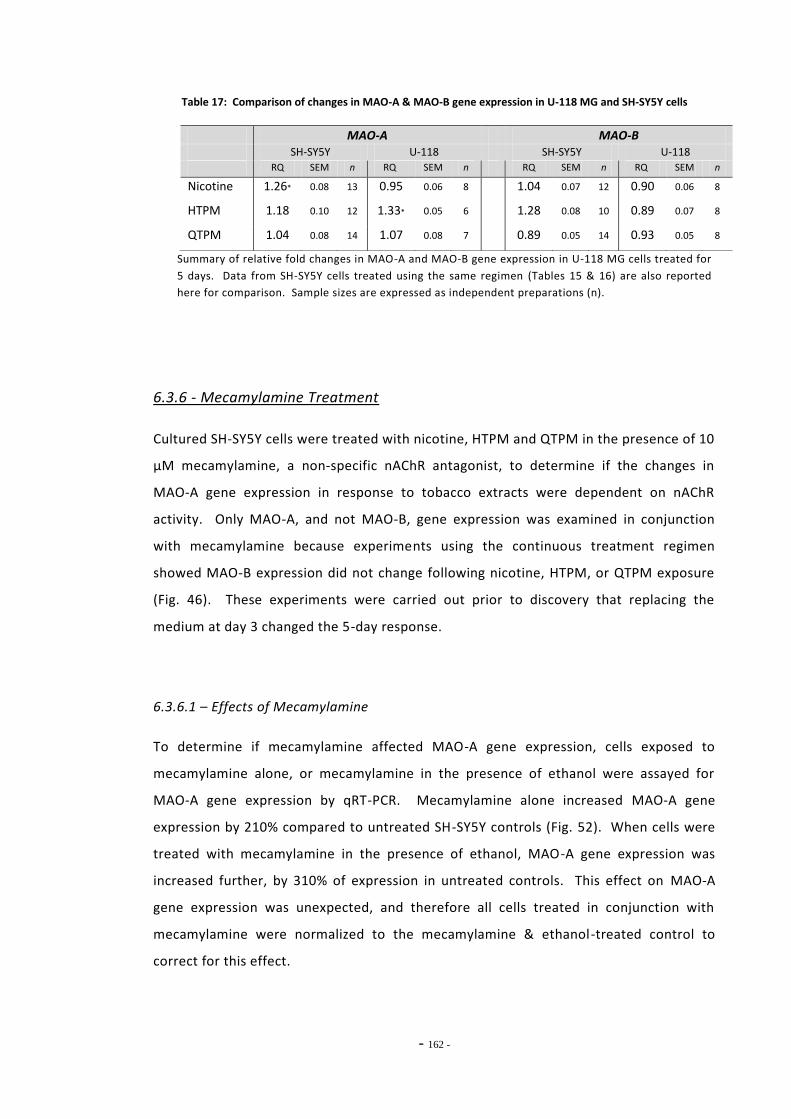
- 162 -
Table 17: Comparison of changes in MAO-A & MAO-B gene expression in U-118 MG and SH-SY5Y cells
Summary of relative fold changes in MAO-A and MAO-B gene expression in U-118 MG cells treated for
5 days. Data from SH-SY5Y cells treated using the same regimen (Tables 15 & 16) are also reported
here for comparison. Sample sizes are expressed as independent preparations (n).
6.3.6 - Mecamylamine Treatment
Cultured SH-SY5Y cells were treated with nicotine, HTPM and QTPM in the presence of 10
μM mecamylamine, a non-specific nAChR antagonist, to determine if the changes in
MAO-A gene expression in response to tobacco extracts were dependent on nAChR
activity. Only MAO-A, and not MAO-B, gene expression was examined in conjunction
with mecamylamine because experiments using the continuous treatment regimen
showed MAO-B expression did not change following nicotine, HTPM, or QTPM exposure
(Fig. 46). These experiments were carried out prior to discovery that replacing the
medium at day 3 changed the 5-day response.
6.3.6.1 – Effects of Mecamylamine
To determine if mecamylamine affected MAO-A gene expression, cells exposed to
mecamylamine alone, or mecamylamine in the presence of ethanol were assayed for
MAO-A gene expression by qRT-PCR. Mecamylamine alone increased MAO-A gene
expression by 210% compared to untreated SH-SY5Y controls (Fig. 52). When cells were
treated with mecamylamine in the presence of ethanol, MAO-A gene expression was
increased further, by 310% of expression in untreated controls. This effect on MAO-A
gene expression was unexpected, and therefore all cells treated in conjunction with
mecamylamine were normalized to the mecamylamine & ethanol-treated control to
correct for this effect.
MAO-A MAO-B
SH-SY5Y U-118 SH-SY5Y U-118
RQ SEM n RQ SEM n RQ SEM n RQ SEM n
Nicotine 1.26* 0.08 13 0.95 0.06 8 1.04 0.07 12 0.90 0.06 8
HTPM 1.18 0.10 12 1.33* 0.05 6 1.28 0.08 10 0.89 0.07 8
QTPM 1.04 0.08 14 1.07 0.08 7 0.89 0.05 14 0.93 0.05 8
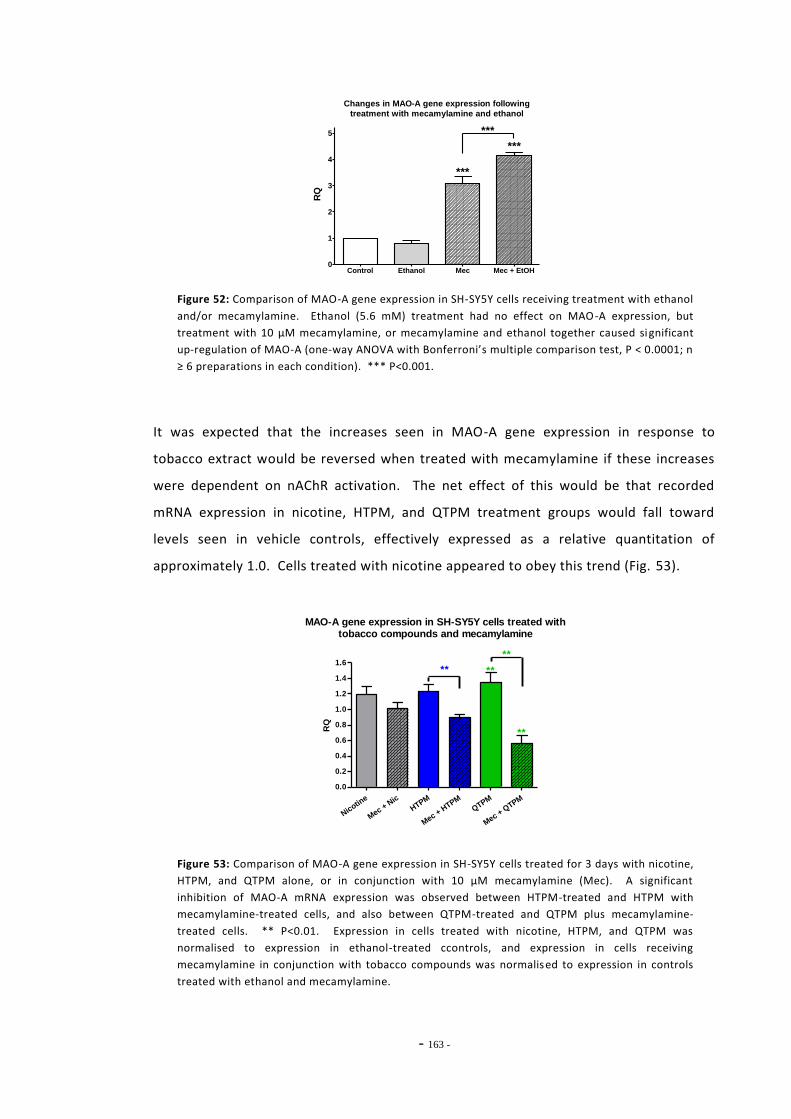
- 163 -
Changes in MAO-A gene expression following
treatment with mecamylamine and ethanol
Control Ethanol Mec Mec + EtOH0
1
2
3
4
5
***
***
***
RQ
Figure 52: Comparison of MAO-A gene expression in SH-SY5Y cells receiving treatment with ethanol
and/or mecamylamine. Ethanol (5.6 mM) treatment had no effect on MAO-A expression, but
treatment with 10 μM mecamylamine, or mecamylamine and ethanol together caused significant
up-regulation of MAO-A (one-way ANOVA with Bonferroni’s multiple comparison test, P < 0.0001; n
≥ 6 preparations in each condition). *** P<0.001.
It was expected that the increases seen in MAO-A gene expression in response to
tobacco extract would be reversed when treated with mecamylamine if these increases
were dependent on nAChR activation. The net effect of this would be that recorded
mRNA expression in nicotine, HTPM, and QTPM treatment groups would fall toward
levels seen in vehicle controls, effectively expressed as a relative quantitation of
approximately 1.0. Cells treated with nicotine appeared to obey this trend (Fig. 53).
MAO-A gene expression in SH-SY5Y cells treated withtobacco compounds and mecamylamine
Nicotin
e
Mec +
Nic
HTPM
Mec +
HTPM
QTPM
Mec +
QTPM
0.0
0.2
0.4
0.6
0.8
1.0
1.2
1.4
1.6**
**
**
**RQ
Figure 53: Comparison of MAO-A gene expression in SH-SY5Y cells treated for 3 days with nicotine,
HTPM, and QTPM alone, or in conjunction with 10 μM mecamylamine (Mec). A significant
inhibition of MAO-A mRNA expression was observed between HTPM-treated and HTPM with
mecamylamine-treated cells, and also between QTPM-treated and QTPM plus mecamylamine-
treated cells. ** P<0.01. Expression in cells treated with nicotine, HTPM, and QTPM was
normalised to expression in ethanol-treated ccontrols, and expression in cells receiving
mecamylamine in conjunction with tobacco compounds was normalised to expression in controls
treated with ethanol and mecamylamine.
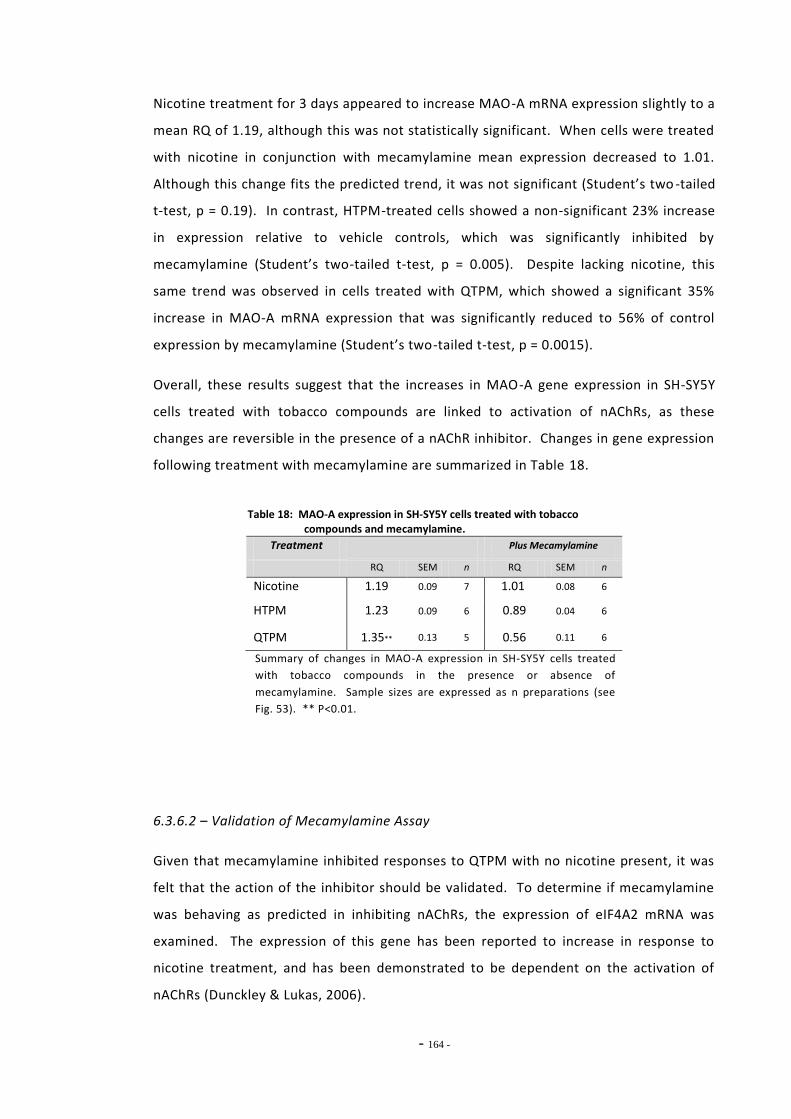
- 164 -
Nicotine treatment for 3 days appeared to increase MAO-A mRNA expression slightly to a
mean RQ of 1.19, although this was not statistically significant. When cells were treated
with nicotine in conjunction with mecamylamine mean expression decreased to 1.01.
Although this change fits the predicted trend, it was not significant (Student’s two -tailed
t-test, p = 0.19). In contrast, HTPM-treated cells showed a non-significant 23% increase
in expression relative to vehicle controls, which was significantly inhibited by
mecamylamine (Student’s two-tailed t-test, p = 0.005). Despite lacking nicotine, this
same trend was observed in cells treated with QTPM, which showed a significant 35%
increase in MAO-A mRNA expression that was significantly reduced to 56% of control
expression by mecamylamine (Student’s two-tailed t-test, p = 0.0015).
Overall, these results suggest that the increases in MAO-A gene expression in SH-SY5Y
cells treated with tobacco compounds are linked to activation of nAChRs, as these
changes are reversible in the presence of a nAChR inhibitor. Changes in gene expression
following treatment with mecamylamine are summarized in Table 18.
Table 18: MAO-A expression in SH-SY5Y cells treated with tobacco compounds and mecamylamine.
Treatment Plus Mecamylamine
RQ SEM n RQ SEM n
Nicotine 1.19 0.09 7 1.01 0.08 6
HTPM 1.23 0.09 6 0.89 0.04 6
QTPM 1.35** 0.13 5 0.56 0.11 6
Summary of changes in MAO-A expression in SH-SY5Y cells treated
with tobacco compounds in the presence or absence of
mecamylamine. Sample sizes are expressed as n preparations (see
Fig. 53). ** P<0.01.
6.3.6.2 – Validation of Mecamylamine Assay
Given that mecamylamine inhibited responses to QTPM with no nicotine present, it was
felt that the action of the inhibitor should be validated. To determine if mecamylamine
was behaving as predicted in inhibiting nAChRs, the expression of eIF4A2 mRNA was
examined. The expression of this gene has been reported to increase in response to
nicotine treatment, and has been demonstrated to be dependent on the activation of
nAChRs (Dunckley & Lukas, 2006).
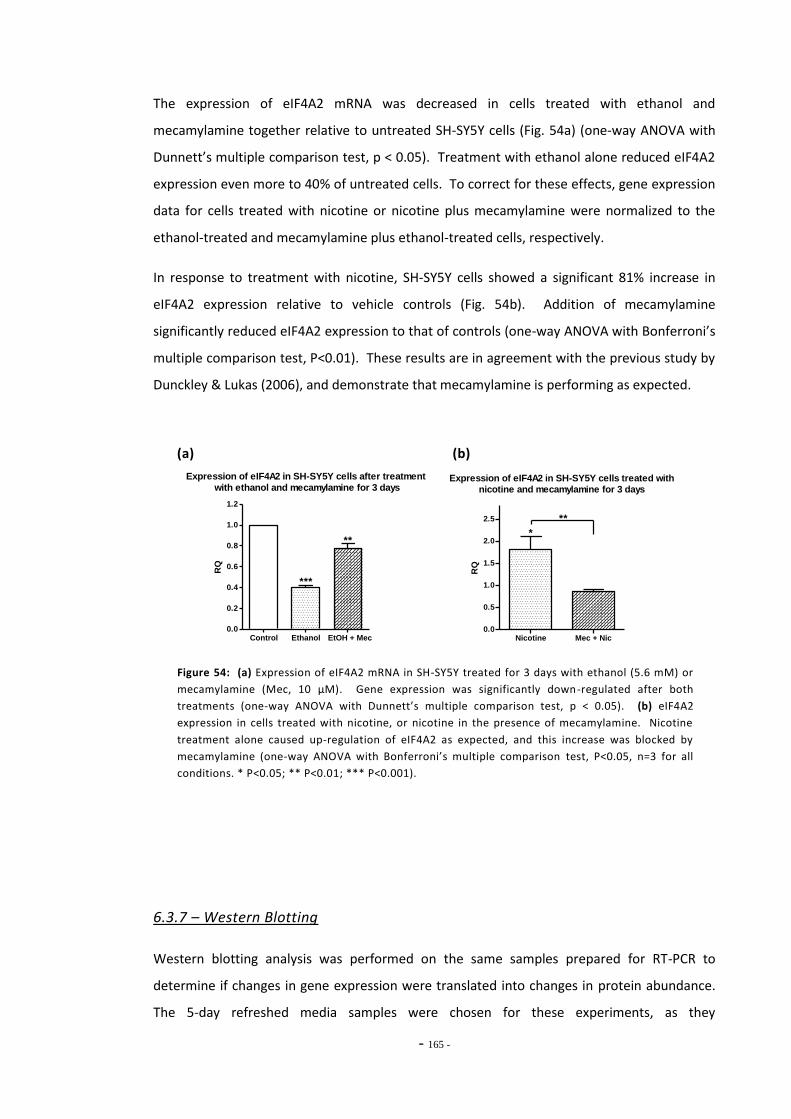
- 165 -
The expression of eIF4A2 mRNA was decreased in cells treated with ethanol and
mecamylamine together relative to untreated SH-SY5Y cells (Fig. 54a) (one-way ANOVA with
Dunnett’s multiple comparison test, p < 0.05). Treatment with ethanol alone reduced eIF4A2
expression even more to 40% of untreated cells. To correct for these effects, gene expression
data for cells treated with nicotine or nicotine plus mecamylamine were normalized to the
ethanol-treated and mecamylamine plus ethanol-treated cells, respectively.
In response to treatment with nicotine, SH-SY5Y cells showed a significant 81% increase in
eIF4A2 expression relative to vehicle controls (Fig. 54b). Addition of mecamylamine
significantly reduced eIF4A2 expression to that of controls (one-way ANOVA with Bonferroni’s
multiple comparison test, P<0.01). These results are in agreement with the previous study by
Dunckley & Lukas (2006), and demonstrate that mecamylamine is performing as expected.
(a) (b)
Expression of eIF4A2 in SH-SY5Y cells after treatment
with ethanol and mecamylamine for 3 days
Control Ethanol EtOH + Mec0.0
0.2
0.4
0.6
0.8
1.0
1.2
***
**
RQ
Expression of eIF4A2 in SH-SY5Y cells treated with
nicotine and mecamylamine for 3 days
Nicotine Mec + Nic0.0
0.5
1.0
1.5
2.0
2.5
*
**
RQ
Figure 54: (a) Expression of eIF4A2 mRNA in SH-SY5Y treated for 3 days with ethanol (5.6 mM) or
mecamylamine (Mec, 10 μM). Gene expression was significantly down -regulated after both
treatments (one-way ANOVA with Dunnett’s multiple comparison test, p < 0.05). (b) eIF4A2
expression in cells treated with nicotine, or nicotine in the presence of mecamylamine. Nicotine
treatment alone caused up-regulation of eIF4A2 as expected, and this increase was blocked by
mecamylamine (one-way ANOVA with Bonferroni’s multiple comparison test, P<0.05, n=3 for all
conditions. * P<0.05; ** P<0.01; *** P<0.001).
6.3.7 – Western Blotting
Western blotting analysis was performed on the same samples prepared for RT-PCR to
determine if changes in gene expression were translated into changes in protein abundance.
The 5-day refreshed media samples were chosen for these experiments, as they
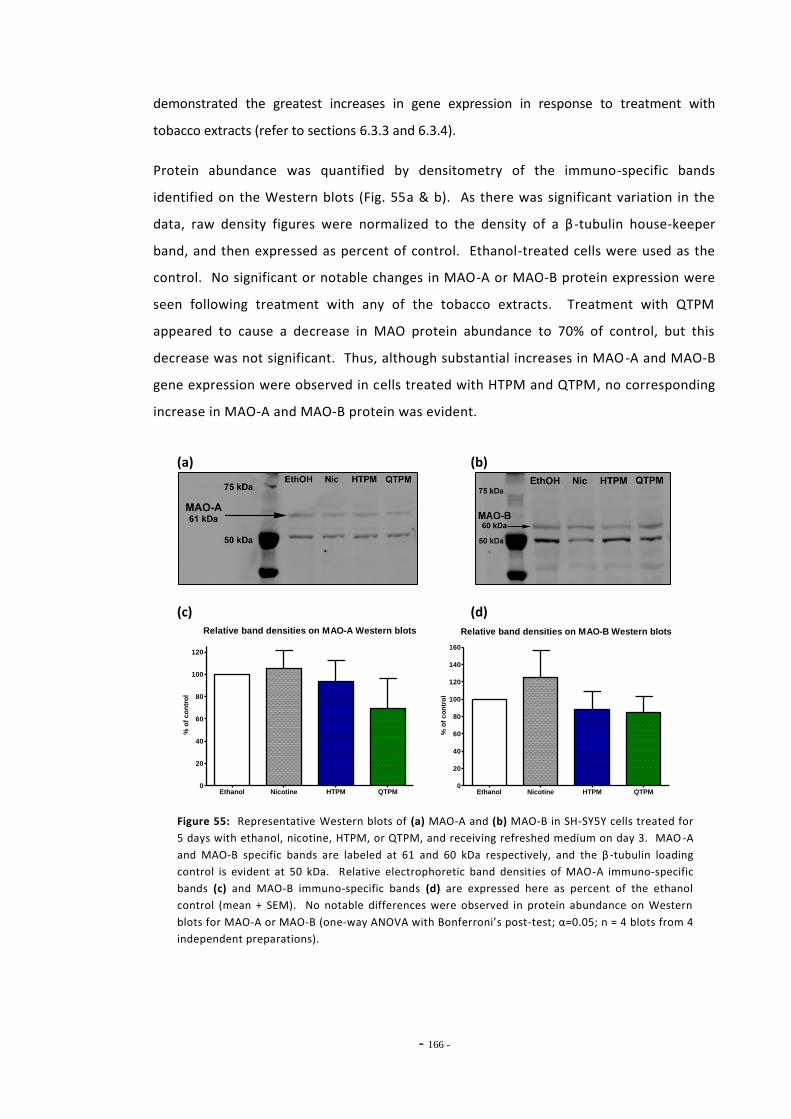
- 166 -
demonstrated the greatest increases in gene expression in response to treatment with
tobacco extracts (refer to sections 6.3.3 and 6.3.4).
Protein abundance was quantified by densitometry of the immuno-specific bands
identified on the Western blots (Fig. 55a & b). As there was significant variation in the
data, raw density figures were normalized to the density of a β -tubulin house-keeper
band, and then expressed as percent of control. Ethanol-treated cells were used as the
control. No significant or notable changes in MAO-A or MAO-B protein expression were
seen following treatment with any of the tobacco extracts. Treatment with QTPM
appeared to cause a decrease in MAO protein abundance to 70% of control, but this
decrease was not significant. Thus, although substantial increases in MAO-A and MAO-B
gene expression were observed in cells treated with HTPM and QTPM, no corresponding
increase in MAO-A and MAO-B protein was evident.
(a) (b)
(c) (d) Relative band densities on MAO-A Western blots
Ethanol Nicotine HTPM QTPM0
20
40
60
80
100
120
% o
f c
on
tro
l
Relative band densities on MAO-B Western blots
Ethanol Nicotine HTPM QTPM0
20
40
60
80
100
120
140
160
% o
f c
on
tro
l
Figure 55: Representative Western blots of (a) MAO-A and (b) MAO-B in SH-SY5Y cells treated for
5 days with ethanol, nicotine, HTPM, or QTPM, and receiving refreshed medium on day 3. MAO -A
and MAO-B specific bands are labeled at 61 and 60 kDa respectively, and the β -tubulin loading
control is evident at 50 kDa. Relative electrophoretic band densities of MAO-A immuno-specific
bands (c) and MAO-B immuno-specific bands (d) are expressed here as percent of the ethanol
control (mean + SEM). No notable differences were observed in protein abundance on Western
blots for MAO-A or MAO-B (one-way ANOVA with Bonferroni’s post-test; α=0.05; n = 4 blots from 4
independent preparations).
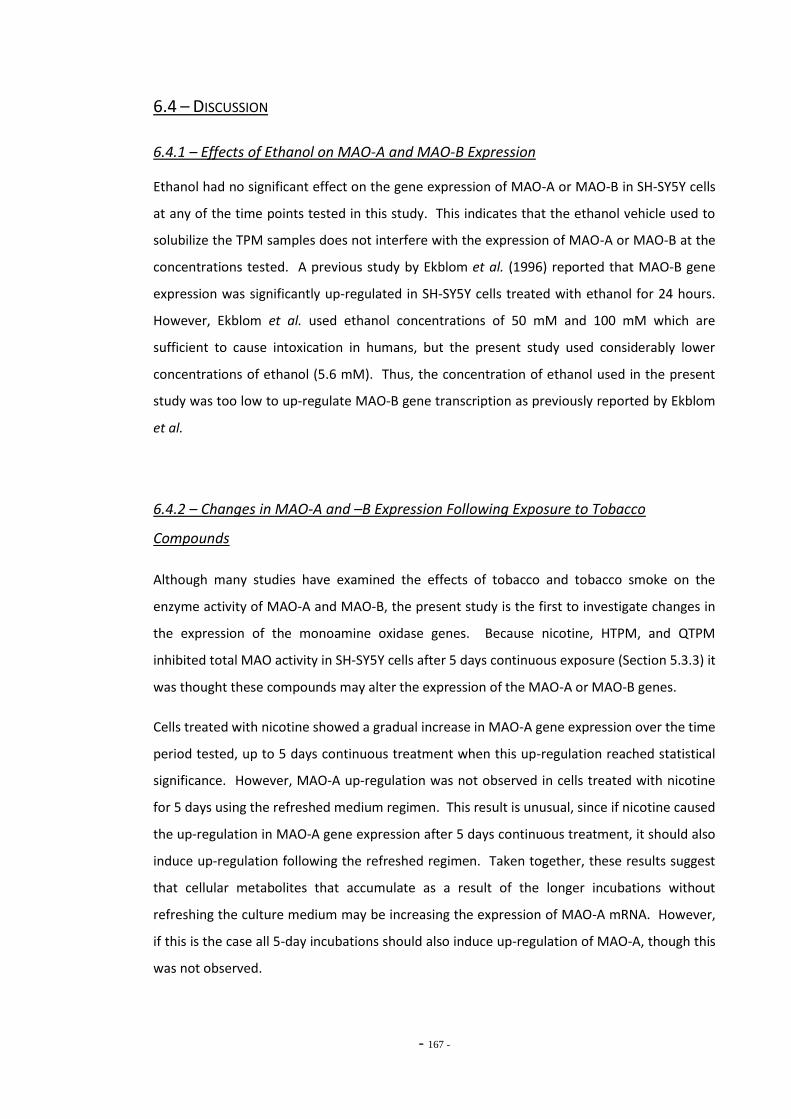
- 167 -
6.4 – DISCUSSION
6.4.1 – Effects of Ethanol on MAO-A and MAO-B Expression
Ethanol had no significant effect on the gene expression of MAO-A or MAO-B in SH-SY5Y cells
at any of the time points tested in this study. This indicates that the ethanol vehicle used to
solubilize the TPM samples does not interfere with the expression of MAO-A or MAO-B at the
concentrations tested. A previous study by Ekblom et al. (1996) reported that MAO-B gene
expression was significantly up-regulated in SH-SY5Y cells treated with ethanol for 24 hours.
However, Ekblom et al. used ethanol concentrations of 50 mM and 100 mM which are
sufficient to cause intoxication in humans, but the present study used considerably lower
concentrations of ethanol (5.6 mM). Thus, the concentration of ethanol used in the present
study was too low to up-regulate MAO-B gene transcription as previously reported by Ekblom
et al.
6.4.2 – Changes in MAO-A and –B Expression Following Exposure to Tobacco
Compounds
Although many studies have examined the effects of tobacco and tobacco smoke on the
enzyme activity of MAO-A and MAO-B, the present study is the first to investigate changes in
the expression of the monoamine oxidase genes. Because nicotine, HTPM, and QTPM
inhibited total MAO activity in SH-SY5Y cells after 5 days continuous exposure (Section 5.3.3) it
was thought these compounds may alter the expression of the MAO-A or MAO-B genes.
Cells treated with nicotine showed a gradual increase in MAO-A gene expression over the time
period tested, up to 5 days continuous treatment when this up-regulation reached statistical
significance. However, MAO-A up-regulation was not observed in cells treated with nicotine
for 5 days using the refreshed medium regimen. This result is unusual, since if nicotine caused
the up-regulation in MAO-A gene expression after 5 days continuous treatment, it should also
induce up-regulation following the refreshed regimen. Taken together, these results suggest
that cellular metabolites that accumulate as a result of the longer incubations without
refreshing the culture medium may be increasing the expression of MAO-A mRNA. However,
if this is the case all 5-day incubations should also induce up-regulation of MAO-A, though this
was not observed.
- 168 -
No consistent changes in MAO-A gene expression were observed in cells treated with HTPM
or QTPM for up to 5 days of continuous exposure, although QTPM increased gene expression
at 3 days, but this fell back to baseline levels after 5 days. In contrast, treatment with both of
these tobacco smoke extracts using the refreshed medium regimen significantly increased the
expression of MAO-A to more than three times the expression of untreated cells. Similarly,
although these TPM samples had no effect on the gene expression of MAO-B after up to 5
days continuous treatment, exposure using the refreshed regimen caused a significant
increase in MAO-B mRNA expression. In both cases, there was no difference in the up-
regulation induced by either HTPM, or QTPM, implying non-nicotine components of tobacco
smoke are responsible for this effect. Since tobacco extracts are known to inhibit MAO-A and
MAO-B enzyme activity, this increase in mRNA expression could indicate the cells are up-
regulating transcription of these genes to compensate for the enzymatic inhibition in an
attempt to maintain a homeostatic level of MAO activity. The present study found an increase
in total MAO enzyme activity in SH-SY5Y cells following exposure to HTPM and QTPM using
the refreshed medium regimen (Section 5.3.3) (although the increase was significant for
HTPM only), which is in agreement with this hypothesis. However, Western blotting analysis
showed no significant increase in the amount of MAO-A or –B protein. This may indicate that
MAO mRNA is being degraded before translation, or that tobacco smoke extracts cause an
increase in the turn-over of MAO-A and MAO-B proteins. Additionally, this lack of correlation
between mRNA transcription and protein abundance is not uncommon, and many studies
examining individual gene and gene product data find only a weak, or no correlation
(Greenbaum et al., 2002). Several reasons have been proposed for this, including differences
in the half life of the protein in vivo, translational regulation, and a significant amount of
experimental error and variation with respect to different conditions and techniques (Nie et
al., 2006). This last factor may be applicable to the present study, as protein abundance was
assessed by Western blotting, which is considered a semi-quantitative technique.
Since the present study is the first to examine MAO-A and MAO-B gene expression in response
to nicotine and tobacco smoke extracts, there is currently little information available to
corroborate the findings and put them in context to tobacco addiction. However interestingly,
a recent study has proposed that tobacco exposure induces increases in MAO-A and MAO-B
gene expression through epigenetic regulation of the gene promoter (Launay et al., 2009).
Their study investigated MAO-B activity in the platelets of dependent smokers and found that
former smokers had a significantly greater platelet MAO-B activity than either current
smokers or subjects who had never smoked. Upon further investigation this was attributed to
- 169 -
higher concentrations of MAO enzyme in the platelets of former smokers. Their study found
that both smokers and former smokers had increased platelet MAO-B concentrations implying
that smoking up-regulated MAO-B and this increased expression persisted long after quitting
smoking, suggesting a smoking-induced modification of the MAO-B gene. The MAO-B core
promoter contains a number of CpG sites that can be methylated, which reduces transcription
of the MAO-B gene, and further genetic analysis showed never-smokers had a much higher
methylation frequency at each of the CpG sites in the promoter. They verified that tobacco
smoke was responsible for these changes in gene methylation, demonstrating that nucleic
acid demethylase activity was significantly higher in lung preparations of mice exposed to
tobacco smoke. Moreover, they also demonstrated that nucleic acid demethylase activity was
increased by treatment with harman and nor-harman, two known MAO inhibitors present in
tobacco smoke. To summarize, the findings of Launay et al. (2009) strongly suggest that
exposure to tobacco smoke reduces methylation of the MAO-B promoter through increased
activity of nucleic acid methyltransferase, resulting in up-regulation of MAO-B gene
expression. This is manifested as an increase in platelet MAO-B protein which endures after
tobacco smoke exposure is ceased. Overall platelet MAO activity in current smokers remains
inhibited due to the ongoing exposure to MAO inhibitors in tobacco smoke, while MAO
activity in former smokers is higher as they are no longer exposed to these inhibitors.
An earlier study by Pinsonneault et al. (2006) reported that the MAO-A gene was also subject
to significant methylation at CpG sites in the promoter region. In a complex study
investigating the epigenetic and genetic factors associated with MAO-A gene regulation in
human brain samples, they found that cis-acting factors had a strong influence on mRNA
expression. Female samples showed extensive and variable methylation of CpG sites, but the
degree of methylation was not correlated with mRNA expression. Genetic polymorphisms
were also found to influence MAO-A mRNA expression, but could not completely account for
regulation of the gene. Pinsonneault et al. (2006) concluded that both genetic and epigentic
factors contributed in a similar manner to MAO-A mRNA expression in females, and proposed
that MAO-A promoter methylation modulates transcription of the gene. Ineterestingly, this
study reported male samples showed no significant methylation of the MAO-A gene locus. It
is unknown how these differences in promoter methylation may affect protein expression or
monoamine metabolism in vivo (Pinsonneault et al., 2006).
The findings of Launay et al. (2009) are relevant to the present study, since the present study
found exposure to tobacco smoke extracts induced an increase in total MAO enzyme activity
- 170 -
(section 5.3.3), and up-regulation of MAO-A and MAO-B gene expression (Fig. 44d & 47d) in
SH-SY5Y cells. Further investigation is warranted to determine if these changes in MAO
activity and expression in SH-SY5Y cells also result from demethylation of the promoter
regions by increased nucleic acid demethylase activity.
However, as discussed previously, cell culture conditions are a significant factor in the
behavior of the cells used in this study. Although flasks of cells treated for 3 and 5 days
continuously had not reached complete confluence it is likely they may have suffered from
nutrient depletion or negative effects from cellular metabolites as a result of the longer
exposure periods. To avoid these effects it would be preferable to culture cells using a
continuous perfusion culture system, as mentioned in section 5.3.3 of this thesis, or to
change the medium daily. Since this perfusion system was not available to the
experimenter, the refreshed medium treatment regimen was employed in an attempt to
counter some of the effects of longer cell exposures.
6.4.3 – Effects of Mecamylamine Treatment on MAO-A Gene Expression
Initially, gene expression was measured for SH-SY5Y cells treated with tobacco compounds for
1, 3, or 5 days continuously, and the results from those experiments informed the
experimental design for the mecamylamine experiments. As discussed above, MAO-A gene
expression increased significantly in cells treated with QTPM for three days, but no change
was observed in cells treated with nicotine or tobacco smoke extract. This questioned the
role of nicotine in the MAO-A response, since QTPM lacks nicotine. To identify whether
nAChR activation was required to induce changes in MAO gene expression, cells were
incubated with tobacco compounds in the presence of mecamylamine for three days, and
only MAO-A gene expression was assayed. If MAO-A gene expression was regulated through a
nAChR-dependant signaling mechanism, then treatment with the nAChR antagonist
mecamylamine should reverse any changes in MAO-A expression observed.
When SH-SY5Y cells were treated with mecamylamine MAO-A mRNA expression was
significantly up-regulated compared to untreated controls. This result was unexpected, and is
difficult to explain, since no direct interaction is known between mecamylamine and MAO-A.
In their earlier study, Dunckley & Lukas (2006) reported that mecamylamine altered the
expression of a number of genes in SH-SY5Y, causing effects similar to those of nicotine alone.
While it is possible that mecamylamine may act via a secondary non-nAChR path to indirectly
- 171 -
affect the expression of a number of genes, these findings also suggest regulation of MAO-A
gene expression in SH-SY5Y cells is dependent on an endogenous cholinergic signaling
mechanism that is inhibited by mecamylamine exposure. While this may be the case in vivo, it
is not certain whether SH-SY5Y cells exhibit this endogenous signaling (Dunckley & Lukas,
2006).
In cells treated for 3 days continuously, MAO-A gene expression seemed to increase slightly
with exposure to nicotine and HTPM, and more so with QTPM exposure. However, when
mecamylamine was added, all of these increases were abolished. These results imply that
inhibition of nAChRs has reversed the tobacco smoke-induced increases in MAO-A expression,
suggesting that tobacco smoke extracts influence regulation of MAO-A gene expression
through a nAChR-dependent mechanism. This finding is significant, since this response was
recorded in the nicotine-free QTPM-treated cells, indicating that non-nicotine components of
tobacco smoke can induce significant cellular effects through activation of nAChRs. However,
the results of this experiment should be interpreted with caution, since the origin of
mecamylamine’s effect on MAO-A expression is not known.
Furthermore, this experiment examined the effect of mecamylamine on gene expression
changes after 3 days continuous treatment with tobacco compounds. However, subsequent
research found mRNA expression of both MAO-A and MAO-B was more profoundly affected
when cells were treated with nicotine and tobacco smoke extracts using the 5-day refreshed
medium regimen. It would be interesting to test the effects of mecamylamine on the
significant up-regulation of MAO-A and MAO-B observed in cells treated with nicotine, HTPM,
and QTPM using this exposure regimen. If indeed mecamylamine does block up-regulation in
cells receiving tobacco extracts in the refreshed medium regimen, this would add further
weight to the tentative conclusion that MAO-A is up-regulated by a nAChR-dependent
mechanism. Unfortunately, these experiments were not carried out in the present study as
they were considered too time consuming and costly to repeat.
6.4.4 – MAO-A and MAO-B Gene Expression in U-118 MG Glioma Cells
The present study used the U-118 MG human glioma cell line as an in vitro model of the
physiological behavior of glial cells in the CNS, as discussed in section 2.1.2. The effects of
tobacco smoke extracts on MAO-A and –B gene expression were examined in this cell line,
and were compared to the changes in gene expression induced by these extracts in the SH-
- 172 -
SY5Y human neuroblastoma cell line. The hypothesis was that glia and astrocytes may
respond differently to tobacco smoke than neuronal cells. Untreated U-118 MG cells
expressed considerably lower levels of MAO-A and MAO-B mRNA than untreated SH-SY5Y
cells. This is consistent with the earlier finding of this study that total MAO enzyme activity in
this cell line was very low, and near the detection limits for the enzymatic assay used (section
5.3.4). As discussed previously, a number of studies have reported very high levels of MAO
activity in astrocytes and glia in the CNS and therefore the poor enzyme activity measured in
U-118 MG cells may indicate this cell line is an unsuitable model of in vivo glial functioning.
Although MAO-A and MAO-B mRNA levels were considerably lower in U-118 MG cells, these
genes seemed to respond to the compounds tested in a similar manner to SH-SY5Y cells. No
changes in MAO-A or MAO-B gene expression were observed in U-118 MG cells treated with
ethanol for 5 days, and the relative expression levels of these genes were no different from
the relative expression observed in SH-SY5Y cells treated with ethanol under the same
regimen. Neither nicotine, nor QTPM caused any change in MAO-A expression in U-118 MG
cells, and although HTPM induced a slightly significant up-regulation in U-118 MG cells, the
relative expression in these cells was not significantly different from that seen in SH-SY5Y cells.
Similarly, none of the tobacco compounds tested caused any change in MAO-B gene
expression in U-118 MG cells or SH-SY5Y cells over 5 days.
These results indicate that nicotine and tobacco smoke extracts do not influence the
regulation and expression of MAO-A and –B genes in glial cells. However, a major limitation of
the current experiment is that gene expression was examined at only one time point. This
decision was made because significant setbacks were encountered in culturing the U-118 MG
cells, and resolving these difficulties proved very time consuming. The cells were treated
using the continuous 5-day exposure period as it was initially thought that prolonged
exposure to tobacco compounds would result in greater inhibition of enzyme activity, and
therefore a more pronounced effect (if any) on gene expression. However, the gene
expression and enzyme activity results obtained for SH-SY5Y cells demonstrated that
treatment with the shorter 3-day exposure or the 5-day refreshed medium regimen were
more effective at eliciting significant changes in MAO-A and –B mRNA expression. Therefore,
it would be interesting to re-examine MAO gene expression in U-118 MG cells treated with
under these exposure regimens to determine if these cells respond in the same manner as SH-
SY5Y. Nevertheless, any changes in U-118 MG gene expression in response to tobacco are
academic if they do not provide insights into regulation of those genes in vivo. Before this cell
- 173 -
line is used for further experiments with tobacco compounds, it should first be established
whether U-118 MG is a suitable model for glial function and signaling in the CNS. This should
involve experiments comparing the physiological function and gene expression of U-118 MG
with primary cultures of glial cells.
6.4.5 – Summary
The present study is the first to examine changes in MAO-A and MAO-B gene and protein
expression in response to nicotine and tobacco smoke extracts. Exposure to tobacco smoke
extracts caused a significant up-regulation in gene expression of both MAO-A and MAO-B
enzymes in SH-SY5Y cells treated for 5 days although no corresponding increase in MAO-A or –
B protein levels was seen. These results suggest that chronic exposure to tobacco smoke may
induce up-regulation of these genes in neuronal cells of human smokers, a possibility that has
some support from the findings of Launay et al. (2009). Blockade of this increase by the
nAChR antagonist, mecamylamine, indicated a potential role for nAChR in the up-regulation
observed, even in response to nicotine-free smoke extracts. However, the findings of the
present study should be interpreted with caution as the results obtained were highly
dependent on the cell culture conditions used to maintain the cells. Nevertheless, the results
obtained are intriguing, and warrant further investigation to determine the actual mechanism
of MAO-A and MAO-B up-regulation in neuronal cells.

- 174 -
Chapter Seven: Up-regulation of MOR gene expression following tobacco exposure
The μ opioid receptor (MOR) is an integral membrane protein involved in many vital
physiological and pharmacological functions (Loh & Smith, 1990; Minami & Satoh, 1995; Satoh
& Minami, 1995; Waldhoer et al., 2004). These include modulating respiratory rhythm,
gastrointestinal mobility, pain transmission, and mediating positive reinforcement in learning
behaviours. As discussed earlier (section 1.5.2), MOR activation can occur through the action
of a number of endogenous neuronal peptides such as β-endorphin, enkephalin, and the
endomorphins, and through the action of exogenous compounds and drugs of abuse.
Activation may arise in the classical way through direct agonist binding to the receptor, as
seen with morphine, or through indirect mechanisms as seen in MOR activation following
cocaine, alcohol, or nicotine administration (Contet et al., 2004). To examine the relationship
between MOR and nicotine and tobacco extract, a good understanding of normal MOR
regulation is needed.
Changes in the expression of MOR mRNA have been reported following acute and chronic
exposures to MOR agonists and antagonists. Much of the research in this area has focused on
the effects of morphine, a plant-derived alkaloid drug used clinically as a potent analgesic.
Morphine is the prototypical exogenous MOR agonist, selectively binding to MOR with high
affinity, but also activating the other classical opioid receptors, delta and kappa. However,
morphine also carries a high potential to induce physical dependence to the drug, and rapidly
induces tolerance to its nociceptive effects. Previously it was thought that the biochemical
mechanisms mediating morphine tolerance and dependence may be due to dynamic changes
in receptor expression and desensitization. Many studies into MOR protein and gene
expression have focused on changes in these parameters as a consequence of chronic agonist
exposure. However, investigation of the effect of morphine on MOR mRNA expression has
been far from straight-forward, and a number of inconsistent or contradictory findings have
been reported.
- 175 -
In vitro studies in cultured cells have found that mRNA expression of MOR is decreased after
chronic exposure to morphine (X. Yu et al., 2003). Undifferentiated SH-SY5Y cells treated for
24 hours with 10 µM morphine showed a 47% reduction in MOR mRNA expression compared
to control cells, a decrease that was inhibited when morphine was co-administered with the
opioid receptor antagonist naloxone (X. Yu et al., 2003). These results are in agreement with
studies examining MOR binding density in SH-SY5Y cells following morphine treatment.
Zadina et al. (1993; Zadina et al., 1994) measured the abundance of cell surface MOR protein
in response to chronic morphine treatment by recording the specific binding of [3H]DAMGO
([3H]Tyr-D-Ala-Gly-N-Me-Phe-Gly-ol), a radio-labelled MOR-specific agonist and enkephalin
analogue. Morphine caused a significant dose-dependent decrease in [3H]DAMGO binding in
SH-SY5Y cells treated for 24 hours. MOR specific binding was reduced by up to 48% of control
values in cells treated with the highest morphine concentration (Zadina et al., 1993; Zadina et
al., 1994). This down-regulation of MOR was later found to be time-dependent, since
morphine treatment for 2.5 hours reduced MOR-specific binding by 28%, and by 50% after 24
hours treatment (Horner & Zadina, 2004). Chronic morphine treatment also decreased
[3H]DAMGO binding by 59% in C6 glial cells stably transfected to express MOR protein
(Yabaluri & Medzihradsky, 1997).
However, studies in vivo have reported variable findings for MOR abundance and expression
following morphine treatment, showing either down-regulation or no change in MOR density.
One study that examined rats chronically treated with i.p. morphine found no change in MOR
mRNA expression in the brains of animals treated for 7 days (Brodsky et al., 1995). Similarly,
in another study no change in DAMGO binding was observed in rats receiving morphine for 7
days (Patel et al., 2002). A third study found no significant differences in MOR mRNA
expression in the striatum, nucleus accumbens, or septum of rats treated with increasing
doses of morphine over 14 days (Castelli et al., 1997). In contrast, Teodorov et al. (2006),
using RT-PCR technology to amplify MOR mRNA from various areas of the female rat brain,
found regionally specific decreases in MOR gene expression following chronic morphine
treatments. When rats were treated chronically with 3.5 mg/kg morphine (i.p.) for 5 days,
reductions in MOR expression were seen in both the periaqueductal grey region and the
striatum – areas of the brain implicated in morphine tolerance and dependence (Teodorov et
al., 2006). Each of the above studies differed significantly with respect to morphine dosage,
treatment duration, and experimental design, and these differences are likely to account for
the differences in results obtained. However, taken together, these results suggest that any in
- 176 -
vivo changes in MOR expression following morphine treatment may be transient and highly
region-specific.
Interestingly, the effects of morphine on MOR mRNA expression differ markedly in
comparison to the changes in MOR expression observed following chronic exposure to
endogenous opioid peptides. Yu et al. (2003) demonstrated that chronic treatment with the
endogenous MOR agonists endomorphin-1 and -2 significantly increased MOR mRNA
expression. In SH-SY5Y cells treated with endomorphin-1, mRNA expression of MOR was
increased by 370% compared to the control, and cells treated with endomorphin-2 showed
increased expression of MOR to 250% of control. These increases were abolished when the
test compounds were administered with naloxone. Interestingly, endomorphin-1 and -2 did
not up-regulate MOR-specific binding density in SH-SY5Y cells when measured by [3H]DAMGO
binding (Horner & Zadina, 2004). Rather, the endomorphins reduced MOR-specific binding in
a time- and dose-dependent manner, with 10 µM endomorphin-1 inhibiting [3H]DAMGO
binding to the cells by 72% compared to control. This observation was found to be due to
receptor internalization, since down-regulation of MOR was reversed by treatment with
hypertonic sucrose which inhibits internalization. Similarly, β-endorphin induced a similar
decrease in MOR-specific binding following chronic treatment (Yabaluri & Medzihradsky,
1997). Together, these results imply that chronic exposure to endogenous µ opioids causes
internalization of MOR, and subsequent up-regulation of MOR gene expression occurs to
restore basal levels of MOR expression in the plasma membrane.
The effects of endomorphin seem to be in contrast to the effects of morphine which either
had no effect on transcription or caused a down-regulation of MOR abundance and mRNA
expression. This may be explained by agonist-dependent receptor signaling, a mechanism
that was first described for MOR (Contet et al., 2004; McConalogue et al., 1999). When an
agonist binds to MOR, the agonist-receptor complex determines the physiological outcome of
ligand binding, rather than the receptor itself. Through this mechanism, several different
biological outcomes are possible following activation of one receptor type. It is thought that
morphine binding stabilizes MOR in a different conformation to that induced by endogenous
MOR agonists, leading to initiation of different signal transduction pathways and different
intracellular sequelae (McConalogue et al., 1999). This is particularly evident with respect to
receptor internalization, as the endogenous β-endorphin, endomorphins, and enkaphalins
cause a rapid internalization of MOR, but morphine does not (Keith et al., 1997; Keith et al.,
1996; McConalogue et al., 1999). Horner & Zadina (2004) demonstrated that morphine is
- 177 -
capable of inducing receptor internalization in SH-SY5Y cells, but this response was
considerably slower than that seen with endomorphin-1.
7.1.2 – Drugs of Abuse
Changes in the expression of MOR have also been studied with respect to a number of other
non-opiate drugs of abuse. The effects of cocaine in particular have been studied extensively,
and this research is briefly reviewed here to provide insight into the effects of non-opiate
drugs on the expression of MOR.
Similar to the changes induced by endogenous opioid peptides, chronic cocaine exposure also
induces a significant up-regulation of MOR receptor binding and MOR gene expression
(Azaryan et al., 1996a; Azaryan et al., 1996b; Schroeder et al., 2003). However, unlike
morphine or the endogenous opioid peptides, cocaine does not bind to MOR but exerts its
neurochemical effects through binding to the dopamine transporter (DAT) and inhibiting the
re-uptake of dopamine from the synaptic cleft. This results in increased dopamine
accumulation in the synapse, particularly in the nucleus accumbens, which induces the
rewarding properties of the drug (Di Chiara et al., 2004).
Azaryan et al. (1996a, 1996b) demonstrated that continuous cocaine administration for 3 days
increased MOR mRNA expression in the nucleus accumbens of treated rats by at least 350% of
control. Co-administration of cocaine with D1 and D2 selective dopamine receptor
antagonists abolished the observed increase in MOR mRNA expression, demonstrating that
up-regulation of MOR gene expression following chronic cocaine administration was
dependent on dopaminergic mechanisms. Thus, it was postulated that increases in MOR gene
expression may be a result of excess synaptic dopamine concentrations induced by cocaine
(Azaryan et al., 1996a). This would also suggest that other drugs of abuse that cause
dopamine overflow in the accumbens may induce changes in MOR gene expression. In fact
this appears to be the case. Although there has been little research in this area, studies have
reported that ethanol exposure can decrease MOR mRNA expression in some areas of rat
brain (Winkler et al., 1998), amphetamine causes up- and down-regulation of MOR mRNA in
different regions of rat brain (Vecchiola et al., 1999), and cannabinoids up-regulate MOR
mRNA expression in mouse brain (Paldyova et al., 2007). One theory is that these changes are
- 178 -
due to a drug-induced increase in the endogenous MOR ligands, β-endorphin and the
endomorphins, following increased dopamine release (Roth-Deri et al., 2008). Thus, the
observed MOR up-regulation may result from endogenous opioid ligand activation of the
receptor.
If this is the case, one would expect chronic nicotine and tobacco exposure to also induce up-
regulation of MOR. Since like cocaine, nicotine induces dopamine overflow in the nucleus
accumbens, it may also cause up-regulation of endogenous opioid peptides, leading to
increased MOR gene expression. Several studies have reported an increase in opioid peptide
levels in the brains of rodents exposed to nicotine (Dhatt et al., 1995; Houdi et al., 1998).
Dhatt et al. (1995) treated mice acutely with a single dose of 1 mg/kg nicotine before
sacrificing the animals up to 24 hours later. Mice were also treated chronically with the same
dose of nicotine daily for 14 days before sacrifice. In contrast, Houdi et al. (1998) treated
Sprague-Dawley rats with 0.6 mg/kg nictoine once before sacrificing the rats up to six hours
later, and chronically treated rats were treated twice daily for 14 days. These studies
examined changes in the expression of preproenkephalin (PPE) mRNA, a precursor of the
endogenous MOR ligand enkephalin, in response to different nicotine treatments. Both
chronic and acute nicotine treatments increased the expression of PPE in the striatum and
hippocampus of rodents. However, in contrast, another study by Wewers et al. (1999) treated
rats with 0.3 mg/kg of nicotine three times daily for 14 days, and found that chronic nicotine
treatment decreased met-enkephalin levels in the striatum of rats by up to 50% (Wewers et
al., 1999).
The results of research examining the effects of nicotine treatment on β-endorphin release
are similarly inconsistent. Early studies reported that cigarette smoking caused an increase in
the plasma levels of β-endorphin in smokers (Pomerleau et al., 1983a), and that nicotine also
stimulated the release of β-endorphin in isolated, perfused mouse brain (Marty et al., 1985).
However, another study found that nicotine increased β-endorphin secretion from cultured
hypothalamic neurons following treatments of up to 24 hours, but longer treatments caused
desensitization of the β-endorphin response (Boyadjieva & Sarkar, 1997). Additionally, Gilbert
et al. (1992) found that β-endorphin plasma concentrations in human smokers were not
elevated when smoking their own brand of cigarette, but were increased when smoking
cigarettes with a higher nicotine concentration. However, Wewers et al. (1994) found no
correlation between changes in plasma β-endorphin levels and periods of smoking or
abstinence in dependent smokers. These results suggest that β-endorphin exhibits a bi-phasic

- 179 -
response to nicotine (Berrendero et al., 2010); however, to confirm this theory more research
into the effects of nicotine on β-endorphin release is warranted.
Very little research has yet been conducted on the effects of tobacco or nicotine on the
expression of opioid peptides or MOR. This is despite a number of studies providing
convincing evidence for the involvement of MOR in the mediation of tobacco dependence
(detailed in section 1.5.3). Wewers et al. (1999) measured MOR specific binding in the
striatum of rats treated chronically with nicotine for 14 days and found a significant 85%
increase in MOR binding in rats receiving nicotine treatment, compared to control. It was
thought that this was a compensatory response to the observed decreases in striatal met-
enkephalin concentrations following chronic nicotine exposure.
Figure 56: Schematic diagram of the proposed interaction between dopamine (DA) and the endogenous
opioid system in the mesolimbic dopamine system. Nicotine binding in the Ventral Tegmental Area (VTA)
causes dopamine overflow in the Nucleus accumbens (NAcc) and other striatal regions. Excess dopamine
leads to release of the endogenous opioid peptides β-endorphin and preproenkephalin (PPE) which causes
internalization and up-regulation of MOR. Increased β-endorphin release in response to nicotine ia also
thought to activate MOR in the VTA, modulating the firing of DA projections to the Nacc.
To date only one study has examined the effects of nicotine on MOR mRNA expression.
Walters et al. (2005) measured MOR mRNA in the ventral tegmentum (VTA) and nucleus
accumbens of mice treated with saline, nicotine, or cocaine for 8 days. Mice chronically
treated with nicotine showed significant up-regulation of MOR mRNA in the VTA, to
- 180 -
approximately 150% of the expression seen in saline-treated rats. This up-regulation was
found to be dependent on MOR activation, as naloxone pre-treatment blocked the response.
Furthermore, increased MOR mRNA expression was also found to be a nicotine-specific
response, as cocaine treatment did not induce MOR up-regulation in this study (Walters et al.,
2005). Additionally, this study showed that activation of the transcription factor CREB was
required for MOR mRNA up-regulation, since mice carrying a mutant form of CREB showed no
increase in MOR mRNA expression in response to nicotine. CREB is thought to play a major
role in the rewarding properties of many drugs of abuse, and the results from this study
suggest that a CREB-dependent increase in MOR expression is required for nicotine reward
(Walters et al., 2005).
The mechanisms and pathways governing the interaction between nicotine and the
opioidergic system are complex and not yet well characterized. There is convincing evidence
that MOR activation is necessary for the reinforcing properties of nicotine; however, nicotine
is not known to directly interact with MOR. It has been suggested that the increased
dopamine concentrations induced by nicotine binding to the acetylcholine receptor (nAChR)
may lead to increased release of endogenous opioid peptides such as β-endorphin or the
endomorphins (Fig. 56). In turn, these opioid peptides mediate the activation of MOR in
regions of the brain critical to the establishment of drug dependence and reinforcement.
However, further research is still required to properly elucidate the mechanisms behind the
involvement of MOR in mediating nicotine reward.
7.1.3 - Objectives
The aim of this study was to examine the effects of nicotine, HTPM and QTPM on the gene
expression of MOR in cultured SH-SY5Y cells. While a prior study has reported in vivo changes
in MOR gene expression in rodents treated with nicotine (Walters et al., 2005), the present
study aimed to examine whether these reported changes were also observed in a cultured
human neuroblastoma cell line, and to determine whether whole tobacco extracts induced
the same changes in gene expression as seen with nicotine.
As there is strong evidence that MOR is linked to the activation of nAChRs, this study planned
to investigate whether nAChR activation was required for nicotine’s effects on MOR gene
expression. To determine if changes in MOR expression were a downstream result of nicotine
binding to nAChRs, or if they were mediated through a nAChR-independent signaling pathway,
- 181 -
an adaptation of a previous experiment by Dunckley & Lukas (2006) using the nAChR
antagonist mecamylamine was planned. If changes in MOR expression involve nAChR-
dependant signaling pathways, then treatment with mecamylamine should reverse any
changes in MOR expression observed. Additionally, if changes in MOR expression are due to a
nicotine-dependent mechanism, then it is expected that QTPM extract should have no effect
on MOR expression, as QTPM lacks nicotine.
Quantitative real-time PCR was used to analyze the expression of MOR in SH-SY5Y cells
chronically treated with nicotine, HTPM and QTPM. These data were used to assess the effect
of tobacco smoke exposure on the expression of MOR. Additionally, SH-SY5Y cells were
treated with tobacco compounds in the presence of mecamylamine to ascertain whether
changes in MOR gene expression associated with tobacco extract exposure occur in a nAChR-
independent manner. It was hoped that these experiments would add to our understanding
of the nicotine and non-nicotine related effects of tobacco smoke, and perhaps strengthen the
evidence for MOR involvement in tobacco dependence.
7.2 – MATERIALS & METHODS
7.2.1 – Tobacco Particulate Exposures
Cultured SH-SY5Y cells were exposed to ethanol, nicotine, HTPM or QTPM for 1, 3, or 5 days
according to the protocol detailed in section 2.2.2. Briefly, 9.8 μL volumes of nicotine or
HTPM extract were added to growing SH-SY5Y cells in 30 mL of growth medium (RPMI 1640,
10% FCS, 1% PenStrep; see section 2.1.3), to give a final concentration of 0.2 μM nicotine.
Equivalent volumes of QTPM or ethanol were added to other flasks, bringing the final ethanol
concentration in each flask to 5.6 mM. Flasks of cells were incubated for 1, 3, or 5 days
continuously, without disruption, before harvesting for total RNA extraction, according to the
methods described in section 2.3.
These exposure groups included a flask each of untreated SH-SY5Y, ethanol-treated, nicotine-
treated, HTPM-treated, and QTPM-treated cells incubated for a given time period. Seven
exposure groups each were prepared for the 1-day time point and the 3-day time point, and
thirteen treatment groups were prepared for the 5-day time point.
- 182 -
7.2.1.2 - 5-day Refreshed Medium Exposure Groups
Six flasks of each treatment were also prepared using the refreshed-medium treatment
regimen (detailed in section 6.2.1.3), in which the medium was changed on day 3 of the 5-day
exposure period. On the third day, cells received a fresh aliquot of culture medium and
tobacco test compound, and were then returned to the incubator for a further 2 days
incubation. Six independent flasks of each treatment were prepared.
7.2.1.3 – Mecamylamine Exposure Groups
Flasks of cells were exposed to ethanol and tobacco compounds in the presence of 10 μM
mecamylamine. Six flasks each were treated with mecamylamine, mecamylamine and
ethanol (5.6 mM), mecamylamine and nicotine (0.2 μM), mecamylamine and HTPM, or
mecamylamine and QTPM. The HTPM dosage was sufficient to give a 0.2 μM nicotine
concentration, and an equivalent volume of QTPM was used. Flasks were incubated for 3 days
continuously before harvesting for RNA extraction, according to the method described in
section 2.3.
7.2.2 – Quantitative Real-Time RT-PCR
Upon completion of the cell culture treatment regimens, cells were lysed in TRIzol® reagent,
and the total RNA was extracted and transcribed into cDNA according to the methods
described in section 2.6. The cDNA was assayed for MOR gene expression using customized
hMOR-specific primers that were designed and fully validated for this assay. This involved
assessment of the amplification efficiency and product specificity, as described in section
6.1.3.
Gene expression data for MOR in treated cells were expressed as fold changes relative to a
calibrator sample (RQ). For ethanol-treated cells the calibrator sample used was untreated
SH-SY5Y cells, and for cells treated with nicotine, HTPM, or QTPM, cDNA from ethanol-treated
cells was used as the calibrator to eliminate any effects of the ethanol vehicle. POLR2F had
been previously validated as a stable reference gene (section 6.3.1.2) and was also used as the
reference gene for all experiments in this study.
- 183 -
7.2.3 – Western Blotting
Western blotting was performed on cell protein lysates to determine if changes in MOR gene
expression correlated with MOR protein abundance. Protein lysates prepared from cells
receiving the 5-day refreshed treatment regimen were used, as these cells showed the
greatest change in MOR gene expression. If changes in gene expression were correlated with
protein abundance the 5-day refreshed treatment groups should show the greatest change in
MOR protein levels.
Four samples each of ethanol, nicotine, HTPM, and QTPM-treated cell extracts from four
different culture experiments were assayed for MOR protein by Western blot. One of each
treatment was tested per blot, for a total of four independent Western blotting experiments.
Western blots were immunostained using a rabbit polyclonal antibody (Chemicon Intl.; AB5511)
specific for a C-terminus epitope in the rat MOR protein. A mouse polyclonal anti-β-tubulin
antibody (BD Pharmingen; cat. 556321) was used as a protein loading control. The MOR
antibody produces specific bands at approximately 50 kDa and 70 kDa in SH-SY5Y cells (Kivell
et al., 2004), and the β-tubulin antibody produces a band at 50 kDa. Because both antibodies
yield a band near 50 kDa, hMOR was visualized with a Cy®-5 labeled anti-rabbit secondary
antibody, and β-tubulin was visualized with a Cy®-3 labeled anti-mouse antibody. The
fluorescence from these bands was scanned using a Fujifilm FLA-5100 imaging system (Fuji
Photo Film Co., Ltd). Cy®-5 fluorescence was measured with a 653 nm laser and the
DBR1/R665 emission filter, and Cy®-3 fluorescence was scanned with a 532 nm laser and
PBG/570DF20 emission filter. Images of the blots were analyzed by integrated pixel density
densitometry on 16-bit TIFF images using ImageJ v3.5 software (Wayne Rasbond, National
Institutes of Health, USA). Specific Western blotting procedures are detailed in section 2.5 of
this thesis.
7.2.4 – Data Analysis
The Ct values obtained from qRT-PCR experiments were used to calculate fold changes in
hMOR gene expression, expressed as relative quantitation (RQ). The efficiency adjusted Ct
method was used as described in section 6.1.3.2.
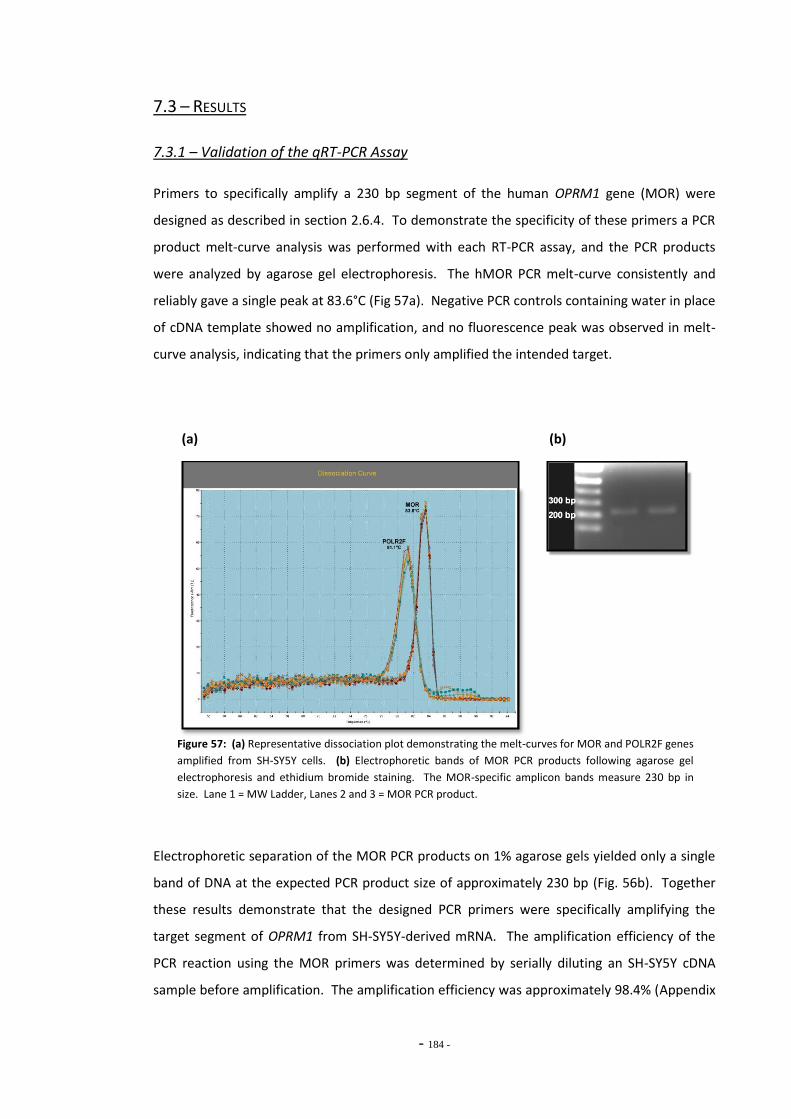
- 184 -
7.3 – RESULTS
7.3.1 – Validation of the qRT-PCR Assay
Primers to specifically amplify a 230 bp segment of the human OPRM1 gene (MOR) were
designed as described in section 2.6.4. To demonstrate the specificity of these primers a PCR
product melt-curve analysis was performed with each RT-PCR assay, and the PCR products
were analyzed by agarose gel electrophoresis. The hMOR PCR melt-curve consistently and
reliably gave a single peak at 83.6°C (Fig 57a). Negative PCR controls containing water in place
of cDNA template showed no amplification, and no fluorescence peak was observed in melt-
curve analysis, indicating that the primers only amplified the intended target.
(a) (b)
Figure 57: (a) Representative dissociation plot demonstrating the melt-curves for MOR and POLR2F genes
amplified from SH-SY5Y cells. (b) Electrophoretic bands of MOR PCR products following agarose gel
electrophoresis and ethidium bromide staining. The MOR-specific amplicon bands measure 230 bp in
size. Lane 1 = MW Ladder, Lanes 2 and 3 = MOR PCR product.
Electrophoretic separation of the MOR PCR products on 1% agarose gels yielded only a single
band of DNA at the expected PCR product size of approximately 230 bp (Fig. 56b). Together
these results demonstrate that the designed PCR primers were specifically amplifying the
target segment of OPRM1 from SH-SY5Y-derived mRNA. The amplification efficiency of the
PCR reaction using the MOR primers was determined by serially diluting an SH-SY5Y cDNA
sample before amplification. The amplification efficiency was approximately 98.4% (Appendix
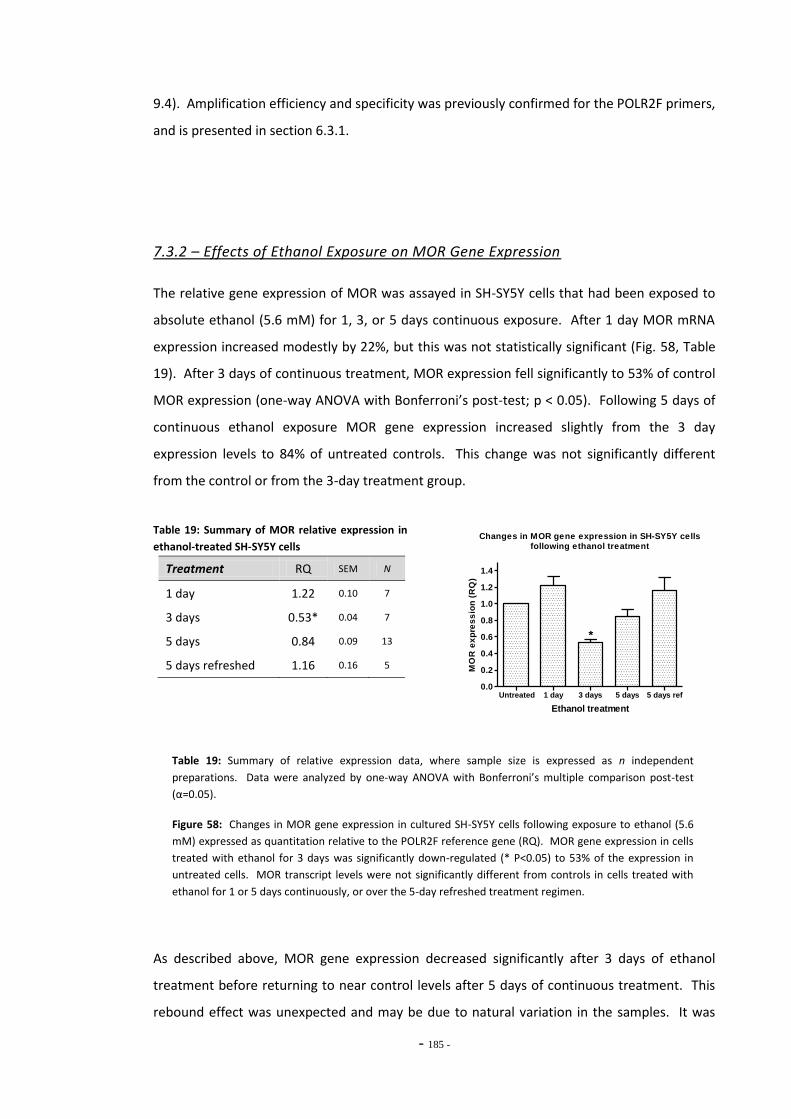
- 185 -
9.4). Amplification efficiency and specificity was previously confirmed for the POLR2F primers,
and is presented in section 6.3.1.
7.3.2 – Effects of Ethanol Exposure on MOR Gene Expression
The relative gene expression of MOR was assayed in SH-SY5Y cells that had been exposed to
absolute ethanol (5.6 mM) for 1, 3, or 5 days continuous exposure. After 1 day MOR mRNA
expression increased modestly by 22%, but this was not statistically significant (Fig. 58, Table
19). After 3 days of continuous treatment, MOR expression fell significantly to 53% of control
MOR expression (one-way ANOVA with Bonferroni’s post-test; p < 0.05). Following 5 days of
continuous ethanol exposure MOR gene expression increased slightly from the 3 day
expression levels to 84% of untreated controls. This change was not significantly different
from the control or from the 3-day treatment group.
Table 19: Summary of MOR relative expression in
ethanol-treated SH-SY5Y cells
Treatment RQ SEM N
1 day 1.22 0.10 7
3 days 0.53* 0.04 7
5 days 0.84 0.09 13
5 days refreshed 1.16 0.16 5
Changes in MOR gene expression in SH-SY5Y cellsfollowing ethanol treatment
Untreated 1 day 3 days 5 days 5 days ref0.0
0.2
0.4
0.6
0.8
1.0
1.2
1.4
*
Ethanol treatment
MO
R e
xp
res
sio
n (
RQ
)
Table 19: Summary of relative expression data, where sample size is expressed as n independent
preparations. Data were analyzed by one-way ANOVA with Bonferroni’s multiple comparison post-test
(α=0.05).
Figure 58: Changes in MOR gene expression in cultured SH-SY5Y cells following exposure to ethanol (5.6
mM) expressed as quantitation relative to the POLR2F reference gene (RQ). MOR gene expression in cells
treated with ethanol for 3 days was significantly down-regulated (* P<0.05) to 53% of the expression in
untreated cells. MOR transcript levels were not significantly different from controls in cells treated with
ethanol for 1 or 5 days continuously, or over the 5-day refreshed treatment regimen.
As described above, MOR gene expression decreased significantly after 3 days of ethanol
treatment before returning to near control levels after 5 days of continuous treatment. This
rebound effect was unexpected and may be due to natural variation in the samples. It was
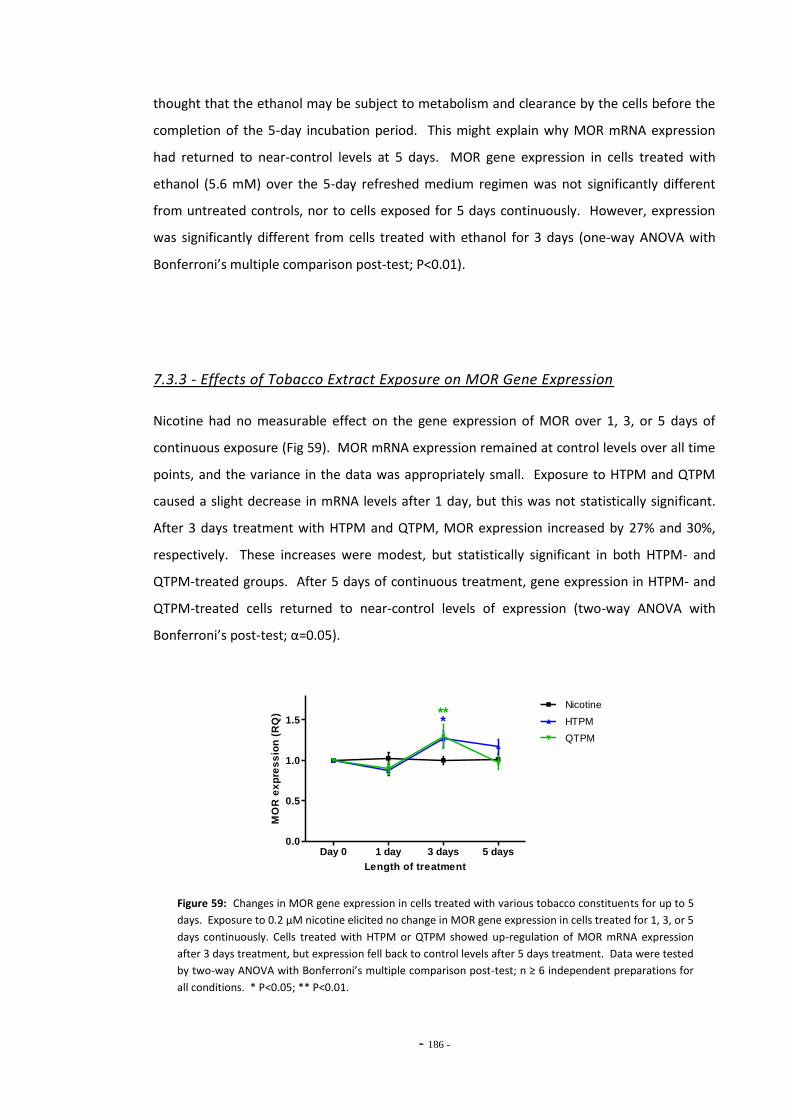
- 186 -
thought that the ethanol may be subject to metabolism and clearance by the cells before the
completion of the 5-day incubation period. This might explain why MOR mRNA expression
had returned to near-control levels at 5 days. MOR gene expression in cells treated with
ethanol (5.6 mM) over the 5-day refreshed medium regimen was not significantly different
from untreated controls, nor to cells exposed for 5 days continuously. However, expression
was significantly different from cells treated with ethanol for 3 days (one-way ANOVA with
Bonferroni’s multiple comparison post-test; P<0.01).
7.3.3 - Effects of Tobacco Extract Exposure on MOR Gene Expression
Nicotine had no measurable effect on the gene expression of MOR over 1, 3, or 5 days of
continuous exposure (Fig 59). MOR mRNA expression remained at control levels over all time
points, and the variance in the data was appropriately small. Exposure to HTPM and QTPM
caused a slight decrease in mRNA levels after 1 day, but this was not statistically significant.
After 3 days treatment with HTPM and QTPM, MOR expression increased by 27% and 30%,
respectively. These increases were modest, but statistically significant in both HTPM- and
QTPM-treated groups. After 5 days of continuous treatment, gene expression in HTPM- and
QTPM-treated cells returned to near-control levels of expression (two-way ANOVA with
Bonferroni’s post-test; α=0.05).
Day 0 1 day 3 days 5 days0.0
0.5
1.0
1.5
Nicotine
HTPM
QTPM
***
Length of treatment
MO
R e
xp
res
sio
n (
RQ
)
Figure 59: Changes in MOR gene expression in cells treated with various tobacco constituents for up to 5
days. Exposure to 0.2 μM nicotine elicited no change in MOR gene expression in cells treated for 1, 3, or 5
days continuously. Cells treated with HTPM or QTPM showed up-regulation of MOR mRNA expression
after 3 days treatment, but expression fell back to control levels after 5 days treatment. Data were tested
by two-way ANOVA with Bonferroni’s multiple comparison post-test; n ≥ 6 independent preparations for
all conditions. * P<0.05; ** P<0.01.
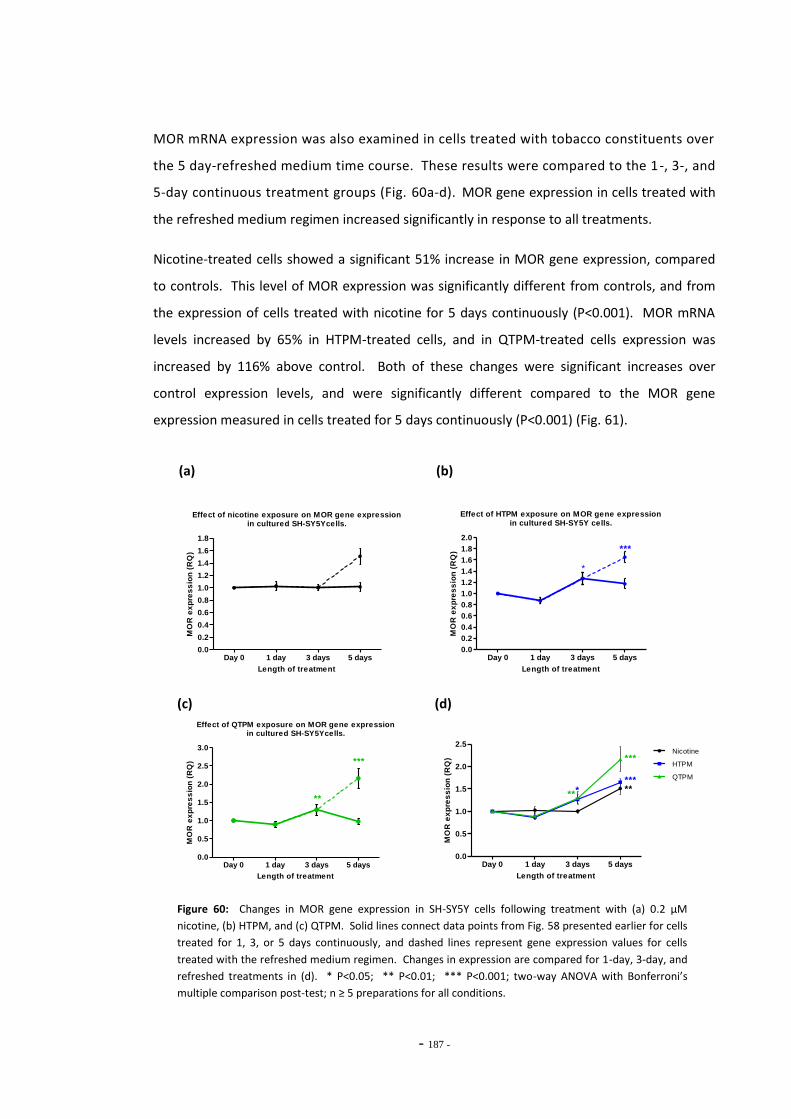
- 187 -
MOR mRNA expression was also examined in cells treated with tobacco constituents over
the 5 day-refreshed medium time course. These results were compared to the 1-, 3-, and
5-day continuous treatment groups (Fig. 60a-d). MOR gene expression in cells treated with
the refreshed medium regimen increased significantly in response to all treatments.
Nicotine-treated cells showed a significant 51% increase in MOR gene expression, compared
to controls. This level of MOR expression was significantly different from controls, and from
the expression of cells treated with nicotine for 5 days continuously (P<0.001). MOR mRNA
levels increased by 65% in HTPM-treated cells, and in QTPM-treated cells expression was
increased by 116% above control. Both of these changes were significant increases over
control expression levels, and were significantly different compared to the MOR gene
expression measured in cells treated for 5 days continuously (P<0.001) (Fig. 61).
(a) (b)
Effect of nicotine exposure on MOR gene expressionin cultured SH-SY5Ycells.
Day 0 1 day 3 days 5 days0.0
0.2
0.4
0.6
0.8
1.0
1.2
1.4
1.6
1.8
Length of treatment
MO
R e
xp
res
sio
n (
RQ
)
Effect of HTPM exposure on MOR gene expressionin cultured SH-SY5Y cells.
Day 0 1 day 3 days 5 days0.0
0.2
0.4
0.6
0.8
1.0
1.2
1.4
1.6
1.8
2.0
***
*
Length of treatment
MO
R e
xp
res
sio
n (
RQ
)
(c) (d)
Effect of QTPM exposure on MOR gene expressionin cultured SH-SY5Ycells.
Day 0 1 day 3 days 5 days0.0
0.5
1.0
1.5
2.0
2.5
3.0
***
**
Length of treatment
MO
R e
xp
res
sio
n (
RQ
)
Day 0 1 day 3 days 5 days0.0
0.5
1.0
1.5
2.0
2.5Nicotine
HTPM
QTPM
***
********
Length of treatment
MO
R e
xp
res
sio
n (
RQ
)
Figure 60: Changes in MOR gene expression in SH-SY5Y cells following treatment with (a) 0.2 μM
nicotine, (b) HTPM, and (c) QTPM. Solid lines connect data points from Fig. 58 presented earlier for cells
treated for 1, 3, or 5 days continuously, and dashed lines represent gene expression values for cells
treated with the refreshed medium regimen. Changes in expression are compared for 1-day, 3-day, and
refreshed treatments in (d). * P<0.05; ** P<0.01; *** P<0.001; two-way ANOVA with Bonferroni’s
multiple comparison post-test; n ≥ 5 preparations for all conditions.
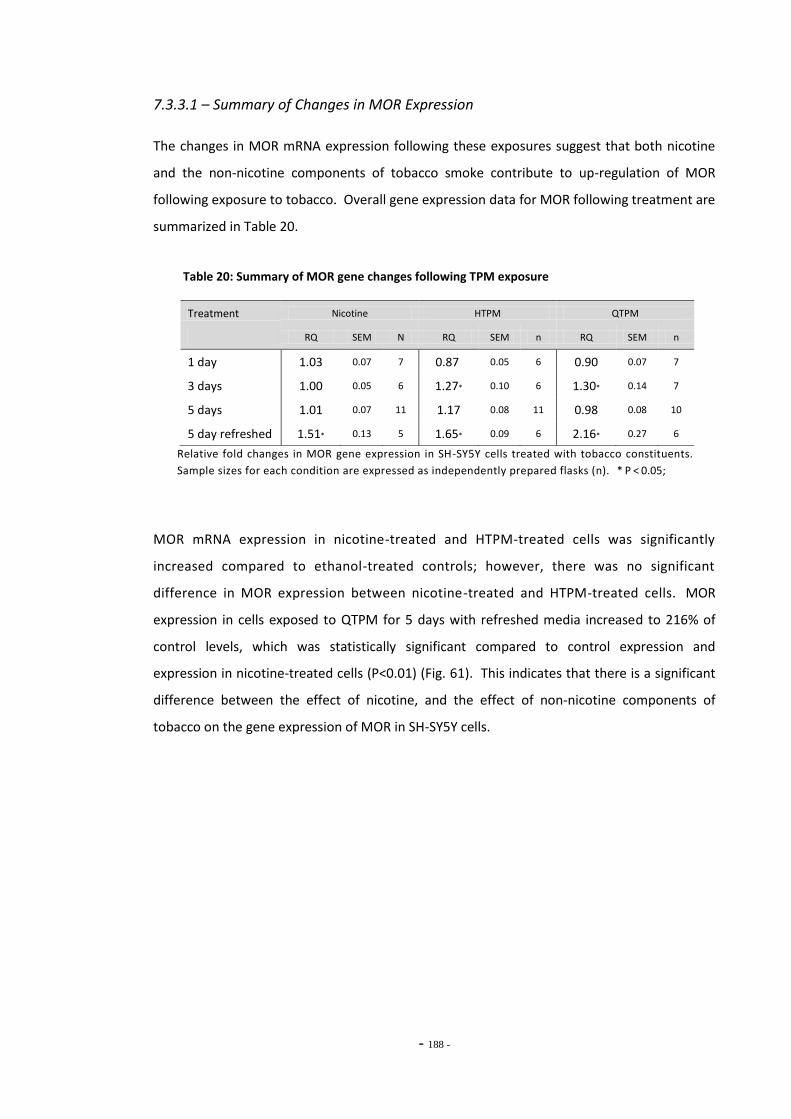
- 188 -
7.3.3.1 – Summary of Changes in MOR Expression
The changes in MOR mRNA expression following these exposures suggest that both nicotine
and the non-nicotine components of tobacco smoke contribute to up-regulation of MOR
following exposure to tobacco. Overall gene expression data for MOR following treatment are
summarized in Table 20.
Table 20: Summary of MOR gene changes following TPM exposure
Relative fold changes in MOR gene expression in SH-SY5Y cells treated with tobacco constituents.
Sample sizes for each condition are expressed as independently prepared flasks (n). * P < 0.05;
MOR mRNA expression in nicotine-treated and HTPM-treated cells was significantly
increased compared to ethanol-treated controls; however, there was no significant
difference in MOR expression between nicotine-treated and HTPM-treated cells. MOR
expression in cells exposed to QTPM for 5 days with refreshed media increased to 216% of
control levels, which was statistically significant compared to control expression and
expression in nicotine-treated cells (P<0.01) (Fig. 61). This indicates that there is a significant
difference between the effect of nicotine, and the effect of non-nicotine components of
tobacco on the gene expression of MOR in SH-SY5Y cells.
Treatment Nicotine HTPM QTPM
RQ SEM N RQ SEM n RQ SEM n
1 day 1.03 0.07 7 0.87 0.05 6 0.90 0.07 7
3 days 1.00 0.05 6 1.27* 0.10 6 1.30* 0.14 7
5 days 1.01 0.07 11 1.17 0.08 11 0.98 0.08 10
5 day refreshed 1.51* 0.13 5 1.65* 0.09 6 2.16* 0.27 6
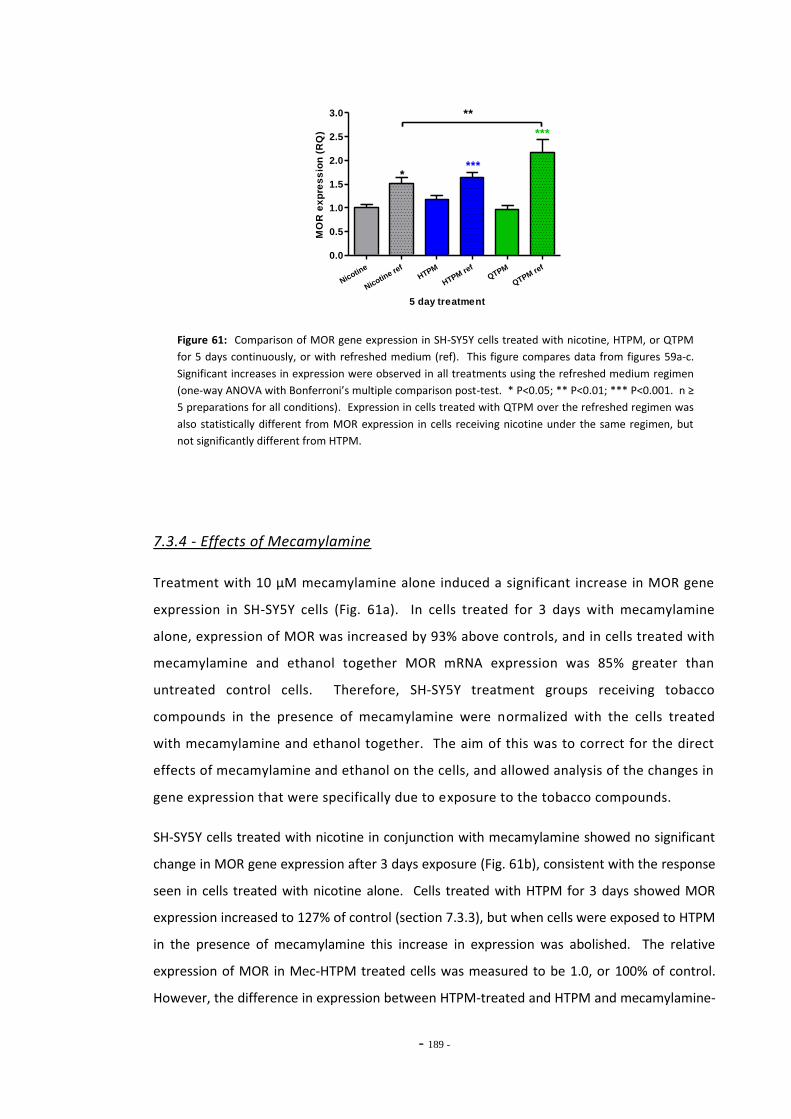
- 189 -
Nicotine
Nicotine re
f
HTPM
HTPM ref
QTPM
QTPM ref
0.0
0.5
1.0
1.5
2.0
2.5
3.0
****
***
**
5 day treatment
MO
R e
xp
res
sio
n (
RQ
)
Figure 61: Comparison of MOR gene expression in SH-SY5Y cells treated with nicotine, HTPM, or QTPM
for 5 days continuously, or with refreshed medium (ref). This figure compares data from figures 59a-c.
Significant increases in expression were observed in all treatments using the refreshed medium regimen
(one-way ANOVA with Bonferroni’s multiple comparison post-test. * P<0.05; ** P<0.01; *** P<0.001. n ≥
5 preparations for all conditions). Expression in cells treated with QTPM over the refreshed regimen was
also statistically different from MOR expression in cells receiving nicotine under the same regimen, but
not significantly different from HTPM.
7.3.4 - Effects of Mecamylamine
Treatment with 10 μM mecamylamine alone induced a significant increase in MOR gene
expression in SH-SY5Y cells (Fig. 61a). In cells treated for 3 days with mecamylamine
alone, expression of MOR was increased by 93% above controls, and in cells treated with
mecamylamine and ethanol together MOR mRNA expression was 85% greater than
untreated control cells. Therefore, SH-SY5Y treatment groups receiving tobacco
compounds in the presence of mecamylamine were normalized with the cells treated
with mecamylamine and ethanol together. The aim of this was to correct for the direct
effects of mecamylamine and ethanol on the cells, and allowed analysis of the changes in
gene expression that were specifically due to exposure to the tobacco compounds.
SH-SY5Y cells treated with nicotine in conjunction with mecamylamine showed no significant
change in MOR gene expression after 3 days exposure (Fig. 61b), consistent with the response
seen in cells treated with nicotine alone. Cells treated with HTPM for 3 days showed MOR
expression increased to 127% of control (section 7.3.3), but when cells were exposed to HTPM
in the presence of mecamylamine this increase in expression was abolished. The relative
expression of MOR in Mec-HTPM treated cells was measured to be 1.0, or 100% of control.
However, the difference in expression between HTPM-treated and HTPM and mecamylamine-
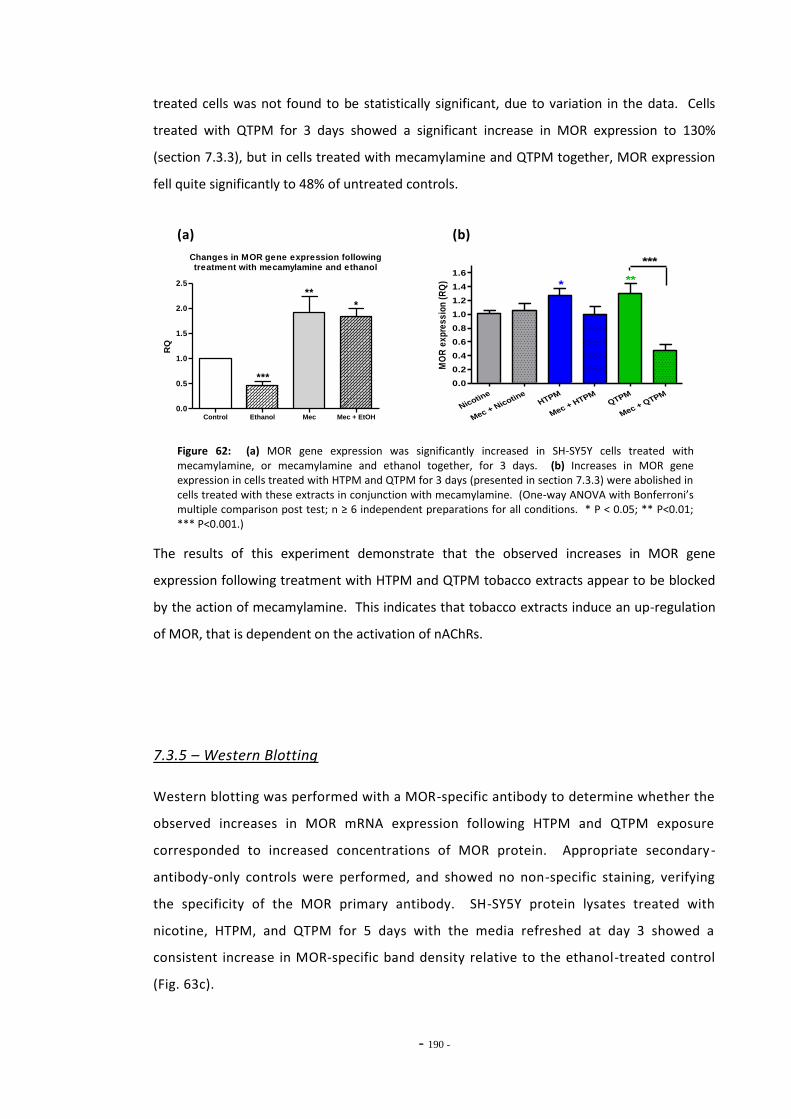
- 190 -
treated cells was not found to be statistically significant, due to variation in the data. Cells
treated with QTPM for 3 days showed a significant increase in MOR expression to 130%
(section 7.3.3), but in cells treated with mecamylamine and QTPM together, MOR expression
fell quite significantly to 48% of untreated controls.
(a) (b)
Changes in MOR gene expression followingtreatment with mecamylamine and ethanol
Control Ethanol Mec Mec + EtOH0.0
0.5
1.0
1.5
2.0
2.5
**
*
***
RQ
Nicotine
Mec + Nicotin
eHTPM
Mec + HTPM
QTPM
Mec + QTPM
0.0
0.2
0.4
0.6
0.8
1.0
1.2
1.4
1.6
* **
***
MO
R e
xp
res
sio
n (
RQ
)
Figure 62: (a) MOR gene expression was significantly increased in SH-SY5Y cells treated with mecamylamine, or mecamylamine and ethanol together, for 3 days. (b) Increases in MOR gene expression in cells treated with HTPM and QTPM for 3 days (presented in section 7.3.3) were abolished in cells treated with these extracts in conjunction with mecamylamine. (One-way ANOVA with Bonferroni’s multiple comparison post test; n ≥ 6 independent preparations for all conditions. * P < 0.05; ** P<0.01; *** P<0.001.)
The results of this experiment demonstrate that the observed increases in MOR gene
expression following treatment with HTPM and QTPM tobacco extracts appear to be blocked
by the action of mecamylamine. This indicates that tobacco extracts induce an up-regulation
of MOR, that is dependent on the activation of nAChRs.
7.3.5 – Western Blotting
Western blotting was performed with a MOR-specific antibody to determine whether the
observed increases in MOR mRNA expression following HTPM and QTPM exposure
corresponded to increased concentrations of MOR protein. Appropriate secondary-
antibody-only controls were performed, and showed no non-specific staining, verifying
the specificity of the MOR primary antibody. SH-SY5Y protein lysates treated with
nicotine, HTPM, and QTPM for 5 days with the media refreshed at day 3 showed a
consistent increase in MOR-specific band density relative to the ethanol-treated control
(Fig. 63c).
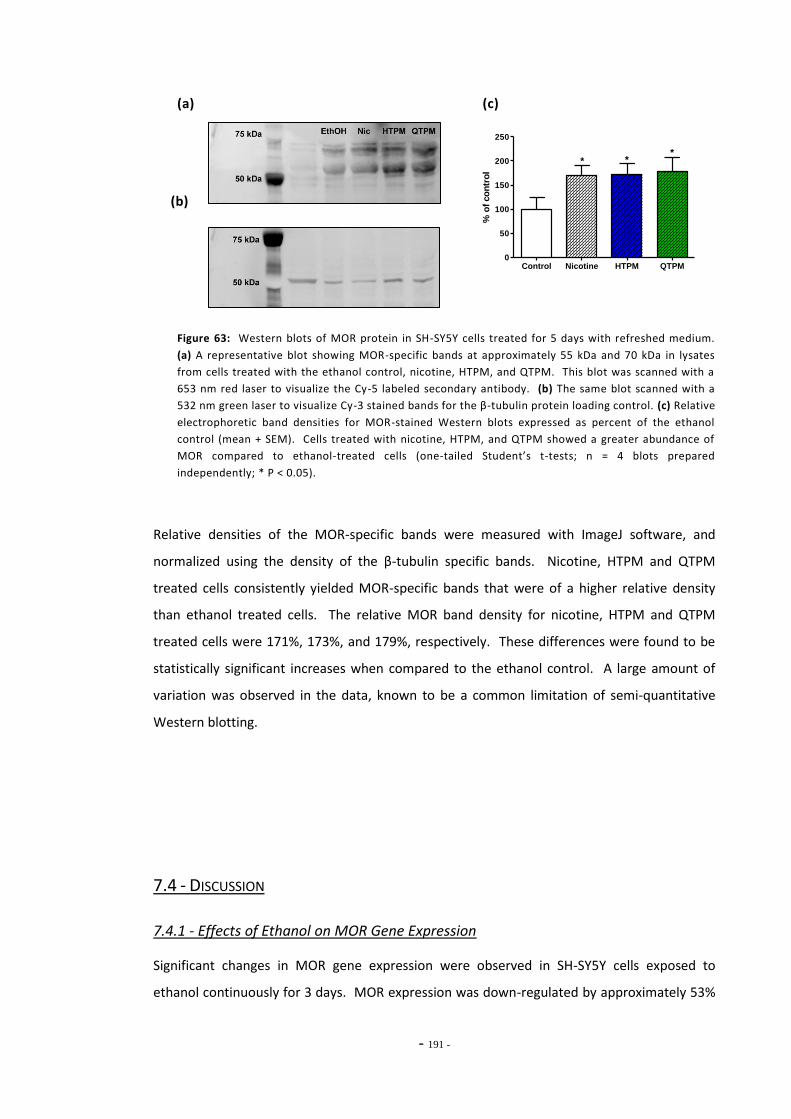
- 191 -
(a) (c)
Control Nicotine HTPM QTPM0
50
100
150
200
250
**
*
% o
f co
ntr
ol
(b)
Figure 63: Western blots of MOR protein in SH-SY5Y cells treated for 5 days with refreshed medium.
(a) A representative blot showing MOR-specific bands at approximately 55 kDa and 70 kDa in lysates
from cells treated with the ethanol control, nicotine, HTPM, and QTPM. This blot was scanned with a
653 nm red laser to visualize the Cy-5 labeled secondary antibody. (b) The same blot scanned with a
532 nm green laser to visualize Cy-3 stained bands for the β-tubulin protein loading control. (c) Relative
electrophoretic band densities for MOR-stained Western blots expressed as percent of the ethanol
control (mean + SEM). Cells treated with nicotine, HTPM, and QTPM showed a greater abundance of
MOR compared to ethanol-treated cells (one-tailed Student’s t-tests; n = 4 blots prepared
independently; * P < 0.05).
Relative densities of the MOR-specific bands were measured with ImageJ software, and
normalized using the density of the β-tubulin specific bands. Nicotine, HTPM and QTPM
treated cells consistently yielded MOR-specific bands that were of a higher relative density
than ethanol treated cells. The relative MOR band density for nicotine, HTPM and QTPM
treated cells were 171%, 173%, and 179%, respectively. These differences were found to be
statistically significant increases when compared to the ethanol control. A large amount of
variation was observed in the data, known to be a common limitation of semi-quantitative
Western blotting.
7.4 - DISCUSSION
7.4.1 - Effects of Ethanol on MOR Gene Expression
Significant changes in MOR gene expression were observed in SH-SY5Y cells exposed to
ethanol continuously for 3 days. MOR expression was down-regulated by approximately 53%

- 192 -
in these cells relative to the untreated SH-SY5Y controls. These findings are consistent with
previous studies reporting down-regulation of MOR in the brains of animals chronically
treated with ethanol. Winkler et al. (1998) reported MOR mRNA expression was down-
regulated by almost 80% in the striatum of mice allowed to drink ethanol ad libitum for four
weeks, and Saland et al. (2005) described significantly lower levels of immunohistochemical
staining for MOR in multiple brain regions, including the striatum and nucleus accumbens, in
rats administered ethanol for two weeks. Although these in vivo studies may reflect the
indirect effects of ethanol on MOR, they may still relate to the down-regulation observed in
the present study.
Interestingly, cells treated with ethanol for 1 or 5 days in the present study did not display
down-regulation of MOR gene expression. It is possible that the shorter duration exposure of
24 hours is insufficient for the cells to respond and alter MOR gene transcription at this
ethanol concentration. The absence of down-regulation at the 5 day time is difficult to
explain, since the studies described above reported down-regulation of MOR following
chronic ethanol exposure. However, those studies examined changes in the brains of rodents,
while SH-SY5Y is an immortalized human cell line, and interspecies differences in MOR
expression are known to exist (Lee et al., 2004; Peckys & Landwehrmeyer, 1998). It is likely
that after 5 days incubation ethanol concentrations in the cultures had fallen to sub-threshold
concentrations through evaporation or cell metabolism, and MOR gene expression had
returned to baseline levels. It would have been useful to measure ethanol concentrations
over the duration of this experiment to determine how much the ethanol concentration fell
due to evaporation or metabolism. However, MOR expression in cells treated under the 5 day
refreshed treatment regimen was also no different from controls. Therefore, it appears
ethanol treatment induces a transient decrease in MOR gene expression in SH-SY5Y cells.
7.4.2 – Tobacco Extract Exposure increases MOR Gene Expression in SH-SY5Y
The present study is the first to examine the effect of whole tobacco smoke extracts on the
gene expression of MOR. Exposure to both HTPM and QTPM samples caused a significant up-
regulation in MOR gene expression in cells treated for three days and five days using the
refreshed medium regimen (Fig. 59d). Since the QTPM sample was derived from
denicotinized tobacco cigarettes, this would indicate that one or more unidentified non-
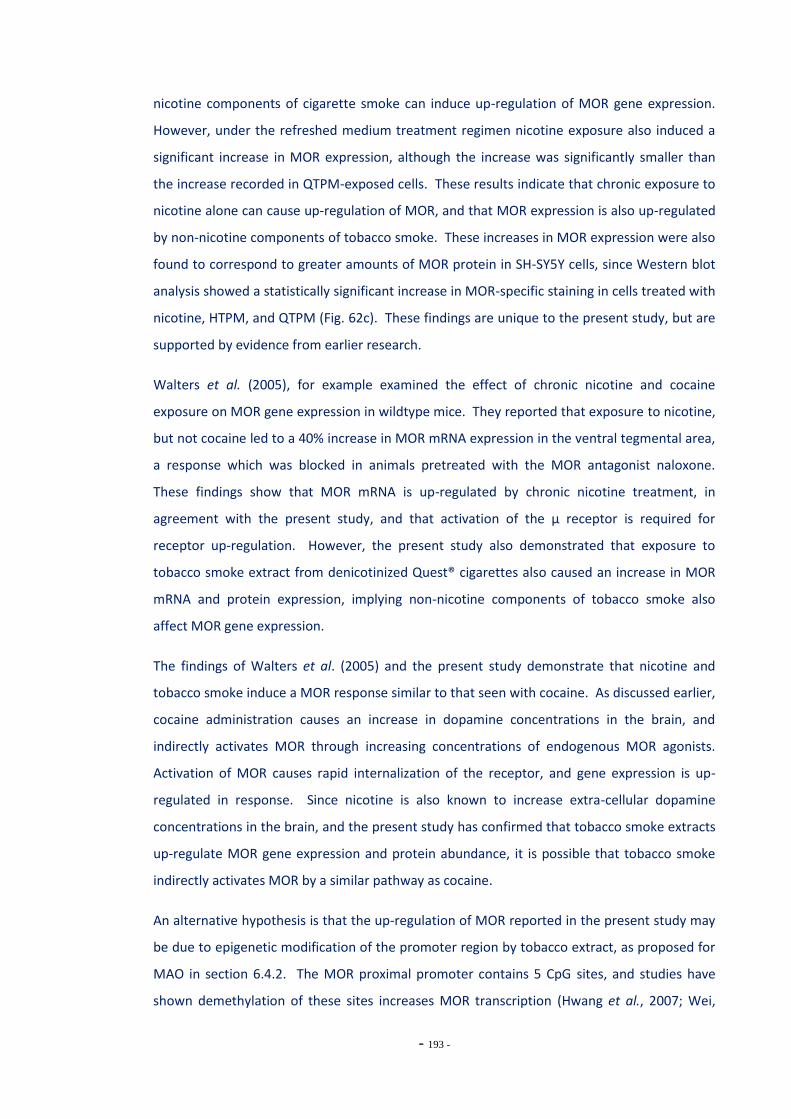
- 193 -
nicotine components of cigarette smoke can induce up-regulation of MOR gene expression.
However, under the refreshed medium treatment regimen nicotine exposure also induced a
significant increase in MOR expression, although the increase was significantly smaller than
the increase recorded in QTPM-exposed cells. These results indicate that chronic exposure to
nicotine alone can cause up-regulation of MOR, and that MOR expression is also up-regulated
by non-nicotine components of tobacco smoke. These increases in MOR expression were also
found to correspond to greater amounts of MOR protein in SH-SY5Y cells, since Western blot
analysis showed a statistically significant increase in MOR-specific staining in cells treated with
nicotine, HTPM, and QTPM (Fig. 62c). These findings are unique to the present study, but are
supported by evidence from earlier research.
Walters et al. (2005), for example examined the effect of chronic nicotine and cocaine
exposure on MOR gene expression in wildtype mice. They reported that exposure to nicotine,
but not cocaine led to a 40% increase in MOR mRNA expression in the ventral tegmental area,
a response which was blocked in animals pretreated with the MOR antagonist naloxone.
These findings show that MOR mRNA is up-regulated by chronic nicotine treatment, in
agreement with the present study, and that activation of the µ receptor is required for
receptor up-regulation. However, the present study also demonstrated that exposure to
tobacco smoke extract from denicotinized Quest® cigarettes also caused an increase in MOR
mRNA and protein expression, implying non-nicotine components of tobacco smoke also
affect MOR gene expression.
The findings of Walters et al. (2005) and the present study demonstrate that nicotine and
tobacco smoke induce a MOR response similar to that seen with cocaine. As discussed earlier,
cocaine administration causes an increase in dopamine concentrations in the brain, and
indirectly activates MOR through increasing concentrations of endogenous MOR agonists.
Activation of MOR causes rapid internalization of the receptor, and gene expression is up-
regulated in response. Since nicotine is also known to increase extra-cellular dopamine
concentrations in the brain, and the present study has confirmed that tobacco smoke extracts
up-regulate MOR gene expression and protein abundance, it is possible that tobacco smoke
indirectly activates MOR by a similar pathway as cocaine.
An alternative hypothesis is that the up-regulation of MOR reported in the present study may
be due to epigenetic modification of the promoter region by tobacco extract, as proposed for
MAO in section 6.4.2. The MOR proximal promoter contains 5 CpG sites, and studies have
shown demethylation of these sites increases MOR transcription (Hwang et al., 2007; Wei,
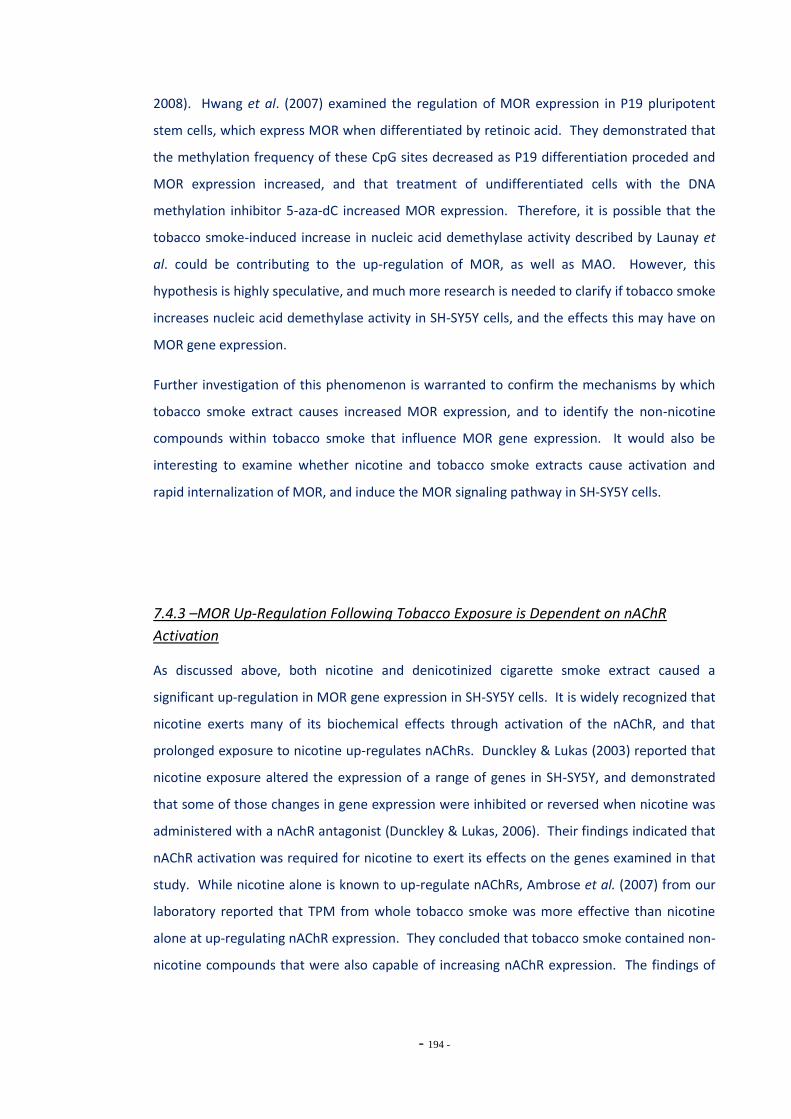
- 194 -
2008). Hwang et al. (2007) examined the regulation of MOR expression in P19 pluripotent
stem cells, which express MOR when differentiated by retinoic acid. They demonstrated that
the methylation frequency of these CpG sites decreased as P19 differentiation proceded and
MOR expression increased, and that treatment of undifferentiated cells with the DNA
methylation inhibitor 5-aza-dC increased MOR expression. Therefore, it is possible that the
tobacco smoke-induced increase in nucleic acid demethylase activity described by Launay et
al. could be contributing to the up-regulation of MOR, as well as MAO. However, this
hypothesis is highly speculative, and much more research is needed to clarify if tobacco smoke
increases nucleic acid demethylase activity in SH-SY5Y cells, and the effects this may have on
MOR gene expression.
Further investigation of this phenomenon is warranted to confirm the mechanisms by which
tobacco smoke extract causes increased MOR expression, and to identify the non-nicotine
compounds within tobacco smoke that influence MOR gene expression. It would also be
interesting to examine whether nicotine and tobacco smoke extracts cause activation and
rapid internalization of MOR, and induce the MOR signaling pathway in SH-SY5Y cells.
7.4.3 –MOR Up-Regulation Following Tobacco Exposure is Dependent on nAChR
Activation
As discussed above, both nicotine and denicotinized cigarette smoke extract caused a
significant up-regulation in MOR gene expression in SH-SY5Y cells. It is widely recognized that
nicotine exerts many of its biochemical effects through activation of the nAChR, and that
prolonged exposure to nicotine up-regulates nAChRs. Dunckley & Lukas (2003) reported that
nicotine exposure altered the expression of a range of genes in SH-SY5Y, and demonstrated
that some of those changes in gene expression were inhibited or reversed when nicotine was
administered with a nAchR antagonist (Dunckley & Lukas, 2006). Their findings indicated that
nAChR activation was required for nicotine to exert its effects on the genes examined in that
study. While nicotine alone is known to up-regulate nAChRs, Ambrose et al. (2007) from our
laboratory reported that TPM from whole tobacco smoke was more effective than nicotine
alone at up-regulating nAChR expression. They concluded that tobacco smoke contained non-
nicotine compounds that were also capable of increasing nAChR expression. The findings of
- 195 -
these two studies were applied in the present experiment, to examine if nAChR activation is
required for up-regulation of MOR.
When administered to cells alone, the nAChR antagonist mecamylamine significantly up-
regulated the expression of MOR (Fig. 61a). This is surprising, since mecamylamine is not
known to directly interact with MOR. However, Dunckley & Lukas (2006) also reported that
mecamylamine altered the expression of several genes in SH-SY5Y, yielding effects similar to
those of nicotine alone. They found that in almost every case where mecamylamine alone
affected gene expression, mecamylamine also inhibited or reversed the effect of nicotine.
This finding is also true of the present study, which showed that mecamylamine alone
increased MOR gene expression in SH-SY5Y cells treated for 3 days, as did HTPM and QTPM
samples (Fig. 61b). However, when mecamylamine was administered in conjunction with
HTPM, MOR up-regulation was abolished, and when the antagonist was co-administered with
QTPM, MOR up-regulation was reversed, resulting in down-regulation of the opioid receptor.
This implies that the increased MOR gene expression due to HTPM or QTPM exposure
observed in this study requires activation of nAChRs. However, what cannot be explained is
why mecamylamine alone led to an increase in MOR mRNA expression. This finding implies
that mecamylamine is inhibiting a basal level of endogenous cholinergic signalling in SH-SY5Y
cells, and MOR resgulation is altered as a result, but it is uncertain whether these cells express
this activity.
By up-regulating MOR, it appears that mecamylamine is mimicking the action of nicotine. This
could occur if the signal to increase MOR transcription is triggered simply by occupation of the
nAChR, by agonist or antagonist, without requiring receptor activation. However, in this case,
mecamylamine and TPM would be presumed to have an additive effect on MOR expression
when administered together, which was not observed. It is also possible that mecamylamine
would mimic the action of TPM samples if their effect on MOR was due to blockade of the
nAChR through receptor desensitization. However, these TPM samples are unlikely to cause
complete desensitization of nAChR under the conditions tested here, as Sokolova et al. (2005)
demonstrated that SH-SY5Y cells chronically treated with nicotine concentrations far
exceeding those used here still retained some nAChR functioning. Furthermore, if MOR up-
regulation were the result of downstream events due to nAChR blockade, co-administration of
TPM samples and mecamylamine would be expected to yield results similar to those of
mecamylamine alone, since the concentration of mecamylamine used here is known to cause
complete antagonism of nAChR function (Serres & Carney, 2006). While it can’t be ruled out
- 196 -
that mecamylamine may cause MOR up-regulation by acting on MOR directly, or at another
non-nAChR site this prospect is considered unlikely as no interactions of this nature have been
reported in the literature.
It is interesting to note here that HTPM and QTPM both up-regulated MOR expression, but
when these samples were co-administered with mecamylamine, MOR expression in HTPM-
treated cells fell back to baseline, but in QTPM-treated cells MOR expression was significantly
inhibited. While this result is difficult to interpret, it suggests that the chemical composition
of QTPM is more considerably different to HTPM than just a lack of nicotine.
7.4.4 – Summary
This study is the first to describe up-regulation of MOR expression in SH-SY5Y cells following
chronic nicotine exposure, and also demonstrates MOR up-regulation following exposure to
standard and denicotinized cigarette smoke extracts. This implies that both nicotine and non-
nicotine compounds in tobacco smoke act to increase expression of MOR. Experiments with
mecamylamine showed that antagonism of nAChRs either inhibited or reversed the observed
up-regulation of MOR in HTPM and QTPM-treated cells, suggesting that nicotine, and non-
nicotine components of tobacco smoke induced up-regulate MOR through a nAChR-
dependent mechanism. These findings further confirm involvement of the endogenous opioid
system in the mechanisms of nicotine dependence, and offer new insights into the nature of
these interactions, although further investigation is required to elucidate the mechanism of
MOR up-regulation due to tobacco smoke.

- 197 -
Chapter Eight: General Discussion & Future
Directions
8.1 – PROJECT SUMMARY
The overall aim of this project was to identify and characterize specific changes to
cellular function as a result of exposure to tobacco smoke extracts. Of particular interest
were those changes that could not be attributed to the action of nicotine. It is widely
known that nicotine is the principle drug of dependence in tobacco, and a very extensive
body of research has examined the neurobiological and physiological roles of nicotine in
tobacco dependence. Nevertheless, the actions of nicotine alone cannot fully account
for the intense and enduring nature of tobacco addiction. Previous research has
provided strong evidence that monoamine oxidase enzyme inhibition and the
endogenous opioid system play a role in the etiology and maintenance of tobacco
dependence. The present study focused on examining changes in the activity and
expression of these proteins in response to tobacco smoke extract exposure.
In agreement with previously published enzyme studies, tobacco smoke extracts
collected from a wide range of tobacco products commercially available in New Zealand
all inhibited the activity of purified human MAO-A and MAO-B enzymes. Extracts
collected from denicotinized Quest® cigarettes also inhibited MAO-A and MAO-B in a
manner similar to that of standard nicotine-containing cigarettes, effectively
demonstrating that non-nicotine compounds within tobacco smoke are at least in part
responsible for MAO inhibition. Different tobacco products vary considerably in their
composition. This was evident in the present study, as significant differences were
observed in the ability of different TPM samples to inhibit MAO-A and MAO-B. This
implies there are significant variations in the concentration of MAO inhibitors in those
tobacco products. These differences were evident between types of tobacco product
(cigarettes versus loose-leaf tobacco), between different brands of cigarette, and even
between different batches of the same brand. It has been previously established in
rodent behavioural studies that co-administration of MAO inhibitors with nicotine greatly
increases the intensity and persistence of addiction to nicotine (Guillem et al., 2005; A. S.
- 198 -
Villegier et al., 2003; A.S. Villegier et al., 2007), and so it is possible that variations in
MAO inhibitor action between different tobacco products may have a direct correlation
to tobacco dependence in human smokers. Indeed, users of loose-leaf tobacco cigarettes
score more highly on tests of nicotine dependence than habitual cigarette smokers
(Young et al., 2006), and the present study found that extracts from loose-leaf tobacco
products more potently inhibited MAO than manufactured cigarettes. Further research
is required to examine this relationship in more depth, but if exposure to higher
concentrations of MAO inhibitors is correlated with greater tobacco dependence in
humans, this may make MAO inhibitor concentrations an important consideration for
public health authorities and regulators of commercially available tobacco products.
Tobacco extract inhibition of MAO was much less clear-cut in experiments using cultured
SH-SY5Y neuroblastoma cells, reflecting the usual differences in complexity between
isolated enzyme preparations and whole cell systems. This study is the first to examine
MAO inhibition due to whole tobacco smoke extracts in the SH-SY5Y cell line, and used
TPM extract concentrations directly relevant to human smoking. Both standard tobacco
TPM and denicotinized TPM significantly inhibited total MAO activity in these cells after
1-day short-term exposures, in line with previously published research demonstrating
MAO inhibition following acute tobacco exposures. Also consistent with previously
published data, HTPM extract induced a mixed-type inhibition, while QTPM inhibited
MAO activity in a non-competitive manner. This suggests that while the denicotinized
Quest® cigarettes inhibit MAO to the same degree as standard cigarettes, there are
differences in the type and concentration of MAO inhibitors in the tobacco smoke.
Interestingly, after 5 days exposure these tobacco extracts caused a considerable
increase in total MAO activity in SH-SY5Y cells, a finding that has not been previously
reported. The cause of this increase in activity is not known, but it was proposed that it
could be due to increased concentrations of MAO-A and MAO-B protein in the cell as a
compensatory mechanism in response to MAO inhibition. However, Western blot
analysis failed to support this proposal. Investigation of MAO-A and MAO-B gene
expression in these cells did support this theory, since mRNA expression of both genes
was significantly up-regulated by both standard tobacco and denicotinized tobacco
extracts. This indicates that MAO up-regulation is induced by the non-nicotine
components of tobacco smoke, since mRNA expression was increased in response to the
denicotinized QTPM sample, and nicotine alone did not alter expression of either MAO-A
or MAO-B genes. This finding is unique to the present study, and further investigation is
- 199 -
warranted to elucidate the mechanism of MAO gene up-regulation and the compound or
compounds responsible. Additional gene expression experiments using mecamylamine
found that this nAChR inhibitor effectively blocked the observed increases in MAO mRNA
expression. This implies that although nicotine does not cause MAO up-regulation,
activation of the nAChR is somehow involved in MAO gene expression. It also indicates
that compounds within tobacco smoke other than nicotine are capable of activating the
nAChR, or that SH-SY5Y cells possess endogenous nAChR agonist activity.
Further research is required to identify whether these changes in MAO gene expression
are also observed in human smokers, and to establish their relevance to tobacco
dependence. A recent study has reported that tobacco smoke causes an epigenetic
modification of the MAO-B gene promoter, resulting in increased gene expression and
protein concentration (Launay et al., 2009). If this is indeed the case, it could clarify
some of the causes of nicotine withdrawal symptoms. If tobacco smoke up-regulates
MAO expression as described, then while a smoker continues to receive regular doses of
MAO inhibitors through cigarette smoking, any increased concentrations of MAO
enzymes due to mRNA up-regulation will be inhibited. Upon quitting, inhibition of MAO
activity is removed and these enzymes are free to degrade serotonin and dopamine
levels in the brain. This mechanism could contribute to the depression and anhedonia
experienced by many smokers in their attempts to quit. Avoidance of these withdrawal
symptoms is an important factor in maintaining addiction, and is a common cause of
relapse. This knowledge can be further applied to smoking cessation therapies to
provide improved pharmacological support for quitting smokers. This may involve the
inclusion of monoamine oxidase inhibitors with nicotine replacement therapies, a
strategy that is already being trialed clinically (Berlin et al., 2002; Weinberger et al.,
2010).
In addition to MAO, expression of the µ opioid receptor gene was also examined in
response to chronic nicotine and tobacco smoke extract exposure. MOR has been widely
studied with regard to mechanisms of drug dependence and addiction because of its
crucial role in mediating the nociceptive and behavioural effects of morphine. Nico tine,
HTPM, and QTPM treatment all increased MOR mRNA expression and MOR protein
abundance. It has been proposed that nicotine may affect MOR indirectly by increasing
extracellular dopamine. Dopamine overflow is thought to increase extracellular
concentrations of endogenous MOR opioid, β-endorphin and the endomorphins, which in
- 200 -
turn activate MOR and lead to rapid internalization of the µ receptor and a consequent
up-regulation of MOR gene transcription. What is interesting is that denicotinized QTPM
extract also increased MOR gene expression, indicating that tobacco compounds other
than nicotine influence regulation of MOR. This finding is unique to the present study,
and the mechanism of action has yet to be elucidated. Further investigation of the
influence of tobacco smoke on MOR expression is required to determine if denicotinized
tobacco smoke can increase dopamine, and therefore endogenous opioids. It remains to
be determined whether tobacco smoke activates MOR, and what the non-nicotine
compounds responsible for these effects are.
8.2 – FUTURE EXPERIMENTS
8.2.1 – Investigate a Continuous Cell Culture Treatment Regimen
In the present study, investigations into the enzyme and gene expression responses of
cultured cells to tobacco extracts demonstrated the considerable influence of cell culture
conditions and treatment regimens in the results obtained. This was particular ly evident
when comparing cellular responses in cells treated for 5 days continuously, or with the
refreshed treatment regimen. In order to eliminate the confounding effects of the
culture conditions, future cell culture experiments could be performed using a
continuous medium perfusion system, as described by Constantinescu et al. (2007). This
method constantly replaces the cell culture medium with fresh medium, thus preventing
the accumulation of cell metabolites which could perturb normal cell function. This is
likely to be a more effective model of the in vivo environment in the CNS, and the cells
are likely to respond to the treatment in a manner that more closely resembles the
responses of neuronal cells in vivo. Furthermore, as Constantinescu et al. demonstrated,
this culture technique can be successfully used to differentiate the SH-SY5Y cell line to
express a phenotype more similar to dopaminergic neurons than to neuroblasts.
The use of a continuous perfusion cell culture system could also be extended to more
accurately model tobacco exposure in human smokers. The present study treated cells
with a single dose of tobacco smoke extract, but in human smoking the smoker is
receives a dose of tobacco smoke with each cigarette smoked, and nicotine accumulates
- 201 -
in the body during the day (N. L. Benowitz, 2008). This could be modeled by maintaining
cells with a continuous medium perfusion system and dosing them directly and
repeatedly with tobacco extracts using concentrations and exposure frequencies relevant
to human smoking habits. It is possible that the MAO and MOR responses in cells
cultured under continuous perfusion conditions will provide a better representation of
human neuronal responses to tobacco smoke.
8.2.2 – Identify the Neurobiologically Active Compounds in Tobacco Smoke
The present study identified a number of intriguing and significant effects of tobacco
smoke that could prove relevant to nicotine addiction. In order to more closely examine
and effectively characterize these effects, the active compounds within tobacco smoke
responsible for these cellular responses must be identified. This could be achieved by
chemical fractionation of the TPM sample and adapting some of the experiments
reported here for use as bio-assays to direct further investigation of the sample. For
example, the MAO activity assay used in the present study has already been adapted for
high-throughput experiments and could easily be used to identify TPM fractions that
exhibit MAO inhibitory action. Active fractions could then be analyzed by gas
chromatography and tandem mass spectrometry (GC-MS/MS) to identify compounds
within the fraction. Candidate compounds can then be retested by bio-assay to confirm
their bio-activity. Admittedly, identifying the tobacco compounds responsible for up-
regulation of the MAO and MOR gene will be difficult, as this approach is likely to be
expensive and time consuming if qRT-PCR is used as a bio-assay. It is possible that novel
MAO inhibitors may be identified in tobacco smoke, and these inhibitors may be useful in
smoking cessation therapies, or perhaps other pharmaceutical applications, such as
treatment of Parkinson’s and Alzheimer’s diseases.
8.2.3 – Elucidate the Mechanisms of MAO Up-Regulation
The present study reported up-regulation of MAO-A and MAO-B mRNA expression in
response to tobacco smoke extracts, though the mechanism of this response was not
elucidated. It is possible that the MAO gene up-regulation in SH-SY5Y cells observed in
the present study is caused by demethylation of the core promoter region of MAO-A and
- 202 -
MAO-B genes, as proposed by Launay, et al. (2009). To investigate this, detailed genetic
analysis could be carried out to determine the methylation patterns of these genes in SH-
SY5Y cells treated chronically with tobacco smoke extract. This could involve bisulfate
treatment of SH-SY5Y genomic DNA to convert all unmethylated cytosine nucleotides to
uracil, followed by sequencing the MAO-A and MAO-B promoters. If the MAO-A and
MAO-B promoter regions proved to have a reduced frequency of methylated CpG sites
compared to untreated controls, as found by Launay et al., then the activity of nucleic
acid demethylase could be measured to confirm this effect.
8.2.4 – Elucidate the Mechanisms of MOR Up-Regulation
Nicotine is known to interact with MOR indirectly by increasing extracellular dopamine
concentrations. It has been proposed that dopamine causes an increase in β-endorphin
and endomorphin release, though this has yet to be adequately confirmed. To determine
if nicotine and tobacco extracts interact with MOR through this mechanism, cellular
concentrations of β-endorphin and the endomorphins could be measured using high
performance liquid chromatography (HPLC) following acute and chronic treatment with
the test compounds in cultured cells. Alternatively, this line of research could be
extended to animal studies, by measuring changes in the extracellular concentrations of
β-endorphin, endomorphin-1, and endomorphin-2 in key brain regions, including the
nucleus accumbens and ventral tegmental area. This could be achieved through the use
of microdialysis experiments and HPLC analysis.
8.2.5 – Do Tobacco Smoke Constituents Bind to or Activate MOR?
The present study reported that nicotine and other unidentified tobacco constituents up-
regulate MOR gene expression in SH-SY5Y cells. While it is possible that nicotine
influences MOR expression indirectly through its ability to cause dopamine release, the
mechanism of action of the denicotinized tobacco smoke extract should prove
interesting. To help elucidate the mechanisms of MOR up-regulation it would be useful
to identify whether any compounds in tobacco smoke bind directly to MOR or if they
influence MOR indirectly. To determine if MOR activation is required for the gene up-
regulation described in the present study, the exposures and expression experiments
could be repeated in the presence and absence of a MOR antagonist, such as naloxone.
- 203 -
If MOR signaling is required for the observed up-regulation, this effect will be abolished
in the presence of naloxone. This could also be tested through in vitro receptor auto-
radiography studies, to determine if tobacco smoke extracts can displace MOR-bound
[3H]-DAMGO. This assay has been widely reported in the literature and seems to produce
good results. It would also be interesting to determine if tobacco extract or nicotine
alone are capable of initiating the MOR signal transduction cascade. Since MOR is a G -
protein coupled receptor, activation can be investigated by measuring the binding of
[35S]GTPγS to the active G-protein (Emmerson et al., 1996). This assay could be
employed to test nicotine and tobacco extracts in cultured SH-SY5Y cells.
8.2.6 – Remodel in vitro Experiments for Animal Studies
Cultured cells present a simple, relatively easily controlled, and convenient experimental
system to test the behavior and function of individual cells. However, the brain is a
complex network of heterogeneous inter-connected cells with different gene and protein
expression profiles, and isolated cell studies are often woefully inadequate at modeling
all of the complex interactions within the brain. While the results reported in the
present study provide some insight into the response of neuronal cells to nicotine and
tobacco extracts, these findings must be validated in vivo before a clearer understanding
of the effects of tobacco smoke on human nicotine addiction can be gained.
Whole animal experiments should ideally involve investigations of MAO-A and -B enzyme
activity, and the mRNA expression profiles of MAO and MOR genes in the brains of
rodents taught to self administer tobacco extracts. The self-administration paradigm
provides a more accurate model of human tobacco addiction, and has been used to study
the effects of nicotine with some success (Corrigall et al., 2000). However, it may be
difficult to train animals to self administer tobacco smoke extracts, especially
denicotinized tobacco, since nicotine is the primary addictive agent in tobacco. The MAO
activity assay presented in the present study could be used to assess MAO-A and MAO-B
enzyme activity in platelets and dissected brain regions from self -administering rats, and
a qRT-PCR assay could be utilized to assess MAO and MOR gene expression in the same
brain samples. In particular, the expression of these genes should be examined in
specific brain areas associated with drug addiction and dependence, such as the nucleus
accumbens, ventral tegmental area, and striatum. Studies into the effects of whole
tobacco smoke extract in animals will prepare the way for future validation and assessment in
- 204 -
human smokers, and provide a framework for further development of smoking cessation
therapies.
8.3 – TOWARDS IMPROVED SMOKING CESSATION THERAPIES
Tobacco addiction is a major public health concern, and the development of effective
smoking cessation strategies is necessary to help dependent smokers quit the habit.
Nicotine induces addiction to smoking, through its complex neurobiological effects,
affecting the activity of many neurotransmitter systems, including dopamine, serotonin,
glutamate, and the endogenous opioid peptides. However, nicotine replacement
therapies prove ineffective at maintaining abstinence in quitting smokers, suggesting a
role for the non-nicotine components of tobacco smoke in maintaining addiction.
The experiments described in this thesis have identified several previously unreported
effects of whole tobacco smoke on neuronal cellular function and behavior, and provide
valuable insights into some of the complex cellular mechanisms influenced by tobac co
smoke. These results demonstrate that tobacco compounds beyond nicotine have
profound effects on the activity and expression of neural pathways associated with
addiction, including monoamine oxidase activity and expression, and the endogenous
opioid system. The research in the present study contributes to the growing body of
knowledge of how tobacco dependence is established and maintained by the various
components of tobacco smoke, and provides a framework for further validation and
investigation of these systems in human smokers. Importantly, the present study has
repeatedly demonstrated that the non-nicotine tobacco compounds in tobacco smoke
have significant affects that may influence human tobacco dependence. This factor
should be considered in future research into tobacco smoking, as examining the effects
of nicotine alone are no longer sufficient to explain the many complex biochemical
responses to tobacco smoke. Further research into the effects of the non-nicotine
components of tobacco smoke is needed, and will complement existing knowledge on
the pharmacology of nicotine. A thorough understanding of these complex cellular
mechanisms is essential for the development of more effective therapeutic strategies for
smoking cessation.

- 205 -

- 206 -
References
Abell, C. W., & Kwan, S. W. (2001). Molecular characterization of monoamine oxidases A and B. Progress in Nucleic Acid Research and Molecular Biology, 65, 129-156.
Ambrose, V., Miller, J. H., Dickson, S. J., Hampton, S., Truman, P., Lea, R. A., et al. (2007). Tobacco particulate matter is more potent than nicotine at upregulating nicotinic receptors on SH-SY5Y cells. Nicotine & Tobacco Research, 9(8), 793-799.
Azaryan, A. V., Clock, B. J., & Cox, B. M. (1996a). Mu opioid receptor mRNA in nucleus accumbens is elevated following dopamine receptor activation. Neurochemical Research, 21(11), 1411-1415.
Azaryan, A. V., Coughlin, L. J., Buzas, B., Clock, B. J., & Cox, B. M. (1996b). Effect of chronic cocaine treatment on mu- and delta-opioid receptor mRNA levels in dopaminergically innervated brain regions. Journal of Neurochemistry, 66(2), 443-448.
Bach, A. W., Lan, N. C., Johnson, D. L., Abell, C. W., Bembenek, M. E., Kwan, S. W., et al. (1988). cDNA cloning of human liver monoamine oxidase A and B: molecular basis of differences in enzymatic properties. Proceedings of the National Academy of Sciences of the U S A, 85(13), 4934-4938.
Bagdy, G., & Rihmer, Z. (1986). Measurement of platelet monoamine oxidase activity in healthy human volunteers. Acta physiologica Hungarica, 68(1), 19-24.
Balfour, D. J. (2002). The neurobiology of tobacco dependence: a commentary. Respiration, 69(1), 7-11.
Balfour, D. J., Bates, C., Benowitz, N., Berridge, V., Britton, J., Callum, C., et al. (2000a). Nicotine Addiction in Britain. London: Royal College of Physicians of London.
Balfour, D. J., & Fagerstrom, K. O. (1996). Pharmacology of nicotine and its therapeutic use in smoking cessation and neurodegenerative disorders. Pharmacology & Therapeutics, 72(1), 51-81.
Balfour, D. J., & Ridley, D. L. (2000). The effects of nicotine on neural pathways implicated in depression: a factor in nicotine addiction? Pharmacology Biochemistry and Behavior, 66(1), 79-85.
Balfour, D. J., Wright, A. E., Benwell, M. E., & Birrell, C. E. (2000b). The putative role of extra-synaptic mesolimbic dopamine in the neurobiology of nicotine dependence. Behavioral Brain Research, 113(1-2), 73-83.
Baron, J. A. (1986). Cigarette smoking and Parkinson's disease. Neurology, 36(11), 1490-1496. Barrett, S. P., Boileau, I., Okker, J., Pihl, R. O., & Dagher, A. (2004). The hedonic response to
cigarette smoking is proportional to dopamine release in the human striatum as measured by positron emission tomography and [11C]raclopride. Synapse, 54(2), 65-71.
Benowitz, N., Dains, K. M., Hall, S. M., Stewart, S., Wilson, M., Dempsey, D., et al. (2009). Progressive commercial cigarette yield reduction: biochemical exposure and behavioural assessment. Cancer epidemiology, biomarkers & prevention: a publication of the American Association for Cancer Research cosponsored by the American Society of Preventative Oncology, 18(3), 876-883.
Benowitz, N. L. (2008). Clinical pharmacology of nicotine: implications for understanding, preventing, and treating tobacco addiction. Clinical Pharmacology & Therapeutics, 83(4), 531-541.
Benwell, M. E., & Balfour, D. J. (1992). The effects of acute and repeated nicotine treatment on nucleus accumbens dopamine and locomotor activity. British Journal of Pharmacology, 105(4), 849-856.
- 207 -
Berlin, I., Aubin, H. J., Pedarroisse, A. M., Trames, A., Lancrenon, S., & Lagrue, G. (2002). Lazabemide, a selective, reversible monoamine oxidase B inhibitor, as an aid to smoking cessation. Addiction, 97(10), 1347-1354.
Berlin, I., Said, S., Spreux-Varoquaux, O., Launay, J. M., Olivares, R., Millet, V., et al. (1995a). A reversible monoamine oxidase A inhibitor (moclobemide) facilitates smoking cessation and abstinence in heavy, dependent smokers. Clinical Pharmacology and Therapeutics, 58(4), 444-452.
Berlin, I., Said, S., Spreux-Varoquaux, O., Olivares, R., Launay, J. M., & Puech, A. J. (1995b). Monoamine oxidase A and B activities in heavy smokers. Biological Psychiatry, 38(11), 756-761.
Berrendero, F., Kieffer, B. L., & Maldonado, R. (2002). Attenuation of nicotine-induced antinociception, rewarding effects, and dependence in mu-opioid receptor knock-out mice. The Journal of Neuroscience, 22(24), 10935-10940.
Berrendero, F., Robledo, P., Trigo, J. M., Martin-Garcia, E., & Maldonado, R. (2010). Neurobiological mechanisms involved in nicotine dependence and reward: participation of the endogenous opioid system. Neuroscience and Behavioural Reviews, 35, 220-231.
Berry, M. D., Juorio, A. V., & Paterson, I. A. (1994). The functional role of monoamine oxidases A and B in the mammalian central nervous system. Progress in Neurobiology, 42(3), 375-391.
Betz, C., Mihalic, D., Pinto, M. E., & Raffa, R. B. (2000). Could a common biochemical mechanism underlie addictions? Journal of Clinical Pharmacy and Therapeutics, 25, 11-20.
Biberman, R., Neumann, R., Katzir, I., & Gerber, Y. (2003). A randomized controlled trial of oral selegiline plus nicotine skin patch compared with placebo plus nicotine skin patch for smoking cessation. Addiction, 98(10), 1403-1407.
Binda, C., Hubalek, F., Li, M., Edmondson, D. E., & Mattevi, A. (2004). Crystal structure of human monoamine oxidase B, a drug target enzyme monotopically inserted into the mitochondrial outer membrane. FEBS Letters, 564(3), 225-228.
Binda, C., Newton-Vinson, P., Hubalek, F., Edmondson, D. E., & Mattevi, A. (2002). Structure of human monoamine oxidase B, a drug target for the treatment of neurological disorders. Nature Structural Biology, 9(1), 22-26.
Boyadjieva, N. I., & Sarkar, D. K. (1997). The secretory response of hypothalamic beta-endorphin neurons to acute and chronic nicotine treatments and following nicotine withdrawal. Life Sciences, 61(6), 59-66.
Britt, J. P., & McGehee, D. S. (2008). Presynaptic opioid and nicotinic receptor modulation of dopamine overflow in the nucleus accumbens. The Journal of Neuroscience, 28(7), 1672-1681.
Brodsky, M., Elliott, K., Hynansky, A., & Inturrisi, C. E. (1995). CNS levels of mu opioid receptor (MOR-1) mRNA during chronic treatment with morphine or naltrexone. Brain Research Bulletin, 38(2), 135-141.
Brody, A. L., Olmstead, R. E., London, E. D., Farahi, J., Meyer, J. H., Grossman, P., et al. (2004). Smoking-induced ventral striatum dopamine release. The American Journal of Psychiatry, 161(7), 1211-1218.
Bullen, C., McRobbie, H., Thornley, S., Glover, M., Lin, R., & Laugesen, M. (2010). Effect of an electronic nicotine delivery device (e cigarette) on desire to smoke and withdrawal, user preferences and nicotine delivery: randomised cross-over trial. Tobacco Control, 19, 98-103.
Bustin, S. A., Benes, V., Nolan, T., & Pfaffl, M. W. (2005). Quantitative real-time RT-PCR - a perspective. Journal of Molecular Endocrinology, 34, 597-601.
- 208 -
Cadoni, C., & Di Chiara, G. (2000). Differential changes in accumbens shell and core dopamine in behavioral sensitization to nicotine. European Journal of Pharmacology, 387, R23-R25.
Calafat, A. M., Polzin, G. M., Saylor, J., Richter, P., Ashley, D. L., & Watson, C. H. (2004). Determination of tar, nicotine, and carbon monoxide yields in the mainstream smoke of selected international cigarettes. Tobacco Control, 13, 45-51.
Castagnoli, K., Steyn, S. J., Magnin, G., Van Der Schyf, C. J., Fourie, I., Khalil, A., et al. (2002). Studies on the interactions of tobacco leaf and tobacco smoke constituents and monoamine oxidase. Neurotoxicity Research, 4(2), 151-160.
Castelli, M. P., Melis, M., Mameli, M., Fadda, P., Diaz, G., & Gessa, G. L. (1997). Chronic morphine and naltrexone fail to modify mu-opioid receptor mRNA levels in the rat brain. Molecular Brain Research, 45, 149-153.
Checkoway, H., Franklin, G. M., Costa-Mallen, P., Smith-Weller, T., Dilley, J., Swanson, P. D., et al. (1998). A genetic polymorphism of MAO-B modifies the association of cigarette smoking and Parkinson's disease. Neurology, 50(5), 1458-1461.
Chen, G., Yee, D. J., Gubernator, N. G., & Sames, D. (2005). Design of optical switches as metabolic indicators: new fluorogenic probes for monoamine oxidases (MAO A and B). Journal of the American Chemical Society, 127, 4544-4545.
Chen, J., Higby, R., Tian, D., Tan, D., Johnson, M. D., Xiao, Y., et al. (2008). Toxicological analysis of low-nicotine and nicotine-free cigarettes. Toxicology, 249, 194-203.
Chen, K. (2004). Organization of MAO A and MAO B promoters and regulation of gene expression. Neurotoxicology, 25(1-2), 31-36.
Chen, Z. Y., Hotamisligil, G. S., Huang, J. K., Wen, L., Ezzeddine, D., Aydin-Muderrisoglu, N., et al. (1991). Structure of the human gene for monoamine oxidase type A. Nucleic Acids Research, 19(16), 4537-4541.
Christoffers, K. H., Li, H., Keenan, S. M., & Howells, R. D. (2003). Purification and mass spectrometric analysis of the mu opioid receptor. Molecular Brain Research, 118, 119-131.
Coccini, T., Castoldi, A. F., Gandini, C., Randine, G., Vittadini, G., Baiardi, P., et al. (2002). Platelet monoamine oxidase B activity as a state marker for alcoholism: Trend over time during withdrawal and influence of smoking and gender. Alcohol and Alcoholism, 37(6), 566-572.
Constantinescu, R., Constantinescu, A. T., Reichmann, H., & Janetzky, B. (2007). Neuronal differentiation and long-term culture of the human neuroblastoma line SH-SY5Y. Journal of Neural Transmission(Suppl 72), 17-28.
Contet, C., Kieffer, B. L., & Befort, K. (2004). Mu opioid receptor: a gateway to drug addiction. Curr Opin Neurobiol, 14(3), 370-378.
Corrigall, W. A., Coen, K. M., Adamson, K. L., Chow, B. L. C., & Zhang, J. (2000). Response of nicotine self-administration in the rat to manipulations of mu-opioid and gamma-aminobutyric acid receptors in the ventral tegmental area. Psychopharmacology, 149, 107-114.
Costa-Mallen, P., Costa, L. G., & Checkoway, H. (2005). Genotype combinations for monoamine oxidase-B intron 13 polymorphism and dopamine D2 receptor TaqIB polymorphism are associated with ever-smoking status among men. Neuroscience Letters, 385(2), 158-162.
Counts, M. E., Hsu, F. S., Laffoon, S. W., Dwyer, R. W., & Cox, R. H. (2004). Mainstream smoke constituent yields and predicting relationships from a worldwide market sample of cigarette brands: ISO smoking conditions. Regulatory Toxicology and Pharmacology, 39, 111-134.
Covey, L. S., Glassman, A. H., & Stetner, F. (1997). Major depression following smoking cessation. American Journal of Psychiatry, 154(2), 263-265.
- 209 -
D'Addario, C., ming, Y., Ogren, S. O., & Terenius, L. (2008). The role of acetaldehyde in mediating effects of alcohol on expression of endogenous opioid system genes in a neuroblastoma cell line. The FASEB Journal, 22(3), 662-670.
Darrall, K. G., & Figgins, J. A. (1998). Roll-your-own smoke yields: theoretical and practical aspects. Tobacco Control, 7, 168-175.
Davenport, K. E., Houdi, A. A., & Van Loon, G. R. (1990). Nicotine protects against mu-opioid receptor antagonism by beta-funaltrexamine: evidence for nicotine-induced release of endogenous opioids in brain. Neuroscience Letters, 113(40-46).
Dhatt, R. K., Gudehithlu, K. P., Wemlinger, T. A., Tejwani, G. A., Neff, N. H., & Hadjiconstantinou, M. (1995). Preproenkephalin mRNA and methionine-enkephalin content are increased in mouse striatum after treatment with nicotine. Journal of Neurochemistry, 64, 1878-1883.
Di Chiara, G., Bassareo, V., Fenu, S., De Luca, M. A., Spina, L., Cadoni, C., et al. (2004). Dopamine and drug addiction: the nucleus accumbens shell connection. Neuropharmacology, 47 Suppl 1, 227-241.
Di Chiara, G., & Imperato, A. (1988). Drugs abused by humans preferentially increase synaptic dopamine concentrations in the mesolimbic system of freely moving rats. Proceedings of the National Academy of Sciences of the U S A, 85(14), 5274-5278.
Dunckley, T., & Lukas, R. J. (2003). Nicotine modulates the expression of a diverse set of genes in the neuronal SH-SY5Y cell line. J Biol Chem, 278(18), 15633-15640.
Dunckley, T., & Lukas, R. J. (2006). Nicotinic modulation of gene expression in SH-SY5Y neuroblastoma cells. Brain Research, 1116(1), 39-49.
Edmondson, D. E., Binda, C., & Mattevi, A. (2004a). The FAD binding sites of human monoamine oxidases A and B. Neurotoxicology, 25(1-2), 63-72.
Edmondson, D. E., Binda, C., Wang, J., Upadhyay, A. K., & Mattevi, A. (2009). Molecular and Mechanistic Properties of the Membrane-Bound Mitochondrial Monoamine Oxidases. Biochemistry, 48(20), 4220-4230.
Edmondson, D. E., Mattevi, A., Binda, C., Li, M., & Hubalek, F. (2004b). Structure and mechanism of monoamine oxidase. Current Medicinal Chemistry, 11(15), 1983-1993.
Ekblom, J., Jossan, S. S., Bergstrom, M., Oreland, L., Walum, E., & Aquilonius, S. M. (1993). Monoamine oxidase-B in astrocytes. Glia, 8(2), 122-132.
Ekblom, J., Zhu, Q. S., Chen, K., & Shih, J. C. (1996). Monoamine oxidase gene transcription in human cell lines: treatment with psychoactive drugs and ethanol. Journal of Neural Transmission, 103(6), 681-692.
Elhwuegi, A. S. (2004). Central monoamines and their role in major depression. Progress in Neuropsychopharmacology & Biological Psychiatry, 28(3), 435-451.
Emilsson, L., Saetre, P., Balciuniene, J., Castensson, A., Cairns, N., & Jazin, E. (2002). Increased monoamine oxidase messenger RNA expression levels in frontal cortex of Alzheimer's disease patients. Neuroscience Letters, 326, 56-60.
Emmerson, P. J., Clark, M. J., Mansour, A., Akil, H., Woods, J. H., & Medzihradsky, F. (1996).
Characterization of opioid agonist efficacy in a C6 glioma cell line expressing the opioid receptor. The Journal of Pharmacology and Experimental Therapeutics, 278(3), 1121-1121.
Feindt, J., Becker, I., Blomer, U., Hugo, H. H., Mehdorn, H. M., Krisch, B., et al. (1995). Expression of somatostatin receptor subtypes in cultured astrocytes and gliomas. Journal of Neurochemistry, 65(5), 1997-2005.
Fichna, J., Janecka, A., Costentin, J., & Do Rego, J.-C. (2007). The endomorphin system and its evolving neurophysiological role. Pharmacological Reviews, 59(1), 88-123.
Fowler, C. J., Mantle, T. J., & Tipton, K. F. (1982). The nature of the inhibition of rat liver monoamine oxidase types A and B by the acetylenic inhibitors clorgyline, l-deprenyl and pargyline. Biochemical Pharmacology, 31(22), 3555-3561.
- 210 -
Fowler, J. S., Logan, J., Wang, G. J., Volkow, N. D., Telang, F., Zhu, W., et al. (2003). Low monoamine oxidase B in peripheral organs in smokers. Proceedings of the National Academy of Sciences of the U S A, 100(20), 11600-11605.
Fowler, J. S., Logan, J., Wang, G. J., Volkow, N. D., Telang, F., Zhu, W., et al. (2005). Comparison of monoamine oxidase A in peripheral organs in nonsmokers and smokers. Journal of Nuclear Medicine, 46(9), 1414-1420.
Fowler, J. S., Volkow, N. D., Wang, G. J., Pappas, N., Logan, J., MacGregor, R., et al. (1996a). Inhibition of monoamine oxidase B in the brains of smokers. Nature, 379(6567), 733-736.
Fowler, J. S., Volkow, N. D., Wang, G. J., Pappas, N., Logan, J., Shea, C., et al. (1996b). Brain monoamine oxidase A inhibition in cigarette smokers. Proceedings of the National Academy of Science of the U S A, 93(24), 14065-14069.
Fowler, J. S., Wang, G. J., Volkow, N. D., Franceschi, D., Logan, J., Pappas, N., et al. (2000). Maintenance of brain monoamine oxidase B inhibition in smokers after overnight cigarette abstinence. American Journal of Psychiatry, 157(11), 1864-1866.
Fowles, J. (2003). Chemical composition of tobacco and cigarette smoke in two brands of New Zealand cigarettes. (Prepared as part of a New Zealand Ministry of Health contract for scientific services). Porirua, Wellington, NZ: Environmental Science and Research Ltd., from http://www.ndp.govt.nz/moh.nsf/pagescm/1005/$File/chemicalcompositioncigarettesbrands.pdf
Fowles, J., & Dybing, E. (2003). Application of toxicological risk assessment principles to the chemical constituents of cigarette smoke. Tobacco Control, 12(4), 424-430.
George, T. P., & O'Malley, S. S. (2004). Current pharmacological treatments for nicotine dependence. Trends in Pharmacological Sciences, 25(1), 42-48.
George, T. P., Vessicchio, J. C., Termine, A., Jatlow, P. I., Kosten, T. R., & O'Malley, S. S. (2003). A preliminary placebo-controlled trial of selegiline hydrochloride for smoking cessation. Biological Psychiatry, 53(2), 136-143.
Gilbert, D. G., Meliska, C. J., Williams, C. L., & Jensen, R. A. (1992). Subjective correlatesof cigarette-smoking-induced elevations of peripheral beta-endorphin and cortisol. Psychopharmacology (Berl), 106(2), 275-281.
Gilbert, D. G., Zuo, Y., Browning, R. A., Shaw, T. M., Rabinovich, N. E., Gilbert-Johnson, A. M., et al. (2003). Platelet monoamine oxidase B activity changes across 31 days of smoking abstinence. Nicotine & Tobacco Research, 5(6), 813-819.
Gotti, C., & Clementi, F. (2004). Neuronal nicotinic receptors: from structure to pathology. Progress in Neurobiology, 74(6), 363-396.
Gourlay, S. G., & Benowitz, N. (1997). Arteriovenous differences in plasma concentration of nicotine and catecholamines and related cardiovascular effects after smoking, nicotine nasal spray, and intravenous nicotine. Clinical Pharmacology and Therapeutics, 62, 453-463.
Gourlay, S. G., & Benowitz, N. L. (1997). Arteriovenous differences in plasma concentration of nicotine and catecholamines and related cardiovascular effects after smoking, nicotine nasal spray, and intravenous nicotine. Clinical pharmacology and therapeutics, 62, 453-463.
Greenbaum, D., Jansen, R., & Gerstein, M. (2002). Analysis of mRNA expression and protein abundance data: an approach for the comparison of the enrichment of features in the cellular population of proteins and transcripts. Bioinformatics, 18(4), 585-596.
Grimsby, J., Chen, K., Wang, L. J., Lan, N. C., & Shih, J. C. (1991). Human monoamine oxidase A and B genes exhibit identical exon-intron organization. Proceedings of the National Academy of Sciences of the U S A, 88(9), 3637-3641.
- 211 -
Grimsby, J., Lan, N. C., Neve, R., Chen, K., & Shih, J. C. (1990). Tissue distribution of human monoamine oxidase A and B mRNA. Journal of Neurochemistry, 55(4), 1166-1169.
Guang, H.-M., & Du, G.-H. (2006). High-throughput screening for monoamine oxidase-A and monoamine oxidase-B inhibitors using one-step fluorescence assay. Acta Pharmacologica Sinica, 27(6), 760-766.
Guillem, K., Vouillac, C., Azar, M. R., Parsons, L. H., Koob, G. F., Cador, M., et al. (2005). Monoamine oxidase inhibition dramatically increases the motivation to self-administer nicotine in rats. The Journal of Neuroscience, 25(38), 8593-8600.
Harro, J., Fischer, K., Vansteelandt, S., & Harro, M. (2004). Both low and high activities of platelet monoamine oxidase increase the probability of becoming a smoker. European Neuropsychopharmacology, 14(1), 65-69.
Harro, M., Eensoo, D., Kiive, E., Merenakk, L., Alep, J., Oreland, L., et al. (2001). Platelet monoamine oxidase in health 9- and 15-year old children: the effect of gender, smoking and puberty. Progress in Neuro-psychopharmacology & Biological Psychiatry, 25(8), 1497-1511.
Hauptmann, N., & Shih, J. C. (2001). 2-Naphthylamine, a compound found in cigarette smoke, decreases both monoamine oxidase A and B catalytic activity. Life Sciences, 68(11), 1231-1241.
Heath, A. C., Kirk, K. M., Meyer, J. M., & Martin, N. G. (1999). Genetic and social determinants of initiation and age at onset of smoking in Australian twins. Behavioral Genetics, 29(6), 395-407.
Herraiz, T., & Chaparro, C. (2005). Human monoamine oxidase is inhibited by tobacco smoke: beta-carboline alkaloids act as potent and reversible inhibitors. Biochemical and Biophysical Research Communications, 326(2), 378-386.
Hoerndli, F. J., Toigo, M., Schild, A., Gotz, J., & Day, P. J. (2004). Reference genes identified in SH-SY5Y cells using custom-made gene arrays with validation by quantitative polymerase chain reaction. Analytical Biochemistry, 335(1), 30-41.
Holschneider, D. P., & Shih, J. C. (2000). Monoamine oxidase: Basic and clinical perspectives Psychopharmacology - The Fourth Generation of Progress: American College of Neuropsychopharmacology.
Horner, K. A., & Zadina, J. E. (2004). Internalization and down-regulation of mu opioid receptors by endomorphins and morphine in SH-SY5Y human neuroblastoma cells. Brain Research, 1028, 121-132.
Houdi, A. A., Dasgupta, R., & Kindy, M. S. (1998). Effect of nicotine use and withdrawal on brain preproenkephalin A mRNA. Brain Research, 799(2), 257-263.
Hwang, C. K., Song, K. Y., Kim, C. S., Choi, H. S., Guo, X.-H., Law, P.-Y., et al. (2007). Evidence of endogenous mu opioid receptor regulation by epigenetic control of the promoters. Molecular and Cellular Biology, 27(13), 4720-4736.
Inazu, M., Takeda, H., Ikoshi, H., Sugisawa, M., Uchida, Y., & Matsumiya, T. (2001). Pjarmacological characterization and visualization of the glial serotonin transporter. Neurochemistry international, 39(1), 39-49.
Inazu, M., Takeda, H., & Matsumiya, T. (2003). Expression and functional characterization of the extraneuronal monoamine transporter in normal human astrocytes. Journal of Neurochemistry, 84(1), 43-52.
Ino, M., Cole, G. M., & Timiras, P. S. (1986). Tyrosine hydroxylase and monoamine oxidase-A activity increases in differentiating human neuroblastoma after elimination of dividing cells. Brain Research, 395(1), 120-123.
Ito, H., Hamajima, N., Matsuo, K., Okuma, K., Sato, S., Ueda, R., et al. (2003). Monoamine oxidase polymorphisms and smoking behaviour in Japanese. Pharmacogenetics, 13(2), 73-79.
- 212 -
Jahng, J. W., Houpt, T. A., Wessel, T. C., Chen, K., Shih, J. C., & Joh, T. H. (1997). Localization of monoamine oxidase A and B mRNA in the rat brain by in situ hybridization. Synapse, 25(1), 30-36.
Jarvik, M. E., Caskey, N. H., Wirshing, W. C., Madsen, D. C., Iwamoto-Schaap, P. N., Elins, J. L., et al. (2000). Bromocriptine reduces cigarette smoking. Addiction, 95(8), 1173-1183.
Karras, A., & Kane, J. M. (1980). Naloxone reduces cigarette smoking. Life Sciences, 27, 1541-1545.
Keith, D. E., Anton, B., Murray, S. R., Zaki, P. A., Chu, P. C., Lissin, D. V., et al. (1997). -opioid receptor internalization: opiate drugs have differential effects on a conserved endocytic mechanism in vitro and in the mammalian brain. Molecular Pharmacology, 53, 377-384.
Keith, D. E., Murray, S. R., Zaki, P. A., Chu, P. C., Lissin, D. V., Kang, L., et al. (1996). Morphine activates opioid receptors without causing their rapid internalization. The Journal of Biological Chemistry, 271(32), 19021-19024.
Khalil, A., Davies, B., & Castagnoli, N., Jr. (2006). Isolation and characterization of a monoamine oxidase B selective inhibitor from tobacco smoke. Bioorganic & Medicinal Chemistry, 14(10), 3392-3398.
Khalil, A., Steyn, S. J., & Castagnoli, N. (2000). Isolation and Characterization of a Monoamine Oxidase Inhibitor from Tobacco Leaves. Chemical Research in Toxicology, 13, 31-35.
Khalil, A. A., Davies, B., & Castagnoli, N. (2006). Isolation and characterization of a monoamine oxidase B selective inhibitor from tobacco smoke. Bioorganic & Medicinal Chemistry, 14, 3392-3398.
Kieffer, B. L. (1999). Opioids: first lessons from knockout mice. Trends in Pharmacological Sciences, 20, 19-26.
Kivell, B. M., Day, D. J., McDonald, F. J., & Miller, J. H. (2004). Developmental expression of
and opioid receptors in the rat brainstem: evidence for a postnatal switch in isoform expression. Developmental Brain Research, 148, 185-196.
Knackstedt, L. A., LaRowe, S., Mardikian, P., Malcolm, R., Upadhyaya, H., Hedden, S., et al. (2009). The role of cystine-glutamate exchange in nicotine dependence in rats and humans. Biological Psychiatry, 65, 841-845.
Konradi, C., Kornhuber, J., Froelich, L., Fritze, J., Heinsen, H., Beckmann, H., et al. (1989). Demonstration of monoamine oxidase-A and -B in the human brainstem by a histochemical technique. Neuroscience, 33(2), 383-400.
Kraml, M. (1965). A rapid microfluorimetric determination of monoamine oxidase. Biochemical Pharmacology, 14, 1684-1686.
Krueger, M. J., & Singer, T. P. (1993). An Examination of the Reliability of the Radiochemical Assay for Monoamine Oxidases A and B Analytical Biochemistry, 214, 116-123.
Laugesen, M. (2008). Safety report on the Ruyan e-cigarette cartridge and inhaled aerosol. Christchurch, New Zealand: Health New Zealand Ltd, from http://www.healthnz.co.nz/RuyanCartridgeReport30-Oct-08.pdf
Laugesen, M., Epton, M., Frampton, C. M. A., Glover, M., & Lea, R. (2009). Hand-rolled cigarette smoking patterns compared with factory-made cigarette smoking in New Zealand men. BMC Public Health, 9(194).
Launay, J.-M., Del Pino, M., Chironi, G., Callebert, J., Peoc'h, K., Megnien, J.-L., et al. (2009). Smoking induces long-lasting effects through a monoamine-oxidase epigenetic regulation. PLoS ONE, 4(11).
Laviolette, S. R., & van der Kooy, D. (2004). The neurobiology of nicotine addiction: bridging the gap from molecules to behaviour. Nature Reviews Neuroscience, 5(1), 55-65.
Law, P.-Y., Wong, Y. H., & Loh, H. H. (2000). Molecular mechanisms and regulation of opioid receptor signalling. Annual Review of Pharmacology and Toxicology, 40, 389-430.
- 213 -
Lawrence, D. M. P., Thomas, D. A., & Wu, D.-Y. (2007). Glial Cells and the Neurobiology of Addiction. TheScientificWorldJOURNAL, 7(2), 86-88.
Lee, P. W., Wu, S., & Lee, Y. M. (2004). Differential expression of mu-opioid receptor gene in CXBK and B6 mice by Sp1. Molecular Pharmacology, 66(6), 1580-1584.
Lena, I., Ombetta, J., Chalon, S., Dognon, A., Baulieu, J., Frangin, Y., et al. (1995). Iododerivative of pargyline: a potential tracer for the exploration of monoamine oxidase sites by SPECT. Nuclear Medicine and Biology, 22(6), 727-736.
Levitt, P., Pintar, J. E., & Breakefield, X. O. (1982). Immunocytochemical demonstration of monoamine oxidase B in brain astrocytes and serotonergic neurons. Proceedings of the National Academy for Sciences of the U S A, 79(20), 6385-6389.
Livak, K. J., & Schmittgen, T. D. (2001). Analysis of relative gene expression data using real-time quantitative PCR and the 2(-Delta Delta C(T)) Method. Methods, 25(4), 402-408.
Loh, H. H., & Smith, A. P. (1990). Molecular characterization of opioid receptors. Annual Review of Pharmacology and Toxicology, 30, 123-147.
Lukas, R. J., Norman, S. A., & Lucero, L. (1993). Characterization of nicotinic acetylcholine receptors expressed by cells of the SH-SY5Y human neuroblastoma clonal line. Molecular and Cellular Neurosciences, 4(1), 1-12.
Mahmood, I., Neau, S. H., & Mason, W. D. (1994). An enzymatic assay for the MAO-B inhibitor selegiline in plasma. Journal of Pharmaceutical & Buimedical Analysis, 12(7), 895-899.
Mansour, A., Fox, C. A., Akil, H., & Watson, S. J. (1995). Opioid-receptor mRNA expression in the rat CNS: anatomical and functional implications. Trends in Neuroscience, 18(1), 22-29.
Mansvelder, H. D., Keath, J. R., & McGehee, D. S. (2002). Synaptic mechanisms underlie nicotine-induced excitability of brain reward areas. Neuron, 33(6), 905-919.
Marty, M. A., Erwin, V. G., Cornell, K., & Zgombick, J. M. (1985). Effects of nicotine on beta-endorphin, alpha MSH, and ACTH secretion by isolated perfused mouse brains and pituitary glands, in vitro. Pharmacol Biochem Behav, 22(2), 317 - 325.
Massey, J. B., & Churchich, J. E. (1977). Kynuramine, a fluorescent substrate and probe of plasma amine oxidase. The Journal of Biological Chemistry, 252(22), 8081-8084.
Matsuzawa, S., Suzuki, T., & Misawa, M. (2000). Involvement of mu-opioid receptor in the salsolinol-associated place preference in rats exposed to conditioned fear stress. Alcoholism: Clinical and Experimental Research, 24(3), 366-372.
Mazzio, E. A., Kolta, M. G., Reams, R. R., & Soliman, K. F. (2005). Inhibitory effects of cigarette smoke on glial inducible nitric oxide synthase and lack of protective properties against oxidative neurotoxins in vitro. Neurotoxicology, 26(1), 49-62.
McConalogue, K., Grady, E. F., Minnis, J., Balestra, B., Tonini, M., Brecha, N. C., et al. (1999). Activation and internalization of the mu-opioid receptor by the newly disfcovered endogenous agonists, endomorphin-1 and endomorphin-2. Neuroscience, 90(3), 1051-1059.
McDonald, G. R., Hudson, A. L., Dunn, S. M. J., You, H., Baker, G. B., Whittal, R. M., et al. (2008). Bioactive contaminants leach from disposable laboratory plasticware. Science, 322, 917.
McGehee, D. S. (2006). Nicotinic and opioid receptor interactions in nicotine addiction. Mol Interv, 6(6), 311-314.
McGehee, D. S., Heath, M. J., Gelber, S., Devay, P., & Role, L. W. (1995). Nicotine enhancement of fast excitatory synaptic transmission in CNS by pre-synaptic receptors. Science, 269, 1692-1696.
Mendez-Alvarez, E., Soto-Otero, R., Sanchez-Sellero, I., & Lopez-Rivadulla Lamas, M. (1997a). Inhibition of brain monoamine oxidase by adducts of 1,2,3,4-tetrahydroisoquinoline with components of cigarette smoke. Life Sciences, 60(19), 1719-1727.
- 214 -
Mendez-Alvarez, E., Soto-Otero, R., Sanchez-Sellero, I., & Lopez-Rivadulla Lamas, M. (1997b). Inhibition of brain monoamine oxidase by adducts of 1,2,3,4-tetrahydroisoquinoline with components of cigarette smoke. Life Sci, 60(19), 1719-1727.
Meng, S. Z., Ozawa, Y., Itoh, M., & Takashima, S. (1999). Developmental and age-related changes of dopamine transporter, and dopamine D1 and D2 receptors in human basal ganglia. Brain Research, 843(1-2), 136-144.
Minami, M., & Satoh, M. (1995). Molecular biology of the opioid receptors: structures, functions and distributions. Neuroscience Research, 23, 121-145.
Mitoma, J., & Ito, A. (1992). Mitochondrial targeting signal of rat liver monoamine oxidase B is located at its carboxy terminus. Journal of Biochemistry (Tokyo), 111(1), 20-24.
Morens, D. M., Grandinetti, A., Reed, D., White, L. R., & Ross, G. W. (1995). Cigarette smoking and protection from Parkinson's disease: false association or etiologic clue? Neurology, 45(6), 1041-1051.
Morinan, A., & Garratt, H. M. (1985). An improved fluorimetric assay for brain monoamine oxidase. J Pharmacol Methods, 13(3), 213-223.
Nagatsu, T. (2004). Progress in monoamine oxidase (MAO) research in relation to genetic engineering. Neurotoxicology, 25(1-2), 11-20.
Nie, L., Wu, G., & Zhang, W. (2006). Correlation of mRNA expression and protein abundance affected by multiple sequence features related to translational efficiency in Desulfovibrio vulgaris: A quantitative analysis. Genetics, 174, 2229-2243.
O'Carroll, A. M., Fowler, C. J., Phillips, J. P., Tobbia, I., & Tipton, K. F. (1983). The deamination of dopamine by human brain monoamine oxidase. Specificity for the two enzyme forms in seven brain regions. Naunyn Schmiedebergs Archives of Pharmacology, 322(3), 198-202.
O'Sullivan, J., Unzeta, M., Healy, J., O'Sullivan, M. I., Davey, G., & Tipton, K. F. (2004). Semicarbazide-Sensitive Amine Oxidases: Enzymes with quite a lot to do. NeuroToxicology, 25, 303-315.
Okuyemi, K. S., Ahluwalia, J. S., & Harris, K. J. (2000). Pharmacotherapy of smoking cessation. Archives of Family Medicine, 9(3), 270-281.
Olson, J. M., McNeel, W., Young, A. B., & Mancini, W. R. (1992). Localization of the periphreal-type benzodiazepine binding site to mitochondria of human glioma cells. Journal of Neuro-oncology, 13(1), 35-42.
Ono, K., Toyono, T., & Inenaga, K. (2008). Nicotinic receptor subtypes in rat subfornical organ neurons and glial cells. Neuroscience, 154(3), 994-1001.
Oreland, L. (1993). Monoamine oxidase in neuro-psychiatric disorders. In H. Yasuhara (Ed.), Monoamine oxidase (pp. 219-247).
Oreland, L., Fowler, C. J., & Schalling, D. (1981). Low platelet monoamine oxidase activity in cigarette smokers. Life Sciences, 29(24), 2511-2518.
Pahlman, S., Hoehner, J. C., Nanberg, E., Hedborg, F., Fagerstrom, S., Gestblom, C., et al. (1995). Differentiation and survival influences of growth factors in human neuroblastoma. European Journal of Cancer, 31A(4), 453-458.
Pahlman, S., Mamaeva, S., Meyerson, G., Mattsson, M. E. K., Bjelfman, C., Ortoft, E., et al. (1990). Human neuroblastoma cells in culture: a model for neuronal cell differentiation and function. Acta physiologica Scandinavica. Supplementum., 592, 25-37.
Paldyova, E., Bereczki, E., Santha, M., Wenger, T., Borsodi, A., & Benyhe, S. (2007). Altered gene expression and functional activity of opioid receptors in the cerebellum of CB1 cannabinoid receptor knock out mice after acute treatments with cannabinoids. Acta Biologica Hungarica, 58 Suppl, 113-129.
- 215 -
Pan, L., Xu, J., Yu, R., Xu, M.-M., Pan, Y.-X., & Pasternak, G. W. (2005). Identification and characterization of six new alternatively spliced variants of the human mu opioid receptor gene, Oprm. Neuroscience, 133, 209-220.
Pare, C. M. B., & Sandler, M. (1959). A clinical and biochemical study of a trial of Iproniazid in the treatment of depression. Journal of Neurology, Neurosurgery & Psychiatry, 22(3), 247-251.
Patel, M. B., Patel, C. N., Rajashekara, V., & Yoburn, B. C. (2002). Opioid agonists differentially regulate mu-opioid receptors and trafficking proteins in vivo. Molecular Pharmacology, 62(6), 1464-1470.
Pauly, J., Li, Q., & Barry, M. B. (2007). Tobacco-free electronic cigarettes and cigars deliver nicotine and generate concern. Tobacco Control, 16(5), 357.
Peckys, D., & Landwehrmeyer, G. B. (1998). Expression of mu, kappa, and delta opioid receptor messenger RNA in the human CNS: a 33P in situ hybridization study. Neuroscience, 88(4), 1093-1135.
Pelto-Huikko, M., Dagerlind, A., Kononen, J., Lundberg, J. M., Villar, M., Koistinaho, J., et al. (1995). Neuronal regulation of c-fos, c-jun, and junB immediate-early genes in rat adrenal medulla. The Journal of Neuroscience, 15(3 Pt 1), 1854-1868.
Peng, X., Gerzanich, V., Anand, R., Wang, F., & Lindstrom, J. (1997). Chronic nicotine treatment up-regulates alpha3 and alpha7 acetylcholine receptor subtypes expressed by the human neuroblastoma cell line SH-SY5Y. Molecular Pharmacology, 51(5), 776-784.
Peters, I. R., Helps, C. R., Hall, E. J., & Day, M. J. (2004). Real-time RT-PCR: considerations for efficient and sensitive assay design. Journal of Immunological Methods, 286, 203-217.
Pidoplichko, V. I., DeBiasi, M., Williams, J. T., & Dani, J. A. (1997). Nicotine activates and densensitizes midbrain dopamine neurons. Nature, 390, 401-404.
Pidoplichko, V. I., Noguchi, J., Areola, O. O., Liang, Y., Peterson, J., Zhang, T., et al. (2004). Nicotinic cholinergic synaptic mechanisms in the ventral tegmental area contribute to nicotine addiction. Learning & Memory, 11(1), 60-69.
Pinsonneault, J. K., Papp, A. C., & Sadee, W. (2006). Allelic mRNA expression of X-linked monoamine oxidase a (MAOA) in human brain: dissection of epigenetic and genetic factors. Human Molecular Genetics, 15(17), 2636-2649.
Pomerleau, O. F., Fertig, J. B., Seyler, L. E., & Jaffe, J. (1983a). Neuroendocrine reactivity to nicotine in smokers. Psychopharmacology (Berl), 81(1), 61-67.
Pomerleau, O. F., Fertig, J. B., Seyler, L. E., & Jaffe, J. (1983b). Neuroendocrine reactivity to nicotine in smokers. Psychopharmacology, 81, 61-67.
Pontieri, F. E., Tanda, G., Orzi, F., & Di Chiara, G. (1996). Effects of nicotine on the nucleus accumbens and similarity to those of addictive drugs. Nature, 382(6588), 255-257.
Quick, M. W., & Lester, R. A. (2002). Desensitization of neuronal nicotinic receptors. Journal of Neurobiology, 53(4), 457-478.
Ramonet, D., Rodriguez, M., Saura, J., Lizcano, J. M., Romera, M., Unzeta, M., et al. (2003). Localization of monoamine oxidase A and B and semicarbazide-sensitive amine oxidase in human peripheral tissues. Inflammopharmacology, 11(2), 111-117.
Rao, T. S., Correa, L. D., Adams, P., Santori, E. M., & Sacaan, A. I. (2003). Pharmacological characterization of dopamine, norepinephrine and serotonin release in the rat prefrontal cortex by neuronal nicotinic acetylcholine receptor agonists. Brain Research, 990(1-2), 203-208.
Richards, J. G., Saura, J., Ulrich, J., & Da Prada, M. (1992). Molecular neuroanatomy of monoamine oxidases in human brainstem. Psychopharmacology (Berl), 106 Suppl, S21-23.
Riederer, P., Danielczyk, W., & Grunblatt, E. (2004). Monoamine Oxidase-B Inhibition in Alzheimer's Disease. Neurotoxicology, 25(1-2), 271.
- 216 -
Rodriguez, M. J., Saura, J., Billett, E. E., Finch, C. C., & Mahy, N. (2001). Cellular localization of monoamine oxidase A and B in human tissues outside of the central nervous system. Cell and Tissue Research, 304(2), 215-220.
Rommelspacher, H., Meier-Henco, M., Smolka, M., & Kloft, C. (2002). The levels of norharman are high enough after smoking to affect monoamine oxidase B in platelets. European Journal of Pharmacology, 441, 115-125.
Rose, J. E., Behm, F. M., Ramsey, C., & Ritchie, J. C., Jr. (2001). Platelet monoamine oxidase, smoking cessation, and tobacco withdrawal symptoms. Nicotine & Tobacco Research, 3(4), 383-390.
Rose, J. E., Behm, F. M., Westman, E. C., & Coleman, R. E. (1999). Arterial nicotine kinetics during cigarette smoking and intravenous nicotine administration: implications for addiction. Drug and Alcohol Dependence, 56, 99-107.
Roth-Deri, I., Green-Sadan, T., & Yadid, G. (2008). Beta-endorphin and drug-induced reward and reinforcement. Progress in Neurobiology, In press.
Sainz, A. (1960). Indications, Contraindications and Treatment with Monoamine Oxidase Inhibiting Antidepressant Drugs. Angiology, 11(94), 94-98.
Saland, L. C., Hastings, C. M., Abeyta, A., & Chavez, J. B. (2005). Chronic ethanol modulates delta and mu-opioid receptor expression in rat CNS: immunohistochemical analysis with quantitative confocal microscopy. Neuroscience Letters, 381, 163-168.
Salminen, O., Murphy, K. L., McIntosh, J. M., Drago, J., Marks, M. J., Collins, A. C., et al. (2004). Subunit composition and pharmacology of two classes of striatal presynaptic nicotinic acetylcholine receptors mediating dopamine release in mice. Molecular Pharmacology, 65(6), 1526-1535.
Salokangas, R. K., Vilkman, H., Ilonen, T., Taiminen, T., Bergman, J., Haaparanta, M., et al. (2000). High levels of dopamine activity in the basal ganglia of cigarette smokers. The American Journal of Psychiatry, 157(4), 632-634.
Sandler, M., Reveley, M. A., & Glover, V. (1981). Human platelet monoamine oxidase activity in health and disease: a review. Journal of Clinical Pathology, 34(3), 292-302.
Sano, M., Ernesto, C., Thomas, R. G., Klauber, M. R., Schafer, K., Grundman, M., et al. (1997). A controlled trial of selegiline, alpha-tocopherol, or both as treatment for Alzheimer's disease. The Alzheimer's Disease Cooperative Study. New England Journal of Medicine, 336(17), 1216-1222.
Satoh, M., & Minami, M. (1995). Molecular pharmacology of the opioid receptors. [Review]. Pharmacology and therapeutics, 68(3), 343-364.
Saura, J., Bleuel, Z., Ulrich, J., Mendelowitsch, A., Chen, K., Shih, J. C., et al. (1996a). Molecular neuroanatomy of human monoamine oxidases A and B revealed by quantitative enzyme radioautography and in situ hybridization histochemistry. Neuroscience, 70(3), 755-774.
Saura, J., Kettler, R., Da Prada, M., & Richards, J. G. (1992). Quantitative enzyme radioautography with 3H-Ro 41-1049 and 3H-Ro 19-6327 in vitro: localization and abundance of MAO-A and MAO-B in rat CNS, peripheral organs, and human brain. The Journal of Neuroscience, 12(5), 1977-1999.
Saura, J., Nadal, E., van den Berg, B., Vila, M., Bombi, J. A., & Mahy, N. (1996b). Localization of monoamine oxidases in human peripheral tissues. Life Sciences, 59(16), 1341-1349.
Scherer, G. (1999). Smoking behaviour and compensation: a review of the literature. Psychopharmacology, 145, 1-20.
Schousboe, A., Sarup, A., Bak, L. K., Waagepetersen, H. S., & Larsson, O. M. (2004). Role of astrocytic transport processes in glutamatergic and GABAergic neurotransmission. Neurochemistry international, 45(4), 521-527.
- 217 -
Schroeder, J. A., Niculescu, M., & Unterwald, E. M. (2003). Cocaine alters mu but not delta or kappa opioid receptor-stimulated in situ [35S]GTP-deltaS binding in rat brain. Synapse, 47, 26-32.
Schurr, A., Porath, O., Krup, M., & Livne, A. (1978). The effects of hashish components and their mode of action on monoamine oxidase from the brain. . Biochemical Pharmacology, 27(21), 2513-2517.
Schurr, A., & Rigor, B. M. (1984). Cannabis extracts, but not delta 1-tetrahydrocannabinol, inhibits human brain and liver monoamine oxidase. General Pharmacology, 15(2), 171-174.
Serres, F., & Carney, S. L. (2006). Nicotine regulates SH-SY5Y neuroblastoma cell proliferation through the release of brain-derived neurotrophic factor. Brain Research, 1101(1), 36-42.
Sharma, G., & Vijayaraghavan, S. (2002). Nicotinic receptor signaling in nonexcitable cells. Journal of Neurobiology, 53, 524-534.
Sherer, T. B., Trimmer, P., Borland, K., Parks, J. K., Bennett, J. P. J., & Tuttle, J. B. (2001). Chronic reduction in complex I function alters calcium signalling in SH-SY5Y neuroblastoma cells. Brain Research, 891, 94-105.
Shih, J. C., Chen, K., & Ridd, M. J. (1999). Monoamine oxidase: from genes to behavior. Annual Review of Neuroscience, 22, 197-217.
Simons, C. T., Cuellar, J. M., Moore, J. A., Pinkerton, K. E., Uyeminami, D., Carstens, M. I., et al. (2005). Nicotinic receptor involvement in antinociception induced by exposure to cigarette smoke. Neuroscience Letters, 389(2), 71-76.
Simpson, G. M., Shih, J. C., Chen, K., Flowers, C., Kumazawa, T., & Spring, B. (1999). Schizophrenia, monoamine oxidase activity, and cigarette smoking. Neuropsychopharmacology, 20(4), 392-394.
Sivasubramaniam, S. D., Finch, C. C., Rodriguez, M. J., Mahy, N., & Billett, E. E. (2003). A comparative study of the expression of monoamine oxidase-A and -B mRNA and protein in non-CNS human tissues. Cell and Tissue Research, 313(3), 291-300.
Snell, L. D., Glanz, J., & Tabakoff, B. (2002). Relationships between effects of smoking, gender, and alcohol dependence on platelet monoamine oxidase-B: activity, affinity labeling, and protein measurements. Alcoholism: Clinical and Experimental Research, 26(7), 1105-1113.
Sokolova, E., Matteoni, C., & Nistri, A. (2005). Desensitization of neuronal nicotinic receptors of human neuroblastoma SH-SY5Y cells during short or long exposure to nicotine. British Journal of Pharmacology, 146(8), 1087-1095.
Spanagel, R., Herz, A., & Shippenberg, T. S. (1990). Identification of the opioid receptor types mediating beta-endorphin-induced alterations in dopamine release in the nucleus accumbens. European Journal of Pharmacology, 190, 177-190.
Stella, N. (2004). Cannabinoid signaling in glial cells. Glia, 48(4), 267-277. Stephens, W. E. (2007). Dependence of tar, nicotine and carbon monoxide yields on physical
parameters: implications for exposure, emissions control and monitoring. Tobacco Control, 16, 170-176.
Sweetman, A. J., & Weetman, D. F. (1969). Polarographic assay of monoamine oxidase. British Journal of Pharmacology, 37(2), 550P.
Takeda, H., Inazu, M., & Matsumiya, T. (2002). Astroglial dopamine transport is mediated by norepinephrine transporter. Naunyn Schmiedebergs Arch Pharmacol, 366(6), 620-623.
Talhout, R., Opperhuizen, A., & van Amsterdam, J. G. (2007). Role of acetaldehyde in tobacco smoke addiction. European Neuropsychopharmacology, 17(10), 627-636.
Tan, E. K., Chai, A., Lum, S. Y., Shen, H., Tan, C., Teoh, M. L., et al. (2003). Monoamine oxidase B polymorphism, cigarette smoking and risk of Parkinson's disease: a study in an Asian
- 218 -
population. American Journal of Medical Genetics Part B (Neuropsychiatric Genetics), 120(1), 58-62.
Tanda, G., & Di Chiara, G. (1998). A dopamine-mu1 opioid link in the rat ventral tegmentum shared by palatable food (Fonzies) and non-psychostimulant drugs of abuse. European Journal of Neuroscience, 10(3), 1179-1187.
Teaktong, T., Graham, A. J., Johnson, M., Court, J. A., & Perry, E. K. (2003). Selective changes in nicotinic acetylcholine receptor subtypes related to tobacco smoking: an immunohistochemical study. Neuropathology and Applied Neurobiology, 30, 243-254.
Teodorov, E., Modena, C. C., Sukikara, M. H., & Felicio, L. F. (2006). Preliminary study of the effects of morphine treatment on opioid receptor gene expressionin brain structures of the female rat. Neuroscience, 141, 1225-1231.
Thorpe, L. W., Westlund, K. N., Kochersperger, L. M., Abell, C. W., & Denney, R. M. (1987). Immunocytochemical localization of monoamine oxidases A and B in human peripheral tissues and brain. The Journal of Histochemistry and Cytochemistry, 35(1), 23-32.
Van Amsterdam, J. G., Talhout, R., Vleeming, W., & Opperhuizen, A. (2006). Contribution of monoamine oxidase (MAO) inhibition to tobacco and alcohol addiction. [Minireview]. Life Sciences, 79, 1969-1973.
Vaughan, P. F. T., Kaye, D. F., Reeve, H. L., Ball, S. G., & Peers, C. (1993). Nicotinic receptor-mediated release of noradrenaline in the human neuroblastoma SH-SY5Y. Journal of Neurochemistry, 60(6), 2159-2166.
Vaughan, P. F. T., Peers, C., & Walker, J. H. (1995). The use of the human neuroblastoma SH-SY5Y to study the effect of second messengers on noradrenaline release. [Review]. General Pharmacology, 26(6), 1191-1201.
Vecchiola, A., Collyer, P., Figueroa, R., Labarca, R., Bustos, G., & Magendzo, K. (1999). Differential regulation of mu-opioid receptor mRNA in the nucleus accumbens shell and core accompanying amphetamine behavioural sensitization. Molecular Brain Research, 69(1), 1-9.
Vijayaraghavan, S. (2009). Glial-neuronal interactions - implications for plasticity and drug addiction. The AAPS Journal, 11(1), 123-132.
Villegier, A. S., Blanc, G., Glowinski, J., & Tassin, J. P. (2003). Transient behavioral sensitization to nicotine becomes long-lasting with monoamine oxidases inhibitors. Pharmacology, Biochemistry and Behavior, 76(2), 267-274.
Villegier, A. S., Lotfipour, S., McQuown, S. C., Belluzzi, J. D., & Leslie, F. M. (2007). Tranylcypromine enhancement of nicotine self-administration. Neuropharmacology, 52(6), 1415-1425.
Waldhoer, M., Bartlett, S. E., & Whistler, J. L. (2004). Opioid Receptors. Annual Review of Biochemistry, 73, 953-990.
Walters, C. L., Cleck, J. N., Kuo, Y. C., & Blendy, J. A. (2005). Mu-opioid receptor and CREB activation are required for nicotine reward. Neuron, 46(6), 933-943.
Watkins, L. R., Hutchinson, M. R., Johnston, I. N., & Maier, S. F. (2005). Glia: novel counter-regulators of opioid analgesia. Trends in Neurosciences, 28(12), 661-669.
Wei, L.-N. (2008). Epigenetic control of the expression of opioid receptor genes. Epigenetics, 3(3), 119-121.
Weinberger, A. H., Reutenauer, E. L., Jatlow, P. I., O'Malley, S. S., & George, T. P. (2010). A double-blind, placebo-controlled, randomized clinical trial of oral selegiline hydrochloride for smoking cessation in nicotine-dependent cigarette smokers. Drug and Alcohol Dependence, 107(2-3), 188-195.
Westenberger, B. J. (2009). Evaluation of e-cigarettes. St Louis, Missouri, USA.: Food and Drug Administration, from http://www.fda.gov/downloads/Drugs/ScienceResearch/UCM173250.pdf
- 219 -
Westlund, K. N., Denney, R. M., Kochersperger, L. M., Rose, R. M., & Abell, C. W. (1985). Distinct monoamine oxidase A and B populations in primate brain. Science, 230(4722), 181-183.
Westlund, K. N., Denney, R. M., Rose, R. M., & Abell, C. W. (1988). Localization of distinct monoamine oxidase A and monoamine oxidase B cell populations in human brainstem. Neuroscience, 25(2), 439-456.
Wewers, M. E., Dhatt, R. K., Snively, T. A., & Tejwani, G. A. (1999). The effect of chronic administration of nicotine on antinociception, opioid receptor binding and met-enkelphalin levels in rats. Brain Research, 822(1-2), 107-113.
Wewers, M. E., Dhatt, R. K., & Tejwani, G. A. (1998). Naltrexone administration affects ad libitum smoking behaviour. Psychopharmacology, 140, 185-190.
Wewers, M. E., Tejwani, G. A., & Anderson, J. (1994). Plasma nicotine, plasma beta-endorphin and mood states during periods of chronic smoking, abstinence and nicotine replacement. Psychopharmacology (Berl), 116(1), 98-102.
Weyler, W., Hsu, Y. P., & Breakefield, X. O. (1990). Biochemistry and genetics of monoamine oxidase. Pharmacology & Therapeutics, 47(3), 391-417.
WHO (2008). Marketers of electronic cigarettes should halt unproved therapy claims. Retrieved 27/01/2010, from http://www.who.int/mediacentre/news/releases/2008/pr34/en/index.html
Winkler, A., Buzas, B., Siems, W. E., Heder, G., & Cox, B. M. (1998). Effect of ethanol drinking on the gene expression of opioid receptors, enkephalinase, and angiotensin-converting enzyme in two inbred mice strains. Alcoholism: Clinical and Experimental Research, 22(6), 1262-1271.
Wonnacott, S., Sidhpura, N., & Balfour, D. J. (2005). Nicotine: from molecular mechanisms to behaviour. Current Opinion in Pharmacology, 5(1), 53-59.
Xue, Y., & Domino, E. F. (2007). Tobacco/nicotine and endogenous brain opioids. Progress in Neuropsychopharmacology & Biological Psychiatry.
Yabaluri, N., & Medzihradsky, F. (1997). Down-regulation of mu-opioid receptor by full but not partial agonists is independent of G protein coupling. Molecular Pharmacology, 52, 896-902.
Yamada, M., & Yasuhara, H. (2004). Clinical Pharmacology of MAO Inhibitors: Safety and Future. Neurotoxicology, 25(1-2), 215.
Yan, Z., Caldwell, G. W., Zhao, B., & Reitz, A. B. (2004). A high-throughput monoamine oxidase inhibition assay using liquid chromatography with tandem mass spectrometry. Rapid Communications in Mass Spectrometry, 18, 834-840.
Youdim, M. B., & Finberg, J. P. (1987). Monoamine oxidase B inhibition and the "cheese effect". Journal of Neural Transmission Supplement, 25, 27-33.
Young, D., Borland, R., Hammond, D., Cummings, K. M., Devlin, E., Yong, H.-H., et al. (2006). Prevalence and attributes of roll-your-own smokers in the International Tobacco Control (ITC) Four Country Survey. Tobacco Control, 15 (Suppl III).
Yu, P. H., & Boulton, A. A. (1987). Irreversible inhibition of monoamine oxidase by some components of cigarette smoke. Life Sciences, 41(6), 675-682.
Yu, P. H., Davis, B. A., & Boulton, A. A. (1992). Neuronal and astroglial monoamine oxidase: pharmacological implications of specific MAO-B inhibitors. Progress in Brain Research, 94, 309-315.
Yu, X., Mao, X., Blake, A. D., Li, W. X., & Chang, S. L. (2003). Morphine and endomorphins differentially regulate mu-opioid receptor mRNA in SH-SY5Y human neuroblastoma cells. The Journal of Pharmacology and Experimental Therapeutics, ???
Yuan, J. S., Reed, A., Chen, F., & Stewart, C. N., Jr. (2006). Statistical analysis of real-time PCR data. BMC Bioinformatics, 7, 85.
- 220 -
Yuan, J. S., Wang, D., & Stewart, C. N., Jr. (2008). Statistical methods for efficiency adjusted real-time PCR quantification. Biotechnol Journal, 3(1), 112-123.
Zadina, J. E., Chang, S. L., Ge, L.-J., & Kastin, A. J. (1993). Mu opiate receptor down-regulation by morphine and up-regulation by naloxone in SH-SY5Y human neuroblastoma cells. The Journal of Pharmacology and Experimental Therapeutics, 265(1), 254-262.
Zadina, J. E., Hackler, L., Ge, L.-J., & Kastin, A. J. (1997). A potent and selective endogenous agonist for the mu-opiate receptor. Nature, 386, 499-502.
Zadina, J. E., Harrison, L. M., Ge, L.-J., Kastin, A. J., & Chang, S. L. (1994). Differential regulation of mu and delta opiate receptors by morphine, selective agonists and antagonists and differentiating agents in SH-SY5Y human neuroblastoma cells. The Journal of Pharmacology and Experimental Therapeutics, 270(3), 1086-1096.
Zaki, P. A., Bilsky, E. J., Vanderah, T. W., Lai, J., Evans, C. J., & Porreca, F. (1996). Opioid receptor types and subtypes: the delta receptor as a model. Annual Review of Pharmacology and Toxicology, 36, 379-401.
Zhou, M., & Panchuk-Voloshina, N. (1997). A one-step fluorometric method for the continuous measurement of monoamine oxidase activity. Analytical Biochemistry, 253(2), 169-174.
Zhu, Q. S., Grimsby, J., Chen, K., & Shih, J. C. (1992). Promoter organization and activity of human monoamine oxidase (MAO) A and B genes. Journal of Neuroscience, 12(11), 4437-4446.
Zhuang, Z. P., Marks, B., & McCauley, R. B. (1992). The insertion of monoamine oxidase A into the outer membrane of rat liver mitochondria. Journal of Biological Chemistry, 267(1), 591-596.
Zitova, A., Hynes, J., Kollar, J., Borisov, S. M., Klimant, I., & Papkovsky, D. B. (2009). Analysis of activity and inhibition of oxygen-dependent enzymes by optical respirometry on the LightCycler system. Analytical Biochemistry, in press.
- 221 -
Chapter Nine: Appendix
9.1 – BUFFERS & SOLUTIONS
Cell Lysis Buffer (1 mM MgCl2, 2mM EGTA, 1% Nonidet P40, 50 mM Tris)
250 µL 2 M MgCl2
0.38 g EGTA
5 mL Nonidet P40
50 mL 0.5 M Tris-HCl, pH 6.8
All reagents were dissolved in 300 mL of ddH2O, before the total volume was adjusted to 50
mL with additional ddH2O. This buffer was stored at -20°C in 50 mL aliquots.
10x Stock Phosphate Buffered Saline(PBS)
80.0 g NaCl
2.0 g KCl
26.8 g Na2HPO4
All salts were dissolved in 800 mL of ddH2O, and the solution pH was adjusted to pH = 7.4 with
addition of HCl or NaOH. Additional ddH2O was added to make the solution up to 1 Litre.
This stock was diluted to a 1x solution before use.
- 222 -
Sodium Phosphate Buffer (50 mM Sodium phosphate, 150 mM Sodium chloride)
3.58 g Sodium Phosphate (Na2HPO4.12H2O)
1.75 g Sodium chloride
Salts were dissolved in 100 mL of ddH2O, and the pH of the solution was adjusted to pH = 7.4
with addition of concentrated HCl or NaOH. Additional ddH2O was added to make the
solution up to 200 mL.
Tris Buffered Saline (TBS) (50 mM Tris, 150 mM NaCl)
6.05 g Tris-base
8.76 g NaCl
Salts were dissolved in 800 mL of ddH2O, and the pH was adjusted to pH = 7.5 with addition of
HCl. The solution was made up to a total 1 Litre volume with additional ddH2O.
T-TBS
1 mL of Tween®20 was added to 1 Litre of TBS (see above).
Western Transfer Buffer
9.09 g Tris-base
43.2 g Glycine
3 g Sodium diodecyl sulphate
300 mL Methanol
All reagents were combined with ddH2O to a volume of 3 Litres.
- 223 -
Agarose Gel (2%)
1g Agarose
50 mL TAE Buffer
All reagents were combined in a glass beaker, and heated in a microwave for approximately 1
minute, until all agarose had dissolved. The solution was cooled briefly (approximately 1
minute), before addition of 10 µL ethidium bromide solution. The gel solution was then
poured smoothly into a agarose gel apparatus, and well forming combs were applied. Gels
were run at 100 V for approximately 30 minutes.
DNA Loading Dye (6x)
250 mg Bromophenol Blue
33 mL 150 mM Tris, pH 7.6
60 mL Glycerol
7 mL ddH2O
Bromophenol blue was dissolved in Tris solution, before the addition of glycerol. The glycerol
was mixed with the bromophenol solution thoroughly, and ddH2O was added to make the
total volume 100 mL.
50x TAE Buffer
242 g Tris-base
100 mL 0.5 M Na2EDTA (pH 8.0)
57.1 mL Glacial acetic acid
All reagents were combined in 600 mL ddH2O. The volume was then adjusted to 1 Litre with
additional ddH2O. This stock was diluted to a 1x solution with ddH2O before use.

- 224 -
9.2 –TPM SAMPLE NUMBERING SCHEME
The below numbering scheme was used to track TPM filters and the extracts produced from
the in the laboratory. The data is reproduced here to elucidate sample abbreviations used in
the text.
Table 21: TPM Sample numbering scheme and abbreviations
Sample Abbreviation
ESR Sample no. Brand Description
Cigarettes 15-Win VA00015-20060317XEb Winfield King Size Filter 16-WinEM VA00016-20060317XEb Winfield Extra Mild 17-B&H VA00017-20060317XEb Benson & Hedges Special Filter 18-Pall VA00018-20060317XEb Pall Mall Filter 19-Hol VA00019-20060317XEb Holiday Special Filter 20-HolM VA00020-20060317XEb Holiday Menthol Mild 21-Roth VA00021-20060317XEb Rothmans King Size 35-Hol VA00035-20070511XEb Holiday Regular 36-Hol VA00036-20070511XEe Holiday Regular 32-Q3 VA00032-20070511XEg Quest 3 Nicotine free 34-Q1 VA00034-20070511XEg Quest 1 Low nicotine Tobacco 23-Port VA00023-20060317XEb Port Royal 24-Park VA00024-20060317XEb Park Drive 25-Drum VA00025-20060317XEb Drum 26-Park VA00026-20060317XEb Park Drive 27-HolTM VA00027-20060317XEb Holiday Menthol 28-HolT VA00028-20060317XEb Holiday
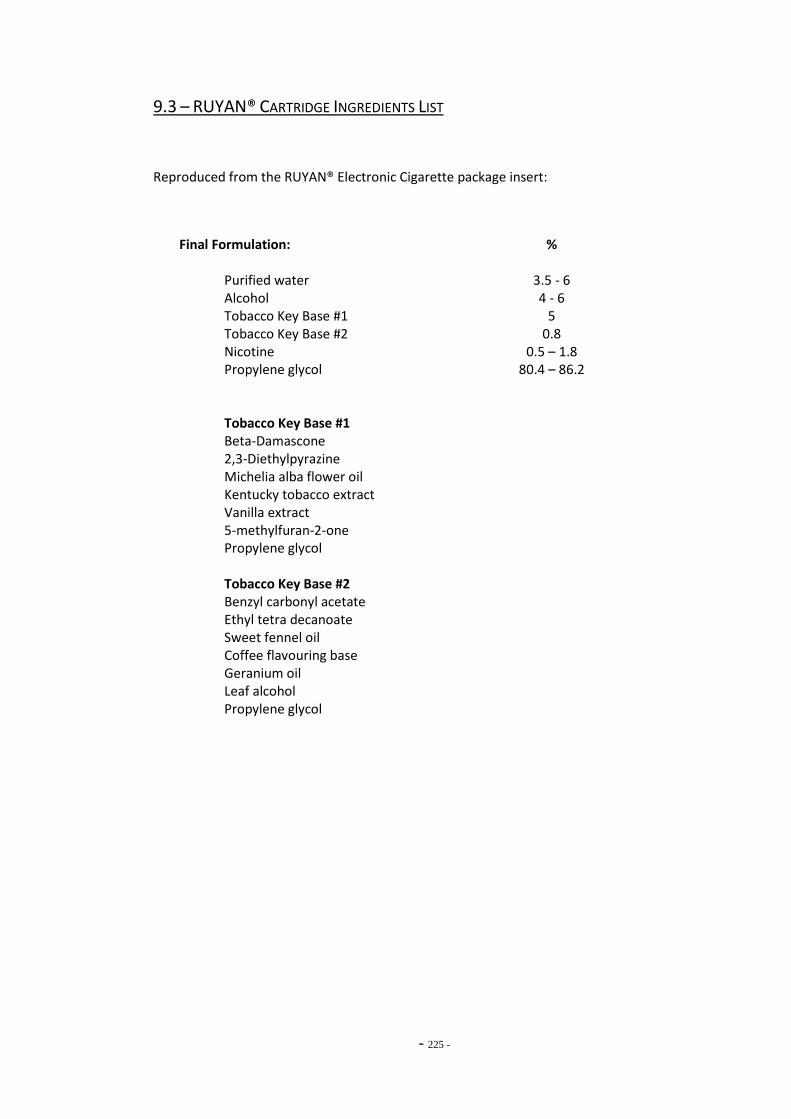
- 225 -
9.3 – RUYAN® CARTRIDGE INGREDIENTS LIST
Reproduced from the RUYAN® Electronic Cigarette package insert:
Final Formulation: % Purified water 3.5 - 6 Alcohol 4 - 6 Tobacco Key Base #1 5 Tobacco Key Base #2 0.8 Nicotine 0.5 – 1.8 Propylene glycol 80.4 – 86.2 Tobacco Key Base #1 Beta-Damascone 2,3-Diethylpyrazine Michelia alba flower oil Kentucky tobacco extract Vanilla extract 5-methylfuran-2-one Propylene glycol Tobacco Key Base #2 Benzyl carbonyl acetate Ethyl tetra decanoate Sweet fennel oil Coffee flavouring base Geranium oil Leaf alcohol Propylene glycol
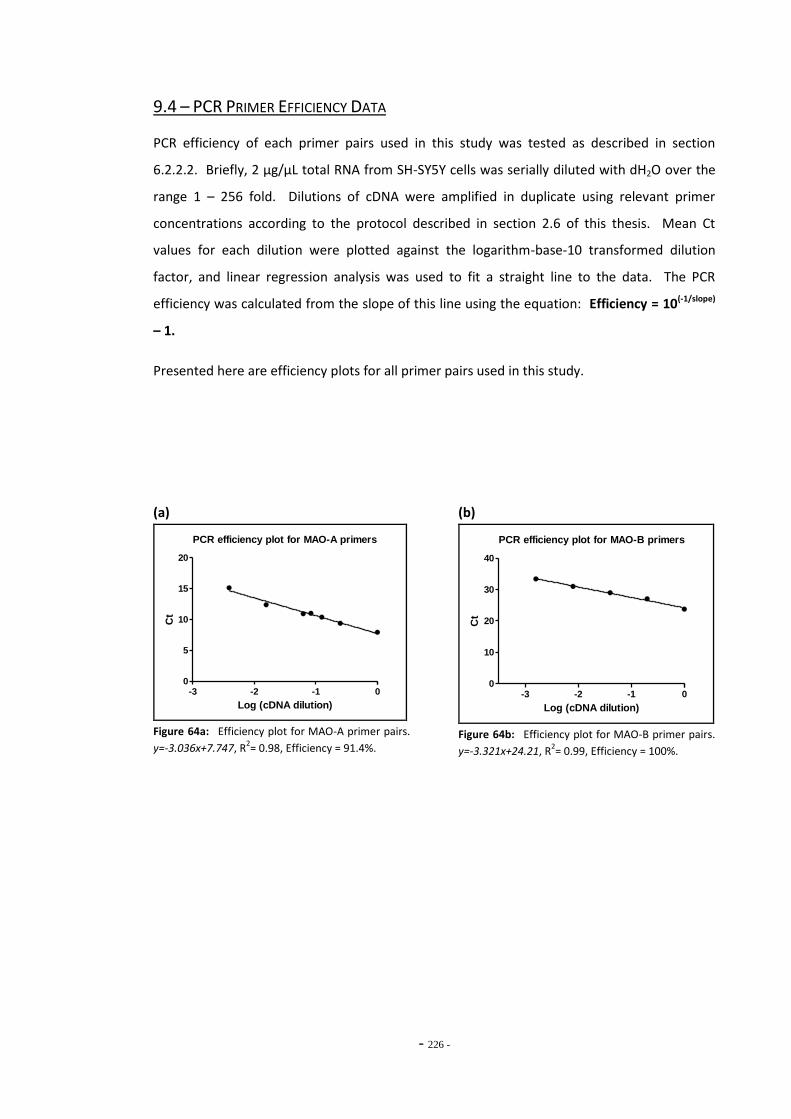
- 226 -
9.4 – PCR PRIMER EFFICIENCY DATA
PCR efficiency of each primer pairs used in this study was tested as described in section
6.2.2.2. Briefly, 2 μg/μL total RNA from SH-SY5Y cells was serially diluted with dH2O over the
range 1 – 256 fold. Dilutions of cDNA were amplified in duplicate using relevant primer
concentrations according to the protocol described in section 2.6 of this thesis. Mean Ct
values for each dilution were plotted against the logarithm-base-10 transformed dilution
factor, and linear regression analysis was used to fit a straight line to the data. The PCR
efficiency was calculated from the slope of this line using the equation: Efficiency = 10(-1/slope)
– 1.
Presented here are efficiency plots for all primer pairs used in this study.
(a)
PCR efficiency plot for MAO-A primers
-3 -2 -1 00
5
10
15
20
Log (cDNA dilution)
Ct
Figure 64a: Efficiency plot for MAO-A primer pairs.
y=-3.036x+7.747, R2= 0.98, Efficiency = 91.4%.
(b)
PCR efficiency plot for MAO-B primers
-3 -2 -1 00
10
20
30
40
Log (cDNA dilution)
Ct
Figure 64b: Efficiency plot for MAO-B primer pairs.
y=-3.321x+24.21, R2= 0.99, Efficiency = 100%.
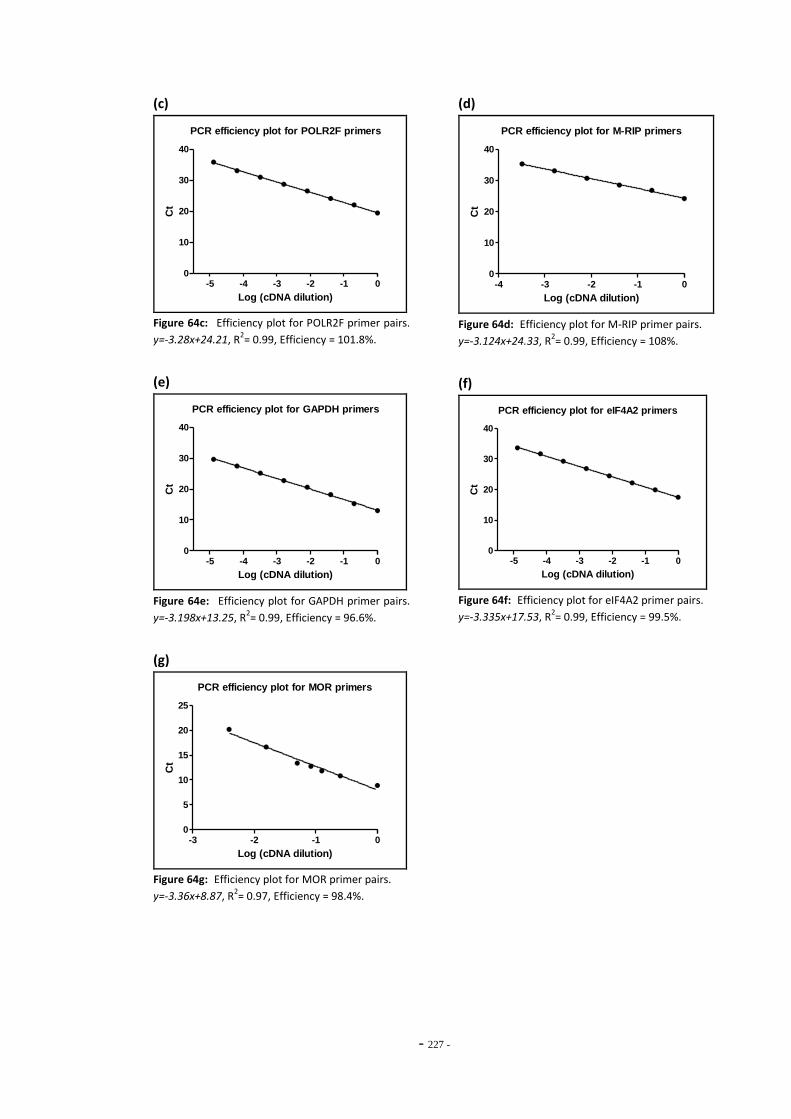
- 227 -
(c)
PCR efficiency plot for POLR2F primers
-5 -4 -3 -2 -1 00
10
20
30
40
Log (cDNA dilution)
Ct
Figure 64c: Efficiency plot for POLR2F primer pairs.
y=-3.28x+24.21, R2= 0.99, Efficiency = 101.8%.
(e)
PCR efficiency plot for GAPDH primers
-5 -4 -3 -2 -1 00
10
20
30
40
Log (cDNA dilution)
Ct
Figure 64e: Efficiency plot for GAPDH primer pairs.
y=-3.198x+13.25, R2= 0.99, Efficiency = 96.6%.
(g)
PCR efficiency plot for MOR primers
-3 -2 -1 00
5
10
15
20
25
Log (cDNA dilution)
Ct
Figure 64g: Efficiency plot for MOR primer pairs.
y=-3.36x+8.87, R2= 0.97, Efficiency = 98.4%.
(d)
PCR efficiency plot for M-RIP primers
-4 -3 -2 -1 00
10
20
30
40
Log (cDNA dilution)
Ct
Figure 64d: Efficiency plot for M-RIP primer pairs.
y=-3.124x+24.33, R2= 0.99, Efficiency = 108%.
(f)
PCR efficiency plot for eIF4A2 primers
-5 -4 -3 -2 -1 00
10
20
30
40
Log (cDNA dilution)
Ct
Figure 64f: Efficiency plot for eIF4A2 primer pairs.
y=-3.335x+17.53, R2= 0.99, Efficiency = 99.5%.