Embed Size (px)
Citation preview


Tailoring DietsTailoring DietsTailoring DietsTailoring DietsTailoring Diets
to Your Farmto Your Farmto Your Farmto Your Farmto Your Farm .............................................11111
Estimating NutrientEstimating NutrientEstimating NutrientEstimating NutrientEstimating Nutrient
RequirementsRequirementsRequirementsRequirementsRequirements ........................................ 33333
Estimating NutrientEstimating NutrientEstimating NutrientEstimating NutrientEstimating Nutrient
Needs at EachNeeds at EachNeeds at EachNeeds at EachNeeds at Each
Production StageProduction StageProduction StageProduction StageProduction Stage.............................. 55555
Vitamin and MineralVitamin and MineralVitamin and MineralVitamin and MineralVitamin and Mineral
Requirements at EachRequirements at EachRequirements at EachRequirements at EachRequirements at Each
Stage of ProductionStage of ProductionStage of ProductionStage of ProductionStage of Production............... 1717171717
Appendix.Appendix.Appendix.Appendix.Appendix.Determining Lean GainDetermining Lean GainDetermining Lean GainDetermining Lean GainDetermining Lean Gain
for Pigsfor Pigsfor Pigsfor Pigsfor Pigs ...................................................................... 2121212121
TABLETABLETABLETABLETABLE
O FO FO FO FO F
CONTENTSCONTENTSCONTENTSCONTENTSCONTENTS
Jerry D. Hawton, PhD.Jerry D. Hawton, PhD.Jerry D. Hawton, PhD.Jerry D. Hawton, PhD.Jerry D. Hawton, PhD.
Extension Animal Scientist - Swine
Department of Animal Science
385 Animal Science/Vet Medicine
1988 Fitch Avenue
St. Paul, MN 55108
phone: (612) 624-2270
Internet:
James E. Pettigrew, PhD.James E. Pettigrew, PhD.James E. Pettigrew, PhD.James E. Pettigrew, PhD.James E. Pettigrew, PhD.
Professor - Swine Nutrition
Department of Animal Science
385 Animal Science/Vet Medicine
1988 Fitch Avenue
St. Paul, MN 55108
phone: (612) 624-5340
Internet: [email protected]
AuthorsAuthorsAuthorsAuthorsAuthors
Monica L. AugensteinMonica L. AugensteinMonica L. AugensteinMonica L. AugensteinMonica L. Augenstein
Graduate Research Assistant
Lee J. Johnston, PhD.Lee J. Johnston, PhD.Lee J. Johnston, PhD.Lee J. Johnston, PhD.Lee J. Johnston, PhD.
Extension Animal Scientist - Swine
West Central Experiment Station
Morris, MN 56267
phone: (612) 589-1711
Internet: [email protected]
Gerald C. Shurson, PhD.Gerald C. Shurson, PhD.Gerald C. Shurson, PhD.Gerald C. Shurson, PhD.Gerald C. Shurson, PhD.
Extension Animal Scientist - Swine
Department of Animal Science
385 Animal Science/Vet Medicine
1988 Fitch Ave.
St. Paul, MN 55108
phone: (612) 624-2764
Internet: [email protected]
Conversion FactorsConversion FactorsConversion FactorsConversion FactorsConversion Factors
1 lb = 454 grams (g)
1 kilogram (kg) = 1000 grams = 2.2 lb
1 gram = 1000 milligrams (mg)
1 megacalorie (Mcal) = 1000 kilocalories (kcal)
1 milligram = 1000 micrograms (mcg)
1 mg/kg = 1 part per million (ppm)
1 inch = 2.54 centimeters
1 IU = 1 USP
To convert from % to ppm, move 4 decimal places to the right.
(.05% = 500 ppm)
To convert from ppm to %, move 4 decimal places to the left.
(40 ppm = .004%)
Tailoring Diets to Your FarmTailoring Diets to Your FarmTailoring Diets to Your FarmTailoring Diets to Your FarmTailoring Diets to Your Farm
odern research and
management suggests feeding
programs for swine herds be
modified to optimize nutrition
for new conditions and objec-
tives. A key component of
better swine feeding for the
future is improving the accu-
racy of determining and meet-
ing nutrient requirements.
Nutrient requirements of pigs
depend on many factors. Thus,
one set of diets is inadequate
to meet the needs of all pigs in
different swine operations.
The objective of thisThe objective of thisThe objective of thisThe objective of thisThe objective of this
publication is to present apublication is to present apublication is to present apublication is to present apublication is to present a
broader approach to swinebroader approach to swinebroader approach to swinebroader approach to swinebroader approach to swine
herd nutrition: tailoringherd nutrition: tailoringherd nutrition: tailoringherd nutrition: tailoringherd nutrition: tailoring
diets to conditions anddiets to conditions anddiets to conditions anddiets to conditions anddiets to conditions and
objectives specific to eachobjectives specific to eachobjectives specific to eachobjectives specific to eachobjectives specific to each
farm.farm.farm.farm.farm.
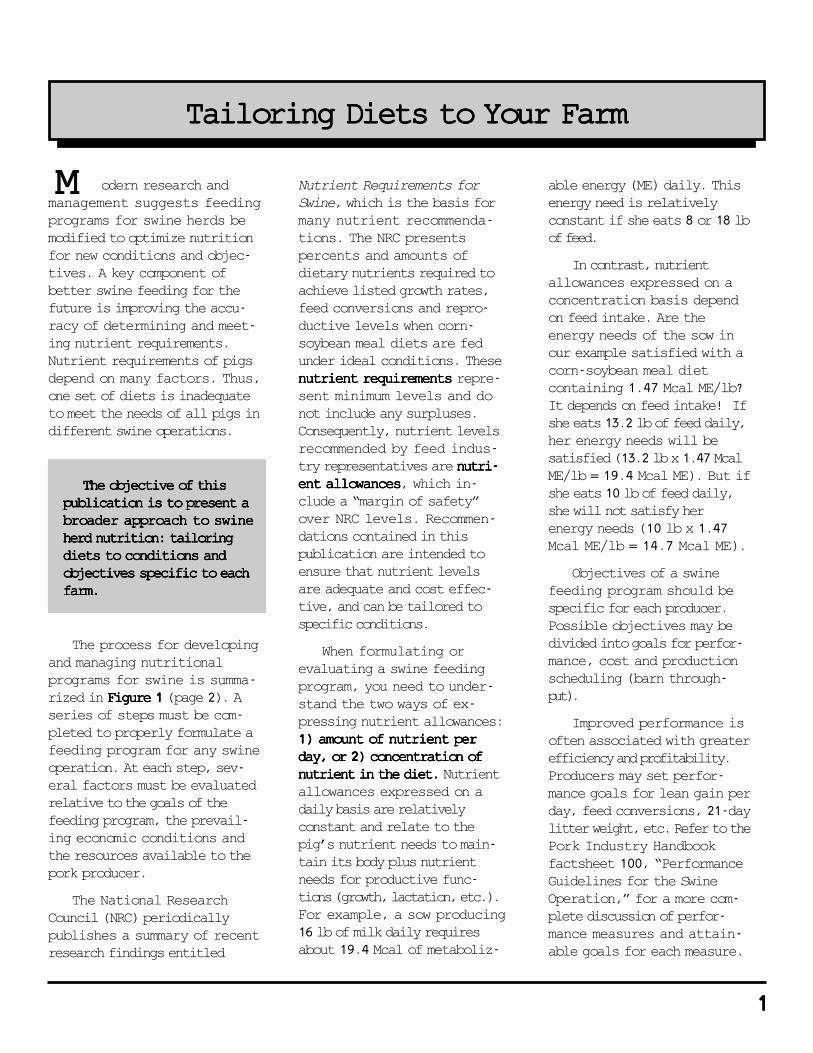
The process for developing
and managing nutritional
programs for swine is summa-
rized in Figure 1 Figure 1 Figure 1 Figure 1 Figure 1 (page 2). A
series of steps must be com-
pleted to properly formulate a
feeding program for any swine
operation. At each step, sev-
eral factors must be evaluated
relative to the goals of the
feeding program, the prevail-
ing economic conditions and
the resources available to the
pork producer.
The National Research
Council (NRC) periodically
publishes a summary of recent
research findings entitled
MMMMM Nutrient Requirements for
Swine, which is the basis for
many nutrient recommenda-
tions. The NRC presents
percents and amounts of
dietary nutrients required to
achieve listed growth rates,
feed conversions and repro-
ductive levels when corn-
soybean meal diets are fed
under ideal conditions. These
nutrient requirementsnutrient requirementsnutrient requirementsnutrient requirementsnutrient requirements repre-
sent minimum levels and do
not include any surpluses.
Consequently, nutrient levels
recommended by feed indus-
try representatives are nutri-nutri-nutri-nutri-nutri-
ent allowancesent allowancesent allowancesent allowancesent allowances, which in-
clude a “margin of safety”
over NRC levels. Recommen-
dations contained in this
publication are intended to
ensure that nutrient levels
are adequate and cost effec-
tive, and can be tailored to
specific conditions.
When formulating or
evaluating a swine feeding
program, you need to under-
stand the two ways of ex-
pressing nutrient allowances:
1) amount of nutrient per1) amount of nutrient per1) amount of nutrient per1) amount of nutrient per1) amount of nutrient per
day, or 2) concentration ofday, or 2) concentration ofday, or 2) concentration ofday, or 2) concentration ofday, or 2) concentration of
nutrient in the diet.nutrient in the diet.nutrient in the diet.nutrient in the diet.nutrient in the diet. Nutrient
allowances expressed on a
daily basis are relatively
constant and relate to the
pig’s nutrient needs to main-
tain its body plus nutrient
needs for productive func-
tions (growth, lactation, etc.).
For example, a sow producing
16 lb of milk daily requires
about 19.4 Mcal of metaboliz-
able energy (ME) daily. This
energy need is relatively
constant if she eats 8 or 18 lb
of feed.
In contrast, nutrient
allowances expressed on a
concentration basis depend
on feed intake. Are the
energy needs of the sow in
our example satisfied with a
corn-soybean meal diet
containing 1.47 Mcal ME/lb?
It depends on feed intake! If
she eats 13.2 lb of feed daily,
her energy needs will be
satisfied (13.2 lb x 1.47 Mcal
ME/lb = 19.4 Mcal ME). But if
she eats 10 lb of feed daily,
she will not satisfy her
energy needs (10 lb x 1.47
Mcal ME/lb = 14.7 Mcal ME).
Objectives of a swine
feeding program should be
specific for each producer.
Possible objectives may be
divided into goals for perfor-
mance, cost and production
scheduling (barn through-
put).
Improved performance is
often associated with greater
efficiency and profitability.
Producers may set perfor-
mance goals for lean gain per
day, feed conversions, 21-day
litter weight, etc. Refer to the
Pork Industry Handbook
factsheet 100, “Performance
Guidelines for the Swine
Operation,” for a more com-
plete discussion of perfor-
mance measures and attain-
able goals for each measure.
11111
Quantify Biology of Animals
Determine & adjustrequirements
A. Feed Intake • Grow-finish • Lactation
B. Productivity Level • Grow-finish 1. ADG 2. Lean growth rates
• Lactation 1. 21-day litter weight 2. Weaning to estrus (lactation weight loss)
• Nursery 1. ADG 2. Mortality/morbidity
• Gestation 1. Sow body condition
Select Nutrient Sources
Ingredients & feedingprogram options
A. Nutrient DensityB. Nutrient bioavailabilityC. Anti-nutritional factorsD. CostE. Nutrient quality/variabilityF. Maximum inclusion rate
ImproveNon-nutritionalManagement
(i.e. All in - All out,split sex feeding)
Monitor Performanceand CostsCompare to expected goals
Formulate Diets
Minimize Feed Wastage
A. Feeder Design
B. Feeder Adjustment
Maximize Quality Control
Manufacture feed
A. Processing • grinding (particle size, ingredient separation) • pelleting (ingredient separation)B. MixingC. DeliveryD. StorageE. Check accuracy of nutrients in final diet
Figure 1. Management of Nutritional Programs

Many performance mea-
sures are greatly influenced
by nutrition. Questions to
consider when establishing
performance goals are:
1)1)1)1)1) What is the current level
of performance in my herd?
2)2)2)2)2) Can and should a higher
level of performance be at-
tained?
3)3)3)3)3) Will improved nutrition
help attain increased perfor-
mance?
4)4)4)4)4) If so, what specific compo-
nents of my nutrition program
can be changed to improve
performance?
5)5)5)5)5) Will an adjustment in my
feeding program improve
profitability?
Production flow (barn
throughput) is also an impor-
tant consideration for planning
a swine feeding program.
Facility cost and diet cost are
components of total cost of
production. If facility costs are
high, a producer may choose
an expensive feeding program
that supports rapid growth
thus reducing fixed cost per
pig. This scheme may reduce
total cost of production. In
contrast, if facility costs are
low, total cost of production
may be lowered by feeding a
diet that results in slower
gains but is less costly.
Factors That Influence Nutrient LevelsFactors That Influence Nutrient LevelsFactors That Influence Nutrient LevelsFactors That Influence Nutrient LevelsFactors That Influence Nutrient Levels
Estimating Nutrient RequirementsEstimating Nutrient RequirementsEstimating Nutrient RequirementsEstimating Nutrient RequirementsEstimating Nutrient Requirements
33333
Feed IntakeFeed IntakeFeed IntakeFeed IntakeFeed IntakeFeed intake is one of the
most critical, and often over-
looked, factors that determine
nutrient levels in feed. Pigs
have daily requirements for a
quantity of nutrients to main-
tain their bodies and support
productive functions (growth,
milk production). Measuring
feed intake is the only way to
determine the amount of each
nutrient consumed by pigs.
Once feed intake is known,
dietary concentration of nutri-
ents can be adjusted to ensure
that pigs consume the proper
amount of each nutrient re-
quired for maintenance and
productive functions.
For example, if a 60 lb
barrow requires 20.0 grams of
lysine daily and consumed 3.5
lb of a diet that contained 0.9%
lysine, he would receive 14.3
grams of lysine daily (3.5 lb
feed x 0.009 x 454 g/lb). If the
pig consumed 5.5 lb of this feed
he would receive 22.5 grams of
lysine daily. Underfeeding
nutrients results in suboptimal
performance (e.g., slow
growth). Overfeeding nutrients
often increases feed costs.
Feed intakes can be mea-
sured and diet formulations
adjusted to more accurately
meet nutrient requirements.
There are several methods for
determining feed intake that
are discussed for each phase of
production below. It is impor-
tant to note that these methods
measure “feed disappearance.”
Feed wastage can significantly
inflate estimates of feed intake.
Therefore good feeder design
and management are essential.
Productivity LevelProductivity LevelProductivity LevelProductivity LevelProductivity LevelA second major factor
affecting nutrient requirements
is level of performance. A sow
raising 12 pigs will produce
more milk and therefore re-
quire more nutrients than a
similar sow raising 8 pigs.
Likewise, a pig gaining 0.75 lb
of lean tissue daily requires a
larger quantity of nutrients
than one depositing 0.6 lb of
lean tissue daily.
On a given farm under
specific conditions, a producer
can measure the current pro-
ductivity level of the swine
herd. However, potential per-
formance level is usually not
known. You should set nutrient
levels somewhat above those
that support current perfor-
mance levels. As new diets are
fed, performance levels should
be measured. If performance

increase to 4 or 5 lb of water
for every lb of feed. Estimated
water consumption for various
classes of pigs is listed in
Table 1.Table 1.Table 1.Table 1.Table 1.
Water quality should also
be considered. Water quality
guidelines are listed in Table 2.Table 2.Table 2.Table 2.Table 2.
These guidelines are similar to
but more lenient than water
quality standards for humans.
Water analysis Acceptable range
pH 6-8Total dissolved solids (TDS) 0-3000ppmb
Nitrate nitrogen 0-100 ppmNitrite nitrogen 0-10 ppmSulfate 0-1000 ppmc
Total bacteria 0-1000/mlColiform bacteria 0-50/ml
aAdapted from Bergsrud and Linn (1989).bLevels up to 5000 ppm can be tolerated with some adaptation.cLevels up to 1500 ppm can be tolerated with some adaptation.
Table 2. Water Quality Guidelines for Swinea
Table 1. Estimated Water Consumption of Pigsa
improves, nutrient levels can
be adjusted progressively
upward until the optimal level
of performance is achieved.
Many factors such as genetics,
season, age/stage of growth,
health status, feed form and
palatability of feed impact feed
intake and productivity level.
Consequently, feed intake
must be measured when these
conditions change so that diets
can be re-formulated to satisfy
nutrient needs of the pig.
Importance of WaterImportance of WaterImportance of WaterImportance of WaterImportance of Water
While much attention
focuses on feed intake and
formulation of diets, water is
the most important nutrient to
the pig. Water makes up about
80% of the pig’s body at birth
and 50% of the market hog’s
body. A pig housed in
thermoneutral conditions will
consume 2 to 3 lb of water for
every pound of dry feed con-
sumed. Under heat stress or
during lactation this may
Class of pig Water intake (gal/head/day)
Sow and litter 8Nursery pig 1Growing pig 3Finishing pig 4Gestating sow 6Boar 8
aMidwest Plan Service, 1983
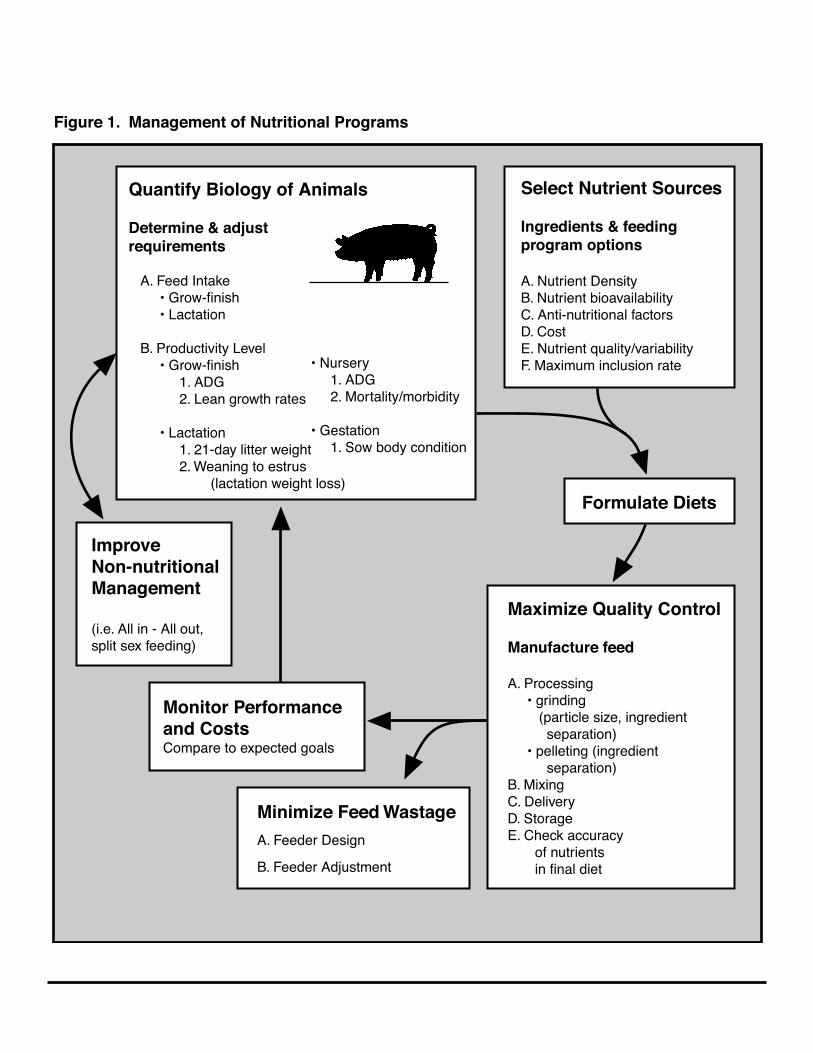
The primary objective for
nutrition of gestating sows is
precise control of weight gain
and body condition while
supporting optimal fetal devel-
opment. Sows must be limit-
fed to minimize excessive
weight gain.
Measuring Feed IntakeMeasuring Feed IntakeMeasuring Feed IntakeMeasuring Feed IntakeMeasuring Feed Intake
for Gestating Sowsfor Gestating Sowsfor Gestating Sowsfor Gestating Sowsfor Gestating Sows
Scoop methodScoop methodScoop methodScoop methodScoop method� Fill a scoop to
a designated level. Weigh the
contents of the scoop and
record the weight. Repeat this
procedure several times to
determine an average amount
of feed the scoop will hold.
Count and record the number
of scoops given to each animal
at feeding. Periodically recheck
the weight of feed the scoop
will hold. Changes in density of
feed reduce the accuracy of
this method, but it is better
than not measuring feed intake
at all. Check calibration of
automatic feed drop systems.
Producers commonly feed a
gestation diet at about 4-6 lb/
day to sows under most envi-
ronmental conditions. This
quantity of feed per day is only
a target and the actual amount
fed should be varied according
to individual animals and
situations. Reducing daily feed
allowance to less than 3 lb/hd
may cause inadequate intake
of vitamins and minerals with
typical gestation diets.
Size of SowSize of SowSize of SowSize of SowSize of SowLarger, heavier animals have
higher maintenance require-
ments than smaller, lighter
animals. Energy requirements
increase about 200 kcal ME for
each 20 lb increase in body
weight.
Housing and FeedingHousing and FeedingHousing and FeedingHousing and FeedingHousing and Feeding
MethodMethodMethodMethodMethodWhen breeding stock are
housed and fed in groups, they
require about 15% more feed
than individually fed animals
because timid sows will not
consume their full share.
EnvironmentalEnvironmentalEnvironmentalEnvironmentalEnvironmental
TemperatureTemperatureTemperatureTemperatureTemperatureSows housed at tempera-
tures below their lower critical
temperature require more feed
Estimating Nutrient Needs at EachEstimating Nutrient Needs at EachEstimating Nutrient Needs at EachEstimating Nutrient Needs at EachEstimating Nutrient Needs at Each
Production StageProduction StageProduction StageProduction StageProduction Stage
Feeding Gestating SowsFeeding Gestating SowsFeeding Gestating SowsFeeding Gestating SowsFeeding Gestating Sows to maintain body temperature
than sows housed in a warm
environment. For every 20oF
below 60oF, feed allowance
should increase l lb. This rule of
thumb applies to the tempera-
ture sensed by the animal,
which is not necessarily the
same as the thermometer
reading.
Body ConditionBody ConditionBody ConditionBody ConditionBody ConditionThin animals have less fat
and insulation and require more
feed than animals in good body
condition to maintain body
temperature when housed in
low environmental tempera-
tures.
The consequences of unde-
sirable body condition for sows
include increased culling rate,
increased numbers of gilts in
the sow herd and decreased
pigs/sows per year.
Overfat sows are more likely to experience:Overfat sows are more likely to experience:Overfat sows are more likely to experience:Overfat sows are more likely to experience:Overfat sows are more likely to experience:
• increased embryonic mortality• increased farrowing difficulty• more crushed pigs• decreased feed intake during lactation• lower milk production, and• increased susceptibility to heat stress.
Thin sows may exhibit:Thin sows may exhibit:Thin sows may exhibit:Thin sows may exhibit:Thin sows may exhibit:
• failure to return to estrus• lower conception rates• smaller subsequent litter sizes• downer sow syndrome (bone breakage and spinal injuries due to excessive mobilization of minerals from bones).
55555

There are two methods toThere are two methods toThere are two methods toThere are two methods toThere are two methods to
evaluate a gestation feedingevaluate a gestation feedingevaluate a gestation feedingevaluate a gestation feedingevaluate a gestation feeding
program:program:program:program:program:
1) Condition scoring.1) Condition scoring.1) Condition scoring.1) Condition scoring.1) Condition scoring. This
method combines visual ap-
praisal and estimated backfat to
arrive at a number from 1 to 5.
The desirable condition score at
farrowing is 3. Daily feed of-
fered should be adjusted if
average score is above or below
3 (see Figure 2).(see Figure 2).(see Figure 2).(see Figure 2).(see Figure 2).
Figure 2. Condition Scores of Sows (Patience and Thacker, 1989)
1 2 3 4 5
Score Condition Body Shape
1 Emaciated Hips, backbone prominent to the eye2 Thin Hips, backbone easily felt without
applying palm pressure3 Ideal Hips, backbone felt only with firm palm
pressure4 Fat Hips, backbone cannot be felt5 Overfat Hips, backbone heavily covered
Metabolizable energy (ME)Metabolizable energy (ME)Metabolizable energy (ME)Metabolizable energy (ME)Metabolizable energy (ME) 6000-8000 kcal6000-8000 kcal6000-8000 kcal6000-8000 kcal6000-8000 kcalCrude proteinCrude proteinCrude proteinCrude proteinCrude protein 240-260 g240-260 g240-260 g240-260 g240-260 gLysineLysineLysineLysineLysine 8-138-138-138-138-13CalciumCalciumCalciumCalciumCalcium 18-20 g18-20 g18-20 g18-20 g18-20 gPhosphorusPhosphorusPhosphorusPhosphorusPhosphorus 16-18 g16-18 g16-18 g16-18 g16-18 g
For mature sows of leanFor mature sows of leanFor mature sows of leanFor mature sows of leanFor mature sows of lean
genotype, approximate last ribgenotype, approximate last ribgenotype, approximate last ribgenotype, approximate last ribgenotype, approximate last rib
backfat measurements are:backfat measurements are:backfat measurements are:backfat measurements are:backfat measurements are:
score 1score 1score 1score 1score 1 < 0.6 in.< 0.6 in.< 0.6 in.< 0.6 in.< 0.6 in.
score 2score 2score 2score 2score 2 0.6-0.7 in.0.6-0.7 in.0.6-0.7 in.0.6-0.7 in.0.6-0.7 in.
score 3score 3score 3score 3score 3 0.7-0.8 in.0.7-0.8 in.0.7-0.8 in.0.7-0.8 in.0.7-0.8 in.
score 4score 4score 4score 4score 4 0.8-0.9 in.0.8-0.9 in.0.8-0.9 in.0.8-0.9 in.0.8-0.9 in.
score 5score 5score 5score 5score 5 > 0.9 in.> 0.9 in.> 0.9 in.> 0.9 in.> 0.9 in.
For younger sows and fatter
genotypes, last rib backfat
measurements may be higher.
2) Weigh animals.2) Weigh animals.2) Weigh animals.2) Weigh animals.2) Weigh animals. Weight
gains depend on environmental
conditions, genetics, and
amount of weight lost during
the previous lactation.
Approximate weight gainsApproximate weight gainsApproximate weight gainsApproximate weight gainsApproximate weight gains
during gestation (114 days)during gestation (114 days)during gestation (114 days)during gestation (114 days)during gestation (114 days)
should be:should be:should be:should be:should be:
Parity 1Parity 1Parity 1Parity 1Parity 1 80-100 lb80-100 lb80-100 lb80-100 lb80-100 lb
Parity 2-5Parity 2-5Parity 2-5Parity 2-5Parity 2-5 80-90 lb80-90 lb80-90 lb80-90 lb80-90 lb
Parity 5+Parity 5+Parity 5+Parity 5+Parity 5+ 55 lb55 lb55 lb55 lb55 lb
To achieve the desiredTo achieve the desiredTo achieve the desiredTo achieve the desiredTo achieve the desired
body condition score andbody condition score andbody condition score andbody condition score andbody condition score and
weight gain, target dailyweight gain, target dailyweight gain, target dailyweight gain, target dailyweight gain, target daily
nutrient intake for gestatingnutrient intake for gestatingnutrient intake for gestatingnutrient intake for gestatingnutrient intake for gestating
sows should be:sows should be:sows should be:sows should be:sows should be:
Table 3. Example Gestation Diet
Ingredient Amount (lb)
Corn (.25% lysine) 1655Soybean meal, 44% 260Dicalcium phosphate (18.5% P; 21% Ca) 52Limestone (39% Ca) 15Salt 10Vitamin premixa 6Trace mineral premixa 2
2000Calculated analysisMetabolizable energy, kcal/lb 1430Protein, % 13.0Lysine, % .55Calcium, % .91Phosphorus, % .80
aSee Table 10. for suggested vitamin and trace mineral levels.
Feed allowance/day, lb
Nutrient 4.0 4.5 5.0 5.5 6.0
Met. Energy, kcal 5720 6435 7150 7865 8580
Protein, g 236 266 295 325 354
Lysine, g 10.0 11.2 12.5 13.7 15.0
Calcium, g 16.5 18.6 20.6 22.7 24.8
Phosphorus, g 14.5 16.3 18.2 20.0 21.8
Table 4. Nutrients Consumed/Day at Various Intakes of the Example Diet for Gestating Sows
77777
than that of lysine derived from
natural protein in common feed
ingredients. There does not
appear to be a difference in
efficiency of lysine utilization
between synthetic and protein-
bound lysine for full-fed sows.
A variety of alternative
feedstuffs can often be included
in gestation diets to replace part
or all of the corn and soybean
meal without causing detrimental
effects on performance. Alterna-
tive feed ingredients may par-
tially or completely replace corn
and soybean meal as energy and
protein sources. These may
include alfalfa, barley, sorghum,
canola meal, meat and bone meal
and many others. Economics andEconomics andEconomics andEconomics andEconomics and
nutrients provided are the mainnutrients provided are the mainnutrients provided are the mainnutrients provided are the mainnutrients provided are the main
considerations for use of alter-considerations for use of alter-considerations for use of alter-considerations for use of alter-considerations for use of alter-
native feedstuffs.native feedstuffs.native feedstuffs.native feedstuffs.native feedstuffs. Other impor-
tant considerations include
ingredient consistency and
quality, palatability, geographic
availability, nutrient availability
and presence of toxic or anti-
nutritional factors. For a more
complete discussion of alterna-
tive feed ingredients, refer to
Pork Industry Handbook
factsheets 3, 5, 73, 108, 112 and
126.
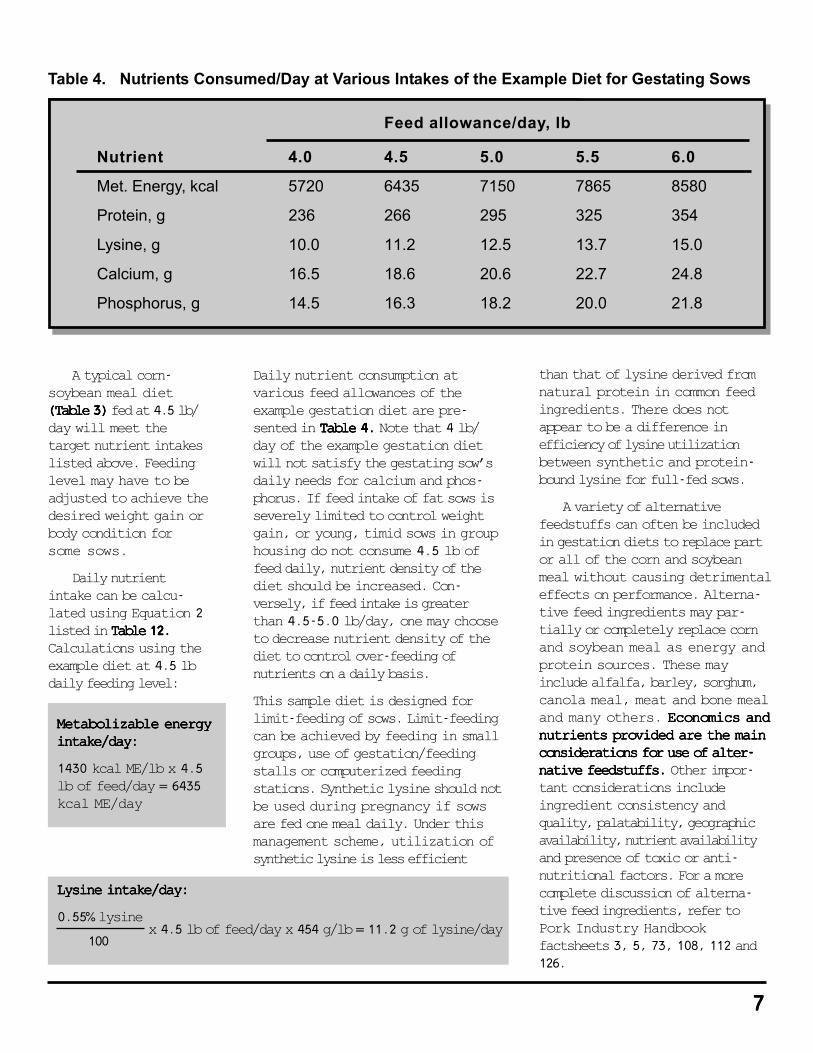
Daily nutrient consumption at
various feed allowances of the
example gestation diet are pre-
sented in Table 4.Table 4.Table 4.Table 4.Table 4. Note that 4 lb/
day of the example gestation diet
will not satisfy the gestating sow’s
daily needs for calcium and phos-
phorus. If feed intake of fat sows is
severely limited to control weight
gain, or young, timid sows in group
housing do not consume 4.5 lb of
feed daily, nutrient density of the
diet should be increased. Con-
versely, if feed intake is greater
than 4.5-5.0 lb/day, one may choose
to decrease nutrient density of the
diet to control over-feeding of
nutrients on a daily basis.
This sample diet is designed for
limit-feeding of sows. Limit-feeding
can be achieved by feeding in small
groups, use of gestation/feeding
stalls or computerized feeding
stations. Synthetic lysine should not
be used during pregnancy if sows
are fed one meal daily. Under this
management scheme, utilization of
synthetic lysine is less efficient
A typical corn-
soybean meal diet
(Table 3)(Table 3)(Table 3)(Table 3)(Table 3) fed at 4.5 lb/
day will meet the
target nutrient intakes
listed above. Feeding
level may have to be
adjusted to achieve the
desired weight gain or
body condition for
some sows.
Daily nutrient
intake can be calcu-
lated using Equation 2
listed in Table 12.Table 12.Table 12.Table 12.Table 12.
Calculations using the
example diet at 4.5 lb
daily feeding level:
Metabolizable energyMetabolizable energyMetabolizable energyMetabolizable energyMetabolizable energy
intake/day:intake/day:intake/day:intake/day:intake/day:
1430 kcal ME/lb x 4.5
lb of feed/day = 6435
kcal ME/day
Lysine intake/day:Lysine intake/day:Lysine intake/day:Lysine intake/day:Lysine intake/day:
0.55% lysine
100x 4.5 lb of feed/day x 454 g/lb = 11.2 g of lysine/day
Feeding Mature BoarsFeeding Mature BoarsFeeding Mature BoarsFeeding Mature BoarsFeeding Mature Boars
As with gestating sows,
the primary objective for nutri-
tion of boars is control of
weight gain and body condi-
tion while supporting optimal
breeding performance. Mature
boars can be limit-fed after
reaching a body weight of 240
lb to control weight gain.
Overfeeding boars can result in
reduced libido and large size,
which is incompatible with
mating small females.
Feed intake can be mea-
sured by the scoop methodscoop methodscoop methodscoop methodscoop method
discussed for gestating sows.
Producers commonly feed their
sow gestation diet to boars at
5-6.5 lb/day under most envi-
ronmental conditions. This
amount of feed per day is a
target and the actual amount
fed should be varied according
to individual animals and
situations (size of the boar,
housing and feeding method,
environmental temperature
and body condition.)
While it is a common prac-
tice to feed the sow gestation
diet to breeding boars, recent
research suggests that this
may not optimize reproductive
performance. Limit-feeding the
gestation diet to control weight
gain limits protein intake,
which may decrease libido and
semen production. Mature
boars should consume about
6000 kcal of metabolizable
energy and 17 g of lysine daily
to control weight gain and
optimize reproductive perfor-
mance. Feeding 4.5 lb daily of
the example gestation diet
(Table 3)(Table 3)(Table 3)(Table 3)(Table 3) will provide 6400 kcal
ME but only 11.5 g of lysine.
Therefore, a boar diet should
be formulated that contains
.85% lysine.
For smaller herds, it may
not be feasible to formulate
Feeding Lactating SowsFeeding Lactating SowsFeeding Lactating SowsFeeding Lactating SowsFeeding Lactating Sows
results in loss of body weight
(negative nutrient balance).
Excessive body weight loss
can lead to short-term repro-
ductive problems such as
extended weaning-to-estrus
interval and smaller subse-
quent litter size. Long-term
problems include a high culling
rate of the sow herd resulting
in low average parity, reduced
pigs weaned per reproductive
lifetime and higher genetic
cost per pig produced. Nega-
tive nutrient balance can be
minimized by increasing feed
intake and/or increasing nutri-
ent concentration in the diet.
and handle a special diet for
boars. A reasonable alternative
is to limit-feed the sow lactation
diet to breeding boars. Protein
and lysine concentration of the
lactation diet is higher than the
gestation diet, while energy
density of the two diets is
similar, assuming there is no fat
added to the lactation diet.
Limit-feeding the lactation diet
will control weight gain and
provide a higher daily protein
intake. If the lactation diet
contains supplemental fat at
greater than 1%, then a sepa-
rate boar diet should be formu-
lated.
For boars, breeding load is
also an important consideration.
Young boars ( < 1 yr) may need
more feed than older boars
because they are still growing
and developing. Feed intake
may have to be increased when
boars are used heavily to main-
tain body condition.
The main objective for
nutrition of the lactating sow is
to minimize negative nutrient
balance while optimizing milk
production. Lactating sows
produce 15 to 25 lb of milk per
day resulting in daily nutrient
requirements that are about
three times higher than during
gestation. Level of nutrient
intake during lactation is
directly related to the amount
of milk produced and growth
rate of nursing piglets. For
highly prolific and productive
sows, nutrients from body
tissue reserves and feed are
used to support lactation. This
The first stepfirst stepfirst stepfirst stepfirst step in minimizing
negative nutrient balance is to
determine the current level ofdetermine the current level ofdetermine the current level ofdetermine the current level ofdetermine the current level of
feed intake in gestation andfeed intake in gestation andfeed intake in gestation andfeed intake in gestation andfeed intake in gestation and
lactation.lactation.lactation.lactation.lactation.
This process will:This process will:This process will:This process will:This process will:
• reveal if feed intake is
inadequate
• provide a base level of
intake against which future
intakes can be evaluated
• provide nutritionists with
information necessary to
accurately formulate sow
diets for a specific herd.
Measuring Feed Intake forMeasuring Feed Intake forMeasuring Feed Intake forMeasuring Feed Intake forMeasuring Feed Intake for
Lactating SowsLactating SowsLactating SowsLactating SowsLactating Sows
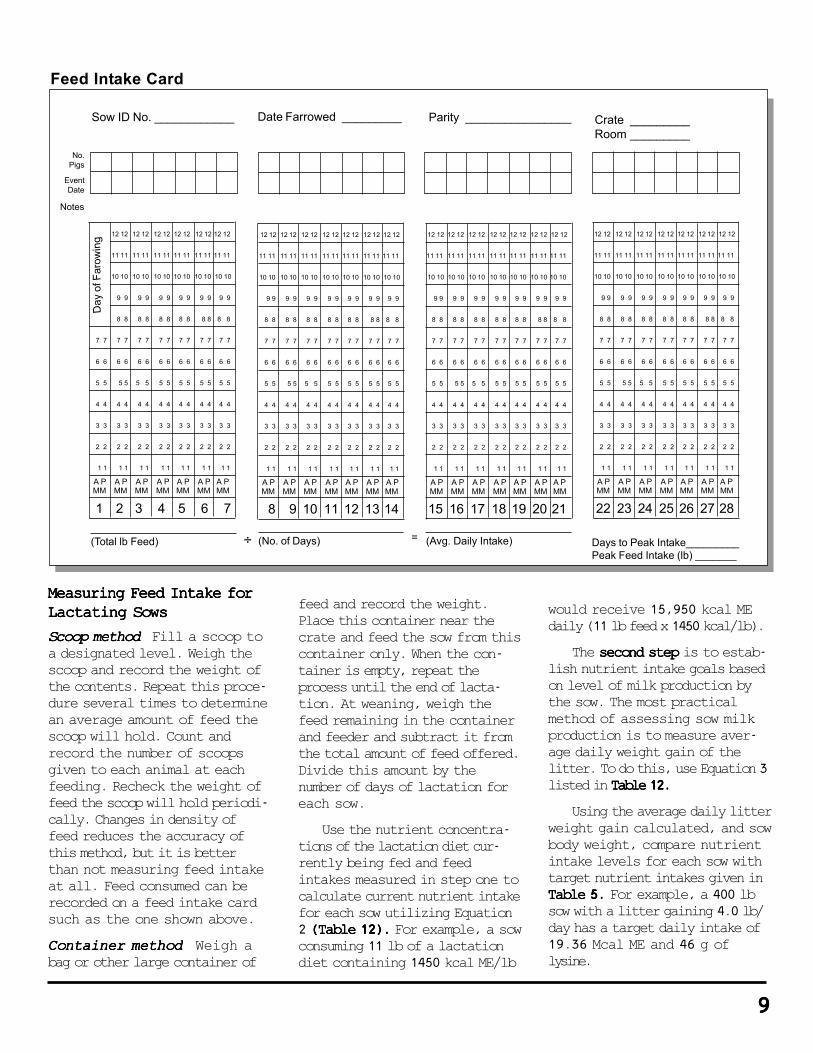
Scoop methodScoop methodScoop methodScoop methodScoop method� Fill a scoop toa designated level. Weigh thescoop and record the weight ofthe contents. Repeat this proce-dure several times to determinean average amount of feed thescoop will hold. Count andrecord the number of scoopsgiven to each animal at eachfeeding. Recheck the weight offeed the scoop will hold periodi-cally. Changes in density offeed reduces the accuracy ofthis method, but it is betterthan not measuring feed intakeat all. Feed consumed can berecorded on a feed intake cardsuch as the one shown above.
Container methodContainer methodContainer methodContainer methodContainer method� Weigh abag or other large container of
feed and record the weight.Place this container near thecrate and feed the sow from thiscontainer only. When the con-tainer is empty, repeat theprocess until the end of lacta-tion. At weaning, weigh thefeed remaining in the containerand feeder and subtract it fromthe total amount of feed offered.Divide this amount by thenumber of days of lactation foreach sow.
Use the nutrient concentra-tions of the lactation diet cur-rently being fed and feedintakes measured in step one tocalculate current nutrient intakefor each sow utilizing Equation2 (Table 12).(Table 12).(Table 12).(Table 12).(Table 12). For example, a sowconsuming 11 lb of a lactationdiet containing 1450 kcal ME/lb
would receive 15,950 kcal MEdaily (11 lb feed x 1450 kcal/lb).
The second stepsecond stepsecond stepsecond stepsecond step is to estab-lish nutrient intake goals basedon level of milk production bythe sow. The most practicalmethod of assessing sow milkproduction is to measure aver-age daily weight gain of thelitter. To do this, use Equation 3listed in Table 12.Table 12.Table 12.Table 12.Table 12.
Using the average daily litterweight gain calculated, and sowbody weight, compare nutrientintake levels for each sow withtarget nutrient intakes given inTable 5.Table 5.Table 5.Table 5.Table 5. For example, a 400 lbsow with a litter gaining 4.0 lb/day has a target daily intake of19.36 Mcal ME and 46 g oflysine.
12 12 12 12 12 12 12 12 12 12 12 12
11 11 11 11 11 11 11 11 11 11 11 11
10 10 10 10 10 10 10 10 10 10 10 10
9 9 9 9 9 9 9 9 9 9 9 9
8 8 8 8 8 8 8 8 8 8 8 8
7 7 7 7 7 7 7 7 7 7 7 7 7 7
6 6 6 6 6 6 6 6 6 6 6 6 6 6
5 5 5 5 5 5 5 5 5 5 5 5 5 5
4 4 4 4 4 4 4 4 4 4 4 4 4 4
3 3 3 3 3 3 3 3 3 3 3 3 3 3
2 2 2 2 2 2 2 2 2 2 2 2 2 2
1 1 1 1 1 1 1 1 1 1 1 1 1 1
1 2 3 4 5 6 7
Sow ID No. ____________ Date Farrowed _________ Parity ________________ Crate _________Room _________
Days to Peak Intake_________Peak Feed Intake (lb) _______
/
No.Pigs
(Total lb Feed)
MM MM MM MM MM MM MM
12 12 12 12 12 12 12 12 12 12 12 12 12 12
11 11 11 11 11 11 11 11 11 11 11 11 11 11
10 10 10 10 10 10 10 10 10 10 10 10 10 10
9 9 9 9 9 9 9 9 9 9 9 9 9 9
8 8 8 8 8 8 8 8 8 8 8 8 8 8
7 7 7 7 7 7 7 7 7 7 7 7 7 7
6 6 6 6 6 6 6 6 6 6 6 6 6 6
5 5 5 5 5 5 5 5 5 5 5 5 5 5
4 4 4 4 4 4 4 4 4 4 4 4 4 4
3 3 3 3 3 3 3 3 3 3 3 3 3 3
2 2 2 2 2 2 2 2 2 2 2 2 2 2
1 1 1 1 1 1 1 1 1 1 1 1 1 1
15 16 17 18 19 20 21
12 12 12 12 12 12 12 12 12 12 12 12 12 12
11 11 11 11 11 11 11 11 11 11 11 11 11 11
10 10 10 10 10 10 10 10 10 10 10 10 10 10
9 9 9 9 9 9 9 9 9 9 9 9 9 9
8 8 8 8 8 8 8 8 8 8 8 8 8 8
7 7 7 7 7 7 7 7 7 7 7 7 7 7
6 6 6 6 6 6 6 6 6 6 6 6 6 6
5 5 5 5 5 5 5 5 5 5 5 5 5 5
4 4 4 4 4 4 4 4 4 4 4 4 4 4
3 3 3 3 3 3 3 3 3 3 3 3 3 3
2 2 2 2 2 2 2 2 2 2 2 2 2 2
1 1 1 1 1 1 1 1 1 1 1 1 1 1
8 9 10 11 12 13 14MM MM MM MM MM MM MMA P A P A P A P A P A P A P
12 12 12 12 12 12 12 12 12 12 12 12 12 12
11 11 11 11 11 11 11 11 11 11 11 11 11 11
10 10 10 10 10 10 10 10 10 10 10 10 10 10
9 9 9 9 9 9 9 9 9 9 9 9 9 9
8 8 8 8 8 8 8 8 8 8 8 8 8 8
7 7 7 7 7 7 7 7 7 7 7 7 7 7
6 6 6 6 6 6 6 6 6 6 6 6 6 6
5 5 5 5 5 5 5 5 5 5 5 5 5 5
4 4 4 4 4 4 4 4 4 4 4 4 4 4
3 3 3 3 3 3 3 3 3 3 3 3 3 3
2 2 2 2 2 2 2 2 2 2 2 2 2 2
1 1 1 1 1 1 1 1 1 1 1 1 1 1
22 23 24 25 26 27 28MM MM MM MM MM MM MMA P A P A P A P A P A P A P
EventDate
Notes
A P A P A P A P A P A P A P
=
MM MM MM MM MM MM MMA P A P A P A P A P A P A P
(Avg. Daily Intake)(No. of Days)
Day
of F
arow
ing
Feed Intake Card
99999
÷

The nutrient intakes listed
in Table 5Table 5Table 5Table 5Table 5 crudely attempt to
account for lysine and protein
derived from breakdown of
body tissue. We assumed that
sows mobilize 4 g of lysine and
61 g of protein daily from body
tissue during lactation. The
energy liberated from mobiliza-
tion of body tissue is not con-
sidered. Consequently, the
estimates of daily energy needs
assume zero weight loss and
may seem higher than is re-
quired for commercial produc-
tion. The values listed in
Table 5Table 5Table 5Table 5Table 5 should be viewed as
intake goals rather than strict
requirements.
The third stepthird stepthird stepthird stepthird step is to make
appropriate management
adjustments to maximize
nutrient intake during lactation.
These are:
1)1)1)1)1) Do not overfeed during
gestation.
2)2)2)2)2) Feed 2 or 3 times per day.
3)3)3)3)3) Ensure that water intake is
not restricted.
4)4)4)4)4) Keep farrowing room tem-
perature between 650 and 700 F.
5)5)5)5)5) Use drip or snout coolers to
lessen summer heat stress.
6)6)6)6)6) Remove spoiled or moldy feed.
7)7)7)7)7) Ensure that feeder design
does not restrict intake.
The fourth stepfourth stepfourth stepfourth stepfourth step is to deter-
mine whether to increase di-
etary nutrient concentrations.
After feed intake has been
maximized, compare actual
nutrient intakes with target
intakes in Table 5.Table 5.Table 5.Table 5.Table 5.
Sows producing a large
quantity of milk may be unable
to consume the volume of feed
required to supply them with
adequate nutrients. Excessive
body weight loss ( > 40 lb) and
depressed milk production
relative to their genetic potential
may occur. Increasing the con-
centration of nutrients in the
diet may partially offset these
effects. Use Equations 4 and 5
in Table 12Table 12Table 12Table 12Table 12 to calculate the
appropriate nutrient concentra-
tion of the diet.
For example, supplemental
fat can be added to lactation
diets in an effort to increase
energy intake of sows. Supple-
mental fat may reduce weight
loss and backfat loss and
increase daily gain of nursing
piglets. However, there are
practical limits to this process.
Supplemental fat increases diet
cost. Addition of fat above 5%
increases the risk of feed
becoming rancid if a preserva-
tive is not used and causes
bridging and caking of feed in
feeders and bulk bins. For more
information about supplemen-
tal fat, refer to Pork Industry
Handbook factsheet 3, “Dietary
Energy for Swine” and “Fat in
Swine Nutrition,” Chapter 7, in
Swine Nutrition by E.R. Miller,
D.E. Ullrey and A.J. Lewis.
Table 5. Recommended Energy, Protein and Lysine Intake for Lactating Sows by Level of Production*
Sow Body Weight, lb
300 400 500
Litter Energy Protein Lysine Energy Protein Lysine Energy Protein Lysine Gain (Mcal ME/d) (g/d) (g/d) (Mcal ME/d) (g/d) (g/d) (Mcal ME/d) (g/d) (g/d)
(lb/day)
3.0 14.82 592 33 15.88 621 34 16.87 648 343.5 16.56 681 39 17.62 710 40 18.61 737 404.0 18.30 770 45 19.36 799 46 20.35 826 464.5 20.04 860 51 21.10 889 52 22.09 916 525.0 21.78 949 57 22.84 978 57 23.83 1005 585.5 23.52 1038 63 24.58 1067 63 25.57 1094 646.0 25.25 1127 69 26.31 1156 69 27.30 1183 70
*Adapted from Pettigrew, 1993.

In general, lactation diets
for highly productive sows
should contain ingredients that
are concentrated sources of
energy and protein such as
corn and soybean meal. Feed
ingredients high in moisture or
fiber content such as beet pulp,
alfalfa hay, oats or wheat bran
dilute the nutrient content of
the diet and may limit nutrient
intake. Recently, researchers
have studied the balance of
essential amino acids in diets
for lactating sows. Early stud-
ies would suggest that
branched chain amino acid (i.e.,
valine) concentration of many
diets formulated for high pro-
ducing sows may be too low to
maximize milk production.
Additional studies are needed to
verify this observation and to
further clarify the appropriate
pattern of essential amino acids
before recommendations on
branched chain amino acid
concentration of lactating sow
diets can be offered with confi-
dence.
The primary objective for
nutrition of weanling pigs is to
optimize growth performance
during the first few weeks after
weaning. The increasing prac-
tice of weaning pigs at a young
age (10-21 days) has resulted in
problems with postweaning lag
seen as decreased gains, low
feed intake and increased
morbidity (sickness) and mor-
tality (death) on many swine
farms. Environment, health,
management practices and
nutrition impact the success of
a weaning program. Environ-
ment (temperature, air quality,
pen and equipment characteris-
tics) is the most critical factor.
After a satisfactory environ-
ment has been provided, nutri-
tion is the next most critical
factor.
In addition to other stresses
at weaning, the change from
liquid sow’s milk to a dry
starter diet is quite a challenge
for the young pig. Information
on the characteristics and level
of nutrients in sow's milk and
the ability of pigs to utilize
various nutrients from com-
monly available feedstuffs has
been used to formulate diets
that promote satisfactory per-
formance of early weaned pigs.
Dried milk products contain
forms of protein (casein) and
energy (lactose) that are highly
digestible by the young pig.
Pigs weaned at a young age
(<21 days) are very sensitive to
anti-nutritional factors present
in conventionally processed
soybean meal. Thus, the level of
soybean meal fed to these pigs
should be limited. These young
pigs develop a transient hyper-
sensitivity response (allergy) to
soybean proteins which in-
creases incidence of diarrhea
and reduces growth rate
(postweaning lag). After about
2 weeks, pigs become tolerant
of soybean protein, the hyper-
sensitivity response wanes and
growth performance improves.
Complex diets containing small
amounts of soybean protein are
fed to newly weaned pigs to
avoid postweaning lag.
Diets containing high levels
of dried milk products, specially
processed soybean products,
animal by-products (i.e., spray-
dried porcine plasma, spray-
dried blood meal, fish meal), and
highly digestible carbohydrate
sources (i.e., oat groats) are often
called “complex starter diets” in
contrast to “simple” corn-soy-
bean meal starter diets. Quality
of these specialized feed ingre-
dients varies greatly among
suppliers. Use only high quality
ingredients in complex starter
diets even though they are more
expensive than the same ingre-
dients of lower quality. A list of
ingredient specifications is
beyond the scope of this publi-
cation. Contact a competent
nutritionist for advice concern-
ing quality of specialized feed
ingredients for starter pig diets.
Feeding complex starter diets to
pigs weaned at less than 4
weeks of age results in signifi-
cantly improved performance
compared to simple diets. In
some experiments, feeding
complex starter diets containing
high levels of milk products has
resulted in improved subse-
quent performance during the
grower and finisher phases of
production.
As the pig grows, its diges-
tive system can better utilize
protein and energy from plant
sources and becomes less
sensitive to anti-nutritional
factors. Thus, the performance
boost gained by feeding com-
plex diets instead of simple
diets decreases over time.
Furthermore, simple diets are
considerably less expensive.
Feeding Starter PigsFeeding Starter PigsFeeding Starter PigsFeeding Starter PigsFeeding Starter Pigs
1111111111

Phase FeedingPhase FeedingPhase FeedingPhase FeedingPhase FeedingDue to dramatic changes in
digestive capacity and feed
intake after weaning, the prac-
tice of phase feeding has been
developed. Phase feeding
involves feeding several diets
for a relatively short period of
time to more accurately and
economically meet the pig’s
nutrient requirements. Phase
feeding programs for starter
pigs provide an expensive,
complex diet containing a high
proportion of high quality
ingredients in the immediate
postweaning period. High
quality, expensive ingredients
are gradually replaced with less
expensive, lower quality ingre-
dients that the pig can better
utilize as it matures. This ap-
proach seems to be a reasonable
compromise between the pig’s
nutritional needs and the eco-
nomic constraints of profitable
pork production. Nutrient and
ingredient suggestions for a
phase feeding program are
presented in Table 6.Table 6.Table 6.Table 6.Table 6. Example
starter diets are shown in
Table 7.Table 7.Table 7.Table 7.Table 7.
The segregated early wean-
ing (SEW) diet should be fed to
pigs until they weigh about 11
lbs. It should contain limited
amounts of corn and soybean
meal and large amounts of
highly digestible ingredients
such as dried skim milk, fish
meal, dried whey and spray-
dried porcine plasma. Pigs
weaned onto this diet should
have very limited exposure to
soybean protein (5% soybean
meal) because of the relative
immaturity of this young pig’s
digestive system. High quality
fat from plant sources (soybean
oil, corn oil) is usually added at a
rate of 3% to facilitate pelleting.
A sub-therapeutic level of
antibiotic and copper sulfate are
added for growth promotion.
Table 6. Suggested Nutrient Levels and Ingredients for Phase Feeding Programs for Starter Pigs
Item SEWa Phase 1 Phase 2 Phase 3
Weaning age 2.5 weeks 3 weeks 4 weeks 6 weeks or moreto 11 lb 11-15 lb 15-25 lb 25-45 lb
Feeding period (About 1 week) (About 1 week) (About 2 weeks) (About 3 weeks)
Feed form Pellet Pellet Pellet/Meal Meal
Nutrient: ———————————————% of diet ————————————————Lysine 1.70 1.50 1.25 1.25Methionine+ cystine 1.02 .90 .75 .75
Ingredient:———————————————% of diet ————————————————Dried skim milk 0-20 0-10 —— ——Dried whey 15-30 10-20 10-20 0-10Fishmeal 0-10 0-10 0-5 ——Special soy
productsb 0-20 0-20 —— ——Spray-dried
porcine plasma 3-10 3-6 —— ——Spray-dried
blood meal —— —— 2-5 ——
aSegregated early weaning.bSoy protein concentrate, extruded soy protein concentrate or isolated soy protein.

The Phase 1 diet should be fed
to pigs weaned at 17-24 days of
age. This diet can also be used for
creep feeding and for small, runt
or problem pigs weaned at older
ages. Phase 1 should be pelleted
because bridging in feeders and
clogging of the feeding system
will occur with high levels of dried
milk products and plasma. The
Phase 1 diet should contain about
10% soybean meal so that pigs
become accustomed to soybean
protein. This practice should ease
the transition to the simpler, corn-
1313131313
soybean meal-based Phase 2
diet. Phase 2 may or may not be
pelleted depending on producer
preference and cost. If pelleted,
Phase 2 should contain 3-4%
added fat. Growth promoting
levels of antibiotic and copper
sulfate (125 ppm copper) should
also be included.
Because pigs usually perform
quite well on the SEW and Phase
1 diets, a temptation is to allow
them to eat it for longer than a
week. This practice should be
avoided because as the pigs get
older, they will consume large
amounts of this expensive diet.
They will perform nearly as well
on the Phase 2 diet at consider-
ably less cost.
Feed intake for starter pigs
can be measured by the groupgroupgroupgroupgroup
method or the inventorymethod or the inventorymethod or the inventorymethod or the inventorymethod or the inventory
method.method.method.method.method. When using either of
these methods, one must ac-
count for the frequent changes in
diet being offered to pigs. These
methods are discussed below in
the section entitled “Feeding
Grower-Finisher Pigs.”
Table 7. Example Phase Feeding Program for Starter Pigs
Lb
Ingredient SEW Phase 1 Phase 2 Phase 3
Corn 734 927 1025 1120Soybean meal (44% CP) 100 200 537 786Dried whole whey 500 400 300 —Dried skim milk 200 50 — —Spray dried porcine plasma 150 100 — —Vegetable fat 100 100 20a 20Fish meal 200 200 — —Spray dried blood meal — — 60 —Dicalcium phosphate 3 10 34 37Limestone — — 15 20Salt — — — 8Vitamin premixa 6 6 6 6Trace mineral premixb 2 2 2 2DL Methionine 3 3 — —L-lysine HCl 1.5 1.5 — —Copper sulfate (25% Cu) 1 1 1 1Antibiotic premixc + + + +
2000 2000 2000 2000
Calculated analysis:Crude protein 24.00 21.60 21.00 22.20Lysine 1.70 1.50 1.25 1.25Calcium .90 .90 .90 .90Phosphorus .75 .75 .75 .75
aIf Phase 2 diet is pelleted, increase fat to 80 lb at the expense of corn.bSee Table 10 for suggested vitamin and trace mineral premixes.cAdd at the expense of corn.

Feeding Grower-Finisher PigsFeeding Grower-Finisher PigsFeeding Grower-Finisher PigsFeeding Grower-Finisher PigsFeeding Grower-Finisher Pigs
Since 75% of total feed
used in a farrow-finish opera-
tion is consumed in the
grower-finisher phase, nutri-
tional accuracy in this phase
has a substantial economic
impact. Due to the quantity of
feed consumed, the impact of
amino acids on lean growth,
the cost of adding amino acid
sources to the diet and in-
creased demand for leaner
pork, emphasis is being
placed on more accurately
defining amino acid require-
ments for grower-finisher
pigs based on genotype, sex
and stage of growth. How-
ever, ensuring an adequate
quantity of energy intake is
equally critical to optimize
lean growth rate and effi-
ciency.
GenotypeGenotypeGenotypeGenotypeGenotypeResearch at Purdue Uni-
versity has indicated that lean
growth potential is highly
variable among genotypes
commonly found in the pork
industry. Faster growth rates,
more efficient feed conversion
and increased carcass lean-
ness create economic advan-
tages for producing high lean
growth genotype pigs. Differ-
ences in lean growth poten-
tial result in differences in
amino acid requirements,
especially lysine. The lean
growth rates of pigs of vari-
ous genotypes can be identi-
fied and used to determine
their protein and lysine re-
quirements. A procedure to
determine lean gain for pigs
is presented in the Appendix.Appendix.Appendix.Appendix.Appendix.
SexSexSexSexSexBarrows eat more feed and
grow faster than gilts. Gilts
have less fat, more muscle, a
higher carcass yield and better
feed conversion than barrows at
a similar body weight. Thus,
gilts require higher dietary
concentrations of amino acids to
promote optimal lean gain than
do barrows. When penned
together, barrows and gilts are
often fed a level of protein and
lysine intermediate between the
requirements of the two sexes.
Consequently, excess protein is
fed to barrows resulting in
increased cost/lb of gain. Gilts
are deprived of protein resulting
in reduced growth rate and
decreased carcass lean.
Customized diets can be
formulated for the requirements
of barrows and gilts, but they
must be penned and fed sepa-
rately. If feeding systems and
facilities can be inexpensively
modified to use separate diets
for barrows and gilts, separate
sex feeding will generally in-
crease profitability when pigs
are marketed on a lean value
pricing scheme. New swine
facilities should be constructed
to accommodate separate sex
feeding to allow producers to
tailor diets for barrows and
gilts. Differences between
barrows and gilts in feed con-
sumption and carcass composi-
tion begin to appear above 40 lb
body weight and become sig-
nificantly greater as pigs reach
market weight. Sexes can be
separated when moved into the
nursery or grower facilities.
Boars gain faster, are more
efficient and have less backfat
than gilts and barrows at a
given weight; consequently,
growing boars have greater
amino acid requirements than
barrows and gilts. Developing
boars should be full-fed up to
about 240 lb to allow assess-
ment of rate of gain and backfat
depth for genetic selection
programs. Boars can then be
limit-fed as outlined in the
section on feeding boars.
Stage of GrowthStage of GrowthStage of GrowthStage of GrowthStage of GrowthRate of muscle growth
decreases and maintenance
requirement increases with
increasing body weight. Thus,
amino acid requirements also
change with stage of growth.
Altering dietary lysine levels to
match changes in feed intake
and nutrient requirements
along the pig’s growth curve
improves the efficiency of
amino acid use and can reduce
production cost.
The frequency with which
lysine levels are altered in the
grower-finisher phase depends
on knowledge of amino acid
requirements and the ability to
handle multiple diets in your
feeding system. Some produc-
ers will have the information
and feeding system flexibility to
change diet formulations every
time a feed bin is filled. This
gives those producers a distinct
competitive advantage.
Two critical pieces of infor-
mation are necessary to fine-
tune diets for grower-finisher
pigs: growth rate and feed

disappearance (intake). There
are two general methods of
recording this information. The
inventory method is the sim-
plest method but provides
limited information. The group
method is more complex and
provides more detailed informa-
tion.
Measuring growth rate�Measuring growth rate�Measuring growth rate�Measuring growth rate�Measuring growth rate� The
inventory methodinventory methodinventory methodinventory methodinventory method requires
producers to record the weight
of all pigs as they enter the
building, number and weight of
dead pigs and dates and
weights of pigs marketed.
ADG = [ (wt. out – wt. in) +ADG = [ (wt. out – wt. in) +ADG = [ (wt. out – wt. in) +ADG = [ (wt. out – wt. in) +ADG = [ (wt. out – wt. in) +
wt. gain of pigs remainingwt. gain of pigs remainingwt. gain of pigs remainingwt. gain of pigs remainingwt. gain of pigs remaining
in building] ק Pig-days*in building] ק Pig-days*in building] ק Pig-days*in building] ק Pig-days*in building] ק Pig-days*
*Pig-days = no of pigs x noof days of monitoring
(inventory) period
The disadvantage of using
the inventory method for mea-
suring ADG (average daily gain)
is that in all-in all-out production
systems it only provides an
overall average of all pigs in the
barn over the entire inventory or
grow-finish period. It does not
account for the gains of pigs in
different stages of growth.
In the group methodgroup methodgroup methodgroup methodgroup method of
measuring ADG, pens of pigs of
the same age are randomly
selected and weighed at inter-
vals throughout the grow-finish
period. Pigs should be identified
and weighed individually to
provide the most accurate
measure of ADG. Multiple pens
of pigs should be monitored in
order to accurately and confi-
dently determine a change in
gain and feed intake.
Measuring feed disappear-Measuring feed disappear-Measuring feed disappear-Measuring feed disappear-Measuring feed disappear-
ance�ance�ance�ance�ance� Measuring feed intake
is a key component of deter-
mining protein and lysine
levels in the grower-finisher
phase. Because of the volume
of feed consumed in this
phase, minimizing feed
wastage is especially critical.
The following formula can
be used to calculate feed
disappearance:
Avg. Daily FeedAvg. Daily FeedAvg. Daily FeedAvg. Daily FeedAvg. Daily Feed
Disappearance = [totalDisappearance = [totalDisappearance = [totalDisappearance = [totalDisappearance = [total
feed used, lb] ק Pig-daysfeed used, lb] ק Pig-daysfeed used, lb] ק Pig-daysfeed used, lb] ק Pig-daysfeed used, lb] ק Pig-days
One option when using
the inventory method is to
record the weight of the feed
delivered to the bin and
subtract the estimated
amount of feed remaining at
the end of the inventory
period. Another way of using
this method is to fill the bin
and take inventory both
when the bin is full and again
when it is nearly empty. One
major drawback of using this
method is that it does not
provide any information on
how much feed has been
consumed by each pen of
pigs.
The group method of
measuring feed disappear-
ance is more accurate be-
cause one selects a represen-
tative number of pens and
weighs the feed delivered to
each feeder. After a period of
time, feed left in the feeder is
weighed and subtracted from
the total amount offered to
arrive at total feed used. In
some feeding systems, the
1515151515
feeders themselves may be
detachable and light enough to
drag onto a scale. Other com-
mercially available monitoring
systems record feed disappear-
ance using weigh hoppers
above feeders or equipment
that measures volume of feed
flow. Some producers have
equipped bulk feed tanks with
electronic load cells. By record-
ing the weight of the tank after
filling and at set time intervals,
one can calculate the weight of
feed being consumed by a
group of pigs.
When pen weights and
feed disappearance are mea-
sured, it is best to randomly
select the pens to be monitored
to avoid biases created by
location within the building.
Two pens sharing one feeder
are counted as one unit.
Estimates of lysine require-
ments for grower-finisher pigs
and developing boars are
presented in Table 8.Table 8.Table 8.Table 8.Table 8. For
example, a 100 lb gilt of high
lean growth genotype requires
23.0 g of lysine daily. If she
consumes 3.0 lb of grower
feed/day, the feed should
contain 1.69% lysine. If this gilt
consumes 5.0 lb feed/day, the
diet should contain 1.01%
lysine. These estimates were
developed under ideal condi-
tions and should be regarded
as targets.

Lean Dietary Feed intake, lb/dayGrowth Weight, Lysine,Genotype Sex lb g/day 3.0 4.0 5.0 6.0 7.0
————————Dietary lysine, %———————
High Mixed 45-130 22.0 1.62 1.21 0.97 0.81(>0.75 lb 130-200 21.8 1.60 1.20 0.96 0.80 0.69lean gain/day) 200-240 21.5 1.18 0.95 0.79 0.68
Barrows 45-130 21.0 1.54 1.16 0.93 0.77130-200 20.5 1.51 1.13 0.90 0.75 0.65200-240 20.5 1.13 0.90 0.75 0.65
Gilts 45-130 23.0 1.69 1.27 1.01 0.85130-200 23.0 1.69 1.27 1.01 0.85 0.72200-240 22.5 1.24 0.99 0.83 0.71
Boars 45-110 25.2 1.85 1.39 1.11 0.93110-175 24.6 1.81 1.36 1.08 0.90 0.77175-240 24.6 1.36 1.08 0.90 0.77
Medium Mixed 45-110 20.8 1.52 1.14 0.91 0.76(0.60-0.75 lb 110-175 21.0 1.54 1.16 0.93 0.77 0.66lean gain/day) 175-240 20.0 1.10 0.88 0.73 0.63
Barrows 45-110 20.0 1.47 1.10 0.88 0.73110-175 20.0 1.47 1.10 0.88 0.73 0.63175-240 19.0 1.05 0.84 0.70 0.60
Gilts 45-110 21.5 1.58 1.18 0.95 0.79110-175 22.0 1.62 1.21 0.97 0.81 0.69175-240 21.0 1.16 0.93 0.77 0.66
Boars 45-110 24.0 1.76 1.32 1.06 0.88110-175 24.0 1.76 1.32 1.06 0.88 0.76175-240 22.8 1.26 1.01 0.84 0.72
*Based on research at the University of Kentucky (Stahly, 1991; Williams, 1984)
Table 8. Estimated Dietary Lysine Needs for Grower-Finisher Pigs and Developing Boars*
Steps in Formulating DietsSteps in Formulating DietsSteps in Formulating DietsSteps in Formulating DietsSteps in Formulating Diets
for Growing-Finishing Pigsfor Growing-Finishing Pigsfor Growing-Finishing Pigsfor Growing-Finishing Pigsfor Growing-Finishing Pigs
Step 1.Step 1.Step 1.Step 1.Step 1. Measure feed
disappearance as described
above and lean growth rate as
described in the Appendix. Appendix. Appendix. Appendix. Appendix.
These assessments should be
conducted several times each
year to account for seasonal
differences in pig performance.
Step 2.Step 2.Step 2.Step 2.Step 2. Determine the ap-
propriate nutrient needs for the
identified type of pigs. Esti-
mates of daily lysine require-
ments are listed in Table 8.Table 8.Table 8.Table 8.Table 8.
Lysine is the first limiting amino
acid in most practical swine
diets. In most cases, if diets are
formulated to satisfy the pigs’
lysine needs using common
feed ingredients, then the pigs’
needs for other essential amino
acids will also be satisfied.
However, diets formulated for
high lean growth genotypes
using synthetic amino acids
may be limiting in other essen-
tial amino acids. In this situa-
tion, consult a nutritionist to
ensure that all essential amino
acids are in a proper ratio to
each other.

In most situations, cereal
grain and soybean meal will
constitute the major portion of
diets for growing-finishing
pigs. This type of diet contains
about 1450-1,500 kcal of me-
tabolizable energy per pound
of feed. In young growing pigs
(up to 100 - 120 pounds de-
pending on genotype), insuffi-
cient energy intake usually
limits growth rate. Conse-
quently, it is essential to maxi-
mize energy intake of pigs by
maintaining high energy
density of the diet. Use of
feedstuffs that dilute energy
practical situations, the same
vitamin and mineral premixes
can be used for breeding stock
and starter pigs.
A wide range of vitamin
and mineral premixes is avail-
able to pork producers. Inclu-
sion rates and nutrient concen-
tration of these products are
quite variable. There is no one
lthough vitamins and
minerals constitute a relatively
small percentage of the swine
diet, they are extremely impor-
tant for normal growth and
productive functions. Vitamins
lose potency when exposed to
minerals, heat, light or mois-
ture or when stored for longer
than three months. If
basemixes or vitamin-trace
mineral premixes are used, be
sure to turn over inventory
quickly to limit storage time.
Vitamin and mineral recom-
mendations in this publication
contain safety margins over
NRC levels and are designed
for use with good storage
conditions. Suggested
macromineral levels are pre-
sented in Table 9.Table 9.Table 9.Table 9.Table 9. Vitamin and
trace mineral allowances are
presented in Table 10.Table 10.Table 10.Table 10.Table 10. In
correct inclusion rate or nutri-
ent concentration. Pork produc-
ers must evaluate premixes
based on the total amount and
form of each nutrient that is
provided to one ton of feed. For
this reason, vitamin and trace
mineral allowances in Table 10Table 10Table 10Table 10Table 10
are presented as amount of
nutrient provided per ton of
final diet.
Table 9. Suggested Calcium, Phosphorus and Salt Levels for Swine Diets
Gestation/Mature Boarsa 0.90 0.80 0.50Lactationb 0.90 0.80 0.50Starter 0.90 0.75 0.30Grower (45-100 lb) 0.75 0.65 0.40Finisher (100-240 lb) 0.65 0.55 0.40Developing boars 0.75 0.60 0.40Replacement gilts (100-240 lb) 0.80 0.70 0.40
aFeed intake > 4.5 lb/day. bFeed intake > 11 lb/day.
Stage of Ca P SaltProduction (% of diet) (% of diet) (% of diet)
1717171717
disappearance that will satisfy
the pig’s daily lysine needs.
Macrominerals, vitamins and
trace minerals should be incor-
porated according to the guide-
lines listed below in Tables 9Tables 9Tables 9Tables 9Tables 9
and 10.10.10.10.10. Subtherapeutic levels
of antibiotics can be added if
health conditions warrant.
Step 4.Step 4.Step 4.Step 4.Step 4. Feed newly formu-
lated diets and continue to
evaluate pig performance. If
desired levels of performance
are not achieved, re-evaluate
diet formulation and manage-
ment practices.
density below 1450 kcal ME/lb
should be avoided in diets for
growing pigs. Energy density of
diets can be increased by adding
supplemental fat. Addition of
supplemental fat up to 5% of the
diet usually increases growth
rate, reduces feed intake and
improves feed efficiency. Unfor-
tunately, supplemental fat also
increases backfat depth of pigs,
especially during the finisher
phase for low-to-average lean
growth genotypes.
Step 3.Step 3.Step 3.Step 3.Step 3. Formulate a diet
based on the observed feed
Vitamin and Mineral RequirementsVitamin and Mineral RequirementsVitamin and Mineral RequirementsVitamin and Mineral RequirementsVitamin and Mineral Requirements
at Each Stage of Productionat Each Stage of Productionat Each Stage of Productionat Each Stage of Productionat Each Stage of Production
AAAAA

Stage of Production
LactationGestation/boars
Ingredient Replacement Starter Grower/Finisher Suggested Sourcestock
———————Amount / ton of diet ————————Vitamin Premixes:
Vitamin A, IU 6,000,000 6,000,000 4,000,000 Vitamin A palmitate-gelatin coatedVitamin D3, IU 1,500,000 1,500,000 672,000 Vitamin D3-stabilizedVitamin E, IU 30,000a 30,000a 21,000 dl-tocopheryl acetateVitamin K, mg 4,000 4,000 2,600 Menadione sodium bisulfiteRiboflavin, mg 6,000 6,000 4,000 RiboflavinNiacin, mg 36,000 36,000 24,000 NicotinamidePantothenic acid, mg 24,000 24,000 16,000 Calcium pantothenateVitamin B12, mg 30 30 18 Vitamin B12 in mannitol (.1%)Pyridoxine, mg 800 800 0 Pyridoxine HClThiamin, mg 1,000 1,000 0 Thiamin mononitrateFolic acid, mg 1,000 0 0 Folic acidBiotin, mg 200 0 0 D-BiotinCholine, mg 530,000 0 0 Choline chloride (60%)
Trace Mineral Premixes:Copper, g 8 8 3.6 CuSO4 • 5H2OIodine, g 0.2 0.2 0.2 KIO4Iron, g 90 90 54 FeSO4 • 2H2OManganese, g 27 27 1.8 MnSO4 • H2OSelenium, mg 90 272b 90 NaSeO3 or NaSeO4Zinc, g 90 90 54 ZnO (80% Zn)
aIf fat is added to diet, increase to 40,000 IU/ton of diet. bThe final diet concentration of selenium will be .3 ppm, which is the legal limit for pigs up to 40 lbs. body weight at this writing.
Table 10. Suggested Vitamin and Trace Mineral Levels for Swine Diets
In Table 10,Table 10,Table 10,Table 10,Table 10, one number
appears for each nutrient in
each stage of production. How-
ever, this should not be inter-
preted to mean that diets can
only be supplemented with
exactly the amount stated in
Table 10. Table 10. Table 10. Table 10. Table 10. Varying storage and
handling conditions, health
status of the herd, genetic
potential of pigs, voluntary feed
intake and other factors may
dictate a different level of
supplementation. Our recom-
mendations should satisfy the
vitamin and trace mineral needs
of most pigs under commercial
conditions.
Non-Nutritive Feed AdditivesNon-Nutritive Feed AdditivesNon-Nutritive Feed AdditivesNon-Nutritive Feed AdditivesNon-Nutritive Feed Additives
Antibiotics.Antibiotics.Antibiotics.Antibiotics.Antibiotics. Antibiotics and
antimicrobials have been used
at subtherapeutic levels in
swine diets for over 35 years.
Antibiotics are quite effective
growth promotants. Research-
ers believe that the primary
reason low-level antibiotic
feeding promotes growth is
due to suppression of
subclinical disease caused by
bacteria. Other direct meta-
bolic and nutrient-sparing
effects have been observed
with low-level antibiotic feed-
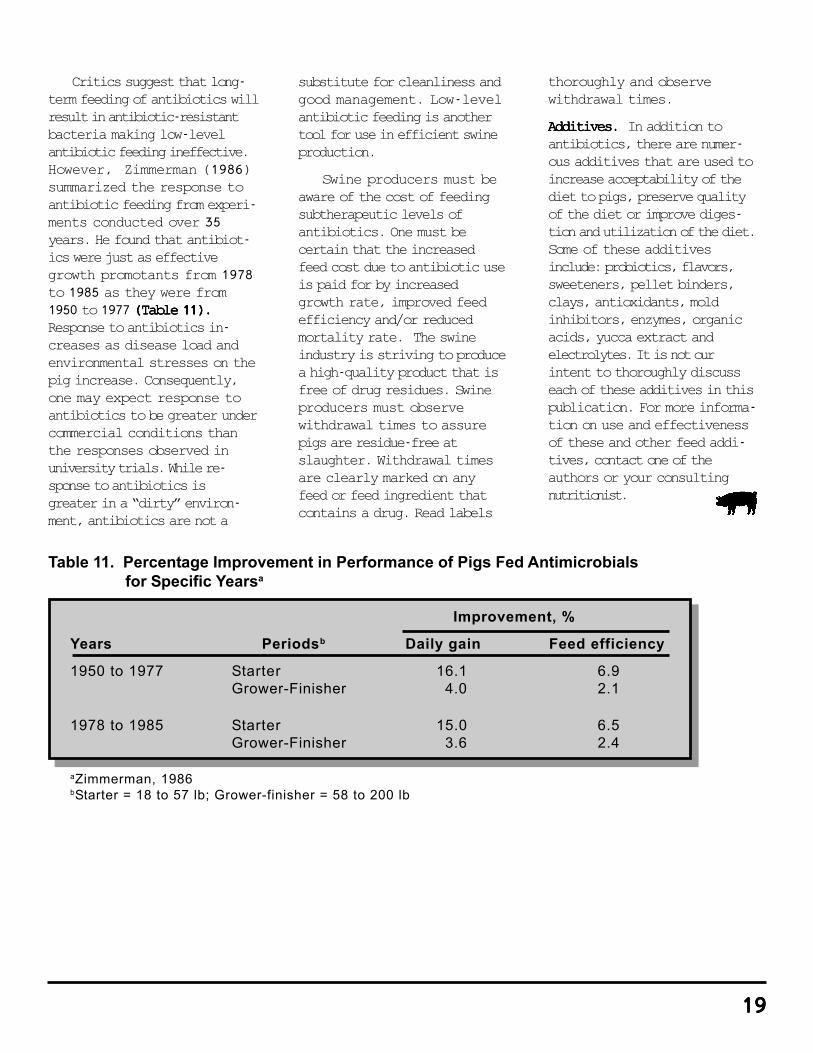
ing. Typically, subtherapeutic
levels of antibiotics increase
growth rate about 15% and
improve efficiency of feed
conversion 5 to 7% (Table 11).(Table 11).(Table 11).(Table 11).(Table 11).
Use of antibiotics may reduce
mortality rate. As the pig gets
older and heavier, the growth
promoting benefits of antibiot-
ics wane. There is some ques-
tion as to the effectiveness of
antibiotics in the diet of finish-
ing pigs.
Critics suggest that long-
term feeding of antibiotics will
result in antibiotic-resistant
bacteria making low-level
antibiotic feeding ineffective.
However, Zimmerman (1986)
summarized the response to
antibiotic feeding from experi-
ments conducted over 35
years. He found that antibiot-
ics were just as effective
growth promotants from 1978
to 1985 as they were from
1950 to 1977 (Table 11).(Table 11).(Table 11).(Table 11).(Table 11).
Response to antibiotics in-
creases as disease load and
environmental stresses on the
pig increase. Consequently,
one may expect response to
antibiotics to be greater under
commercial conditions than
the responses observed in
university trials. While re-
sponse to antibiotics is
greater in a “dirty” environ-
ment, antibiotics are not a
substitute for cleanliness and
good management. Low-level
antibiotic feeding is another
tool for use in efficient swine
production.
Swine producers must be
aware of the cost of feeding
subtherapeutic levels of
antibiotics. One must be
certain that the increased
feed cost due to antibiotic use
is paid for by increased
growth rate, improved feed
efficiency and/or reduced
mortality rate. The swine
industry is striving to produce
a high-quality product that is
free of drug residues. Swine
producers must observe
withdrawal times to assure
pigs are residue-free at
slaughter. Withdrawal times
are clearly marked on any
feed or feed ingredient that
contains a drug. Read labels
thoroughly and observe
withdrawal times.
Additives.Additives.Additives.Additives.Additives. In addition to
antibiotics, there are numer-
ous additives that are used to
increase acceptability of the
diet to pigs, preserve quality
of the diet or improve diges-
tion and utilization of the diet.
Some of these additives
include: probiotics, flavors,
sweeteners, pellet binders,
clays, antioxidants, mold
inhibitors, enzymes, organic
acids, yucca extract and
electrolytes. It is not our
intent to thoroughly discuss
each of these additives in this
publication. For more informa-
tion on use and effectiveness
of these and other feed addi-
tives, contact one of the
authors or your consulting
nutritionist.
1919191919
Table 11. Percentage Improvement in Performance of Pigs Fed Antimicrobials for Specific Yearsa
Improvement, %
Years Periodsb Daily gain Feed efficiency
1950 to 1977 Starter 16.1 6.9Grower-Finisher 4.0 2.1
1978 to 1985 Starter 15.0 6.5Grower-Finisher 3.6 2.4
aZimmerman, 1986bStarter = 18 to 57 lb; Grower-finisher = 58 to 200 lb
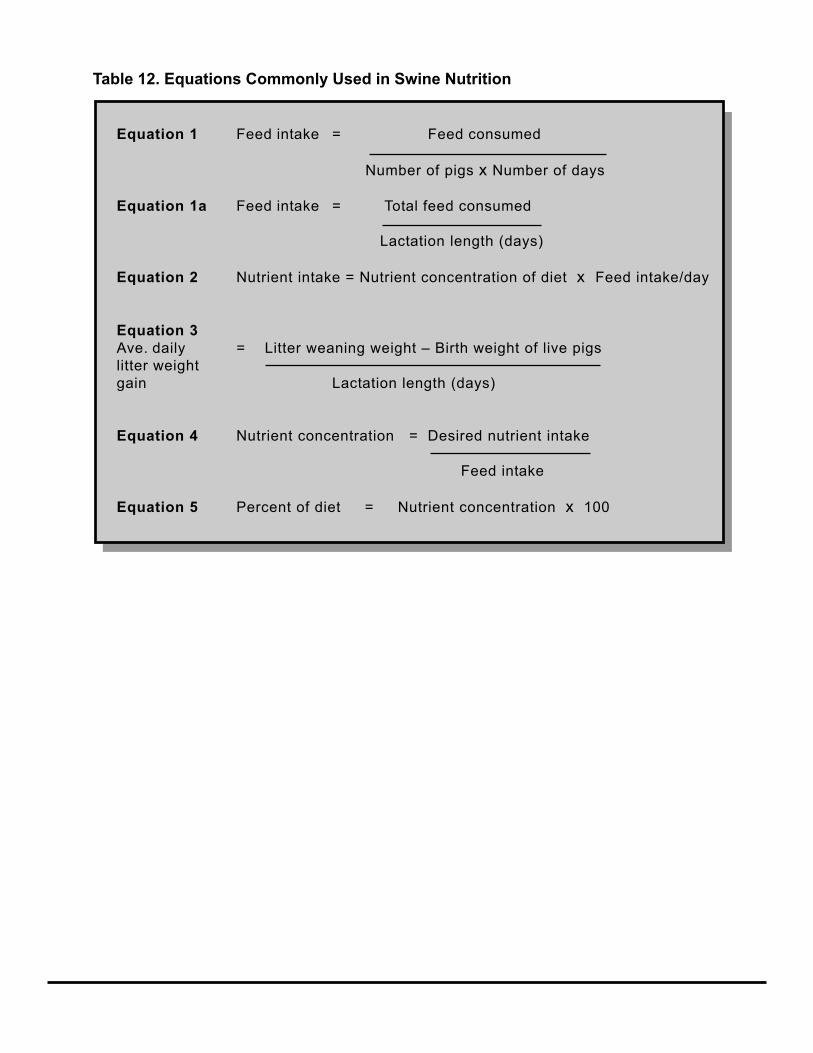
Table 12. Equations Commonly Used in Swine Nutrition
Equation 1 Feed intake = Feed consumed
Number of pigs x Number of days
Equation 1a Feed intake = Total feed consumed
Lactation length (days)
Equation 2 Nutrient intake = Nutrient concentration of diet x Feed intake/day
Equation 3Ave. daily = Litter weaning weight – Birth weight of live pigslitter weightgain Lactation length (days)
Equation 4 Nutrient concentration = Desired nutrient intake
Feed intake
Equation 5 Percent of diet = Nutrient concentration x 100

2121212121
Appendix. Determining Lean Gain for PigsAppendix. Determining Lean Gain for PigsAppendix. Determining Lean Gain for PigsAppendix. Determining Lean Gain for PigsAppendix. Determining Lean Gain for Pigs
To determine lean gain for pigs, the following information is needed:To determine lean gain for pigs, the following information is needed:To determine lean gain for pigs, the following information is needed:To determine lean gain for pigs, the following information is needed:To determine lean gain for pigs, the following information is needed:
1) Pig identity (ear notch or tag)
2) Initial weight and date weighed (obtained at 40-70 lb)
3) Carcass data
a) When optical probe (e.g., Fat-O-Meater) information is available:When optical probe (e.g., Fat-O-Meater) information is available:When optical probe (e.g., Fat-O-Meater) information is available:When optical probe (e.g., Fat-O-Meater) information is available:When optical probe (e.g., Fat-O-Meater) information is available:
Hot carcass weight (HCW), lb
Backfat depth (BF), in.
Loin eye depth (LED), in.
-or-
b) When carcasses are ribbed:When carcasses are ribbed:When carcasses are ribbed:When carcasses are ribbed:When carcasses are ribbed:
Adjusted hot carcass weight, lb
Loin muscle area, sq. in.
10th rib backfat depth, in.
-or-
c) When carcasses are not ribbed:When carcasses are not ribbed:When carcasses are not ribbed:When carcasses are not ribbed:When carcasses are not ribbed:
Adjusted hot carcass weight, lb
Carcass muscling score (1 = thin, 2 = medium, 3 = thick)
Last rib backfat depth, in.
Sex code (barrow = 0, gilt = 1)
4) Days on test from initial weight to market weight
Midwest Plan Service.Midwest Plan Service.Midwest Plan Service.Midwest Plan Service.Midwest Plan Service. 1983. Swine
Housing and Equipment Handbook.
Fourth edition, MPWS-8.
Miller, E.R., D.E. Ullrey and A.J. LewisMiller, E.R., D.E. Ullrey and A.J. LewisMiller, E.R., D.E. Ullrey and A.J. LewisMiller, E.R., D.E. Ullrey and A.J. LewisMiller, E.R., D.E. Ullrey and A.J. Lewis
(Eds.).(Eds.).(Eds.).(Eds.).(Eds.). 1991. Swine Nutrition.
Butterworth-Heinemann, Boston.
National Pork Producers Council.National Pork Producers Council.National Pork Producers Council.National Pork Producers Council.National Pork Producers Council. 1991.
Procedures to evaluate market hogs.
National Pork Producers Council, Des
Moines, Iowa.
Pettigrew, J.E.Pettigrew, J.E.Pettigrew, J.E.Pettigrew, J.E.Pettigrew, J.E. 1993. Amino acid nutri-
tion of gestating and lactating sows.
Biokyowa Technical Review - 5. Nutri-
Quest, Inc., Chesterfield, Missouri.
Pork Industry Handbook.Pork Industry Handbook.Pork Industry Handbook.Pork Industry Handbook.Pork Industry Handbook. Purdue
University Cooperative Extension
Service. West Lafayette, IN (Contact
your local County Extension Office for
order blanks and information).
Stahly, T.S.Stahly, T.S.Stahly, T.S.Stahly, T.S.Stahly, T.S. 1991. Amino acids in
growing, finishing and breeding
swine. Proceedings of the Animal
Nutrition Institute of the National
Feed Ingredients Association.
Williams, W.D., G.L. Cromwell, T.S.Williams, W.D., G.L. Cromwell, T.S.Williams, W.D., G.L. Cromwell, T.S.Williams, W.D., G.L. Cromwell, T.S.Williams, W.D., G.L. Cromwell, T.S.
Stahly and J.R. Overfield.Stahly and J.R. Overfield.Stahly and J.R. Overfield.Stahly and J.R. Overfield.Stahly and J.R. Overfield. 1984. The
lysine requirement of the growing
boar versus barrow. J. Anim. Sci.
58:657.
Zimmerman, D.R.Zimmerman, D.R.Zimmerman, D.R.Zimmerman, D.R.Zimmerman, D.R. 1986. Role of
subtherapeutic levels of antimicrobi-
als in pig production. J. Anim. Sci. 62
(Suppl. 3):6.
ReferencesReferencesReferencesReferencesReferences
Bergsrud, F., and J. Linn.Bergsrud, F., and J. Linn.Bergsrud, F., and J. Linn.Bergsrud, F., and J. Linn.Bergsrud, F., and J. Linn. 1989. Water
quality for livestock and poultry.
Minnesota Extension Publication AG-
FO-1864. Minnesota Extension
Service, St. Paul, MN.
Johnston, L.J. and J.D. Hawton. Johnston, L.J. and J.D. Hawton. Johnston, L.J. and J.D. Hawton. Johnston, L.J. and J.D. Hawton. Johnston, L.J. and J.D. Hawton. 1991.
Quality control of on-farm swine feed
manufacture. Minnesota Extension
Publication AG-FO-5639-C. Minnesota
Extension Service, St. Paul, MN.
Kerber, J.A., J. Shurson, and J.Kerber, J.A., J. Shurson, and J.Kerber, J.A., J. Shurson, and J.Kerber, J.A., J. Shurson, and J.Kerber, J.A., J. Shurson, and J.
Pettigrew.Pettigrew.Pettigrew.Pettigrew.Pettigrew. 1993. On-farm procedures
for monitoring pig growth. Univ. of
MN Swine Day Proceedings. pg. 58.
Appendix continued on back coverAppendix continued on back coverAppendix continued on back coverAppendix continued on back coverAppendix continued on back cover

Produced by the Educational Development System, Minnesota Extension Service.
Copyright © 1994 Minnesota Extension Service, University of Minnesota. All rights reserved.
The University, including the Minnesota Extension Service, is committed to the policy that all persons shall have equal access to its programs, facilities,and employment without regard to race, color, creed, religion, national origin, sex, age, marital status, disability, public assistance status, veteran status,or sexual orientation.
Calculate lean gain/day using the following equations (equations taken from NPPC, 1991):Calculate lean gain/day using the following equations (equations taken from NPPC, 1991):Calculate lean gain/day using the following equations (equations taken from NPPC, 1991):Calculate lean gain/day using the following equations (equations taken from NPPC, 1991):Calculate lean gain/day using the following equations (equations taken from NPPC, 1991):
Lean gain/day = Carcass muscle - Initial muscle
Days on test
Initial muscle, lb = (.418 x initial live weight, lb) – 3.65
For Fat-O-Meater information:For Fat-O-Meater information:For Fat-O-Meater information:For Fat-O-Meater information:For Fat-O-Meater information:
Carcass muscle, lb = 2.827 + (.469 x adj. hot carcass wt., lb)+ (9.824 x loin muscle depth, in.)– (18.470 x fat depth, in.)
If backfat and loin muscle depth are provided in centimeters by the packer, convert to inches(1 centimeter = .394 in).
For ribbed carcasses:For ribbed carcasses:For ribbed carcasses:For ribbed carcasses:For ribbed carcasses:
Carcass muscle, lb = 7.231 + (.437 x adj. hot carcass wt, lb)+ (3.877 x 10th rib loin muscle area, sq. in.)– (18.746 x 10th rib fat depth, in.)
For unribbed carcasses:For unribbed carcasses:For unribbed carcasses:For unribbed carcasses:For unribbed carcasses:
Carcass muscle, lb = 8.179 + (.427 x adj. hot carcass wt., lb)+ (6.290 x carcass muscle score*)+ (3.858 x sex code**)– (15.596 x last rib fat depth, in.)
*Carcass muscle scores: 1 = thin, 2 = intermediate, 3 = thick**Barrow = 0, Gilt = 1
For example, a pig has the following information:Initial weight = 50 lbDays on test = 109Hot carcass weight = 180 lbFat-O-Meater measurements: LED = 3.15 in. BF = .8 in.
Initial muscle = (.418 x 50) – 3.65 = 17.25 lb
Carcass muscle = 2.827 + (.469 x 180) + (9.824 x 3.15) –(18.470 x .8) = 103.4 lb
Lean gain/day = 103.4 lb – 17.25 lb = .79 lb
109 days
Printed on recycled paper with minimum of 10% postconsumer waste.