Embed Size (px)
Citation preview

To the Graduate Council:
I am submitting herewith a thesis written by Harlin Wilkin entitled “Identification of High Accident Locations Involving Farm equipment on Public Roads and Similarities among those Locations.” I have examined the electronic copy of this thesis for form and content and recommend that it be accepted in partial fulfillment of the requirements for the degree of Master of Science, with a major in Agriculture and Natural Resources.
Dr. Sandy Mehlhorn Major Professor
We have read this thesis and recommend its acceptance:
Dr. Jeremy D’Antoni
Dr. Barbara Darroch
Dr. Joey Mehlhorn
Accepted for the Council
Dr. Victoria S. Seng Associate Vice Chancellor for Academic Affairs and Dean of Graduate Studies
(Original signatures are on file with official student records)


Identification of Locations with High Accident Frequencies
Involving Farm Equipment on Public Roads
and Similarities among those Locations
A Thesis Presented for
the Master of Science Degree
The University of Tennessee at Martin
Harlin Wilkin
August 2013

ii
Acknowledgments
I would like to express my deepest gratitude to Dr. Sandy Mehlhorn for all of her advice
and support throughout my graduate studies as well as with this research work. I would also like
to like to thank Dr. Barb Darroch and Dr. Jeremy D’Antoni for their constructive critiques and
help with statistics within this thesis. I am grateful for the information and assistance provided by
the Tennessee Highway Patrol.

iii
Abstract
The increased safety of farm equipment on public roadways has been the topic of much
research for several years. With more farm vehicles traveling on roadways at increased speeds, it
will continue to be an important topic for research. The objective of this research project was to
locate areas with high accident rates involving farm equipment (excluding other slow moving
vehicles) and to identify similarities, if any, within those locations.
The primary geographical location of research was northwest Tennessee. Data collected
from public accident report records obtained from the Tennessee Highway Patrol were entered
into a Geographic Information System (GIS) database, so locations with high accident rates
could be identified. Physical data were gathered concerning these locations including number of
lanes, presence and width of a shoulder, presence of equipment warning signs, and other
roadway information. Information contained within the public accident records was also
considered, such as time of day, weather conditions, and severity of the accident. Statewide data
included crash site location, time and day of the accident, vehicle body code, and injury class.
This research study revealed that most farm vehicle crashes occur during the months of
May, June, and October. More accidents occur on Mondays than any other day of the week with
Sundays having the fewest reported farm vehicle accidents. Typically, most farm vehicle
collisions occur between 12:00 pm and 6:00 pm and when the weather is clear. Of the 16
accidents sites in northwest Tennessee, 88% (14 sites) had grass shoulders that were 6 feet wide
or less. No sites had farm vehicle signs posted, and 81% (13 sites) had no posted speed limits.
Farm vehicle collisions could be reduced through better driver education, proper sign posting,
wider shoulders, improved warning lights, and reduced traffic speeds.

iv
Table of Contents
1 Introduction ...................................................................................................................................1
Objectives ............................................................................................................................2
2 Literature Review..........................................................................................................................3
3 Methods.......................................................................................................................................10
4 Results and Discussion ...............................................................................................................13
5 Conclusion ..................................................................................................................................31
List of References ..........................................................................................................................34
Appendix ........................................................................................................................................37
Vita .................................................................................................................................................47
v
List of Figures
Figure 1. Slow Moving Vehicle Sign..............................................................................................6
Figure 2. Farm equipment signs W11-5 and W115A .....................................................................7
Figure 3. A map summarizing frequency of crashes involving farm equipment by
Tennessee County and frequency for the period of 2003 to 2011 .....................................14
Figure 4. Locations of crashes involving farm equipment within the focus area of
northwest Tennessee ..........................................................................................................14
Figure 5. Photograph of a typical farm vehicle crash site in northwest Tennessee ......................16
Figure 6. Scatter plot of farm acreage (2007) and population (2010) per county in Tennessee ...17
Figure 7. Scatter plot of farm acreage (2007) and number of farm vehicle accidents
(2003-2011) per county in Tennessee ................................................................................18
Figure 8. Scatter plot of number of farm vehicle accidents (2003-2011) and population
(2010) per county in Tennessee .........................................................................................18
Figure 9. Farm vehicle accident totals by month in all of Tennessee for the years of
2003 to 2011 ......................................................................................................................20
Figure 10. Farm vehicle accident totals by month for the high crash frequency sites in
the focus area of northwest Tennessee for the years of 2003 to 2011 ...............................20
Figure 11. Farm vehicle accident totals by weekday for all of Tennessee from
2003 to 2011 ......................................................................................................................21
Figure 12. Farm vehicle accident totals by weekday for the high crash frequency sites
in the focus area of northwest Tennessee for the years of 2003 to 2011 ...........................21
Figure 13. Farm vehicle accident totals by time for Tennessee for the years
2003 to 2011 ......................................................................................................................23
Figure 14. Farm vehicle accident totals by time for the high crash frequency sites in the focus area of northwest Tennessee for the years of 2003 to 2011 .....................................23
Figure 15. Farm vehicle accident totals by weather conditions in Tennessee for
the years 2003 to 2011 .......................................................................................................24
Figure 16. Farm vehicle accident totals by weather for the high crash frequency sites in
the focus area of northwest Tennessee for the years of 2003 to 2011 ...............................24

vi
Figure 17. Farm vehicle accident totals by distance from an intersection in
Tennessee from 2003 to 2011 ............................................................................................26
Figure 18. Farm vehicle accident totals by distance from intersection for the
high crash frequency sites in the focus area of northwest Tennessee for
the years of 2003 to 2011 ...................................................................................................26
Figure 19. Direction from an intersection a farm vehicle accident occurred from
2003 to 2011 in Tennessee .................................................................................................27
Figure 20. Farm vehicle accident totals by direction from intersection for the
high crash frequency sites in the focus area of northwest Tennessee for
the years of 2003 to 2011 ...................................................................................................27
Figure 21. Farm vehicle collision types in Tennessee from 2003 to 2011 ...................................28
Figure 22. Farm vehicle accident totals by collision type for the high crash frequency
sites in the focus area of northwest Tennessee for the years of 2003 to 2011 ...................28
Figure A.1. HWY 79 and HWY 124 ............................................................................................38
Figure A.2. HWY 79 and Brasher Rd ...........................................................................................38
Figure A.3. HWY 54 and Mt. Orange Rd .....................................................................................39
Figure A.4. HWY 54 and Lowery Rd ...........................................................................................39
Figure A.5. Luck Madden and White R ........................................................................................39
Figure A.6. Luck Madden and Breece Rd ....................................................................................40
Figure A.7. HWY 69 and Sparks Rd ............................................................................................40
Figure A.8. Sparks Rd ...................................................................................................................41
Figure A.9. Ken-Tenn HWY and Flippen Dr ...............................................................................41
Figure A.10. Ken-Tenn HWY and Albert Owens Rd ...................................................................41
Figure A.11. Ken-Tenn HWY .2 miles from Albert Owens Rd ...................................................42
Figure A.12. Shawtown Rd .4 miles from Davis Rd ....................................................................42

vii
Figure A.13. Ralston Rd. and Billingsby Rd ................................................................................43
Figure A.14. Ralston Rd. and Bushart Rd.....................................................................................43

viii
List of Tables
Table 1. Summary of conditions during farm vehicle accidents at high frequency
crash sites in northwest Tennessee, 2003 – 2011 ..............................................................15
Table 2. Site descriptions for accidents at high frequency crash locations sites in
northwest Tennessee, 2003 – 2011 ....................................................................................15
Table 3. Pearson correlation coefficients among farm acreage (2007), number of
farm vehicle accidents (2003-2011), and population (2010) per county in Tennessee .....17
Table A.1. Summary of location of farm vehicle accidents at high frequency crash
sites in northwest Tennessee, 2003 – 2011 ........................................................................44
Table A.2. Summary of time of farm vehicle accidents at high frequency crash sites
in northwest Tennessee, 2003 – 2011 ................................................................................44
Table A.3. Summary of crash type, weather condition, injury class, and road type
of farm vehicle accidents at high frequency crash sites in northwest
Tennessee, 2003 – 2011 .....................................................................................................45
Table A.4. Summary of physical location characteristics of farm vehicle accidents
at high frequency crash sites in northwest Tennessee, 2003 – 2011 .................................46
1
1 Introduction
Since the invention of tractors, farmers have been able to work greater numbers of acres
in less time. Farmers can plant, spray, and harvest in shorter amounts of time due to
technological advances that provide greater efficiency and ease of operation. Though these
advances have made life easier in many ways, they also bring a degree of danger with them
(Devault, 2005). Much of the self-propelled farm equipment in operation today can travel at
speeds as high as 25 mph or more. These higher rates of speed can cause issues with other
vehicle traffic that may underestimate the speed of the equipment when pulling out from an
intersection or attempting to pass (Garvey, 2003). As the population in rural areas increases,
large farm plots are being divided by roads and highways. This has forced producers to operate
large equipment on public roads more frequently. The need to move large tractors and other
equipment from field to field increases the risk of a vehicle collision with a farm vehicle.
Research has revealed many factors that should be considered to reduce crashes involving
farm vehicles. Many factors are the sole responsibility of the farm vehicle owner; these include:
insuring that all warning lights are working properly, all loads are secured and balanced, and
equipment is capable and functioning properly for road transport. However, factors related to the
physical characteristics of the roadways and surrounding areas can be modified to help reduce
the risk of crashes. These factors include lane and shoulder width, information distribution to the
public through the posting farm vehicle signs, and speed limits.

2
Objectives
The objective of this research project was to locate areas within Northwest Tennessee
with high accident rates involving farm vehicles (farm vehicle body code on crash record). The
site characteristics at these locations were inventoried and compared to find similarities among
sites. A secondary objective was to compare the results from the focus area to statewide data.
This comparison was used as a check and to provide insight into potential factors not represented
within the focus area.

3
2 Literature Review
Luginbuhl et al. (2003) evaluated both reported and unreported accidents involving farm
equipment in North Carolina. They conducted a mail survey of North Carolina farmers and
gathered official data from the state highway patrol. The authors were focused on the farmers’
perceptions of safety on the road while in their farm equipment. Reported accident data were
used to validate the perceptions of the farmers. Farmers believed the greatest risk on roadways
was lack of respect from other drivers and increased speeds on rural roads. The study concluded
that a majority of farmers surveyed believed the following mitigation measures would help
reduce farm equipment related accidents: the use of blinking lights, roadway signs to caution
other drivers of areas frequented by farm implements, and wider roadways and/or shoulders to
provide adequate room to allow farm vehicles to exit or operate along the side of the roadway for
passing vehicles (Luginbuhl et al., 2003).
Another study from North Carolina investigated public health concerns regarding farm
vehicle transport on public roads (Costello et al, 2003). Discussions with producers as well as
equipment dealerships revealed that operators transporting farm equipment down public roads
feel less safe now than in years past. Factors investigated by this study included population
density, tourism, industry, and urban versus rural mix. These factors were compared with
Michigan, Iowa, and Florida based on information availability. The results provided a “water-
mark” for further research into farm vehicle transport safety on public roads. At the time of this
study, May, June, and July had the highest number of farm vehicle crashes and the most
frequently reported time of an accident was 3 p.m. to 6 p.m. Over 75% of farm vehicle collisions
occurred on a secondary or numbered highway. Costello et al. (2003) suggests that a
4
multidiscipline approach to public road safety and farm vehicle transport is necessary to reduce
the number of accidents.
Wickes and Nelson (2000) investigated an alternative aspect to the cause of accidents
between slow moving vehicles and other vehicles. The authors looked at the amount of time
drivers take to react to slow moving vehicles versus the amount of time necessary to take action
to avoid an accident. This information was then compared with the distance covered and closing
speeds of vehicles traveling 25 to 70 mph. Wickes and Nelson (2000) concluded that if a vehicle
was traveling at highway speeds and closing on a vehicle traveling around 25 mph, a surprised
driver would not have enough time to react to prevent a collision from occurring.
In an attempt to estimate capital loss from tractor roll-overs based on productive lives
lost, Lehtol et al. (1994) used newspaper articles from 1988 to 1992 and determined that there
were 136 fatalities during the time period. Of the 136, 14% of the fatalities resulted from
accidents involving tractors and motor vehicles. Per year, Iowa had an estimated 7.25 million
dollars lost simply due to tractor related fatalities. There was no evidence of a decline in tractor
related deaths in Iowa during that time period (Lehtol et al., 1994).
In 2003, Swedish researchers performed a study to investigate slow moving vehicle
collisions and ways they can be prevented (Pinzke and Lundquist, 2003). Five years of accident
data were reviewed covering all types of slow moving vehicles. The study was not limited to
farm equipment, but included other slow moving vehicles such as mopeds, scooters, and horse-
drawn vehicles. The authors suggested ways to reduce roadway accidents, including measures to
make vehicles more visible, improving driver training, and improving information directed
toward farm vehicle operators and others on the roads (Pinzke and Lundquist, 2003).
5
A similar study by the California Farm Safety Program recommended practices for safe
farm machinery operation (Meyers, 2005). Concerning implements in tow and tractors on the
roadways, all lights, signs, and brakes should be checked to ensure they are in proper working
order before entering a roadway. In addition, operators should never carry passengers, and
should make sure all loads are secure, balanced, and within the tractor’s operational weight
(Meyers, 2005).
In 1994, legislation was enacted in Wisconsin that required youth without a driver’s
license to obtain certification to operate farm machinery on roadways. The legislation also
prohibited those less than 13 years of age from operating farm equipment entirely. Fourteen
states have laws, restrictions, or propitiations related to youth operating farm equipment on
public roadways (Doty and Marlenga, 2006). Of the fourteen states, Tennessee was not listed in
the article. Tennessee does restrict vehicle being operated left of center, but this law is not
specific to farm vehicles. There are no current restrictions on farm vehicle weight or width in
Tennessee.
Whereas current federal roadway regulations do not require a Slow Moving Vehicle
(SMV) emblem on machinery moving at 25 mph or less, many states have legislation that do
require SMV emblem. The official SMV (Figure 1) was recognized by the American Society of
Agricultural and Biological Engineers (ASABE) in 1964 as a means to improve visibility of farm
equipment on public roadways (Murphy, D.J, and R. Grisso, 2009). The use of these emblems is
intended to be an effective way to inform drivers of a slow moving vehicle. Although some
tractors are now capable of speeds greater than 25 mph, most farm equipment display a SMV.

6
Figure 1. Slow Moving Vehicle Sign. This emblem is displayed on the rear of motor vehicles
with a maximum speed of 25 mph to inform other motorists of the vehicle’s low speed.
Garvey (2003) explores the notion that the SMV symbol for a slow moving vehicle might
be misunderstood by the general public. The symbol has a different appearance at night than in
the daytime, which may confuse drivers. Other issues with the current SMV emblem include
incorrect use, which degrades its purpose, discrepancy of meaning among driver handbooks for
driver’s education, and similar emergency markers such as emergency triangles used by
incapacitated vehicles on highways (Garvey, 2003).
Murphy and Grisso (2009) discussed the topic of tractor and farm safety, including
operation of tractors on public roads and high speed tractors. They suggested that high speed
tractors should have an emblem different from the SMV to warn others using the roadway of the
machines’ capabilities to achieve speeds over 25 mph. The authors also outlined current

7
advancements in both the industry and legislation that will help shape the future for safe tractors
and roadways. Some of the advancements mentioned were standard warning lights on new
tractors and a stronger outlook on safety during the development process (Murphy and Grisso,
2009).
Another issue facing farm equipment operators on public roadways are improper or
misunderstood roadway warning signs. Legault and Sheldon (2004) questioned the sign used for
warning drivers of possible implements on roadways. Concerns are that the current design may
be out of date. The current design has been used for 40 years and does not represent modern
machinery very well. It displays an antique looking tractor with an oversized rider (W11-5,
Figure 2). The goal of the project was to develop a more modern looking sign that would more
efficiently alert drivers of the possibility of the presence of farm equipment (W11-5A, Figure 2)
(Legault and Sheldon, 2004).
W11-5 W11-5A
Figure 2. Farm equipment signs W11-5 and W115A. W11-5 it the most common farm
vehicle sign and W11-5A displays a more modern tractor.

8
The factors contributing to vehicle collisions involving animals and farm machinery are
similar. These similarities include vehicle speeds, traffic volumes, driver reactions, and site
characteristics. Seiler (2005) studied moose-vehicle collisions in Sweden and their approach and
end results are not radically different from studies of farm machinery collisions. The article
illustrates the problem for drivers in Sweden where moose must cross roadways to forage, the
most important issue being loss of life. Seiler (2005) examined many factors that contribute to
moose-vehicle collisions to determine why these collisions are occurring and how they can be
avoided. Suggested actions for predicting and reducing moose-vehicle collisions include:
reducing vehicle speeds in areas with higher moose populations, the use of fencing to regulate
where moose crossings occur, and increasing roadside clearance (Seiler, 2005). Although the
migration of moose across a roadway and the transportation of farm equipment on a roadway are
different, reducing vehicle speeds and increased roadside clearance can be relevant in reducing
farm vehicle crashes.
Increased population density in rural areas may also contribute to frequency of farm
machinery accidents. Ewing et al. (2003) investigated urban sprawl as a link to increased traffic
accidents and pedestrian fatalities in rural areas. Sprawl was defined as “any environment
characterized by the following: a population widely dispersed in low-density residential
development; rigid separation of homes, shops, and workplaces; a lack of distinct, thriving
activity centers, such as strong downtowns or suburban town centers; and a network of roads
marked by very large block size and poor access from one place to another.” The authors created
an index from 448 US counties in the largest 101 metropolitan areas and then preformed
regression analysis to determine a relationship between the index and traffic fatalities. The
results revealed that there was a direct relationship between urban sprawl to traffic and

9
pedestrian fatalities. For every 1% increase of the index (i.e. less urban sprawl) all modes of
traffic fatalities fell by 1.49% and pedestrian fatalities fell by 1.47% to 3.56% depending on
exposure (Ewing et. al., 2003). This article relates to farm-vehicle collisions as it provides insight
to an indirect cause of accidents.

10
3 Methods
Accident records from all Tennessee counties were obtained from the Tennessee
Highway Patrol (THP) for 2003 through 2011. A summary of accidents statewide was
constructed by mapping the number of accidents per county. Accidents that were used were
identified on the reports involving farm vehicles. There was no designation to determine what
type of farm vehicle it was. The focus area was narrowed to northwest Tennessee, specifically
Lake, Obion, Weakley, Henry, Benton, Carroll, Gibson, and Dyer counties. The records from
these counties were organized into an Excel (Microsoft ®) spreadsheet. Google Earth was used
to pin-point the GPS coordinates and elevation for each crash site location according to the crash
record.
Once all of the GPS information was identified, the Excel document was then loaded into
ArcGIS (ESRI of California). ArcGIS was used to create a map that plotted all of the crash sites
for the focus area onto roadways. The map was then used to determine what areas had high crash
rates. Each site was visited to collect an inventory of site characteristics. Information on roadway
width, shoulder width, posted speed limit, and farm vehicle sign information was collected at
each site. In addition, information on road composition, shoulder composition, roadway lines,
sight distance, a physical site description, and pictures were all recorded. For both statewide and
the focus area, data were summarized in Excel by month, day of the week, time of day, weather
conditions at time of accident, distance from an intersection, direction from intersection, and type
of collision (property damage, injury, and fatal).
A chi square test was used to determine if different variables, like days of the week or
months of the year, are equal. After performing a chi squared test the resulting p value is the

11
determining factor. If the p value is greater than a critical value (α=0.05) then you would accept
the null of equality. Alternatively, if the p value is less than α then rejection of the null of
equality would occur. This could mean that one or more variables have a greater chance of
occurrence than other variables.
The chi square test was performed in Excel through the use of the =CHISQ.TEST
function. Month, day of the week, time of day, weather conditions at the time of the accident,
distance from the intersection, direction from the intersection, and collision type from the
statewide data were all evaluated using the chi square test. Expected values needed for the test
were calculated by taking the total number of data points divided by the number of outcomes (i.e.
for months, divide by 12). Due to the limited number of data points contained in the focus area, a
chi square test was not performed for any of the previously listed factors.
Linear correlation analysis tests the linear relationship between two variables. The results
of a correlation test range from +1 to -1. The closer the resulting integer from the test is to either
positive or negative one, the stronger the relationship is between the two variables. If the results
of the test are positive one, this means that as one variable increases the other variable will also
increase. The opposite of this is true if a negative one results. As one variable increases then the
other variable will decrease. Should the result from the correlation regression be zero or very
close to it, then the relationship between the two variables is much weaker or there is no
relationship (if the results were zero). Pearson’s product-moment correlation (r) was calculated
as follows:

12
√
Correlation analyses were performed on population, farm acres, and number of accidents.
Excel’s data analysis toolpak was utilized to accomplish the analysis. Population information
was gathered from the U.S. Census Bureau census of 2010 (2013) and the number of acres of
farmland in each Tennessee county was gathered from the 2007 USDA Census of Agriculture
(2013). The critical value for (r) for 93 degrees of freedom (there are 95 counties in Tennessee)
at α0.05 is 0.202. The correlation function within the analysis toolpak of Excel was used to
calculate each correlation coefficient. Correlations between county population and county farm
acreage, county population and the number of accidents per county, and county farm acreage and
the number of accidents per county were determined.

13
4 Results and Discussion
From 2003 to 2011 there were 1424 reported and documented traffic collisions for
Tennessee involving a farm vehicle (Figure 3). The focus area counties of northwest Tennessee
are outlined with a bold gray. The counties with the highest number of accidents statewide are
Sullivan, Giles, and Hamblen. In the focus area, Weakley County had the highest number of
farm vehicle accidents. The counties with the lowest number of accidents in the state are
Rutherford, Claiborne, and Morgan. Lake County had the lowest number of accidents in the
focus area with only three reported accidents. From this work it is difficult to explain the
variation in the number of accidents per county.
Of the crash sites recorded in northwest Tennessee (Figure 4), a total of seven sites,
which included sixteen accidents, were identified within Lake, Obion, Weakley, Henry, Benton,
Carroll, Gibson, and Dyer counties to have a high crash frequency. A high crash frequency was
described as two or more crashes within two miles on the same roadway during the eight year
period. Table 1 and 2 identify the specific site characteristics for the high crash frequency areas.
Of the sites visited, none had a farm vehicle sign present in either direction (Table 2).
Furthermore, of these sites 81% (thirteen sites) had no posted speed limit. Of the five sites with
some form of roadway signs, 40% have a short line of sight and two of the roads have five lanes.
Most (88%) of the accident sites have shoulders that are six feet wide or less, and 13% of the
lane widths are less than nine feet. Most (88%) of the shoulders were grass; the shoulders at the
other two sites were composed of asphalt. The majority of the roadways were two lanes with the
average width being 20.5 feet (Figure 5); the others (two sites) were 5 lane highways with an
average road width of 59.2 feet.

14
Figure 3. A map summarizing frequency of crashes involving farm equipment by Tennessee
county and frequency for the period of 2003 to 2011. The counties outlined in bold gray were
studied in more detail.
Figure 4. Locations of crashes involving farm equipment within the focus area of northwest
Tennessee. High crash frequency areas are circled in red.

15
Table 1. Summary of conditions during farm vehicle accidents at high frequency crash sites in
northwest Tennessee, 2003 – 2011.
Accident Site Time Month Day Weather Code Injury Class
1 8:05 AM September Monday Clear No Injury 2 9:28 AM April Friday No Adverse Conditions No Injury 3 9:30 AM August Monday No Adverse Conditions No Injury 4 3:55 PM October Tuesday Clear No Injury 5 2:45 PM June Thursday No Adverse Conditions Possible Injury 6 1:25 PM May Thursday Clear No Injury 7 8:55 AM June Tuesday Clear No Injury 8 3:18 PM September Wednesday No Adverse Conditions No Injury 9 1:00 PM October Saturday No Adverse Conditions No Injury
10 5:25 PM May Tuesday No Adverse Conditions No Injury 11 1:45 PM March Saturday Clear Possible Injury 12 8:15 AM June Monday Clear Incapacitating Injury 13 9:15 AM March Monday Clear No Injury 14 2:47 PM October Thursday No Adverse Conditions No Injury 15 6:00 PM August Tuesday Cloudy Possible Injury 16 2:45 PM October Monday Clear No Injury
Table 2. Site descriptions for accidents at high frequency crash locations sites in northwest
Tennessee, 2003 – 2011.
Accident Site
Road Width
(ft)
Lane Width
(ft)
Shoulder Width 1
Shoulder Width 2
Shoulder Type
Roadway Lines
Posted Speed
Signs
1 59 12 3 10 Asphalt Yes Yes Multiple HWY indicators
2 59 12 10 10 Asphalt Yes Yes Road markers, Street Name
3 19 10 4 10 Grass Yes No None 4 19 10 4 8 Grass Yes No None 5 23 12 5 5 Grass Yes No None 6 23 11 5 5 Grass Yes No None 7 17 8 2 1 Grass No No Line of Sight 8 21 11 10 2 Grass Yes Yes None 9 20 10 6 6 Grass Yes No None
10 19 10 4 5 Grass Yes No None 11 23 12 6 5 Grass Yes No Mile marker 12 23 12 6 2 Grass Yes No None 13 23 12 6 4 Grass Yes No None 14 20 10 6 2 Grass Yes No None 15 17 8 6 6 Grass Yes No None 16 20 10 2 5 Grass Yes No Intersection

16
Figure 5. Photograph of a typical farm vehicle crash site in northwest Tennessee.
To explore the possible effect of population density on farm vehicle accidents, farm
acreage, population, and number of accidents were organized by county. Correlation coefficients
among these factors were determined (Table 3). Scatter plots of population and farm acreage
(Figure 6), farm acreage and accidents (Figure 7), and accidents and population (Figure 8)
display the relative correlation between these factors. All of the correlation coefficients (Table 3)
were less than the critical r value of 0.202. Therefore, no coefficients were significant. There was
a slight negative correlation (r = -0.0271) between the population and the number of farm
acreage. An explanation may be farm lands will decrease because land is being sold for
developments such as subdivisions, thereby increasing the population and reducing the number
of farm acres. Out of the three correlations, the strongest (r = 0.0940) was between the number of
farm acreage and the number of farm vehicle accidents. This means the more farm acres there
are, the greater the likelihood of farm vehicle accidents.

17
Table 3. Pearson correlation coefficients among farm acreage (2007), number of farm vehicle
accidents (2003-2011), and population (2010) per county in Tennessee.
Acres Population
Population -0.0271
Accidents 0.0940 -0.0002
Figure 6. Scatter plot of farm acreage (2007) and population (2010) per county in Tennessee.
r = -0.0271
0
100
200
300
400
500
600
700
800
900
1000
0 50 100 150 200 250 300 350
Po
pu
lati
on
(Th
ou
san
ds)
Acres (Thousands)

18
Figure 7. Scatter plot of farm acreage (2007) and number of farm vehicle accidents (2003-2011)
per county in Tennessee.
Figure 8. Scatter plot of number of farm vehicle accidents (2003-2011) and population (2010)
per county in Tennessee.
r= 0.0940
0
10
20
30
40
50
60
70
0 50 100 150 200 250 300 350
Nu
mb
er
of
Acc
ide
nts
Acres (Thousands)
r= -0.0002
0
10
20
30
40
50
60
70
0 100 200 300 400 500 600 700 800 900 1000
Nu
mb
er o
f A
ccid
ents
Population (Thousands)

19
The impact of time was considered in this study. Time of day, day of the week, and
month of the year were examined for Tennessee as a whole and for the focus area. Figure 9
illustrates the distribution of wrecks by month throughout the state over the investigated period
(Chi square p value = 5.43E-50). With the critical p value less than α 0.05, the null of equality was
rejected. Therefore, there is a significant relationship between month and number of collisions.
May, June, and October had the greatest number of accidents statewide. It is important to note
that this is a peak time for operation of farm vehicles as it falls around planting and harvesting.
The focus area reflects similar results with the greatest number of accidents occurring in October
(Figure 10). June had the next highest number of recorded accidents with March, August, and
September having equal numbers of accidents.
Figure 11 shows the day of the week in which accidents occurred statewide. The highest
percentages of accidents occurred on Mondays (18%), and Tuesday closely following with 17%
(Chi square p value = 4.34E-55). Conversely, the day of the week with the lowest percentage of
crashes was Sunday with 7%. Again, the p value was less than α 0.05 meaning the null of equality
was rejected. Similar results were observed in the focus area, with more accidents happening on
Monday and Tuesday, and Sundays had no reported farm-vehicle accidents (Figure 12). Sundays
could have the lowest number of farm vehicle collisions because it might be the day most
farmers do not work. This would mean there are fewer farm vehicles on the roadways. Mondays
and Tuesdays could have higher numbers as they are generally the start to the work week and the
day farmers choose to move equipment to start working.

20
Figure 9. Farm vehicle accident totals by month in all of Tennessee for the years of 2003 to
2011. Chi square p value = 5.43E-50.
Figure 10. Farm vehicle accident totals by month for the high crash frequency sites in the focus
area of northwest Tennessee for the years of 2003 to 2011.
35
60
80
117
176
225
127 120
134
156
100
72
0
50
100
150
200
250
Jan Feb Mar Apr May Jun Jul Aug Sep Oct Nov Dec
Nu
mb
er
of
Cra
she
s
Month
0 0
2
1
2
3
0
2 2
4
0 0 0
1
2
3
4
5
Jan Feb Mar Apr May Jun Jul Aug Sep Oct Nov Dec
Nu
mb
er
of
Cra
shes
Month

21
Figure 11. Farm vehicle accident totals by weekday for all of Tennessee from 2003 to 2011. Chi
square p value = 4.34E-55.
Figure 12. Farm vehicle accident totals by weekday for the high crash frequency sites in the
focus area of northwest Tennessee for the years of 2003 to 2011.
252 239
214 204 206
193
94
0
50
100
150
200
250
300
Mon Tue Wed Thu Fri Sat Sun
Nu
mb
er O
f C
rash
es
Day
5
4
1
3
1
2
0 0
1
2
3
4
5
6
Mon Tue Wed Thu Fri Sat Sun
Nu
mb
er o
f C
rash
es
Day

22
Time of day can show us when it is most likely to have an accident occur. Across
Tennessee, 47% of farm vehicle collisions occurred from 12:00 pm to 6:00 pm and 32%
occurred from 6:00 am to 12:00 pm (Figure 13). Likewise in the focus area, 52% of farm vehicle
collisions occurred from 12:00 pm to 6:00 pm, while 38% occurred from 6:00 am to 12:00 pm
(Figure 14). The high rate of accidents from 12:00 pm to 6:00 pm likely results from farmers
finishing work in one field and moving to another while at the same time traffic is increasing as
people are getting off work or out of school. Similarly, farm vehicles might be on the roadways
in the morning (6:00 am to 12:00 pm) moving to fields to begin work. With a p value of 2.47E-
250, which is much smaller than α 0.05, once again the null of equality was rejected.
The THP data included weather conditions at the time of the accident. However, in both
the statewide totals and in the focus area, almost all farm vehicle collisions occurred during ‘no
adverse’ or ‘clear’ weather (Figure 15 and 16). Weather condition’s p value was 0 which results
in a rejection of the null of equality. No other weather condition comes close to the number of
accidents occurring during these conditions (Figure 15 and 16). The best reason farm vehicle
collisions occur on clear days or days with no adverse weather conditions is that this is the type
of weather most farm vehicles are being used. As previously mentioned, planting and harvest
times are peak operation times for farm vehicles. For Tennessee, planting and harvesting are
generally governed by weather. This means that on days it rains, most farm vehicles will remain
parked until clear weather returns.

23
Figure 13. Farm vehicle accident totals by time for Tennessee for the years 2003 to 2011. Chi
square p value = 2.47E-250.
Figure 14. Farm vehicle accident totals by time for the high crash frequency sites in the focus
area of northwest Tennessee for the years of 2003 to 2011.
15
442
658
281
0
100
200
300
400
500
600
700
12:00am-6:00am 6:00am-12:00pm 12:00pm-6:00pm 6:00pm-12:00am
Nu
mb
er o
f C
rash
es
Time of Day
0
6
9
1
0
1
2
3
4
5
6
7
8
9
10
12:00am-6:00am 6:00am-12:00pm 12:00pm-6:00pm 6:00pm-12:00am
Nu
mb
er o
f C
rash
es
Time of Day

24
Figure 15. Farm vehicle accident totals by weather conditions in Tennessee for the years 2003 to
2011. Chi square p value = 0.
Figure 16. Farm vehicle accident totals by weather for the high crash frequency sites in the focus
area of northwest Tennessee for the years of 2003 to 2011.
927
349
18 21 20 8 1 2 56
0
100
200
300
400
500
600
700
800
900
1000
Nu
mb
er o
f C
rash
es
Weather Condition
7
8
0 0
1
0 0 0 0 0
1
2
3
4
5
6
7
8
9
Nu
mb
er o
f C
rash
es
Weather Condition

25
The data received from the THP also included distance and direction from the closest
intersection for each accident. Investigation of those distances revealed that accidents occurred
most frequently within 0.25 miles of an intersection in both the focus area and statewide (Figure
17 and 18). The next frequent location for an accident was at an intersection. Farm vehicle
collisions could be occurring close to intersections if field entrances are located nearby. If a farm
vehicle was attempting to make a turn into a field while signaling, other drivers might
misinterpret the signal and assume the indicator is for the upcoming intersection. If the driver of
the vehicle attempted to overtake a farm vehicle as it was turning, a collision could occur. Chi
square test revealed that the null of equality would be rejected (p value = 4.39E-231<0.05).
The direction from an intersection was also studied because of its availability from the
data. Results of the chi square were a p value of 4.56E-13 resulting in rejection of the null of
equality. Direction from an intersection could play a likely role in farm vehicle collisions, but
little weight was given to direction in this thesis. Position of the sun, time of day, and direction
could play a role in impairing a driver’s ability to see during early morning and late afternoon,
but it was not investigated (Figures 19 and 20).
Crash type was recorded by the THP and accidents were categorized by: property damage
(>$400), injury, or fatalities. It was not possible to determine if any of these categories
overlapped from the data received. The null of equality for crash type was rejected with a p value
of 4.70E-191 being less than α 0.05. The majority of the collisions reported were mostly property
damage (Figure 21). However, 2% of accidents in Tennessee resulted in fatality during the study
period (Figure 21). The focus area results did not match the statewide results (Figure 22). The
focus area had more accidents resulting in injury (63%) with the majority of accidents statewide
resulted in property damages >$400.

26
Figure 17. Farm vehicle accident totals by distance from an intersection in Tennessee from 2003
to 2011. Chi square p value = 4.39E-231.
Figure 18. Farm vehicle accident totals by distance from intersection for the high crash
frequency sites in the focus area of northwest Tennessee for the years of 2003 to 2011.
421
596
145 108
17
121
0
100
200
300
400
500
600
700
At Intersection 0-0.25 0.25-0.5 0.5-0.75 0.75-1.0 1.0+
Nu
mb
er o
f C
rash
es
Distance (mi.)
4
8
2 2
0 0 0
1
2
3
4
5
6
7
8
9
At Intersection 0-0.25 0.25-0.5 0.5-0.75 0.75-1.0 1.0+
Nu
mb
er o
f C
rash
es
Distance (mi.)

27
Figure 19. Direction from an intersection a farm vehicle accident occurred from 2003 to 2011 in
Tennessee. Chi square p value = 4.56E-13.
Figure 20. Farm vehicle accident totals by direction from intersection for the high crash
frequency sites in the focus area of northwest Tennessee for the years of 2003 to 2011.
North 18%
East 17%
South 20%
West 17%
No Dir 28%
North 25%
East 13%
South 38% West
0%
No Dir 25%

28
Figure 21. Farm vehicle collision types in Tennessee from 2003 to 2011. Chi square p value =
4.70E-191.
Figure 22. Farm vehicle accident totals by collision type for the high crash frequency sites in the
focus area of northwest Tennessee for the years of 2003 to 2011.
Property Damage > $400
67%
Injury 31%
Fatal 2%
Property Damage > $400
38%
Injury 63%
Fatal 0%

29
There were many similarities among crash sites in the focus area. Previous research has
suggested that increasing shoulder widths, reducing speeds, posting more signs to inform drivers,
and increasing driver preparedness are important in reducing crashes. None of the sites evaluated
in the focus area of this research exhibited all of these characteristics. All of the high crash rate
zones had no farm vehicle signs present. Most sites had no posted speed limit combined with
narrow lanes and shoulders. Crashes at these sites could be prevented if the lanes and shoulder
widths were increased.
There are no data on near misses or unreported collisions. Luginbuhl et al. (2003)
reported from a survey that 5% of respondents were aware of an accident that went unreported.
Of those unreported accidents 91% involved a farm vehicle. The reasons for not reporting the
accidents were: little or no damage, insurance rates, no injuries, or damages were paid
(Luginbuhl et al, 2003). Without more information on near misses or unreported accidents, it is
difficult to precisely predict the factors that cause collisions between farm vehicles and other
motor vehicles. An investigation that tracks farm vehicle movements and traveling distances
would provide more of this undocumented information.
Heckman (1979) explains sample selection bias as a bias created from non-randomly
selected data. This has occurred within this thesis because it only looks at one specific type of
crash and there is no way to estimate how the total population of farm vehicle collisions occurs
from a sample. The bias comes from estimating the behavior of a relationship when the data
itself is not randomly selected resulting in a skewing of the results. This skewing can show a
weaker or stronger relationship within a population estimate when really the true relationship
behavior could be stronger or weaker between two variables, but it is impossible to discern
without more data from the "opposite side" of the data (Heckman, 1979).

30
To properly evaluate all the factors contained within this thesis, a traffic study needs to be
conducted or collision data involving all types of vehicles needs to be evaluated along with farm
vehicle collision data. A sample selection bias has been created without data involving the
number of farm vehicle and other vehicle interactions on roadways that do not involve a
collision. The data used in this thesis were not randomly selected, but were selected because a
collision occurred between a farm vehicle and another vehicle. These data do not account for
locations with “no collision” or collisions involving other types of slow moving vehicles. Due to
this, it is impossible to determine exactly what factors play a critical role in the occurrence of
only farm vehicle collisions.

31
5 Conclusion
As farm vehicles get larger and faster, the ability to operate and transport these vehicles
becomes more tedious. Roads that were once just an “old farm road” are now frequented by
more motorists traveling through rural areas or from rural home to work. More motorists
combined with farm fragmentation and larger equipment increases the likelihood for farm
vehicle collisions on public roads. It is hard to definitively say there is a direct link between
growing populations and farm vehicle collisions. Logically, the more motorists you have on a
roadway the higher the probability of a collision to occur. Inversely, a higher population could
mean that there are less farm acres translating into a lower number of farm vehicles on roadways.
The purpose of this research was to study farm vehicle collisions and to identify factors
that are contributing to accidents. Factors such as sign posting, proper lighting and signals for
equipment, and speed reductions will all decrease the likelihood of these collisions. Better
education of young drivers through driver education courses could better explain to them when
and how they may meet a farm vehicle on a roadway and give them a better understanding of
how to handle the situation.
With regard to making vehicles more visible, it is time to standardize farm equipment
lighting and possibly eliminate the unfamiliar SMV triangle. Murphy and Grisso (2009) suggest
a different SMV emblem for vehicles capable of speeds greater than 25 mph and standard
warning lights on all new tractors. Similarly, Garvey (2003) found that the SMV is not familiar
to most drivers, in part due to its misuse and discrepancy in driver education handbooks. While
echoing the emphasis on improved vehicle visibility, Luginbuhl et al. (2003) further explains that
wider roads and shoulders would allow farm vehicles to exit or operate next to the roadways,

32
reducing the number of collisions. From this research, wider shoulders could reduce the number
of collisions observed in the research area. Farm vehicle operators could be apprehensive about
using narrow shoulders with steep ditches due to the potential of rollover.
More research is needed to gather more information on what leads to these types of
crashes. This research focused on the physical characteristics of high frequency crash sites. Other
research could take into account driving habits of a given region, traffic flow models could be
constructed to help determine alternate routes during planting and harvest time, or determine the
size and type of the equipment most likely to be involved in a farm vehicle collision. The
knowledge gained from other research combined with the information gained here could be used
to better inform both vehicle drivers and farm equipment operators. Programs could then be
initiated to inform drivers about the meaning and proper utilization of SMV signs as well as how
to share the road with farm equipment. Information such as who has the right-of-way, when and
how to properly overtake farm equipment, as well as where and when to expect farm equipment
in the roadways, could be gathered and shared with the public through media. Other actions that
could come from further knowledge of this subject include doing away with outdated signs and
enacting legislation to make all farm vehicles that travel motorways abide by the same standards
for lighting as vehicles that must be registered.
All of these suggested actions would reduce the number of these collisions, but none of
them will work if they are not implemented. Action must be taken by everyone who uses a
roadway. It is up to the farm vehicle operator to make sure the machine and lights are in good
working order before entering roadways. It is up to motorists to respect farm vehicles while in
the roadway and give them an extra few feet to operate as well as wait until the operator of the
farm vehicle allows safe passage around. It is up to local and state governments to oversee road

33
maintenance and make sure all traffic warning devices are in place. Law enforcement’s role is to
make sure everyone on the roadway complies with laws already established or provide escort
through urban areas when necessary. Action from drivers and equipment operators is required to
reduce or eliminate these collisions.

34
List of References

35
Costello, T. M., M. D. Schulman, and R.C. Luginbuhl. 2003. Understanding the Health Impacts
of Farm Vehicle Public Road Crashes in North Carolina. Journal of Agriculture Safety
and Health. 9(1): 19-32.
Devault, G. 2005. Tractor Safety is NO ACCIDENT. Mother Earth News. 209: 98, 100, 102-
104.
Doty, B.C., and B. Marlenga. 2006. A Summary of State Laws Regulating Youth Operating
Farm Tractors on Highways. Journal of Agricultural Safety and Health. 12(1): 51-58.
Edwing, R.,R.A. Schieber, and C.V. Zegeer. 2003. Urban Sprawl as a Risk Factor in Motor
Vehicle Occupant and Pedestrian Fatalities. American Journal of Public Health. 93(9):
1541-5.
Garvey, P.M. 2003. Motorist Comprehension of Slow-Moving Vehicle (SMV) Emblem. Journal
of Agricultural Safety and Health. 9(2): 159-169.
Heckman, J.J. 1979. Sample Selection Bias as a Specification Error. Econometrica. 47(1):153-
161.
Legault, M.L., and E.J. Sheldon. 2004. The Farm Equipment Hazard Warning Sign: An Update.
ASAE/CSAE Meeting Paper No. 045025. Ottawa, Ontario, Canada. ASAE.
Lehtol, C.J., S.J. Marley, and S.W. Melvin. 1994. A Study of Five Years of Tractor-Related
Fatalities in Iowa. Applied Engineering in Agriculture. 10(5): 627-632.
Luginbuhl, R.C., V.C. Jones, and R.L. Langley. 2003. Farmers’ Perceptions and Concerns: The
Risk of Driving Farm Vehicles on Rural Roadways in North Carolina. Journal of
Agricultural Safety and Health. 9(4): 327-348.
Meyers, J.M. 2005. Tractor Safety: What Works Best in California?. Western Farm Press. 27(7):
10.
Murphy, D.J, and R. Grisso. 2009. Operation Agricultural Equipment of Public Roads. ASABE
Paper No. 090031. Reno, Nevada. ASABE.
Pinzke, S., and P. Lundquist. 2003. Slow-Moving Vehicles in Swedish Traffic. Journal of
Agricultural Safety and Health. 10(2): 121-126.

36
Seiler, A. 2005. Predicting Locations of Moose-Vehicle Collisions in Sweden. Journal of
Applied Ecology. 42(2): 371-382. http://www.jstor.org/stable/3505730.
U.S. Census Bureau. 2010. Population Estimates by County [data file]. Retrieved from
http://factfinder2.census.gov/faces/tableservices/jsf/pages/productview.xhtml?src=bkmk.
United States Department of Agriculture. 2007. 2007 Census of Agriculture- County Data. 2007
Census. 1:249-260.
Wickes, H.G., and G.S. Nelson. 2000. Collisions with Slow-Moving Vehicles. Professional
Safety. 45(8): 39.

37
Appendix

38
Site Photos.
Carroll County
Figure A.1. HWY 79 and HWY 124
Figure A.2. HWY 79 and Brasher Rd.

39
Gibson County
Figure A.3. HWY 54 and Mt. Orange Rd.
Figure A.4. HWY 54 and Lowery Rd.
Figure A.5. Luck Madden and White Rd.

40
Figure A.6. Luck Madden and Breece Rd.
Henry County
Figure A.7. HWY 69 and Sparks Rd

41
Figure A.8. Sparks Rd.
Obion County
Figure A.9. Ken-Tenn HWY and Flippen Dr.
Figure A.10. Ken-Tenn HWY and Albert Owens Rd.

42
Figure A.11. Ken-Tenn HWY .2 miles from Albert Owens Rd.
Figure A.12. Shawtown Rd .4 miles from Davis Rd.

43
Weakly County
Figure A.13. Ralston Rd. and Billingsby Rd.
Figure A.14. Ralston Rd. and Bushart Rd.

44
Table A.1. Summary of location of farm vehicle accidents at high frequency crash sites in
northwest Tennessee, 2003 – 2011.
Location HWY Nearest_Int Location
Est Units Direction Lat Lon
US 79 SR 124
36.128450 -88.51024
US 79 Brashear Rd 500 Feet South 36.109914 -88.531018
Luck Madden Breece Rd 0.4 Miles North 35.858383 -88.895414
Luck Madden White Brothers 0.5 Miles South 35.861099 -88.894933
SR 54 Lowery Ln 0.2 Miles South 35.945006 -88.982354
SR 54 Mt Orange Rd 0.5 Miles South 35.954811 -88.973614
Sparks SR 69 0.1 Miles East 36.392442 -88.449358
SR 69 Sparks Rd 0
36.391299 -88.4505526
Shawtown Davis Rd 0.4 Miles South 36.387517 -89.246424
Shawtown Davis Rd 0.2 Miles East 36.388772 -89.249215 Ken-Tenn HWY Albert Owens 0.2 Miles North 36.470078 -88.953196 Ken-Tenn HWY Flippen 419 Feet North 36.447603 -88.99677 Ken-Tenn HWY Albert Owens 0
36.228065 -88.956244
Ralston Bushart Rd 0.1 Miles South 36.422923 -88.790602
Ralston Snyder Rd 0.1 Miles North 36.380445 -88.789938
Billingsby Ralston Rd
36.389476 -88.789068
Table A.2. Summary of time of farm vehicle accidents at high frequency crash sites in northwest
Tennessee, 2003 – 2011.
Location HWY Ele County Time Date Month Day
US 79 426 Carroll 8:05:00 AM 9/13/2010 September Monday
US 79 453 Carroll 9:28:00 AM 4/7/2006 April Friday
Luck Madden 391 Gibson 9:30:00 AM 8/27/2007 August Monday
Luck Madden 382 Gibson 3:55:00 PM 10/5/2010 October Tuesday
SR 54 357 Gibson 2:45:00 PM 6/15/2006 June Thursday
SR 54 378 Gibson 1:25:00 PM 5/21/2009 May Thursday
Sparks 447 Henry 8:55:00 AM 6/9/2009 June Tuesday
SR 69 468 Henry 3:18:00 PM 9/13/2006 September Wednesday
Shawtown 398 Obion 1:00:00 PM 10/15/2005 October Saturday
Shawtown 382 Obion 5:25:00 PM 5/31/2005 May Tuesday
Ken-Tenn HWY 361 Obion 1:45:00 PM 3/12/2011 March Saturday
Ken-Tenn HWY 357 Obion 8:15:00 AM 6/6/2011 June Monday
Ken-Tenn HWY 358 Obion 9:15:00 AM 3/9/2009 March Monday
Ralston 343 Weakley 2:47:00 PM 10/23/2003 October Thursday
Ralston 409 Weakley 6:00:00 PM 8/10/2010 August Tuesday
Billingsby 411 Weakley 2:45:00 PM 10/17/2011 October Monday

45
Table A.3. Summary of crash type, weather condition, injury class, and road type of farm
vehicle accidents at high frequency crash sites in northwest Tennessee, 2003 – 2011.
HWY Crash Type Weather Code Injury Class Road Type
US 79 Injury Clear No Injury Asphalt
US 79 Property Damage > $400
No Adverse Conditions No Injury Asphalt
Luck Madden
Injury No Adverse Conditions No Injury Asphalt
Luck Madden
Property Damage > $400
Clear No Injury Asphalt
SR 54 Injury No Adverse Conditions Possible Injury Asphalt
SR 54 Property Damage > $400
Clear No Injury Asphalt
Sparks Property Damage > $400
Clear No Injury Chip & Seal
SR 69 Injury No Adverse Conditions No Injury Asphalt
Shawtown Injury No Adverse Conditions No Injury Asphalt
Shawtown Property Damage > $400
No Adverse Conditions No Injury Asphalt
Ken-Tenn HWY
Injury Clear Possible Injury Asphalt
Ken-Tenn HWY
Injury Clear Incapacitating Injury
Asphalt
Ken-Tenn HWY
Injury Clear No Injury Asphalt
Ralston Property Damage > $400
No Adverse Conditions No Injury Asphalt
Ralston Injury Cloudy Possible Injury Asphalt
Billingsby Injury Clear No Injury Asphalt
46
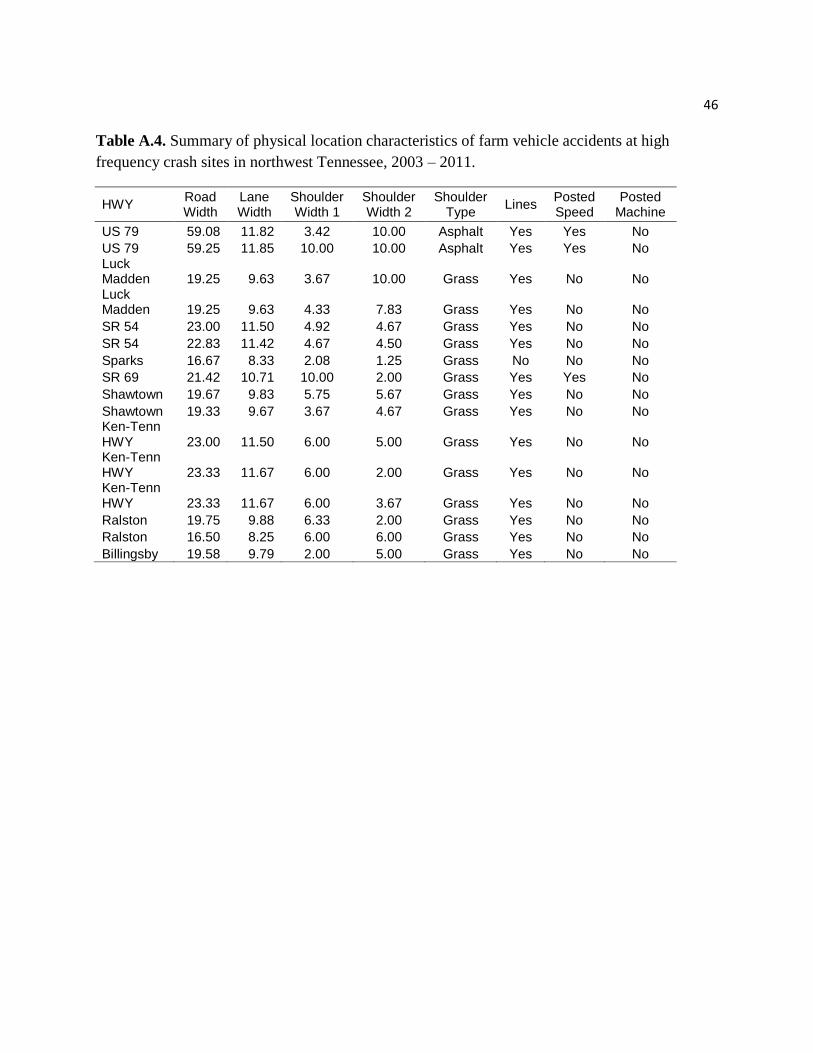
Table A.4. Summary of physical location characteristics of farm vehicle accidents at high
frequency crash sites in northwest Tennessee, 2003 – 2011.
HWY Road Width
Lane Width
Shoulder Width 1
Shoulder Width 2
Shoulder Type
Lines Posted Speed
Posted Machine
US 79 59.08 11.82 3.42 10.00 Asphalt Yes Yes No
US 79 59.25 11.85 10.00 10.00 Asphalt Yes Yes No Luck Madden 19.25 9.63 3.67 10.00 Grass Yes No No Luck Madden 19.25 9.63 4.33 7.83 Grass Yes No No
SR 54 23.00 11.50 4.92 4.67 Grass Yes No No
SR 54 22.83 11.42 4.67 4.50 Grass Yes No No
Sparks 16.67 8.33 2.08 1.25 Grass No No No
SR 69 21.42 10.71 10.00 2.00 Grass Yes Yes No
Shawtown 19.67 9.83 5.75 5.67 Grass Yes No No
Shawtown 19.33 9.67 3.67 4.67 Grass Yes No No Ken-Tenn HWY 23.00 11.50 6.00 5.00 Grass Yes No No Ken-Tenn HWY 23.33 11.67 6.00 2.00 Grass Yes No No Ken-Tenn HWY 23.33 11.67 6.00 3.67 Grass Yes No No
Ralston 19.75 9.88 6.33 2.00 Grass Yes No No
Ralston 16.50 8.25 6.00 6.00 Grass Yes No No
Billingsby 19.58 9.79 2.00 5.00 Grass Yes No No

47
Vita
The son of Susie and Glen Wilkin, Harlin Wilkin was born in Aurora, MO. Raised on a
farm, a love of working outdoors and with farm machinery was fostered within Harlin. The
family moved to Tennessee before his junior year of high school, and Harlin finished high school
at Franklin County High School in Winchester. From there, Harlin went on to pursue a
bachelor’s degree at the University of Tennessee at Martin. After following other interests,
Harlin returned to agriculture and graduated in 2011 with a degree in plant and soil science. He
continued his education at UTM with a Master of Science degree in Agriculture and Natural
Resources.