Embed Size (px)
Citation preview

To Share or Not To Share: Does Local Participation Matter for Spillovers from Foreign
Direct Investment?
Beata Smarzynska JAVORCIK and
Mariana SPATAREANU*
Abstract: This study examines whether the degree of spillovers from foreign direct investment is affected by the foreign ownership share in investment projects. The analysis, based on an unbalanced panel of Romanian firms during 1998-2000, produces evidence consistent with positive intra-sectoral spillovers resulting from fully-owned foreign affiliates but not from projects with joint domestic and foreign ownership. This finding is in line with the literature suggesting that foreign investors tend to put more resources into technology transfer to their wholly-owned projects than to those owned partially. Further, the data indicate that the presence of partially foreign-owned projects is correlated with higher productivity of domestic firms in upstream industries suggesting that domestic suppliers benefit from contacts with multinational customers. The opposite is true, however, in the case of fully-owned foreign affiliates which appear to have a negative effect on domestic firms in upstream industries. These results are consistent with the observation that foreign investors entering a host country through greenfield projects are less likely to source locally than those engaged in joint ventures or partial acquisitions. They are also in line with the evidence suggesting that fully-owned foreign subsidiaries use newer or more sophisticated technologies than jointly owned investment projects and thus may have higher requirements vis-à-vis suppliers.
Keywords: spillovers, foreign direct investment, joint venture, technology transfer
JEL classification: F23
World Bank Policy Research Working Paper 3118, August 2003 The Policy Research Working Paper Series disseminates the findings of work in progress to encourage the exchange of ideas about development issues. An objective of the series is to get the findings out quickly, even if the presentations are less than fully polished. The papers carry the names of the authors and should be cited accordingly. The findings, interpretations, and conclusions expressed in this paper are entirely those of the authors. They do not necessarily represent the view of the World Bank, its Executive Directors, or the countries they represent. Policy Research Working Papers are available online at http://econ.worldbank.org.
* Development Economics Research Group, World Bank, 1818 H St, NW, Washington DC, 20433. Email: [email protected] and [email protected]. Thanks to Ana Fernandes, Caroline Freund, Holger Görg, Hiau Looi Kee and Kamal Saggi for very useful comments on an earlier draft.

2
Introduction
Many countries, including developing and transition economies, offer generous incentive
packages to attract foreign direct investment (FDI) justifying their actions with the expected
knowledge externalities to be generated by foreign affiliates operating in their economy. While a
lot of research effort has been put into looking for the evidence of such externalities,1 little
attention has been devoted to how the degree of foreign ownership affects knowledge spillovers
from FDI. A notable exception is a study by Blomström and Sjöholm (1999) who employ cross-
section data on Indonesian firms and find that there is no statistically significant difference
between within-industry spillovers associated with minority- and majority-owned foreign
projects. They also show that FDI, regardless of the degree of ownership, has a significant
positive effect on the productivity of Indonesian firms operating in the same industry. In contrast,
Dimelis and Louri (2001), using cross-sectional data on Greek manufacturing firms, demonstrate
that while the labor productivity of domestic firms is enhanced by the presence of foreign
affiliates in the same industry, spillovers stemming from minority-owned foreign establishments
are larger than those from majority-owned ones.
This paper investigates this question in more detail by extending the analysis to: (i)
examine the difference between spillovers associated with fully- and partially-owned foreign
investments in addition to comparing the impact of majority- and minority-owned foreign
projects, and (ii) study both intra- (horizontal) as well as inter-industry (vertical) spillovers
stemming from different types of foreign establishments. Moreover, this study significantly
improves upon the econometric techniques employed in the earlier literature by controlling for
unobserved firm heterogeneity and taking into account the endogeneity of input selection with
1 Most of the existing firm level studies, including Haddad and Harrison (1993) on Morocco, Aitken and Harrison (1999) on Venezuela, Djankov and Hoekman (2000) on the Czech Republic, and Konings (2000) on Bulgaria, Poland and Romania cast doubt on the existence of horizontal (i.e., intra-industry) spillovers from FDI in developing countries. They either fail to find a significant effect or produce the evidence of the negative impact the presence of multinational corporations has on domestic firms in the same sector. The few studies finding evidence of positive within-sector spillovers focus on developed countries (e.g., Haskel, Pereira and Slaughter, 2002, on the UK). The exceptions are Konings (2001) and Kinoshita (2001) who found evidence of positive horizontal spillovers in R&D intensive sectors in Bulgaria and Poland, and the Czech Republic, respectively. The picture is more optimistic in the case of inter-industry, or vertical spillovers, taking place through contacts between domestic firms and their multinational customers operating in the same country. Blalock (2001), Schoors and van der Tol (2001) and Smarzynska (2002) provide evidence consistent with the presence of positive FDI spillovers operating through this channel.

3
respect to productivity, which allows for consistent estimates of production function.2 These
improvements are possible since, unlike the existing literature which relies on cross-sectional
information, this study employs a firm level panel dataset.
The ownership structure of FDI may affect the presence of horizontal (or intra-industry)
spillovers in two ways. First, as Blomström and Sjöholm (1999) mentions, it is generally
believed that participation of local capital in a foreign investment project reveals the
multinational’s proprietary technology and thus facilitates spillovers. This belief has led many
governments in developing countries to introduce restrictions on the degree of foreign ownership
allowed in firms operating in their country.3 Second, fear of technology leakage, especially in
countries with limited rule of law, may induce firms with most sophisticated technologies to shy
away from shared ownership and instead choose to invest only in fully-owned subsidiaries.4 As
demonstrated by Ramacharandran (1993), foreign investors tend to devote more resources to
technology transfer to their wholly-owned subsidiaries than to partially-owned affiliates. In the
same manner, Mansfield and Romero (1980) point out that the transfer of technology is more
rapid within wholly-owned networks of multinationals’ subsidiaries than to joint ventures or
licensees. Hence, partially-owned investment project may present a smaller potential for
spillovers. The overall relationship between the share of foreign ownership and spillovers is a
result of these two forces and its sign is, therefore, ambiguous.
Turning to determinants of vertical (or inter-industry) spillovers, it has been argued that
affiliates established through joint ventures or mergers and acquisitions are more likely to source
their inputs locally than those taking form of greenfield projects (UNCTC 2001). While the
latter need to put significant efforts into developing linkages with local suppliers, the former can
take advantages of the supplier relationships of the acquired firm or the local partner. Empirical
evidence to support this view has been found for Japanese investors (Belderbos et al. 2001) and
for Swedish affiliates in Eastern and Central Europe (UNCTC 2000). On the other hand,
anecdotal evidence suggests that foreign investors acquiring local firms in transition countries
2 Griliches and Mairesse (1995) have argued that inputs should be considered endogenous since they are chosen by a firm based on its productivity, which is observed by the producer but not by the econometrician. Not taking into account the endogeneity of input choices biases the estimated production function coefficients. Since the focus of this paper is on firm productivity, the consistency of the estimates is crucial for the analysis. 3 For instance, in the 1980s restrictions on foreign ownership were present in China, India, Indonesia, Malaysia, Mexico, Nigeria, Pakistan, the Republic of Korea and Sri Lanka (UNCTC, 1987). 4 See Smarzynska and Wei (2000) and Javorcik and Saggi (2002).

4
tend to dramatically reduce the number of local suppliers.5 While in our dataset we cannot
distinguish between acquisitions, joint ventures and greenfield projects, we have detailed
information on the foreign equity share. To the extent that full foreign ownership is a proxy for
greenfield projects and full acquisitions, we expect that fully-owned foreign affiliates will rely
more on imported inputs, while investment projects with local capital will source more locally.6
Therefore, we anticipate larger spillovers to be associated with partially-owned foreign projects
than with fully-owned foreign subsidiaries. This effect may be reinforced by the fact that fully-
owned foreign affiliates may use newer or more sophisticated technologies than their partially-
owned counterparts and thus may have higher requirements vis-à-vis suppliers which only a
handful of domestic firms, if any, would be able to meet.
We examine the above hypotheses using data from the Amadeus database which includes
information on 54,032 Romanian firms for the period 1998-2000. In contrast to the findings of
Blomström and Sjöholm (1999), our results suggest that the degree of foreign ownership matters
for horizontal spillovers. Moreover, it also affects the degree of vertical spillovers from FDI.
When we estimate a regression similar to the cross-sectional one employed by Blomström and
Sjöholm we confirm their result of no difference between spillovers associated with minority-
and majority-owned foreign projects. However, when we compare the effects of fully- and
partially-owned foreign investments we find a significant difference between the two. Only the
fully-owned foreign investments are found to be associated with positive productivity spillovers
within a sector. We also test for the difference in the effect of minority-owned, majority-but-not-
fully-owned and fully-owned projects. Interestingly enough, we find that positive spillovers are
associated only with fully-owned foreign projects and that there is no statistically significant
difference between spillovers stemming from the two other types of FDI.
5 One of the largest FDI projects in Romania, Renault’s purchase of an equity stake in Dacia, the local automobile maker, may serve as an example. The initial transaction took place in 1999 with subsequent increases in Renault’s share in 2001and 2002. After the acquisition, the French company promised to continue sourcing inputs from local suppliers provided they lived up to the expectations of the new owner. This, however, does not seem to have been the case. In 2002, eleven foreign suppliers of the French group were expected to start operating in Romania, thus replacing the Romanian producers from whom Dacia used to source (Ziarul Financiar (Financial Newspaper) April 19, 2001). 6 A recent survey of multinationals operating in Latvia provides support for this view as it shows that while 52 percent of firms with joint domestic and foreign ownership had at least one local supplier of intermediate inputs, the same was true of only 9 percent of fully-owned foreign subsidiaries. Moreover, partially-owned foreign buyers were reported to offer more technical, managerial and financial assistance to their suppliers than fully-owned ones (FIAS 2003). Further, the results of a study of the largest exporters in Hungary also indicate that foreign affiliates with larger share of foreign equity tend to purchase fewer inputs from Hungarian companies (Toth and Semjen 1999).
5
Next we improve upon the Blomström and Sjöholm’s methodology by controlling for
unobserved firm characteristics and confirm that only the fully-owned foreign projects result in
positive horizontal spillovers and that there are no significant effects associated with minority
and majority-but-not-fully-owned foreign projects. Again the difference between spillovers
associated with fully- and partially-owned foreign projects is statistically significant.
Furthermore, we implement the Olley and Pakes (1996) correction for endogeneity of input
selection and control for industry concentration and still find that the degree of foreign
ownership in investment projects matters for the extent of intra-industry spillovers.
Finally, we find a pattern of vertical spillovers that is consistent with our expectations.
Our results suggest that positive externalities are associated with partially-owned foreign projects
which were hypothesized to rely more heavily on local suppliers. On the other hand, fully-
owned foreign subsidiaries are shown to have a negative effect on productivity of domestic firms
in upstream sectors. This negative effect may be due to the fact that foreign investors acquiring
domestic enterprises may upgrade production facilities which results in demand for more
complex, higher quality inputs and leads to severing existing relationships with local suppliers
and greater reliance on imported inputs. The subsequent decrease in demand for intermediates
produced in Romania may prevent local producers from reaping the benefits of scale economies.7
This paper is structured as follows. In the next section, we discuss FDI inflows into
Romania. Then we present our data, estimation strategy and the empirical results. The last
section concludes.
FDI in Romania
After the collapse of the communist regime in 1989, Romania started its transformation
to a market economy. During the first years following the regime change, the government took a
cautious approach to transition. Privatization in Romania lagged behind those in other Central
East European countries and so did FDI inflows. The situation changed after 1997 when a mass-
7 This finding is consistent with the case study discussed in the previous footnote and the anecdotal evidence from the Czech Republic indicating that multinationals upgrading or changing the nature of their production may switch from local to global sourcing and thus drop their suppliers in a host country (KPMG 2002). This result is also in line with the theoretical predictions of Saggi (2002) who shows that local suppliers of intermediates will be worse off after the entry of multinationals if the technology gap between local and foreign producers of final goods is large.

6
privatization program was implemented. The privatization initiative together with the changes in
the legislative framework and the incentives given for FDI provided new opportunities for
foreign investors. FDI became permitted in virtually all economic sectors, full ownership was
allowed and there were no restrictions on profit repatriation. Foreign investors were offered
guarantees against nationalization and expropriation as well as tax incentives including
exemptions from customs duties, VAT exemptions for imports and tax holidays.
As a result, FDI inflows in Romania, slow in the early 1990s, picked up rapidly after
1996. The amount of FDI received in 1998 was more than 20 times larger than that in 1993. The
total volume of foreign direct investment during the period 1991-August 2001 totaled seven
billion dollars. The number of companies with foreign capital reached over 80 thousand by
mid-August 2001, representing about 9 percent of all companies registered in Romania. In terms
of the number of investment projects Italy ranked first, followed by Germany, China and Turkey.
Preferred areas for FDI included oil exploration, automobile and automotive component
industry, banking and finance, food processing, telecommunications and construction. Romania
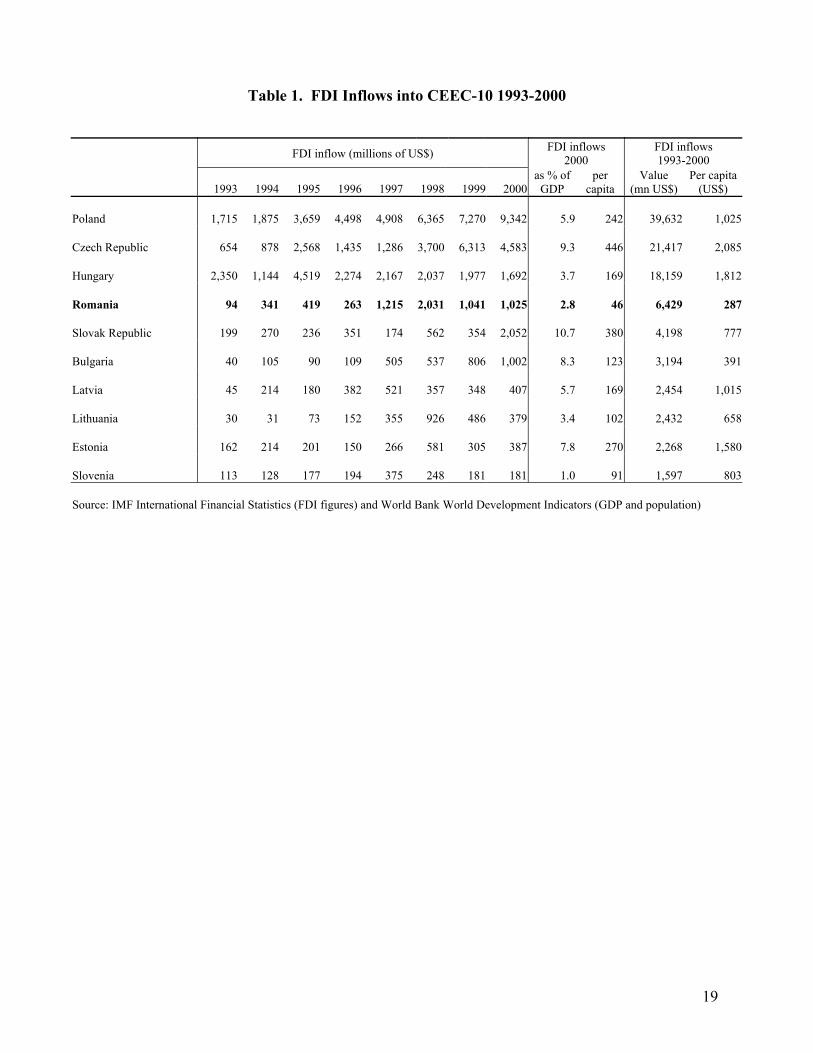
is the fourth largest FDI recipients among Central and Eastern European countries but ranks
tenth in the region in terms of FDI inflows per capita (see Table 1).
Data Description
The data used in this study come from a commercial database Amadeus compiled by
Bureau van Dijk, which contains comprehensive information on companies operating in thirty-
five European countries, including Romania. The Amadeus database covers 387, 357 firms out
of 783,969 (308,064 reported active) firms registered in Romania at the end of year 2000.8 The
difference comes from the fact that while Amadeus includes some inactive companies, it does
not cover state owned firms or co-operatives. Information on the firms included in Amadeus
comes from the Chamber of Commerce and Industry of Romania. In addition to the standard
financial statements, Amadeus includes detailed information about the ownership structure of
firms which allows us to determine the foreign equity stake in each company. Unfortunately, the
database contains only the latest available ownership information (mostly for 2000 and 1999)
8 Source: Romanian Statistical Yearbook (2001).

7
and no historical figures.9 For this reason, we limit our analysis to an unbalanced panel spanning
over the period 1998-2000. We assume that firms which were foreign-owned in the year for
which we have the ownership information were foreign-owned during the whole three-year
period.
The sample includes firms with more than five employees in 1999. After deleting
inactive firms and missing observations and removing outliers,10 we are left with 54,032 firms
(or 131,396 firm-year observations, between 42,246 and 52,240 observations per year). For
6,262 firms the foreign capital share exceeds ten percent of the total.
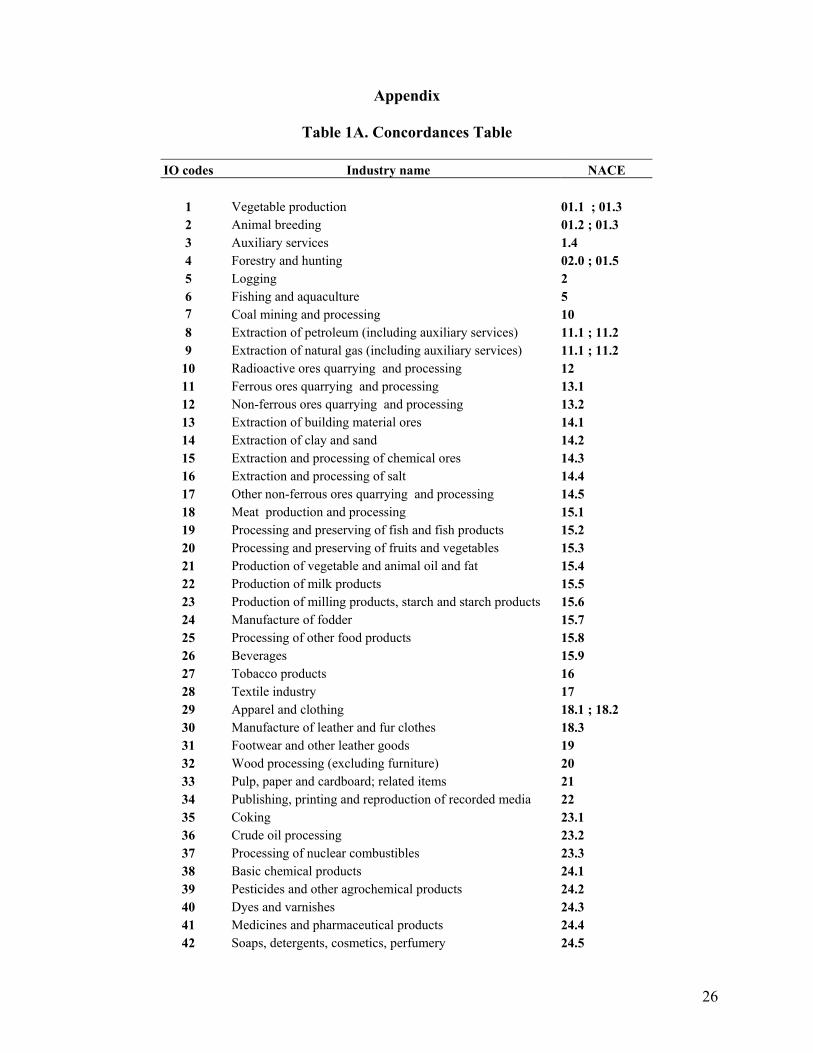
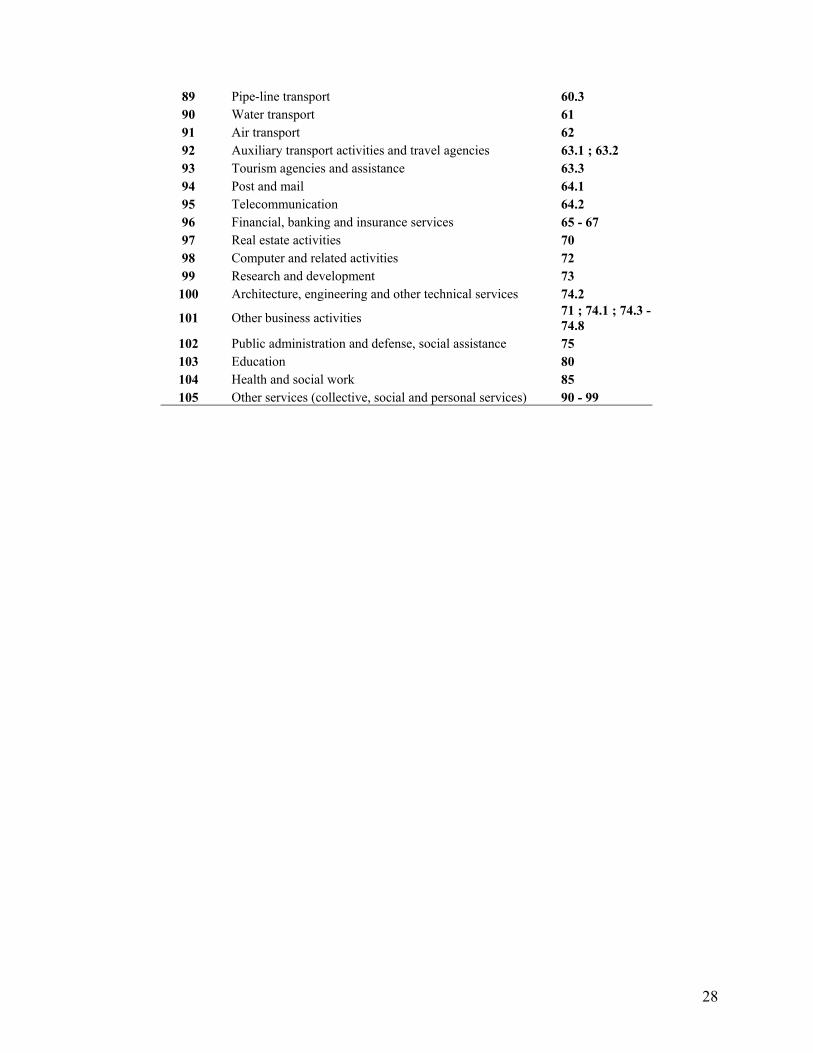
We also employ the input-output matrix provided by the Statistical Institute of Romania
for the first year covered by the sample 1998.11 The input-output matrix contains 105 sectors
and each firm in our dataset is matched with the IO sector classification based on its primary
three-digit NACE code. The concordances between the IO industry codes and three digits
NACE codes are provided in Appendix Table A1. All sectors of the economy are represented in
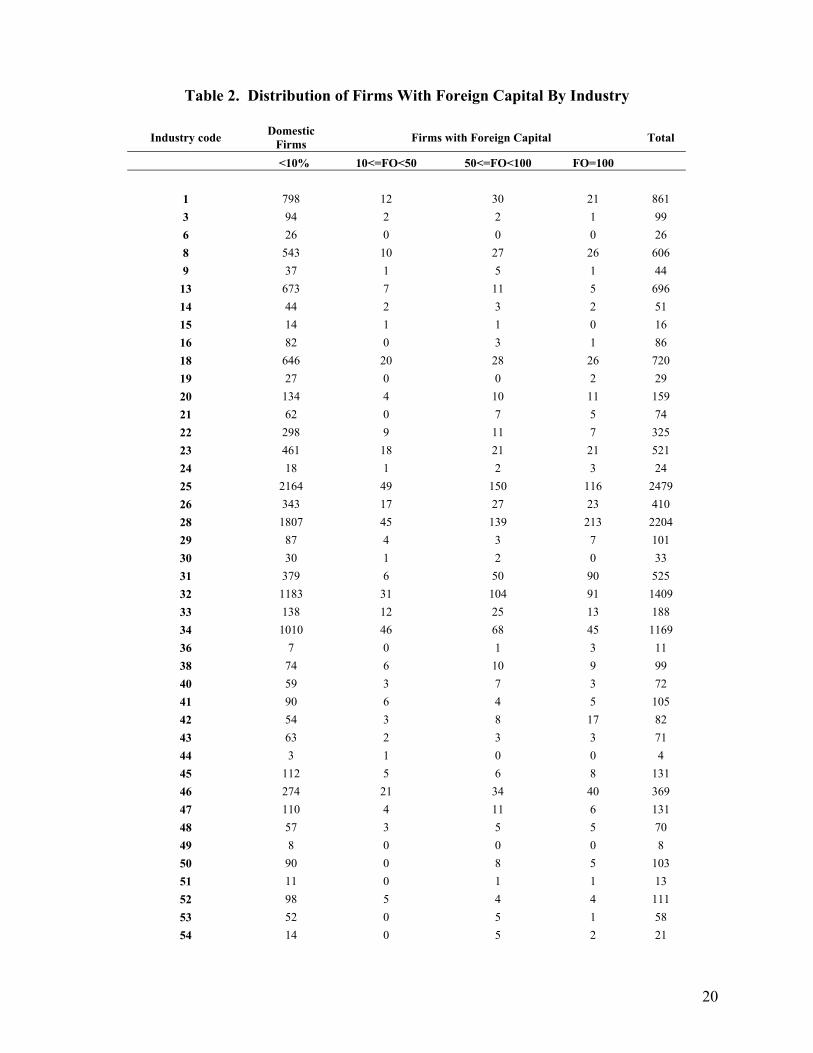
our sample. A detailed sectoral distribution of firms is presented in Table 2. As summary
statistics presented in Table 3 indicate, a large degree of heterogeneity is found in the case of
outputs, inputs and ownership type.
Empirical Strategy
Model
To examine the effect of foreign presence on productivity of domestic firms, we estimate
a log-linear transformation of a Cobb-Douglas production function:
ln Yit = α + β1lnKit + β2lnLit + β3lnMit + β4Horizontal_Type1jt + β5Horizontal_Type2jt +
+β7Vertical_Type1jt + β8Vertical_Type2jt + αt + αj + εijt (1)
9 Despite this shortcoming many researchers studying European economies have employed the Amadeus data. See, for instance, Budd, Konings and Slaughter (2002), Castellani and Zanfei (2001), Konings and Murphy (2001), Konings, Rizov and Vandenbussche (2003), Schoors and van der Tol (2001). 10 Firms in the top and bottom one percentile of all the firm-specific output and input variables were deleted from the sample. 11 Ideally we would like to use multiple input-output matrices since relationships between sectors may change over the years or with FDI inflows, albeit radical changes are unlikely. Unfortunately, input-output matrices for later years are not available.

8
where subscripts i, j and t refer to firm, industry and time, respectively. Yit stands for firm output.
Kit, Lit and Mit represent production inputs: capital, labor, and materials. αt and αj capture time
and industry effects, respectively. We define output as firm’s turnover deflated by industry
specific producer price indices at the two-digit NACE classification. We measure labor by the
number of employees. Capital is proxied by the value of tangible fixed assets deflated using the
GDP deflator. Material inputs are deflated by a weighted average of the producer price indices
of the supplying sectors. The weights are given by the input-output matrix and represent the
proportion of inputs sourced from a given sector.
In addition to the standard production function variables, we include measures of foreign
presence in the same sector (Horizontal) as well as in downstream sectors (Vertical), which are
defined as follows. Horizontaljt is the share of an industry j’s output produced by firms with at
least ten percent foreign equity, calculated for each of the 105 industries. Even though the
number of foreign firms does not change during the sample period, output fluctuates and thus it
is a sector-specific time-varying variable. Since we are interested in exploring spillovers
stemming from different types of FDI projects, we calculate separately measures of foreign
presence pertaining to minority- and majority-owned foreign investments as well as to partially-
and fully-owned foreign projects.
The variable Verticaljt is a proxy for the foreign presence in downstream sectors (i.e.,
sectors supplied by the industry to which the firm in question belongs) and thus is intended to
capture the effect multinational customers have on domestic suppliers. It is defined in the
following way:
Verticaljt = Σk αjk Horizontalkt
where αjk is the proportion of sector j’s output used by sector k taken from the 1998 input-output
matrix including 105 sectors.12 We calculate two separate measures of Vertical: one for partially-
and one for fully-owned foreign projects by using the appropriate definition of Horizontal
variables defined above.13 For summary statistics on these and other variables see Table 3.
12 In calculating αjk sector j’s output sold for final consumption was excluded. 13 Note that we do not calculate separate measures of Vertical for minority and majority foreign projects, as there is no theoretical argument suggesting that they should be different.

9
Estimation issues
Blomström and Sjöholm (1999) estimate a version of the above equation on the sample of
domestic firms using ordinary least squares correcting the standard errors for heteroskedasticity.
We will employ their estimation strategy and restrict our attention to domestic establishments.
Considering only domestic firms has two advantages. It allows us to focus on the impact of FDI
on domestic firms and avoid a potential bias stemming from the fact that foreign investors tend
to acquire stakes in large and most successful domestic companies (see Djankov and Hoekman,
2000). The regressions will include time and industry fixed effects. The results from this
specification are presented mainly for comparison purposes as they suffer from two econometric
shortcomings.
The first shortcoming of the above empirical strategy is that it does not take into account
unobserved firm characteristics, such a managerial talent, availability of better infrastructure or
access to financing, etc., which may affect firm productivity. To address this issue we will
reestimate our model as a panel with firm fixed effects. It will allow us to control for time
invariant determinants of productivity across firms that are also potentially correlated with FDI
variables.
The second shortcoming is the fact that the firm’s private knowledge of its productivity
(unobserved by the econometrician) may affect the input decisions, leading to biased estimates of
the coefficients on factor shares. Since our study relies on correctly measuring firm productivity,
obtaining consistent estimates of the production function coefficients is crucial to our analysis.
Some studies attempt to correct for the simultaneity bias by assuming that the unobserved firm
heterogeneity can be captured by a time-invariant fixed effect or by using instrumental variables.
However, both approaches rely on the simplifying assumptions of time-invariance of the firm-
specific effect in the former case and no serial correlation of the productivity shocks in the latter
and are, therefore, not entirely satisfactory.
For this reason, we employ the semi-parametric approach to estimating production
function parameters suggested by Olley and Pakes (1996) and modified by Levinsohn and Petrin
(2000). This method allows for firm-specific productivity differences that exhibit idiosyncratic
changes over time and thus addresses the simultaneity bias. To illustrate the insights of the
method, we start with the following production function:
10
vait = yit - mit = α + βl *lit +βk *kit +ωit + ηit (2)
where va stands for value added (i.e., output minus material inputs), l labor, k capital, and i and t
are subscripts denoting firm and time, respectively. Capital is treated as a state variable while
labor and materials are assumed to be freely variable inputs. ηit represents the error term
capturing unpredictable shocks, while ωit is a productivity shock which is unobserved by the
econometrician but known to the firm. Firms adjust their variable inputs based on their
anticipation or knowledge of the productivity component (ωit). Since there exists a correlation
between the error term (ωit + ηit) and the explanatory variables, a simple OLS procedure leads to
inconsistent parameter estimates.
As Levinsohn and Petrin (2000) showed, the unobserved productivity can be identified
from the firms’ observable variable input choices. The chosen variable input is material inputs.14
The demand for materials can be modeled as a monotonic function of the capital stock and the
unobserved (to the econometrician) productivity shock.
mit = f(kit, ωit)
The first advantage of using intermediate inputs is that they generally respond to the entire
productivity term, while investment may respond only to the ‘news’ in the unobserved term.
Further, intermediate inputs provide a simpler link between the estimation strategy and the
economic theory, primarily because they are not typically state variables.
Assuming the function f(.) is invertible, the unobservable productivity shock can be
expressed as a function of observable variables
ωit = h(mit ,kit) (3)
Note that we assume that materials are a variable input whose choice is affected by ωIt while
capital is determined by past values of productivity only.
14 While Olley and Pakes (1996) use investment to model the unobserved productivity shock, we follow Levinsohn and Petrin (2000) approach and use materials as the instrument to correct for simultaneity bias (as was done by Hallward-Driemeier et al., 2001). We do so because of the lack of reliable information on investment expenditures.

11
Substituting (3) into (2), we get the equation to be estimated in the first stage of the
procedure:
vait = α + βl *lit +βk *kit + h(mit ,kit) + ηit (4)
Note that the functional form of h(.) is not known. Therefore, βk cannot be obtained at this stage.
We estimate equation (4) using a third order polynomial expansion in capital and materials to
approximate the unknown form of h(.). From this stage we obtain the consistent estimate of the
labor input coefficient as well as the estimate of the third order polynomial in mit and kit , to
which we refer as ψit
ψit= βk *kit + h(mit ,kit) (5)
Thus, h(mit ,kit)= ψit - βk *kit (6)
We proceed with the second stage where we estimate the effect of capital and materials on
output. Let’s consider the expectation of vat+1 - βl *lt+1 conditional on the information at time t.
Assuming that ωit follows a first order Markov process, one can rewrite ωit+1 as a function of ωit,
letting ξit+1 be the innovation in ωit+1. And ωit can be replaced with a function of h(mit,kit).
Therefore the equation to be estimated in the second stage becomes:
vait+1 - βl *lit+1 =c + βk *kit+1 + g( hit(.)) + ξit+1 + ηit+1 (7)
Since the functional for of g(.) is not known, we use once more the third order polynomial
expansion (with all interactions). Since the capital in use in a given period is assumed to be
known at the beginning of the period and ξit+1 is mean independent of all variables known at the
beginning of the period, ξit+1 is mean independent of kit+1. The consistent coefficient βk can thus
be obtained by running non linear least squares on equation (7).
In summary, following Olley and Pakes(1996) and Levinsohn and Petrin (2000) we use a
semi-parametric estimator to generate time-varying firm-specific measures of plant productivity
that are consistent even in the presence of input shares being influenced by the private
12
knowledge of firm’s productivity. The above procedure is performed for each sector separately
and the obtained measures of productivity are used in the estimation of equation (1).15
Results
We begin our analysis by examining the difference between horizontal spillovers
associated with minority- and majority-owned foreign establishments. Due to data constraints,
we cannot include all the variables employed by Blomström and Sjöholm (1999) but we employ
the same empirical strategy (OLS with White’s correction of standard errors). The results,
presented in the first column of Table 4, point to the presence of positive intra-industry
spillovers, which are, however, significant only in the case majority-owned foreign projects. We
confirm Blomström and Sjöholm’s findings that there is no statistically significant difference in
the magnitude of the coefficients associated with the two types of FDI.
Since, as discussed earlier, there are reasons to expect a difference in spillovers stemming
from partially- and wholly-owned foreign projects, we also estimate a model including a separate
measure of horizontal spillovers associated with these two types of investment. We find that
only fully-owned foreign establishments result in positive and significant horizontal spillovers,
and unlike in the previous case, this time the difference between the coefficients is statistically
significant. This is consistent with the view that multinationals transfer newer technologies and
invest more resources in knowledge transfer to their fully-owned affiliates and thus such
affiliates represent a greater potential for spillovers.16
Next we test whether the previously found positive effects associated with the majority-
owned foreign investments are driven by fully-owned foreign subsidiaries. Thus we include
three measures of Horizontal: minority (pertaining to firms with 10-50 percent of foreign share),
majority-but-not-fully-owned (above 50 but less than 100 percent foreign ownership) and fully-
owned (100 percent foreign ownership). Interestingly, we find that in a regression that includes
all three measures the only positive and significant effect is associated with fully-owned foreign
15 Since the procedure described above calls for using lagged variables, we employ a longer panel 1996-2000 to obtain productivity estimates but in the subsequent analysis of spillovers the timeframe is restricted to years 1998-2000. 16 Additional regressions (not reported here) performed on a combined sample of both domestic and foreign indicate that fully-owned foreign subsidiaries have higher productivity levels than partially-owned foreign projects and domestic firms.

13
subsidiaries. The test of equality of coefficients reveals no significant difference between the
minority and majority-but-not-fully-owned effects but a statistically significant difference
between the impact of fully-owned projects and the other two types of FDI.
Finally we focus on vertical spillovers from FDI by adding to our model two measures of
foreign presence in downstream sectors.17 While their inclusion has no effect on the coefficients
of the Horizontal variables, we find that proxies for vertical spillovers exhibit a very different
sign pattern. Namely, partially-owned foreign projects appear to be associated with positive
vertical spillovers while full foreign ownership results in negative externalities to domestic firms
in upstream industries. The two coefficients as well as the difference between them are
statistically significant at the one percent level. Their sign pattern is consistent with the
hypothesis that foreign investors entering a host country through greenfield projects or full
acquisitions are less likely to source their inputs locally than those who invested through joint
ventures or partial acquisitions.18 This may be due to the fact that the former group faces higher
costs of finding local suppliers and that foreign owners tend to reduce the number of existing
suppliers in the acquired firms as they integrate the subsidiary in the supplier network of the
parent company.19
A serious drawback of the empirical strategy employed so far is its inability to account
for unobserved firm characteristics that may influence firm productivity, such as managerial
talent, quality of available infrastructure, etc. To take them into account we exploit the panel
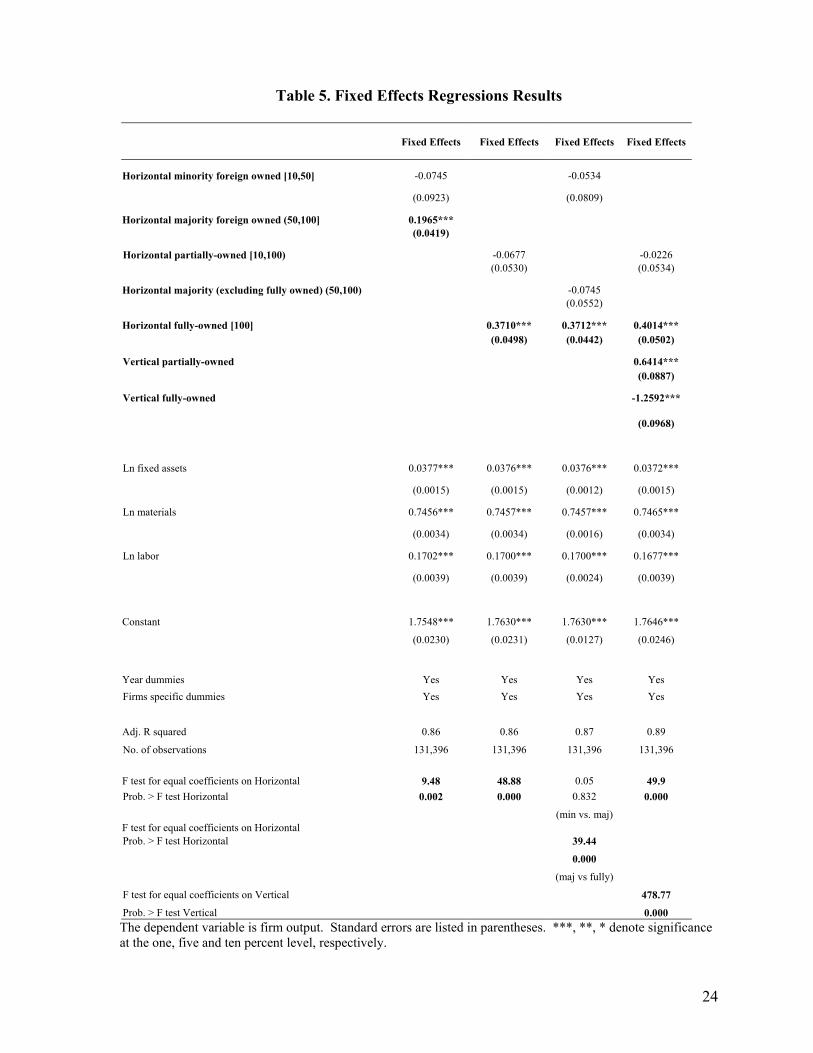
nature of our dataset and estimate a model with firm specific fixed affects. The findings are
presented in Table 5. The results pertaining to the impact of minority versus majority, as well as
partial and full foreign ownership on productivity of domestic firms remain qualitatively
unchanged thus lending support to our hypotheses.
However, in the fixed effects specification we do find a statistically significant difference
between horizontal spillovers associated with minority and majority foreign establishments.
17 Note that we include in the regression only the partially- and fully-owned measures of horizontal spillovers since we found no statistically significant difference between the spillover effects of minority and majority-but-not-fully-owned projects. 18 Greenfield investments accounted for about 50-60 percent of FDI inflows into Romania before 2002 (Voinea 2003), which is the period covered by our sample. 19 This point was, for instance, mentioned in “FDI-related policies in Hungary 1990-2001”, Investment for Development Project, Consumer Unit and Trust Society. Internet address: http://cuts.org/ifd-lm-cr-hun.doc

14
While the effects associated with minority ownership are insignificant, the spillovers stemming
from majority owned are positive and statistically significant. These findings suggest that firm
heterogeneity is important and accounting for it leads to more accurate estimates of spillovers
effects associated with different degrees of foreign ownership. Nevertheless, when the majority
variable is split into majority-but-not-fully-owned and fully-owned, the difference between the
minority and majority- but-not -fully-owned becomes insignificant confirming the previous
findings.
The final robustness checks are presented in Table 6. We applied the Olley and Pakes
(1996) method to estimate firm-specific total factor productivity and then used it as the
dependent variable in an OLS estimation with industry fixed effects as well as in a first
difference regression.20 Moreover, we added the Herfindahl index to the model to control for
industry concentration.21 This additional control may be important, since as Aitken and Harrison
(1999) pointed out, the estimates of spillover effect may capture the net impact of knowledge
externalities and the competition effect. The latter effect is present when foreign entry leads to
increased competitive pressures which result in a decline of local firms’ market shares,
increasing their average costs and thus lowering productivity.
The results are broadly consistent with our previous findings. First, we show that the
share of foreign ownership matters for both horizontal and vertical spillovers. In all regressions,
the difference between spillovers associated with fully- and partially-owned foreign projects is
statistically significant. This is true for both inter- and intra-industry effects. Second, as before
the empirical evidence is consistent with positive spillovers from fully-owned foreign
investments taking place within sectors. The estimated coefficients are significant at the one
percent level in all four regressions. There is, however, some change with respect to horizontal
spillovers associated with partially foreign-owned projects. While in the earlier regressions and
in the OLS regression with the Olley-Pakes correction the coefficients are not statistically
significant, the first difference results suggest that such projects have a negative and significant
20 Since the Olley-Pakes correction was applied to each industry separately, we had to discard industries with insufficient number of observations to carry out the procedure. Hence, Table 6 contains regressions based on a smaller number of observations that the previous tables. 21 The index is defined as the sum of the squared market shares of the four largest producers in a given sector and its value ranges from 0 to 10000. As pointed out by Nickell (1996), predictions of the theoretical literature on the impact of competition on productivity are ambiguous. In the empirical analysis, however, he finds evidence of competition being positively correlated with a higher rate of productivity growth.

15
impact on the performance of domestic firms in their sector. This would suggest that in the case
of partially foreign-owned projects, the competition effect (which may not be entirely captured
by the Herfindahl index) may outweigh knowledge externalities. However, since this effect is
not robust to other specifications, we stop short of drawing strong conclusions about it. Third, as
in the earlier regressions, the data suggests that there exist significant negative effects associated
with the presence of fully foreign-owned projects in downstream sectors. The evidence of a
positive correlation between the presence of partially foreign-owned projects in downstream
sectors and the productivity of domestic firms in upstream industries is, however, present only in
the first difference regression. In sum, the additional robustness checks lend support to our
hypothesis that the degree of spillovers vary with the degree of foreign ownership.
Conclusions
Governments of developing countries often favor joint ventures over fully-owned FDI
projects believing that active participation of local firms in foreign investment projects
facilitates the absorption of new technologies and know-how. In this paper, we leave aside the
issue of whether this perception is true, and instead test if there is a difference in the magnitude
of horizontal and vertical spillovers associated with different degrees of foreign ownership.
We find evidence consistent with positive horizontal spillovers resulting from fully-owned
foreign establishments but not from partially-owned foreign projects. This finding is in line
with the literature suggesting that foreign investors tend to put more resources into technology
transfer to their wholly-owned projects than into joint ventures.
A different pattern emerges in the case of vertical spillovers. The data indicate that the
presence of partially-owned foreign projects is correlated with higher productivity of domestic
firms in upstream industries suggesting that domestic suppliers of intermediates may benefit
from contacts with multinational customers. The opposite is true, however, in the case of
fully-owned foreign establishments which appear to have a negative effect on domestic firms
in upstream sectors. The latter finding is consistent with the observation that foreign investors
entering a host country through greenfield projects are less likely to rely on local sourcing due
to costs associated with finding domestic suppliers. This result is also supported by the
anecdotal evidence suggesting that after a full acquisitions of a domestic enterprise,

16
multinationals tend to reduce the number of suppliers often severing existing links with
domestic firms in upstream sectors and thus lowering demand for domestically produced
intermediates.
While this study sheds some light on the factors driving FDI spillovers, certainly more
work is needed to improve our understanding of this phenomenon.

17
Bibliography
Aitken, Brian J. and Ann E. Harrison. 1999. “Do Domestic Firms Benefit from Direct Foreign Investment? Evidence from Venezuela,” American Economic Review. 89(3): 605-618
Belderbos, Rene, Giovanni Capannelli and Kyoji Fukao. 2001. “Backward vertical linkages of foreign manufacturing affiliates: Evidence from Japanese multinationals,” World Development, 29(1): 189-208.
Blomström, Magnus and Fredrik Sjöholm. 1999. “Technology transfer and spillovers: Does local participation with multinationals matter?” European Economic Review. 43:915-923.
Budd, John, Josef Konings and Matthew J. Slaughter. 2002. “International Rent Sharing in Multinational Firms,” NBER Working Paper No. 8809.
Castellani, Davide and Antonello Zanfei, 2001. "Productivity Gaps, Inward Investments and Productivity of European Firms” 0107001, Economics Working Paper Archive at WUSTL.
Dimelis, Sophia and Helen Louri, 2001. “ Foreign Direct Investment and Efficiency Benefits: A Conditional Quantile Analysis”, CEPR Working Papers, No. 2868
Djankov, Simeon and Bernard Hoekman. 2000. “Foreign Investment and Productivity Growth in Czech Enterprises,” World Bank Economic Review, 14(1): 49-64.
Factbook 2001. The CIA World Factbook. http://www.factbook.net/Sitemap.htm
FIAS, 2003. “Developing Knowledge Intensive Sectors, Technology Transfers, and the Role of FDI." Mimeo, Foreign Investment Advisory Services, the World Bank, Washington, D.C.
Griliches, Z. and J. Mairesse. 1995. “Production Functions: the Search for Identification,” NBER Working Paper 5067.
Haddad, Mona and Ann Harrison. 1993. “Are There Positive Spillovers from Direct Foreign Investment” Evidence from Panel Data for Morocco.” Journal of Development Economics. 42(1): 51-74.
Hallward-Driemeier, Mary, Giuseppe Iarossi and Kenneth L. Sokoloff. 2002. “Exports and Manufacturing Productivity in East Asia: A Comparative Analysis with Firm-Level Data,” NBER Working Paper No 8894.
Haskel, Jonathan E., Sonia C. Pereira and Matthew J. Slaughter. 2002. “Does Inward Foreign Direct Investment Boost the Productivity of Domestic Firms?” NBER Working Paper 8724.
Javorcik Beata Smarzynska and Kamal Saggi. 2002. “Technological Asymmetry and the Mode of Foreign Investment,” Mimeo, the World Bank, Washington, D.C.
Kinoshita, Y. 2000. “R&D and Technology Spillovers via FDI: Innovation and Absorbtive Capacity”, CEPR Discussion Paper 2775
Konings, Jozef and A. Murphy. 2001. “Do Multinational Enterprises Substitute Parent Jobs for Foreign Ones? Evidence from European Firm-Level Panel Data”, CEPR Discussion Paper 2972

18
Konings, Jozef, , Marian Rizov and Hylke Vandenbussche, 2003. “Investment and Financial Constraints in Transition Economies: Micro Evidence from Poland, the Czech Republic, Bulgaria and Romania”, Economics Letters, Volume 78, Issue 2, February 2003, Pages 253-258
KPMG. 2002. “Impact Assessment of Supplier Development Programme.” Mimeo, CzechInvest, Prague, Czech Republic.
Mansfield, Edwin, and Anthony Romero. 1980. Technology Transfer to Overseas Subsidiaries by US-Based Firms,” Quarterly Journal of Economics 95(4), pp.737-750
Nickell, Stephen. 1996. “Competition and Corporate Performance,” Journal of Political Economy. 104(4):724-46.
Ramachandaram, Vijaya. 1993. “Technology transfer, Firm Ownership, and Investment
in Human Capital,” Review of Economics and Statistics 75(4), pp. 664-670
Robinson, P. 1988. “Root-N consistent Semi-parametric Regression”, Econometrica 55, pp. 931-954
Saggi, Kamal. 2002. “Backward Linkages under Foreign Direct Investment,” mimeo, Southern Methodist University.
Schoors, Koen and Bartoldus van der Tol. 2001. “The productivity effect of foreign
ownership on domestic firms in Hungary,” mimeo, University of Gent.
Smarzynska, Beata. 2002. “Does Foreign Direct Investment Increase the Productivity of Domestic Firms? In Search of Spillovers through Backward Linkages” World Bank Policy Research Working Paper No. 2923.
Smarzynska, Beata and Shang-Jin Wei. 2000. “Corruption and Composition of Foreign Direct Investment: Firm Level Evidence from Transition Economies” NBER Working Paper No. 7969.
Toth, Ilda. 2000. “Acquisitions in Hungary: Marriages not for love,” HGV, Budapest, 22, 44 (4 November), pp. 78-85.
UNCTC. 1987. Arrangements between Joint Venture Partners in Developing Countries. Advisory Study No. 2. New York: UN.
UNCTC. 2000. World Investment Report. Cross-Border Mergers and Acquisitions and Development.
UNCTC. 2001. World Investment Report. Promoting Linkages.
Voinea, Liviu. 2003. “FDI in Romania Matures,” UNDP Project Early Warning System ROM/99/006.
19
Table 1. FDI Inflows into CEEC-10 1993-2000
FDI inflow (millions of US$) FDI inflows 2000
FDI inflows 1993-2000
1993 1994 1995 1996 1997 1998 1999 2000as % of
GDP per
capita Value
(mn US$)Per capita
(US$) Poland 1,715 1,875 3,659 4,498 4,908 6,365 7,270 9,342 5.9 242 39,632 1,025 Czech Republic 654 878 2,568 1,435 1,286 3,700 6,313 4,583 9.3 446 21,417 2,085 Hungary 2,350 1,144 4,519 2,274 2,167 2,037 1,977 1,692 3.7 169 18,159 1,812 Romania 94 341 419 263 1,215 2,031 1,041 1,025 2.8 46 6,429 287 Slovak Republic 199 270 236 351 174 562 354 2,052 10.7 380 4,198 777 Bulgaria 40 105 90 109 505 537 806 1,002 8.3 123 3,194 391 Latvia 45 214 180 382 521 357 348 407 5.7 169 2,454 1,015 Lithuania 30 31 73 152 355 926 486 379 3.4 102 2,432 658 Estonia 162 214 201 150 266 581 305 387 7.8 270 2,268 1,580 Slovenia 113 128 177 194 375 248 181 181 1.0 91 1,597 803 Source: IMF International Financial Statistics (FDI figures) and World Bank World Development Indicators (GDP and population)
20
Table 2. Distribution of Firms With Foreign Capital By Industry
Industry code Domestic Firms Firms with Foreign Capital Total
<10% 10<=FO<50 50<=FO<100 FO=100 1 798 12 30 21 861 3 94 2 2 1 99 6 26 0 0 0 26 8 543 10 27 26 606 9 37 1 5 1 44
13 673 7 11 5 696 14 44 2 3 2 51 15 14 1 1 0 16 16 82 0 3 1 86 18 646 20 28 26 720 19 27 0 0 2 29 20 134 4 10 11 159 21 62 0 7 5 74 22 298 9 11 7 325 23 461 18 21 21 521 24 18 1 2 3 24 25 2164 49 150 116 2479 26 343 17 27 23 410 28 1807 45 139 213 2204 29 87 4 3 7 101 30 30 1 2 0 33 31 379 6 50 90 525 32 1183 31 104 91 1409 33 138 12 25 13 188 34 1010 46 68 45 1169 36 7 0 1 3 11 38 74 6 10 9 99 40 59 3 7 3 72 41 90 6 4 5 105 42 54 3 8 17 82 43 63 2 3 3 71 44 3 1 0 0 4 45 112 5 6 8 131 46 274 21 34 40 369 47 110 4 11 6 131 48 57 3 5 5 70 49 8 0 0 0 8 50 90 0 8 5 103 51 11 0 1 1 13 52 98 5 4 4 111 53 52 0 5 1 58 54 14 0 5 2 21

21
55 13 0 2 5 20 56 9 0 2 1 12 57 9 1 1 1 12 58 20 1 7 3 31 59 65 1 3 5 74 60 1014 24 49 53 1140 61 41 2 7 3 53 62 78 5 9 5 97 63 21 0 6 1 28 64 41 1 6 6 54 65 67 1 12 7 87 67 37 4 4 5 50 68 98 8 13 15 134 69 141 6 15 18 180 70 54 11 6 10 81 71 109 6 11 11 137 72 89 5 8 4 106 73 69 1 4 2 76 74 17 0 1 0 18 77 551 18 49 40 658 78 191 3 19 21 234 79 18 0 2 0 20 80 4 0 3 1 8 81 43 1 1 1 46 82 71 0 0 0 71 83 4193 60 86 54 4393 84 19900 385 904 887 22076 85 321 8 20 13 362 86 2065 26 73 46 2210 87 8 1 2 2 13 88 1528 40 111 117 1796 90 30 1 4 2 37 91 9 1 0 1 11 92 113 7 8 13 141 93 275 9 24 28 336 95 234 11 16 17 278 97 214 7 19 11 251 98 376 20 49 54 499 99 78 2 2 4 86 100 541 18 30 16 605 101 1150 38 91 100 1379 102 13 0 1 0 14 103 142 3 1 4 150 104 208 3 21 10 242 105 1228 26 100 58 1412
Total 47770 1122 2643 2497 54032 FO stands for share of foreign capital in total firm’s equity. Industry codes correspond to sector codes used in the input-output matrix. See Table 1A – Appendix for a concordance with NACE classification.

22
Table 3. Summary Statistics
Variable Nr. Obs Mean Std. Dev. Min Max Sales (th. Lei 1995) 131,396 7,113.6 11,498.8 17.8 208,280.0 Fixed assets (th. Lei 1995) 131,396 1,399.9 3,757.3 0.004 56,666.2 Materials (th. Lei 1995) 131,396 5,265.0 9,042.1 8.4 102,814.1 Number of Employees 131,396 20.4 37.1 2.0 410.0 Horizontal minority 131,396 0.033 0.02 0 0.29 Horizontal majority 131,396 0.146 0.07 0 0.88 Horizontal partially-owned 131,396 0.107 0.04 0 0.81 Horizontal majority- but not fully-owned 131,396 0.740 0.03 0 0.80 Horizontal fully-owned 131,396 0.072 0.05 0 0.67 Vertical partially-owned 131,396 0.062 0.04 0 0.70 Vertical fully-owned 131,396 0.040 0.02 0 0.21 Concentration measure 131,396 28.035 154.506 0.009 5643.91

23
Table 4. OLS Regressions Results
OLS OLS OLS OLS
Horizontal minority foreign owned [10,50] -0.0312 -0.0146
(0.1876) (0.1882)
Horizontal majority foreign owned (50,100] 0.2924*** (0.0869)
Horizontal partially-owned [10,100) 0.0341 0.0719 (0.1002) (0.1008)
Horizontal majority (excluding fully owned) (50,100) 0.0577 (0.1268)
Horizontal fully-owned [100] 0.4442*** 0.4436*** 0.4666*** (0.1083) (0.1082) (0.1092)
Vertical partially-owned 0.5272*** (0.1360)
Vertical fully-owned -1.2670*** (0.1796) Ln fixed assets 0.0633*** 0.0633*** 0.0633*** 0.0633*** (0.0011) (0.0011) (0.0011) (0.0011) Ln materials 0.7102*** 0.7102*** 0.7102*** 0.7104*** (0.0017) (0.0017) (0.0017) (0.0017) Ln labor 0.2436*** 0.2436*** 0.2436*** 0.2433*** (0.0024) (0.0024) (0.0024) (0.0024)
Constant 1.4789*** 1.4873*** 1.4871*** 1.5173***
(0.0158) (0.0160) (0.016) (0.0223)
Year dummies Yes Yes Yes Yes
Industry dummies Yes Yes Yes Yes
Adj. R squared 0.89 0.89 0.89 0.89
No. of observations 131,396 131,396 131,396 131,396
F test for equal coefficients on Horizontal 2.39 0.71 0.09 8.07
Prob. > F test Horizontal 0.123 0.003 0.76 0.0045
(min vs. maj)
F test for equal coefficients on Horizontal 6.05
Prob. > F test Horizontal 0.014
(maj vs fully)
F test for equal coefficients on Vertical
79.7
Prob. > F test Vertical 0.000 The dependent variable is firm output. Standard errors are listed in parentheses. ***, **, * denote significance at the one, five and ten percent level, respectively.
24
Table 5. Fixed Effects Regressions Results
Fixed Effects Fixed Effects Fixed Effects Fixed Effects
Horizontal minority foreign owned [10,50] -0.0745 -0.0534
(0.0923) (0.0809)
Horizontal majority foreign owned (50,100] 0.1965*** (0.0419)
Horizontal partially-owned [10,100) -0.0677 -0.0226 (0.0530) (0.0534)
Horizontal majority (excluding fully owned) (50,100) -0.0745 (0.0552)
Horizontal fully-owned [100] 0.3710*** 0.3712*** 0.4014*** (0.0498) (0.0442) (0.0502)
Vertical partially-owned 0.6414*** (0.0887)
Vertical fully-owned -1.2592*** (0.0968)
Ln fixed assets 0.0377*** 0.0376*** 0.0376*** 0.0372***
(0.0015) (0.0015) (0.0012) (0.0015)
Ln materials 0.7456*** 0.7457*** 0.7457*** 0.7465***
(0.0034) (0.0034) (0.0016) (0.0034)
Ln labor 0.1702*** 0.1700*** 0.1700*** 0.1677***
(0.0039) (0.0039) (0.0024) (0.0039)
Constant 1.7548*** 1.7630*** 1.7630*** 1.7646***
(0.0230) (0.0231) (0.0127) (0.0246)
Year dummies Yes Yes Yes Yes Firms specific dummies Yes Yes Yes Yes
Adj. R squared 0.86 0.86 0.87 0.89
No. of observations 131,396 131,396 131,396 131,396
F test for equal coefficients on Horizontal 9.48 48.88 0.05 49.9 Prob. > F test Horizontal 0.002 0.000 0.832 0.000
(min vs. maj) F test for equal coefficients on Horizontal Prob. > F test Horizontal 39.44
0.000
(maj vs fully)
F test for equal coefficients on Vertical 478.77
Prob. > F test Vertical 0.000 The dependent variable is firm output. Standard errors are listed in parentheses. ***, **, * denote significance at the one, five and ten percent level, respectively.

25
Table 6 : Olley and Pakes Regressions Results
OLS OLS First Differences
First Differences
Horizontal partially-owned -0.094 -0.12 -0.290** -0.329** (0.202) (0.202) (0.126) (0.126)
Horizontal fully-owned 1.191*** 1.281*** 1.057*** 1.045*** (0.2) (0.201) (0.134) (0.132)
Vertical partially-owned -0.055 -0.032 1.006*** 0.967*** (0.399) (0.399) (0.285) (0.286)
Vertical fully-owned -1.621*** -1.664*** -1.191*** -1.237*** (0.39) (0.391) (0.236) (0.237) Concentration measure <0.001*** <0.001*** (0.000) (0.000) Constant 2.891*** 2.894*** -0.069*** -0.071*** (0.049) (0.049) (0.005) (0.005) Year dummies Yes Yes Yes Yes Industry dummies Yes Yes No No Adj. R squared 0.30 0.30 0.003 0.003 No. of observations 117,877 117,877 71,641 71,641 F test for equal coefficients on Horizontal 20.99 24.53 63.55 66.87 Prob. > F test Horizontal 0.000 0.000 0.000 0.000 F test for equal coefficients on Vertical 8.69 9.40 38.90 38.91 Prob. > F test Vertical 0.003 0.000 0.000 0.000
The dependent variable is firm productivity calculated for each industry separately using the Olley-Pakes procedure. Standard errors are listed in parentheses. ***, **, * denote significance at the one, five and ten percent level, respectively.
26
Appendix
Table 1A. Concordances Table
IO codes Industry name NACE
1 Vegetable production 01.1 ; 01.3 2 Animal breeding 01.2 ; 01.3 3 Auxiliary services 1.4 4 Forestry and hunting 02.0 ; 01.5 5 Logging 2 6 Fishing and aquaculture 5 7 Coal mining and processing 10 8 Extraction of petroleum (including auxiliary services) 11.1 ; 11.2 9 Extraction of natural gas (including auxiliary services) 11.1 ; 11.2
10 Radioactive ores quarrying and processing 12 11 Ferrous ores quarrying and processing 13.1 12 Non-ferrous ores quarrying and processing 13.2 13 Extraction of building material ores 14.1 14 Extraction of clay and sand 14.2 15 Extraction and processing of chemical ores 14.3 16 Extraction and processing of salt 14.4 17 Other non-ferrous ores quarrying and processing 14.5 18 Meat production and processing 15.1 19 Processing and preserving of fish and fish products 15.2 20 Processing and preserving of fruits and vegetables 15.3 21 Production of vegetable and animal oil and fat 15.4 22 Production of milk products 15.5 23 Production of milling products, starch and starch products 15.6 24 Manufacture of fodder 15.7 25 Processing of other food products 15.8 26 Beverages 15.9 27 Tobacco products 16 28 Textile industry 17 29 Apparel and clothing 18.1 ; 18.2 30 Manufacture of leather and fur clothes 18.3 31 Footwear and other leather goods 19 32 Wood processing (excluding furniture) 20 33 Pulp, paper and cardboard; related items 21 34 Publishing, printing and reproduction of recorded media 22 35 Coking 23.1 36 Crude oil processing 23.2 37 Processing of nuclear combustibles 23.3 38 Basic chemical products 24.1 39 Pesticides and other agrochemical products 24.2 40 Dyes and varnishes 24.3 41 Medicines and pharmaceutical products 24.4 42 Soaps, detergents, cosmetics, perfumery 24.5

27
43 Other chemical products 24.6 44 Synthetic and man made fibres 24.7 45 Rubber processing 25.1 46 Plastic processing 25.2 47 Glass and glassware 26.1 48 Processing of refractory ceramics (excluding building items) 26.2 49 Ceramic boards 26.3 50 Brick, tile and other building material processing 26.4 51 Cement, lime and plaster 26.5 52 Processing of concrete, cement and lime items 26.6 53 Cutting, shaping and finishing of stone 26.7 54 Other non-metallic mineral products 26.8 55 Metallurgy and ferroalloys processing 27.1 56 Manufacture of tubes 27.2 57 Other metallurgy products 27.3 58 Precious metals and other non-ferrous metals 27.4 59 Foundry 27.5 60 Metal structures and products 28
61 Manufacture of equipment for producing and using of mechanical power (except for plane engines, vehicles and motorcycles) 29.1
62 Machinery for general use 29.2 63 Agricultural and forestry machinery 29.3 64 Machine tools 29.4 65 Other machines for special use 29.5 66 Armament and ammunition 29.6 67 Labor-saving devices and domestic machinery 29.7 68 Computers and office machinery 30 69 Electric machinery and appliances 31 70 Radio, TV-sets and communication equipment 32 71 Medical, precision, optical instruments and apparatus 33 72 Means of road transport 34 73 Naval engineering and repair 35.1 74 Production and repair of railway transport means 35.2 75 Aircraft engineering and repair 35.3 76 Motorcycles , bicycles and other transport means 35.4 ; 35.5 77 Furniture 36.1 78 Other industrial activities 36.2 - 36.6 79 Electric power production and distribution 40.1 80 Gas production and distribution 40.2 81 Production and distribution of thermal energy 40.3 82 Water collection, treatment and distribution 41 83 Construction 45 84 Wholesale and retail 50 - 52 85 Hotels 55.1 ; 55.2 86 Restaurants 55.3 - 55.5 87 Railway transport 60.1 88 Road transport 60.2
28
89 Pipe-line transport 60.3 90 Water transport 61 91 Air transport 62 92 Auxiliary transport activities and travel agencies 63.1 ; 63.2 93 Tourism agencies and assistance 63.3 94 Post and mail 64.1 95 Telecommunication 64.2 96 Financial, banking and insurance services 65 - 67 97 Real estate activities 70 98 Computer and related activities 72 99 Research and development 73 100 Architecture, engineering and other technical services 74.2
101 Other business activities 71 ; 74.1 ; 74.3 - 74.8
102 Public administration and defense, social assistance 75 103 Education 80 104 Health and social work 85 105 Other services (collective, social and personal services) 90 - 99