Embed Size (px)
Citation preview

Cash on delivery: Results of a randomized experiment to promote maternal health care in Kenya Karen A. Grépin James Habyarimana William Jack
Working Paper Series | No. 3 | September 2017
Georgetown University Initiative on Innovation, Development and Evaluation Department of Economics and the McCourt School of Public Policy 306 Reiss Building | Washington, DC 20057 https://gui2de.georgetown.edu/

Cash on delivery: Results of a randomized experiment to promote maternal health care in Kenya1
Karen A. Grépin2, James Habyarimana3, and William Jack4
September 16, 2017
Abstract In an experimental setting in Kenya, we show that certain financial and informational interventions delivered over the mobile phone network can be highly effective in boosting facility delivery rates of poor, rural women. Vouchers covering the full cost of care increased facility delivery rates by one-third, but a small copayment reduced the effect to almost zero. Cash transfers sent over the mobile network and labeled as transport subsidies, had similarly large effects only if they were conditional on delivering in a facility. By contrast, unconditional transfers had no effect on health care utilization. In contrast, we find a government policy that simply made care free at the point of service had little effect on demand. JEL Codes: L10, D10, D04, O12 Highlights:
• Full vouchers and conditional cash transfers were highly effective, and cost-effective, at increasing rates of institutional deliveries among poor, rural women in Kenya.
• Co-payments greater reduced the effectiveness of vouchers and unconditional transports were not effective.
• A free care policy instituted by the government also demonstrated no effect on institutional deliveries.
• SMS text reminders did not have any effect on institutional deliveries. Keywords: maternal health; global health; Kenya; developing countries; randomized controlled trial
1 We gratefully acknowledge the financial support of the Georgetown University Global Health Initiative and Grand Challenges Canada’s Saving Lives at Birth program. We thank Sam and Scholastica Agutu, and Zach Oloo of Changamka Micro Health Ltd. for their efforts in implementing the m-kadi program. We also thank Nada Eissa for helpful discussions, and seminar participants at Georgetown, Washington State University, Wilfrid Laurier University, McMaster University, Imperial College, the Harvard School of Public Health, and Oxford University. We thank Anna Diofasi, Caitlyn Brown and Binta Zahra Diop for excellent research assistance. Finally, we thank Jessica Bayern, Nisha Rai and Woubedle Alemayehu for their tireless and professional work in supporting the implementation and managing our team of 20 field staff. All errors are our own. 2 Corresponding author, Department of Health Sciences, Wilfrid Laurier University, Waterloo, ON Canada, [email protected] 3 McCourt School of Public Policy, Georgetown University, Washington DC USA, [email protected] 4 Department of Economics, Georgetown University, Washington DC USA, [email protected]

1. Introduction
Despite recent progress, rates of infant and maternal mortality remain persistently
high in the developing world, due in part to a lack of timely access to quality maternal
health services.1,2 In this study we experimentally test policies to reduce the financial,
transportation, and informational barriers to care faced by pregnant women in rural
Kenya. In particular, we assess the impacts of maternal health care vouchers, cash
transfers labeled as transport subsidies, and SMS reminders on facility delivery rates.
As detailed below, we find that vouchers covering the full cost of care at public
facilities had a sizeable impact on demand, while vouchers requiring a small out-of-
pocket payment had virtually no impact. A conditional cash transfer paid to women who
delivered in a clinic had a similar effect to that of the full voucher, but unconditional cash
transfers paid in advance of attendance had no impact, suggesting incentives, not liquidity
constraints, are critical barriers to the women in our sample. Finally, in general using
SMS messages to remind women to deliver in clinics had little impact, although we find
suggestive evidence that when those messages were made particularly salient and were
received by an intermediary - not by the pregnant woman herself – they could be
effective.
The demand-side vouchers we evaluate stand in apparent contrast to supply-side
interventions, such as those deployed in Rwanda (Basinga et al. 2011), Cambodia (Van
de Poel et al. 2016), and Burundi (Bonfrer, Van de Poel, and van Doorslaer 2014). But
while specific features and implementation details differ across supply and demand side
incentives, to the extent that both approaches reduce the consumer price (sometimes to
zero) while maintaining the producer price, the difference is largely administrative. We
1 Millennium Development Goal (MDG) 5, a target to reduce maternal mortality rates by three quarters globally between 1990-2015, was not met and the situation is particularly dire in Sub-Saharan Africa where more than half of all maternal deaths take place (Alkema et al. 2016; Kassebaum et al. 2014). 2 Promoting the use of health services may do little to improve health outcomes unless quality levels are maintained or increased. In Tanzania, increased use of public health services led to improved health outcomes through more timely access to malaria diagnosis and better adherence to treatment (Adhvaryu and Nyshadham 2015). A number of observational studies suggest that women who either give birth in a health care facility or in the presence of a skilled birth attendant have better pregnancy outcomes, as do their newborns (Ronsmans et al. 2009; Darmstadt et al. 2009; Scott and Ronsmans 2009). In the Netherlands, where rates of facility deliveries are much higher and rates of maternal and newborn deaths are much lower than in the developing world, one study has shown that newborns fare better when delivered in a health facility rather than at home (Trandafir and Daysal 2015).
2
illustrate with a simple model that the equilibrium impacts on the quantity and quality of
care provided are invariant to the means by which the subsidy is delivered.3,4
While vouchers are most typically conceived of as a means to exempt targeted
users from prevailing fees, supply side incentives tend to be implemented in the context
of care that is already free to the consumer. Unexpectedly, mid-way through our
experiment, the government of Kenya instituted such a free-care policy, which, in light of
the equivalence between supply and demand side subsidies, allowed us to compare the
two approaches to reducing demand side financial barriers.
An alternative way to promote the use of health care services is through
conditional or unconditional cash transfers (CCTs or UCTs).5 While formally similar to a
voucher-mediated price subsidy, CCTs might usefully focus consumers’ attention on
complementary goods and services.6 A number of studies have investigated the impact of
CCTs on health service utilization, nutrition and other health outcomes (Lagarde, Haines,
and Palmer 2009). Rigorous evidence from the impact of CCTs on maternal health
outcomes has also been demonstrated Mexico (Barber and Gertler 2010), Indonesia
(Kusuma et al. 2016), Nepal (Powell-Jackson and Hanson 2012), and India (Lim et al.
2010; Powell-Jackson, Mazumdar, and Mills 2015).
On the other hand, if consumers have challenges planning ahead or face liquidity
constraints, a labeled but otherwise unconditional transfer delivered at the appropriate
time might increase the utilization of health services. To date, the evidence on the impact
of UCTs is mixed, and there is limited evidence of their impact on health utilization. A
UCT in Morocco, in which beneficiaries were provided money unconditionally but were
informed that it was to be used to finance education expenses found that such a “nudge” 3 One form of supply side intervention is a so-called “performance-based financing” mechanism, in which payments to providers are tied to specific deliverables. 4 Ellis and McGuire (1993) addresses the trade-off between demand-side and supply-side cost sharing in the context of insured health care services in the US, an environment in which limiting demand and costs, while protecting consumers from risk, was a primary motivation (Ellis and McGuire 1993). In our context, the interventions are motivated by a somewhat different concern – that of increasing demand for and utilization of health services, while maintaining quality. 5 Indeed a cash transfer conditional on visiting a health care facility should have equivalent effects to a price subsidy of the same magnitude (even if it was used in the context of otherwise “free” care, thereby making the net price negative), although cash-in-hand could be viewed differently to a subsidized price by consumers, again for either behavioral reasons or if they anticipate that payment of the conditional transfer will be delayed, perhaps indefinitely. 6 In our context, these include transport costs, which are believed to represent a significant barrier to maternal health care use in many low-income country settings (Sacks et al. 2015).

3
was almost as effective as a conditional transfer at improving educational outcomes
(Benhassine et al. 2015). Similar results are observed for a subset of the health outcomes
in the UCT arm of a trial in Malawi (Baird, McIntosh, and Özler 2011). An evaluation of
the short-term impact of a UCT program in Kenya supported by the NGO GiveDirectly
found little short-term impact on any health measure (Haushofer and Shapiro 2016).
While paper vouchers may be costly to administer and to target, 7 especially
amongst poor and geographically remote populations, the reach of the mobile phone, and
the explosion of mobile money in Kenya has provided a platform over which both
targeted financial subsidies and information can be delivered at minimal cost (Suri and
Jack 2016; Suri, Jack, and Stoker 2012; Jack and Suri 2014).8
Another potential advantage of using a mobile platform to deliver financial
subsidies is that additional interventions can be deployed in tandem. For example, so-
called ‘mHealth’ initiatives have targeted information to health care providers, or have
sent SMS reminders to patients to maintain adherence to medicines or to increase the use
of routine health services (Sondaal et al. 2016; Lester et al. 2010; Pop-Eleches et al.
2011; Raifman et al. 2014). How such messages can be designed to be most effective,
for example in terms of their salience, has received less attention in the literature. We
thus tested two types of SMS messages, as described below, both of which provided
information on the importance of a healthy pregnancy and maternal health care.
However, one version of the messages was “plain”, while the other was more
“contextualized”, modified to make the health of the baby more salient to the prospective
mothers.
Our study makes a number of contributions to the literature on the design of
health promotion programs in low-income settings. First, we find a strong effect of the
full voucher and the CCT on facility deliveries, especially when they are delivered in
combination. Forty-seven percent of women with access to both the CCT and the full
voucher delivered in a clinic or hospital, while only 33 percent of those with neither did
7 See Schmidt et al. (2010) for a discussion (Schmidt et al. 2010). From a tax-efficiency perspective, an advantage of vouchers is that they can be targeted to those whose behavior is expected to respond to a price subsidy, thereby limiting the fiscal cost. Of course, identifying the most needy and responsive individuals (often through some sort of proxy means test) is non-trivial (Jehu-Appiah et al. 2010).8 In Niger, the use of mobile phones to deliver a cash transfer program provided more benefits to households than resources transferred via more manual methods (Aker et al. 2016)

4
so, a 14 percentage point, or 42 percent, increase in institutional delivery rates. Without a
health care voucher, the CCT increased facility deliveries by 8.7 percentage points, while
the full voucher alone increased facility deliveries by 11 percentage points.
Second, we find that the UCT had little impact, suggesting women were not
simply liquidity constrained, and that in this context they did not respond to such a
nudge.
Third, amongst women who did not receive a cash transfer, and whose only
financial incentive at the margin to deliver in a clinic was a maternity care voucher, our
evidence suggests the small copayment reduced demand to levels close to the control
group. Specifically, our point estimate of the effect the copay voucher is one-tenth that
of the full voucher, and is not statistically different from zero. On the other hand, we
reject the null of equal average treatment effects of the full and copay voucher, but only
at the ten percent level among non-recipients of a cash transfer. Our tentative conclusion,
consistent with the findings from some other experimental studies of the demand for
health commodities, that a small cost-sharing contribution for maternal health services
has a large, if not discontinuous, impact on demand (Cohen and Dupas 2010; Ashraf,
Berry, and Shapiro 2010; Kremer and Miguel 2007).
Fourth, we find no evidence that either type of text message affected utilization of
maternal care services across the full sample. However, there is suggestive evidence of
an effect for women who received the contextualized messages via someone else’s
phone: although imprecisely estimated, such women appear to have higher rates of
facility delivery than those who received the messages on their own phones. There was
no response from either group to the simple reminders. We discuss the extent to which
these results might reflect the importance of the face-to-face engagement of a third party
(the owner of the phone) in inducing behavior change in this context.
Fifth, consistent with the model of quality we develop, we find little impact of the
free care policy on demand for women without vouchers. On the other hand, even after
the policy change, women with vouchers consistently had higher rates of facility delivery
than women without vouchers. We find some evidence that the voucher holding women
paid less for maternity care, even after the free maternity care policy was implemented.
In addition, we also investigate the perceived quality of care reported by women as a

5
function of voucher status, and depending on whether their due dates fell before and after
the policy change. Recognizing that quality is only observed for those who deliver at a
facility, we use the randomly assigned conditional cash transfer to instrument for
selection, which we find predicts demand, but we argue is unlikely to have induced a
quality response from the facilities. Our results suggest that prior to the free care policy,
voucher recipients perceived somewhat higher quality care in some dimensions,
particularly those that could be varied on a patient-by-patient basis. During the new
policy regime however, this quality differential appears to be eliminated, although it is
difficult to tell if this convergence reflects real quality changes. More objective measures
of quality show much less variation across treatment groups, or over time.
Section 2 describes the context and our interventions in more detail, section 3
develops a simple model of demand and supply with endogenous quality, section 4
describes our recruitment activities and the data sources used, section 5 outlines our
empirical strategy, and section 6 presents our results. Section 7 explores the cost-
effectiveness of the interventions, adjusted for potentially distortionary financing costs,
while section 8 concludes.
2. Context and Description of interventions
Kenya’s maternal mortality ratio was estimated to be 362 per 100,000 live births
during 2007-2014, only slightly lower than some estimates for 1990. There was no
measurable decline in the rate during the early 2000s and rates may have even increased
during the 1990s.9 In the 2014 Kenya Demographic and Health Survey, only 61% of
births in the preceding 5 years were reported to have taken place in a health facility
(Kenya National Bureau of Statistics and The DHS Program 2015). In Western
Province,10 where this study was carried out, the corresponding figure was a little less
than half (47%), although that was nearly double the rate reported in the 2008-9 DHS 9 Due to a lack of data from a vital statistics registry, maternal mortality rates in Kenya are modeled and thus estimates vary depending on the data source and models employed (Kenya National Bureau of Statistics and ICF Macro 2010; Kenya National Bureau of Statistics and The DHS Program 2015; Lozano et al. 2011; Hogan et al. 2010). 10 Under the current Kenyan Constitution, which was passed in 2010, new administrative structures were drawn up and the eight provinces were replaced by 47 counties. Vihiga County, the location of this study, was part of Western Province at the time of the 2008 DHS, and thus could not be directly identified in those survey data. In the 2014 DHS however, Vihiga County was identifiable.

6
(Kenya National Bureau of Statistics and ICF Macro 2010). In the earlier DHS survey,
the most commonly cited reasons for not delivering in a health facility among women
were geographic and financial barriers. While nearly all pregnant women in Kenya
(96%) received some antenatal care (ANC) services, only a little more than half (58%)
made the recommended four or more visits during their pregnancies, and they often
sought care late – the median gestation at first visit was 5.4 months instead of the
recommended 12 weeks. Finally, more than 60% of pregnant women in Western
Province (43% nationally) did not receive any postnatal care (PNC) after their most
recent live birth.
Our research project was conducted in collaboration with Changamka, a micro-
health Insurance organization, whose “m-Kadi” program provided the platform over
which the experimental interventions were delivered to pregnant women in Vihiga
County. Below we describe in more detail the three types of interventions: maternity
health care vouchers, cash transfers labeled as transport subsidies, and reminder SMS
messages. The three intervention types, which each included two treatments and a
control, were crossed, yielding a 3x3x3 design.
(i) Maternal health care vouchers
Two types of maternal health vouchers that covered ANC visits, delivery, and
PNC visits, were offered to selected women. The vouchers covered the costs of these
services, as reported in Appendix Table 1, plus a small premium to compensate facilities
for the administrative burden of adopting the system and recording utilization.
Women assigned to the “full voucher” group made no payments to the facility,
and in principle were not required to purchase any inputs or consumables at the point of
service. As the majority of the health facilities in our catchment area only offered basic
emergency obstetric care, if a woman in the full voucher group presented at a health
clinic in labor, but required a cesarean section or additional obstetric procedures, she
would be transported to the Vihiga District Hospital, the only health facility in the
catchment area that provided comprehensive emergency obstetric services. Under this
circumstance, the voucher program reimbursed both the health clinic and the hospital.
The cost of transport from the clinic to the hospital was also covered if the woman had a

7
voucher, but women without a voucher had to pay for those services, as they would under
normal circumstances.
A second group of women received a “copay voucher,” under which they
received free care for all ANC and PNC services, but were required to pay a 100 KSh
(about $1.20 at the time) copayment for a facility delivery, which represented about 10
percent of the median reported price for a normal delivery paid by the control group.11
The copayment, which had to be made at the time of check-in via one of Kenya’s mobile
money platforms, was the same across facilities, and did not depend on whether a
cesarean section was performed. The facility would not be reimbursed for deliveries of
women in the copay voucher group unless the copayment had been made.12
(ii) Cash transfers to subsidize transport costs
We administered two types of cash transfers – conditional and unconditional –
designed to help overcome transport cost barriers. These subsidies, also delivered by
mobile phone, were not tied directly to the purchase of transport services, primarily
because of the challenges of keeping track of receipts and limiting fraud. Instead, those
women assigned to the conditional cash transfer arm were sent transfers if and when they
presented at a health facility for one of the prescribed maternal health services, and if
their visit was recorded in the online accounting system. This conditional transfer was
paid for up to four ANC visits, a facility delivery, and up to three PNC visits. An eligible
woman received a transfer of 250 KSh (about $3 USD) for each eligible ANC and PNC
visit, and a 500 KSh ($6 USD) transfer for her delivery.
Another group of women were randomized into an unconditional cash transfer
arm. Transfers in the same amounts as the conditional arm were remitted to these women
on the mobile money platform a few days before each of their predicted ANC and PNC
visits, according to the schedule recommended by the Kenyan Ministry of Health, and a
week before her expected delivery date. 11 Even after the free care policy came into effect, if the facility was to be reimbursed for serving copay voucher recipients, the 100 KSh payment had to be made. It is possible that the facility itself could have executed this payment on behalf of the woman, in order to earn the face value of the voucher, if the woman was unwilling to do so. 12 Our data, which includes the mobile phone number from which payments were made, indicates that the practice of the facility remitting the co-payment in order to qualify for the larger reimbursement was not prevalent.

8
We reiterate that the cash transfers were not formally linked to the purchase of
transport services. However, because we told women that they were meant to help with
transport costs, and they were large enough to cover reasonable fares, there could have
been a labeling effect associated with these two arms. 13
(iii) Reminder SMS messages
Finally, we sent some women weekly mobile text messages via SMS, intended to
promote a healthy pregnancy and to remind them of upcoming ANC and PNC visits and
to encourage facility deliveries. We used messages developed by the Mobile Alliance for
Maternal Action (MAMA),14 a partnership established to develop vital health messages to
new and expectant mothers in developing countries via their mobile phones. Women in
one SMS treatment arm received the “plain” MAMA messages, while women in a second
arm received more “contextualized” meant to make the health of their baby a more salient
motivation for seeking care. Again, a control group of women received no weekly SMS
messages from the program.
Appendix Table 2 provides a comparison of the plain reminder messages and
those that were contextualized to strengthen the incentive to use the service. Both types
of messages were sent on the same schedule, and assignment of the SMS treatments was
orthogonal to that of the financial interventions.
3. A model of price and quality
Let us focus on a normal delivery as the unit of care. Let the regulated price of a
delivery be p, which without further government intervention is the amount paid by the
customer and received by the clinic. The government, or other sponsor, can also provide
a subsidy s per delivery to the consumer, for example through a voucher. When the
voucher is redeemed in exchange for services, the clinic receives a payment s from the
sponsor. A consumer who uses the voucher makes an out-of-pocket payment in the
amount ! − # for the service. If the voucher subsidy is greater than the price, p, the clinic
13Of course, we are unable to independently identify such a labeling effect, as no women were offered the transfers without the reference to transport costs.14 http://www.mobilemamaalliance.org/

9
receives s, but the consumer faces a zero price. Producer and consumer prices, as
functions of the voucher subsidy, are illustrated in Figure 1.
Figure 1: Consumer (solid line) and producer (dashed line) prices as functions of the voucher subsidy rate, given a
regulated price p
Alternatively, the government might administer a supply-side payment in an
amount t per delivery, paid directly to the clinic. The consumer would continue to pay p,
but the clinic would receive ! + %.
Consider a consumer who chooses between health services h and another
composite numeraire good x. The quality of health services is q, which she takes as
exogenously fixed. We assume quality is not contractible, so the price and subsidy do
not depend on it, although consumer preferences are sensitive to it. Suppressing the
dependence on income, health status, and other factors, consumer demand is a function of
the net-of-subsidy price, and quality, ℎ' ! − #; ) , which is assumed to be decreasing in
the first argument, and increasing in the second.15
On the supply side, clinics maximize an objective function that responds directly
to the quantity and/or quality of services provided (so there is thus some incentive to
provide at least a minimal level of service), but is also sensitive to retained revenues and
costs. Holding quality fixed, the supply of services is ℎ* ! + %; ) , which is assumed to
be increasing in the first argument, and decreasing in the second.
15 If p – s is negative, demand is ℎ' 0; ) .

10
If the price p is regulated at a fixed level, then equality of demand and supply is
attained by quality adjustment, with an equilibrium quantity of services ℎ∗(! − #, ! + %),
provided at quality )∗(! − #, ! + %). A number of policy scenarios can be considered using
this simple model. First, prior to our intervention, a fixed price for services prevailed,
with no additional consumer subsidy or supply side payment in place. That # = % = 0,
and the equilibrium quantity of services was ℎ∗(!, !), at quality )∗(!, !), as illustrated in
Figure 2.
Figure2:Withnosubsidies,equilibriumquantityandquality1∗(2, 2)and3∗(2, 2)respectively.Introducingademandsidevoucherwithfacevalueequaltotheregulatedpriceleadstoanincreaseinquantityto1∗ 4, 2 butafallinqualityto3∗ 4, 2 .Underafreecarepolicy,qualityfallsto3∗(4, 4)andthequantity,1∗(4, 4),couldbe
largelyunaffectedcomparedwiththeregulatedpositivepriceoutcome.
Introducing the voucher with a face-value of p in this context increases the
quantity demanded at any given quality, shifting the hD curve to the right, as shown in
Figure 2. The number of services provided increases accordingly to ℎ∗ 0, ! > ℎ∗(!, !),
but quality falls to )∗ 0, ! < )∗(!, !) to equilibrate the market.
On the other hand, a “free care” policy that reduces the regulated price to zero
without any consumer or producer payments results primarily in a potentially large fall in
quality. To see this, note that a free care policy shifts the demand function in the same
way as a full voucher, to ℎ'(0, )), but it also shifts the supply function to ℎ*(0, )), as
shown in Figure 2. The quantity of services delivered falls compared with the voucher

11
scenario, to ℎ∗(0,0), and could end up close to the level under the regulated (positive)
price outcome. Quality is )∗(0,0).
Combining the free care policy with a voucher has precisely the same impact as
free care plus a supply side subsidy of % = #. In particular, the supply curve shifts back
out to ℎ*(#, )), and if the subsidy is equal to the original regulated price, Figure 2 again
prevails and the quantity and quality of services is the same as with a voucher in the
context of fee-for-service care.
The model suggests that introducing a voucher with a face value s at or below the
prevailing regulated price acts as a demand side subsidy, but that as s increases above p
(which might be zero), the voucher is equivalent to a supply side payment. By
administering the voucher program after the price of maternity services was reduced to
zero, we effectively implemented a supply side subsidy, whose effects are expected to be
similar to those of a voucher of the same value that reduces the consumer price to zero.
The conditional cash transfer might be expected to have similar effects to a
voucher of the same face value. There are two differences however: first, even if the
regulated price of care is zero, the consumer still benefits directly from the CCT,
effectively facing a negative price; and second, again when the regulated price is low or
zero, the provider does not benefit from the CCT, while it does with the voucher. The
result, in the context of free-care, is illustrated in Figure 3. Finally, absent behavioral
effects associated with labeling, the unconditional cash transfer is likely to have a (small)
income effect on demand, and little effect on supply.

12
Figure3:Aconditionalcashtransferinthecontextofafreecarepolicycouldboostdemandto1∗(−7, 4),butat
evenlowerequilibriumquality,3∗(−7, 4)
Assuming providers can at least partially differentiate among women based on their
individual demands, our model suggests demand will be higher but quality lower under
the full voucher and CCT compared with prevailing levels under a fee for service regime,
and that demand could be largely unaffected, but quality again lower, under the free care
policy.
Although these theoretical predictions are straightforward, we face both
econometric and simple measurement challenges in observing them in the data. Below
we propose an identification strategy to address the econometric issue of selection, but
measuring quality in a reliable way remains problematic (Akachi and Kruk 2017).
Nonetheless, even if quality impacts turn out to be difficult to detect, the differential
effects on the quantity of services provided under different regimes can be rationalized by
appealing to an underlying quality adjustment mechanism.
4. Recruitment and data collection
Community Health Workers (CHWs), whose regular job includes identifying,
monitoring, and counseling pregnant women in their home villages, were trained and
engaged by our research team in collaboration with Changamka to implement the
recruitment activities for this project. Village meetings were conducted in which women

13
and other community members were informed about the new “m-Kadi” program.
Women were told that by enrolling in the program they could receive financial support to
help them cover the costs of their pregnancy, although they were not told which benefits,
if any, they might receive. After the meetings, the CHWs approached pregnant women in
their villages to see if they were interested in enrolling in the program. Women were
informed of the potential benefits of the program and were asked to give informed
consent to participate in the study. Between February and July 2013, a total of 1,595
eligible pregnant women consented and were enrolled into the program.16
At recruitment, CHWs administered a face-to-face survey collecting data on
demographics, current pregnancy status, prior pregnancies, and other information using a
mobile phone for data collection. Participating women were given a unique ID number,
which they were told to present at health facilities for all maternal health visits.
Of the 1,595 women recruited, only 1,514 were eligible for our endline survey: 2
women turned out not to be pregnant, 7 died during the course of the study, and 72
experienced a miscarriage.17 Panel A of Table 1 reports the numbers of women in our
endline eligible sample assigned to each combination of health care voucher and cash
transfer treatments, while Panel B reports the distribution of our sample that actually
completed the endline survey. The Panel C Table 1 reports the assignment to SMS
treatments, which was orthogonal to the other two treatment assignments. A full
description of the attrition in our sample is also available in Appendix Table 3.
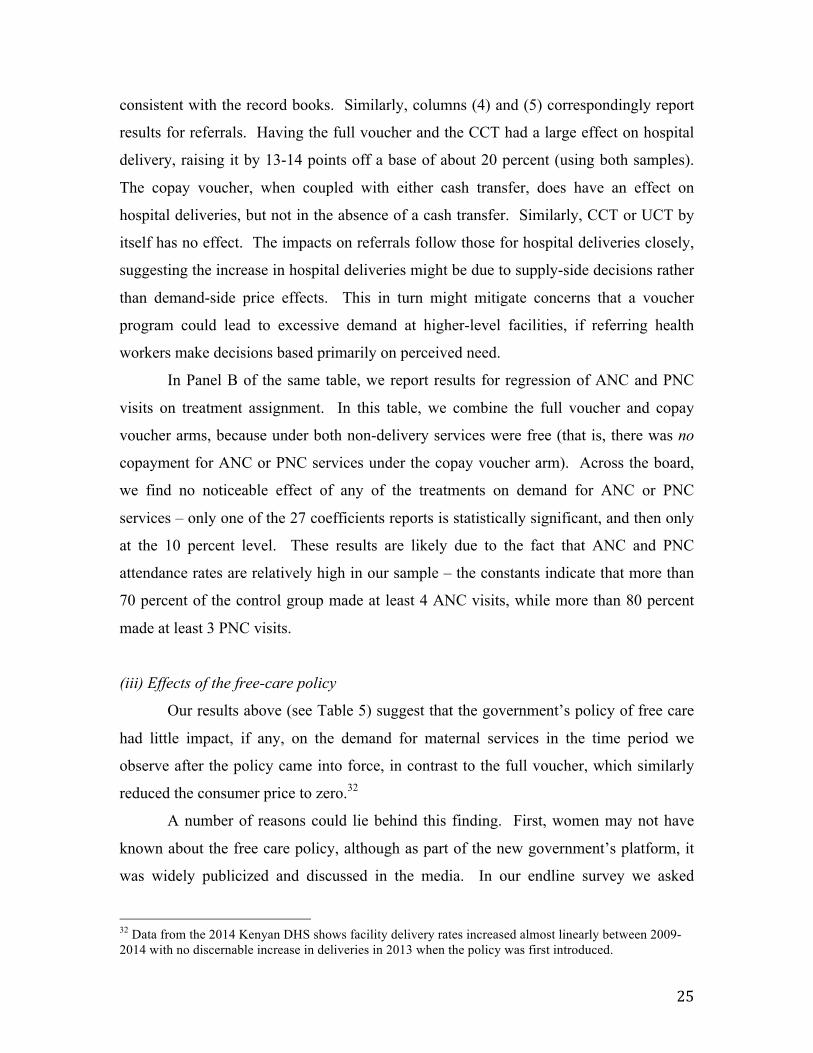
Table 2 reports balance tests using baseline data for the maternal health care
vouchers (Panel A) and cash transfer arms (Panel B).18 The treatment and control groups
for all of the interventions were well balanced.
Although cash transfers and copayments were made over the mobile money
platform, and text messages were administered, women were not required to possess a
mobile phone to take part in the study. Instead, they could specify the number of phone
that would be used for these purposes, often belonging to a family member, friend, or
sometimes the community health worker herself.
16 Eligibility for the m-Kadi program was restricted to poor women without a formal occupation. 17 We acknowledge that the second and third outcomes could have been affected by the treatments themselves, but we lack power to speak definitively to this possibility. 18 We do no present the balance test for the SMS subsidies, but they are available upon request.

14
When a woman visited one of the eight participating health facilities, 19 her
program ID number was recorded, and basic information collected in an on-line database,
which was linked to the payment system through which vouchers were redeemed by the
facility. Data clerks at the facilities were in charge of these operations, and worked in
shifts to provide 24-hour coverage. However, as we report below compliance with the
data collection protocol at the facilities was imperfect, particularly, and not surprisingly,
for women who did not receive a maternity care voucher or conditional cash transfer.
However, as part of routine administrative procedures at public facilities, nurses and
other staff recorded information on all patients visiting a facility in register books at all of
the participating facilities. As we describe below, we use both the survey data (from
baseline and endline) and register book data in our analysis.20
The endline survey was administered in person by the CHWs on a rolling basis in
four phases between August 2013 and March 2014 to women whose expected delivery
date (as estimated at recruitment) had recently passed. We attempted to reach women
who could not be interviewed in person with follow-up phone surveys.21 Data on the
number and timing of ANC visits, when and where their delivery took place, the number
of PNC visits she made, and measures of her perceived quality of care were all collected
in the endline survey.
We face two potential biases in using the endline survey data to measure
pregnancy outcomes: first, measurement error issues could arise if women gave false
answers, either simply due to recall bias or strategically if they felt they should answer in
a particular way; and second, if we find that there was significant non-random attrition
from the baseline sample, especially by women who could not be found or did not give
consent to be interviewed.
19 At the time of our experiment, there were 8 public facilities in Vihiga County, all of which participated in our study. While there were no private facilities providing deliveries in the area, there were some private providers that provided some maternity services, such as ultrasounds, which were not covered under the voucher program. While most women visited a health care provider in their local area, some women could also travel outside of Vihiga county to seek medical care, but these facilities did not participate with our study. 20 Completion of the register book did not involve the on-line system through which vouchers were redeemed or transport subsidies were validated, and was administratively independent of our experiment. Therefore, while the register book data could of course be subject to error, we assume such errors are uncorrelated with treatment assignment. 21 We attempted to reach by phone 36 recruited women who had relocated outside of Vihiga district before the endline survey.

15
Table 3 reports the correlation of attrition at endline with assignment to the
voucher and cash transfer arms, and their interactions. Of the 1,514 women who were
eligible to take the endline survey, 1,401 (92.5%) completed either the in-person endline
survey or the phone survey: we were unable to find 43 of the non-respondents (2.8% of
the eligible sample), while 70 women (4.6% of the eligible sample) refused to consent to
the survey. Column (2) shows that other than a small negative effect of being assigned to
the conditional cash transfer there was no correlation between being found at endline and
any of the other treatment assignments, while Column (3) confirms that assignment to
either a health care voucher or cash transfer treatment arm, or their interactions, reduced
consent-related attrition.22
To account for possible measurement error, and also to correct for non-random
attrition, we constructed a complementary dataset on the place of delivery, using data
from the register books from all eight health facilities in our catchment area. As
described in more detail in footnote 26, we construct two new indicators of place of
delivery that differ according to the strength of the match between our baseline survey
data and the register book data.23 According to these definitions, between 590 and 772 of
the 1,514 women eligible to take the endline survey were recorded as having delivered in
a health care facility. Using this approach, the rate of facility deliveries in the control
group ranged between 33 and 46%, which is more consistent with estimates we would
have expected based on data from the 2014 Kenyan DHS (which was 47% in the
preceding 5 years).
22 Attrition was uncorrelated with assignment to the SMS treatment arms and whether or not women in the initial sample were eligible for the endline survey (results not shown).23 Matching register data to our baseline and endline datasets was non-trivial since, for example, women’s names are often spelled differently in the register book and dates are remembered or recorded with error. To develop the database, we first took photographs of the pages in the register books kept in the labor and delivery units of each facility over the entire study period. These books were then transcribed into a database by two independent transcribers, if the transcriptions were not exact, then the transcripts were manually reconciled by a third person. We then developed an automated matching algorithm to find the closest match for each woman in our baseline survey to entries in the transcribed database. Match scores were based on her expected date of delivery, the age of the woman, her first and last name, and her home village. Two research assistants working independently were then asked to determine if there was a match among the closest matches obtained from the matching algorithm. If both research assistants agreed on the same match for the woman in our baseline survey, then we recorded that birth as having taken place in a health facility. Otherwise the woman was assumed to have delivered outside of a health facility. We refer to this as the “full match” algorithm. We also include results for a “partial match” definition of facility delivery, equal to 1 if either one or both manual checks indicate such. By this latter measure, there were 772 facility births. The number of self-reported facility deliveries, 1,189, was much larger.

16
Although the routinely collected facility level data could be incomplete, there is
no reason to believe it is biased with respect to the research design. For this reason,
while we present the results from both the endline survey and the register book dataset,
our preferred specification is based on the full match data from the register books.
However, as we were only able to generate a comparable dataset for delivery outcomes
(but not for ANC or PNC visits), we used the endline survey data for other health care
utilization outcomes.
5. Empirical strategy
(i) Maternal health care utilization
Our primary outcome variable of interest, 89 is in-facility or institutional delivery,
but we also estimate treatment effects on hospital deliveries, referrals to hospitals, as well
as the number of ANC and PNC visits. Our main results focus on the coefficients in
unsaturated regressions of the form:
89 = : + ;<=9<
>
<?@
+ ABC9B>
B?@
+ DEF9E>
<?@
+ G9
where:
• =9@ = 1 if individual i is assigned to the full voucher group and zero otherwise;
• =9> = 1 if she is assigned to the copay voucher group and zero otherwise;
• C9@ = 1 if she is assigned to the conditional cash transfer group and zero
otherwise;
• C9> = 1 if she is assigned to the unconditional cash transfer group and zero
otherwise;
• F9@ = 1 if individual i is assigned to the contextual SMS group and zero
otherwise; and
• F9> = 1 if she is assigned to the plain SMS group and zero otherwise.

17
Alternatively, we present results for the (nearly) fully saturated model including
interactions between the voucher and cash transfer interventions as follows:24
89 = : + ;<=9<
>
<?@
+ ABC9B>
B?@
+ I<,B=9<×C9B
>
<,B?@
+ DEF9E>
<?@
+ G9
We estimate the impact of the free-care policy including potentially differential
effects of the experimental treatments before and after the policy, by running an additive
as well as a fully interacted model of the specifications above with an indicator equal to 1
if the expected delivery date is after the policy change.25 We conduct a Chow test to
determine the likelihood that the process determining facility delivery is the same before
and after the free care policy.
(ii) Quality
To assess the possible quality impacts of the experimental interventions and the
free care policy, we use the quality data that we collected in the endline survey, which we
have for all women who reported having delivered in a health facility. A simple
treatment-control comparison presents us with the obvious selection issue however, that
quality is only observed for those who attend a facility, and attendance rates differ by
treatment assignment. For example, women who respond to the vouchers might be
relatively poor, relatively healthy (in terms of their need for health care), or different in
other unobserved ways. In turn, reported quality could respond in various ways to these
underlying characteristics, say because health care workers treat poor people badly,
because healthier women don’t need such high quality, or because the perceptions of
what constitutes “good” quality are different for the marginal client.
To address this problem, we exploit the orthogonal cash transfer arms of our
experiment using a Heckman selection model (Heckman 1976).26 In particular, we argue
24 We do not present results of the fully saturated model, in which the SMS treatments are also interacted with the other treatments. 25 In results available from the authors, we estimate a model with month dummies to capture potential time varying effects of the free care policy to reflect the gradual adoption of the change. 26 We also estimated a propensity score matching model, in which we estimated the probability of clinic delivery on the control group, and matched women in the treatment group on the basis of their predicted probabilities. This method would also have allowed us to match women in the two groups who were more likely to answer the endline survey. However, the sample of close matches was too small to yield statistically meaningful results (available on request).

18
that on a person-by-person basis, the cash transfers aimed at subsidizing transport costs
should not directly affect quality, since providers do not have any claims on the funds
made available to recipients, and they are unlikely to be aware of the subsidy status of
individual women.27 On the other hand, we know that the subsidy was instrumental in
inducing women to deliver at a clinic.28
Following this strategy, we estimate a first stage equation of facility delivery on
assignment to the cash transfer arms, plus other exogenous variables, and estimate a
second stage of quality indicators, including the inverse Mills ratio.29
6. Results
We first report the effects of our experimental interventions, then examine
possible impacts of the free-care policy that was implemented part-way through our
study.
(i) Effects of experimental interventions on facility delivery rates
Table 4 presents our main experimental results on the impacts of the financial
interventions we tested. The results of the unsaturated model, which effectively
constrains treatment interactions to be zero, are shown in Panel A, while the saturated
model results are reported in Panel B. The coefficients in each row reflect the mean
impact of assignment to the respective experimental cell or cells. Column (1) uses self-
reported data from the endline survey, which could suffer from both attrition and
potential mis-reporting. To account for the former, in Columns (2) and (3) we report
lower and upper bounds on the estimated effects, using Manski’s non-parametric method
27 Figure 3 suggests that the CCT could reduce quality if it increases demand sufficiently. We argue however that at the individual level, receipt of the CCT should not directly affect the quality of services offered to a particular woman, while possession of the voucher could induce the provider to supply higher quality care. 28 It is possible that the process that drove selection to deliver at a clinic was different before and after the June 1st policy change. If so, we would need a second instrument to properly identify the impact of the vouchers on quality received, using data from both before and after the change. However, we observe little impact of the policy change on utilization rates, and suggest that it is difficult to see how the policy change would have altered the mix of women delivering in clinics, while leaving utilization rates themselves unaffected. In light of this, we assume the selection process before and after June 1st was fixed. 29 In results not shown, we also estimate specifications including month dummies, to account for the fact that quality changes might have emerged gradually over time, both because the policy change was announced in advance, and because some providers might have become aware of the difference in marginal revenues only slowly after the change was implemented.

19
(Manski 1990). Finally, in light of our concerns over mis-reporting, Columns (4) and (5)
use data on our full sample of pregnant recruited women, as validated with data collected
from the register books using the match algorithm discussed above, using either the
partial or full match algorithms respectively. Our discussion will focus on Columns (1)
and (5).
In both specifications, the first striking observation is that the constant terms,
reflecting the rate of facility deliveries amongst women who received neither a maternity
voucher nor a cash transfer, differ widely between Columns (1) and (5). When asked at
endline, 79 percent of respondents in our control group reported delivering in a facility,
while the validated data from the facilities’ record books using the full match suggest
only 33 percent of the pure control women were validated to have delivered in a clinic.
The partial match yields a rate in the control group of 46 percent. The fact that the
facility delivery rate from the register data books are more in line with data from the
DHS, provides further justification for our preference for the register book data over the
data from the endline data, which we suspect suffered from over-reporting of facility
deliveries. In addition, as previously discussed, we have no reason to believe that the
register book data would be biased according to treatment status.
A first summary of treatment effects from the upper panel is that the full voucher
and the conditional cash transfer each have large impacts on delivery rates, increasing
them by 7.2-8.5 percentage points off a base of 33.0 percent. The copay voucher and the
unconditional cash transfer have little effect on average, as do the SMS messages.
Turning to the saturated model in the lower panel, the impact of receiving just the
full maternity voucher is 9.7-11.0 percentage points, using both endline and register book
data. Similarly, the impact of receiving both the full maternity voucher and a conditional
cash transfer is 12.0-14.0 points. However, when coupled with an unconditional cash
transfer, the impact using endline data (11.0 points) disappears in the register book data.
Using the full match protocol, women who were assigned the copay voucher,
which required them to pay a small fraction (10 percent) of the regular delivery price,
exhibited virtually no change in facility deliveries, unless the voucher was coupled with a
CCT. This stands in contrast to the 11.0-point impact of the full voucher when received
in isolation, significant at the 1-percent level. We report the p-value for F-test of the

20
hypothesis of equal treatment effects of the full and copay voucher both when
(Copay=Full: Excluding cash transfer interaction parameters) and when not coupled with
any cash transfer (Copay=Full: Excluding cash transfer interaction parameterss) at the
bottom of the table. We cannot reject the hypothesis of pairwise equality of voucher
effects in all three cash transfer groups (Copay=Full: Including cash transfer interaction
parameters) – that is, a test of the hypothesis that (UCT x Full = UCT x Copay) and
(CCT x Full = CCT x Copay) and (Full only = Copay only), however we are able to
reject it when the effects of the cash transfers are excluded. On the other hand, we are
able to reject the null of equal treatment effects of the CCT and UCT, both restricted to
women who receive no voucher, and jointly across all voucher arms.
Coupling the copay voucher with the conditional cash transfer, however, increases
the measured effect relative to the control group to 15.0 percentage points (8.4 points
using endline data). As we observed with the full voucher, the impact of the copay
voucher combined with the unconditional cash transfer is large when measured using the
endline survey, but small and insignificant when using the record books.
The effect of receiving the conditional cash transfer alone is between 8.7 and 11.0
percentage points, while the impact of the unconditional transfer is statistically
insignificant, using both data sources. In this case, as reported in the bottom panel, the
effects of the conditional and unconditional cash transfers are statistically different from
each other using the register book data, both across all groups (p < 0.01), and between the
two cash transfer cells in which there was no maternity voucher (p < 0.05).
Table 5 incorporates temporal effects to measure any changes to the data
generating process that might have occurred after the introduction of the government’s
free care policy. Again, we present the unsaturated model in the top panel, and the
saturated version in the lower panel. Using the full match validated register book data,
Column (1) first includes a dummy variable equal to 1 for women whose expected
delivery data was after June 1, 2013, but this is found to have no detectible impact on
delivery rates.
Columns (2) and (3) in Table 5 estimate the basic models respectively before and
after the policy change. Although the parameter values are similar in the two periods, we
lack power in the pre-policy change regime to generate the same statistical significance

21
levels. The p-values associated with a Chow test in the unsaturated and saturated models
are presented at the bottom of each panel, and suggest no change in the data generating
process over time.
Our pattern of results is consistent with the following interpretations. First, we
find evidence that both the full voucher and the conditional cash transfer were very
effective at increasing demand for institutional deliveries in our sample of women. The
full voucher alone increased the utilization of services by 11.0 percentage points while
the conditional cash transfer increased it by 8.7 percentage points. When given together,
women increased their propensity to delivery in a facility by 14.0 percentage points, or a
roughly 42% increase compared to the control using the facility data, a very large
proportional increase in delivery rates.
Second, we find that while both the co-pay voucher and the unconditional cash
transfer had some impact according to the endline survey, neither demonstrated any
significant effects using the register book data. Women who received a voucher and an
unconditional cash transfer appear to have over-reported their rates of facility deliveries
in the endline survey. On the other hand, recipients of the unconditional cash transfer
who did not receive a maternity voucher seem to have felt no pressure to misreport.
What is more challenging to understand is why there is an impact on facility
deliveries for women with a full maternity voucher only, while (according to the register
book data) this effect is offset by receipt of an unconditional cash transfer. One possible
explanation is that women with both a full voucher and the unconditional cash transfer
misunderstood the combination, and interpreted the cash received as being the voucher
itself, intended to finance maternity services, but realized they could spend it on
something else. An alternative reason could be that women prefer to deliver at a private
facility or with a traditional birth attendant, or at a facility outside Vihiga, and that receipt
of the unconditional funds leads them to pay for such alternatives, even when care at the
local facilities is free.30 We further investigated this hypothesis by first observing that
the number of deliveries at private facilities in Vihiga, or at any facility outside the
30 We test the hypothesis that women with unconditional cash transfers act on strong preferences to deliver in private/NGO facilities or outside the district. The p-value of our statistical test of no differences in this behavior between the conditional and unconditional arms is 0.56. Similarly, we find no evidence that these women were more likely to travel further for their deliveries, or use more expensive modes of transport.

22
county, was very low – only 1-2 percent as reported in the endline survey across all
treatment arms. Notwithstanding the possible bias of the endline data, it seems unlikely
that a large number of women use the unconditional cash transfer to purchase care from
either of these alternative sources.
At recruitment, each woman was asked if she owned a mobile phone. She was
also required to register a phone number that could be used to receive text messages and
mobile money transfers as part of the treatments, or for SMS communications. There is a
high correlation (0.6) between ownership at baseline and ownership of the registered
number, but phone ownership at baseline provides a more meaningful basis upon which
to estimate heterogeneous treatment effects, as phone registration could have responded
to treatment assignment, and could be changed at any time during the intervention.
Table 6 reports regressions to examine heterogeneity of the impact of the cash
transfer and SMS arms by mobile phone ownership using the full match register book
data as an outcome. Column (1) measures whether impacts of the cash transfer arms
were moderated by phone ownership by including an interaction of phone ownership with
assignment to the cash transfer arms. Phone ownership at baseline was directly
associated with higher rates of facility deliveries (likely due to a wealth effect). Although
statistically insignificant, the point estimate of the interacted term suggests a reduced
effectiveness of the conditional cash transfer for women who own a phone at
baseline. Column (2) reports results of the SMS interventions, again using the fully
matched register book data. As earlier reported (Table 4), neither the plain reminders nor
the contextualized reminders had any measurable impact on facility deliveries. This
stands in contrast to some other studies that have found meaningful effects of reminders
on savings decisions (Karlan et al. 2016) as well as on adherence to anti-retroviral and
malaria treatment (Lester et al. 2010; Pop-Eleches et al. 2011; Raifman et al. 2014).
Column (2) tests whether the treatment effects are different for women who owned their
own phone at baseline. Again, there appears to be little effect of the simple reminders,
for both owners and non-owners – that is, the direct effect and the interaction with phone
ownership are both small in magnitude and statistically insignificant. However, we find a
sizeable (8.9 percentage point), although again imprecisely estimated, impact of the
contextualized reminders on women who did not own a phone at baseline, while phone

23
owners were not affected. One potential interpretation of these suggestive results is that
the CCT or reminders can be effective if a third-party intermediary is engaged to deliver
both the cash, as well as perhaps a face-to-face nudge, to the pregnant woman, although
further research is needed to better understand these findings.
The motivation for the cash transfers was to overcome geographic barriers, by
providing women with the means to pay for transport services. To gain more insight into
this potential mechanism, we generate non-parametric estimates of facility delivery rates
by distance from the nearest clinic. Figure 4 presents our results, comparing estimated
delivery rates as a function of distance across the three cash transfer arms.31 Over the
whole range, women assigned to the conditional transfer arm have higher delivery rates
than the other arms, consistent with the average treatment effects reported in Table 4.
However, there is little meaningful treatment heterogeneity by distance to the nearest
clinic. This is not inconsistent with the fact that the cash transfers were large enough to
cover reasonable transport costs for all women in the sample, so the cost constraint was
made non-binding for everyone, and not just those residing nearer to clinics.
31 Distance is measured between where the baseline interview took place (usually the woman’s home) and the closest health facility. We present the results of a kernel-weighted local polynomial regression of fraction delivered in a facility and distance from the nearest facility for each cash transfer arm. Distance is calculated as the crow flies between the GPS coordinates of the woman's home and the nearest health facility. We impute using the average of observed GPS coordinates in the village for those women with no home GPS measure. For a small fraction of women with missing GPS data, the average latitude and longitude for the village are used. We winsorize the distance data replacing the top and bottom 2 percent of the distance distribution.

24
Figure4:Facilitydeliveryratesbycashtransferstatusanddistancetohealthfacility
(ii) Effects on demand for other services
Table 7 reports treatment effects on other outcomes, including hospital (as
opposed to clinic) deliveries, referrals, and the number of reported ANC and PNC visits.
Information on these outcomes is only available from the endline survey, so we report
results using both the full endline sample, and a sub-sample restricted to those
interviewed at endline whose answers to the delivery question were consistent with the
record book data, according to the full match algorithm. Column (1) reports a regression
in which the dependent variable is equal to one if her endline delivery response is
inconsistent with the record book data. Assignment to the copay voucher plus CCT
seems to be associated with more consistent responses, while those assigned to the UCT
only cell were more inconsistent in their responses. There were, however, no systematic
patterns across the other cells.
Columns (2) and (3) of Panel A report effects of assignment on hospital
deliveries, for the full endline sample and amongst all those whose delivery answers were
.2
.3
.4
.5
.6
Frac
tion
of w
omen
who
del
iver
in fa
cilit
y
0 1000 2000 3000 4000Distance to closest facility, meters
Unconditional Conditional Control kernel = epanechnikov, degree = 0, bandwidth = 160.7
25
consistent with the record books. Similarly, columns (4) and (5) correspondingly report
results for referrals. Having the full voucher and the CCT had a large effect on hospital
delivery, raising it by 13-14 points off a base of about 20 percent (using both samples).
The copay voucher, when coupled with either cash transfer, does have an effect on
hospital deliveries, but not in the absence of a cash transfer. Similarly, CCT or UCT by
itself has no effect. The impacts on referrals follow those for hospital deliveries closely,
suggesting the increase in hospital deliveries might be due to supply-side decisions rather
than demand-side price effects. This in turn might mitigate concerns that a voucher
program could lead to excessive demand at higher-level facilities, if referring health
workers make decisions based primarily on perceived need.
In Panel B of the same table, we report results for regression of ANC and PNC
visits on treatment assignment. In this table, we combine the full voucher and copay
voucher arms, because under both non-delivery services were free (that is, there was no
copayment for ANC or PNC services under the copay voucher arm). Across the board,
we find no noticeable effect of any of the treatments on demand for ANC or PNC
services – only one of the 27 coefficients reports is statistically significant, and then only
at the 10 percent level. These results are likely due to the fact that ANC and PNC
attendance rates are relatively high in our sample – the constants indicate that more than
70 percent of the control group made at least 4 ANC visits, while more than 80 percent
made at least 3 PNC visits.
(iii) Effects of the free-care policy
Our results above (see Table 5) suggest that the government’s policy of free care
had little impact, if any, on the demand for maternal services in the time period we
observe after the policy came into force, in contrast to the full voucher, which similarly
reduced the consumer price to zero.32
A number of reasons could lie behind this finding. First, women may not have
known about the free care policy, although as part of the new government’s platform, it
was widely publicized and discussed in the media. In our endline survey we asked
32 Data from the 2014 Kenyan DHS shows facility delivery rates increased almost linearly between 2009-2014 with no discernable increase in deliveries in 2013 when the policy was first introduced.

26
women if they were aware of the free maternity care policy, and almost all women (93%)
reported knowing about the policy and finding out about the policy while they were
pregnant. It was therefore not likely to not knowing about the policy.
Second, the free care policy might not have reduced all costs associated with
delivery to zero. Our endline survey provides some support to this argument, with
women who did not receive a voucher and who gave birth after June 1, 2013 reporting
average delivery-related expenditures of 782 KSh (about $US10 at the time). Voucher
recipients on the other hand reported costs of 375 KSh on average. This roughly 50
percent cost difference was however much smaller than for women who gave birth before
the free care policy came into effect: women without a voucher reported costs of 1,760
KSh, while voucher recipients paid 337 KSh on average, a difference of 81 percent. The
free care policy appears to have lowered the cost to voucher non-recipients, but only by
about half, and not to zero. This could account for the continued efficacy of the vouchers
in inducing some women to deliver at a facility.
A third reason for the limited impact on observed demand is that supply side
incentives could have reduced quality, at least for those without a voucher, as suggested
by Figure 2. 33 Table 8 examines whether this possibility is borne out in the data,
reporting the results of a quality analysis using the cash transfers and SMS reminders as
instruments in a Heckman selection model, to account for endogenous facility delivery
and participation in the endline survey.34 We do not report the first stage, but include the
33 Our data show that only 30 percent of study subjects believed that the policy would improve quality of health services 34 We collected information on the quality of care the women received during their pregnancy, including information on whether the woman was counseled on such topics as breast-feeding, umbilical cord care and other perinatal care, immunization, and hand-washing, all considered practices that are advantageous the child (Larson et al. 2014). From these questions, using principal component analysis we construct an index of counseling coverage. Women were also asked whether they received potentially important health commodities during their delivery, including antibiotics (or another drug) by intravenous drip, a pill to stop the contraction of the uterus post birth (alluding to the use of misoprostol which is recommended post-partum for most women), manual removal of the placenta, or a blood transfusion. While higher levels of these services are generally understood to be a positive measure of quality, their appropriate use depends on the woman’s needs. From these indicators we constructed a service availability index, also using principal component analysis. We also asked all women who reported having delivered in a health facility to rate the quality of care they received as excellent, very good, good, fair or poor. As measures of perceived quality, we believe the responses to this question are more subjective than the indicators described above. Some questions related to the quality of care delivered at an individual level: how would you rate your experience of being greeted and talked to respectfully?; how would you rate the privacy you were given (e.g. having a curtain)?; and

27
inverse Mills ratio as an independent regressor. The quality measures include indices
constructed for each of the following: (i) whether the woman received various counseling
services during her delivery; (ii) the availability and use of various supplies and materials
such as gloves, gauze, medications, etc.; (iii) a measure of overall respect shown by
facility staff to clients; and (iv) a measure of overall satisfaction. The data used are
reports by those women who delivered in a facility as determined from the register books.
The coefficient on the Mills ratio is only significant in the overall satisfaction regression,
suggesting selection is not consistently biasing the quality results.
Based on this analysis, there is no evidence of any decline in perceived quality
following the introduction of the free maternity care policy on June 1. Although the
evidence is relatively weak, we do find some support for the possibility that before the
policy change, provision of counseling services and respect were perceived to be higher
for voucher recipients (Column (1)). Respect shown to clients appears to have increased
after the June 1st policy change for voucher non-recipients (Column (3)), essentially
converging to that of voucher holders. Other measures of quality did not change
noticeably at that time. One interpretation of the data is that quality levels might have
differed prior to the free-care policy, but this differential was eliminated afterwards. This
result is puzzling, since before the policy change the clinics earned revenue from all
women, including those with and without vouchers, but after the change voucher
recipients likely had a higher marginal effect on clinic revenues. One possible
reconciliation of our observations with the theory is that women without vouchers who
received free care might have revised their quality expectations downward, and reported
greater satisfaction than they otherwise would have. However, we lack data that could be
used to meaningfully test this hypothesis.
7. Cost effectiveness
In this section we provide some simple illustrative back-of-the-envelope estimates
of the cost-effectiveness of the voucher and cash transfer programs at increasing facility
deliveries. Our main results suggest that the combination of full maternity voucher and how would you rate the clarity with which health providers explained things to you? From these questions we calculated an index of respect.

28
conditional cash transfer can increase the rates of facility deliveries by β =11 percentage
points from a control group base of about α = 33 percent. The cost of the full voucher
was approximately v = $33 at the prevailing exchange rate, implying total gross voucher
expenditure per additional facility delivery of (α +β)v / β = $132 .
Of course, private spending by the 33 percent of women in the control group who
delivered in a facility was avoided by the comparable group in the treatment group. Pre-
project negotiations revealed private costs of about w = $23 per pregnancy. Netting out
these savings, the cost per induced delivery falls to v+α(v−w) / β = $63 .
Finally, although the vouchers were financed out of donor-funded project
resources, if the policy were to be financed from the Kenyan budget, the distortionary
costs of raising the necessary funds would have to be considered. We conservatively
assume a distortionary cost of public funds of λ = 0.5 , which is based on recent estimates
of the marginal cost of public funds in African countries (Auriol and Warlters 2012). In
this case the net social cost per induced facility delivery, κ , accounting for both private
cost savings and the marginal cost of raising pubic revenue, is:
κ = (1+λ)v+α (1+λ)v−w[ ]
β= $129 .
Since we do not have information on the health and other benefits of delivering a
child in a facility (although in principle the exogenous variation our experiment induced
could help measure them) it is difficult to say whether the cost of inducing shifts to
facility deliveries was worth it. This would necessarily be the subject of future research.
8. Conclusions
In this paper we report results of a randomized evaluation of two types of
financial incentives delivered over the mobile network aimed at boosting the use of
maternal health care services amongst poor rural women in western Kenya: vouchers and
cash transfers. We also provide evidence of the effectiveness of a free care policy
introduced by the government of Kenya during the course of our experiment. Finally, we
tested the efficacy of text messages delivered over the mobile phone network in
increasing demand for care in this population.

29
Our main findings suggest that at least two of the interventions tested – full
maternity vouchers and conditional cash transfers – were highly effective, and cost
effective, at driving important improvements in facility delivery rates. The combination
of the two incentives shows correspondingly larger, although sub-additive, impacts. On
the other hand, unconditional cash transfers negligible effects on delivery outcomes, and
vouchers with a small copayment had a very small positive but statistically insignificant
effect. Among women who don’t receive any cash transfers, we are able to draw a
moderately strong conclusion about the discontinuity of the demand function at zero as
our point estimate of the impact of the 10 percent copayment is statistically
distinguishable from the (significant) estimate of the effect of the full voucher (p-value
=.083) at the 10% level.
Our second main finding is that simply making maternity services nominally free
through the free maternity care policy had little effect on demand over the time period we
observe, perhaps because the consumer price was not driven all the way to zero, or
because supply-side incentives were not maintained. Indeed, it is notable that the full
voucher, which should not have directly affected demand after the government’s free care
policy went into effect, nonetheless continued to boost delivery services. In addition to
removing cost of care to the consumer, and providing a price incentive for providers, the
voucher may also have provided some additional reminder or incentive to women that
encouraged facility births. Alternatively, women with vouchers could have been able to
elicit higher levels of quality after the introduction of the policy.
Our work confirms the feasibility of delivering financial and informational
incentives over the mobile network to poor women in remote areas. The conditional cash
transfers, which potentially require little in the way of registration and documentation,
could be especially easy to administer at scale. Moreover, our research has also provided
some subtle insights into the potential mechanisms behind effective communication
strategies. For example, our results suggest that women who had text messages sent to
someone else’s phone were more, not less, likely to respond to them. One interpretation
of the observed heterogeneous treatment effect is that the text messages induced face-to-
face engagement by a third party (the owner of the phone), and that such personal

30
interaction was instrumental in inducing behavior change. 35 The influence of the
intermediary also appears to have modulated the impact of the unconditional cash transfer
program. Future research could further investigate the impact of intermediaries in
influencing the effectiveness of m-Health initiatives.
35 A similar effect in a very different context has been observed in a road safety intervention studied by two of the authors (Habyarimana and Jack 2011; Habyarimana and Jack 2014), in which messages to bus passengers motivating them to tell their drivers to slow down appear to be highly effective.

31
References Adhvaryu, Achyuta, and Anant Nyshadham. 2015. “Returns to Treatment in the Formal
Health Care Sector: Evidence From Tanzania..” American Economic Journal: Economic Policy 7 (3): 29–57. doi:10.1257/pol.20120262.
Akachi, Yoko, and Margaret E Kruk. 2017. “Quality of Care: Measuring a Neglected Driver of Improved Health..” Bulletin of the World Health Organization 95 (6): 465–72. doi:10.2471/BLT.16.180190.
Aker, Jenny C, Rachid Boumnijel, Amanda McClelland, and Niall Tierney. 2016. “Payment Mechanisms and Antipoverty Programs: Evidence From a Mobile Money Cash Transfer Experiment in Niger.” Economic Development and Cultural Change Forthcoming (August): 000–000. doi:10.1086/687578.
Alkema, Leontine, Doris Chou, Daniel Hogan, Sanqian Zhang, Ann-Beth Moller, Alison Gemmill, Doris Ma Fat, et al. 2016. “Global, Regional, and National Levels and Trends in Maternal Mortality Between 1990 and 2015, with Scenario-Based Projections to 2030: a Systematic Analysis by the UN Maternal Mortality Estimation Inter-Agency Group.” The Lancet 387 (10017): 462–74. doi:10.1016/S0140-6736(15)00838-7.
Ashraf, Nava, James Berry, and Jesse M Shapiro. 2010. “Can Higher Prices Stimulate Product Use? Evidence From a Field Experiment in Zambia.” American Economic Review 100 (5). American Economic Association: 2383–2413. doi:10.1257/aer.100.5.2383.
Auriol, E, and M Warlters. 2012. “The Marginal Cost of Public Funds and Tax Reform in Africa.” Journal of Development Economics. doi:10.1016/j.jdeveco.2011.01.003.
Baird, S, C McIntosh, and B Özler. 2011. “Cash or Condition? Evidence From a Cash Transfer Experiment.” The Quarterly Journal of Economics 126 (4): 1709–53. doi:10.1093/qje/qjr032.
Barber, Sarah L, and Paul J Gertler. 2010. “Empowering Women: How Mexico's Conditional Cash Transfer Programme Raised Prenatal Care Quality and Birth Weight.” Journal of Development Effectiveness 2 (1). Taylor & Francis: 51–73. doi:10.1080/19439341003592630.
Basinga, Paulin, Paul J Gertler, Agnes Binagwaho, Agnes L B Soucat, Jennifer Sturdy, and Christel M J Vermeersch. 2011. “Effect on Maternal and Child Health Services in Rwanda of Payment to Primary Health-Care Providers for Performance: an Impact Evaluation..” Lancet 377 (9775): 1421–28. doi:10.1016/S0140-6736(11)60177-3.
Benhassine, Najy, Florencia Devoto, Esther Duflo, Pascaline Dupas, and Victor Pouliquen. 2015. “Turning a Shove Into a Nudge? a ‘Labeled Cash Transfer’ for Education.” American Economic Journal: Economic Policy 7 (3): 86–125. doi:10.1257/pol.20130225.
Bonfrer, Igna, Ellen Van de Poel, and Eddy van Doorslaer. 2014. “The Effects of Performance Incentives on the Utilization and Quality of Maternal and Child Care in Burundi.” Social Science & Medicine 123 (December): 96–104. doi:10.1016/j.socscimed.2014.11.004.
Cohen, J, and P Dupas. 2010. “Free Distribution or Cost-Sharing? Evidence From a Randomized Malaria Prevention Experiment.” The Quarterly Journal of Economics.
Darmstadt, Gary L, Anne C C Lee, Simon Cousens, Lynn Sibley, Zulfiqar A Bhutta,

32
France Donnay, Dave Osrin, et al. 2009. “60 Million Non-Facility Births: Who Can Deliver in Community Settings to Reduce Intrapartum-Related Deaths?.” International Journal of Gynaecology and Obstetrics: the Official Organ of the International Federation of Gynaecology and Obstetrics 107 Suppl 1 (October): S89–S112. doi:10.1016/j.ijgo.2009.07.010.
Ellis, Randall, and Thomas McGuire. 1993. “Supply-Side and Demand-Side Cost Sharing in Health Care.” The Journal of Economic Perspectives 7 (4): 135–51.
Habyarimana, James, and William Jack. 2011. “Heckle and Chide: Results of a Randomized Road Safety Intervention in Kenya.” Journal of Public Economics 95 (11-12): 1438–46. doi:10.1016/j.jpubeco.2011.06.008.
Habyarimana, James, and William Jack. 2014. “State Versus Consumer Regulation: an Evaluation of Two Road Safety Interventions in Kenya.” In African Successes, Volume I: Government and Institutions, 307–30. University of Chicago Press.
Haushofer, Johannes, and Jeremy Shapiro. 2016. “The Short-Term Impact of Unconditional Cash Transfers to the Poor: Experimental Evidence From Kenya.” The Quarterly Journal of Economics, July. Oxford University Press, qjw025. doi:10.1093/qje/qjw025.
Heckman, J J. 1976. “The Common Structure of Statistical Models of Truncation, Sample Selection and Limited Dependent Variables and a Simple Estimator for Such Models.” Annals of Economic and Social Measurement.
Hogan, Margaret C, Kyle J Foreman, Mohsen Naghavi, Alan D Lopez, Rafael Lozano, and Christopher J L Murray. 2010. “Maternal Mortality for 181 Countries, 1980-2008: a Systematic Analysis of Progress Towards Millennium Development Goal 5.” Lancet 375 (9726): 1609–23. doi:10.1016/S0140-6736(10)60518-1.
Jack, William, and Tavneet Suri. 2014. “Risk Sharing and Transactions Costs: Evidence From Kenya's Mobile Money Revolution” 104 (1): 183–223. doi:10.1257/aer.104.1.183.
Jehu-Appiah, Caroline, Genevieve Aryeetey, Ernst Spaan, Irene Akua Agyepong, and Rob Baltussen. 2010. “Efficiency, Equity and Feasibility of Strategies to Identify the Poor: an Application to Premium Exemptions Under National Health Insurance in Ghana..” Health Policy (Amsterdam, Netherlands) 95 (2-3): 166–73. doi:10.1016/j.healthpol.2009.11.017.
Karlan, Dean, Margaret McConnell, Sendhil Mullainathan, and Jonathan Zinman. 2016. “Getting to the Top of Mind: How Reminders Increase Saving.” Management Science, January. INFORMS, mnsc.2015.2296. doi:10.1287/mnsc.2015.2296.
Kassebaum, Nicholas J, Amelia Bertozzi-Villa, Megan S Coggeshall, Katya A Shackelford, Caitlyn Steiner, Kyle R Heuton, Diego Gonzalez-Medina, et al. 2014. “Global, Regional, and National Levels and Causes of Maternal Mortality During 1990–2013: a Systematic Analysis for the Global Burden of Disease Study 2013” 384 (9947). Elsevier: 980–1004. doi:10.1016/S0140-6736(14)60696-6.
Kenya National Bureau of Statistics, and ICF Macro. 2010. “Kenya Demographic and Health Survey 2008-09.” Calverton, Maryland: KNBS and ICF Macro.
Kenya National Bureau of Statistics, and The DHS Program. 2015. “Kenya Demographic and Health Survey 2014.” Rockville, MD.
Kremer, M, and E Miguel. 2007. “The Illusion of Sustainability.” The Quarterly Journal of Economics 122 (3): 1007–65. doi:10.1162/qjec.122.3.1007.

33
Kusuma, Dian, Jessica Cohen, Margaret McConnell, and Peter Berman. 2016. “Can Cash Transfers Improve Determinants of Maternal Mortality? Evidence From the Household and Community Programs in Indonesia..” Social Science & Medicine (1982) 163 (August): 10–20. doi:10.1016/j.socscimed.2016.06.020.
Lagarde, Mylene, Andy Haines, and Natasha Palmer. 2009. The Impact of Conditional Cash Transfers on Health Outcomes and Use of Health Services in Low and Middle Income Countries. Edited by Mylene Lagarde. Cochrane Database of Systematic Reviews (Online). Chichester, UK: John Wiley & Sons, Ltd. doi:10.1002/14651858.CD008137.
Larson, Elysia, Sabrina Hermosilla, Angela Kimweri, Godfrey M Mbaruku, and Margaret E Kruk. 2014. “Determinants of Perceived Quality of Obstetric Care in Rural Tanzania: a Cross-Sectional Study..” BMC Health Services Research 14 (1): 483. doi:10.1186/1472-6963-14-483.
Lester, Richard T, Paul Ritvo, Edward J Mills, Antony Kariri, Sarah Karanja, Michael H Chung, William Jack, et al. 2010. “Effects of a Mobile Phone Short Message Service on Antiretroviral Treatment Adherence in Kenya (WelTel Kenya1): a Randomised Trial..” Lancet 376 (9755): 1838–45. doi:10.1016/S0140-6736(10)61997-6.
Lim, Stephen S, Lalit Dandona, Joseph A Hoisington, Spencer L James, Margaret C Hogan, and Emmanuela Gakidou. 2010. “India's Janani Suraksha Yojana, a Conditional Cash Transfer Programme to Increase Births in Health Facilities: an Impact Evaluation..” Lancet 375 (9730): 2009–23. doi:10.1016/S0140-6736(10)60744-1.
Lozano, Rafael, Haidong Wang, Kyle J Foreman, Julie Knoll Rajaratnam, Mohsen Naghavi, Jake R Marcus, Laura Dwyer-Lindgren, et al. 2011. “Progress Towards Millennium Development Goals 4 and 5 on Maternal and Child Mortality: an Updated Systematic Analysis” 378 (9797): 1139–65. doi:10.1016/S0140-6736(11)61337-8.
Manski, Charles F. 1990. “Nonparametric Bounds on Treatment Effects.” The American Economic Review 80 (2). American Economic Association: 319–23. doi:10.2307/2006592?ref=search-gateway:084f2eabecdc23300eab3ba585dc5545.
Pop-Eleches, Cristian, Harsha Thirumurthy, James P Habyarimana, Joshua G Zivin, Markus P Goldstein, Damien de Walque, Leslie MacKeen, et al. 2011. “Mobile Phone Technologies Improve Adherence to Antiretroviral Treatment in a Resource-Limited Setting: a Randomized Controlled Trial of Text Message Reminders.” AIDS (London, England) 25 (6): 825–34. doi:10.1097/QAD.0b013e32834380c1.
Powell-Jackson, Timothy, and Kara Hanson. 2012. “Financial Incentives for Maternal Health: Impact of a National Programme in Nepal.” Journal of Health Economics 31 (1): 271–84. doi:10.1016/j.jhealeco.2011.10.010.
Powell-Jackson, Timothy, Sumit Mazumdar, and Anne Mills. 2015. “Financial Incentives in Health: New Evidence From India's Janani Suraksha Yojana.” Journal of Health Economics 43 (September): 154–69. doi:10.1016/j.jhealeco.2015.07.001.
Raifman, Julia R G, Heather E Lanthorn, Slawa Rokicki, and Günther Fink. 2014. “The Impact of Text Message Reminders on Adherence to Antimalarial Treatment in Northern Ghana: a Randomized Trial.” Edited by Laurence Slutsker. PLoS ONE 9 (10). Public Library of Science: e109032. doi:10.1371/journal.pone.0109032.
Ronsmans, Carine, S Scott, S N Qomariyah, E Achadi, D Braunholtz, T Marshall, E

34
Pambudi, K H Witten, and W J Graham. 2009. “Professional Assistance During Birth and Maternal Mortality in Two Indonesian Districts..” Bulletin of the World Health Organization 87 (6): 416–23. doi:10.2471/BLT.08.051581.
Sacks, Emma, Daniel Vail, Katherine Austin-Evelyn, Dana Greeson, Lynn M Atuyambe, Mubiana Macwan'gi, Margaret E Kruk, and Karen A Grépin. 2015. “Factors Influencing Modes of Transport and Travel Time for Obstetric Care: a Mixed Methods Study in Zambia and Uganda.” Health Policy and Planning, June. Oxford University Press, czv057. doi:10.1093/heapol/czv057.
Schmidt, Jean-Olivier, Tim Ensor, Atia Hossain, and Salam Khan. 2010. “Vouchers as Demand Side Financing Instruments for Health Care: a Review of the Bangladesh Maternal Voucher Scheme.” Health Policy (Amsterdam, Netherlands) 96 (2): 98–107. doi:10.1016/j.healthpol.2010.01.008.
Scott, S, and C Ronsmans. 2009. “The Relationship Between Birth with a Health Professional and Maternal Mortality in Observational Studies: a Review of the Literature.” Tropical Medicine & International Health : TM & IH 14 (12): 1523–33. doi:10.1111/j.1365-3156.2009.02402.x.
Sondaal, Stephanie Felicie Victoria, Joyce Linda Browne, Mary Amoakoh-Coleman, Alexander Borgstein, Andrea Solnes Miltenburg, Mirjam Verwijs, and Kerstin Klipstein-Grobusch. 2016. “Assessing the Effect of mHealth Interventions in Improving Maternal and Neonatal Care in Low- and Middle-Income Countries: a Systematic Review.” Edited by Dongmei Li. PLoS ONE 11 (5): e0154664. doi:10.1371/journal.pone.0154664.
Suri, T, and W Jack. 2016. “The Long-Run Poverty and Gender Impacts of Mobile Money.” Science (New York, NY). doi:10.1126/science.aah5309.
Suri, Tavneet, William Jack, and Thomas M Stoker. 2012. “Documenting the Birth of a Financial Economy..” Proceedings of the National Academy of Sciences of the United States of America 109 (26): 10257–62. doi:10.1073/pnas.1115843109.
Trandafir, M, and N M Daysal. 2015. “Saving Lives at Birth: the Impact of Home Births on Infant Outcomes.” American Economic Journal: Applied Economics.
Van de Poel, Ellen, Gabriela Flores, Por Ir, and Owen O’Donnell. 2016. “Impact of Performance-Based Financing in a Low-Resource Setting: a Decade of Experience in Cambodia.” Health Economics 25 (6): 688–705. doi:10.1002/hec.3219.

Table 1: Summary of treatment assignmentsPanel A: Endline eligible sample at baseline
Full Copay None TotalUCT 160 144 154 458CCT 172 166 143 481None 139 161 275 575Total 471 471 572 1514
Panel B: Endline eligible sample that completed endline surveyFull Copay None Total
UCT 149 139 140 428CCT 168 160 141 469None 130 150 224 504Total 447 449 505 1401
Panel C: SMS treatment assignmentBaseline Endline
Plain 606 556Contextual 334 311None 574 534Total 1514 1401Notes: Panel A summarizes the endline-eligible sample at baseline, which excludes women who died (n=2), miscarried (n=72), or turned out to not be pregnant (n=7) among the 1,595 women originally recruited. Treatment status did not predict any of these exclusions (not shown, but available upon request). Panel B summarizes the sample who were found, consented, and completed the endline among those eligible to complete the survey. Panel C reports on the experimental sample for our SMS interention and is orthologal to the other interventions.
Table 2: Balance Test(1) (2) (3) (4) (5) (6) (7) (8)
Panel A: Maternity Voucher ArmsFull Copay Full Sample Full Sample (1) vs. (2) (1) vs. (3) (2) vs. (3) p-value
Age, in years 26.246 26.255 26.455 26.328 -0.008 -0.208 -0.200 0.818 (0.272) (0.278) (0.262) (0.156) (0.389) (0.380) (0.383)Married 0.752 0.790 0.808 0.785 -0.038 -0.056** -0.018 0.086 (0.020) (0.019) (0.016) (0.011) (0.027) (0.026) (0.025)Head of household 0.227 0.202 0.217 0.215 0.025 0.010 -0.015 0.633 (0.019) (0.019) (0.017) (0.011) (0.027) (0.026) (0.025)Completed more than primary education 0.369 0.361 0.313 0.345 0.008 0.056* 0.048 0.113 (0.022) (0.022) (0.019) (0.012) (0.031) (0.029) (0.029)Owns a phone 0.658 0.614 0.656 0.643 0.045 0.003 -0.042 0.267 (0.022) (0.022) (0.020) (0.012) (0.031) (0.030) (0.030)Number of household members, n 4.032 4.045 3.913 3.991 -0.013 0.119 0.132 0.496 (0.094) (0.095) (0.081) (0.052) (0.134) (0.123) (0.124)Has lights 0.051 0.021 0.033 0.035 0.030** 0.018 -0.012 0.044 (0.010) (0.007) (0.007) (0.005) (0.012) (0.012) (0.010)Has clean water 0.527 0.544 0.510 0.526 -0.017 0.016 0.033 0.568 (0.023) (0.023) (0.021) (0.013) (0.033) (0.031) (0.031)Has a traditional roof 0.068 0.079 0.094 0.081 -0.010 -0.026 -0.016 0.292 (0.012) (0.012) (0.012) (0.007) (0.017) (0.017) (0.018)Weeks pregnant at recruitment, weeks 19.500 21.833 20.575 20.537 -2.333 -1.075 1.258 0.684 (1.735) (2.118) (1.334) (0.940) (2.716) (2.185) (2.443)Has had prior ANC for this pregnancy 0.564 0.506 0.495 0.520 0.057* 0.069** 0.012 0.066 (0.023) (0.023) (0.021) (0.013) (0.033) (0.031) (0.031)Has seen a doctor for this pregnancy 0.634 0.567 0.599 0.601 0.067 0.035 -0.031 0.311 (0.030) (0.032) (0.029) (0.017) (0.044) (0.042) (0.043)Has seen a TBA for this pregnancy 0.030 0.055 0.092 0.060 -0.024 -0.061*** -0.037 0.009 (0.011) (0.015) (0.017) (0.008) (0.018) (0.020) (0.023)Number of ANC visits for this pregnancy, n 1.883 1.891 2.000 1.928 -0.008 -0.117 -0.109 0.391 (0.069) (0.071) (0.067) (0.040) (0.099) (0.096) (0.098)Observations 471 471 572 1514 942 1043 1043
Panel B: Cash Transfer ArmsUCT CCT Control Full Sample (1) vs. (2) (1) vs. (3) (2) vs. (3) p-value
Age, in years 26.299 26.291 26.381 26.328 0.008 -0.082 -0.090 0.965 (0.276) (0.275) (0.260) (0.156) (0.390) (0.382) (0.380)Married 0.779 0.796 0.779 0.785 -0.017 0.000 0.017 0.756 (0.019) (0.018) (0.017) (0.011) (0.027) (0.026) (0.025)Head of household 0.231 0.195 0.219 0.215 0.036 0.012 -0.024 0.391 (0.020) (0.018) (0.017) (0.011) (0.027) (0.026) (0.025)Completed more than primary education 0.343 0.349 0.344 0.345 -0.006 -0.002 0.005 0.976 (0.022) (0.022) (0.020) (0.012) (0.031) (0.030) (0.029)Owns a phone 0.646 0.651 0.635 0.643 -0.004 0.012 0.016 0.854 (0.022) (0.022) (0.020) (0.012) (0.031) (0.030) (0.030)Number of household members, n 3.950 4.046 3.977 3.991 -0.096 -0.028 0.068 0.750 (0.094) (0.090) (0.085) (0.052) (0.130) (0.127) (0.124)Has lights 0.041 0.023 0.040 0.035 0.019 0.001 -0.017 0.214 (0.009) (0.007) (0.008) (0.005) (0.011) (0.012) (0.011)Has clean water 0.528 0.522 0.527 0.526 0.007 0.001 -0.005 0.977 (0.023) (0.023) (0.021) (0.013) (0.033) (0.031) (0.031)Has a traditional roof 0.063 0.090 0.089 0.081 -0.026 -0.025 0.001 0.241 (0.011) (0.013) (0.012) (0.007) (0.017) (0.017) (0.018)Weeks pregnant at recruitment 18.611 22.657 19.172 20.537 -4.046* -0.561 3.485 0.147 (1.591) (1.459) (1.676) (0.940) (2.336) (2.473) (2.213)Has had prior ANC for this pregnancy 0.507 0.518 0.532 0.520 -0.011 -0.026 -0.014 0.711 (0.023) (0.023) (0.021) (0.013) (0.033) (0.031) (0.031)Has seen a doctor for this pregnancy 0.515 0.677 0.605 0.601 -0.162*** -0.090** 0.073* 0.001 (0.033) (0.030) (0.028) (0.017) (0.044) (0.043) (0.041)Has seen a TBA for this pregnancy 0.047 0.069 0.062 0.060 -0.021 -0.015 0.006 0.600 (0.014) (0.016) (0.014) (0.008) (0.021) (0.020) (0.021)Number of ANC visits for this pregnancy, n 1.858 1.891 2.010 1.928 -0.033 -0.151 -0.119 0.243
(0.077) (0.067) (0.064) (0.040) (0.101) (0.099) (0.093)Observations 458 481 575 1514 939 1033 1056Notes: Panel A shows selected means and standard errors in parentheses across the Full, Copay, and control maternity voucher arms in columns (1)-(3) while Panel B shows the same values for the Conditional, Unconditional, and control arms for the cash transfer arms. In both panels, column (4) shows the means for the full endline eligible sample. Columns (5)-(7) show pairwise comparisons of means between the various study arms. Column (8) reports the p-value for the test that all study arms have the same mean. All variables are measured at baseline and are binary unless otherwise stated. ***, ** and * indicate statistical significance at the 1, 5 and 10 percent level respectively.

Table 3: Attrition analysis(1) (2) (3)
Panel A: Saturated Model All attrition Not found No consentFull Voucher -0.052*** -0.0015 -0.051***
(0.016) (0.011) (0.013)Copay Voucher -0.060*** -0.0037 -0.056***
(0.016) (0.011) (0.013)UCT -0.050*** 0.0069 -0.057***
(0.018) (0.012) (0.013)CCT -0.088*** -0.026*** -0.062***
(0.015) (0.0090) (0.012)SMS: Plain 0.0084 -0.0059 0.014
(0.015) (0.0098) (0.012)SMS: Contextual -0.0031 -0.0041 0.0011
(0.017) (0.011) (0.013)Constant 0.15*** 0.040*** 0.11***
(0.019) (0.011) (0.017)
Panel B: Unsaturated Model All attrition Not found No consentFull Voucher * UCT -0.12*** 0.0081 -0.12***
(0.031) (0.018) (0.026)Full Voucher * CCT -0.16*** -0.018 -0.14***
(0.026) (0.013) (0.023)Full Voucher * No Transfer -0.12*** 0.0071 -0.13***
(0.032) (0.019) (0.026)Copay Voucher * UCT -0.15*** -0.0085 -0.14***
(0.028) (0.016) (0.024)Copay Voucher * CCT -0.15*** -0.017 -0.13***
(0.028) (0.013) (0.025)Copay Voucher * No Transfer -0.12*** 0.014 -0.13***
(0.031) (0.019) (0.025)UCT Only -0.095*** 0.036 -0.13***
(0.033) (0.022) (0.025)CCT Only -0.17*** -0.029*** -0.14***
(0.025) (0.010) (0.024)SMS: Plain 0.0082 -0.0066 0.015
(0.015) (0.0098) (0.012)SMS: Contextual -0.0019 -0.0045 0.0026
(0.017) (0.011) (0.013)Constant 0.18*** 0.033*** 0.15***
(0.024) (0.012) (0.022)
Observations 1514 1514 1514Dependent Variable Mean 0.075 0.028 0.046Notes: The dependent variables in each column correspond to three forms of attrition. Column (1) takes the value 1 if the woman cannot be found or does not consent to the endline survey and 0 otherwise. Column (2) takes the value 1 if woman cannot be found at endline and 0 otherwise. Column (3) takes the value of 1 if the woman is found but does not provide consent for the endline and 0 otherwise. Standard errors in parentheses clustered at the village level. ***, ** and * indicate statistical significance at the 1, 5 and 10 percent level respectively.

Table 4: Impact of Vouchers and Cash Transfers on Facility Delivery(1) (2) (3) (4) (5)
Panel A: Unsaturated ModelEndline Data Lower Manski
BoundUpper Manski
BoundPartial Match Full Match
Full Voucher 0.064*** 0.027 0.12*** 0.047 0.072**(0.023) (0.024) (0.023) (0.031) (0.031)
Copay Voucher 0.037 0.0041 0.10*** 0.041 0.043(0.024) (0.025) (0.024) (0.031) (0.030)
UCT 0.040 -0.0013 0.10*** -0.012 -0.029(0.024) (0.025) (0.024) (0.032) (0.030)
CCT 0.055** 0.050** 0.11*** 0.079** 0.085***(0.023) (0.024) (0.023) (0.031) (0.031)
SMS: Plain -0.0023 0.0034 -0.013 -0.0051 -0.013(0.021) (0.022) (0.021) (0.029) (0.028)
SMS: Contextual -0.022 -0.0093 -0.028 0.0050 0.016(0.026) (0.027) (0.026) (0.034) (0.034)
Constant 0.79*** 0.79*** 0.70*** 0.46*** 0.33***(0.025) (0.024) (0.026) (0.030) (0.029)
Panel B: Saturated ModelEndline Data Lower Manski
BoundUpper Manski
BoundPartial Match Full Match
Full Voucher * UCT 0.11*** 0.011 0.26*** 0.032 0.031(0.038) (0.038) (0.038) (0.050) (0.048)
Full Voucher * CCT 0.12*** 0.058* 0.27*** 0.096** 0.14***(0.037) (0.035) (0.037) (0.049) (0.048)
Full Voucher * No Transfer 0.097** -0.0018 0.25*** 0.078 0.11**(0.041) (0.041) (0.040) (0.052) (0.051)
Copay Voucher * UCT 0.11*** 0.040 0.26*** 0.045 0.030(0.039) (0.038) (0.039) (0.052) (0.049)
Copay Voucher * CCT 0.084** 0.011 0.23*** 0.13*** 0.15***(0.040) (0.038) (0.040) (0.049) (0.048)
Copay Voucher * No Transfer 0.054 -0.044 0.21*** 0.0038 0.010(0.042) (0.041) (0.041) (0.050) (0.047)
UCT Only 0.035 -0.081* 0.20*** -0.033 -0.032(0.044) (0.043) (0.042) (0.050) (0.047)
CCT Only 0.11*** 0.053 0.25*** 0.090* 0.087*(0.039) (0.037) (0.040) (0.052) (0.050)
SMS: Plain -0.0019 0.0056 -0.013 -0.0062 -0.015(0.021) (0.022) (0.021) (0.029) (0.028)
SMS: Contextual -0.022 -0.0081 -0.031 0.0047 0.016(0.026) (0.027) (0.026) (0.034) (0.034)
Constant 0.78*** 0.81*** 0.64*** 0.46*** 0.33***(0.031) (0.027) (0.032) (0.035) (0.033)
Ftests(p-values)CCT = UCT: Including voucher interaction parameters 0.34 0.039 0.0053CCT = UCT: Excluding voucher interaction parameters 0.093 0.034 0.033Copay = Full: Including cash transfer interaction parameters 0.57 0.53 0.39Copay = Full: Excluding cash transfer interaction parameters 0.32 0.20 0.083
Observations 1401 1514 1514 1514 1514Dependent Variable Mean 0.85 0.85 0.85 0.51 0.39Notes: This table provides linear probability estimates of the impact of treatments on facility delivery, which is defined in different ways. In column (1), the dependent variable takes on the value of 1 if the woman reports delivering in a facility in endline survey or 0 otherwise. In Column (4) the dependent variable takes on the value of 1 if the woman's delivery is partially matched to the register books using methodology described in the text while column (5) uses the full match algorithm instead. Columns (2) and (3) represent delivery outcomes that account for attrition following Manski (1990). The Lower Manski Bound assumes facility delivery for attrited controls and home delivery for attriting treated observations. The Upper Manski Bound assumes institutional deliveries for those who attrited from the treatment group. Standard errors in parentheses clustered at the village level. ***, ** and * indicate statistical significance at the 1, 5 and 10 percent level respectively.

Table 5: Impact of Free Delivery Policy on Facility Delivery
(1) (2) (3)Panel A: Unsaturated Model Full Sample Before June 1 After June 1Full Voucher 0.072** 0.082 0.072**
(0.031) (0.059) (0.036)Copay Voucher 0.044 0.010 0.060*
(0.030) (0.055) (0.036)UCT -0.030 -0.039 -0.025
(0.030) (0.056) (0.036)CCT 0.085*** 0.052 0.100***
(0.031) (0.057) (0.037)SMS: Plain -0.013 -0.0027 -0.018
(0.028) (0.053) (0.033)SMS: Contextual 0.016 -0.078 0.056
(0.034) (0.060) (0.040)Post-Jun1 0.027
(0.027)Constant 0.31*** 0.35*** 0.32***
(0.035) (0.055) (0.034)
Observations 1514 436 1078Chow Test (p-value)
Panel B: Saturated Model Full Sample Before June 1 After June 1Full Voucher * UCT 0.029 -0.022 0.052
(0.048) (0.093) (0.056)Full Voucher * CCT 0.14*** 0.16* 0.13**
(0.048) (0.087) (0.058)Full Voucher * No Transfer 0.11** 0.065 0.12**
(0.051) (0.098) (0.060)Copay Voucher * UCT 0.030 0.015 0.040
(0.049) (0.089) (0.059)Copay Voucher * CCT 0.14*** 0.021 0.20***
(0.048) (0.086) (0.058)Copay Voucher * No Transfer 0.010 -0.025 0.028
(0.047) (0.086) (0.057)UCT Only -0.033 -0.066 -0.020
(0.047) (0.087) (0.055)CCT Only 0.085* 0.022 0.11*
(0.050) (0.096) (0.059)SMS: Plain -0.015 0.0011 -0.023
(0.028) (0.054) (0.033)SMS: Contextual 0.016 -0.077 0.051
(0.034) (0.061) (0.041)Post-Jun1 0.026
(0.027)Constant 0.32*** 0.36*** 0.32***
(0.038) (0.061) (0.039)
Observations 1514 436 1078Chow Test (p-value)
0.38
0.51
Dependent Variable: Full Match Facility Delivery
Notes: This table presents two tests for changes in the delivery specification before and after June 1. The dependent variable takes on the value of 1 if the woman's delivery is a full match with the register books. Column (1) is the estimate for all endline eligible women, while column (2) estimates the model for women with expected delivery dates before June 1, 2013 and column (3) estimates it for women with expected due dates after that date. Standard errors in parentheses clustered at the village level. ***, ** and * indicate statistical significance at the 1, 5 and 10 percent level respectively.

Table 6: Impact of Cash Transfers, SMS and Phone Ownership on Facility Delivery(1) (2)
Full Voucher 0.072** 0.073**(0.031) (0.031)
Copay Voucher 0.045 0.045(0.030) (0.030)
UCT 0.034 -0.027(0.050) (0.030)
CCT 0.13** 0.084***(0.050) (0.031)
SMS: Plain -0.013 -0.00055(0.028) (0.046)
SMS: Contextual 0.018 0.089(0.034) (0.056)
Own Phone 0.074* 0.056(0.041) (0.042)
UCT*Own Phone -0.099(0.062)
CCT*Own Phone -0.070(0.063)
SMS: Plain * Own Phone -0.020(0.058)
SMS: Contextual * Own Phone -0.11(0.071)
Constant 0.28*** 0.30***(0.038) (0.039)
Observations 1514 1514Notes: This table presents linear probability estimates of the impact of cash transfers interacted with phone ownership on facility delivery. Data on faciity deliveries comes from the register book data. Standard errors in parentheses clustered at the village level. ***, ** and * indicate statistical significance at the 1, 5 and 10 percent level respectively.
Dependent Variable: Full Match facility delivery

Table 7: Impact of Voucher and Transfer treatments on other maternal services(1) (3) (4) (5) (6)
Panel A: Hospital Deliveries and Referrals
Inconsistent: Full Match
Hospital: Full Sample
Hospital: Consistent
Only
Referral: Full Sample
Referral: Consistent
OnlyFull Voucher * UCT 0.068 0.064 0.087 0.061 0.099
(0.053) (0.044) (0.062) (0.039) (0.062)Full Voucher * CCT -0.032 0.14*** 0.11** 0.11*** 0.12**
(0.051) (0.045) (0.057) (0.040) (0.056)Full Voucher * No Transfer 0.0061 0.060 0.093 0.070* 0.027
(0.055) (0.047) (0.063) (0.042) (0.053)Copay Voucher * UCT 0.069 0.082* 0.14** 0.039 0.074
(0.054) (0.046) (0.066) (0.039) (0.061)Copay Voucher * CCT -0.068 0.083* 0.11* 0.070* 0.090*
(0.051) (0.044) (0.057) (0.039) (0.054)Copay Voucher * No Transfer 0.071 0.0082 -0.0093 -0.0016 0.025
(0.053) (0.042) (0.055) (0.035) (0.055)UCT Only 0.12** 0.022 -0.015 0.017 0.023
(0.054) (0.044) (0.057) (0.038) (0.060)CCT Only 0.057 0.023 0.039 0.015 0.045
(0.054) (0.043) (0.059) (0.036) (0.056)SMS: Plain 0.0027 0.028 -0.023 -0.0018 -0.041
(0.030) (0.026) (0.036) (0.023) (0.036)SMS: Contextual -0.042 -0.0090 -0.036 -0.023 -0.043
(0.036) (0.030) (0.040) (0.026) (0.040)Constant 0.46*** 0.18*** 0.18*** 0.10*** 0.11***
(0.037) (0.030) (0.040) (0.026) (0.040)
Inconsistent self reports included Y N Y NObservations 1401 1401 877 1189 694
Panel B: ANC and PNC visits 4+ANC 4+ANC 3+PNC 3+PNCAny Voucher * No Transfer 0.038 0.069 -0.011 -0.0090
(0.040) (0.055) (0.035) (0.047)UCT Only 0.034 -0.012 -0.0059 -0.0014
(0.048) (0.075) (0.041) (0.060)CCT Only 0.026 0.053 -0.019 -0.026
(0.048) (0.068) (0.042) (0.058)Any Voucher * UCT -0.034 -0.019 0.026 -0.0033
(0.060) (0.091) (0.053) (0.076)Any Voucher * CCT -0.042 -0.095 -0.027 -0.024
(0.060) (0.083) (0.053) (0.073)SMS: Plain 0.022 -0.0020 -0.018 0.014
(0.026) (0.038) (0.025) (0.035)SMS: Contextual -0.014 -0.037 0.033 0.063*
(0.032) (0.044) (0.027) (0.037)Constant 0.72*** 0.71*** 0.84*** 0.82***
(0.034) (0.048) (0.029) (0.040)
Inconsistent self reports included Y N Y NObservations 1371 711 1309 686
Note: I restrict the samples using the fuzzy match as the truth and throwing out observations that report different delivery outcomes than the fuzzy match.
Notes: This table presents linear probability estimates of the impact of experimental treatments on other delivery outcomes. In Panel A Columns (1) and (2) start by indicating the impact of treatments on misreporting delivery based on the partial (1) and full (2) matches. Columns (4) and (6) exclude all observations that are not identified as having delivered in a facility using the partial match. In Panel B, we examine the impact of treatments on recommended utilization of ANC (at least four visits) and PNC (3 visits). Note that since there was no co-pay for these services, the voucher arms are collapsed into one treatment. Standard errors

Table 8: Impact of treatments and free-maternity care on reported quality measures, Heckman corrections(1) (2) (3) (4)
Index of Counseling
servicesIndex of Goods
and Services
Respect: Excellent and
very good
Overall Satisfaction with
Delivery
Full Voucher 0.51** 0.0018 0.29 0.14(0.20) (0.22) (0.23) (0.11)
Copay Voucher 0.32* -0.12 0.37* 0.084(0.19) (0.20) (0.21) (0.10)
Full voucher*Post June 1 -0.31 0.100 -0.51** -0.21*(0.22) (0.23) (0.25) (0.12)
Copay voucher*Post June 1 -0.11 0.31 -0.54** -0.033(0.23) (0.24) (0.25) (0.12)
Post-Jun1 0.24 0.0012 0.50*** 0.11(0.16) (0.17) (0.18) (0.084)
SMS: Reminder 0.058 -0.074 -0.074 -0.0071(0.093) (0.098) (0.11) (0.050)
SMS: Contextual 0.082 -0.045 -0.085 -0.0078(0.11) (0.11) (0.12) (0.059)
Constant -0.71 -0.074 0.38 1.05***(0.48) (0.53) (0.55) (0.27)
Inverse mills ratio 0.39 0.060 -0.65 -0.44*(0.40) (0.43) (0.46) (0.23)
Observations 1461 1440 1461 1479
Chow tests (p-values)Free Regime Not Different 0.38 0.29 0.05 0.28Voucher Recipients No different in Free Regime" 0.37 0.42 0.05 0.17Notes: This table presents Heckman selection estimates of the impact of voucher assignment on the quality of services reported by women. The first stage probit is not reported (available on request). Column (1) & (2) represent indices of counseling and services inputs. Column 3 is an index of how respectful facility staff were and column 4 is an indicator for overall satisfaction with the delivery. We use an indicator for assignment to the conditional cash transfer as our instrument for the first stage. Standard errors in parentheses clustered at the village level. ***, ** and * indicate statistical significance at the 1, 5 and 10 percent level respectively.

Appendix Table 1: Prevaling prices, voucher face values, and transport subsidy amounts
Maternity VouchersControl group Full voucher Copay voucher Face value
First ANC visit 120-150 0 0 250Subsequent ANC visits 0-50 0 0 100Normal delivery 300-1,500 0 100 800-2,000C-section 7,000-9,000 0 100 10,000PNC visits 0 0 0 100
Cash transfers Transfer amountEach ANC visit (up to four) 250Delivery 500Each PNC visit (up to three) 250Notes: ANC=Antenatal care; PNC= Postnatal care. Prevaling prices paid by women in the control value was estimated from a small non-random survey of women in catchment area prior to launch of study.

Appendix Table 2: Description of SMS remindersVisit Plain reminder Contextualized reminderANC 1 Your next pregnancy checkup is due soon. Remember
to set some time aside to visit a clinic in the coming weeks.
Keep your baby healthy and safe. Your next pregnancy checkup is due soon. Remember to set some time aside to visit a clinic in the coming weeks
ANC 1 It's about time for your next pregnancy checkup. If you haven't already done so, remember to visit a clinic within the coming days.
Do you know if your baby is healthy and safe? It's about time for your next pregnancy checkup. If you haven't already done so, remember to visit a clinic within the coming days.
ANC 2 Your next pregnancy checkup is due soon. Remember to set some time aside to visit a clinic in the coming weeks.
Stay strong for your baby. Your next pregnancy checkup is due soon. Remember to set some time aside to visit a clinic in the coming weeks.
ANC 2 It's about time for your next pregnancy checkup. If you haven't already done so, remember to visit a clinic within the coming days.
ANC visits help prevent premature births. It's about time for your next pregnancy checkup. If you haven't already done so, remember to visit a clinic within the coming days.
ANC 3 Your next pregnancy checkup is due soon. Remember to set some time aside to visit a clinic in the coming weeks.
Prevent Malaria from making your baby sick. Your next pregnancy checkup is due soon. Remember to set some time aside to visit a clinic in the coming weeks.
ANC 3 It's about time for your next pregnancy checkup. If you haven't already done so, remember to visit a clinic within the coming days.
ANC visits help prevent low birth weight. It's about time for your next pregnancy checkup. If you haven't already done so, remember to visit a clinic within the coming days
ANC 4 Your next pregnancy checkup is due soon. Remember to set some time aside to visit a clinic in the coming weeks.
Make sure your baby is healthy. Your next pregnancy checkup is due soon. Remember to set some time aside to visit a clinic in the coming weeks
ANC 4 It's about time for your next pregnancy checkup. If you haven't already done so, remember to visit a clinic within the coming days.
Make sure you know proper baby care. It's about time for your next pregnancy checkup. If you haven't already done so, remember to visit a clinic within the coming days.
Delivery Your baby will be arriving soon. Find out the fastest way to get to a clinic where you can have a safe delivery.
Delivering at a clinic means someone can help your baby if there is a problem. Your baby will be arriving soon. Find out the fastest way to get to a clinic where you can have a safe delivery.
Delivery Your delivery date is approaching. If you haven't already done so, make arrangements for your clinic delivery.
Clinic deliveries save lives. Your delivery date is approaching. If you haven't already done so, make arrangements for your clinic delivery
Postnatal 1 It is important to visit a clinic after your delivery. Make sure to visit the clinic 2 days after your delivery or as soon as possible.
Your baby relies on you for care. It is important to visit a clinic after your delivery. Make sure to visit the clinic 2 days after your delivery or as soon as possible.
Postnatal 2 You should bring your baby for a postnatal checkup 2 weeks after your delivery. Make sure to set some time aside to visit the clinic.
New babies need immunizations. You should bring your baby for a postnatal checkup 2 weeks after your delivery. Make sure to set some time aside to visit the clinic
Postnatal 2 Remember you and your baby should have a postnatal checkup 2 weeks after your delivery. If you haven't already done so, visit a clinic within the coming days
Your baby needs regular care. Remember you and your baby should have a postnatal checkup 2 weeks after your delivery. If you haven't already done so, visit a clinic within the coming days.
Postnatal 3 You should bring your baby for a postnatal checkup 4 weeks after your delivery. Make sure to set some time aside to visit the clinic in the coming weeks.
Is your baby healthy? You should bring your baby for a postnatal checkup 4 weeks after your delivery. Make sure to set some time aside to visit the clinic in the coming weeks.
Postnatal 3 You should bring your baby for a postnatal checkup 4 weeks after your delivery. Make sure to set some time aside to visit the clinic in the coming weeks.
Your baby’s health is important. Remember you and your baby should have a postnatal checkup 4 weeks after your delivery. If you haven't already done so, visit a clinic within the coming days.

Appendix Table 3: Full description of attrition from sampleFull sample at recruitment 1595
Died 7Not pregnant 2Miscarried 72
Eligible for endline 1514
Not found 43No consent 70
Endline completed 1401Notes: This table shows the composition of the study sample from the pilot phase, through recruitment and finally the number available at the endline survey 12-18 months after recruitment.