Embed Size (px)
Citation preview

Arms Makers for Responsible Citizens®
STURM, RUGER & CO., INC.Lacey Place, Southport, CT 06890 U.S.A.
www.ruger.com
Sturm, Ruger & Company, Inc.
2004 Annual Report

To Our Stockholders 1
www.ruger.com
2004 was, in some respects, a disappointing year. However, we have paved a solid roadfor the future with an array of new products, improved production facilities, and retooledproduction lines.
The year began with a host of new Ruger product announcements; indeed, themost we have offered since 1982. Perhaps we were a bit too ambitious and tried toaccomplish too much at once. But our newly reconstructed design staff was bursting withnew ideas, and it took more time than anticipated in 2004 to transform these many newdesign concepts into finished products. The good news is that most of this is now behindus, and we enter 2005 full of enthusiasm for the year ahead.
Our Board of Directors adjusted the dividend downward in July, 2004 in recognition ofunexpectedly low earnings, due in large measure to our inability at that time to fill demandevidenced by outstanding orders for our new products. It was felt that putting somecorporate resources back into renovated and updated production facilities for both our firearms and castings segments would ultimately pay dividends in both the literal andfigurative senses. We are proceeding in this fashion, and trust that our shareholders understand that we constantly monitor our dividend rate to ascertain that it is prudent and correct, given the status of Company operations at the time. We believe that Sturm, Ruger remains an attractive investment as well as an industry leader.
We look forward to 2005 being perhaps what 2004 should have been. A great number of new products, heretofore delayed by unforseen pre-production setbacks, are now available in quantity, and are being made better than ever due to advanced machiningtechniques. 2004’s many new products are rapidly being augmented by our newlyannounced firearms products for early 2005. These include our 50th Anniversary Blackhawk,an entirely new authentically-sized New Vaquero line, the innovative Ruger M77MKII Frontierrifle, and the powerful new Ruger Super Redhawk Alaskan revolver. Our popular Mini-14 linehas been retooled and is back in full production, along with some exciting new variations ofthis classic Ranch Rifle. Gold Label side-by-sides are now being produced in quantity,although demand still far exceeds their supply. New Bearcats are also in full production, asare the New Model Single Six Hunters in the new high velocity .17 calibers, as are No. 1 andM77MKII rifles in the popular .204 Ruger caliber, which won 2004’s coveted ShootingIndustry “Rifle of the Year” award.
New products from our Prescott, Arizona plant include our immensely popular P345, Mark III, and totally redesigned 22/45 pistols, all new in 2004 and now in full production. We spent a great deal of time, effort, and money to refurbish the former Dorr Woolen facilityadjacent to our plant in Newport, New Hampshire to become a state-of-the-art titaniumprecision investment casting foundry, which we now believe to be the fourth largest suchfacility in the world. Our outside foundry business was up considerably in 2004, and weintend to keep expanding this segment of our business even as we continually expand andmodernize our firearms product lines.
We welcome Randell Pence as our new Executive Director of Sales and Marketing.Randell is extremely well qualified for this important position, having spent his entire workinglife in the firearms business. He has been previously employed in both retail and wholesalefirearms sales, and has served as in-house sales manager for a major optics manufacturer.

To Our Stockholders(Continued)
For the last seven years, he has been the Company’s southeastern U.S. salesrepresentative, and is highly thought of by his many industry contacts. He will help usachieve our goal of increased sales, and I know he is quite enthusiastic about the manyopportunities offered by our record number of new products.
Our website continues to be expanded and modernized, with many popular features.We had over four million visitors to this site in 2004 alone, and we view this as yet anothermethod to get detailed information about our Company and its products to customers,distributors, and our shareholders.
The Ruger Studio of Art and Decoration entered its second year of operationsbrimming with enthusiasm. We offer custom workmanship second to none, in a variety of styles and price ranges. We urge any of our shareholders who visit the Southport, CT area to please stop into our corporate headquarters and observe these artisans at work.Their level of achievement after just a very short period of operation is truly amazing.
I have often reported to you about litigation in these pages, but this year, I amdelighted that there is very little to discuss. We remain at the historically low level of just one open product liability lawsuit, and official statistics show that the already low numberof firearms accidents also continues to drop to record low levels. We had no trials orsignificant settlements during 2004, and thirteen of the municipal-type cases, allegingliability of the Company for the acts of criminals far beyond our control have been fully andfinally dismissed. Four dismissals remain on appeal, and only three other city cases remainpending, with the New York City lawsuit seemingly headed to trial this year.
In November, 2004, the dismissal of the Chicago city suit was sustained on appeal,and the dismissal of a similar well-publicized “public nuisance” lawsuit brought by anumber of cities and counties in California was also sustained on appeal in February, 2005.The Company’s sales practices were completely exonerated by the court in the Lemongellocase, which failed in its attempt to impose liability upon the Company for the “strawpurchase” from a pawn shop in West Virginia of a pistol subsequently transferred to andused by a criminal. While no one can predict with certainty what can happen in a courtroom,it does appear that the Company is on the right track.
One of the proudest moments in the history of this Company was our ringing of“The Closing Bell” at the New York Stock Exchange following the Board of Directors’ meetingthere on October 21, 2004. Our Company banner bearing our trademarked motto, “ArmsMakers for Responsible Citizens”® was plainly visible to those on the trading floor, as well as on the cable television networks which broadcast the ceremony. As the only firearmsmanufacturer listed on the New York Stock Exchange, it was our opportunity to show off our responsible industry, America’s oldest and finest, to the financial and businesscommunity, and we were honored to do so.
Given all these positive changes at Sturm, Ruger, I hope you can better understandwhy we are so optimistic about our future. We invite you to share our enthusiasm at our nextAnnual Shareholders meeting, to be held in New London, New Hampshire on May 3, 2005.
Sincerely,
William B. Ruger, Jr.Chairman of the BoardChief Executive Officer
February 7, 2005
3
www.ruger.com
Sturm, Ruger Honored forDesign Excellence and IndustryLeadership in 2004

5

New Ruger Products for 2005
www.ruger.com
7

Management’s Discussion and Analysis ofFinancial Condition and Results of Operations
Company OverviewSturm, Ruger & Company, Inc. (the “Company”) is princi-
pally engaged in the design, manufacture, and sale offirearms and precision investment castings. The Company’sdesign and manufacturing operations are located in theUnited States. Substantially all sales are domestic.
The Company is the only U.S. firearms manufacturerwhich offers products in all four industry product categories –rifles, shotguns, pistols, and revolvers. The Company’sfirearms are sold through a select number of independentwholesale distributors principally to the commercial sportingmarket.
Investment castings manufactured are of titanium andsteel alloys. Investment castings are sold either directly toor through manufacturers’ representatives to companies in awide variety of industries.
Because many of the Company’s competitors are notsubject to public filing requirements and industry-wide datais generally not available in a timely manner, the Company isunable to compare its performance to other companies orspecific current industry trends. Instead, the Company mea-sures itself against its own historical results.
The Company does not consider its overall firearms busi-ness to be predictably seasonal; however, sales of certainmodels of firearms are usually lower in the third quarter of the year.
Results of Operations - RestatedYear ended December 31, 2004, as compared to yearended December 31, 2003
The financial statements as of and for the year endedDecember 31, 2004 have been restated to reduce the LIFOinventory reserve by $0.9 million at December 31, 2004 andreduce cost of goods sold by $0.9 million for the yearended December 31, 2004. The misstatement was causedby an error in the calculation of the LIFO index. Thisrestatement increased net income by $0.5 million or $0.02per share for the year ended December 31, 2004.
Net sales of $145.6 million were achieved by theCompany in 2004 representing a decrease of $2.3 millionor 1.6% from net sales of $147.9 million in 2003.
Firearms segment net sales decreased by $5.6 millionor 4.3% to $124.9 million in 2004 from $130.6 million in theprior year. Firearms unit shipments for 2004 decreased8.0% from 2003, as shipments of revolvers and pistolsdeclined sharply. Shipments during the latter half of 2003,especially the fourth quarter, improved due in large part tothe introduction of several new product offerings. A modestprice increase and a change in mix from lower priced prod-ucts to higher priced products resulted in the lesser declinein sales versus unit shipments. In 2003, revolver shipmentsbenefited from the popularity of the new Single Six revolverin the .17 HMR caliber and the 50th Anniversary Ruger NewModel Single Six revolver, which was available only in 2003.Similarly, pistol shipments in 2003 reflected strong demand
for the MK-4NRA, a .22 caliber pistol commemoratingWilliam B. Ruger, the Company’s founder.
In 2004, the Company offered a sales incentive programfor its distributors which allowed them to earn rebates ofup to 1.5% if certain annual overall sales targets wereachieved. This program replaced a similar sales incentiveprogram in 2003.
Casting segment net sales increased 19.0% to $20.7 mil-lion in 2004 from $17.4 million in 2003 as a result of higherunit volume. Increased sales were generated from existingcustomers as well as several new customers in 2004, in avariety of industries. Much of the increase in sales relates toinvestment castings sold to other firearms manufacturers.
Cost of products sold for 2004 was $115.7 million com-pared to $113.2 million in 2003, representing an increaseof 2.2%. This increase of $2.5 million was primarilyattributable to increased production costs in the castingssegment, and increased unitary overhead expenses result-ing from a reduction in production volume, and a chargerelated to certain firearms inventory, partially offset bydecreased product liability costs. The Company incurred anexpense of $1.9 million for the relocation of two titaniumfurnaces from its Arizona foundry to New Hampshire. Thefurnace relocation is nearly complete. In addition, theCompany will incur further costs for the development ofan additional foundry in New Hampshire in 2005.
Gross profit as a percentage of net sales decreased to20.5% in 2004 from 23.5% in 2003. This deterioration wascaused by less efficient firearms production due toincreased unitary overhead expenses resulting from lowerrates of production, discounts offered on discontinuedfirearm models, increased production costs in the castingssegment, and the aforementioned relocation expensesrelated to the two titanium furnaces, partially offset bydecreased product liability expenses.
Selling, general and administrative expenses increased8.9% to $22.9 million in 2004 from $21.0 million in 2003due primarily to additional firearms promotional and adver-tising expenses as well as increased personnel relatedexpenses.
Total other income decreased from $6.9 million in 2003to $1.0 million in 2004. Included in total other income in2003 was the pretax gain of $5.9 million from the sale ofcertain non-manufacturing real estate in Arizona, known asthe Single Six Ranch. Included in total other income in2004 was a $0.9 million gain from the sale of the propertyand building that housed the Company’s Uni-Cast divisionprior to its sale in 2000. The Company’s earnings on short-term investments declined in 2004 as a result of reducedprincipal.
The effective income tax rate of 40.1% remained consis-tent in 2004 and 2003.
As a result of the foregoing factors, consolidated netincome in 2004 decreased to $4.8 million from $12.4 millionin 2003, representing a decrease of $7.6 million or 60.1%.
December 31,2004 2003 2002 2001 2000
RestatedNet firearms sales . . . . . . . . . . . . . . . . . . . $124,924 $130,558 $139,762 $147,622 $166,415Net castings sales. . . . . . . . . . . . . . . . . . . 17,320,700 17,359 21,825 26,708 36,239Total net sales . . . . . . . . . . . . . . . . . . . . . . 14145,624 147,917 161,587 174,330 202,654Cost of products sold . . . . . . . . . . . . . . . . 113115,725 113,189 125,376 134,449 144,503Gross profit . . . . . . . . . . . . . . . . . . . . . . . . 34,729,899 34,728 36,211 39,881 58,151Income before income taxes . . . . . . . . . . 20,648,051 20,641 14,135 22,199 44,474Income taxes . . . . . . . . . . . . . . . . . . . . . . 83,228 8,277 5,668 8,702 17,434Net income . . . . . . . . . . . . . . . . . . . . . . . . 12,364,823 12,364 8,467 13,497 27,040Basic and diluted earnings per share . . . 0.460.18 0.46 0.31 0.50 1.00Cash dividends per share . . . . . . . . . . . . . $ 0.60 $ 0.80 $ 0.80 $ 0.80 $ 0.80
December 31,2004 2003 2002 2001 2000
Working capital . . . . . . . . . . . . . . . . . . . . . $290,947 $102,715 $103,116 $118,760 $123,020Total assets . . . . . . . . . . . . . . . . . . . . . . . . 170147,460 162,873 183,958 204,378 215,665Total stockholders’ equity. . . . . . . . . . . . . 133120,687 133,640 137,983 164,340 172,358Book value per share . . . . . . . . . . . . . . . . $ 4.48 $ 4.97 $ 5.13 $ 6.11 $ 6.40Return on stockholders’ equity. . . . . . . . . 9.34.0% 9.3% 6.1% 8.0% 15.9%Current ratio . . . . . . . . . . . . . . . . . . . . . . . 5.7 5.7 to 1 5.7 to 1 4.8 to 1 6.1 to 1 5.8 to 1Common shares outstanding . . . . . . . . . . 226,910,700 26,910,700 26,910,700 26,910,700 26,910,700Number of stockholders of record . . . . . . 2,0301,977 2,036 2,026 2,064 2,011Number of employees . . . . . . . . . . . . . . . 1,251,291 1,251 1,418 1,547 1,814
Selected Financial Data should be read in conjunction with the Consolidated Financial Statements and accompanying notes and Management’sDiscussion & Analysis of Financial Condition & Results of Operations.
Selected Financial Data(Dollars in thousands, except per share data)
On October 21, 2004, Sturm, Ruger held its Board of Directors’
Meeting at the New York Stock Exchange and was honored to
be a part of the day’s closing ceremonies.
At 4:00 P.M., William B. Ruger, Jr. rang The Closing BellSM,
officially signaling the end of the NYSE’s trading day. RGR’s
stock closed ay $9.00 per share, up $0.52 from the previous
close. Together with NYSE President Catherine Kinney, Sturm,
Ruger’s board members and other executives were present on
the platform with Mr. Ruger, Jr., standing under the Ruger
banner proudly bearing the Company’s motto, “Arms Makersfor Responsible Citizens.” The ceremony was televised on a
number of cable television business programs.
“We are very honored to have been part of the New York
Stock Exchange’s closing ceremonies,” said William B. Ruger,
Jr. “As the only firearms company listed on the New York Stock
Exchange, we feel that participating in this event not only
provided favorable visibility for the Company, but also for the
responsible American firearms industry as a whole.”
Ruger at the New York Stock Exchange
Shown Left to Right: Admiral James E. Service*, C. Edward Rowe,Richard T. Cunniff*, Chief Financial Officer Thomas A. Dineen,NYSE President Catherine Kinney, CEO and Chairman William B.Ruger, Jr.*, Molly Ruger Vogel, President and Vice ChairmanStephen L. Sanetti*, John M. Kingsley, Jr.*, Townsend Hornor*,Corporate Secretary Leslie M. Gasper.
* Denotes Board Member
9

Results of OperationsYear ended December 31, 2003, as compared to yearended December 31, 2002
Net sales of $147.9 million were achieved by theCompany in 2003 representing a decrease of $13.7 million or 8.5% from net sales of $161.6 million in 2002.
Firearms segment net sales decreased by $9.2 millionor 6.6% to $130.6 million in 2003 from $139.8 million in theprior year. Firearms unit shipments for 2003 decreased2.4% from 2002, as shipments of all productfamilies declined significantly in the first half of the year.Shipments during the latter half of 2003, especially thefourth quarter, improved due in large part to the introduc-tion of several new product offerings. Revolver shipmentsbenefited from the popularity of the new Single Six revolverin the .17 HMR caliber and the 50th Anniversary Ruger NewModel Single Six revolver. Pistol shipments reflected strongdemand for the MK-4NRA, a .22 caliber pistol commemo-rating William B. Ruger, the Company’s founder, and rifleshipments benefited from the popularity of the Ruger 40thAnniversary 10/22 Carbine. However, a change in mix fromhigher priced products to lower priced products resulted inthe further decline in sales versus unit shipments.
In 2003, the Company instituted a sales incentive pro-gram for its distributors which allowed them to earn rebatesof up to 1.5% if certain annual overall sales targets wereachieved. This program replaced a similar sales incentiveprogram in 2002. From May 1, 2003 to September 30,2003, the Company offered a consumer-driven sales incen-tive program for certain centerfire pistols. From August 1,2002 through November 30, 2002, the Company conduct-ed a similar consumer-driven sales incentive program forcertain hunting rifles and revolvers.
Casting segment net sales decreased 20.5% to $17.4million in 2003 from $21.8 million in 2002 as a result oflower unit volume. Shipments of titanium golf clubheads toKarsten Manufacturing Corporation decreased $7.4 millionin 2003 compared to 2002.
Cost of products sold for 2003 was $113.2 million com-pared to $125.4 million in 2002, representing a decrease of9.7%. This decrease of $12.2 million was primarilyattributable to decreased sales in both the firearms andinvestment castings segments and decreased productliability expenses, partially offset by a charge related tocertain obsolete firearms inventory.
Gross profit as a percentage of net sales increased to23.5% in 2003 from 22.4% in 2002. This improvement isdue to improved margins in the castings segment com-pared to 2002 and decreased product liability costs partial-ly offset by decreased sales in both segments and an unfa-vorable adjustment in the firearms segment for a chargerelated to certain obsolete firearms inventory.
Selling, general and administrative expenses increased1.7% to $21.0 million in 2003 from $20.7 million in 2002
due primarily to royalties paid to the NRA Foundation relat-ed to shipments of the MK4-NRA commemorative pistol, aswell as increased national advertising expenditures.
In 2002, the Company recognized asset impairmentcharges of $3.3 million related to certain assets in theinvestment castings segment.
Total other income increased from $1.9 million in 2002to $6.9 million in 2003 primarily due to the pretax gain of$5.9 million from the sale of certain non-manufacturing realestate in Arizona, known as the Single Six Ranch. TheCompany’s earnings on short-term investments declinedin 2003 as a result of declining interest rates.
The effective income tax rate of 40.1% remained consis-tent in 2003 and 2002.
As a result of the foregoing factors, net income in 2003increased to $12.4 million from $8.5 million in 2002, repre-senting an increase of $3.9 million or 46.0%.
Financial ConditionOperations
At December 31, 2004, the Company had cash, cashequivalents and short-term investments of $33.3 million,working capital of $90.9 million and a current ratio of 5.7to 1.
Cash provided by operating activities was $1.3 million,$14.7 million, and $9.9 million in 2004, 2003, and 2002,respectively. The decrease in cash provided in 2004 is prin-cipally the result of a reduction in net income and increasesin trade receivables, prepaid expenses and other assets,and inventories compared with reductions in trade receiv-ables, prepaid expenses and other assets, and inventoriesin 2003. The fluctuations in prepaid and other assetsreflects a prepaid income tax asset at December 31, 2004,and the increase in trade receivables in 2004 is attributableto anticipated timing of certain customer payments, andthe increase in inventories in 2004 resulted from decreasedfirearm sales.
Until November 30, 2004, the Company followed a com-mon industry practice of offering a “dating plan” to itsfirearms customers on selected products, which allowedthe customer to buy the products commencing inDecember, the start of the Company’s marketing year, andpay for them on extended terms. Discounts were offeredfor early payment. The dating plan provided a revolvingpayment plan under which payments for all shipmentsmade during the period December through February weremade by April 30. Shipments made in subsequent monthswere paid for within a maximum of 120 days. On December1, 2004, the Company modified the payment terms onthese selected products whereby payment is now due 45days after shipment.Discounts are offered for early payment. Dating planreceivable balances were $6.3 million and $8.8 million atDecember 31, 2004 and 2003, respectively.
The Company has reserved the right to discontinue the dat-ing plan at any time and has been able to finance this planfrom internally generated funds provided by operatingactivities.
The Company purchases its various raw materials froma number of suppliers. There is, however, a limited supplyof these materials in the marketplace at any given timewhich can cause the purchase prices to vary based uponnumerous market factors. The Company believes that it hasadequate quantities of raw materials in inventory to provideample time to locate and obtain additional items at a rea-sonable cost without interruption of its manufacturing oper-ations. However, if market conditions result in a significantprolonged inflation of certain prices, the Company’s resultscould be adversely affected.
In conjunction with the sale of its Uni-Cast division inJune 2000, the Company extended credit to the purchaserin the form of a note and a line of credit, both of which arecollateralized by certain of the assets of Uni-Cast. In July2002, the Company established an additional collateralizedline of credit for the purchaser and, as of December 31,2004, the total amount due from the purchaser was $1.4million, which is scheduled to be paid in 2005. TheCompany purchases aluminum castings used in the manu-facture of certain models of pistols exclusively from Uni-Cast.
Investing and FinancingCapital expenditures during the past three years aver-
aged $4.7 million per year. In 2005, the Companyexpects to spend approximately $8 million on capitalexpenditures to continue to upgrade and modernize equip-ment at each of its manufacturing facilities. The Company finances, and intends to continue to finance,all of these activities with funds provided by operations and
current cash and short-term investments.In 2004 the Company paid dividends of $16.1 million.
This amount reflects a quarterly dividend of $.20 per sharepaid in March and June 2004, and a quarterly dividend of$0.10 per share paid in September and December 2004.On January 24, 2005, the Company declared a quarterlydividend of $.10 per share payable on March 15, 2005.Future dividends depend on many factors, including inter-nal estimates of future performance, then-current cash andshort-term investments, and the Company’s need for funds.
Historically, the Company has not required externalfinancing. Based on its cash flow and unencumberedassets, the Company believes it has the ability to raisesubstantial amounts of short-term or long-term debt.The Company does not anticipate a need for significantexternal financing in 2005.
Contractual ObligationsThe following table summarizes the Company’s signifi-
cant contractual obligations at December 31, 2004, and theeffect such obligations are expected to have on our liquidityand cash flows in future periods. This table excludesamounts already recorded on the Company’s balance sheetas current liabilities at December 31, 2004.
“Purchase Obligations” as used in the below tableincludes all agreements to purchase goods or services thatare enforceable and legally binding on the Company andthat specify all significant terms, including: fixed or mini-mum quantities to be purchased; fixed, minimum or vari-able price provisions; and the approximate timing of thetransaction. Certain of the Company’s purchase ordersor contracts for the purchase of raw materials and othergoods and services that may not necessarily beenforceable or legally binding on the Company, are also
Management’s Discussion and Analysis ofFinancial Condition and Results of Operations(Continued)
11
Payment due by period (in thousands)Contractual Obligations Total Less than 1 year 1-3 years 3-5 years More than 5 years
Long-Term Debt Obligations - - - - -Capital Lease Obligations - - - - -Operating Lease Obligations - - - - -Purchase Obligations $18,627 $18,299 $328 - -Other Long-Term Liabilities
Reflected on the Registrant's Balance Sheet under GAAP - - - - -
Total $18,627 $18,299 $328 - -

13
included in “Purchase Obligations” in the table. Certainof the Company’s purchase orders or contracts thereforeincluded in the table may represent authorizations to pur-chase rather than legally binding agreements. TheCompany expects to fund all of these commitments withcash flows from operations and current cash and short-term investments.
The expected timing of payment of the obligationsdiscussed above is estimated based on current informa-tion. Timing of payments and actual amounts paid maybe different depending on the time of receipt of goods orservices or changes to agreed-upon amounts for someobligations.
Firearms LegislationThe sale, purchase, ownership, and use of firearms
are subject to thousands of federal, state and local govern-mental regulations. The basic federal laws are the NationalFirearms Act, the Federal Firearms Act, and the GunControl Act of 1968. These laws generally prohibit theprivate ownership of fully automatic weapons and placecertain restrictions on the interstate sale of firearms unlesscertain licenses are obtained. The Company does notmanufacture fully automatic weapons, other than for thelaw enforcement market, and holds all necessary licensesunder these federal laws. From time to time, congressionalcommittees review proposed bills relating to the regulationof firearms. These proposed bills generally seek eitherto restrict or ban the sale and, in some cases, the owner-ship of various types of firearms. Several states currentlyhave laws in effect similar to the aforementioned legisla-tion.
Until November 30, 1998, the “Brady Law” mandated anationwide five-day waiting period and background checkprior to the purchase of a handgun. As of November 30,1998, the National Instant Check System, which applies toboth handguns and long guns, replaced the five-day wait-ing period. The Company believes that the “Brady Law”has not had a significant effect on the Company’s sales offirearms, nor does it anticipate any impact on sales in thefuture. The “Crime Bill” took effect on September 13, 1994,but none of the Company’s products were banned as so-called “assault weapons.” To the contrary, all theCompany’s then-manufactured commercially-sold longguns were exempted by name as “legitimate sportingfirearms.” This ban expired by operation of law onSeptember 13, 2004. The Company remains stronglyopposed to laws which would restrict the rights of law-abiding citizens to lawfully acquire firearms. The Companybelieves that the lawful private ownership of firearms isguaranteed by the Second Amendment to the UnitedStates Constitution and that the widespread private owner-ship of firearms in the United States will continue.
However, there can be no assurance that the regulation offirearms will not become more restrictive in the future andthat any such restriction would not have a material adverseeffect on the business of the Company.
Firearms LitigationThe Company is a defendant in numerous lawsuits
involving its products and is aware of certain other suchclaims. The Company has expended significant amounts offinancial resources and management time in connectionwith product liability litigation. Management believes that,in every case, the allegations are unfounded, and that theshootings and any results therefrom were due to negli-gence or misuse of the firearms by third-parties or theclaimant, and that there should be no recovery against theCompany. Defenses further exist to the suits brought bycities, municipalities, counties, and a state attorney generalbased, among other reasons, on established state law pre-cluding recovery by municipalities for essential governmentservices, the remoteness of the claims, the types of dam-ages sought to be recovered, and limitations on theextraterritorial authority which may be exerted by a city,municipality, county or state under state and federal law,including State and Federal Constitutions.
The only case against the Company alleging liabilityfor criminal shootings by third-parties to ever be permittedto go before a constitutional jury, Hamilton, et al. v. Accu-tek, et al., resulted in a defense verdict in favor of theCompany on February 11, 1999. In that case, numerousfirearms manufacturers and distributors had been sued,alleging damages as a result of alleged negligent salespractices and “industry-wide” liability. The Company andits marketing and distribution practices were exoneratedfrom any claims of negligence in each of the seven casesdecided by the jury. In subsequent proceedings involvingother defendants, the New York Court of Appeals as a mat-ter of law confirmed that 1) no legal duty existed under thecircumstances to prevent or investigate criminal misuses ofa manufacturer’s lawfully made products; and 2) liability offirearms manufacturers could not be apportioned under amarket share theory.
More recently, the New York Court of Appeals onOctober 21, 2003 declined to hear the appeal from thedecision of the New York Supreme Court, AppellateDivision, affirming the dismissal of New York AttorneyGeneral Eliot Spitzer’s public nuisance suit against theCompany and other manufacturers and distributors offirearms. In its decision, the Appellate Division relied heavi-ly on Hamilton in concluding that it was “legally inappropri-ate,” “impractical,” “unrealistic” and “unfair” to attempt tohold firearms manufacturers responsible under theoriesof public nuisance for the criminal acts of others.
Management’s Discussion and Analysis ofFinancial Condition and Results of Operations(Continued)
Of the lawsuits brought by municipalities or a stateAttorney General, nineteen have been dismissed. Sixteenof those cases are concluded: Atlanta – dismissal by inter-mediate Appellate Court, no further appeal; Bridgeport –dismissal affirmed by Connecticut Supreme Court; Countyof Camden – dismissal affirmed by U.S. Third Circuit Courtof Appeals; Miami – dismissal affirmed by intermediateAppellate Court, Florida Supreme Court declined review;New Orleans – dismissed by Louisiana Supreme Court,United States Supreme Court declined review; Philadelphia– U.S. Third Circuit Court of Appeals affirmed dismissal, nofurther appeal; Wilmington – dismissed by trial court, noappeal; Boston – voluntary dismissal with prejudice by the City at the close of fact discovery; Cincinnati – voluntar-ily withdrawn after a unanimous vote of the City Council;Detroit – dismissed by Michigan Court of Appeals, noappeal; Wayne County – dismissed by Michigan Court ofAppeals, no appeal; New York State – Court of Appealsdenied plaintiff’s petition for leave to appeal theIntermediate Appellate Court’s dismissal, no further appeal;Newark – Superior Court of New Jersey Law Division forEssex County dismissed the case with prejudice; City ofCamden – dismissed on July 7, 2003, not reopened; JerseyCity – voluntarily dismissed and not re-filed; and St. Louis –Missouri Supreme Court denied plaintiff’s motion to appealMissouri Appellate Court’s affirmance of dismissal.
The dismissal of the Washington, D.C. lawsuit was sus-tained on appeal, but individual plaintiffs were permitted toproceed to discovery and attempt to identify the manufac-turers of the firearms used in their shootings as “machineguns” under the city’s “strict liability” law. On October 19,2004, the D.C. Court of Appeals vacated the court’s judg-ment, which dismissed the city’s claim against firearmsmanufacturers but let stand certain individuals’ claims against the manufacturers of firearmsallegedly used in criminal assaults against plaintiffs underthe Washington, D.C. “Strict Liability Act,” subject to proofof causation. The court scheduled a rehearing of the matteren banc by the full Court of Appeals to be heard in 2005.
On March 7, 2003, the consolidated California Citiescase involving nine cities and three counties was dismissedas to all manufacturer defendants, and plaintiffs appealedon June 9, 2003. The dismissal was affirmed by theCalifornia Appeals Court on February 10, 2005.
On November 18, 2004, in the Chicago case, theIllinois Supreme Court affirmed the trial court’s dismissal.The court held that plaintiffs failed to state a claim for publicnuisance. At the same time the Chicago lawsuit was dis-missed, the court also dismissed the previously reportedYoung lawsuit, in which plaintiffs sued under the same“public nuisance” theory. Plaintiffs in the Chicago lawsuitfiled a motion for reconsideration on December 9, 2004,which was denied on January 24, 2005.
The Indiana Court of Appeals affirmed the dismissal ofthe Gary case by the trial court, but the Indiana SupremeCourt reversed this dismissal and remanded the case fordiscovery proceedings on December 23, 2003. Clevelandand New York City are open cases and the New York Citycase is presently scheduled to begin trial in September,2005.
In the NAACP case, on May 14, 2003, an advisoryjury returned a verdict rejecting the NAACP’s claims. OnJuly 21, 2003, Judge Jack B. Weinstein entered an orderdismissing the NAACP lawsuit, but this order containedlengthy dicta which defendants believe are contrary to lawand fact. Appeals by both sides were filed, but plaintiffswithdrew their appeal. On August 3, 2004, the UnitedStates Court of Appeals for the Second Circuit granted theNAACP’s motion to dismiss the defendants’ appeal ofJudge Weinstein’s order denying defendants’ motion tostrike his dicta made in his order dismissing the NAACP’scase, and the defendants’ motion for summary dispositionwas denied as moot. The ruling of the Second Circuit effec-tively confirmed the decision in favor of defendants andbrought this matter to a conclusion.
Legislation has been passed in approximately 34 statesprecluding suits of the type brought by the municipalitiesmentioned above, and similar federal legislation has beenintroduced in the U.S. Congress. It passed the House by a2-to-1 bipartisan majority and had over 54 co-sponsors inthe Senate. It was considered by the Senate in February,2004, but failed to gain final passage after it was encum-bered with numerous non-germane amendments. It isuncertain when it may be reconsidered by the new sessionin Congress.
Other Operational MattersIn the normal course of its manufacturing operations,
the Company is subject to occasional governmental pro-ceedings and orders pertaining to waste disposal, airemissions and water discharges into the environment.The Company believes that it is generally in compliancewith applicable environmental regulations and the outcomeof such proceedings and orders will not have a materialadverse effect on its business.
The valuation of the future defined benefit pension obli-gations at December 31, 2004 indicated that these planswere underfunded. While this estimation has no bearing onthe actual funded status of the pension plans, it results inthe recognition of a cumulative other comprehensive loss of$10.3 million and $8.6 million at December 31, 2004 and2003, respectively.
The Company expects to realize its deferred tax assetsthrough tax deductions against future taxable income orcarry back against taxes previously paid.
Inflation's effect on the Company's operations is mostimmediately felt in cost of products sold becausethe Company values inventory on the LIFO basis.
Management’s Discussion and Analysis ofFinancial Condition and Results of Operations(Continued)
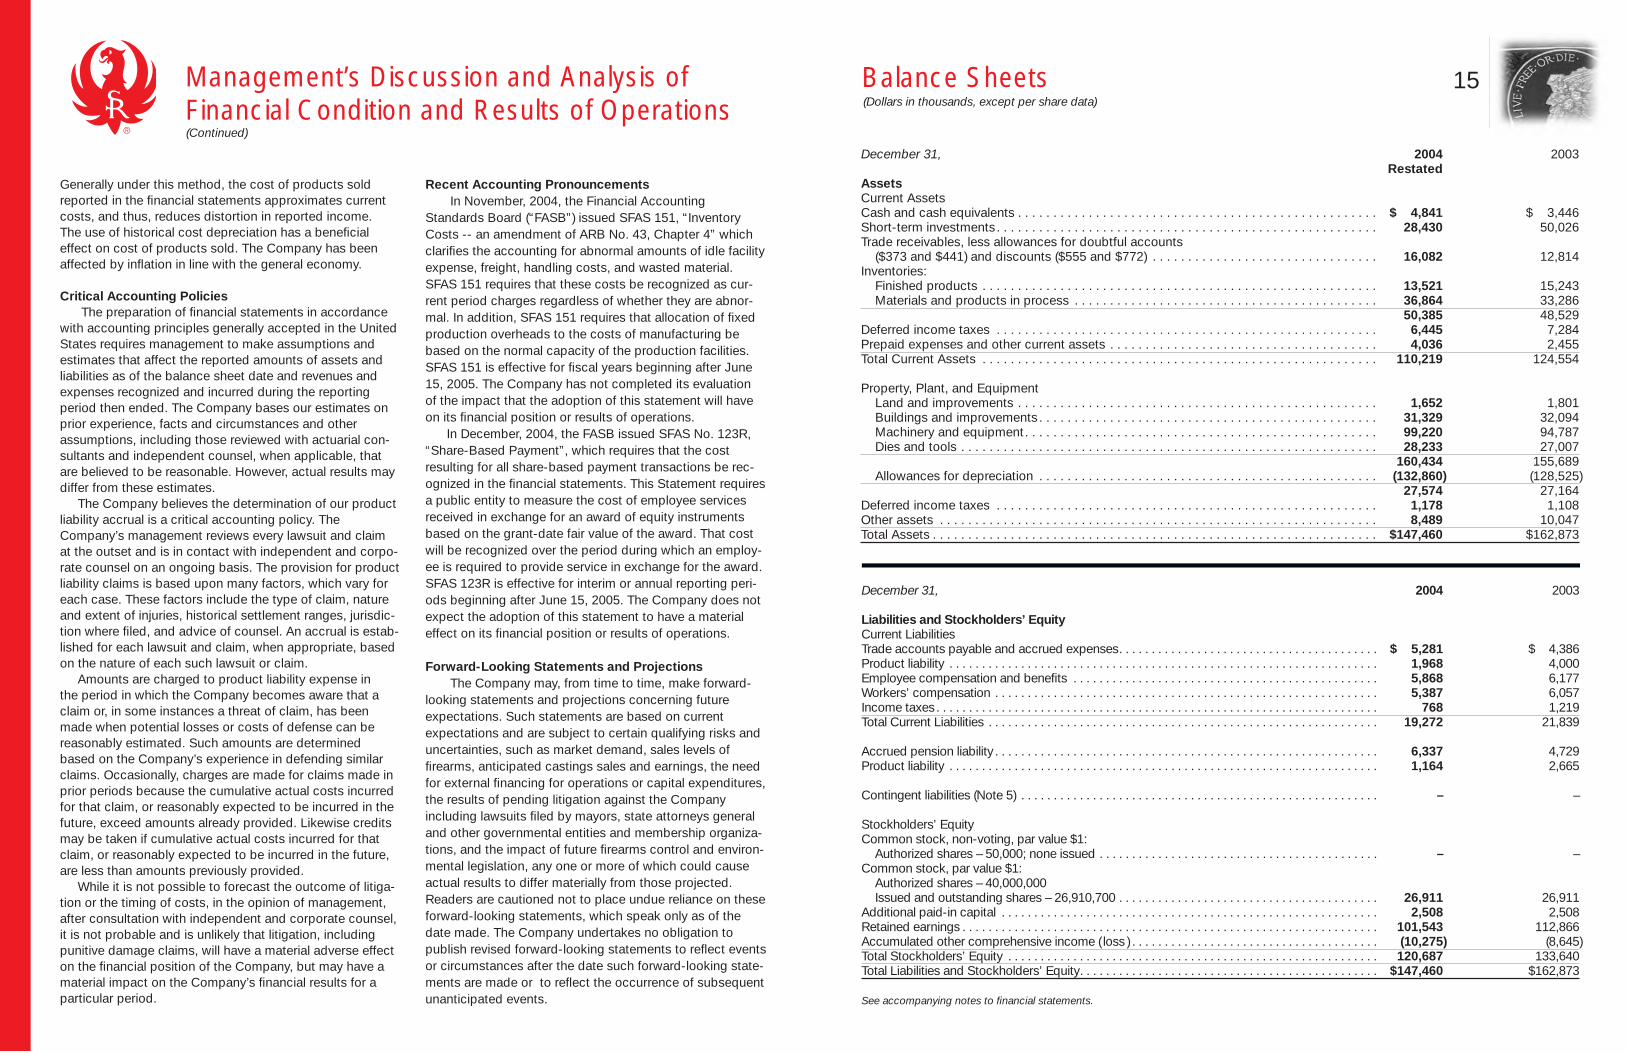
15Balance Sheets(Dollars in thousands, except per share data)
December 31, 2004 2003Restated
AssetsCurrent AssetsCash and cash equivalents . . . . . . . . . . . . . . . . . . . . . . . . . . . . . . . . . . . . . . . . . . . . . . . . . . . $ 4,841 $ 3,446Short-term investments. . . . . . . . . . . . . . . . . . . . . . . . . . . . . . . . . . . . . . . . . . . . . . . . . . . . . . 28,430 50,026Trade receivables, less allowances for doubtful accounts
($373 and $441) and discounts ($555 and $772) . . . . . . . . . . . . . . . . . . . . . . . . . . . . . . . . 16,082 12,814Inventories:
Finished products . . . . . . . . . . . . . . . . . . . . . . . . . . . . . . . . . . . . . . . . . . . . . . . . . . . . . . . . 13,521 15,243Materials and products in process . . . . . . . . . . . . . . . . . . . . . . . . . . . . . . . . . . . . . . . . . . . 36,864 33,286
50,385 48,529Deferred income taxes . . . . . . . . . . . . . . . . . . . . . . . . . . . . . . . . . . . . . . . . . . . . . . . . . . . . . . 6,445 7,284Prepaid expenses and other current assets . . . . . . . . . . . . . . . . . . . . . . . . . . . . . . . . . . . . . . 4,036 2,455Total Current Assets . . . . . . . . . . . . . . . . . . . . . . . . . . . . . . . . . . . . . . . . . . . . . . . . . . . . . . . . 110,219 124,554
Property, Plant, and EquipmentLand and improvements . . . . . . . . . . . . . . . . . . . . . . . . . . . . . . . . . . . . . . . . . . . . . . . . . . . 1,652 1,801Buildings and improvements . . . . . . . . . . . . . . . . . . . . . . . . . . . . . . . . . . . . . . . . . . . . . . . . 31,329 32,094Machinery and equipment. . . . . . . . . . . . . . . . . . . . . . . . . . . . . . . . . . . . . . . . . . . . . . . . . . 99,220 94,787Dies and tools . . . . . . . . . . . . . . . . . . . . . . . . . . . . . . . . . . . . . . . . . . . . . . . . . . . . . . . . . . . 28,233 27,007
160,434 155,689Allowances for depreciation . . . . . . . . . . . . . . . . . . . . . . . . . . . . . . . . . . . . . . . . . . . . . . . . (132,860)) (128,525)
27,574 27,164Deferred income taxes . . . . . . . . . . . . . . . . . . . . . . . . . . . . . . . . . . . . . . . . . . . . . . . . . . . . . . 1,178 1,108Other assets . . . . . . . . . . . . . . . . . . . . . . . . . . . . . . . . . . . . . . . . . . . . . . . . . . . . . . . . . . . . . . 8,489 10,047Total Assets . . . . . . . . . . . . . . . . . . . . . . . . . . . . . . . . . . . . . . . . . . . . . . . . . . . . . . . . . . . . . . . $147,460 $162,873
December 31, 2004 2003
Liabilities and Stockholders’ EquityCurrent LiabilitiesTrade accounts payable and accrued expenses. . . . . . . . . . . . . . . . . . . . . . . . . . . . . . . . . . . . . . . . $ 5,281 $ 4,386Product liability . . . . . . . . . . . . . . . . . . . . . . . . . . . . . . . . . . . . . . . . . . . . . . . . . . . . . . . . . . . . . . . . . . 1,968 4,000Employee compensation and benefits . . . . . . . . . . . . . . . . . . . . . . . . . . . . . . . . . . . . . . . . . . . . . . . 5,868 6,177Workers’ compensation . . . . . . . . . . . . . . . . . . . . . . . . . . . . . . . . . . . . . . . . . . . . . . . . . . . . . . . . . . . 5,387 6,057Income taxes. . . . . . . . . . . . . . . . . . . . . . . . . . . . . . . . . . . . . . . . . . . . . . . . . . . . . . . . . . . . . . . . . . . . 768 1,219Total Current Liabilities . . . . . . . . . . . . . . . . . . . . . . . . . . . . . . . . . . . . . . . . . . . . . . . . . . . . . . . . . . . . 19,272 21,839
Accrued pension liability . . . . . . . . . . . . . . . . . . . . . . . . . . . . . . . . . . . . . . . . . . . . . . . . . . . . . . . . . . . 6,337 4,729Product liability . . . . . . . . . . . . . . . . . . . . . . . . . . . . . . . . . . . . . . . . . . . . . . . . . . . . . . . . . . . . . . . . . . 1,164 2,665
Contingent liabilities (Note 5) . . . . . . . . . . . . . . . . . . . . . . . . . . . . . . . . . . . . . . . . . . . . . . . . . . . . . . . – –
Stockholders’ EquityCommon stock, non-voting, par value $1:
Authorized shares – 50,000; none issued . . . . . . . . . . . . . . . . . . . . . . . . . . . . . . . . . . . . . . . . . . . – –Common stock, par value $1:
Authorized shares – 40,000,000Issued and outstanding shares – 26,910,700 . . . . . . . . . . . . . . . . . . . . . . . . . . . . . . . . . . . . . . . . 26,911 26,911
Additional paid-in capital . . . . . . . . . . . . . . . . . . . . . . . . . . . . . . . . . . . . . . . . . . . . . . . . . . . . . . . . . . 2,508 2,508Retained earnings . . . . . . . . . . . . . . . . . . . . . . . . . . . . . . . . . . . . . . . . . . . . . . . . . . . . . . . . . . . . . . . . 101,543 112,866Accumulated other comprehensive income ( loss ) . . . . . . . . . . . . . . . . . . . . . . . . . . . . . . . . . . . . . . (10,275)) (8,645)Total Stockholders’ Equity . . . . . . . . . . . . . . . . . . . . . . . . . . . . . . . . . . . . . . . . . . . . . . . . . . . . . . . . . 120,687 133,640Total Liabilities and Stockholders’ Equity. . . . . . . . . . . . . . . . . . . . . . . . . . . . . . . . . . . . . . . . . . . . . . $147,460 $162,873
See accompanying notes to financial statements.
Generally under this method, the cost of products soldreported in the financial statements approximates currentcosts, and thus, reduces distortion in reported income.The use of historical cost depreciation has a beneficialeffect on cost of products sold. The Company has beenaffected by inflation in line with the general economy.
Critical Accounting PoliciesThe preparation of financial statements in accordance
with accounting principles generally accepted in the UnitedStates requires management to make assumptions andestimates that affect the reported amounts of assets andliabilities as of the balance sheet date and revenues andexpenses recognized and incurred during the reportingperiod then ended. The Company bases our estimates onprior experience, facts and circumstances and otherassumptions, including those reviewed with actuarial con-sultants and independent counsel, when applicable, thatare believed to be reasonable. However, actual results maydiffer from these estimates.
The Company believes the determination of our productliability accrual is a critical accounting policy. TheCompany’s management reviews every lawsuit and claimat the outset and is in contact with independent and corpo-rate counsel on an ongoing basis. The provision for productliability claims is based upon many factors, which vary foreach case. These factors include the type of claim, natureand extent of injuries, historical settlement ranges, jurisdic-tion where filed, and advice of counsel. An accrual is estab-lished for each lawsuit and claim, when appropriate, basedon the nature of each such lawsuit or claim.
Amounts are charged to product liability expense inthe period in which the Company becomes aware that aclaim or, in some instances a threat of claim, has beenmade when potential losses or costs of defense can bereasonably estimated. Such amounts are determinedbased on the Company’s experience in defending similarclaims. Occasionally, charges are made for claims made inprior periods because the cumulative actual costs incurredfor that claim, or reasonably expected to be incurred in thefuture, exceed amounts already provided. Likewise creditsmay be taken if cumulative actual costs incurred for thatclaim, or reasonably expected to be incurred in the future,are less than amounts previously provided.
While it is not possible to forecast the outcome of litiga-tion or the timing of costs, in the opinion of management,after consultation with independent and corporate counsel,it is not probable and is unlikely that litigation, includingpunitive damage claims, will have a material adverse effecton the financial position of the Company, but may have amaterial impact on the Company’s financial results for aparticular period.
Recent Accounting PronouncementsIn November, 2004, the Financial Accounting
Standards Board (“FASB”) issued SFAS 151, “InventoryCosts -- an amendment of ARB No. 43, Chapter 4” whichclarifies the accounting for abnormal amounts of idle facilityexpense, freight, handling costs, and wasted material.SFAS 151 requires that these costs be recognized as cur-rent period charges regardless of whether they are abnor-mal. In addition, SFAS 151 requires that allocation of fixedproduction overheads to the costs of manufacturing bebased on the normal capacity of the production facilities.SFAS 151 is effective for fiscal years beginning after June15, 2005. The Company has not completed its evaluationof the impact that the adoption of this statement will haveon its financial position or results of operations.
In December, 2004, the FASB issued SFAS No. 123R,“Share-Based Payment”, which requires that the costresulting for all share-based payment transactions be rec-ognized in the financial statements. This Statement requiresa public entity to measure the cost of employee servicesreceived in exchange for an award of equity instrumentsbased on the grant-date fair value of the award. That costwill be recognized over the period during which an employ-ee is required to provide service in exchange for the award.SFAS 123R is effective for interim or annual reporting peri-ods beginning after June 15, 2005. The Company does notexpect the adoption of this statement to have a materialeffect on its financial position or results of operations.
Forward-Looking Statements and ProjectionsThe Company may, from time to time, make forward-
looking statements and projections concerning futureexpectations. Such statements are based on currentexpectations and are subject to certain qualifying risks anduncertainties, such as market demand, sales levels offirearms, anticipated castings sales and earnings, the needfor external financing for operations or capital expenditures,the results of pending litigation against the Companyincluding lawsuits filed by mayors, state attorneys generaland other governmental entities and membership organiza-tions, and the impact of future firearms control and environ-mental legislation, any one or more of which could causeactual results to differ materially from those projected.Readers are cautioned not to place undue reliance on theseforward-looking statements, which speak only as of thedate made. The Company undertakes no obligation topublish revised forward-looking statements to reflect eventsor circumstances after the date such forward-looking state-ments are made or to reflect the occurrence of subsequentunanticipated events.

Statements of Income
Year ended December 31, 2004 2003 2002Restated
Net firearms sales . . . . . . . . . . . . . . . . . . . . . . . . . . . . . . . . . . . . . . . . . . . . . . . . $124,924 $130,558 $139,762Net castings sales . . . . . . . . . . . . . . . . . . . . . . . . . . . . . . . . . . . . . . . . . . . . . . . . 20,700 17,359 21,825Total net sales . . . . . . . . . . . . . . . . . . . . . . . . . . . . . . . . . . . . . . . . . . . . . . . . . . . 145,624 147,917 161,587
Cost of products sold . . . . . . . . . . . . . . . . . . . . . . . . . . . . . . . . . . . . . . . . . . . . . 115,725 113,189 125,376Gross profit . . . . . . . . . . . . . . . . . . . . . . . . . . . . . . . . . . . . . . . . . . . . . . . . . . . . . 29,899 34,728 36,211Expenses:
Selling . . . . . . . . . . . . . . . . . . . . . . . . . . . . . . . . . . . . . . . . . . . . . . . . . . . . . . . 16,700 15,189 14,777General and administrative. . . . . . . . . . . . . . . . . . . . . . . . . . . . . . . . . . . . . . . 6,175 5,827 5,885Impairment of long-lived assets . . . . . . . . . . . . . . . . . . . . . . . . . . . . . . . . . . . – – 3,311
22,875 21,016 23,973Operating profit . . . . . . . . . . . . . . . . . . . . . . . . . . . . . . . . . . . . . . . . . . . . . . . . . . 7,024 13,712 12,238
Gain on sale of real estate. . . . . . . . . . . . . . . . . . . . . . . . . . . . . . . . . . . . . . . . . . 874 5,922 –Other income-net . . . . . . . . . . . . . . . . . . . . . . . . . . . . . . . . . . . . . . . . . . . . . . . . 153 1,007 1,897Total other income. . . . . . . . . . . . . . . . . . . . . . . . . . . . . . . . . . . . . . . . . . . . . . . . 1,027 6,929 1,897Income before income taxes . . . . . . . . . . . . . . . . . . . . . . . . . . . . . . . . . . . . . . . 8,051 20,641 14,135
Income taxes . . . . . . . . . . . . . . . . . . . . . . . . . . . . . . . . . . . . . . . . . . . . . . . . . . . . 3,228 8,277 5,668Net Income . . . . . . . . . . . . . . . . . . . . . . . . . . . . . . . . . . . . . . . . . . . . . . . . . . . . . $ 4,823 $ 12,364 $ 8,467Basic and Diluted Earnings Per Share . . . . . . . . . . . . . . . . . . . . . . . . . . . . . . . . $ 0.18 $ 0.46 $ 0.31Cash Dividends Per Share . . . . . . . . . . . . . . . . . . . . . . . . . . . . . . . . . . . . . . . . . $ 0.60 $ 0.80 $ 0.80
See accompanying notes to financial statements.
AccumulatedAdditional Other
Common Paid-In Retained ComprehensiveStock Capital Earnings Income (loss) Total
Balance at December 31, 2001 . . . . . . . . . . . . . . . . . . . . . . . $26,911 $2,492 $135,093 $ (156) $164,340Net income . . . . . . . . . . . . . . . . . . . . . . . . . . . . . . . . . . . . . 8,467 8,467Additional minimum pension liability,
net of deferred taxes of $5,287 . . . . . . . . . . . . . . . . . . . (7,929) (7,929)Comprehensive income . . . . . . . . . . . . . . . . . . . . . . . . . . . 538Stock options compensation . . . . . . . . . . . . . . . . . . . . . . . 16 16Cash dividends declared and paid . . . . . . . . . . . . . . . . . . (21,529) (21,529)Unpaid dividends declared. . . . . . . . . . . . . . . . . . . . . . . . . (5,382) (5,382)
Balance at December 31, 2002 . . . . . . . . . . . . . . . . . . . . . . . 26,911 2,508 116,649 (8,085) 137,983Net income . . . . . . . . . . . . . . . . . . . . . . . . . . . . . . . . . . . . . 12,364 12,364Additional minimum pension liability,
net of deferred taxes of $373 . . . . . . . . . . . . . . . . . . . . . (560) (560)Comprehensive income . . . . . . . . . . . . . . . . . . . . . . . . . . . 11,804Cash dividends declared and paid . . . . . . . . . . . . . . . . . . (16,147) (16,147)
Balance at December 31, 2003 . . . . . . . . . . . . . . . . . . . . . . . 26,911 2,508 112,866 (8,645) 133,640Net income, as restated . . . . . . . . . . . . . . . . . . . . . . . . . . . 4,823 4,823Additional minimum pension liability,
net of deferred taxes of $1,086 . . . . . . . . . . . . . . . . . . . (1,630) (1,630)Comprehensive income . . . . . . . . . . . . . . . . . . . . . . . . . . . 3,193Cash dividends declared and paid . . . . . . . . . . . . . . . . . . (16,146) (16,146)
Balance at December 31, 2004, as restated . . . . . . . . . . . $26,911 26,9 $2,508 $101,543 $ (10,275) $120,687
See accompanying notes to financial statements.
(In thousands, except per share data)
Statements of Stockholders’ Equity(Dollars in thousands)
Statements of Cash Flows
Year ended December 31, 2004 2003 2002Restated
Operating ActivitiesNet income. . . . . . . . . . . . . . . . . . . . . . . . . . . . . . . . . . . . . . . . . . . . . . . . . . . $ 4,823 8,467 $ 12,364 $ 8,467Adjustments to reconcile net income to cash
provided by operating activities:Depreciation. . . . . . . . . . . . . . . . . . . . . . . . . . . . . . . . . . . . . . . . . . . . . . 5,827 5,923 7,490Impairment of long-lived assets . . . . . . . . . . . . . . . . . . . . . . . . . . . . . . – – 3,311Gain on sale of real estate. . . . . . . . . . . . . . . . . . . . . . . . . . . . . . . . . . . (874) (5,922) (209)Deferred income taxes . . . . . . . . . . . . . . . . . . . . . . . . . . . . . . . . . . . . . 1,855 2,674 1,533Changes in operating assets and liabilities:
Trade receivables. . . . . . . . . . . . . . . . . . . . . . . . . . . . . . . . . . . . . . . . (3,268) 742 1,095Inventories . . . . . . . . . . . . . . . . . . . . . . . . . . . . . . . . . . . . . . . . . . . . . (1,855) 3,099 (1,835)Trade accounts payable and other liabilities . . . . . . . . . . . . . . . . . . (81) (549) (1,443)Product liability . . . . . . . . . . . . . . . . . . . . . . . . . . . . . . . . . . . . . . . . . (3,533) (3,568) (2,229)Prepaid expenses and other assets . . . . . . . . . . . . . . . . . . . . . . . . (1,132) (386) (6,418)Income taxes . . . . . . . . . . . . . . . . . . . . . . . . . . . . . . . . . . . . . . . . . . . (451) 337 178
Cash provided by operating activities . . . . . . . . . . . . . . . . . . . . . . . . . 1,311 14,714 9,940
Investing ActivitiesProperty, plant, and equipment additions. . . . . . . . . . . . . . . . . . . . . . . . . . . (6,945) (3,996) (3,155)Purchases of short-term investments. . . . . . . . . . . . . . . . . . . . . . . . . . . . . . (123,098) (148,620) (145,392)Proceeds from sales or maturities of
short-term investments . . . . . . . . . . . . . . . . . . . . . . . . . . . . . . . . . . . . . . . 144,693 148,370 159,574Net proceeds from sale of real estate. . . . . . . . . . . . . . . . . . . . . . . . . . . . . . 1,580 10,909 322
Cash provided by investing activities . . . . . . . . . . . . . . . . . . . . . . . . . . 16,230 6,663 11,349
Financing ActivitiesDividends paid . . . . . . . . . . . . . . . . . . . . . . . . . . . . . . . . . . . . . . . . . . . . . . . . (16,146) (21,529) (21,529)
Cash used by financing activities . . . . . . . . . . . . . . . . . . . . . . . . . . . . . (16,146) (21,529) (21,529)
Increase (Decrease) in cash and cash equivalents. . . . . . . . . . . . . . . . . . . . . . 1,395 (152) (240)Cash and cash equivalents at beginning of year . . . . . . . . . . . . . . . . . . . . . . . 3,446 3,598 3,838Cash and Cash Equivalents at End of Year . . . . . . . . . . . . . . . . . . . . . . . . . . . $ 4,841 $ 3,446 $ 3,598
See accompanying notes to financial statements.
(In thousands)
17

Notes to Financial Statements
1. Significant Accounting Policies
OrganizationSturm, Ruger & Company, Inc. (the “Company”) is principally engaged in the design, manufacture, and sale of firearms
and precision investment castings. The Company’s design and manufacturing operations are located in the United States.Substantially all sales are domestic. The Company’s firearms are sold through a select number of independent wholesaledistributors to the sporting and law enforcement markets. Investment castings are sold either directly to or through manu-facturers’ representatives to companies in a wide variety of industries.
Use of EstimatesThe preparation of financial statements in conformity with generally accepted accounting principles requires manage-
ment to make estimates and assumptions that affect the amounts reported in the financial statements and accompanyingnotes. Actual results could differ from those estimates.
Principles of ConsolidationThe financial statements have been prepared from the Company’s books and records and include all of the Company’s
accounts. All significant intercompany accounts and transactions have been eliminated. During 2003, two subsidiaries ofthe Company were merged into the parent. Certain prior year balances may have been reclassified to conform with currentyear presentation.
Revenue RecognitionRevenue is recognized, net of any estimated discounts, sales incentives, or rebates, when product is shipped and the
customer takes ownership and assumes risk of loss.
Cash EquivalentsThe Company considers interest-bearing deposits with financial institutions with remaining maturities of three months
or less at the time of acquisition to be cash equivalents.
Short-term InvestmentsShort-term investments are recorded at cost plus accrued interest, which approximates market, and are principally
United States Treasury instruments, all maturing within one year. The income from short-term investments is included inother income – net. The Company intends to hold these investments until maturity.
Inventories - RestatedInventories are stated at the lower of cost, principally determined by the last-in, first-out (LIFO) method, or market. If
inventories had been valued using the first-in, first-out method, inventory values would have been higher by approximately$53.6 million and $49.4 million at December 31, 2004 and 2003, respectively. During 2003, inventory quantities werereduced. This reduction resulted in a liquidation of LIFO inventory quantities carried at lower costs prevailing in prior yearsas compared with the current cost of purchases, the effect of which decreased costs of products sold by approximately$0.2 million.
Property, Plant, and Equipment Property, plant, and equipment are stated on the basis of cost. Depreciation is computed using the straight-line and
declining balance methods predominately over 15, 10, and 3 years for buildings, machinery and equipment, and tools anddies, respectively.
Long-lived assets are reviewed for impairment whenever circumstances indicate that the carrying amount of an assetmay not be recoverable in accordance with Statement of Financial Accounting Standards (“SFAS”) No. 144. In performingthis review, the carrying value of the assets is compared to the projected undiscounted cash flows to be generated from theassets. If the sum of the undiscounted expected future cash flows is less than the carrying value of the assets, the assetsare considered to be impaired. Impairment losses are measured as the amount by which the carrying value of the assetsexceeds the fair value of the assets. When fair value estimates are not available, the Company estimates fair value using theestimated future cash flows discounted at a rate commensurate with the risks associated with the recovery of the assets.
Income TaxesIncome taxes are accounted for using the asset and liability method in accordance with SFAS No. 109. Under this
method, deferred income taxes are recognized for the tax consequences of “temporary differences” by applying enactedstatutory rates applicable to future years to differences between the financial statement carrying amounts and the tax basisof the Company’s assets and liabilities.
Product LiabilityThe Company provides for product liability claims including estimated legal costs to be incurred defending such claims.
The provision for product liability claims is charged to cost of products sold.
Advertising CostsThe Company expenses advertising costs as incurred. Advertising expenses for the years ended December 31, 2004,
2003, and 2002, were $2.5 million, $2.3 million, and $2.2 million, respectively.
Shipping CostsCosts incurred related to the shipment of products are included in selling expense. Such costs totaled $1.7 million, $1.7
million, and $1.6 million in 2004, 2003, and 2002, respectively.
Stock OptionsThe Company accounts for employee stock options under APB Opinion No. 25, “Accounting for Stock Issued to Employees.”The Company has adopted the disclosure-only provisions of SFAS No. 123, “Accounting for Stock-Based Compensation” asamended by SFAS No. 148, “Accounting for Stock-Based Compensation-Transition and Disclosure.” Had compensationexpense for the Plans been determined in accordance with SFAS No. 123, the Company’s net income and earnings per sharewould have been reduced to the following pro forma amounts (in thousands, except per share data):
2004 2003 2002Restated
Net Income, As Reported . . . . . . . . . . . . . . . . . . . . . . . . . . . . . . . . . . . . . . . . . . . . . . . . . . . $4,823 $12,364 $8,467
Add: Recognized stock-based employee compensation,net of tax . . . . . . . . . . . . . . . . . . . . . . . . . . . . . . . . . . . . . . . . . . . . . . . . . . . . . – – 10
Deduct: Employee compensation expense determined underfair value method, net tax . . . . . . . . . . . . . . . . . . . . . . . . . . . . . . . . . . . . . . . . (28) (387) (387)Pro forma $4,795 $11,977 $8,090
Earnings per share, (Basic and Diluted):As Reported. . . . . . . . . . . . . . . . . . . . . . . . . . . . . . . . . . . . . . . . . . . . . . . . . . . $ 0.18 $ 0.46 $ 0.31Pro forma. . . . . . . . . . . . . . . . . . . . . . . . . . . . . . . . . . . . . . . . . . . . . . . . . . . . . $ 0.18 $ 0.44 $ 0.30
Earnings Per ShareBasic earnings per share is based upon the weighted-average number of shares of Common Stock outstanding during the
year, which was 26,910,700 in 2004, 2003, and 2002. Diluted earnings per share reflect the impact of options outstandingusing the treasury stock method. This results in diluted weighted-average shares outstanding of 26,930,000 in 2004,26,919,400 in 2003, and 27,002,200 in 2002.
Recent Accounting PronouncementsIn November 2004, the Financial Accounting Standards Board (“FASB”) issued SFAS 151, “Inventory Costs -- an amend-
ment of ARB No. 43, Chapter 4” which clarifies the accounting for abnormal amounts of idle facility expense, freight, handlingcosts, and wasted material. SFAS 151 requires that these costs be recognized as current period charges regardless of whetherthey are abnormal. In addition, SFAS 151 requires that allocation of fixed production overheads to the costs of manufacturingbe based on the normal capacity of the production facilities. SFAS 151 is effective for fiscal years beginning after June 15,2005. The Company has not completed its evaluation of the impact that the adoption of this statement will have on its financialposition or results of operations.
In December 2004, the FASB issued SFAS No. 123R, “Share-Based Payment”, which requires that the cost resulting forall share-based payment transactions be recognized in the financial statements. This Statement requires a public entity tomeasure the cost of employee services received in exchange for an award of equity instruments based on the grant-datefair value of the award. That cost will be recognized over the period during which an employee is required to provide servicein exchange for the award. SFAS 123R is effective for interim or annual reporting periods beginning after June 15, 2005. TheCompany does not expect the adoption of this statement to have a material effect on its financial position or results ofoperations.
19

Notes to Financial Statements
2. Restatement of 2004 Financial StatementsThe financial statements as of and for the year ended December 31, 2004 have been restated to reduce the LIFO inventory
reserve by $0.9 million at December 31 2004 and reduce cost of goods sold by $0.9 million and increase income taxes, netincome and earnings per share by $0.3 million, $0.5 million and $0.02, respectively, for the year ended December 31, 2004.The misstatement was caused by an error in the calculation of the LIFO index. The restatement affected the amounts previouslyreported in notes 3,9 and 10. The following table presents a summary of the restatement adjustments described above on theCompany’s Balance Sheet as of December 31, 2004 and Statement of Income for the year then ended.
As PreviouslyReported Adjustments As Restated
Balance SheetInventories:
Finished Products . . . . . . . . . . . . . . . . . . . . . . . . . . . . . . . . . . $ 13,289 $ 232 $ 13,521Materials and Products in Process . . . . . . . . . . . . . . . . . . . . . . . 36,230 634 36,864
Total Inventories . . . . . . . . . . . . . . . . . . . . . . . . . . . . . . . . . . . . 49,519 866 50,385Prepaid Expenses and Other Current Assets . . . . . . . . . . . . . . . . . . 4,383 (347) 4,036Total Current Assets . . . . . . . . . . . . . . . . . . . . . . . . . . . . . . . . . . . . . . . 109,700 519 110,219Total Assets . . . . . . . . . . . . . . . . . . . . . . . . . . . . . . . . . . . . . . . . . . . . . . 146,941 519 147,460Retained Earnings . . . . . . . . . . . . . . . . . . . . . . . . . . . . . . . . . . . . . . . . . 101,024 519 101,543Stockholders’ Equity . . . . . . . . . . . . . . . . . . . . . . . . . . . . . . . . . . . . . . 120,168 519 120,687Total Liabilities and Stockholders’ Equity . . . . . . . . . . . . . . . . . . . . . 146,941 519 147,460
Statement of IncomeCost of Products Sold . . . . . . . . . . . . . . . . . . . . . . . . . . . . . . . . . . . . . $ 116,591 $ (866) $ 115,725Gross Profit . . . . . . . . . . . . . . . . . . . . . . . . . . . . . . . . . . . . . . . . . . . . . . 29,033 866 29,899Operating Profit . . . . . . . . . . . . . . . . . . . . . . . . . . . . . . . . . . . . . . . . . . . 6,158 866 7,024Income Before Income Taxes . . . . . . . . . . . . . . . . . . . . . . . . . . . . . . . 7,185 866 8,051Income Taxes . . . . . . . . . . . . . . . . . . . . . . . . . . . . . . . . . . . . . . . . . . . . 2,881 347 3,228Net Income . . . . . . . . . . . . . . . . . . . . . . . . . . . . . . . . . . . . . . . . . . . . . . 4,304 519 4,823Basic and Diluted Earnings Per Share . . . . . . . . . . . . . . . . . . . . . . . . $ 0.16 $ 0.02 $ 0.18
The restatement did not result in any changes to cash and cash equivalents as of December 31, 2004 or any changes to thenet cash flows from operating, investing or financing activities in the Statement of Cash Flows for the year ended December 31,2004, although it did impact certain components of the net cash flow from operations.
3. Income TaxesThe Federal and state income tax provision consisted of the following (in thousands):
Year ended December 31, 2004 2003 2002Restated
Current Deferred Current Deferred Current DeferredFederal . . . . . . . . . . . . . . . . . . . . . . . . . . . . . . . . . $ 931 $1,556 $4,286 $2,286 $3,190 $1,303State . . . . . . . . . . . . . . . . . . . . . . . . . . . . . . . . . . . 442 299 1,317 388 945 230
$1,373 $1,855 $5,603 $2,674 $4,135 $1,533
(Continued)
21
Significant components of the Company’s deferred tax assets and liabilities are as follows (in thousands):
December 31, 2004 2003Deferred tax assets:
Product liability . . . . . . . . . . . . . . . . . . . . . . . . . . . . . . . . . . . . . . . . . . . . . . . . . . . . . . . . . . . . $ 1,256 $ 2,673Employee compensation and benefits . . . . . . . . . . . . . . . . . . . . . . . . . . . . . . . . . . . . . . . . . . 3,788 4,025Allowances for doubtful accounts and discounts. . . . . . . . . . . . . . . . . . . . . . . . . . . . . . . . . . 507 677Inventories. . . . . . . . . . . . . . . . . . . . . . . . . . . . . . . . . . . . . . . . . . . . . . . . . . . . . . . . . . . . . . . . 1,571 1,248Additional minimum pension liability . . . . . . . . . . . . . . . . . . . . . . . . . . . . . . . . . . . . . . . . . . . 6,850 5,764Other . . . . . . . . . . . . . . . . . . . . . . . . . . . . . . . . . . . . . . . . . . . . . . . . . . . . . . . . . . . . . . . . . . . . 1,511 1,145
Total deferred tax assets. . . . . . . . . . . . . . . . . . . . . . . . . . . . . . . . . . . . . . . . . . . . . . . . . . . . . . . 15,483 15,532Deferred tax liabilities:
Depreciation . . . . . . . . . . . . . . . . . . . . . . . . . . . . . . . . . . . . . . . . . . . . . . . . . . . . . . . . . . . . . . 1,475 1,416Pension plans . . . . . . . . . . . . . . . . . . . . . . . . . . . . . . . . . . . . . . . . . . . . . . . . . . . . . . . . . . . . . 6,080 5,724Other . . . . . . . . . . . . . . . . . . . . . . . . . . . . . . . . . . . . . . . . . . . . . . . . . . . . . . . . . . . . . . . . . . . . 305 –
Total deferred tax liabilities . . . . . . . . . . . . . . . . . . . . . . . . . . . . . . . . . . . . . . . . . . . . . . . . . . . . . 7,860 7,140Net deferred tax assets. . . . . . . . . . . . . . . . . . . . . . . . . . . . . . . . . . . . . . . . . . . . . . . . . . . . . . . . $ 7,623 $ 8,392
In accordance with the provisions of SFAS No. 87, “Employers’ Accounting for Pension Plan Costs,” changes in deferred taxassets relating to the additional minimum pension liability are not charged to expense and are therefore not included in thedeferred tax provision, instead they are charged to other comprehensive income.
The effective income tax rate varied from the statutory Federal income tax rate as follows:
Year ended December 31, 2004 2003 2002Statutory Federal income tax rate . . . . . . . . . . . . . . . . . . . . . . . . . . . . . . . . . . . . . . . . . . . . . . . . 35.0% 35.0% 35.0%State income taxes, net of Federal tax benefit . . . . . . . . . . . . . . . . . . . . . . . . . . . . . . . . . . . . . . 6.2 5.4 5.4Other items . . . . . . . . . . . . . . . . . . . . . . . . . . . . . . . . . . . . . . . . . . . . . . . . . . . . . . . . . . . . . . . . . (1.1) (0.3) (0.3)Effective income tax rate . . . . . . . . . . . . . . . . . . . . . . . . . . . . . . . . . . . . . . . . . . . . . . . . . . . . . . . 40.1% 40.1% 40.1%
The Company made income tax payments of approximately $2.6 million, $2.8 million, and $6.4 million, during 2004, 2003,and 2002, respectively. The Company expects to realize its deferred tax assets through tax deductions against future taxableincome or carry back against taxes previously paid.
4. Pension PlansThe Company and its subsidiaries sponsor two defined benefit pension plans which cover substantially all employees.
A third defined benefit pension plan is non-qualified and covers certain executive officers of the Company.The cost of these defined benefit plans and the balances of plan assets and obligations are as follows (in thousands):
Change in Benefit Obligation 2004 2003Benefit obligation
at January 1 . . . . . . . . . . . . . . . . . . $53,598 $47,788Service cost . . . . . . . . . . . . . . . . . . . . 1,563 1,507Interest cost . . . . . . . . . . . . . . . . . . . . 3,187 3,011Actuarial loss . . . . . . . . . . . . . . . . . . . 2,560 3,033Benefits paid . . . . . . . . . . . . . . . . . . . (1,794) (1,741)Benefit obligation
at December 31 . . . . . . . . . . . . . . . 59,114 53,598
Change in Plan AssetsFair value of plan assets
at January 1 . . . . . . . . . . . . . . . . . . 46,440 38,806Actual return on plan assets . . . . . . . 2,565 4,549Employer contributions . . . . . . . . . . . 3,132 4,826Benefits paid . . . . . . . . . . . . . . . . . . . (1,794) (1,741)Fair value of plan assets
at December 31 . . . . . . . . . . . . . . . 50,343 46,440Funded status . . . . . . . . . . . . . . . . . . (8,771) (7,158)Unrecognized net actuarial loss. . . . . 19,548 16,679Unrecognized prior
service cost . . . . . . . . . . . . . . . . . . 1,741 2,063Unrecognized transition
obligation (asset) . . . . . . . . . . . . . . 11 22Net amount recognized . . . . . . . . . . . $12,529 $11,606
Weighted Average Assumptions forthe years ended December 31, 2004 2003Discount rate . . . . . . . . . . . . . . . . . . . 6.0% 6.5%Expected long-term return on
plan assets . . . . . . . . . . . . . . . . . . 8.0% 8.0%Rate of compensation increases . . . . 5.0% 5.0%
Components of Net Periodic Pension CostService cost . . . . . . . . . . . . . . . . . . . . $ 1,563 $ 1,507Interest cost . . . . . . . . . . . . . . . . . . . . 3,187 3,011Expected return
on assets . . . . . . . . . . . . . . . . . . . . (3,743) (3,231)Amortization of unrecognized
transition asset. . . . . . . . . . . . . . . . 11 11Recognized gains. . . . . . . . . . . . . . . . 870 770Prior service cost recognized. . . . . . . 320 566Net periodic pension cost . . . . . . . . . $ 2,208 $ 2,634

Amounts Recognized on the Balance Sheet 2004 2003Accrued benefit liability . . . . . . . . . . . $ (6,337) $ (4,729)Intangible asset . . . . . . . . . . . . . . . . . 1,741 1,926Accumulated other comprehensive income, net of tax. . 10,275 8,645
Deferred tax asset . . . . . . . . . . . . . . . 6,850 5,764$12,5299, $11,606
Weighted Average Assumptions as of December 31,Discount rate . . . . . . . . . . . . . . . . . . . 5.75% 6.00%Rate of compensation increases . . . . 5.00% 5.00%
Information for Pension Plans with an Accumulated Benefit Obligation in excess of plan assets 2004 2003Projected benefit obligation . . . . . . . . $59,114 $53,598 Accumulated benefit obligation . . . . . $56,680 $51,169 Fair value of plan assets . . . . . . . . . . $50,343 $46,440
Pension Weighted Average Asset Allocations as of December 31, Debt securities . . . . . . . . . . . . . . . . . . 66% 70%Equity securities. . . . . . . . . . . . . . . . . 28% 27%Money market funds . . . . . . . . . . . . . 6% 3%
100% 100%
The estimated future benefit payments for the defined benefit plans, which reflect future service as appropriate, for each ofthe next five years and the total amount for years six through ten, are as follows: 2005-$2.1 million, 2006-$2.2 million, 2007-$2.3million, 2008-$2.6 million, 2009-$2.9 million and for the five year period ending 2014-$18.3 million.
The accumulated benefit obligation for all the defined benefit pension plans was $56.7 million and $51.2 million as ofDecember 31, 2004 and 2003, respectively. Intangible assets are included in other assets in the balance sheet.
The measurement dates of the assets and liabilities of all plans presented for 2004 and 2003 were December 31, 2004 andDecember 31, 2003, respectively.
The Company expects to contribute $2.7 million in the form of cash payments to its pension plans in 2005. None of this con-tribution is required by funding regulations or laws. The investment objective is to produce income and long-term appreciationthrough a target asset allocation of 75% debt securities and other fixed income investments including cash and short-terminstruments, and 25% of equity investments, to provide for the current and future benefit payments of the plans. The pensionplans are not invested in the common stock of the Company.
The Company determines the expected return on plan assets based on the target asset allocations. In addition, the historicalreturns of the plan assets are also considered in arriving at the expected rate of return.
The Company also sponsors two defined contribution plans which cover substantially all of its hourly and salaried employ-ees and a non-qualified defined contribution plan which covers certain of its salaried employees. Expenses related to the definedcontribution plans were $0.7 million, $1.5 million, and $1.6 million in 2004, 2003, and 2002, respectively.
In accordance with SFAS No. 87, “Employers’ Accounting for Pension Costs,” the Company recorded an additional minimumpension liability, net of tax which decreased comprehensive income by $1.6 million, $0.6 million, and $7.9 million in 2004, 2003,and 2002, respectively.
5. Stock Incentive and Bonus PlansIn 1998, the Company adopted, and in May 1999 the shareholders approved, the 1998 Stock Incentive Plan (the “1998
Plan”) under which employees may be granted options to purchase shares of the Company’s Common Stock and stockappreciation rights. The Company has reserved 2,000,000 shares for issuance under the 1998 Plan. These options have anexercise price equal to the fair market value of the shares of the Company at the date of grant, become vested ratably overfive years, and expire ten years from the date of grant. To date, no stock appreciation rights have been granted.
On December 18, 2000, the Company adopted, and in May 2001 the shareholders approved, the 2001 Stock Option Planfor Non-Employee Directors (the “2001 Plan”) under which non-employee directors are granted options to purchase shares ofthe Company’s authorized but unissued stock. The Company has reserved 200,000 shares for issuance under the 2001 Plan.Options granted under the 2001 Plan have an exercise price equal to the fair market value of the shares of the Company atthe date of grant and expire ten years from the date of grant. Twenty-five percent of the options vest immediately and theremaining options vest ratably over three years.
Notes to Financial Statements(Continued)
The following table summarizes the activity of the Plans:Weighted Average
Shares Exercise PriceOutstanding at December 31, 2001 . . . . . . . . . . . . . . . . . . . . . . . . . . . . . . . . . . . . . . . . . . . . . . . 1,490,000 $11.65
Granted . . . . . . . . . . . . . . . . . . . . . . . . . . . . . . . . . . . . . . . . . . . . . . . . . . . . . . . . . . . . . . . . . . . – –Exercised . . . . . . . . . . . . . . . . . . . . . . . . . . . . . . . . . . . . . . . . . . . . . . . . . . . . . . . . . . . . . . . . . . – –Canceled . . . . . . . . . . . . . . . . . . . . . . . . . . . . . . . . . . . . . . . . . . . . . . . . . . . . . . . . . . . . . . . . . . (160,000) 11.94
Outstanding at December 31, 2002 . . . . . . . . . . . . . . . . . . . . . . . . . . . . . . . . . . . . . . . . . . . . . . . 1,330,000 11.62Granted . . . . . . . . . . . . . . . . . . . . . . . . . . . . . . . . . . . . . . . . . . . . . . . . . . . . . . . . . . . . . . . . . . . – –Exercised . . . . . . . . . . . . . . . . . . . . . . . . . . . . . . . . . . . . . . . . . . . . . . . . . . . . . . . . . . . . . . . . . . – –Canceled . . . . . . . . . . . . . . . . . . . . . . . . . . . . . . . . . . . . . . . . . . . . . . . . . . . . . . . . . . . . . . . . . . (235,000) 11.94
Outstanding at December 31, 2003 . . . . . . . . . . . . . . . . . . . . . . . . . . . . . . . . . . . . . . . . . . . . . . . 1,095,000 11.55Granted . . . . . . . . . . . . . . . . . . . . . . . . . . . . . . . . . . . . . . . . . . . . . . . . . . . . . . . . . . . . . . . . . . . – –Exercised . . . . . . . . . . . . . . . . . . . . . . . . . . . . . . . . . . . . . . . . . . . . . . . . . . . . . . . . . . . . . . . . . . – –Canceled . . . . . . . . . . . . . . . . . . . . . . . . . . . . . . . . . . . . . . . . . . . . . . . . . . . . . . . . . . . . . . . . . . (20,000) 9.88
Outstanding at December 31, 2004 . . . . . . . . . . . . . . . . . . . . . . . . . . . . . . . . . . . . . . . . . . . . . . . 1,075,000 $11.58
There were 1,027,000 exercisable options at December 31, 2004, with a weighted average exercise price of $11.65 andan average contractual life remaining of 4.3 years. At December 31, 2004, an aggregate of 1,125,000 shares remain availablefor grant under the Plans.
The weighted average fair value of options granted under the Plans was estimated at $1.87 on the date of grant usingthe Black-Scholes option-pricing model with the following weighted average assumptions in 2001: dividend yield of 8.0%,expected volatility of 34.3%, risk free rate of return of 2.0%, and expected lives of 5 years. The estimated fair value of optionsgranted is subject to the assumptions made and if the assumptions changed, the estimated fair value amounts could besignificantly different.
The Company’s Stock Bonus Plan, as amended, covers its key employees excluding members of the Ruger family.Pursuant to the Plan, awards are made of Common Stock and a cash bonus approximating the estimated income tax on theawards. At December 31, 2004, 502,000 shares of Common Stock were reserved for future awards.
6. Contingent LiabilitiesAs of December 31, 2004, the Company is a defendant in approximately 9 lawsuits involving its products and is aware of certain other such claims. These lawsuits and claims fall into two categories:(i) Those that claim damages from the Company related to allegedly defective product design which stem from a
specific incident. These lawsuits and claims are based principally on the theory of “strict liability” but also may bebased on negligence, breach of warranty, and other legal theories, and
(ii) Those brought by cities, municipalities, counties, associations, individuals and one state Attorney General againstfirearms manufacturers, distributors and dealers seeking to recover damages allegedly arising out of the misuse offirearms by third parties in the commission of homicides, suicides and other shootings involving juveniles and adults.The complaints by municipalities seek damages, among other things, for the costs of medical care, police and emergen-cy services, public health services, and the maintenance of courts, prisons, and other services. In certain instances, theplaintiffs seek to recover for decreases in property values and loss of business within the city due to criminal violence.In addition, nuisance abatement and/or injunctive relief is sought to change the design,manufacture, marketing and distribution practices of the various defendants. These suits allege, among other claims,strict liability or negligence in the design of products, public nuisance, negligent entrustment, negligent distribution,deceptive or fraudulent advertising, violation of consumer protection statutes and conspiracy or concert of action theories. Most of these cases do not allege a specific injury to a specific individual as a result of the misuse or use of any of the Company’s products.
Management believes that, in every case, the allegations are unfounded, and that the shootings and any results therefromwere due to negligence or misuse of the firearms by third-parties or the claimant, and that there should be no recovery againstthe Company. Defenses further exist to the suits brought by cities, municipalities, counties, and the Attorney General based,among other reasons, on established state law precluding recovery by municipalities for essential government services, theremoteness of the claims, the types of damages sought to be recovered, and limitations on the extraterritorial authority whichmay be exerted by a city, municipality, county or state under state and federal law, including State and Federal Constitutions.
23

Provision is made for product liability claims based upon many factors related to the severity of the alleged injury andpotential liability exposure, based upon prior claim experience. Because the Company’s experience in defending these law-suits and claims is that unfavorable outcomes are typically not probable or estimable, only in rare cases is an accrual estab-lished for such costs. In most cases, an accrual is established only for estimated legal defense costs. Product liabilityaccruals are periodically reviewed to reflect then-current estimates of possible liabilities and expenses incurred to date andreasonably anticipated in the future. Threatened product liability claims are reflected in the Company’s product liabilityaccrual on the same basis as actual claims; i.e., an accrual is made for reasonably anticipated possible liability and claims-handling expenses on an ongoing basis.
A range of reasonably possible loss relating to unfavorable outcomes cannot be made. However, in the product liabilitycases in which a dollar amount of damages is claimed, the amount of damages claimed, which totaled $435 million and $436million at December 31, 2004 and 2003, respectively, are set forth as an indication of possible maximum liability that theCompany might be required to incur in these cases (regardless of the likelihood or reasonable probability of any or all of thisamount being awarded to claimants) as a result of adverse judgments that are sustained on appeal.
Product liability claim payments are made when appropriate if, as, and when claimants and the Company reach agree-ment upon an amount to finally resolve all claims. Legal costs are paid as the lawsuits and claims develop, the timing ofwhich may vary greatly from case to case. A time schedule cannot be determined in advance with any reliability concerningwhen payments will be made in any given case.
While it is not possible to forecast the outcome of litigation or the timing of costs, in the opinion of management, afterconsultation with independent and corporate counsel, it is not probable and is unlikely that litigation, including punitivedamage claims, will have a material adverse effect on the financial position of the Company, but may have a material impacton the Company’s financial results for a particular period.
7. Asset Impairment ChargesIn 2002 the Company recognized asset impairment charges of $3.3 million related to certain assets in the investment
castings segment. As a result of the significant reduction in sales and substantial losses incurred by this segment, in 2002the Company evaluated the recoverability of certain assets and wrote off $1.0 million of a building and $2.3 million of machin-ery and equipment. The Company was required to reduce the carrying value of the assets to fair value and recognized assetimpairment charges, because the carrying value of the affected assets exceeded the projected future undiscounted cashflows. The fair value of the building was based on available market data and the fair value of the machinery and equipmentwas based on estimated discounted cash flows from the assets.
A similar evaluation of the recoverability of other certain assets in the investment castings segment was performed in2003 and 2004. These evaluations did not result in the recognition of an additional asset impairment charge.
8. Related Party TransactionsIn 2004, 2003, and 2002, the Company paid Newport Mills, of which William B. Ruger, Jr., Chairman and Chief Executive
Officer of the Company, is the sole proprietor, $243,000, $243,000, and $222,750, respectively, for storage rental and officespace. On July 17, 2003, the Company sold two automobiles to Mr. Ruger, Jr. for $60,000.
9. Operating Segment InformationThe Company has two reportable operating segments: firearms and investment castings. The firearms segment manufac-
tures and sells rifles, pistols, revolvers, and shotguns principally to a select number of licensed independent wholesale distrib-utors primarily located in the United States. The investment castings segment consists of two operating divisions whichmanufacture and sell titanium and steel investment castings.
Corporate segment income relates to interest income on short-term investments, the sale of non-operating assets, andother non-operating activities. Corporate segment assets consist of cash and short-term investments and other non-operat-ing assets.
The Company evaluates performance and allocates resources, in part, based on profit or loss before taxes. The account-ing policies of the reportable segments are the same as those described in the summary of significant accounting policies(see Note 1).
Intersegment sales are recorded at the Company’s cost plus a fixed profit percentage. The $3.3 million asset impairmentcharges recorded in 2002 are included in the investment castings segment.
The Company’s assets are located entirely in the United States and export sales are insignificant.Revenues from one customer in the firearms segment totaled $16.0 million in 2004. Revenues from another customer in
the firearms segment totaled $15.7 million and $15.5 million in 2004 and 2003, respectively. Revenues from a third customerin the firearms segment totaled $15.1 million, $24.8 million, and $24.0 million in 2004, 2003, and 2002, respectively.
Notes to Financial Statements(Continued)
25
Year ended December 31, (in thousands) 2004 2003 2002Restated
Net SalesFirearms. . . . . . . . . . . . . . . . . . . . . . . . . . . . . . . . . . . . . . . . . . . . . . . . . . . . . . $ 124,924 $130,558 $139,762Castings
Unaffiliated. . . . . . . . . . . . . . . . . . . . . . . . . . . . . . . . . . . . . . . . . . . . . . . . . . 20,700 17,359 21,825Intersegment . . . . . . . . . . . . . . . . . . . . . . . . . . . . . . . . . . . . . . . . . . . . . . . . 14,363 15,653 17,679
35,063 33,012 39,504Eliminations . . . . . . . . . . . . . . . . . . . . . . . . . . . . . . . . . . . . . . . . . . . . . . . . . . . (14,363) (15,653) (17,679)
$ 145,624 $147,917 $161,587Income (Loss) Before Income Taxes
Firearms. . . . . . . . . . . . . . . . . . . . . . . . . . . . . . . . . . . . . . . . . . . . . . . . . . . . . . $ 10,811 $ 18,392 $ 23,673Castings. . . . . . . . . . . . . . . . . . . . . . . . . . . . . . . . . . . . . . . . . . . . . . . . . . . . . . (3,942) (4,439) (11,230)Corporate . . . . . . . . . . . . . . . . . . . . . . . . . . . . . . . . . . . . . . . . . . . . . . . . . . . . 1,182 6,688 1,692
$ 8,051 $ 20,641 $ 14,135Identifiable Assets
Firearms. . . . . . . . . . . . . . . . . . . . . . . . . . . . . . . . . . . . . . . . . . . . . . . . . . . . . . $ 77,824 $ 72,600 $ 79,301Castings. . . . . . . . . . . . . . . . . . . . . . . . . . . . . . . . . . . . . . . . . . . . . . . . . . . . . . 19,657 17,939 19,394Corporate. . . . . . . . . . . . . . . . . . . . . . . . . . . . . . . . . . . . . . . . . . . . . . . . . . . . . 49,979 72,334 85,263
$ 147,460 $162,873 $183,958Depreciation
Firearms. . . . . . . . . . . . . . . . . . . . . . . . . . . . . . . . . . . . . . . . . . . . . . . . . . . . . . $ 3,220 $ 3,301 $ 3,448Castings. . . . . . . . . . . . . . . . . . . . . . . . . . . . . . . . . . . . . . . . . . . . . . . . . . . . . . 2,607 2,622 4,042
$ 5,827 $ 5,923 $ 7,490Capital Expenditures
Firearms. . . . . . . . . . . . . . . . . . . . . . . . . . . . . . . . . . . . . . . . . . . . . . . . . . . . . . $ 4,403 $ 3,215 $ 2,767Castings. . . . . . . . . . . . . . . . . . . . . . . . . . . . . . . . . . . . . . . . . . . . . . . . . . . . . . 2,542 781 388
$ 6,945 $ 3,996 $ 3,155
10. Quarterly Results of Operations (Unaudited)The following is a tabulation of the unaudited quarterly results of operations for the two years ended December 31, 2004
(in thousands, except per share data):Three Months Ended
3/31/04 6/30/04 9/30/04 12/31/04Restated
Net sales . . . . . . . . . . . . . . . . . . . . . . . . . . . . . . . . . . . . . . . . . . . . . . . . . . . . . . . . $40,237 $32,713 $35,380 $37,295Gross profit . . . . . . . . . . . . . . . . . . . . . . . . . . . . . . . . . . . . . . . . . . . . . . . . . . . . . . 12,211 4,762 4,998 7,928Net income (loss) . . . . . . . . . . . . . . . . . . . . . . . . . . . . . . . . . . . . . . . . . . . . . . . . . 3,879 (461) (20) 1,425Basic and diluted earnings (loss) per share . . . . . . . . . . . . . . . . . . . . . . . . . . . 0.14 (0.02) – 0.05
Three Months Ended3/31/03 6/30/03 9/30/03 12/31/03
Net sales . . . . . . . . . . . . . . . . . . . . . . . . . . . . . . . . . . . . . . . . . . . . . . . . . . . . . . . . . $41,132 $31,801 $36,820 $38,164Gross profit . . . . . . . . . . . . . . . . . . . . . . . . . . . . . . . . . . . . . . . . . . . . . . . . . . . . . . . 12,437 6,507 5,718 10,066Net income . . . . . . . . . . . . . . . . . . . . . . . . . . . . . . . . . . . . . . . . . . . . . . . . . . . . . . . 4,527 1,035 3,852 2,950Basic and diluted earnings per share . . . . . . . . . . . . . . . . . . . . . . . . . . . . . . . . . . 0.17 0.04 0.14 0.11

REPORT OF INDEPENDENT REGISTERED PUBLIC ACCOUNTING FIRM
The Board of Directors and StockholdersSturm, Ruger & Company, Inc.:
We have audited the accompanying balance sheets of Sturm, Ruger & Company, Inc. as of December 31, 2004 and2003, and the related statements of income, stockholders’ equity, and cash flows for each of the years in the three-year periodended December 31, 2004. In connection with our audits of the financial statements, we also have audited the accompanyingfinancial statement schedule. These financial statements and financial statement schedule are the responsibility of theCompany’s management. Our responsibility is to express an opinion on these financial statements based on our audits.
We conducted our audits in accordance with the standards of the Public Company Accounting Oversight Board (UnitedStates). Those standards require that we plan and perform the audit to obtain reasonable assurance about whether the financialstatements are free of material misstatement. An audit includes examining, on a test basis, evidence supporting the amountsand disclosures in the financial statements. An audit also includes assessing the accounting principles used and significantestimates made by management, as well as evaluating the overall financial statement presentation. We believe that our auditsprovide a reasonable basis for our opinion.
In our opinion, the financial statements referred to above present fairly, in all material respects, the financial position ofSturm, Ruger & Company, Inc. as of December 31, 2004 and 2003, and the results of its operations and its cash flows for eachof the years in the three-year period ended December 31, 2004, in conformity with U.S. generally accepted accounting princi-ples. Also in our opinion, the related financial statement schedule, when considered in relation to the basic financial state-ments taken as a whole, presents fairly, in all material respects, the information set forth therein.
As discussed in note 2 to the financial statements, the Company has restated its financial statements as of December 31,2004 and for the year then ended.
We also have audited, in accordance with the standards of the Public Company Accounting Oversight Board (UnitedStates), the effectiveness of Sturm, Ruger & Company Inc.’s internal control over financial reporting as of December 31, 2004,based on criteria established in Internal Control—Integrated Framework issued by the Committee of Sponsoring Organizationsof the Treadway Commission (COSO), and our report dated March 8, 2005, except as to the third, fifth, and sixth paragraphs ofManagement’s Report on Internal Control Over Financial Reporting (restated), which are as of March 31, 2006, expressed anunqualified opinion on management’s assessment of, and an adverse opinion on the effective operation of, internal control overfinancial reporting as of December 31, 2004.
Stamford, Connecticut March 8, 2005, except as to note 2 to the financial statements which is as of March 31, 2006
Notes to Financial Statements(Continued)
27

Report of Management Stockholder Information 29
The Board of Directors and StockholdersSturm, Ruger & Company, Inc:
Restatement
As discussed in Note 2 to the financial statements contained in Item 8 of this Amendment and Item 4.02(a) of theCompany’s Current Report on Form 8-K filed on March 14, 2006, management of the Company has amended its AnnualReport on Form 10-K for the year ended December 31, 2004. The determination to restate these financial statements wasmade after an error in the calculation of the LIFO index as of December 31, 2004 was identified.
Evaluation of Disclosure Controls and Procedures
The Company conducted an evaluation, with the participation of its Chief Executive Officer and Chief Financial Officer,of the effectiveness of the design and operation of the Company’s disclosure controls and procedures, as defined in Rules 13a-15(e) and 15d-15(e) under the Securities Exchange Act of 1934, as amended, as of December 31, 2004.
Based upon that evaluation, the Chief Executive Officer and Chief Financial Officer have concluded that as ofDecember 31, 2004, our disclosure controls and procedures over financial reporting were not effective because of the materialweaknesses discussed below under “Management’s Report on Internal Control over Financial Reporting.”
Management’s Report on Internal Control over Financial Reporting (Restated)
The Company’s management is responsible for establishing and maintaining adequate internal control over financialreporting as defined in Rules 13a-15(f) and 15d-15(f) under the Securities Exchange Act of 1934.
Because of its inherent limitations, internal control over financial reporting may not prevent or detect misstatements.Also, projections of any evaluation of effectiveness to future periods are subject to the risk that controls may become inade-quate because of changes in conditions, or that the degree of compliance with the policies or procedures may deteriorate.
The Company conducted an evaluation, with the participation of its Chief Executive Officer and Chief FinancialOfficer, of the effectiveness of its internal control over financial reporting as of December 31, 2004. This evaluation wasperformed based on the framework in “Internal Control — Integrated Framework” issued by the Committee of SponsoringOrganizations of the Treadway Commission (“COSO”). In the Company’s previously filed Annual Report on Form 10-K forthe year ended December 31, 2004, management concluded that the Company’s internal control over financial reporting as ofDecember 31, 2004 was effective based upon the criteria in COSO. However, in March, 2006, the Company determined thatit needed to restate certain of its previously issued financial statements. As a result of such financial statement restatement,management reassessed the Company’s internal control over financial reporting using the COSO criteria and identified a mate-rial weakness in internal control over financial reporting as of December 31, 2004.
A material weakness is a control deficiency, or combination of control deficiencies, that results in more than a remotelikelihood that a material misstatement of the annual or interim financial statements will not be prevented or detected.
As of December 31, 2004, the Company did not maintain adequate supervisory review controls over the data used tocalculate the LIFO index. This control deficiency resulted in a material error that required the Company to restate its previous-ly issued financial statements as of and for the year ended December 31, 2004. Also, this control deficiency results in morethan a remote likelihood that a material misstatement of annual or interim financial statements would not be prevented ordetected. Accordingly, management has determined that this control deficiency constitutes a material weakness.
As a result of the aforementioned material weakness as of December 31, 2004, management has revised its previouslyreported assessment of the effectiveness of internal control over financial reporting and has concluded that, as of December31, 2004, the Company’s internal control over financial reporting was not effective.
Management’s restated assessment of the effectiveness of the Company’s internal control over financial reporting as ofDecember 31, 2004 has been audited by KPMG LLP, an independent registered public accounting firm, as stated in theirreport which appears in this Annual Report on Form 10-K/A.
Plan for Remediation of Material Weaknesses
Subsequent to December 31, 2005, the Company has taken steps towards remediation of the material weaknessdescribed above. Specifically, the Company has implemented additional procedures related to the review of data used in theLIFO index calculation.
Changes in Internal Control over Financial Reporting
There were no changes in our internal control over financial reporting that occurred during our most recently completedfiscal quarter (quarter ended December 31, 2004) that has materially affected, or is reasonably likely to materially affect, ourinternal control over financial reporting.
REPORT OF INDEPENDENT REGISTERED PUBLIC ACCOUNTING FIRM
The Board of Directors and StockholdersSturm, Ruger & Company, Inc.:
We have audited management's assessment, included in the accompanying Management’s Report on Internal ControlOver Financial Reporting (restated), that Sturm, Ruger & Company, Inc. did not maintain effective internal control overfinancial reporting as of December 31, 2004, because of the effect of a material weakness identified in management's assess-ment, based on criteria established in Internal Control—Integrated Framework issued by the Committee of SponsoringOrganizations of the Treadway Commission (COSO). Sturm, Ruger & Company Inc.’s management is responsible for main-taining effective internal control over financial reporting and for its assessment of the effectiveness of internal control overfinancial reporting. Our responsibility is to express an opinion on management's assessment and an opinion on the effective-ness of the Company's internal control over financial reporting based on our audit.
We conducted our audit in accordance with the standards of the Public Company Accounting Oversight Board (UnitedStates). Those standards require that we plan and perform the audit to obtain reasonable assurance about whether effectiveinternal control over financial reporting was maintained in all material respects. Our audit included obtaining an understand-ing of internal control over financial reporting, evaluating management's assessment, testing and evaluating the design andoperating effectiveness of internal control, and performing such other procedures as we considered necessary in the circum-stances. We believe that our audit provides a reasonable basis for our opinion.
A company's internal control over financial reporting is a process designed to provide reasonable assurance regardingthe reliability of financial reporting and the preparation of financial statements for external purposes in accordance with gen-erally accepted accounting principles. A company's internal control over financial reporting includes those policies and proce-dures that (1) pertain to the maintenance of records that, in reasonable detail, accurately and fairly reflect the transactions anddispositions of the assets of the company; (2) provide reasonable assurance that transactions are recorded as necessary topermit preparation of financial statements in accordance with generally accepted accounting principles, and that receipts andexpenditures of the company are being made only in accordance with authorizations of management and directors of thecompany; and (3) provide reasonable assurance regarding prevention or timely detection of unauthorized acquisition, use, ordisposition of the company's assets that could have a material effect on the financial statements.
Because of its inherent limitations, internal control over financial reporting may not prevent or detect misstatements.Also, projections of any evaluation of effectiveness to future periods are subject to the risk that controls may become inade-quate because of changes in conditions, or that the degree of compliance with the policies or procedures may deteriorate.
A material weakness is a control deficiency, or combination of control deficiencies, that results in more than a remotelikelihood that a material misstatement of the annual or interim financial statements will not be prevented or detected. Thefollowing material weakness has been identified and included in management's restated assessment as of December 31, 2004:The Company did not maintain adequate supervisory review controls over the data used to calculate the LIFO index. Thiscontrol deficiency resulted in a material error that required the Company to restate its previously issued financial statementsas of and for the year ended December 31, 2004. Also, this control deficiency results in more than a remote likelihood thata material misstatement of annual or interim financial statements would not be prevented or detected.
As stated in the sixth paragraph of Management’s Report on Internal Control Over Financial Reporting (restated),management’s assessment of the effectiveness of Sturm, Ruger & Company, Inc.’s internal control over financial reportinghas been restated to reflect the aforementioned material weakness in internal control over financial reporting.
We also have audited, in accordance with the standards of the Public Company Accounting Oversight Board (UnitedStates), the balance sheets of Sturm, Ruger & Company, Inc. as of December 31, 2004 and 2003, and the related statementsof income, stockholders’ equity, and cash flows for each of the years in the three-year period ended December 31, 2004. Theaforementioned material weakness was considered in determining the nature, timing, and extent of audit tests applied in ouraudit of the 2004 financial statements (as restated), and this report does not affect our report dated March 8, 2005, except asto note 2 to the financial statements which is as of March 31, 2006, which expressed an unqualified opinion on those financialstatements.

Report of Management
Common Stock DataThe Company’s Common Stock is traded on the New York Stock Exchange under the symbol “RGR.” At February 1, 2005, the Company had 1,973 stockholders of record.
The following table sets forth, for the periods indicated, the high and low sales prices for the Common Stock as reported on the New York Stock Exchange and dividends paid on Common Stock.
DividendsHigh Low Per Share
2004:First Quarter . . . . . . . . . . . . . . . . . . . . . . . $ 13.26 $ 10.98 $ .20Second Quarter . . . . . . . . . . . . . . . . . . . . 13.43 10.50 .20Third Quarter . . . . . . . . . . . . . . . . . . . . . . 11.63 8.12 .10Fourth Quarter . . . . . . . . . . . . . . . . . . . . . 9.55 8.35 .10
2003:First Quarter . . . . . . . . . . . . . . . . . . . . . . . $ 11.20 $ 8.76 $ .20Second Quarter . . . . . . . . . . . . . . . . . . . . . 10.29 8.24 .20Third Quarter . . . . . . . . . . . . . . . . . . . . . . . 11.97 10.06 .20Fourth Quarter . . . . . . . . . . . . . . . . . . . . . . 11.75 10.40 .20
Annual MeetingThe Annual Meeting of Stockholders was held on May 3, 2005 at the LakeSunapee Country Club, New London,New Hampshire, at 10:30 am. May 4, 2
004 at the Lake Sunapee Country Club,
Principal BanksBank of America, Southport, ConnecticutLake Sunapee Savings Bank, Newport,
New HampshireSugar River Savings Bank, Newport,
New HampshireBank One, Arizona, NA, Prescott,
Arizona
Transfer AgentComputershare Investor Services, L.L.C.Attention: Shareholder Communications2 North LaSalle StreetP.O. Box A3504Chicago, IL 60690-5190www.computershare.com
Independent Registered PublicAccounting FirmKPMG LLP, Stamford, Connecticut
Corporate AddressTo correspond with the Company or to request a copy of the Annual Reporton Form 10-K for 2004 free of charge, please visit our website www.ruger.comor write to:
Corporate SecretarySturm, Ruger & Company, Inc.One Lacey PlaceSouthport, Connecticut 06890Telephone: 203-259-7843Fax: 203-256-3367
FacilitiesAll Ruger firearms and investment castingsare proudly designed and manufactured byAmerican workers at Ruger facilities inNewport, New Hampshire and Prescott,Arizona. Corporate Headquarters islocated in Southport, Connecticut U.S.A.
Corporate Governance InformationOur Corporate Code of Business Conduct and Ethics, Corporate Board Governance Guidelines, andcharters for our Nominating and Corporate Governance, Audit, and Compensation Committees are postedon our Stockholder Relations section of our corporate website at www.ruger.com. Simply click on“Corporate Governance Documents.” Written copies may also be obtained by telephoning our CorporateSecretary’s office at 203-259-7843, or by written request to the Corporate Headquarters at One LaceyPlace, Southport, CT 06890.
Shareholders, employees, or other persons wishing to anonymously report to the Board of Directors’Audit Committee any suspected accounting irregularities, auditing fraud, violations of our corporateCompliance Program, or violations of the Company’s Code of Business Conduct and Ethics, may do so bytelephoning 1-800-826-6762. This service is independently monitored 24 hours a day, 7 days a week.
Directors
William B. Ruger, Jr.Chairman
Stephen L. SanettiVice Chairman
Richard T. Cunniff*Vice Chairman, Ruane, Cunniff & Co., Inc.
Townsend Hornor*Corporate Director
John M. Kingsley, Jr.* Corporate Director
James E. Service*ConsultantDirector
Officers
William B. Ruger, Jr.Chief Executive Officer
Stephen L. SanettiPresident and Chief Operating Officer
Thomas A. DineenTreasurer andChief Financial Officer
Leslie M. GasperCorporate Secretary
* Audit Committee Member,
Compensation Committee Member,
and Nominating and Corporate
Governance Committee Member
Stockholder Information 31
REPORT OF INDEPENDENT REGISTERED PUBLIC ACCOUNTING FIRM
In our opinion, management's restated assessment that Sturm, Ruger & Company Inc. did not maintain effective inter-nal control over financial reporting as of December 31, 2004, is fairly stated, in all material respects, based on criteria estab-lished in Internal Control—Integrated Framework issued by COSO. Also, in our opinion, because of the effect of the materialweakness described above on the achievement of the objectives of the control criteria, Sturm, Ruger & Company, Inc. did notmaintain effective internal control over financial reporting as of December 31, 2004, based on criteria established in InternalControl—Integrated Framework issued by COSO.
Stamford, Connecticut March 8, 2005, except as to the third, fifth, and sixth paragraphs of Management’s Report on Internal Control Over FinancialReporting (restated), which are as of March 31, 2006
Corporate DisclosureThe Chief Executive Officer has certified to the New York Stock Exchange that he is not awareof any violation by the Company of the New York Stock Exchange governance listing standards.The Section 302 Chief Executive Officer and Chief Financial Officer certification has been filedas an exhibit to the Company’s Form 10-K/A.

Made in America
www.ruger.com