Embed Size (px)
Citation preview
1
INORGANIC NITROGEN LEACHING AND AGRONOMIC RESPONSE OF ST AUGUSTINEGRASS TO NITROGEN FERTILIZATION STRATEGIES UNDER
RESIDENTIAL LAWN CONDITIONS
By
NEIL GRAHAM MILLER YOUNG
A THESIS PRESENTED TO THE GRADUATE SCHOOL OF THE UNIVERSITY OF FLORIDA IN PARTIAL FULFILLMENT
OF THE REQUIREMENTS FOR THE DEGREE OF MASTER OF SCIENCE
UNIVERSITY OF FLORIDA
2009

2
© 2009 Neil Graham Miller Young

3
To mum and dad who gave the encouragement and support to go back to school

4
ACKNOWLEDGMENTS
Sincere thanks are accredited to Dr. John Cisar for providing the opportunity to study and
work in a discipline I love, for always making time to discuss technical and scientific matters,
and for making research entertaining. Gratitude must be expressed to Dr. Snyder for agreeing to
chair my committee despite having retired, although fortunately, Dr. Snyder’s definition of
retirement differs from most. Unlike any one I know, Dr. Snyder. has an uncanny ability to
furnish knowledge without trying and on every single occasion I had the pleasure of talking with
him I learned something new about soil fertility and field research. I thank Drs. Sartain and
Erickson who patiently served on my committee and provided great scientific incite into my
research. The support and advice from Ms. Karen Williams was extremely valuable. The huge
contributions and help from Ms. Eva King with tissue preparation and digestion were greatly
appreciated. Thanks are given to Mr. Bill Latham for providing analytical training and always
being available when problems arose with my water analysis. Great thanks are given to Dr.
Wright for providing the full use of his laboratory. The humor, support, and analytical prowess
of Dr. Luo made tissue nitrogen determinations an absolute joy. I credit my parents Dr. Graham
and Anne Young whose encouragement and support made this experience possible. I express my
undying gratitude to my girlfriend Rachel who provided endless amounts of help with all facets
of my research, who was extremely understanding about the lack of time I could devote to her,
and for listening to my boring conversions about soils and plants. The support, opportunities, and
professional development advice that Dr. Kathie Kalmowitz has provided through my graduate
schooling has been thoroughly appreciated. Finally, the author would like to thank the Florida
Department of Environmental Protection for providing the funding for this experiment and for
their continued support of environmentally based soil and water research that greatly benefits the
State of Florida.

5
TABLE OF CONTENTS page
ACKNOWLEDGMENTS ...............................................................................................................4
LIST OF TABLES ...........................................................................................................................7
LIST OF FIGURES .........................................................................................................................9
ABSTRACT ...................................................................................................................................10
CHAPTER
1 INTRODUCTION ..................................................................................................................12
St. Augustinegrass Land use influenced Demographics .........................................................12 Anthropogenic and Ecological Implications from Lawn Fertilization ...................................12 Fertilizer Ordinance and Labeling Restrictions ......................................................................13
2 THE INFLUENCE OF VARIOUS NITROGEN STRATEGIES ON ST. AUGUSTINEGRASS QUALITY, DENSITY, YIELD, AND NITROGEN UPTAKE. .......16
Introduction .............................................................................................................................16 Nitrogen (N) Source Categorization and Benefits ..................................................................16
Biosolid N Management under Turfgrass Conditions .....................................................17 Controlled-Release Liquid N Sources in Turfgrass .........................................................18 Polymer-Coated Urea Fertilization in Turfgrass .............................................................19
Research Objectives ................................................................................................................19 Materials and Methods ...........................................................................................................20
Visual Assessments .........................................................................................................22 St. Augustinegrass Tissue Harvest and Analysis ............................................................22
Statistical Design and Analysis ..............................................................................................23 Results and Discussion ...........................................................................................................23
Comparisons of N Sources Based on N-Release Categorization ....................................23 Comparisons of N Sources Applied at 49 kg ha-1 at 60-d Intervals ................................26 Comparisons of N Sources Applied at 98 kg ha-1 at 120-d Intervals .............................29 Comparisons within N Sources Applied at 147 kg ha-1 at 180-d Intervals .....................32 The Relationship between Controlled-Release Nitrogen Rate and St.
Augustinegrass Yield ...................................................................................................35 Conclusions .............................................................................................................................36
3 INORGANIC NITROGEN LEACHING FROM ST AUGUSTINEGRASS IN RESPONSE TO NITROGEN FERTILIZATION STRATEGIES UNDER RESIDENTIAL LAWN CONDITIONS ................................................................................47
Introduction .............................................................................................................................47 Research Objectives ................................................................................................................49

6
Materials and Methods ...........................................................................................................50 Construction Specifications of the Field-Based N Leaching Facility .............................51 Percolate Sampling and Field Quality Assurance ...........................................................52 Percolate Water Sample Analysis and Laboratory Quality Assurance ...........................53
Results and Discussion ...........................................................................................................54 Flow-Weighted NOx-N Concentrations Influenced by N Source and Hydrology ..........54 Nitrogen Leaching Influenced by N Source ....................................................................60 Relative Recovery of Inorganic Nitrogen in Percolate and Clipping ..............................61 Potential Nitrogen Losses other than Leaching or Plant Uptake .....................................62
Conclusion ..............................................................................................................................66
APPENDIX
A CLIMATOLOGY DATA .......................................................................................................84
B PERCOLATE VOLUMES ...................................................................................................855
LIST OF REFERENCES .............................................................................................................866
BIOGRAPHICAL SKETCH .......................................................................................................966

7
LIST OF TABLES
Table page 2-1 Effect of fertilizer treatments on selected soil characteristics averaged over the 24-
mo study period.†...............................................................................................................38
2-2 Nitrogen (N) source description and application information. .........................................39
2-3 The influence of N source, application rate, and frequency on average visual quality over 60-d cycles across 2007 and 2008. ............................................................................40
2-4 The influence of N source, application rate, and frequency on visual density evaluated ~ every 3-mo across 2007 and 2008. .................................................................41
2-5 The influence of N source, application rate, and frequency on dry weight yield over each 60-d cycle across 2007 and 2008. ..............................................................................42
2-6 The influence of N source, application rate, and frequency on nitrogen uptake over each 60-d cycle across 2007 and 2008. ..............................................................................43
3-1 The influence of N source applied at 49 kg N ha-1 on flow-weighted concentration of NO3-N (mg L-1) averaged over each 60-d cycle across 2007 and 2008. ...........................68
3-2 The influence of N source applied at 98 kg N ha-1 on flow-weighted concentration of NO3-N (mg L-1) averaged over each 120-d cycle across 2007 and 2008. .........................69
3-3 The influence of N source applied at 147 kg ha-1 on flow-weighted concentration of NO3-N (mg L-1) averaged over each 180-d cycle across 2007 and 2008. .........................69
3-4 Nitrogen budget of inputs vs. N accounted for by N leaching and St. Augustinegrass N uptake for cycle 1 (April 30 – June 30, 2007). ..............................................................73
3-5 Nitrogen budget of inputs vs. N accounted for by N leaching and St. Augustinegrass N uptake for cycle 2 (July 1– August 31, 2007). ...............................................................74
3-6 Nitrogen budget of inputs vs. N accounted for by N leaching and St. Augustinegrass N uptake for cycle 3 (September 1 – November 7, 2007). ................................................74
3-7 Nitrogen budget of inputs vs. N accounted for by N leaching and St. Augustinegrass N uptake for cycle 5 (January 6 – March 7, 2008). ...........................................................75
3-8 Nitrogen budget of inputs vs. N accounted for by N leaching and St. Augustinegrass N uptake for cycle 6 (March 8 – May 9, 2008). ................................................................75
3-9 Nitrogen budget of inputs vs. N accounted for by N leaching and St. Augustinegrass N uptake for cycle 7 (May 9 – July 7, 2008). ....................................................................76

8
3-10 Nitrogen budget of inputs vs. N accounted for by N leaching and St. Augustinegrass N uptake for cycle 8 (July 8 – September 6, 2008). ..........................................................76
3-11 Nitrogen budget of inputs vs. N accounted for by N leaching and St. Augustinegrass N uptake for cycle 9 (September 6 – November 13, 2008). ..............................................77
3-12 Nitrogen budget of inputs vs. N accounted for by N leaching and St. Augustinegrass N uptake for cycle 10 (November 14 – January 13, 2008). ...............................................77
3-13 Nitrogen budget of inputs vs. N accounted for by N leaching and St. Augustinegrass N uptake for cycle 11 (January 14 – March 12, 2008). .....................................................78
3-14 Nitrogen budget of inputs vs. N accounted for by N leaching and St. Augustinegrass N uptake for cycle 12 (March 13 – May 15, 2008). ..........................................................78
3-15 Nitrogen budget of inputs vs. N accounted for by N leaching and St. Augustinegrass N uptake for cycle 1 (April 30 – August 31, 2007). ..........................................................79
3-16 Nitrogen budget of inputs vs. N accounted for by N leaching and St. Augustinegrass N uptake for cycle 3 (January 6 – March 7, 2008). ...........................................................80
3-17 Nitrogen budget of inputs vs. N accounted for by N leaching and St. Augustinegrass N uptake for cycle 4 (May 16 – September 6, 2008). ........................................................80
3-18 Nitrogen budget of inputs vs. N accounted for by N leaching and St. Augustinegrass N uptake for cycle 5 (September 7 – January 13, 2008). ...................................................81
3-19 Nitrogen budget of inputs vs. N accounted for by N leaching and St. Augustinegrass N uptake for cycle 6 (January 14 – May 15, 2008). ..........................................................81
3-20 Nitrogen budget of inputs vs. N accounted for by N leaching and St. Augustinegrass N uptake for cycle 1 (April 30 – November 7, 2008). .......................................................82
3-21 Nitrogen budget of inputs vs. N accounted for by N leaching and St. Augustinegrass N uptake for cycle 3 (May 10 – November 13, 2008). ......................................................83
3-22 Nitrogen budget of inputs vs. N accounted for by N leaching and St. Augustinegrass N uptake for cycle 4 (November 13 – May 15, 2008). ......................................................83
A-1 Climatology data (May-April, 2007 and 2008) for Ft. Lauderdale Research and Education Center (FLREC), FL, with long term norms. ...................................................84

9
LIST OF FIGURES
Figure Page 2-1 The duration of acceptable St. Augustinegrass quality (i.e ratings ≥ 6) provided by
controlled release nitrogen sources (CRNS) applied at 147 kg N ha-1 prior to the 4-mo rainy season fertilization on April 30, 2007.. ..............................................................44
2-2 The duration of acceptable St. Augustinegrass quality (i.e ratings ≥ 6) provided by CRNS applied at 147 kg N ha-1 prior to the 4-mo rainy season fertilization on May 15, 2008..............................................................................................................................45
2-3 The relationship between CRNS rate (i.e. 49, 98, 147 kg N ha-1) and average St. Augustinegrass yield during the 60-d period following initial fertilization in 2007. ........46
3-1 NOx-N leached in cycle 1 (April 30-August 31, 2007) influenced by N sources applied every 120-d at 98 kg N ha-1 and precipitation during the wet season (WS).. .......70
3-2 NOx-N leached in cycle 4 (May 10-September 6, 2008), influenced by N sources applied every 120-d at 98 kg N ha-1 and precipitation during the WS…… ......................70
3-3 NOx-N leached during cycles 1-3 (May 10-September 6), influenced by N sources applied every 60-d at 49 kg N ha-1 and precipitation during the WS…… ........................71
3-4 NOx-N leached in cycle 1 (April 30 – November 7), influenced by N sources applied at 147 kg N ha-1 every 180-d and precipitation during the WS… .....................................71
3-5 NOx-N leached during cycles 3 and 4 (May 10, 2008 – May 15, 2009), influenced by N sources applied at 147 kg N ha-1 every 180-d and precipitation. ...................................72
B-1 Percolate volumes averaged across each treatment collected over the 24-mo study period, indicating generally lower percolate during the dry season…….. ........................85

10
Abstract of Thesis Presented to the Graduate School of the University of Florida in Partial Fulfillment of the
Requirements for the Master of Science
NITROGEN LEACHING AND AGRONOMIC RESPONSE OF ST AUGUSTINEGRASS TO NITROGEN FERTILIZATION STRATEGIES UNDER RESIDENTIAL LAWN
CONDITIONS
By
Neil Graham Miller Young
December 2009 Chair: George Snyder Major: Soil and Water Science
In Florida, residential landscape fertilization legislation limits per-application nitrogen (N)
rates to 49 kg ha-1, prevent fertilization during the wet season, and control soluble-N to reduce
NO3-N in ground-water. Insufficient data are available to assess the efficacy of N-rate regulation.
The performance of controlled-release N sources (CRNS) and their capacity to leach N under
abundant seasonal precipitation on St. Augustinegrass [Stenotaphrum secundatum Walt. Kuntze]
grown on fine sand (Siliceous, hyperthermic Lythic Psammaquent) is unknown. Higher per-
application rates of CRNS may sustain agronomic responses (i.e. turf quality, density, growth,
and N-uptake) during restrictive seasons. A 24-mo field study compared these agronomic
responses and N leaching from polymer-coated urea (PCU), controlled-release liquid (CRL), and
biosolid (BSD) applied at 49, 98, and 147 kg N ha-1 on 60, 120, and 180-d re-application
intervals, respectively. Equal N combinations of PCU and urea, at 49 and 98 kg N ha-1 every 60
and 120 d, respectively provided responses equal to urea, which served as the base for
comparison at 49 kg N ha-1 every 60-d. Residual N carryover from preceding cycles was an
important agronomic factor for PCU and BSD at 49 kg N ha-1. Of the CRNS, PCU at 98 kg N ha-
1 provided the best responses. At 147 kg N ha-1 BSD and PCU were capable of sustaining

11
acceptable turf quality throughout restrictive seasons, with negligible NO3-N leaching. Initially,
urea at 49 kg N ha-1 produced maximum leaching losses of 12% of applied N. In subsequent
fertilization cycles, N leaching was greatly reduced despite intense hydrological events,
indicating N utilization may improve under adequate plant available nitrogen (PAN). Re-
application intervals (180-d) in excess of manufacture recommendations for CRL at 147 kg ha-1
resulted in progressively lower turf density and increased N leaching. Our findings suggest
soluble-N rate restrictions prevent excess N leaching. However, rate regulation of certain CRNS
prevents judicious N fertilization throughout restrictive seasons and if St. Augustinegrass density
declines during this period due to limited PAN, greater N leaching may result once fertilization
resumes.
12
CHAPTER 1 INTRODUCTION
St. Augustinegrass Land use influenced Demographics
Since 1990, demographic data reports the population in Florida has increased by 31.9% to
approximately 18.3 million residents (United States Census Bureau, 2008). Anthropogenic
intrusion of this magnitude has shown to drastically alter the nitrogen (N) cycle and more than
double the production rate of reactive nitrogen (Galloway and Cowling 2002; Galloway et al.
2004) with detrimental consequences to ecological systems and human health (Wolfe and Patz,
2002). Urban development in the US requires the inclusion of urban and domestic landscapes
with St. Augustinegrass sod production increasing dramatically in Florida to support urban
expansion (Haydu and Cisar, 1990). Recent land use trends suggest St. Augustinegrass
Stenotaphrum secundatum (Walt.) Kuntze landscapes encompass an estimated at 810,000 ha in
Florida (Trenholm and Unruh, 2007). In recent years, improving water resources in Florida has
become a key concern for regulatory bodies and has lead certain factions to implicate
fertilization practices on urban landscapes as a potential non-point source contributor to N
species degradation of surface and ground water.
Anthropogenic and Ecological Implications from Lawn Fertilization
As human populations escalate so does the demand for safe drinking water that must not
exceed the Maximum Contaminant Level (MCL) of 10 mg L-1 as NO3-N set by Environmental
Protection Agency (EPA) for human safety. Petrovic (1990) reported that groundwater accounts
for 86% of water resources and provides 24% of drinking water for urban areas in the contiguous
USA. According to the United States Geological Survey, 1% of public water supplies, 9% of
domestic water wells, and 21% of shallow wells in agricultural communities contain nitrate
(NO3-N) in excess of the MCL standard. Serious human health concerns are associated with

13
consumption of excessive NO3-N in drinking water. High level NO3-N ingestion is involved in
the aetiology of human cancer (Fraser et al. 1980), with increased incidences of gastric cancer
(Knight et al., 1989; van Leeuwen et al., 1999) and brain tumors (Mueller et al., 2004). More
publicized, however, has been the incidence of methaemoglobinaemia or “blue-baby” syndrome
where infants display symptoms of hypoxia (Mansouri, 1985).
Townsend et al. (2003) reported the eutrophication of coastal and marine ecosystems may be
an ecological factor that affects human health, due to the increased occurrence of harmful algae
blooms (HAB) in coastal water as a result of anthropogenic nutrient loading. On the West coast
of Florida the nearly annual occurrence of HAB, commonly known as “Florida Red Tide”, is due
to the toxic Dinoflagellate Karenia brevis or other closely related species, which are linked to
marine mortalities and human illness (Van Dolah, et al., 2009).
Sources of NO3-N contamination of groundwater are diverse and include effluent from
septic tanks, animal and human waste, and fertilization of agricultural lands (Keeney, 1986).
Flipse et al. (1984) proposed NO3-N from applied fertilizer N to urban turfgrass landscapes was a
primary source of ground-water contamination where these areas were a major land use. In
Florida, fertilizer N leaching to groundwater from urban landscapes has been implicated as a
potential non-point source contributor to the coastal marine eutrophication and in particular the
increasing incidence of “Florida Red Tide” in Sarasota Bay.
Fertilizer Ordinance and Labeling Restrictions
Even though no scientific evidence currently links N loading from urban landscapes with
nutrient pollution in the Gulf of Mexico, cities and municipalities have responded with
heightened regulatory restriction on urban fertilization practices in efforts to control red tide
outbreaks. These local government ordinances and resolutions supersede state-wide fertilizer

14
labeling legislation that was designed to moderate N species degradation of surface and ground
water resources. The state fertilizer labeling rule restricts per application N-rates to 49 kg N ha-1,
of which, the water-soluble N portion should not exceed 34 kg N ha-1 (Department of
Agricultural and Consumer services (DACS), No. 4640400, Rule 5E-1.003, 2007).
St. Johns County introduced the first restrictive fertilization ordinance on October 24, 2000;
when Guana Marsh Basin was identified as a critical sink for leached N. The enactment limited
the portion of soluble N applied from May 15 to October 15 and constrained annual N applied as
fertilizer to 196 kg ha-1 (Ordinance No. 2000-60), although three years later this enactment was
largely repealed with less stringent regulation (Ordinance No. 2003-52). Amidst growing
concern over the impact of severe red tide outbreaks on Florida’s multi-million dollar tourism
and fishing industries the previous year, resolution No. 2006-126 was proposed on May 24, 2006
that called for counties and cities in the Southwest Florida Region to uniformly adopt regulatory
urban fertilizer ordinances (Council of the City of Sannibel, Agenda item #4[b], 2006).
On March 6, 2007, the City of Sanibel enacted Ordinance No. 07-003 (Council of the City of
Sannibel, Water Resources Department) and later that year Sarasota County adopted the
Fertilizer and Landscape Management Code (Board of County Commissioners of Sarasota
County, Ordinance No. 2007-63). These legislative codes prohibit N fertilization during the
traditional rainy season in South Florida from June 1 through September 30, restrict annual N
applied as fertilizer to 196 kg ha-1, and further limit the per-application soluble N portion of
fertilizer to 24.5 kg ha-1. The City of Cape Coral passed similar fertilizer legislation with
Resolution 72-07 on August 29, 2007 (Commissioner Dolores Bertolin, personnel
communication), although seasonal restrictions were not imposed. In 2008, Lee and Charlotte
Counties followed suit with Ordinance No. 08-08 and 2008-028, respectively. However, only
15
Charlotte County chose to follow state Best Management Practices (BMP) guidelines (FDEP,
2008) and limit annual N to between 196 and 294 kg N ha-1 for St. Augustinegrass in South
Florida.
Fertilizer application limits of 49 kg N ha-1 have been imposed unilaterally across all N-
sources and may negate the best features of controlled-release nitrogen sources (CRNS) that
have been shown to be more effective when applied at infrequent higher per-application rates
(Skogley and King, 1968; Hummel and Waddington, 1984; Williams et al., 1997) with reduced
potential for N leaching (Rieke and Ellis, 1974; Brown et al., 1977; Nelson et al., 1980; Snyder
et al. 1981, 1984; Engelsjord and Singh, 1997; Guillard and Kopp, 2004). These enactments may
rule out judicious fertilization with higher rates of CRNS and sustain good turf quality and root
growth, before, during, and after restrictive rainy season periods and limit N leaching,.
There is a clear need to evaluate N-loss and agronomic responses of St. Augustinegrass under
variable N-source management and application regimes to better understand the efficacy of N-
rate regulation. The evaluation of N leaching under CRNS fertilization of St. Augustinegrass
may provide valuable information for regulatory bodies to determine if the same stringent rate
regulation is applicable to all sources and to ascertain if higher pre-application rates of these N-
sources, prior to restrictive seasons can sustain turf vigor for extended periods without
environmental consequences. Urban landscape fertilizer ordinances as they are currently written
may have damaging agronomic and environmental implications. Ultimately, if the goal is to
promote urban landscapes that have aesthetic value, while limiting N-pollution, all factors
involved with residential lawn fertilization and N-deposition must be considered.

16
CHAPTER 2 THE INFLUENCE OF VARIOUS NITROGEN STRATEGIES ON ST. AUGUSTINEGRASS
QUALITY, DENSITY, YIELD, AND NITROGEN UPTAKE.
Introduction
Urban landscapes have been implicated as a potential non-point source contributor to
nitrogen (N) species degradation of surface and ground water (Petrovic, 1990; King and Balogh,
2008). Recent land use trends suggest an increasing use of St. Augustinegrass [Stenotaphrum
secundatum (Walt.) Kuntze], in urban landscapes with currently an estimated 810,000 ha in
Florida (Trenholm and Unruh, 2007). Statewide fertilizer labeling legislation in conjunction with
city and municipality restrictions have been introduced in response to mounting concerns over
the impact of urban fertilization practices on Florida’s water resources. These enactments were
introduced prior to determining N leaching characteristics or agronomic responses of controlled-
release N sources (CRNS) on St. Augustinegrass and may have inadvertently constrained
optimal CRNS management strategies (i.e. less frequently applied, higher per-application N-
rates) that reduce inputs such as labor, time, and energy (Trenkel, 1997). There is a clear need to
evaluate the agronomic responses of St. Augustinegrass under varying N sources, application
rates, and frequencies to better understand the efficacy of N rate regulation.
Nitrogen Source Categorization and Benefits
Nitrogen-based fertilizers for residential lawns are broadly categorized either as quick or as
controlled release, depending on release duration (Turner and Hummel, 1992), although several
sub-classes exist within these delineations (Oertli, 1980). The benefits of controlled-release
fertilizers have been well documented, the most notable of which include reduced NO3-N
leaching (Rieke and Ellis, 1974; Brown et al., 1977; Nelson et al., 1980; Snyder et al. 1981,
1984; Petrovic, 1990) and lower water use (Subjarit and Trenholm, 2005). While greater N-

17
uptake efficiency in response to quick-release N has been shown in the greenhouse for St.
Augustinegrass relative to other warm season grasses (Bowman et al., 2002), little is known
about St. Augustinegrass responses under varied CRNS management regimes. Numerous CRNS
are commercially available for lawn-care use and stringent fertilizer restrictions exemplify the
need to evaluate each N source to determine specific rate and frequency recommendations.
Biosolid N Management under Turfgrass Conditions
Milorganite® (BSD), an activated aerobically digested biosolid (Chinault and O’Connor,
2008), is composed of ~20 % soluble N (Sartain, 1999) and has been evaluated extensively on
turfgrass (Turner and Hummel, 1992), although studies pertaining specifically to St.
Augustinegrass are limited. Many bio-solid-based fertilizers are marketed. Each has its own set
of characteristics. Since Milorganite has been used on turfgrass for over 80 years, it often is used
as a standard for biosolid fertilizing and therefore was chosen for this study. Chinault and
O’Connor (2008) reported the chemical characteristics of BSD and reported a C/N ratio of 6.0; a
ratio that Wolf and Snyder, (2003) maintain should permit relatively rapid microbial
decomposition. In contrast, Sartain (1999) reported BSD compared less favorably to mixed
component organic N-sources for St. Augustinegrass quality; inferring N-release was too gradual
from the unilateral mineralization rate of the organic material. Other studies noted slow initial
responses or lower visual quality compared to soluble N sources (Moberg et al., 1970; Volk and
Horn 1975; Carrow, 1997).
Several incubation studies have examined N recovery from BSD. Lee and Peacock (2005)
found ~60% of applied N was recovered after 70-d, whereas Sartain et al. (2004) reported only
~40% of applied N was recovered following 180-d of aggressive extraction procedures.
According to the US EPA Document 40 CFR Part 503 (1999), the annual mineralization rates of

18
the organic-N applied as biosolid are 30, 15, 8, 4, and 3% in years 1, 2, 3, 4, and 5, respectively
in EPA region 8. However, these N-release patterns are expected to be accelerated in Florida
where higher average annual precipitation and soil temperatures are more conducive of microbial
decomposition (Wolf and Snyder, 2003). Correspondingly, Carrow and Johnson (1989)
compared CRNS on centipedegrass (Eremochloa ophiurides) with ammonium nitrate (AN) and
found under periods of active microbial growth, Milorganite generated turf quality ≥ to AN.
Controlled-Release Liquid N Sources in Turfgrass
Liquid CRNS could be beneficial in the lawn care industry which, for convenience, often
applies fertilizers as a liquid. The chemical characteristics of these formulations vary, although
differential microbial degradation of urea and reacted-N species provides the mechanism for
extended N release. Landschoot and Waddington (1987) reported initial turf response decreases
relative to urea as the proportion of water-insoluble N (WIN) in the formulation increased, and
longer-chained methylene ureas were present. Carrow (1997), evaluated several urea-
formaldehyde (UF) products and found Coron® (50% N from urea, remainder polymethylene
urea, methylene urea, monomethylol urea) and Nutralene® (13% urea, 51% N from methylene
polymers, 36% UF) induced lower average visual quality of bermudagrass (Cynodon dactylon)
than urea. Splitting the N application into two equal treatments greatly improved long term
response but at the expense of initial and intermediate responses. In agreement, Sartain (2004)
reported 37% of N applied as Nutralene® was released in the first 7 d. However, in a separate
study, Sartain (1992) found no bermudagrass quality, growth rate, or N-uptake differences
between urea, Coron®, and N-Sure® (6% methylene diurea and methylol urea by weight,
remainder 0.48 to 1.0 ratio triazone to urea) treated turf. Studies indicate reduced NH3
volatilization and N leaching are associated with urea-triazone products compared with urea and

19
AN (Clapp and Parham, 1991; Clapp, 2001). With inconsistent performance on warm-season
grass, and no published studies documenting the performance of CRNS on St. Augustinegrass,
comparative information would be of interest to lawn-care professionals.
Polymer-Coated Urea Fertilization in Turfgrass
Polymer-coated urea (PCU) is a relatively new technology described by Goertz (1991). PCU
releases N by osmotic diffusion through the polymeric coating, whereby coating thickness
controls the release duration (Christianson, 1988). Field studies have shown PCU provides
consistent release patterns within the desired window (Hummel, 1989; Peacock and DiPaola,
1992) and through the alteration of polymer chemistry and coating thickness can offer wide
range of flexibility in N-release durations. Initially slow turf response and N-release have been
observed compared to soluble-N sources (Carrow, 1997; Hummel, 1989; Sartain et al., 2004).
Hence, soluble-N sources are sometimes included in blends as bridging products to provide
increased initial responses (Peacock and Dipaola, 1992). Nevertheless, Hummel (1989) and Cisar
et al. (2001) both reported increased N-uptake between 14 and 90 d post application relative to
soluble N-sources at lower per-application rates applied more frequently.
Research Objectives
Previous studies have observed differences in the performance of CRNS, although these
distinctions appear to vary depending on turfgrass species and environment. Even though
stringent restrictions have been imposed on lawn-grass fertilization in Florida, few studies have
evaluated CRNS on St. Augustinegrass under lawn maintenance regimes. Therefore, the
objectives of the experiment were as follows.
• Objective 1: Determine if controlled-release N sources applied under current regulatory restrictions can provide acceptable turf quality and density relative to urea.
20
• Objective 2: Evaluate St. Augustinegrass response (i.e. quality, density, and N-uptake) in response to various N management regimes to determine the most effective sources at each N application rate and frequency. Of particular interest was the longevity of turf response from CRNS applied prior to restrictive seasons at rates higher than currently permitted.
• Objective 3: Assess fertilizer response based on their broad categorizations by grouping sources across all rates to determine if quick-, controlled-release, or mixed component N sources provided the best St. Augustinegrass responses.
• Objective 4: Compare treatment effects on clipping yield under variable N management using yield comparisons with the lawn care industry standard, urea, to determine initial and long term response.
Materials and Methods
The field study was replicated in space, and over two consecutive years at the University of
Florida’s, Fort Lauderdale Research and Education Center (FLREC) from April 30, 2007 to May
09, 2008 and May 10, 2008 to May 15, 2009 (hereafter each experimental period are denoted as
2007 and 2008, respectively) using St. Augustinegrass [Stenotaphrum secundatum Walt. Kuntze]
cv. ‘Floratam’. The climate in South Florida is subtropical, permitting warm-season grass growth
year round, but varies seasonally as shown by data obtained from the Florida Automated
Weather Network station located approximately 300 m from the experimental site (Appendix A).
Traditionally, two distinct seasons have been demarcated, the wet season (WS) from June to
October, and the dry season (DS) from November to May, and our findings have been delineated
in a similar manner to reflect climatic variation.
The sand grown sod was established 6-mo prior on mined medium-fine sand (very coarse
0.2%, coarse 5.4 %, medium 29.9%, fine sand 62.9%, very fine sand 1.5%, and silt and clay
0.1%) having similar textural characteristics to the Margate and Hallandale fine sand series
(Siliceous, hyperthermic Lythic Psammaquent) found in this coastal plain region. Composite soil
samples from each plot were taken throughout the study (n = 4) from the 0 to 10 cm surface
layer and analyzed by various procedures (A&L Laboratory, Pompano Beach, FL). Soil chemical
21
characteristics were averaged across the experimental period (Table 2-1). Due to high potassium
(K) mobility in sandy soil, muriate of potash at 49 kg K ha-1 was applied every 3-mo. Bray P1
and Olsen Bicarbonate phosphorous (P) extraction methods were used to determine soil P status,
because of the potential for iron/aluminum-P complexes (under bio-solid fertility) and calcium
(Ca)-P complexes under very high Ca inputs from irrigation (data not included). Since additional
P was supplied with biosolid (6-2-0) N applications and despite very high soil P status, an
additional 24.5 kg P ha-1 was applied to all plots except the BSD treatment on October 1, 2007 as
triple super phosphate to ensure P was not limiting. Quantifiable visual or growth responses from
this supplementary P application were not observed, so no additional P fertilizations were
performed thereafter and it was assumed that extraction procedures accurately estimated soil P.
Micro-nutrients were applied as Harrell’s Max® Minors containing Mg 1%, S 3.5%, B 0.02%,
Cu 0.25%, Fe 4%, Mn 1%, Zn 0.6% and Mo 0.0005% at 12.3 L product in 420 L water ha-1
every 90-d to ensure adequate tissue concentrations.
The N sources descriptions, application rates, and frequencies are provided in Table 2-2. All
treatments totaled 294 kg N ha-1 yr-1, which is within best management practice guidelines for St.
Augustinegrass N fertilization in South Florida (FDEP, 2008; Sartain, 2007). The controlled-
release liquid (CRL) treatments were applied in solution at 181 ml m-2 using a CO2 sprayer,
equipped with two flat-fan TeeJet 8010 nozzles at 50 cm spacing. Granular sources were hand
sprinkled. The irrigation system configuration (i.e. 2 plots per irrigation zone) permitted all
treatments to be irrigated immediately follow application to reduce volatile N losses (Torello and
Wehner, 1983). Irrigation was schedule 3 times per week delivering ~0.6 cm at each event,
including post-treatment.

22
Visual Assessments
Fertilizer response was evaluated in terms of visual field assessments of St. Augustinegrass
quality, and density. Turf quality is defined as the degree in which turf conforms to an agreed
standard, which is composition of uniformity, shoot density, leaf texture, growth habit,
smoothness and color (Krans and Morris, 2007). Turf density is a visual estimate of living plants
per unit area (Morris, 2001). Visual quality evaluations were conducted approximately every 14-
d on a one to nine scale in increments of 0.5; nine was dark green, dense turf, one represented
dead, brown turf, and six was deemed minimally acceptable for all components (Carrow, 1997).
Turf density was assessed less frequently, but in order to account for seasonal variations, ratings
were conducted approximately every 90-d.
St. Augustinegrass Tissue Harvest and Analysis
Harvested clipping tissue provided a basis for quantifying treatment effects on yield and N
uptake. Clipping samples were harvested using a commercially available pedestrian rotary
mower (Toro, Bloomington, MN) at a 7.5 cm height of cut. Mowing occurred weekly during the
WS and bi-weekly during DS in both years. Clippings were removed as part of normal
maintenance. Samples removed from the 2.24 m2 sub-plot units were oven dried at 60oC for 48
hrs to a constant weight. Yield represented average daily leaf dry matter production above 7.5
cm (Methall et al., 1983). Dried tissue was sub-sampled for analysis of tissue N content using the
Kjedahl procedure (Wolf, 1982), with manual colormetric determination (UNIVO 2100, Dayton,
NJ) of NH4-N according to Reardon (1966). Data were obtained according to quality
assurance/quality control (QA/QC) protocols set forth by Kennedy et al. (1994) where N-
recovery of standard reference materials 1573a and 1547 (National Institute of Standards and
Technology) conformed to 89 to 101% of certificated values. Nitrogen uptake, the product of N-

23
content (g N kg-1) and yield (kg dry wt. ha-1 d-1), was reported as g N ha-1 d-1 (Skogley and
Sawyer, 1992).
Statistical Design and Analysis
The experiment was conducted according to a randomized complete block design, with 2 x 4
m plots arranged with 3 replicates. All data were tested for their conformity of the assumptions
of analysis of variance (ANOVA) using PROC UNIVARIATE with normal plot of residuals and
histogram of residuals (Clewer and Scarisbrick, 2001). Yield and relative N uptake data that did
not conform were appropriately transformed based on the results of the Box-Cox transformation
procedure (Box and Cox, 1964) before statistical analysis.
Because N-sources and rates were not balanced across all treatments, Source x N-rate
interactions was investigated separately for yield and N uptake parameters for appropriate
sources (i.e. BS, CRL, and PCU at 49, 98, and 147 kg N ha-1 rates) and linear regressions were
performed using the PROC REG procedure in SAS software (SAS Institute, 1999). All data were
subjected to ANOVA using PROC GLM (SAS Institute, 1999) and mean separation was
accomplished using single degree contrasts. Two-tailed F tests of error variance for the estimated
parameters between years were performed so that means for corresponding cycles could be
compared legitimately.
Results and Discussion
Comparisons of N Sources Based on N-Release Categorization
In Florida, much discussion has surrounded residential lawn fertilization practices. County
council debates have focused on broad categorizations of N fertilizers based on their N-release
mechanism (i.e. quick- or controlled-release). For example, controlled-release N sources have
been frequently referred to positively as having less potential to leach N compared to quick-
release N fertilizers. However, little consideration is given to the agronomic fertilizer N

24
responses of St. Augustinegrass under these broad N source categorizations. As such, it was
considered appropriate to provide comparative information of N-sources based on these broad
categorization.
Controlled-release N sources and mixed component N sources (MCNS) (i.e. fertilizer blends
containing equal N combinations of quick- and controlled-release N materials) were grouped in
appropriate categories, and compared with the quick-release N-source. Turf quality, density,
yield, and N-uptake were affected by N-source categorization in 2007 and 2008 (Tables 2-3, 2-4,
2-5, 2-6). Urea, the only treatment composed exclusively from quick-release N produced greater
turf quality than CRNS on 11 of 12 cycles through the 24-mo period. Sub-optimal climatic
conditions for warm-season grass growth (Moore et al., 2004) during cycle 11 reduced turf
quality across most treatments and potentially masked N-source effects. Nitrogen uptake
followed a similar pattern. However unlike turf quality; elevated N-uptake from BSD and PCU
at 147 kg N ha-1 reduced differences between N categories during cycle 1 and 7. Because
appreciable improvements in turf quality were not observed in response to greater N-uptake
relative to urea during the initial 60-d periods in the WS of 2007 and 2008, the elevated N-
release from BSD and PCU at this higher N-rate may have detrimentally influenced the longevity
of response from both sources. In both years, it is assumed that excessive initial N-release
without correspondingly high improvements in turf quality resulted in lower N-uptake and
quality ratings towards the latter stage (cycles 3 and 9) of each 180-d WS release window
(Tables 2-3, 2-6).
These findings indicate that even with advanced N-release technology (i.e. polymer-coating),
the delivery of N over extended durations (i.e. 180-d) was less uniform than more frequent,
lower per-application N-rates of quick-release urea in South Florida. The inability of CRNS to

25
deliver uniform N release throughout the entire release window may be a contributing cause of
lower turf responses when compared to frequent applications of quick-release N fertilizers.
Nevertheless, ratings for the granular CRNS at these higher rates were all in the “acceptable”
range and generally > 7.
Conversely, when quick and controlled-release were combined as MCNS (i.e. UPCU1 and
UPCU2) both turf quality and N-uptake were largely indistinguishable from urea. This indicates
that under reduced release durations (i.e. 60 to 120-d windows) the addition of soluble-N largely
counteracts problems with inconsistent N-release patterns. Differences were only apparent under
cooler conditions in the DS, where quality ratings and N-uptake were greater for urea during
cycle 4 (2007). Despite the similarity in terms of quality throughout 2008, N-uptake was lower
for MCNS during cycle 12 (DS). Peacock and DiPaola (1992) made similar observations,
suggesting polymer coating permeability, dissolution rate, and N-release decrease under lower
temperatures. Therefore, in order to optimize N management from MCNS and combat slower N-
release from PCU in response to cooler conditions, lawn-care professionals may find it beneficial
to increase the proportion of quick-release N in blended fertilizers intended for use under DS
conditions in South Florida. However, care should be exercised to ensure increasing the soluble
N-fraction of fertilizer blends are in compliance with local fertilizer ordinances. Our study is in
agreement with numerous studies (Landschoot and Waddington, 1987; Peacock and DiPaola,
1992; Carrow, 1997) that in most situations, CRNS in combination with quick-release N offer
viable alternatives to frequent applications of urea.
Given the propinquity of St. Augustinegrass response under quick-release and MCNS
fertilization, it is not surprising that MCNS outperformed CRNS in terms of quality and N-
uptake. However, under MCNS fertilization, N-uptake differences were manifested more slowly
26
between categorizes, with CRNS showing comparable levels during cycles 1 and 2 (2007), even
with the 50% soluble-N proportion in the blended fertilizers. Therefore, when initiating a MCNS
program, initially the proportions of quick- and controlled-release N should be weighted toward
the former, in order to induce notable plant response but could be reduced accordingly thereafter.
In the context of this study, direct comparison of quick- versus CRNS may have been
confounded by considerably lower measurable parameters in CRL plots over each N-rate and
frequency. Nevertheless, turf density assessed on individual rating dates every 3-mo, appeared to
be less affected by the N-release mechanism (Table 2-4), demonstrating CRNS were capable of
maintaining turf density equal to that of urea on 6 of 9 assessments, despite lower ratings in the
CRL treatment. It may be considered unfair to draw broad conclusions of the effectiveness of
these N-release categories on St. Augustinegrass based solely on these findings. The author
could find no other studies that have made direct agronomic response comparisons between
fertilizers based on N-release categorization, but in order to address the subject conclusively a
great deal more N-sources in both categories would have been needed.
Comparisons of N Sources Applied at 49 kg ha-1 at 60-d Intervals
Fertilizer treatments were divided into six cycles per annum (Table 2-2). During 2007, PCU
and BSD were slow to induce satisfactory quality in cycle 1 (Table 2-3). Compared to BSD,
lower N-uptake and yield in cycles 1 and 2 for PCU would indicate that the initial release
patterns are slower for PCU (Table 2-6). Thereafter, cumulative quality increases suggest
residual N-release from preceding applications is sufficient to sustain adequate turf quality
(Table 2-3). Examining N-uptake from equivalent WS cycles in 2007 and 2008 provides further
evidence that residual N-carryover plays an important role in generating sufficient turf quality
for PCU and BSD at this N-rate. Nitrogen uptake increased by 1.3 and 3.8 fold for BSD and

27
PCU, respectively during cycle 8 (2008) compared to cycle 2, similarly, both sources generated
2- fold increases when cycle 9 was compared to cycle 3.
Current mandates prohibit CRNS being applied at 49 kg N ha-1 every 60-d during the WS in
certain Florida counties. The supply of residual N from preceding applications appears to be an
important aspect for the effectiveness of BSD and PCU at this N-rate and interruption of this
process due to restrictive seasons may reduce the effectiveness of this N management approach.
It appears improbable that either source would be capable of sustaining acceptable quality (i.e.
quality ≥ 6) throughout a 120-d restrictive season with a single 49 kg N ha-1 application.
Furthermore, because customer satisfaction depends on noticeable turf responses from applied
fertilizer, the delayed initial responses particularly from PCU, may limit the wide scale use of
this N source and rate, unless PCU was blended with soluble-N.
Quality differences between BSD and PCU were confined to cycles 6 and 7 where PCU
delivered superior ratings (Table 2-3). Greater N-uptake for PCU in cycle 5-7 (Table 2-6) also
resulted in greater yield, 78 and 116 % relative to urea in cycles 5 and 7, respectively compared
to BSD where lower yield, 44 and 70 % were observed relative to urea in the same cycles (Table
2-5).
Despite the 60-d application window corresponding more closely with manufacturer
recommendations for CRL (Georgia-Pacific, 2007), this product demonstrated lower turf quality,
density, and N-uptake in both years relative to BSD and PCU. In addition, the maximum yield
was 55% relative to urea in both years (Table 2-5). These findings indicate this N-reaction
product is less effective on St. Augustinegrass. Carrow (1997) reported reduced mowing
requirements and visual quality from bermudagrass treated with a similar UF reaction product
compared to urea, however differences were less pronounced.
28
Urea maintained good mean turf quality throughout each cycle and was indistinguishable
from the UPCU treatment. Compared with PCU and BSD, UPCU produced greater quality in
cycles 2, 4, 6, 10, and 11 (Table 2-3). Elevated N-uptake was observed in cycles 2, 6, and 12,
while yield differences were confined to cycles 2 and 4. Increased quality for UPCU without
necessarily demonstrating higher average N-uptake or yield may imply that more uniform
delivery of applied N from the MCS may benefit turf quality (Table 2-3, 2-5, 2-6).
In contrast, N-source appeared to influence turf density to a lesser degree than quality, with
UPCU demonstrating elevated levels on single rating dates in 2007 and 2008 (Table 2-4). Under
adequate N fertilization turf density may be expected to fluctuate less than quality, since color
improvements (a major component of overall turf quality) are manifested more rapidly in
response to available-N (Waddington et al., 1963). During each year, treatments that induced
elevated quality also produced denser turf. Consequently, density ratings were generally lower
for CRL, consistently below acceptable standards, and less than BSD and PCU on 8 of 9 rating
dates (Table 2-4).
For most sources, the annual N rate of 296 kg ha-1 yr-1 delivered acceptable turf density, as
demonstrated by ratings of at least 6.0. However, at this N-rate, which represents the upper
annual N limit suggested by best management practice (BMP) guidelines (FDEP, 2008) and
exceeds that of most local municipality ordinance restrictions, uniform high density (i.e. density
≥ 7.5) was not achieved, even with urea. While studying the effects of N-rate on bermudagrass
density, Carrow et al. (1987) reported similar results indicating that higher annual N-rates were
required to achieve maximum turf density, although as was the case in our study, clippings were
collected during mowing and turf was grown on a low organic matter sand soil. Johnson et al.
(1987) reported that recycling clippings enhanced shoot density and may contribute up to 100 kg

29
N ha-1 yr-1. Under soil conditions similar to that observed in this study, higher N-inputs may be
required to achieve maximum St. Augustinegrass density in South Florida. In locations where
legislation prohibits such actions, additional stipulations may be needed to enforce the return of
clippings to prevent large scale declines in turf density, a factor that has been shown to increase
nutrient run-off (Gross et al., 1990; Linde et al., 1995, 1998; Easton and Petrovic, 2004).
Comparisons of N Sources Applied at 98 kg ha-1 at 120-d Intervals
The CRNS evaluated performed best under this 3 cycle per year regime, where cycles
covered the WS and DS with a transitional cycle that straddle both periods. The 120-d
application interval corresponded more closely with N-release patterns observed from PCU in
previous studies (Fry et. al. 1993; Cisar et. al. 2001). Correspondingly, PCU outperformed other
CRNS, generating turf quality and yield comparable to urea throughout the 24-mo study (Tables
2-3, 2-5). At this higher pre-application N rate, delayed N-release was less apparent with PCU,
demonstrating equivalent levels of N-uptake to quick-release N in the initial 60-d period.
Therefore, as a lawn-care product, PCU (8% coating weight) is more suited to this application
rate and frequency, because customer satisfaction depends on noticeable turf responses from
applied treatments (Spangenberg et al., 1986).
Polymer-coated urea delivered higher average quality ratings in cycles 2, 4, 6, 10, and 12
(Table 2-3) and demonstrated increased yield and N-uptake in cycles, 2, 4, 6, 8, 10, 12 relative to
BSD (Table 2-5, 2-6). It has already been stated that responses from PCU decreased under the
cooler, DS conditions. Nitrogen release from microbial dependent N-mineralization may be
impacted to a greater degree in response to lower temperatures, since quality, density, yield, and
N-uptake differences between sources were more apparent during the DS in both years. Stanford
et al. (1977) observed the fraction of N mineralized in relation to temperature and reported an ~
40 % decrease in the rate of mineralization as average monthly air temperature declined from 27

30
to 22oC; the mean average air temperatures in the WS and DS, respectively (Appendix A).
Carrow et al. (1997) evaluated PCU (41-0-0) and Milorganite on bermudagrass at 98 kg N ha-1
under temperatures consistent with DS conditions, found reduced shoot growth for Milorganite
72 and 56% that of PCU in year 1 and 2, respectively. In agreement, we observed very similar
results when BSD was compared to PCU (42-0-0), with 70 and 53% less yield in 2007 and 2008,
respectively. In essence, the bio-available N from BSD may be released more slowly than the N
from PCU. Consequently, turf quality, density, yield, and N-uptake were correspondingly lower
for BSD, which is in agreement with Sartain et al. (2004) who demonstrated through incubation
studies that PCU releases ~80% of applied N in 112-d versus only ~40% from Milorganite
during a 180-d incubation period.
The performance of CRL declined under the higher per-application N, reduced frequency
regime. Turf quality only marginally exceeded minimally-acceptable standards (i.e. turf quality ≥
6.0) during the WS in 2007 and thereafter remained consistently below this level. Comparisons
of yield during the WS demonstrated inferior growth from this source. For instance, CRL, BSD,
and PCU induced average WS yields of 52, 82, and 93% in 2007 and 20, 74, and 132% during
2008, respectively compared to urea (Table 2-5). Moreover, when N-uptake was average over
the WS of both years, CRL was the only source to demonstrate lower values in 2008 than 2007
(Table 2-6). Nitrogen uptake was quantified as a function of clipping yield. Minimal yield
response following fertilization at 98 kg N ha-1 for CRL which corresponded to ~ 40 kg soluble-
N ha-1 in 2008 may be explained by substantial reductions in turf density (Table 2-4).
In low density warm-season grass canopies, increased assimilation of photosynthates in
response to applied N may be channeled preferential towards lateral growth to increase stand
density in preference to appreciable biomass yield production for St. Augustinegrass. Low red

31
light (R) to far-red light (FR) ratios caused by FR reflected on green leaves, provide an
environmental cue of the presence of neighboring plants (Ballaré et al., 1987). The extent of the
reduction correlates with the proximity of surrounding vegetation (Smith et al., 1990) and
reduced tillering in bunch growth type C3 grasses (Casal et al., 1986, 1990). In contrast, under
high R to FR ratios, as would occur in low density canopies, signals perceived by the
phytochrome may induce tillering and through morphological plasticity enable stolon growth to
increase turf density. In support, Frank and Hofman (1994) found that through defoliating grass
canopies and increasing the R to FR ratio at the canopy base, increased stand density was
achieved.
In 2007, urea plus PCU (UPCU) outperformed CRNS, generating superior turf quality in
cycles 1, 3, and 5 relative to PCU and BSD (Table 2-3). However, following an initially-superior
quality response from UPCU in 2008, overall quality was more consistent for PCU and BSD and
produced combined ratings superior to UPCU in cycles 8 and 10. Clipping yields from UPCU
were for the most part undistinguishable from urea and exceeded that of PCU during the 60-d
period following fertilization in cycles 1 and 5 (Table 2-5), presumably due to the quick-release
portion stimulating more rapid growth. Yield improvements for PCU in 2008 followed a similar
pattern to quality with greater yield observed in cycles 7 and 12, where PCU induced yield equal
to urea compared to 40% less from UPCU in cycle 12. Our findings suggest that benefits of
combining quick and controlled-release sources in 50:50 N proportions (i.e. more rapid initial
turf quality responses) are mainly observed during the first 12-mo period. Beyond this time
frame, more uniform turf response and greater N-uptake from PCU suggests this source is more
effective over a 120-d release interval at 98 kg N ha-1 when applied solely in controlled-release
formulation. Few studies have monitored the performance of CRNS continuously over extended

32
periods, largely because climatic conditions enforce relatively short growth seasons for warm-
season grasses. In this instance, under year-round growth conditions, PCU applied at this N-rate
and frequency provided continual improvements in St. Augustinegrass lawn quality and N
utilization with continuous use. Our long-term findings are contradictory to numerous studies
(Landschoot and Waddington, 1987; Peacock and DiPaola, 1992; Carrow, 1997) whose short-
term conclusions indicate PCU sources are more effective when used in conjunction with soluble
N. We conclude that under restrictive N legislation, that PCU applied solely as controlled-release
fertilizer would be considered more environmental judicious with reduced potential for NO3-N
leaching and improved N-utilization compared to MCNS over the long-term.
Comparisons within N Sources Applied at 147 kg ha-1 at 180-d Intervals
The CRNS evaluated differed in their initial and long-term longevity of responses between
years. CRL imparted acceptable turf quality for ~120 d and ~43 d, with acceptable turf quality
apparent 9 and 20 days after treatments (DAT) for 2007 and 2008, respectively (Fig. 2-1, 2-2).
Growth and N-uptake also dropped sharply in the latter year for CRL, with average WS yield
relative to urea of 67% in 2007 versus only 15% during 2008. When N-uptake was averaged
over both WS periods a 44% reduction was observed (Table 2-5).
In previous studies involving various UF reaction products (Landschoot and Waddingtion,
1987; Carrow 1997), found sources that provided good initial responses were less effective over
extended release durations. The 180-d release period far exceeded the 60 to 90-d re-application
interval suggested by the manufacturer (Georgia Pacific, 2007), as such, turf density declined
appreciable by the end of the each 180-d application period, presumably through insufficient
PAN throughout the latter stages of the extended N-release window. These findings highlight the
importance of selecting CRNS that closely correspond to the intended use criteria and that St.

33
Augustinegrass grown on sand soil, low in organic matter, requires continuous inputs of N
during summer months in order to sustain adequate turf quality and density.
Conversely, PCU and BSD provided elevated durations of acceptable turf quality in 2008
compared to 2007, although differences in initial and long-term response were observed between
sources (Fig. 2-1, 2-2). For instance, BSD produced initial turf quality responses similar to CRL
during 2007, although BSD maintained acceptable turf quality far longer (~134 d). Following
initial applications, improvements in turf quality were slower from PCU in 2007, ~32-d were
required to attain acceptable turf quality following fertilization, although overall response
longevity was greater (~152 d) than other CRNS (Fig. 2-1). Yield and N-uptake for PCU
averaged over each 60-d cycle reflected this slower initial N-release pattern, with increased N-
uptake longevity in the final two cycles of each 180-d period in 2007. (Tables 2-5, 2-6).
For PCU, higher turf quality prior to applications in the WS (2008) was beneficial. This
provided a buffer in which to mask latent N-release permitting acceptable turf quality throughout
the 180-d interval (Fig. 2-2). In 2008, BSD also delivered acceptable turf quality for the duration
of the 180-d release window. When both WS periods were considered, the data indicates that if
turf quality is reasonable prior to application, all CRNS evaluated at this N rate were capable of
sustaining adequate turf quality for the 120-d restrictive season imposed by certain local
legislative bodies. Moreover, both PCU and BSD provided acceptable turf quality for longer
durations (i.e > 120-d), particularly in 2008 (Figure 2-2), denoting the potential to reduce
application rates to achieve desirable durations of lawn aesthetics.
For BSD, initial responses were largely identical in both years and consistent with urea
(Figures 2-1, 2-2), which is in agreement with Sartain (1999) who reported Milorganite is
composed of ~20% soluble N and therefore would deliver 29.4 kg ha-1 of PAN at this N rate.

34
Ironically, our findings indicate that in order to obtain noticeable fertilizer responses from St.
Augustinegrass, a factor that is important in the lawn-care industry, ~30 kg soluble-N ha-1 is
required. Although this application rate is currently permitted under state labeling legislation in
Florida, certain counties prohibit this per-application rate of soluble N (Board of County
Commissioners of Sarasota County, Ordinance No. 2007-63; Board of County Commissioners of
Lee County, Ordinance Number 08-08; Board of County Commissioners of Charlotte County,
Ordinance Number 2008-028).
Despite lower temperatures, greater improvements in turf quality together with higher
average seasonal ratings were observed from BSD during the DS in 2007 and 2008. Quality
ratings illustrated more uniform, extended release patterns indicating that N release from BSD
(i.e., mineralization) is more tightly coupled to plant demand. In other words, N release from
BSD was more biologically driven while PCU was driven by the physical environment. These
results suggest BSD applied under this extended regime appears more suited for dry season
conditions in South Florida particularly during the initial year of use.
Residual N carry-over from preceding cycles is also possible and may explain extended
durations of acceptable turf quality during the WS in 2008. In agriculture, much emphasis is
placed on applying biosolids at the agronomic rate to meet crop N requirements. Under
Environmental Protection Agency (EPA) guidelines, land managers are directed to adjust
application rates in subsequent years of use to account for latent N mineralization from the prior
application (United States EPA Document 40 CFR Part 503, 1999). Under field conditions in
Florida, He et al. (2000) found that 48% of the total organic N component of biosolids was
mineralized in 12-mo and stated that the extent and rate of N mineralization needs to be
considered carefully to minimize the risk of NO3-N leaching. Based on He et al. (2000) and

35
Sartain et al. (2004) who reported similar mineralization rates, we infer plant available nitrogen
(PAN) would increase in response to repeat application of BSD and that measured turf responses
should improve correspondingly over time with continual use. Several studies in cool-season
turfgrass research with the biosolid Milorganite, have reported these conclusions. Moberg et al.
(1970) showed increased yield, color, and N recovery in the second year of evaluations.
Waddington et al. (1976) reported total soil-N increased for Milorganite relative to synthetic
CRNS, and increased yield resulted from continued use in long-term evaluations. Hummel and
Waddington (1981) also showed residual N effects from both synthetic and natural organic
fertilizers and hypothesized through continued use, performance of low-recovery N products can
be expected to increase. On St. Augustinegrass, BSD compared less favorable to PCU especially
under lower pre-application N rates, applied more frequently. Long-term studies, similar to
Waddington et al. (1976) and agricultural evaluations by Barbarick et al. (1997) and Barbarick
and Ippolito (2007) are required in warm-season turfgrass research to help answer the following
questions. How does PAN from BSD change with continuous application? Does N-rate and
application frequency influence PAN over time? At what point does cumulative-N increase to
the point that exceeds plant uptake and cause detrimental environmental implications?
The Relationship between Controlled-release Nitrogen Rate and St. Augustinegrass Yield
In order to deliver the same total annual N rate, application frequency differed between N
rates that preordained two occasions (April 30, 2007 and May 15, 2008) when controlled-release
sources were applied in unison at 49, 98, and 147 kg ha-1. N rate x yield interactions were only
observed in 2007. Treatment induced differences in turf density prior to fertilizer applications
may have influenced interactions in 2008. In the first year, variation in yield can be explained by
a linear regression model for each CRNS, with R2 values of 0.95, 0.98, and 1.00 for BSD, CRL,
and PCU, respectively (Fig. 2-3). The data suggests that the maximum yield was not achieved for

36
each CRNS at 147 kg N ha-1 and for every 49 kg N ha-1 increase in fertilizer N rate you would
expect an additional 0.06, 0.04, and 0.02 kg dry weight (DW) ha-1 d-1 yield increase in St.
Augustinegrass under BSD, CRL, and PCU fertilization, respectively.
However, making inferences outside the range of X-values used to find the fitted equations
may generate erroneous results. For instance, a maximum yield is expected at a given fertilizer
rate in excess of 147 kg N ha-1 and above that hypothetical rate, yield is expected to decline.
Furthermore, the data only represents the initial 60-d period after fertilization, a factor that was
limited due to re-application of sources on the 49 kg N ha-1 (60-d frequency). During the relative
short period the full extent of N release may not have been realized, because each source was
expected to release N for more extended periods and initial response distinctions were noted that
undoubtedly influenced the slope, particularly for PCU with slow initial N release characteristics.
Conclusions
This study has shown that acceptable turf quality is possible with high frequency, low
application rates of CRNS; however we found that lower frequency, higher application rates of
many CRNS produce better quality turf. Thus, limiting application rates reduced optimal
controlled-release performance with respect to turf quality, yield, and N-uptake. For instance, at
current regulated rates imposed on controlled-release fertilizers in Florida, PCU and BSD
provided acceptable quality St. Augustinegrass, albeit after an initial delay in response. The
higher per-application rates, which exceeded current regulated rates, over more extended periods,
resulted in better turf quality, particularly for PCU at 98 kg N ha-1 on a 120-d release interval.
Seasonal performance differences were noted, whereby BSD exhibited enhanced responses
during the cooler DS at 147 kg N ha-1 on the 180-d cycle. Even so, the CRNS evaluated were
inadequate in terms of either initial or long term response relative to urea applied at 60-d
intervals, although through continuous use, the residual N effect improved initial responses for

37
PCU and improved longevity for BSD. We found that all CRNS applied at 147 kg N ha-1 were
capable of delivering acceptable turf quality for the 120-d restrictive season although adequate
turf density and quality were required for CRL prior to application. Our findings indicated that
controlled-release N in combination with soluble N (i.e. UPCU) offered a viable alternative to
frequent applications of urea. The relatively poor performance of several CRNS at high
frequency, low rates compared to low frequency, high rates suggest the need for further research
to determine the influence of application rate on the fate of applied N from CRNS on St.
Augustinegrass.
38
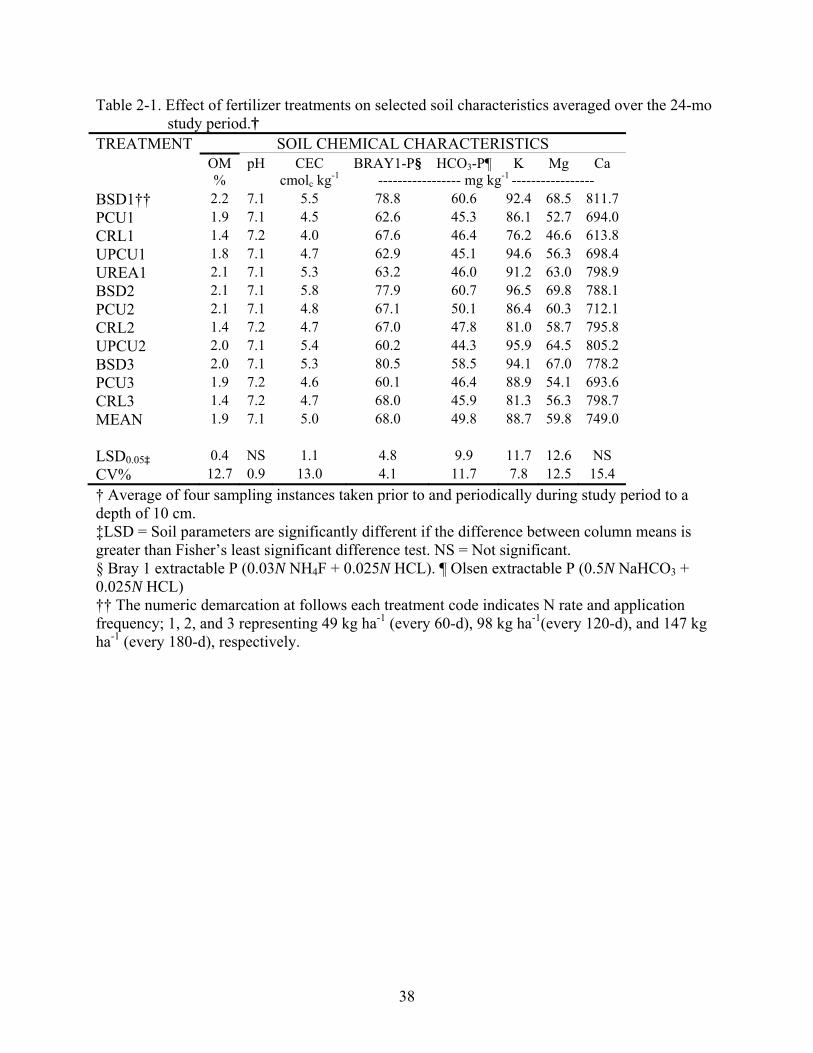
Table 2-1. Effect of fertilizer treatments on selected soil characteristics averaged over the 24-mo study period.†
TREATMENT SOIL CHEMICAL CHARACTERISTICS OM pH CEC BRAY1-P§ HCO3-P¶ K Mg Ca
% cmolc kg-1 ----------------- mg kg-1 ----------------- BSD1†† 2.2 7.1 5.5 78.8 60.6 92.4 68.5 811.7 PCU1 1.9 7.1 4.5 62.6 45.3 86.1 52.7 694.0 CRL1 1.4 7.2 4.0 67.6 46.4 76.2 46.6 613.8 UPCU1 1.8 7.1 4.7 62.9 45.1 94.6 56.3 698.4 UREA1 2.1 7.1 5.3 63.2 46.0 91.2 63.0 798.9 BSD2 2.1 7.1 5.8 77.9 60.7 96.5 69.8 788.1 PCU2 2.1 7.1 4.8 67.1 50.1 86.4 60.3 712.1 CRL2 1.4 7.2 4.7 67.0 47.8 81.0 58.7 795.8 UPCU2 2.0 7.1 5.4 60.2 44.3 95.9 64.5 805.2 BSD3 2.0 7.1 5.3 80.5 58.5 94.1 67.0 778.2 PCU3 1.9 7.2 4.6 60.1 46.4 88.9 54.1 693.6 CRL3 1.4 7.2 4.7 68.0 45.9 81.3 56.3 798.7 MEAN 1.9 7.1 5.0 68.0 49.8 88.7 59.8 749.0 LSD0.05‡ 0.4 NS 1.1 4.8 9.9 11.7 12.6 NS CV% 12.7 0.9 13.0 4.1 11.7 7.8 12.5 15.4 † Average of four sampling instances taken prior to and periodically during study period to a depth of 10 cm. ‡LSD = Soil parameters are significantly different if the difference between column means is greater than Fisher’s least significant difference test. NS = Not significant. § Bray 1 extractable P (0.03N NH4F + 0.025N HCL). ¶ Olsen extractable P (0.5N NaHCO3 + 0.025N HCL) †† The numeric demarcation at follows each treatment code indicates N rate and application frequency; 1, 2, and 3 representing 49 kg ha-1 (every 60-d), 98 kg ha-1(every 120-d), and 147 kg ha-1 (every 180-d), respectively.

39
Table 2-2. Nitrogen source description and application information. TRT† PRODUCT DESCRIPTION N-P-K
ANALYSIS N
APPLIED
APP. ‡ INTERVAL
MANUFACTURER
kg ha-1 days
BSD1§ Lawn grade sewage sludge biosolid 6-2-0 49 60 Milorganite, Miliwaukee, WI
PCU1 Polymer-coated urea 42-0-0 49 60 Pursell Inc., Sylacauga, AL
CRL1 12% Urea + 18% methylene urea + triazone 30-0-0 49 60 Georgia-Pacific, Decatur, GA
UPCU1 50:50 N (urea:polymer-coated urea) 44-0-0 49 60 Pursell Inc. & PCS Sales, Inc
Urea Granular 46-0-0 49 60 PCS Sales, Northbrook, IL
BSD2 Lawn grade sewage sludge biosolid 6-2-0 98 120 Milorganite, Miliwaukee, WI
PCU2 Polymer-coated urea 42-0-0 98 120 Pursell Inc., Sylacauga, AL
CRL2 12% Urea + 18% methylene urea + triazone 30-0-0 98 120 Georgia-Pacific, Decatur, GA
UPCU2 50:50 N (urea:polymer-coated urea) 44-0-0 98 120 Pursell Inc. & PCS Sales, Inc
BS3 Lawn grade sewage sludge biosolid 6-2-0 147 180 Milorganite, Miliwaukee, WI
PCU3 Polymer-coated urea 42-0-0 147 180 Pursell Inc., Sylacauga, AL
CRL3 12% Urea + 18% methylene urea + triazone 30-0-0 147 180 Georgia-Pacific, Decatur, GA
† TRT = Treatment code: CRL = Control release liquid; PCU = Polymer-coated urea; BS = Activated sewage sludge biosolid; UPCU = Urea in equal N combination with polymer-coated urea. ‡ N source release window, sources reapplied following interval (days). § The numeric demarcation at follows each treatment code indicates N rate and application frequency; 1, 2, and 3 representing 49 kg ha-1 (every 60-d), 98 kg ha-1(every 120-d), and 147 kg ha-1 (every 180-d), respectively.

40
Table 2-3. The influence of N source, application rate, and frequency on average visual quality over 60-d cycles across 2007 and 2008.
TREATMENT† ST. AUGUSTINEGRASS QUALITY 2007 2008 WET SEASON DRY SEASON WET SEASON DRY SEASON C1‡ C2 C3 C4 C5 C6 C7 C8 C9 C10 C11 C12 ------------------------- RATINGS [1-9 SCALE] ------------------------- BSD1§ 6.0 7.1 7.0 6.7 6.7 6.8 6.8 7.7 6.9 7.1 6.3 7.3 PCU1 5.7 7.5 7.3 6.9 6.8 7.7 .3 7.7 7.2 7.0 6.4 7.7 CRL1 5.4 6.4 5.7 5.7 5.0 5.7 5.6 6.5 5.7 6.0 5.6 6.1 UPCU1 6.8 7.6 7.4 7.3 7.5 7.7 7.5 7.6 7.1 7.9 6.9 7.6 UREA1 6.0 7.8 7.4 7.6 7.8 7.6 7.8 7.5 7.1 7.8 6.7 7.3 BSD2 6.3 6.8 7.4 6.3 6.9 6.5 7.4 7.2 7.5 7.2 6.0 6.6 PCU2 6.2 7.5 7.7 7.1 7.0 7.6 7.7 7.5 7.5 7.9 6.2 7.6 CRL2 6.3 6.6 6.5 5.4 5.7 5.4 5.9 5.6 5.9 5.3 5.2 5.6 UPCU2 6.9 7.4 8.0 6.7 7.6 7.3 8.0 6.9 7.7 7.0 6.4 6.7 BSD3 7.0 7.1 6.0 7.7 7.2 6.3 7.8 7.2 6.4 8.0 7.3 6.9 PCU3 6.5 7.8 6.6 6.7 8.0 7.3 7.9 7.4 6.2 6.6 8.0 7.7 CRL3 6.7 6.8 6.6 6.3 5.0 4.9 6.2 5.5 5.2 6.6 5.3 5.5 CONTRAST¶ UREA vs. CRNS# * *** *** *** *** *** *** ** *** *** NS ** UREA vs. MIXED†† NS NS NS ** NS NS NS NS NS NS NS NS MIXED vs. CRNS NS ** *** *** *** *** *** * *** *** * * PCU1 vs. BSD1 NS NS NS NS NS ** * NS NS NS NS NS CRL1 vs. BSD1 & PCU1 NS *** *** *** *** *** *** *** *** *** ** *** UPCU1 vs. PCU1 & BSD1 NS * NS *** NS * NS NS NS *** * NS PCU2 vs. BS2 NS ** NS *** NS ** NS NS NS ** NS ** CRL2 vs. BSD2 & PCU2 NS * *** *** *** *** *** *** *** *** ** *** UPCU2 vs. PCU2 & BSD2 * NS * NS * NS * * NS * NS NS PCU3 vs. BSD3 NS ** ** *** * ** NS NS NS *** * * CRL3 vs. BSD3 & PCU3 NS ** *** *** *** *** *** *** *** *** *** *** NS, *, **, ***, = P>0.05, P<0.05, P<0.01, P<0.001 † Treatment code: CRL = Control release liquid; PCU = Polymer-coated urea; BSD = Activated sewage sludge biosolid; and UPCU = Urea in equal N combination with polymer-coated urea. ‡C = Means of 3 replications, averaged over each 60-d cycle. § The numeric demarcation that follows each treatment code indicates N rate and application frequency; 1, 2, and 3 representing 49 kg ha-1 (every 60-d), 98 kg ha-1(every 120-d), and 147 kg ha-1 (every 180-d), respectively. ¶ Single degree contrasts performed at the alpha level 0.05. # CRNS: Controlled-release N sources (BSD, CRL, and PCU) grouped across all rates and frequencies. †† MIXED: Mixed component N sources (UPCU) grouped over both rates.

41
Table 2-4. The influence of N source, application rate, and frequency on visual density evaluated ~ every 3-mo across 2007 and 2008.
TREATMENT† ST. AUGUSTINEGRASS DENSITY 2007 2008 WET SEASON DRY SEASON WET SEASON DRY SEASON 04/29 07/31 10/30 01/29 05/09 08/08 11/07 02/20 05/15 ------------------------- RATINGS [1-9 SCALE] ------------------------- BSD1§ 4.7‡ 7.0 5.0‡ 6.7 7.0‡ 7.3 6.3‡ 5.0 6.5 PCU1 4.8‡ 7.5 6.3‡ 6.2 8.0‡ 7.2 6.5‡ 5.2 7.2 CRL1 5.0‡ 6.5 4.0‡ 4.8 6.0‡ 6.5 5.2‡ 4.2 4.2 UPCU1 4.8‡ 7.5 6.3‡ 6.7 7.5‡ 7.3 7.3‡ 5.7 7.2 UREA1 5.2‡ 7.3 6.2‡ 8.0 7.2‡ 7.3 7.0‡ 5.7 6.2 BSD2 4.8‡ 6.7 6.0 6.5 6.3‡ 6.5 7.0 5.0 5.3 PCU2 4.8‡ 7.5 7.5 5.8 7.5‡ 7.0 9.0 4.8 7.0 CRL2 4.8‡ 6.5 5.0 5.3 5.5‡ 5.3 4.8 4.0 3.8 UPCU2 4.8‡ 7.2 7.5 7.2 6.8‡ 6.5 7.0 5.2 5.7 BSD3 5.2‡ 7.0 4.7‡ 7.0 6.2‡ 6.8 5.7‡ 6.0 5.0 PCU3 4.8‡ 7.7 5.7‡ 7.3 7.2‡ 7.0 4.8‡ 8.2 6.7 CRL3 5.0‡ 6.7 4.2‡ 4.7 5.2‡ 5.3 4.5‡ 4.2 3.2 CV (%) 6.0 3.7 11.0 8.3 9.7 5.6 6.2 11.4 12.2 CONTRAST¶ UREA vs. CRNS# NS NS * *** NS ** NS NS NS UREA vs. MIXED†† NS NS NS ** NS NS ** NS NS MIXED vs. CRNS NS * *** ** * * *** NS ** PCU1 vs. BSD1 NS * * NS NS NS NS NS NS CRL1 vs. BSD1 & PCU1 NS *** ** *** ** ** *** * *** UPCU1 vs. PCU1 & BSD1 NS * NS NS NS NS * NS NS PCU2 vs. BSD2 NS *** ** NS * NS * NS *** CRL2 vs. BSD2 & PCU2 NS ** *** * ** *** *** * *** UPCU2 vs. PCU2 & BSD2 NS NS NS * NS NS NS NS NS PCU3 vs. BSD3 NS ** NS NS NS NS NS *** ** CRL3 vs. BSD3 & PCU3 NS ** * *** ** *** ** *** ***
NS, *, **, ***, = P>0.05, P<0.05, P<0.01, P<0.001 † Treatment code: CRL = Control release liquid; PCU = Polymer-coated urea; BSD = Activated sewage sludge biosolid; and UPCU = Urea in equal N combination with polymer-coated urea. ‡C = Fertilization events followed visual assessment. § The numeric demarcation that follows each treatment code indicates N rate and application frequency; 1, 2, and 3 representing 49 kg ha-1 (every 60-d), 98 kg ha-1(every 120-d), and 147 kg ha-1 (every 180-d), respectively. ¶ Single degree contrasts performed at the alpha level 0.05. # CRNS: Controlled-release N sources (BSD, CRL, and PCU) grouped across all rates and frequencies. †† MIXED: Mixed component N sources (UPCU) grouped over both rates.

42
Table 2-5. The influence of N source, application rate, and frequency on dry weight yield over each 60-d cycle across 2007 and 2008.
TREATMENT ST. AUGUSTINEGRASS DRY WEIGHT YIELD 2007 2008 WET SEASON DRY SEASON WET SEASON DRY SEASON C1 C2 C3 C4 C5 C6 C7 C8 C9 C10 C11 C12 ------------------------------------- kg DW ha-1 d-1 ------------------------------------- BSD1 2.8 9.2 3.9 0.5 0.4 0.9 8.3 12.2 7.8 0.5 0.3 2.2 PCU1 1.6 4.8 4.4 0.6 0.8 1.6 13.6 15.5 8.6 0.5 0.3 2.6 CRL1 1.4 3.9 1.1 0.2 0.5 0.2 1.1 3.5 3.0 0.3 0.2 0.6 UPCU1 2.1 9.1 6.2 1.0 0.8 1.9 12.6 14.6 9.0 0.6 0.3 2.5 UREA1 3.4 11.9 6.7 1.4 1.0 2.0 11.7 12.1 9.3 0.9 0.3 2.5 BSD2 3.5 5.7 6.3 0.7 0.7 0.5 10.2 6.3 7.7 0.5 0.2 1.1 PCU2 2.9 11.2 6.8 1.2 0.7 1.5 25.7 12.6 7.0 0.9 0.2 2.5 CRL2 2.7 4.9 2.4 0.3 0.3 0.2 1.6 2.1 2.8 0.2 0.2 0.3 UPCU2 5.4 8.8 9.1 1.3 1.4 1.3 16.6 7.3 8.2 0.7 0.3 1.1 BSD3 6.4 9.5 1.7 1.0 0.7 0.6 22.4 10.7 4.3 1.1 0.4 0.8 PCU3 4.8 20.0 4.3 0.4 1.8 2.2 39.4 16.7 5.1 0.5 0.5 2.6 CRL3 4.5 6.2 1.2 0.4 0.2 0.3 1.6 1.9 1.5 0.5 0.2 0.3 CV (%) 19.0 14.4 17.2 18.4 17.9 24.5 16.7 16.8 7.9 15.3 11.3 13.0 CONTRAST¶ UREA vs. 49 Kg RATE# * ** ** *** * * NS NS ** ** * * PCU1 vs. BSD1 NS NS NS NS * NS * NS NS NS NS NS CRL1 vs. BSD1 & PCU1 NS NS *** NS NS ** *** *** *** NS NS *** PCU1 vs. UPCU1 NS * NS * NS NS NS NS NS NS NS NS UREA vs. 98 Kg RATE†† NS * NS ** NS ** NS ** *** * * *** PCU2 vs. BSD2 NS ** NS * NS * *** * NS * NS *** CRL2 vs. BSD2 & PCU2 NS * *** ** * * *** *** *** *** NS *** PCU2 vs. UPCU2 * NS NS NS * NS * NS NS NS NS *** UREA vs. 147 Kg RATE * NS *** *** NS ** NS NS *** NS NS *** PCU3 vs. BSD3 NS ** * ** *** *** ** NS NS ** * *** CRL3 vs. BSD3 & PCU3 NS *** * NS *** ** *** *** *** * *** *** NS, *, **, ***, = P>0.05, P<0.05, P<0.01, P<0.001 † Treatment code: CRL = Control release liquid; PCU = Polymer-coated urea; BSD = Activated sewage sludge biosolid; and UPCU = Urea in equal N combination with polymer-coated urea. ‡C = Means of 3 replications, averaged over each 60-d cycle. § The numeric demarcation that follows each treatment code indicates N rate and application frequency; 1, 2, and 3 representing 49 kg ha-1 (every 60-d), 98 kg ha-
1(every 120-d), and 147 kg ha-1 (every 180-d), respectively. ¶ Single degree contrasts performed at the alpha level 0.05. # 49 kg RATE: Single degree contrast of urea vs. all sources applied at 49 kg N ha-1. †† 98 kg RATE: Single degree contrast of urea (49 kg N ha-1) vs. all sources applied at 98 kg N ha-1. ‡‡ 147 kg RATE: Single degree contrast of urea (49 kg N ha-1) vs. all sources applied at 147 kg N ha-1.

43
Table 2-6. The influence of N source, application rate, and frequency on nitrogen uptake over each 60-d cycle across 2007 and 2008.
TREATMENT† ST. AUGUSTINEGRASS NITROGEN UPTAKE 2007 2008 WET SEASON DRY SEASON WET SEASON DRY SEASON C1‡ C2 C3 C4 C5 C6 C7 C8 C9 C10 C11 C12 ---------------------------------------- g N ha-1 d-1 ---------------------------------------- BSD1 47 204 81 10 9 21 172 269 163 11 5 41 PCU1 25 85 86 14 18 32 265 324 176 12 5 49 CRL1 19 69 17 4 8 4 18 67 52 6 3 10 UPCU1 32 177 117 19 18 40 244 292 193 14 6 47 UREA1 55 249 121 33 20 27 216 256 195 19 6 46 BSD2 59 103 133 12 14 9 206 116 172 10 4 19 PCU2 57 231 145 24 15 33 601 257 151 19 4 47 CRL2 40 81 41 5 6 4 25 33 52 4.1 4 5 UPCU2 103 156 193 24 32 27 337 128 193 16 5 18 BSD3 125 182 26 24 13 10 496 201 71 28 8 14 PCU3 109 497 72 8 42 47 958 356 90 13 12 44 CRL3 76 92 18 8 3 3 27 301 24 10 3 4 CV (%) 19.4 7.3 9.8 20.7 18.7 18.6 9.2 7.0 3.8 12.1 18.1 9.1 CONTRAST¶ UREA vs. CRNS# NS ** ** *** * *** NS ** *** ** NS *** UREA vs. MIXED†† NS NS NS * NS NS NS NS NS NS NS * MIXED vs. CRNS NS NS *** *** *** *** ** * *** * NS *** PCU1 vs. BSD1 NS * NS NS * * * NS NS NS NS NS CRL1 vs. BSD1 & PCU1 NS NS *** * NS *** *** *** *** ** NS *** UPCU1 vs. BSD1 & PCU1 NS * NS NS NS ** NS NS NS NS NS * PCU2 vs. BSD2 NS * NS * NS ** * * NS * NS *** CRL2 vs. BSD2 & PCU2 NS * *** ** * *** *** *** *** *** NS *** UPCU2 vs. PCU2 & BSD2 * NS NS NS * NS NS NS NS NS NS * PCU3 vs. BSD3 NS ** ** ** ** *** NS NS NS ** NS *** CRL3 vs. BSD3 & PCU3 * *** ** NS *** *** *** *** *** ** *** ***
NS, *, **, ***, = P>0.05, P<0.05, P<0.01, P<0.001 † Treatment code: CRL = Control release liquid; PCU = Polymer-coated urea; BSD = Activated sewage sludge biosolid; and UPCU = Urea in equal N combination with polymer-coated urea. ‡C = Means of 3 replications, averaged over each 60-d cycle. § The numeric demarcation that follows each treatment code indicates N rate and application frequency; 1, 2, and 3 representing 49 kg ha-1 (every 60-d), 98 kg ha-
1(every 120-d), and 147 kg ha-1 (every 180-d), respectively. ¶ Single degree contrasts performed at the alpha level 0.05. # CRNS: Controlled-release N sources (BSD, CRL, and PCU) grouped across all rates and frequencies. †† MIXED: Mixed component N sources (UPCU) grouped over both rates.

44
Fig. 2-1. The duration of acceptable St. Augustinegrass quality (i.e ratings ≥ 6) provided by
CRNS applied at 147 kg N ha-1 prior to the 4-mo rainy season fertilization on April 30, 2007. Vertical dashed lines indicate restrictive season parameters. Urea at high frequency, low per-application N provided a quality benchmark to assess initial and the long term response from CRNS. Arrows indicate urea fertilization events.
4.5
5.0
5.5
6.0
6.5
7.0
7.5
8.0
8.5
4/29 5/9 5/19 5/29 6/8 6/18 6/28 7/8 7/18 7/28 8/7 8/17 8/27 9/6 9/16 9/26 10/6 10/16 10/2RATING DATES
QU
ALI
TY R
ATI
NG
CRL3
P CU3
BS3
UREA1
MIN. ACCEP T. STD.

45
Fig. 2-2. The duration of acceptable St. Augustinegrass quality (i.e ratings ≥ 6) provided by
CRNS applied at 147 kg N ha-1 prior to the 4-mo rainy season fertilization on May 15, 2008. Vertical dashed lines indicate restrictive season parameters. Urea at high frequency, low per-application N provided a quality benchmark to assess initial and the long term response from CRNS. Arrows indicate urea fertilization events.
4.0
4.5
5.0
5.5
6.0
6.5
7.0
7.5
8.0
8.5
9.0
5/9 5/23 6/6 6/20 7/4 7/18 8/1 8/15 8/29 9/12 9/26 10/10 10/2 11/7RATING DATES
QU
ALI
TY R
ATI
NG
CRL3
P CU3
BS3
UREA1
MIN. ACCEP T. STD.

46
y = 0.0598x - 1.995R2 = 0.9453
y = 0.0357x - 0.4994R2 = 0.9985
y = 0.0239x + 0.1562R2 = 0.9845
0.0
1.0
2.0
3.0
4.0
5.0
6.0
7.0
8.0
45 70 95 120 145
NITROGEN RATE (kg N ha-1)
YIE
LD (k
g D
W h
a-1)
BSDCRLPCULinear (BSD)Linear (PCU)Linear (CRL)
Fig. 2-3. The relationship between CRNS rate (i.e. 49, 98, 147 kg N ha-1) and average St. Augustinegrass yield during the 60-d period following initial fertilization in 2007.

47
CHAPTER 3 INORGANIC NITROGEN LEACHING FROM ST AUGUSTINEGRASS IN RESPONSE TO
NITROGEN FERTILIZATION STRATEGIES UNDER RESIDENTIAL LAWN CONDITIONS
Introduction
Anthropogenic intrusion to the magnitude experienced in Florida in recent years has the
potential to drastically alter the nitrogen (N) cycle and more than double the production rate of
reactive N (Galloway and Cowling 2002; Galloway et al. 2004). For example, increasing human
population densities in various watersheds have been correlated with nitrate (NO3-N)
degradation of groundwater (Vitousek et al., 1997; Peierls et al., 1991), with detrimental
consequences to ecological systems (Wolfe and Patz, 2002). Human health may also be impacted
due the reliance on groundwater for drinking supplies, must not exceed the Maximum
Contaminant Level (MCL) of 10 mg L-1 as N set by Environmental Protection Agency (EPA).
Residential landscapes have increased dramatically in Florida in unison with urban development
to support population expansion (Haydu and Cisar, 1990). St. Augustinegrass [Stenotaphrum
secundatum (Walt.) Kuntze] is the predominant vegetation in Florida residential landscapes
(Erickson et al., 2005) with an estimated land use of 810,000 ha (Trenholm and Unruh, 2007).
Routine fertilization practices of residential turfgrass have been implicated as a major source of
NO3-N contamination of groundwater in these locations (Flipse et al., 1984). Urban fertilizer
usage has increased in tandem with residential landscape expansion in Florida (Erickson et al.,
2005) and detailed evaluations of N fertilization strategies on St. Augustinegrass are needed,
particularly in South Florida where the most populated areas are located throughout coastal
regions where fine sand soils are subjected to frequent and intense seasonal precipitation
(McCollum et al, 1978; McCollum and Cruz, 1981; Pendleton et al. 1984; Hurt et al., 1995).

48
Environmental precursors in southern Florida are highly conducive of rapid N leaching (i.e.
coarse textured soil with high soil-water percolation) under conditions of excessive N
fertilization coupled with abundant precipitation or irrigation (Reike and Ellis, 1974; Snyder et
al., 1984; Morton et al., 1988; Barton et al., 2006). In efforts to address concerns over N loss
from residential landscape N fertilization and to more effectively manage urban coastal
watersheds influenced by non-point source pollutants, state-wide fertilizer labeling legislation
was introduced. Directed specifically at residential and urban landscapes, this legislation limits
per-application N rates to 49 kg ha-1 and restricts the water-soluble N portion to 34 kg N ha-1
(Department of Agricultural and Consumer services, No. 4640400, Rule 5E-1.003, 2007).
In addition, certain coastal counties and municipalities imposed further prohibitive measures
by restricting N fertilization during the traditional rainy season in Florida from June 1 through
September 30; constrains annual fertilizer N to 196 kg ha-1, and controls the soluble-N fraction to
24.5 kg N ha-1 per-application (Council of the City of Sannibel, Water Resources Department,
Ordinance No. 07-003; Board of County Commissioners of Sarasota County, Ordinance No.
2007-63; Board of County Commissioners of Lee County, Ordinance No. 08-08).
The scientific literature suggests that minimal N leaching or run-off occurs from judicious
fertilization of established turfgrass with quick-release N-sources (Easton and Petrovic, 2004;
Gross et al., 1990, 1991; Linde et al., 1995, 1998; Miltner et al., 1996; Mosdell and Schmidt,
1985; Petrovic et al., 1986; Starr and Deroo, 1981; Snyder et al., 1981, 1984), although
appreciable N leaching has been observed when excess N fertilization on coarse textured soils is
coupled with high irrigation or precipitation (Barton et al., 2006; Nelson et al., 1980; Reike and
Ellis, 1974; Snyder et al., 1984). Several studies have indicated that NO3-N leaching is
significantly reduced under controlled- versus quick-release N fertilization strategies (Brown et

49
al., 1977; Nelson et al., 1980; Snyder et al. 1981, 1984; Petrovic et al., 1986; Geron et al., 1993;
Engelsjord and Singh, 1997; Guillard and Kopp, 2004). Of these, only Petrovic et al. (1986),
Geron et al. (1993), and Guillard and Kopp, (2004) conducted their studies to address residential
lawn fertilization under the cool-season grass conditions. In fact, no prior study to date has
examined the influence of quick- and controlled-release N-sources on N leaching from a
conventional St. Augustinegrass lawn environment.
Imposing stringent N application rate restrictions unilaterally across all N-sources may
negate the best features of controlled-release nitrogen sources (CRNS). They are more effective
when applied at infrequent higher per-application rates (Skogley and King, 1968; Hummel and
Waddington, 1984; Williams et al., 1997), which decreases water use in St. Augustinegrass
(Subhrajit and Trenholm, 2005), and reduced N-species leaching (Brown et al., 1977; Nelson et
al., 1980; Snyder et al. 1981, 1984; Petrovic et al., 1986; Engelsjord and Singh, 1997; Guillard
and Kopp, 2004). Current legislation prohibits higher per-application rates of CRNS prior to the
120-d restrictive seasons, although these sources may provide sustained growth and vigor due to
extended N-release patterns. There is considerable interest in determining whether higher pre-
application rates of CRNS fertilizers induce appreciable N leaching under St. Augustinegrass
lawn conditions. Consequently, research to investigate N-leaching under varying N sources,
application rates, and frequencies on St. Augustinegrass is of primary importance to better
understand the efficacy of N rate regulation and provide legislative bodies with valuable
information so that future enactments advocate sound agronomic and environmental principles.
Research Objectives
Numerous studies that evaluated N-leaching under cool-season residential turfgrass
conditions have reported that environmental impacts of N fertilization are reduced when CRNS

50
strategies are compared to quick-release soluble N approaches. However, to date no published
studies are available under St. Augustinegrass lawn conditions. Therefore, the objectives of this
experiment were as follows.
• Objective 1: to determine if controlled-release N sources can be applied at higher rates than currently permitted prior to restrictive seasons without negatively contributing to groundwater N degradation.
• Objective 2: to evaluate whether N leaching losses are escalated when the soluble portion of applied N is increased from currently mandated levels of 24.5 kg N ha-1 to 49 kg N ha-1.
• Objective 3: to ascertain if variable N management approaches result in differences in N species leached.
• Objective 4: to establish if total N recovery was influenced by N management regime, using a N budget approach.
Materials and Methods
The experimental design, treatments, and statistical analysis were described in the
materials and methods section in chapter two (p 20), this section will focus on methodology
pertaining to inorganic N leaching determinations. For a statistical standpoint, the only
distinction between chapters was the occurrence of outliers. On two occasions, for urea and CRL
3 outliers were identified as datum that exceeded three standard deviations from the mean and
were subsequently removed from analysis.
Unfortunately, an appreciable amount of water samples were inadvertently discarded while
awaiting analysis at FLREC. This constituted samples from November 7, 2007 to January 6,
2008, and in terms of application cycles corresponded to the beginning of the dry season (DS)
sampling period when 49 and 147 kg N ha-1 treatments were initially applied in cycle 4 and 2,
respectively. Furthermore, this impacted half of the third cycle for 98 kg N ha-1 treatments. As
such, leaching data for these full cycles are not presented.

51
Construction Specifications of the Field-Based N Leaching Facility
A pre-existing elevated facility to permit gravity-fed water percolate collection was used for
this experiment and since this facility has not been previously described a detailed account of
construction specifications are provided. In November 2004, ~ 400 m3 cubic meters of native soil
was extracted allowing the installation of underlying hard fractured limestone fill base for
structural support. The foundation was laser-graded to provide a uniform base on which to
construct an artificial soil profile throughout the 27.5 x 14 m site that corresponded to the
constructed profile in each lysimeter; designed to facilitate quantifiable water percolation with
minimal risk of flow restriction due to sand migration.
Each lysimeter was constructed from a high density polyethylene drum that was 86 cm long,
an interior of 55 cm, a 1.3 cm thick wall, (US Plastic Corp., Lima, OH) and the flat bottom was
removed. When installed the lysimeter was inverted so that the manufactured threaded aperture
(to allow attachment of a liquid extraction device) was situated at the base. Polyvinyl chloride
(PVC) drainage pipes (schedule 40, 1.9 cm diameter) were individually installed into the
foundation with sufficient gradient to permit gravity-fed flow to the percolate collection sites
located at the periphery of the facility. Drainage PVC pipe was connected to each lysimeter with
a screw in PVC fitting, attached to a 90o elbow.
A stainless steel screen (1 mm mesh) was inserted into each lysimeter drainage outlet to
retain the gravel (>14 mm 1%, 12-14 mm 7.5%, 9-12 mm 10.5%, 6.73-9 mm 28%, 6-6.73 mm
41%, 4-6 mm 7%, 2-4 mm 3.5%, <2mm 1.5%), which was back-filled to a depth of 10 cm.
Medium sand (>2 mm 0.1%, 1-2 mm, 7.6%, 0.5-1.0 mm 26%, 0.25-0.5 mm 45.6%, 0.15-0.25
mm 19.1%, 0.053-0.15 1.2%, <0.053 0.6%) was uniformly positioned to a depth of 5 cm
between the gravel layer and the finer root zone sand to act as a “choker layer” to prevent
particle migration. Mason sand (very coarse 0.2%, coarse 5.4 %, medium 29.9%, fine sand
52
62.9%, very fine sand 1.5%, and silt and clay 0.1%) that closely matched the particle size
distribution of the Margate and Hallandale fine sand soil series (Siliceous, hyperthermic Lythic
Psammaquent) found in this coastal plain region was back-filled, and uniformly compacted at
~15 cm depth increments.
The soil profile at the experimental site was constructed to conform exactly to lysimeter
specifications before an additional 5 cm of mason sand was installed above the upper rim of each
lysimeter to provide a final mason sand depth of 76 cm. The elevated rectangular platform was
re-leveled and the sloping sides were gently graded to facilitate grass mowing maintenance.
Sampling stations with sufficient capacity to contain three 20 L percolate collection containers
were excavated and supported with timber framing. An automatic irrigation system was
configured to provide watering flexibility with individual irrigation zones covering 4 x 4 m unit
areas (i.e. 2 treatment plots per irrigation zone). Each zone was fitted with landscape 1800 series
pop-up sprinklers with 12 Series VAN, 15° Trajectory, 90o arc nozzles (Rain Bird Corp. Azusa,
Ca) at each corner.
In November 2006, 6-mo prior to the initiation of our experiment, the existing sod was
removed and mason sand matching the original specifications was used to re-construct the initial
soil profile specification, before St Augustinegrass cv. ‘Floratam’ sod, harvested from sand
grown soil was installed. Establishment fertilization included 49 kg P ha-1 from triple super
phosphate and 49 kg K ha-1 from muriate of potash on January 12 and April 20, 2007. No N
fertilizer was applied until treatment initiation on April 30, 2007.
Percolate Sampling and Field Quality Assurance
Percolate drainage samples were collected ~every 7-d or following precipitation events
exceeding 0.64 cm in accordance with Florida Department of Environmental Protection (FDEP)
quality assurance/quality control (QA/QC) protocol that stipulate appropriate collection of

53
blanks, duplicates and standards during field sampling. Sampling occurred more frequently for
the 21-d periods following N fertilization when precipitation of ≥ 0.25 cm prompted sampling.
Percolate water volume was recorded on each occasion. Sub-samples were collected in
polyethylene scintillation vials, stored on ice at 4oC during the sampling procedure, and stored in
a frozen matrix until analysis. The N concentration of irrigation water was determined at each
sampling event and precipitation N was periodically assessed throughout the study period.
Percolate Water Sample Analysis and Laboratory Quality Assurance
Leachate samples were analyzed at FLREC for NO3-N and NH4-N using colorimetric
methods G-200-97 Rev.3 and G-171-96 Rev. 8, respectively (Seal Analytical, Norderstedt,
Germany). Leachate data were subjected to strict QA/QC protocols. Colorimetric NO3-N and
NH4-N calibration curves achieved r2 ≥ 0.9995, while blanks, spikes, duplicates, and certified
standards were ± 5% of expected values. In order to achieve consistent spike recoveries, the
minimal detection limit (MDL) was increased to 0.05 mg l-1 and 0.03mg l-1 for NO3-N and NH4-
N, respectively and sample concentrations determined below these levels were reported as MDL
values, therefore, N leaching data are considered to be worst case scenario.
The dual channel instrument permitted simultaneous analysis of NO3-N and NH4-N,
however, the significant amount of time saved came at the expense of accurately determining
NO3-N. The G-200-97 method relies on the reduction of NO3-N to nitrite (NO2-N) for
colorimetric detection. Since NO2-N concentrations should be established under a system devoid
of cadmium reduction capacity and would be subtracted from NO3-N to accurately depict the
concentration of NO3-N, this study reported inorganic-N leaching as NOx-N and NH4-N.
Mean cycle flow-weighted NOx-N concentrations data, calculated as the total NOx-N leached
divided by total percolate volume were presented by fertilization cycle. To demonstrate the
influence hydrological factors may contribute to increased instances of groundwater pollution

54
through excessive N leaching, individual NOx-N leaching events were plotted with precipitation
data (summed over each sampling period) during periods when peak NOx-N concentrations were
observed. Mean N loading data, calculated as the inorganic-N concentration divided by the
surface area of the lysimeter, were summed over each fertilization cycle to convey the potential
for fertilizer N strategies’ to contribute to specific water body impairment. In coastal watersheds,
where residential land-use has been estimated, this information may prove particularly pertinent
since ground water delivers the majority of non-point source, land derived-N pollutants to
estuaries and coastal ecosystem where N is often the limiting nutrient for growth (King and
Balogh, 2008). In addition, the inorganic N inputs were summarized in budget format and
aligned with N recovered in leachates and St. Augustinegrass tissue over each fertilization cycle
to illustrate the efficacy of fertilizer N-strategies and to divulge potential N losses or sinks not
measured in this study.
Results and Discussion
Flow-Weighted NOx-N Concentrations Influenced by N Source and Hydrology
During this study, N source influenced mean cycle flow-weighted NOx-N concentrations
with highest concentrations occurring under urea fertilization, applied solely or in combination
with polymer-coated urea (PCU) (i.e. urea plus PCU at 98 kg N ha-1 [UPCU2]) at soluble N rates
of 49 kg ha-1 during the wet season (WS), 2007. When averaged per fertilization cycle maximum
NOx-N concentrations for urea were 6.4 and 3.1 mg L-1 in cycle 1 and 2, respectively (Table 3-
1). For UPCU2, greatest concentrations occurred during the same period with NOx-N
concentrations of 10.5 mg L-1 (Table 3-2). In subsequent cycles, NOx-N concentrations from
soluble-N sources were greatly reduced and despite a similar trend, whereby elevated
concentrations from urea and UPCU2 occurred during the initial 60-d period following
fertilization during the WS of 2008, no differences between soluble-N and CRNS were observed.

55
In 2007, NOx-N leaching was closely coupled with hydrological factors. Two intense
precipitation events occurred shortly after fertilizations and appeared to coincide with peak NOx-
N concentrations. The first produced 60 mm and resulted in high initial NOx-N concentrations
from urea (82.4 mg L-1) and UPCU2 (237.0 mg L-1), 17 days after fertilization (DAF) (Fig. 3-1).
The second 85 mm precipitation event occurred 6 DAF of 49 kg N ha-1 sources, produced no
additional losses from UPCU2, but induced further NOx-N concentrations of 28.6 mg L-1 from
the urea treatment (constituting a 3-fold reduction in leachate NOx-N concentrations compare to
cycle 1). The lower NOx-N concentrations from urea under greater precipitation-induced
leaching conditions may indicate increased capacity for St. Augustinegrass to capture and utilize
applied N as the summer progressed. On the other hand, it may indicate that insufficient time had
elapsed for complete transformation of urea to NH4-N, through enzymatic urease induced
hydrolysis (Conrad, 1942) and subsequent nitrification of NH4-N to NO3-N (Harper and
Boatman, 1926).
Sarigumba and Fiskell (1976) conducted urea transformation studies under sandy soil
conditions in Florida and reported the majority of urea hydrolysis occurred within 3-d under
Blichton fine sand soil conditions, whereas Eriksen and Kjeldby (1987) reported that 85% urea
hydrolysis rate after 4-d. Sabey et al. (1956) illustrated through temperature based incubation
studies that nitrification increases linearly with temperature and that the bulk of ammonium
sulfate was nitrified within 7-d at soil temperatures of 25oC (lower soil temperatures than
observed in our study, Appendix A). Sartain et al. (2004) reported the presence of NO3-N in
leachate from incubated isobutylidene diurea (IBDU) after 7-d; a source that depends on an
additional stage of water hydrolysis for urea release.

56
Noticeably higher NOx-N levels were collected in the leachate, 28.6 mg NOx L-1 compared to
7.8 mg NH4 L-1 (data not included) over this 6-d period in 2007 and the cation exchange capacity
(CEC) of the soils was low (~3.2 cmolc kg-1). Therefore, we conclude that appreciable
nitrification had occurred and that St. Augustinegrass was better able to recover applied N, even
though climatic conditions were more conducive of rapid N-leaching following the second 49 kg
N ha-1 urea application. These findings, together with leachate data from successive cycles
demonstrating negligible losses of NOx-N despite substantial precipitation events in close
proximity to fertilization (Tables 3-1, 3-2), suggests the capture and utilization of applied N
increases towards the latter stages of the summer growing season.
Considering that the St. Augustinegrass stand was established 180-d prior to treatment
initiation during the dry season (DS), in which lower temperatures and photoperiods were less
conducive of growth, together with no N inputs during the establishment period, we believe the
root system had not fully developed during the initial stages of the experiment. DiPaola et al.
(1982) described distinct seasonal rooting patterns for St. Augustinegrass, noting that aggressive
root initiation and growth during summer months was greatly reduced under cooler winter soil
temperatures. Enhanced root growth is associated with increased plant available nitrogen (PAN),
namely in the form of root length. Although the root to shoot dry weight ratio declines with
elevated N supply, the more highly branched, finer root structure increases surface area and
nutrient acquisition (Marschner, 2002). Bowman et al (1998) reported that greater N
accumulation and lower N leaching resulted from deeper rooted creeping bentgrass genotypes. In
greenhouse studies, Bowman et al. (2002) demonstrated that compared to six warm-season grass
varieties, St. Augustinegrass possesses inherently greater root length density (RLD) and
theorized that this morphological characteristic resulted in lower NO3-N leaching. In essence,

57
under N deprived conditions during establishment, RLD progressively increased for St.
Augustinegrass under adequate PAN during summer months. The pulse of NOx-N remained in
contact with the deeper root system for longer durations and resulted in reduced NOx-N leaching
as the WS progressed.
Consequently, given the relationship between N fertility and root growth it appears plausible
that restrictive fertilizer ordinances (June - October), may negatively impact root development
during WS months, when optimal root growth has been observed for St. Augustinegrass systems.
For example, during early summer 2007, when the root system of St. Augustinegrass may not
have fully developed, we observed NOx-N in concentrations in excess of MCL standards (~13
mg L-1) in leachates following a UPCU1 application (i.e. 24.5 kg soluble N ha-1), which
corresponds to currently mandated N fertility guidelines for residential lawns (Fig. 3-3). It
appears that N losses that exceed MCL standards are possible, even under stringent soluble N
level control, if significant precipitation events are encountered shortly after fertilization.
Ironically, the unintended consequences of fertilizer legislation may result in greater NO3-N
leaching, once fertilization resumes, if RLD is adversely affected by 120-d periods when N
inputs are constrained. More research is required to better understand the physiological and
morphological changes that occur in St. Augustinegrass in response to intervals of severe N
limitation in order to better understand the efficacy of restrictive season legislation.
Our findings indicating NOx-N losses in excess of MCL standards are possible with soluble
N fertilization in conjunction with intense precipitation. However, these losses tend to decline
over time, possibly indicating that N uptake efficiency improves concomitantly with successive
fertilization. Conversely, judicious use of CRNS prior to restrictive seasons presented no such
risk, which is consistent with numerous other studies (Petrovic et al. 1986, Geron et al. 1993;

58
Guillard and Kopp, 2004), and would provide N for extended durations (Carrow, 1997; Hummel,
1989; Landschoot and Waddington, 1987; Moberg et al., 1970; Peacock and DiPaola, 1992;
Volk and Horn 1975), to supplement root growth.
Under CRNS fertilization, minimal NOx-N was leached and average cycle flow-weighted
NOx-N losses were for the most part were ≤ 1.0 mg L-1 per cycle (Tables 3-1, 3-2, 3-3). Leachate
NOx-N concentrations in excess of MCL were not observed from biosolid (BSD) or PCU applied
at 147 kg N ha-1 throughout the 24-mo study period and were largely restricted to MDL values
(Fig. 3-4, 3-5). These findings are consistent with numerous studies whose conclusions were
drawn from diverse locations and grass varieties. Barton et al. (2006) investigated the influence
of N source fertilization and irrigation during a 22-mo turfgrass production study with four
warm-season grass varieties, reporting NO3-N concentration in percolate from polymer-coated N
or biosolid treatments never exceeded MCL standards, even when applied at 400 kg N ha-1 under
high irrigation (i.e. 140% evapo-transpiration). Brown et al., (1977) under similar study
parameters, showed that FWNC of < 3 mg l-1 resulted from what was considered high N rates
(146-244 kg ha-1) of Milorganite on bermudagrass turf grown on sandy soil under high irrigation
regimes. Guillard and Kopp (2004) demonstrated that a mixed species cool-season lawn turf
fertilized with either polymer-coated sulfur-coated urea (PCSCU) or an organic N source at 147
kg N ha-1 yr-1 produced no NO3-N leaching above MCL standards throughout a 36-mo residential
lawn leaching study. Petrovic et. al. (1986) reported similar conclusions with anion exchange
resin NO3-N detection techniques employed to a 30 cm depth under a Kentucky bluegrass lawn
environment fertilized with PCU and Milorganite treatments at 98 kg N ha-1.
Several studies have documented higher levels of NO3-N leaching from certain CRNS, which
include sulfur-coated urea (SCU), IBDU, and methylene urea (Petrovic et al., 1986; Snyder et al.

59
1981, 1984). In the present study, there was a tendency for controlled-release liquid (CRL)
treatments to leach higher concentrations of NOx-N compared to BSD or PCU, particularly at
147 kg N ha-1 (Table 3-3). Over each 30-d period after fertilization with the highest N rate of
CRL (147 kg ha-1), peak NOx-N concentrations of 25.2, 63.5, and 32.4 mg NOx-N L-1 were
detected in leachates shortly after fertilization during cycle 1, 3, and 4, respectively (Fig. 3-4, 3-
5). According to manufacturer labeling, this N rate should deliver ~59 kg soluble N ha-1 per-
application and subsequently NOx-N leaching was consistent with initial losses recorded from
urea N at 49 kg ha-1. However, the potential for urea to leach applied N, diminished under repeat
fertilization. In contrast, 2.5-fold increases in NOx-N were observed from CRL in the subsequent
cycle (Fig. 3-4, 3-5). This result could be explained by progressively lower turf density in CRL
plots due to insufficient N release over the latter stages of each application interval (Tables 2-4).
The relationship between turf density and the potential to leach NO3-N has not been well
studied on established grass stands. Research is required to address this concern, particularly in
Florida where residential lawns may experience a decline in turfgrass density due to inadequate
PAN during the peak growing season under fertilization restrictions, a factor that may exacerbate
NO3-N leaching through reduced N uptake under higher soil infiltration rates (Petrovic, 1990).
Current data indicates a close correlation between increasing turf coverage and reduced NO3-N
leaching (Easton and Petrovic, 2008; Rosenthal and Hipp, 1993; Snyder and Cisar, 2000),
however these studies have focused on turf establishment situations where low plant densities are
cognately associated with immaturely rooted turf. Conversely, increased potential for NO3-N
run-off losses due to low plant density has received attention and several studies have noted that
run-off losses decline as turf density increases. These authors attributed lower nutrient run-off in
dense turf due to the reduction in velocity as water travels a more tortuous path through densely
60
populated turf stands, thus resulting in higher infiltration rates (Linde et al., 1995; Gross et al.,
1990, 1991; Easton and Petrovic, 2004). However these studies were conducted largely on fine
texture soils, with low infiltration rates, which is less of a concern in Florida due to the
predominately sandy soil in populated coastal water-sheds. Erickson et al. (2001) showed that
minimal inorganic N run-off was possible from a well fertilized, dense St. Augustinegrass turf on
a 10% slope due to intense precipitation. Therefore, research focusing specifically on the
relationship between St. Augustinegrass density and how this impacts NO3-N run-off and
leaching may be of importance in Florida.
As shown, significant scientific data obtained over many years document that certain CRNS
at higher-application rates offer negligible contributions to ground-water degradation. Our
findings on a field-based St. Augustinegrass lawn system in Florida are consistent with previous
studies and clearly demonstrate that both PCU and BSD can be applied at the N rates employed
in this study (i.e. up to 147 kg ha-1) without significant risk from N species pollution of important
ecological water resources or drinking water supplies in Florida. Therefore we encourage local
and state legislative bodies to consider revising their policies to permit higher-application N rates
of BSD and PCU to allow judicious fertilization throughout the restrictive season to curve
potentially negative impacts of St. Augustinegrass managed under insufficient PAN. (i.e.
reduced turf density and RLD).
Nitrogen Leaching Influenced by N Source
Nitrogen loads were influenced by N sources at each application rate, although N rate
brackets (i.e. 49 and 98 kg N ha-1) that utilized quick-release N, initially offered the highest total
N loads of this study. During cycle 1, urea at 49 kg N ha-1 leached 6.5 % of applied N and
UPCU2 at 98 kg N ha-1, 12 % of applied N (Tables 3-4, 3-15). For urea, an additional 7% of
applied N was leached in cycle 2 (Table 3-5), but thereafter maximum N losses were 2.3%

61
(Table 3-9) with the majority of cycle means showing N losses < 1% of applied N (Tables 3-6 -
3-8, 3-11 - 3-13).
Nitrogen leaching from sources applied at N rates of 98 kg ha-1 were analogous to that
observed under lower N strategies, whereby initial high N loading from UPCU2, were followed
by losses ≤ 1.3% of applied N, although during the WS in 2008 losses of 3.6% of applied N were
noted (Table 3-17). As mentioned above, N leached from BSD and PCU at the elevated N rate
over extended re-application intervals produced the lowest N leaching with average values of
0.9% of applied N leached over the study period. To put this into context, total N losses from
BSD and PCU at 147 kg N ha-1 were lower than the N inputs from the city irrigation water
supply (Tables 3-20 – 3-22). Increased incidences of NOx-N in CRL leachates that were in
excess of MCL standards were reported, which resulted in higher N leaching values as the study
progressed. However, steady increases of 3.3, 4.0, and 4.2 kg ha-1 of total N leached represented
only 2.2, 2.7, and 2.9 % of applied N leached in cycle 1, 3, and 4 respectively.
Relative Recovery of Inorganic Nitrogen in Percolate and Clipping
Evidently, low levels of N leaching resulted from fertilizer N strategies employed in this
study. However, equally low levels of relative N recovery were also apparent, particularly during
the cooler DS. For example, when averaged across each cycle, maximum relative N recovery
from PCU3 and PCU2 were 56.4, and 51.7% of N inputs during the WS of 2008, respectively
and only 3.6 and 3.9% of N was recovered during the DS from these sources. This clearly
represents a large proportion of N unaccounted for. In his review, Petrovic (1990) reported that
five major categories of the N cycle explain the fate of N applied to turfgrass: plant uptake,
atmospheric loss, soil storage, leaching, and run-off.
Plant uptake was quantified in the form of N recovered in clippings, however, temperature
and season have been shown to influence N recovered in clippings and may explain considerably

62
lower relative N recovery under DS conditions. Many studies indicate that the majority of N
applied to turf is recovered in clippings (Hummel and Waddington, 1981; Starr and Deroo,
1981), but most studies were conducted under near optimum conditions for plant growth. South
Florida is unique in that respect since growth persists year round for warm-season grass albeit
with significant reductions during the DS. Few studies have focused on N recovery from turf
under sub-optimal temperatures. Mosdell and Schmidt (1985) examined N recoveries under
temperatures deemed below optimum from Kentucky bluegrass under growth chamber
conditions. They reported N recovery was 39% lower than comparative recoveries under
favorable temperatures for growth. Other studies that have examined N leaching and visually turf
responses in temperate climate reported insufficient growth to quantify tissue N concentrations
from October to April (Mangiafico and Guillard, 2006; Weyner and Haley, 1993). In addition,
since visual symptoms of fertilizer response were observed during these below optimum periods,
N uptake may have been allocated to other plant parts (roots, crowns, stems, and stolons).
Petrovic (1990) reported that 31 and 20 % of applied N could be apportioned in crowns and
roots, respectively. Hummel and Waddington (1984) could only account for 1.5% of applied N
in roots of Kentucky bluegrass. While, Varshovi (1995) observed that N recovery in roots and
stolons of bermudagrass varied between 5 and 11% of applied N depending on N source.
Potential Nitrogen Losses other than Leaching or Plant Uptake
In this study, the portion of N in unmown parts of the plant may have been small and N
run-off may be of little consequence due to the topography and soil texture. Thus atmospheric
loss and/or soil storage may have been the major sinks for applied N. Atmospheric loss of
applied fertilizer N can occur either through ammonia (NH3) volatilization or as denitrification
(Petrovic, 1990). Ammonia volatilization from surface applied NH4-based fertilizers is
influenced by soil pH, soil moisture, temperature, relative humidity (RH), fertilizer source,

63
cation exchange capacity (CEC), and depth of incorporation (Nelson, 1982). Reports of the
magnitude of NH3 losses from surface applied urea on turf are inconsistent and range from 10%
(Torello et al., 1983) to 68% of applied N (Fenn and Kissel, 1974). The majority of fertilizers in
this experiment (9 of 12) were urea based, volatile N loss may have been substantial given that
environmental factors (i.e. high temperature and RH) were particularly favorable for
volatilization during the WS. Irrigation was supplied post-application in efforts to limit NH3
losses, but the rate (0.6 cm) may have been insufficient. Titko et al. (1987) and Bouwmeester et
al. (1985) reported that irrigation rates of 2.5 and 2.4 cm respectively were required to eliminate
potential volatile losses from surface applied urea.
Soil conditions were also conducive of volatile N loss (Table 2-1). Torello et al. (1983)
reported NH3 loss under acidic soil conditions (pH 6.4) was negligible. Conversely, under
alkaline soils NH3 losses can be severe. Research shows that appreciable NH3 is formed at a soil
pH > 7.5 (Vlek and Craswell, 1981; Titko et al., 1987). Even with mildly alkaline soil pH (7.1)
in this study, palpable NH3 volatilization may have occurred (Table 2-1), since sharp increases in
soil pH due to urea hydrolysis are expected for short intervals following urea application (Kissel
et al., 2008).
Guertal et al. (2007) reported that N source influenced NH3 volatilization on warm-season
grass. The extent of gaseous N flux from their treatments were urea > methylene urea > sewage
sludge > PCU. These findings may explain our highest N recovery with PCU (98 and 147 kg N
ha-1); however, it fails to account for lower N recovery from CRL (12% Urea; 18% methylene
urea and triazone) relative to urea at 49 kg ha-1. Clapp and Parham (1991) also found lower NH3
losses from a methlyene urea and triazone fertilizer compared to urea, although, application
method and soil factors may have influenced gaseous losses in our experiment.

64
Firstly, in the present study CRL was the only source to be applied in liquid form and
researchers have shown greater NH3 losses from dissolved versus granularly applied urea
(Torello, 1983; Titko, 1987). Secondly, increased organic matter (OM) reduces NH3 loss through
the contribution of OM to CEC, which influences the retention of NH4. Soil analysis revealed
significantly lower OM and CEC in CRL1 plots compared to urea (Table 2-1). Increased NH3
volatilization may explain progressively lower N recovery, yield and density from CRL (Tables
2-4, 2-5, 3-1, 3-8, 3-9, 3-12), particularly since slower accumulations of OM were observed in
CRL plots compared to urea. NH3 loss may help to explain low N recovery during the WS,
because N losses of 40% are not unusual in tropical climates when conditions are favorable
(Francis et al., 2008). However, environmental factors such as high temperature and RH that
could enhance the magnitude of NH3 losses in the WS were considerably lower during the DS
(Appendix A), when N recoveries were consistently lowest (Tables 3-7, 3-8, 3-12 - 3-14, 3-16, 3-
19, 3-22), therefore, other factors may have contributed.
Denitrification is a multi-step respiratory pathway by which facultative anaerobes reduce
NO3- to molecular N in anaerobic soil with organic or inorganic electron donors and N oxide
electron acceptors (Coyne, 2008). Sand soils are generally not associated with substantial N
losses through denitrification, however, the soil profile within the lysimeter (i.e. constructed
system with distinct textural layers, designed to prevent sand particulate migration and reduce
percolate impediment) may have facilitated anaerobic conditions during the DS when percolate
flow is notably reduced (Appendix B). For example, Brown and Duble (1975) demonstrated
having coarse textured strata within the soil profile created a perched water table and increased
the water retention of the entire profile. In essence, a saturated zone would persist between the
gravel and the sand in the lysimeter system and during periods of infrequent precipitation the

65
replenishment of oxygenated water may be limited and anaerobic conditions may develop. Since
organic electron donors would be available from seasonal regeneration and decomposition of
root structures, conditions may be conducive for biological denitrification during the DS. Under
soil temperatures consistent with the season (20.9 – 25.5oC), denitrification losses ranging from
0.2 – 0.9 kg N ha-1 d-1 have been reported (Lensi and Chalamet, 1982; Groffman et al., 1991).
Soil storage (immobilization), essentially the opposite of mineralization, in that
immobilization is the conversion of inorganic N (NO3-N and NH4-N) to organic forms. On
average OM content of the upper 10 cm soil layer increased by ~1.5% over the 24-mo study
period. The level in which fertilizer N is incorporated into OM is largely a function of turf stand
maturity and during the period of increasing soil OM some of the fertilizer will be immobilized
(Petrovic, 1990). Few studies have investigated the amount of fertilizer N that is eventually
incorporated into OM under turf conditions and the author could not find published literature
documenting this process in warm-season grass turf. Starr and Deroo (1981) evaluated the fate of
N on cool-season grasses using labeled 15N and found that 15 – 21% of applied N was stored in
the organic content of a sandy loam soil, 4-mo after the last application. Watson (1987) reported
similar conclusions ~2-mo after last fertilizer applications to perennial ryegrass grown on a
sandy loam soil and noted that 13 – 17% of fertilizer N from urea was stored in the organic soil
component.
These findings suggest that soil storage or immobilization of fertilizer N in coastal soils in
Florida may be significant, especially in immature residential landscapes which have been shown
to accumulate N rapidly in the first 10-yr period. More research is warranted to determine the
influence of St. Augustinegrass lawn maturity on the fertilization requirements based on the
capacity of a soil to accumulate fertilizer N in the soil organic-N pool. Long-term evaluations

66
may show that reduced inorganic-N inputs are needed as the soil OM content reaches
equilibrium and remains relatively constant, thus removing a potential fertilizer N sink.
Conclusion
This experiment has shown that various N strategies can be employed under St.
Augustinegrass lawn conditions without serious implications to inorganic-N groundwater
degradation. Based on these findings, N leaching from established residential St. Augustinegrass
landscapes is expected to provide minor contributions to the pool of non-point source N
pollutants in coastal watershed systems. Furthermore, we find little benefit in N rate regulation in
addition to that set forth by state legislative bodies. In fact, restrictive fertilization seasons may
have a detrimental environmental impact. For example, CRL at 147 kg N ha-1 that was allocated
an N-release duration (180-d) far in excess of recommended re-application window (60 to 90-d)
demonstrated severe symptoms of N deprivation (i.e. reduced turf density and quality).
Incidences of NOx-N leaching in excess of MCL standards were exacerbated progressively as
these visual assessments deteriorated. These findings may provide valuable information of the
potential ramifications of restrictive season legislation. If counties and municipalities are
insistent on such fertilization boundaries, new revisions are required to enable certain CRNS to
be applied at higher pre-applications N rates than currently permitted, prior to 120-d restrictive
periods in order to sustain St. Augustinegrass density and root growth. For instance, PCU and
BSD demonstrated the lowest inorganic-N leaching at N rates of 147 kg ha-1, and were capable
of sustaining acceptable St. Augustinegrass visual assessments for 120-d durations.
However, only low levels of applied N could be recovered in St. Augustinegrass clippings
and inorganic-N leachates. We proposed three potential factors that may explain unaccounted for
the majority of N not accounted for; (i) NH3 volatilization, (ii) denitrification, and (iii) soil
storage. Ammonia volatilization may be more prevalent under WS conditions and may have

67
induced losses of ~40% or more of applied N depending on the N source. Hydrological factors
may have been most favorable during the DS due to lysimeter specifications and N losses may
have been substantial. Due to turf stand immaturity and low soil OM levels, soil storage or
immobilization of applied fertilizer N may have been in the magnitude of ~15%, although this
value is based on temperate research conditions. The relatively low levels of N recovered in this
study suggest that inorganic-N leaching is not a major N flux in residential landscapes fertilized
with these N sources but gaseous N loses may be more prevalent. Much more research is
required in Florida to better understand the fate of applied N to a St. Augustinegrass under
varying degrees of lawn maturity.

68
Table 3-1. The influence of N source applied at 49 kg N ha-1 on flow-weighted concentration of NO3-N (mg L-1) averaged over each 60-d cycle across 2007 and 2008.
TREATMENT† -------------- 2007 -------------- --------------------- 2008 --------------------- --- Wet Season --- - Dry Season - --- Wet season --- --- Dry Season --- C1‡ C2 C3 C5 C6 C7 C8 C9 C10 C11 C12 ------------------------------------------------------- mg [NOx-N] L-1------------------------------------------------------- BSD1§ 0.62 0.44 0.47 0.40 0.39 0.75 0.59 0.46 0.40 0.30 0.33 PCU1 0.64 0.43 0.43 0.41 0.30 0.48 0.59 0.44 0.38 0.29 0.31 CRL1 0.54 0.73 0.43 0.76 0.45 0.47 1.51 0.50 0.42 0.32 0.45 UPCU1 0.62 1.81 0.41 0.40 0.40 0.51 0.62 0.50 0.43 0.32 0.39 UREA1 6.40 3.09 0.38 0.41 0.32 2.32 0.59 0.50 0.34 0.25 0.95 CONTRAST¶ UREA1 vs. OTHERS * *** NS NS NS NS NS NS NS NS NS UREA vs. UPCU1 * NS NS NS NS NS NS NS NS NS NS PCU1 vs. BS1 NS NS NS NS NS NS NS NS NS NS NS CRL1 vs. BS1 & PCU1 NS NS NS ** NS NS NS NS NS NS NS NS, *, **, ***, = P>0.05, P<0.05, P<0.01, P<0.001 † Treatment code: CRL = Control release liquid; PCU = Polymer-coated urea; BSD = Activated sewage sludge biosolid; and UPCU = Urea in equal N combination with polymer-coated urea. ‡C = Means of 3 replications, averaged over each 60-d cycle. § The numeric demarcation that follows each treatment code indicates N rate and application frequency with 1 representing 49 kg ha-1 applied every 60-d. ¶ Single degree contrasts performed at the alpha level 0.05.
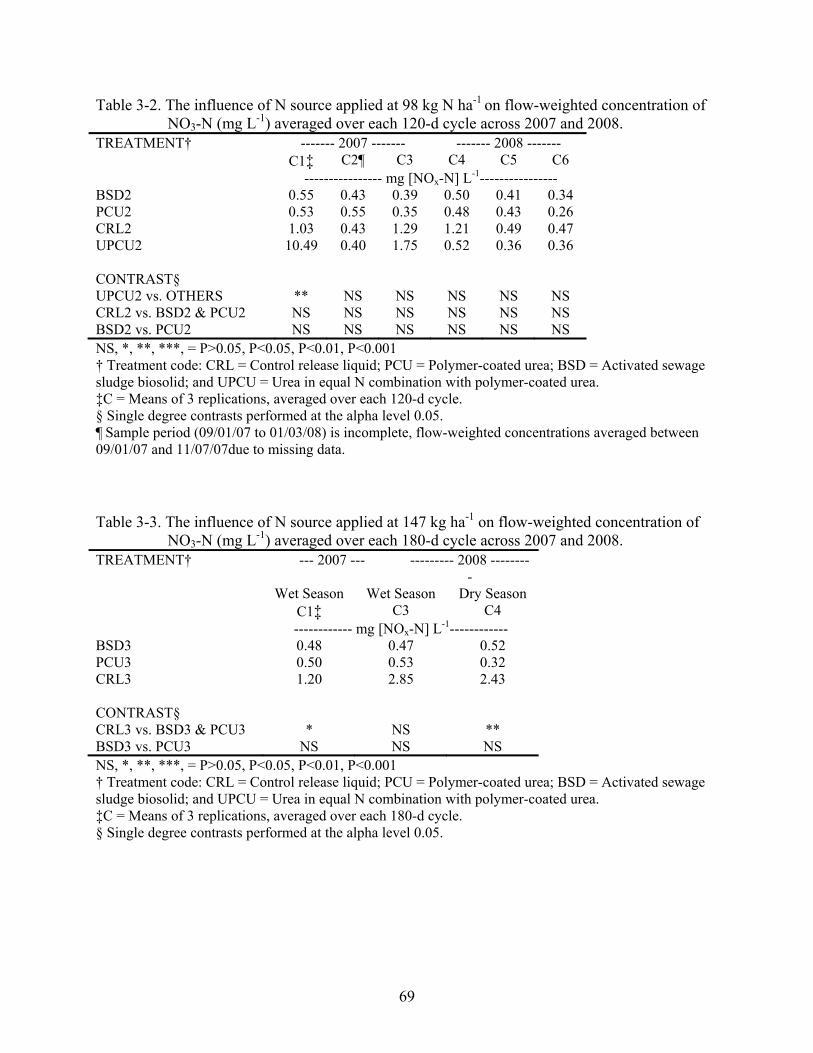
69
Table 3-2. The influence of N source applied at 98 kg N ha-1 on flow-weighted concentration of NO3-N (mg L-1) averaged over each 120-d cycle across 2007 and 2008.
TREATMENT† ------- 2007 ------- ------- 2008 ------- C1‡ C2¶ C3 C4 C5 C6 ---------------- mg [NOx-N] L-1---------------- BSD2 0.55 0.43 0.39 0.50 0.41 0.34 PCU2 0.53 0.55 0.35 0.48 0.43 0.26 CRL2 1.03 0.43 1.29 1.21 0.49 0.47 UPCU2 10.49 0.40 1.75 0.52 0.36 0.36 CONTRAST§ UPCU2 vs. OTHERS ** NS NS NS NS NS CRL2 vs. BSD2 & PCU2 NS NS NS NS NS NS BSD2 vs. PCU2 NS NS NS NS NS NS NS, *, **, ***, = P>0.05, P<0.05, P<0.01, P<0.001 † Treatment code: CRL = Control release liquid; PCU = Polymer-coated urea; BSD = Activated sewage sludge biosolid; and UPCU = Urea in equal N combination with polymer-coated urea. ‡C = Means of 3 replications, averaged over each 120-d cycle. § Single degree contrasts performed at the alpha level 0.05. ¶ Sample period (09/01/07 to 01/03/08) is incomplete, flow-weighted concentrations averaged between 09/01/07 and 11/07/07due to missing data. Table 3-3. The influence of N source applied at 147 kg ha-1 on flow-weighted concentration of
NO3-N (mg L-1) averaged over each 180-d cycle across 2007 and 2008. TREATMENT† --- 2007 --- --------- 2008 --------
- Wet Season Wet Season Dry Season C1‡ C3 C4 ------------ mg [NOx-N] L-1------------ BSD3 0.48 0.47 0.52 PCU3 0.50 0.53 0.32 CRL3 1.20 2.85 2.43 CONTRAST§ CRL3 vs. BSD3 & PCU3 * NS ** BSD3 vs. PCU3 NS NS NS NS, *, **, ***, = P>0.05, P<0.05, P<0.01, P<0.001 † Treatment code: CRL = Control release liquid; PCU = Polymer-coated urea; BSD = Activated sewage sludge biosolid; and UPCU = Urea in equal N combination with polymer-coated urea. ‡C = Means of 3 replications, averaged over each 180-d cycle. § Single degree contrasts performed at the alpha level 0.05.

70
Fig. 3-1. NOx-N leached in cycle 1 (April 30-August 31, 2007) influenced by N sources applied
every 120-d at 98 kg N ha-1 and precipitation during the WS. Vertical dashed lines indicate urea fertilization every 60-d at 49 kg N ha-1. Precipitation values summed over each sampling period.
Fig. 3-2. NOx-N leached in cycle 4 (May 10-Spetmeber 6, 2008), influenced by N sources
applied every 120-d at 98 kg N ha-1 and precipitation during the WS. Vertical dashed lines indicate urea fertilization every 60-d at 49 kg N ha-1, included for comparative interest. Precipitation values summed over each sampling period.
0
50
100
150
200
250
5/1/2007 5/15/2007 5/29/2007 6/12/2007 6/26/2007 7/10/2007 7/24/2007 8/7/2007 8/21/2007SAMPLING DATES
PER
CO
LA
TE
NOx
-N (m
g l-1
)
0
20
40
60
80
100
120
140
PRE
CIP
ITA
TIO
N (m
m)
BSD2
CRL2PCU2
UPCU2UREA1
PRECIPITATION
0
10
20
30
40
50
60
70
5/16/2008 5/30/2008 6/13/2008 6/27/2008 7/11/2008 7/25/2008 8/8/2008 8/22/2008 9/5/2008
SAMPLING DATES
PER
CO
LA
TE
NOx -
N (m
g L-1
)
0
10
20
30
40
50
60
70
80
90
100
PRE
CIP
ITA
TIO
N (m
m
BSD2
CRL2
PCU2
UPCU2
UREA1
PRECIPITATION

71
Fig. 3-3. NOx-N leached during cycles 1-3 (May 10-Spetmeber 6), influenced by N sources
applied every 60-d at 49 kg N ha-1 and precipitation during the WS. Vertical dashed lines indicate fertilization dates. Precipitation values summed over each sampling period.
Fig. 3-4. NOx-N leached in cycle 1 (April 30 – November 7), influenced by N sources applied at
147 kg N ha-1 every 180-d and precipitation during the WS. Precipitation values summed over each sampling period.
0
10
20
30
40
50
60
70
80
90
5/1/07 5/15/07 5/29/07 6/12/07 6/26/07 7/10/07 7/24/07 8/7/07 8/21/07 9/4/07 9/18/07 10/2/07 10/16/07 10/30/07
SAMPLING DATES
PER
CO
LATE
NO
x-N
(mg
l-1
0
20
40
60
80
100
120
140
PREC
IPIT
ATI
ON
(mm
)
BSD1CRL1PCU1UPCU1UREA1PRECIPITATION
0
5
10
15
20
25
30
5/1/2007 5/15/2007 5/29/2007 6/12/2007 6/26/2007 7/10/2007 7/24/2007 8/7/2007 8/21/2007 9/4/2007 9/18/2007 10/2/2007 10/16/2007 10/30/2007SAMPLING DATES
PER
CO
LA
TE
NOx -
N (m
g L-1
)
0
20
40
60
80
100
120
140
PRE
CIP
ITA
TIN
(mm
BSD3
PCU3
CRL3
PRECIPITATION

72
Fig. 3-5. NOx-N leached during cycles 3 and 4 (May 10, 2008 – May 15, 2009), influenced by N
sources applied at 147 kg N ha-1 every 180-d and precipitation. Vertical dashed line indicates fertilization date. Precipitation values summed over each sampling period.
0
10
20
30
40
50
60
70
5/16/2008 6/13/2008 7/11/2008 8/8/2008 9/5/2008 10/3/2008 10/31/2008 11/28/2008 12/26/2008 1/23/2009 2/20/2009 3/20/2009 4/17/2009SAMPLING DATES
PER
CO
LA
TE
NOx -
N (m
g L-1
)
0
20
40
60
80
100
120
PRE
CIP
ITA
TIO
N (m
m
BSD3
PCU3
CRL3
PRECIPITATION

73
Table 3-4. Nitrogen budget of inputs vs. N accounted for by N leaching and St. Augustinegrass N uptake for cycle 1 (April 30 – June 30, 2007).
SOURCE† NITROGEN BUDGET N INPUTS INORGANIC-N RECOVERED
FERT‡ IRRIG§ NOx-N NH4-N TN¶ NUP†† NL‡‡ REC§§ -------------------------- kg ha-1 -------------------------- ----- % ----- BSD1 49 0.93 0.34 0.55 0.89 2.93 1.8 7.6 PCU1 49 0.93 0.35 0.57 0.93 1.16 1.9 4.2 CRL1 49 0.93 0.29 0.49 0.78 1.56 1.6 4.7 UPCU1 49 0.93 0.34 0.54 0.88 1.98 1.8 5.7 UREA1 49 0.93 2.75 0.49 3.25 3.41 6.5 13.3 CV (%) 23.4 17.1 21.7 40.4 26.2 CONTRAST UREA VS. OTHERS ** NS ** NS ** UREA VS. UPCU1 * NS * NS * CRL1 VS. BSD1, PCU1 NS NS NS NS NS BSD1 VS. PCU1 NS NS NS NS NS NS, *, **, ***, = P>0.05, P<0.05, P<0.01, P<0.001 † Source code: CRL1 = Control release liquid; PCU1 = Polymer-coated urea; BSD1 = Activated sewage sludge bio-solid; UPCU1 = Urea in equal N combination with polymer-coated urea; Urea1 = Urea. All sources applied at 49 kg N ha-1every 60-d. ‡ FERT: Fertilizer N applied per application cycle. § IRRIG: N supplied via irrigation, concentrations determined weekly and multiplied by volume applied. ¶ TN: Total N summed from NOx-N and NH4-N leachates. †† NUP: N-uptake as a product of dry weight yield and tissue N content. ‡‡ NL: N leached, percent of applied. §§ REC: Relative N recovery, the percent of inorganic-N recovered compared to N inputs.

74
Table 3-5. Nitrogen budget of inputs vs. N accounted for by N leaching and St. Augustinegrass N uptake for cycle 2 (July 1– August 31, 2007).
SOURCE† NITROGEN BUDGET N INPUTS INORGANIC-N RECOVERED
FERT‡ IRRIG§ NOx-N NH4-N TN¶ NUP†† NL‡‡ REC§§ ------------------------- kg ha-1 ------------------------- ----- % ----- BSD1 49 0.62 0.23 0.31 0.54 12.6 1.1 26.5 PCU1 49 0.62 0.23 0.34 0.57 5.26 1.2 12.2 CRL1 49 0.62 0.40 0.39 0.79 4.25 1.6 9.7 UPCU1 49 0.62 0.99 0.31 1.30 10.96 2.6 24.7 UREA1 49 0.62 2.31 0.60 2.91 15.43 5.9 36.9 CV (%) 16.8 22.7 13.2 12.0 13.8 CONTRAST UREA VS. OTHERS ** ** ** * NS UREA VS. UPCU1 NS ** NS NS NS CRL1 VS. BSD1, PCU1 NS NS NS NS NS BSD1 VS. PCU1 NS NS NS NS NS NS, *, **, ***, = P>0.05, P<0.05, P<0.01, P<0.001
Table 3-6. Nitrogen budget of inputs vs. N accounted for by N leaching and St. Augustinegrass N uptake for cycle 3 (September 1 – November 7, 2007).
SOURCE† NITROGEN BUDGET N INPUTS INORGANIC-N RECOVERED
FERT‡ IRRIG§ NOx-N NH4-N TN¶ NUP†† NL‡‡ REC§§ ------------------------- kg ha-1 ------------------------- ----- % ----- BSD1 49 0.43 0.25 0.24 0.49 5.50 1.0 12.1 PCU1 49 0.43 0.23 0.25 0.49 5.81 1.0 12.7 CRL1 49 0.43 0.24 0.22 0.46 1.15 0.9 3.3 UPCU1 49 0.43 0.22 0.22 0.44 7.93 0.9 16.9 UREA1 49 0.43 0.21 0.21 0.42 8.19 0.8 17.4 CV (%) 8.5 8.1 8.2 35.2 32.1 CONTRAST UREA VS. OTHERS NS NS NS NS NS UREA VS. UPCU1 NS NS NS NS NS CRL1 VS. BSD1, PCU1 NS NS NS NS NS BSD1 VS. PCU1 NS NS NS NS NS NS, *, **, ***, = P>0.05, P<0.05, P<0.01, P<0.001

75
Table 3-7. Nitrogen budget of inputs vs. N accounted for by N leaching and St. Augustinegrass N uptake for cycle 5 (January 6 – March 7, 2008).
SOURCE† NITROGEN BUDGET N INPUTS INORGANIC-N RECOVERED
FERT‡ IRRIG§ NOx-N NH4-N TN¶ NUP†† NL‡‡ REC§§ ------------------------- kg ha-1 ------------------------- ----- % ----- BSD1 49 0.70 0.16 0.07 0.24 0.53 0.5 1.54 PCU1 49 0.70 0.17 0.08 0.24 1.04 0.5 2.57 CRL1 49 0.70 0.73 0.13 0.86 0.45 1.7 2.64 UPCU1 49 0.70 0.16 0.07 0.23 1.05 0.5 2.57 UREA1 49 0.70 0.17 0.07 0.24 1.21 0.5 2.91 CV (%) 41.0 21.1 31.4 18.1 25.5 CONTRAST UREA VS. OTHERS NS NS NS * NS UREA VS. UPCU1 NS NS NS NS NS CRL1 VS. BSD1, PCU1 NS * NS NS * BSD1 VS. PCU1 NS NS NS * NS NS, *, **, ***, = P>0.05, P<0.05, P<0.01, P<0.001
Table 3-8. Nitrogen budget of inputs vs. N accounted for by N leaching and St. Augustinegrass N uptake for cycle 6 (March 8 – May 9, 2008).
SOURCE† NITROGEN BUDGET N INPUTS INORGANIC-N RECOVERED
FERT‡ IRRIG§ NOx-N NH4-N TN¶ NUP†† NL‡‡ REC§§ ------------------------- kg ha-1 ------------------------- ----- % ----- BSD1 49 0.22 0.017 0.016 0.033 1.29 0.1 2.70 PCU1 49 0.22 0.013 0.013 0.026 2.04 0.1 4.20 CRL1 49 0.22 0.019 0.022 0.041 0.25 0.1 0.60 UPCU1 49 0.22 0.017 0.015 0.031 2.52 0.1 5.18 UREA1 49 0.22 0.014 0.013 0.026 2.71 0.1 5.56 CV (%) 19.6 18.9 18.8 22.3 20.7 CONTRAST UREA VS. OTHERS NS NS NS NS NS UREA VS. UPCU1 NS NS NS NS NS CRL1 VS. BSD1, PCU1 NS ** NS NS NS BSD1 VS. PCU1 NS NS NS NS NS NS, *, **, ***, = P>0.05, P<0.05, P<0.01, P<0.001

76
Table 3-9. Nitrogen budget of inputs vs. N accounted for by N leaching and St. Augustinegrass N uptake for cycle 7 (May 9 – July 7, 2008).
SOURCE† NITROGEN BUDGET N INPUTS INORGANIC-N RECOVERED
FERT‡ IRRIG§ NOx-N NH4-N TN¶ NUP†† NL‡‡ REC§§ ------------------------- kg ha-1 ------------------------- ----- % ----- BSD1 49 0.47 0.35 0.14 0.49 9.95 1.0 21.1 PCU1 49 0.47 0.22 0.09 0.32 15.39 0.7 31.76 CRL1 49 0.47 0.22 0.10 0.31 1.03 0.6 2.71 UPCU1 49 0.47 0.23 0.99 0.33 14.14 0.7 29.25 UREA1 49 0.47 1.07 0.77 1.15 12.52 2.3 27.63 CV (%) 46.2 13.0 37.5 32.5 28.6 CONTRAST UREA VS. OTHERS NS NS NS NS NS UREA VS. UPCU1 NS NS NS NS NS CRL1 VS. BSD1, PCU1 NS NS NS ** ** BSD1 VS. PCU1 NS NS NS NS NS NS, *, **, ***, = P>0.05, P<0.05, P<0.01, P<0.001
Table 3-10. Nitrogen budget of inputs vs. N accounted for by N leaching and St. Augustinegrass N uptake for cycle 8 (July 8 – September 6, 2008).
SOURCE† NITROGEN BUDGET N INPUTS INORGANIC-N RECOVERED
FERT‡ IRRIG§ NOx-N NH4-N TN¶ NUP†† NL‡‡ REC§§ ------------------------- kg ha-1 ------------------------- ----- % ----- BSD1 49 1.24 0.22 0.37 0.58 16.7 1.2 34.3 PCU1 49 1.24 0.22 0.35 0.58 20.1 1.2 41.2 CRL1 49 1.24 0.57 0.38 0.95 4.1 2.0 10.1 UPCU1 49 1.24 0.23 0.43 0.66 18.1 1.3 37.4 UREA1 49 1.24 0.22 0.38 0.60 15.8 1.2 32.7 CV (%) 22.4 12.1 26.2 21.1 34.0 CONTRAST UREA VS. OTHERS NS NS NS NS NS UREA VS. UPCU1 NS NS NS NS NS CRL1 VS. BSD1, PCU1 NS NS * ** * BSD1 VS. PCU1 NS NS NS NS NS NS, *, **, ***, = P>0.05, P<0.05, P<0.01, P<0.001

77
Table 3-11. Nitrogen budget of inputs vs. N accounted for by N leaching and St. Augustinegrass N uptake for cycle 9 (September 6 – November 13, 2008).
SOURCE† NITROGEN BUDGET N INPUTS INORGANIC-N RECOVERED
FERT‡ IRRIG§ NOx-N NH4-N TN¶ NUP†† NL‡‡ REC§§ ------------------------- kg ha-1 ------------------------- ----- % ----- BSD1 49 0.52 0.020 0.024 0.044 10.1 0.1 20.5 PCU1 49 0.52 0.019 0.027 0.046 10.9 0.1 22.1 CRL1 49 0.52 0.022 0.025 0.047 3.2 0.1 6.6 UPCU1 49 0.52 0.023 0.024 0.047 12.0 0.1 24.3 UREA1 49 0.52 0.022 0.025 0.047 12.1 0.1 24.5 CV (%) 10.9 20.5 21.7 23.2 23.2 CONTRAST UREA VS. OTHERS NS NS NS * * UREA VS. UPCU1 NS NS NS NS NS CRL1 VS. BSD1, PCU1 NS NS NS ** ** BSD1 VS. PCU1 NS NS NS NS NS NS, *, **, ***, = P>0.05, P<0.05, P<0.01, P<0.001 Table 3-12. Nitrogen budget of inputs vs. N accounted for by N leaching and St. Augustinegrass
N uptake for cycle 10 (November 14 – January 13, 2008). SOURCE† NITROGEN BUDGET
N INPUTS INORGANIC-N RECOVERED FERT‡ IRRIG§ NOx-N NH4-N TN¶ NUP†† NL‡‡ REC§§ ------------------------- kg ha-1 ------------------------- ----- % ----- BSD1 49 0.83 0.167 0.205 0.371 0.69 0.7 2.13 PCU1 49 0.83 0.152 0.200 0.352 0.77 0.7 2.51 CRL1 49 0.83 0.172 0.311 0.483 0.38 1.0 1.48 UPCU1 49 0.83 0.172 0.254 0.426 0.92 0.9 2.70 UREA1 49 0.83 0.134 0.260 0.395 1.20 0.8 3.21 CV (%) 15.5 26.9 20.4 13.3 21.3 CONTRAST UREA VS. OTHERS NS NS NS ** * UREA VS. UPCU1 NS NS NS NS NS CRL1 VS. BSD1, PCU1 NS NS NS * * BSD1 VS. PCU1 NS NS NS NS NS NS, *, **, ***, = P>0.05, P<0.05, P<0.01, P<0.001

78
Table 3-13. Nitrogen budget of inputs vs. N accounted for by N leaching and St. Augustinegrass N uptake for cycle 11 (January 14 – March 12, 2008).
SOURCE† NITROGEN BUDGET N INPUTS INORGANIC-N RECOVERED
FERT‡ IRRIG§ NOx-N NH4-N TN¶ NUP†† NL‡‡ REC§§ ------------------------- kg ha-1 ------------------------- ----- % ----- BSD1 49 0.13 0.106 0.497 0.603 0.290 1.2 1.82 PCU1 49 0.13 0.098 0.267 0.364 0.319 0.7 1.39 CRL1 49 0.13 0.107 0.529 0.637 0.192 1.3 1.68 UPCU1 49 0.13 0.113 0.451 0.564 0.355 1.1 1.87 UREA1 49 0.13 0.081 0.301 0.382 0.367 0.8 1.53 CV (%) 22.9 20.6 17.8 11.7 12.2 CONTRAST UREA VS. OTHERS NS NS NS NS NS UREA VS. UPCU1 NS NS NS NS NS CRL1 VS. BSD1, PCU1 NS NS NS * NS BSD1 VS. PCU1 NS NS NS NS NS NS, *, **, ***, = P>0.05, P<0.05, P<0.01, P<0.001 Table 3-14. Nitrogen budget of inputs vs. N accounted for by N leaching and St. Augustinegrass
N uptake for cycle 12 (March 13 – May 15, 2008). SOURCE† NITROGEN BUDGET
N INPUTS INORGANIC-N RECOVERED FERT‡ IRRIG§ NOx-N NH4-N TN¶ NUP†† NL‡‡ REC§§ ------------------------- kg ha-1 ------------------------- ----- % ----- BSD1 49 0.21 0.111 0.137 0.249 2.60 0.5 5.8 PCU1 49 0.21 0.109 0.124 0.231 3.16 0.5 6.9 CRL1 49 0.21 0.167 0.365 0.532 0.65 1.1 2.4 UPCU1 49 0.21 0.135 0.141 0.277 2.98 0.6 6.6 UREA1 49 0.21 0.671 0.126 0.797 2.97 1.6 7.7 CV (%) 37.8 9.3 23.6 16.8 15.2 CONTRAST UREA VS. OTHERS ** * * NS NS UREA VS. UPCU1 * NS * NS NS CRL1 VS. BSD1, PCU1 NS *** * *** ** BSD1 VS. PCU1 NS NS NS NS NS NS, *, **, ***, = P>0.05, P<0.05, P<0.01, P<0.001

79
Table 3-15. Nitrogen budget of inputs vs. N accounted for by N leaching and St. Augustinegrass N uptake for cycle 1 (April 30 – August 31, 2007).
SOURCE† NITROGEN BUDGET N INPUTS INORGANIC-N RECOVERED
FERT‡ IRRIG§ NOx-N NH4-N TN¶ NUP†† NL‡‡ REC§§ ------------------------- kg ha-1 ------------------------- ----- % ----- BSD2 98 1.55 0.60 0.94 1.54 10.0 1.5 11.6 PCU2 98 1.55 0.56 1.02 1.59 17.9 1.6 19.5 CRL2 98 1.55 1.11 0.95 2.05 7.5 2.1 9.6 UPCU2 98 1.55 11.10 0.87 11.97 16.1 12.0 28.2 UREA1 98 1.55 12.76 1.09 13.84 18.9 13.9 32.8 CV (%) 20.9 21.5 16.1 16.2 9.1 CONTRAST UREA VS. OTHERS ** NS ** NS *** UREA VS. UPCU2 ** NS ** NS *** CRL2 VS. BSD2, PCU2 NS NS NS * * BSD2 VS. PCU2 NS NS NS NS * NS, *, **, ***, = P>0.05, P<0.05, P<0.01, P<0.001 † Source code: CRL2 = Control release liquid; PCU2 = Polymer-coated urea; BSD2 = Activated sewage sludge bio-solid; UPCU2 = Urea in equal N combination with polymer-coated urea; Urea1 = Urea. All sources applied at 98 kg N ha-1every 120-d, expect Urea1 applied at 49 kg N ha-1every 60-d ‡ FERT: Fertilizer N applied per application cycle. § IRRIG: N supplied via irrigation, concentrations determined weekly and multiplied by volume applied. ¶ TN: Total N summed from NOx-N and NH4-N leachates. †† NUP: N-uptake as a product of dry weight yield and tissue N content. ‡‡ NL: N leached, percent of applied. §§ REC: Relative N recovery, the percent of inorganic-N recovered compared to N inputs.

80
Table 3-16. Nitrogen budget of inputs vs. N accounted for by N leaching and St. Augustinegrass N uptake for cycle 3 (January 6 – March 7, 2008).
SOURCE† NITROGEN BUDGET N INPUTS INORGANIC-N RECOVERED
FERT‡ IRRIG§ NOx-N NH4-N TN¶ NUP†† NL‡‡ REC§§ ------------------------- kg ha-1 ------------------------- ----- % ----- BSD2 98 0.92 0.175 0.085 0.260 1.350 0.3 1.63 PCU2 98 0.92 0.176 0.086 0.449 2.983 0.5 4.19 CRL2 98 0.92 0.890 0.273 0.976 0.573 1.0 0.84 UPCU2 98 0.92 1.238 0.087 1.325 3.540 1.3 4.92 UREA1 98 0.92 0.183 0.088 0.271 3.910 0.3 4.22 CV (%) 19.2 19.9 28.5 24.2 CONTRAST UREA VS. OTHERS NS NS NS NS NS UREA VS. UPCU2 * NS NS * * CRL2 VS. BSD2, PCU2
* ** NS * *
BSD2 VS. PCU2 NS NS NS NS NS NS, *, **, ***, = P>0.05, P<0.05, P<0.01, P<0.001
Table 3-17. Nitrogen budget of inputs vs. N accounted for by N leaching and St. Augustinegrass N uptake for cycle 4 (May 16 – September 6, 2008).
SOURCE† NITROGEN BUDGET N INPUTS INORGANIC-N RECOVERED
FERT‡ IRRIG§ NOx-N NH4-N TN¶ NUP†† NL‡‡ REC§§ ------------------------- kg ha-1 ------------------------- ----- % ----- BSD2 98 1.7 0.424 0.413 0.837 19.1 0.8 20.0 PCU2 98 1.7 0.402 0.446 0.848 50.7 0.9 51.7 CRL2 98 1.7 1.018 0.642 1.661 3.5 1.7 5.2 UPCU2 98 1.7 3.185 0.370 3.555 27.5 3.6 31.2 UREA1 98 1.7 1.298 0.457 1.756 28.4 1.8 30.2 CV (%) 31.4 9.9 22.8 16.4 11.7 CONTRAST UREA VS. OTHERS NS NS NS NS NS UREA VS. UPCU2 NS NS NS NS * CRL2 VS. BSD2, PCU2 NS * NS *** *** BSD2 VS. PCU2 NS NS NS ** ** NS, *, **, ***, = P>0.05, P<0.05, P<0.01, P<0.001

81
Table 3-18. Nitrogen budget of inputs vs. N accounted for by N leaching and St. Augustinegrass N uptake for cycle 5 (September 7 – January 13, 2008).
SOURCE† NITROGEN BUDGET N INPUTS INORGANIC-N RECOVERED
FERT‡ IRRIG§ NOx-N NH4-N TN¶ NUP†† NL‡‡ REC§§ ------------------------- kg ha-1 ------------------------- ----- % ----- BSD2 98 1.35 0.164 0.206 0.370 11.30 0.4 11.67 PCU2 98 1.35 0.151 0.201 0.349 10.64 0.4 10.96 CRL2 98 1.35 0.197 0.254 0.450 3.48 0.5 3.92 UPCU2 98 1.35 0.134 0.174 0.309 12.75 0.3 13.06 UREA1 98 1.35 0.157 0.286 0.442 13.30 0.4 13.74 CV (%) 21.1 24.9 22.8 14.9 14.1 CONTRAST UREA VS. OTHERS NS NS NS ** ** UREA VS. UPCU2 NS NS NS ** ** CRL2 VS. BSD2, PCU2 NS NS NS *** *** BSD2 VS. PCU2 NS NS NS NS NS NS, *, **, ***, = P>0.05, P<0.05, P<0.01, P<0.001
Table 3-19. Nitrogen budget of inputs vs. N accounted for by N leaching and St. Augustinegrass N uptake for cycle 6 (January 14 – May 15, 2008).
SOURCE† NITROGEN BUDGET N INPUTS INORGANIC-N RECOVERED
FERT‡ IRRIG§ NOx-N NH4-N TN¶ NUP†† NL‡‡ REC§§ ------------------------- kg ha-1 ------------------------- ----- % ----- BSD2 98 0.33 0.243 0.689 0.936 1.45 1.0 2.42 PCU2 98 0.33 0.191 0.873 0.587 3.26 0.6 3.91 CRL2 98 0.33 0.338 0.391 1.210 0.54 1.2 1.77 UPCU2 98 0.33 0.260 0.718 0.987 1.45 1.0 2.48 UREA1 98 0.33 0.753 0.426 1.174 3.35 1.2 4.59 CV (%) 29.9 15.2 19.0 21.8 20.6 CONTRAST UREA VS. OTHERS NS NS NS ** *** UREA VS. UPCU2 NS NS NS NS NS CRL2 VS. BSD2, PCU2 NS * NS ** * BSD2 VS. PCU2 NS NS NS ** * NS, *, **, ***, = P>0.05, P<0.05, P<0.01, P<0.001

82
Table 3-20. Nitrogen budget of inputs vs. N accounted for by N leaching and St. Augustinegrass N uptake for cycle 1 (April 30 – November 7, 2008).
SOURCE† NITROGEN BUDGET N INPUTS INORGANIC-N RECOVERED
FERT‡ IRRIG§ NOx-N NH4-N TN¶ NUP†† NL‡‡ REC§§ ------------------------- kg ha-1 ------------------------- ----- % ----- BSD3 147 1.98 0.79 1.10 1.89 20.87 1.3 15.27 PCU3 147 1.98 0.78 1.33 2.11 42.49 1.4 29.94 CRL3 147 1.98 1.98 1.32 3.30 11.63 2.2 10.02 UREA1 147 1.98 12.97 1.30 14.27 27.10 9.6 27.73 CV (%) 23.7 10.3 18.1 13.1 6.4 CONTRAST UREA VS. OTHERS ** NS * NS ** CRL3 VS. BSD3, PCU3
NS NS NS ** ***
BSD3 VS. PCU3 NS NS NS ** *** NS, *, **, ***, = P>0.05, P<0.05, P<0.01, P<0.001 † Source code: CRL3 = Control release liquid; PCU3 = Polymer-coated urea; BSD3 = Activated sewage sludge bio-solid; Urea1 = Urea. All sources applied at 147 kg N ha-1every 180-d, expect Urea1 applied at 49 kg N ha-1every 60-d ‡ FERT: Fertilizer N applied per application cycle. § IRRIG: N supplied via irrigation, concentrations determined weekly and multiplied by volume applied. ¶ TN: Total N summed from NOx-N and NH4-N leachates. †† NUP: N-uptake as a product of dry weight yield and tissue N content. ‡‡ NL: N leached. §§ REC: Relative N recovery, the percent of inorganic-N recovered compared to N inputs.

83
Table 3-21. Nitrogen budget of inputs vs. N accounted for by N leaching and St. Augustinegrass N uptake for cycle 3 (May 10 – November 13, 2008).
SOURCE† NITROGEN BUDGET N INPUTS INORGANIC-N RECOVERED
FERT‡ IRRIG§ NOx-N NH4-N TN¶ NUP†† NL‡‡ REC§§ ------------------------- kg ha-1 ------------------------- ----- % ----- BSD3 147 2.23 0.403 0.363 0.765 45.62 0.5 31.09 PCU3 147 2.23 0.471 0.499 0.969 83.22 0.6 56.42 CRL3 147 2.23 3.173 0.834 4.006 4.92 2.7 5.98 UREA1 147 2.23 1.32 0.482 1.802 40.47 1.2 28.33 CV (%) 31.9 8.53 21.5 12.7 11.8 CONTRAST UREA VS. OTHERS NS NS NS NS NS CRL3 VS. BSD3, PCU3 NS *** NS *** *** BSD3 VS. PCU3 NS NS NS ** ** NS, *, **, ***, = P>0.05, P<0.05, P<0.01, P<0.001
Table 3-22. Nitrogen budget of inputs vs. N accounted for by N leaching and St. Augustinegrass N uptake for cycle 4 (November 13 – May 15, 2008).
SOURCE† NITROGEN BUDGET N INPUTS INORGANIC-N RECOVERED
FERT‡ IRRIG§ NOx-N NH4-N TN¶ NUP†† NL‡‡ REC§§ ------------------------- kg ha-1 ------------------------- ----- % ----- BSD3 147 1.17 0.584 0.943 1.532 3.093 1.0 3.12 PCU3 147 1.17 0.363 0.655 1.016 4.353 0.7 3.62 CRL3 147 1.17 2.677 1.549 4.227 1.127 2.9 3.61 UREA1 147 1.17 0.888 0.687 1.569 4.543 1.1 4.13 CV (%) 14.5 11.9 7.7 10.3 8.5 CONTRAST UREA VS. OTHERS NS NS NS ** NS CRL3 VS. BSD3, PCU3 ** ** *** *** NS BSD3 VS. PCU3 NS NS NS NS NS NS, *, **, ***, = P>0.05, P<0.05, P<0.01, P<0.001

84
APPENDIX A CLIMATOLOGY DATA
Table A-1. Climatology data (May-April, 2007 and 2008) for Ft. Lauderdale (FLREC), FL, with long term norms. SOIL TOTAL AIR TEMPERATURE TOTAL TEMPERATURE RELATIVE SOLAR
2007 2008 RAINFALL (10 cm) HUMIDITY RADIATION MONTH MAX. MIN. AVG. MAX. MIN. AVG. NORM.† 2007 2008 2007 2008 2007 2008 2007 2008
-------------------------- OC -------------------------- ---- mm ---- ----- OC ----- ---- % ---- --- W m-2 ---
MAY 33.5 15.0 25.0 35.1 16.5 26.6 25.8 109.2 100.6 26.0 27.7 70 71 242.7 276.8
JUNE 34.5 19.8 26.3 33.1 21.4 27.5 27.3 479.3 60.2 27.3 28.4 77 80 233.0 227.4
JULY 34.1 15.3 26.7 33.6 21.6 27.3 28.1 264.4 262.6 28.3 28.0 79 82 222.0 215.2
AUGUST 35.0 22.7 28.7 34.7 22.8 28.1 27.9 43.4 239.3 29.2 28.3 76 83 238.2 201.6
SEPTEMBER 34.9 22.1 27.6 32.4 21.9 27.8 27.2 287.0 160.3 28.3 28.0 80 82 193.0 188.9
OCTOBER 32.7 22.6 27.1 31.7 11.5 25.1 25.5 265.4 204.5 26.5 25.5 82 78 150.1 166.4
NOVEMBER 29.3 12.8 22.8 31.5 9.2 20.8 22.8 59.7 27.2 23.4 22.6 75 76 158.7 165.1
DECEMBER 29.5 10.3 22.8 28.6 9.7 20.8 20.1 17.3 10.7 23.0 21.2 81 80 145.6 129.5
JANUARY 29.2 3.3 20.2 29.3 4.6 18.6 19.6 41.7 2.8 21.1 20.7 77 76 141.4 153.7
FEBRUARY 31.9 8.7 22.3 30.3 2.2 19.1 19.2 126.5 6.9 22.4 21.2 77 70 169.4 187.4
MARCH 32.3 10.4 22.6 30.2 6.4 21.3 22.1 140.2 122.7 22.7 23.0 74 68 193.2 207.4
APRIL 32.2 12.7 23.6 32.0 10.6 23.9 23.6 84.8 28.4 25.1 26.0 71 66 259.5 252.3
MEAN 32.4 14.6 24.6 31.9 13.2 23.9 24.1 159.9 102.2 25.3 25.1 77 76 195.6 197.6
NORM † = Average from 2003 to 2007.

85
APPENDIX B PERCOLATE VOLUMES
0.0
10.0
20.0
30.0
40.0
50.0
60.0
70.0
80.0
90.0
5/1/07 7/1/07 9/1/07 11/1/07 1/1/08 3/1/08 5/1/08 7/1/08 9/1/08 11/1/08 1/1/09 3/1/09 5/1/09
SAMPLING DATES
PER
CO
LA
TE
VO
LU
ME
(l m
-2)
Fig. B-1. Percolate volumes averaged across each treatment collected over the 24-mo study period, indicating generally lower percolate during the DS (November 1 – May 1), although sporadic significant precipitation induced percolation was evident.

86
LIST OF REFERENCES
Ballaré, C.L., R.A. Sanchez, L.A. Scopel, J.J. Casal, and C.M. Ghersa. 1987. Early detection of neighbouring plants by phytochrome perception of spectral changes in reflected sunlight. Plant Cell and Environ. 10:551-557.
Barton, L., G.G.Y. Wan, and T.D. Colmer. 2006. Turfgrass (cynodon dactylon L.) sod production on sandy soils: II. Effects of irrigation and fertilizer regimes on N leaching. Plant and Soil. 284:147-164.
Barbarick, K.A., J.A. Ippolito, and D.G. Westfall. 1997. Sewage biosolids cumulative effect on
extractable-soil and grain elemental concentrations. J. Environ. Qual. 26:1696-1702. Barbarick, K.A. and J.A. Ippolito. 2007. Nutrient assessment of a dryland wheat agroecosystem
after 12 years of biosolid application. Agron. J. 99:715-722. Bowman, D.C., D.A. Dewitt, M.C. Engelke, and T.W. Rufty, Jr. 1998. Root architecture affects
nitrate leaching from bentgrass turf. Crop Sci. 38:1633-1639.
Bowman, D.C. Bowman, C.T. Cherney, and T.W. Rufty, Jr. 2002. Fate and Transport of nitrogen applied to six warm-season turfgrasses. Crop Sci. 42:833-841.
Bouwmeester, R.J.B., P.L.G. Vlek, and J.M. Stumpe. 1985. Effect of environmental factors on ammonia volatilization from a urea-fertilized soil. Soil Sci. Soc. Am. J. 49:376-381.
Box, G.E.P. and D.R. Cox. 1964. An analysis of Transformations. J. Royal Stat. Soc. Series B (Methodological). 26(No.2):211-252.
Brown, K.W., R.L. Duble, and J.C. Thomas. 1977. Influence of management and season on fate of N applied on golf greens. Agron. J. 69:667-671.
Brown, K.W., and R.L. Duble. 1975. Physical characteristics of soil mixtures used in golf green construction. Agon. J. 67:647-652.
Carrow, R.N, B.J. Johnson, and R.E. Burns. 1987. Thatch and quality of tifway bermudagrass turf in relation to fertility and cultivation. Agron. J. 79:524-530.
Carrow, R.N. and B. J. Johnson. 1989. Frequency of Fertilizer Applications and Centipedegrass Performance. Agron. J. 1988 80: 925-929.
Carrow, R.N. 1997. Turfgrass response to slow-release nitrogen fertilizers. Agron. J. 89:491-496.
Casal, J.J., R.A. Sanchez, and V.A. Deregibus. 1986. Variation in tiller dynamics and morphology in lolium multiflorum Lam. Vegetative and reproductive plants as affected by differences in red/far-red irradiance. Environ. Exp. Botany. 26:365-371.

87
Casal, J.J., R.A. Sanchez, and D. Gibson. 1990. The significance of changes in the red/far-red ratio, associated with either neighbouring plants at twilight, for tiller in Lolium multiflorum Lam. New Phytol. 116:565-572.
Chinualt, S.L. and G.A. O’Connor. 2008. Phosphorous release from bio-solids-amended sandy spodosol. J. Environ. Qual. 37:937-943.
Christianson, C.B. 1988. Factors affecting N release of urea from reactive layer coated urea. Fert. Res. 16:273-284.
Cisar, J.L., G.H. Snyder, J.L. Haydu, and K.E. Williams. 2001. Turf response to coated-urea fertilizer. II. Nitrogen content in clippings, nitrogen uptake, and nitrogen retention from prills. Int. Turfgrass Res. J. 9:368-374.
Clapp, J. G. Jr. 2001. Urea-triazone N characteristics and uses. In: Optimizing Nitrogen Management in Food and Energy Production and Environmental Protection: Proceedings of the 2nd International Nitrogen Conference on Science and Policy. TheScientificWorld (2001) 1:103-107.
Clapp, J. G. Jr. and T. M. Parham Jr. 1991. Properties and uses of liquid urea-triazone-based nitrogen fertilizers. Fert. Res. 28:229-232.
Clewer, A.G. and D.H. Scarisbrick. 2001. Practical Statistics and Experimental Design for Plant and Crop Science. J. Wiley & Sons Inc. N.Y.
Conrad, J.P. 1942. Enzymatic vs. microbial concepts of urea hydrolysis in soils. Agron. J. 34:1102-1113.
Council of the City of Sannibel. 2006. Agenda item #4[b] http://sanibelh2omatters.com/fertilizer/PDF/News/Fertilizer_connection_to_red_tide.pdf.
Council of the City of Sannibel. 2007. Ordinance No. 07-003. http://www.sanibelh2omatters.com/fertilizer/PDF/Fertilizer_Ordinance.pdf.
County of Charlotte. 2008. Ordinance No. 2008-028. http://charlotte.ifas.ufl.edu/horticulture/fertilizer/brochure.pdf.
County of Lee. 2008. Ordinance No. 08-08. http://lee.ifas.ufl.edu/Hort/BrownsPlantFiles/FertilizerOrdinanceFinal.pdf.
County of Sarasota. 2007. Fertilizer and landscape management code, Ordinance No. 2007-63. http://www.sarasota.wateratlas.usf.edu/upload/documents/Sarasota%20County%20Fertilizer%20brochure.pdf.
County of St. Jonhs. 2000. Ordinance No. 2000-60. http://www.clk.co.st-johns.fl.us/minrec/OrdinanceBooks/2000/ORD2000-60.pdf.

88
County of St. Jonhs. 2000. Ordinance No. 2003-52. http://www.clk.co.st-johns.fl.us/minrec/ OrdinanceBooks/2003/ORD2003-48.pdf.
Coyne, M.S. 2008. Biological denitrification. p. 201-253. In J.S. Schepers and W.R. Raun (ed.) Nitrogen in agricultural systems. Agron. Monogr. 49. ASA, CSSA, and SSSA, Madison, WI.
Department of Agricultural and Consumer services, No. 4640400, Rule 5E-1.003. 2007. http://www.dep.state.fl.us/water/nonpoint/.
DiPaola, J.M., J.B. Beard, and H. Brawand. 1982. Key events in the seasonal root growth of bermudagrass and st. augustinegrass. HortScience. 17(5):829-831.
Easton, Z.M. and Petrovic, A.M. 2004. Fertilizer source effect on ground and surface water quality in drainage from turfgrass. J. Environ. Qual. 33:645-655.
Engelsjord, M.E. and B.R. Singh. 1997. Effects of slow-release fertilizers on growth and on uptake and leaching of nutrients in Kentucky bluegrass turfs established on sand-based root zones. Can. J. Pant Sci. 77:433-444.
Ericksen, A.B., and M. Kjeldby. 1987. A comparative study of urea hydrolysis rate and ammonia volatilization from urea and urea calcium nitrate. Fert. Res. 11:9-24.
Erickson, J.E., J.L. Cisar, J.C. Volin, G.H. Snyder. 2001. Comparing nitrogen runoff and leaching between newly established St. Augustinegrass turf and alternative residential landscape. Crop Sci. 41:1889-1895.
Erickson, J.E., J.L. Cisar, G.H. Snyder, D.M. Park, and K.E. Williams. 2005. Does a mixed-species landscape reduce inorganic-nitrogen leaching compared to a conventional St. Augustinegrass lawn. Crop Sci. 48:1586-1594.
Fenn, L.B., and D.E. Kissel. 1974. Ammonia volitization from surface applications of ammonia compounds on calcareous soil: Effects of temperature and rate of ammonia nitrogen application. Soil Sci. Soc. Am. Proc. 38:606-610.
Flipse, J.R., Jr., B.G. Katz, J.B. Lindner, and R. Markel. 1984. Sources of nitrate in groundwater in a sewer housing development, central Long Island, New York. Groundwater 32:418-426.
Florida Department of Environmental Protection. 2008. Florida green industries best management practices for protection of water resources in Florida. Florida Dep. Environmental Protection. http://www.dep.state.fl.us/water/nonpoint/pubs.htm.
Francis, D.D., M.F. Vigil, and A.R. Mosier. 2008. Gaseous Losses of Nitrogen other than through Denitrification. p. 255-279. In J.S. Schepers and W.R. Raun (ed.) Nitrogen in agricultural systems. Agron. Monogr. 49, ASA, CSSA, and SSSA, Madison, WI.

89
Frank, A.B. and L. Hofman. 1989. Light quality and stem numbers in cool-season forage grasses. Crop Sci. 34:468-473.
Fraser, P., C. Chilvers, V. Beral, and M. J. Hill. 1980. Nitrate and human cancer: a review of the evidence. Intern. J. Epidemiology. 9:3-11
Fry, J.D., D.O. Fuller, and F.P. Maier. 1993. Nitrogen release from coated urea applied to turf. Int. Turfgrass Res. J. 7:533-539.
Galloway, J.N. and E.B. Cowling. 2002. Reactive nitrogen and the world: 200 years of change. Ambio. 31:64-71.
Galloway, J.N., F.J. Dentener , D.G. Capone, E.W. Boyer, R.W. Howarth , S.P. Seitzinger , G.P. Asner, C. Cleveland, P. Green , E. Holland, D.M. Karl, A.F. Michaels, J.H. Porters, A. Townsend and C. Vorösmarty. 2004. Nitrogen cycles: past and future. Biogeochemistry. 70:153-226.
Georgia Pacific. 2007. Plant Nutrition, Nitamin® Brand Nitrogen Fertilizers. http://www.gp.com/PlantNutrition/product.
Geron, C.A., T.K. Danneberger, S.J. Traina, T.J. Logan, and J.R. Street. 1993. The effects of establishment methods and fertilization practices on nitrate leaching from turfgrass. J. Environ. Qual. 19:663-668.
Goertz, H.M. 1991. Commercial granular controlled release fertilizers for the speciality markets. p.51-67. In: R.M. Scheib (ed.) Proc. of Controlled Release Fertilizer Workshop. Tennessee Valley Authority. Muscle Shoals, AL.
Groffmann, P.M., E.A. Axelrod, J.L. Lemunyon, and W.M. Sullivan. 1991. Dentrification in grass and forest vegetation filter strips. J. Environ. Qual. 20:671-674.
Gross, C.M., J.S. Angle, R.L. Hill, and M.S. Welterlen. 1991. Run-off and sediment losses from tall fescue under simulated rainfall. J. Environ. Qual. 20:604-607.
Gross, C.M., J.S. Angle, and M.S. Welterlen. 1990. Nutrient and sediment losses from turfgrass. J. Environ. Qual. 19:663-668.
Guillard, K. and K.L. Kopp. 2004. Nitrogen fertilizer form and associated nitrate leaching from cool-season lawn turf. J. Environ. Qual. 33:1822-1827.
Guillard, K., and S.S. Mangiafico. 2006. Fall fertilization timing effects on nitrate leaching and turfgrass color and growth. J. Environ. Qual. 35:163-171.
Guertal, E.A., E.C. Knight, and C.W. Wood. 2007. Mowing and nitrogen source effects on ammonia volatilization from turfgrass. Crop Sci. 47:1628-1634.
Haydu, J.J. and J.L. Cisar. 1990. Structural changes in the Florida sod industry. J. Farm Magers. 54:55-61.

90
Harper, J.J., and Boatman, B. 1926. Studies on nitrification of ammonium sulfate in soils. Agon. J. 18:876-887.
He, Z. L., A.K. Alva, P. Yan, Y.C. Li, D.V. Calvert, P.J. Stoffella, D.J. Banks. 2000. Nitrogen mineralization and transformation from composts and biosolids during field incubation in a sandy soil. Soil Sci. 165(2):161-169.
Hummel, N.W.Jr., and D.V. Waddington. 1984. Sulfur-coated urea for turfgrass fertilization. Soil Sci. Soc. Am. J. 48:191-195.
Hummel, N.W. Jr. 1989. Resin-coated urea evaluations for turfgrass fertilization. Agron. J. 81:290-294.
Hummel, N.W.Jr. and D.V. Waddington 1981. Evaluation of slow-release nitrogen sources on baron Kentucky bluegrass. Soil Sci. Soc. Am. J. 45:966-970.
Hurt, G.W., C.V. Noble, and R.W. Drew. 1995. Soil survey of Monroe county, keys area, Florida. U.S.D.A. National Cooperative Soil Survey, IFAS University of Florida. http://soildatamart.nrcs.usda.gov/manuscripts/FL687/0/Monroe-Keys.pdf
Johnson, B.J., R.N. Carrow, and R.E. Burns. 1987. Bermudagrass turf response to mowing practices and fertilizer. Agron. J. 79:677-680.
Kennedy, V.H., A.P. Rowland, and J. Parrington. 1994. Quality assurance for soil nutrient analysis. Commun. Soil Sci. Plant Anal. 25:1605-1627.
Keeney, 1986. Sources of nitrate to ground water. Crit. Rev. Environ. Control. 16:257-304.
King, F.W. King, and J.C. Balogh. 2008. Nutrient and pesticide transport in surface run-off from perennial grasses in the urban landscape. In J.B. Beard and M.P. Kenna (ed.) Water quality and quantity issues from turfgrasses in urban landscapes. Council Agric. Sci. Tech. (CAST), Ames, IA.
Kissel, D.E., M.L. Cabrera, and S. Paramasivam. 2008. Ammonium, ammonia, and urea reactions in soils. In J.S. Schepers and W.R. Raun (ed.) Nitrogen in agricultural systems. Agron. Monogr. 49. ASA, CSSA, and SSSA, Madison, WI.
Knight, T.M, D. Forman, R. Pirastu, P. Comba, R. Iannarilli, P.L. Cocco, G. Angotzi, E. Ninu, and S. Schierano. 1990. Nitrate and nitrite exposure in Italian populations with different gastric cancer rates. Int J Epideimol. 19:510-515.
Krans, J.V., and Morris, K. 2007. Determining a profile of protocols and standards used in the visual field assessment of turfgrassses: A survey of National Turfgrass Evaluation Program – sponsored university scientists. Appl. Turfgrass Sci. dol:10.1094/ATS-2007-1130-01-TT.
Landschoot, P.J., and D.V. Waddington. 1987. Response of turfgrass to various nitrogen sources. Soil Sci. Soc. Am. J. 51:225-230.

91
Lee, D.J., and C.H. Peacock. 2005. Evaluation of the effect of natural organic sources on nitrogen release and turfgrass quality. Int. Turfgrass Res. J. 10:956-961.
van Leeuwen, J.A., D. Walter-Toews, T. Abernathy, B. Smit, and M. Shoukri. 1999. Associations between stomach cancer incidence and drinking water contamination with atrazine and nitrate in Ontario (Canada) agroecosystems, 1987-1991. Int J Epideimol. 28:836-840.
Lensi, R. and A. Chalamet. 1982. Denitrification in water-logged soils: In situ temperature-dependent variations. Soil Biol. Biochem. 14:51-55.
Linde, D.T., T.L. Watschke, A.R. Jarett. 1998. Surface run-off comparison between creeping bentgrass and perennial ryegrass turf. J. Turfgrass Management. 2:11-33.
Linde, D.T., T.L. Watschke, A.R. Jarett, and J.A. Borger. 1995. Surface run-off assessment from creeping bentgrass and perennial ryegrass turf. Agron. J. 87:176-182.
Littell, R.C., W.W. Stroup, R. J. Freund. 2002. SAS for Linear Models, 4th Ed. Cary, NC: SAS Institute Inc.
Mangiafico, S.S., and Guillard, K. Cool-season turfgrass color and growth calibrated to leaf nitrogen. Crop Sci. 2007 47: 1217-1224.
Mansouri, A. Review: methaemoglobinaemia. Am J Med Sci. 289:200-209.
Marschner, H. 2002. Mineral nutrition of higher plants. 2nd Ed. P. 514-515. Academic Press, London, UK.
McCollum, S.H., O.E. Cruz, Sr, L.T. Stem, W.H. Witterstruck, R.D. Ford, and F.C. Watts. 1978. Soil survey of Palm Beach County area, Florida. U.S.D.A. National Cooperative Soil Survey, IFAS University of Florida. http://soildatamart.nrcs.usda.gov/manuscripts/FL611/ 0/Palm_Beach.pdf.
McCollum, S.H., and O.E. Cruz, Sr. 1981. Soil survey of Martin County area, Florida. U.S.D.A. National Cooperative Soil Survey, IFAS University of Florida. http://soildatamart.nrcs. usda.gov/manuscripts/FL085/0/martin.pdf
Methall, B.J., R.J. Hull, and C.R. Skogley. 1983. Cultivar variation in Kentucky bluegrass: P and K nutritional factors. Agron. J. 75:767-772.
Miltner, E.D., B.E. Branham, A.E. Paul, and P.E. Rieke. 1996. Leaching and Mass balance of 15N-labelled urea applied to a Kentucky bluegrass turf. Crop Sci. 36:1427-1433.
Moberg, E.L., D.V. Waddington, and J.M. Duich. 1970. Evaluation of slow-release nitrogen sources on Merion Kentucky bluegrass. Soil Sci. Soc. Am. Proc. 34:335-339.

92
Moore, K.J., K.J. Boote, and M.A. Sanderson. 2004. Physiology and development morphology. p. 179-216. In L.E. Moser et al., (ed.) Warm-season (C4) grasses. Agron. Monogr. 45, ASA, CSSA, and SSSA, Madison, WI.
Morris, K. 2001. NTEP Newsline: A publication of the National Turfgrass Evaluation Program. January – March. Vol. 4, Issue 1. http://www.ntep.org/newsletter/News03_01.pdf.
Morton, T.G., A.J. Gold, and W.M. Sullivan. 1988. Influence of overwatering and fertilization on nitrogen losses from home lawns. J. Environ. Qual. 17:124-130.
Mosdell, D.K., and R.E. Schmidt. 1985. Temperature and irrigation influences on nitrate losses of Poa pratensis L. turf. p. 487-494. In F.L. Lemaire (ed.) Proc. 5th Int. Turfgrass Research Conf., Avignon, France. 1-5 July. INRA Paris, France.
Mueller, B.A., Nielson S.S., Preston-Martin S., Holly E.A., Cordier S., Filoppini G., Peris-Bonet R. and Choi N.W. 2004 Household water source and the risk of childhood brain tumors: results of the SEARCH international brain tumor study. Int J Epideimol. 33:1216-1218.
Munshaw, C.G., E.H. Ervin, C. Shang, S.D. Askew, X. Zhang, and R.W. Lemus. 2006. Influence of late-season iron, nitrogen, seaweed extract on fall color retention and cold tolerance of four Bermudagrass Cultivars. Crop Sci. 46:273-283.
Nelson, K.E., A.J. Turgeon, and J.R. Street. 1980. Thatch influence on mobility and transformation of nitrogen carriers applied to turf. Agron. J. 72: 487-492.
Nelson, D.W. 1982. Gaseous losses of nitrogen other than through dentrification. p. 327-364. In F.J. Stevenson (ed.) Nitrogen in agriculture soils. Agron. Monogr. 22, ASA, CSSA, and SSSA, Madison, WI.
Oertli, J.J. 1980. Controlled-release fertilizers. Fert. Res. 1:103-123.
Peacock, C.H., and J.M DiPaola. 1992. Bermudagrass response to reactive layer coated fertilizers. Agron. J. 84:946-950.
Peierls, B., N. Caraco, M. Pace, and J.J. Cole. 1991. Human influence on river nitrogen. Nature 350:386-387.
Pendleton, R.F., H.D. Dollar, L. Law, Jr., S.H. McCollum, and D.J. Beiz. 1984. Soil survey of Broward County, Florida Easter Part. U.S.D.A. National Cooperative Soil Survey, IFAS University of Florida. http://soildatamart.nrcs.usda.gov/manuscripts/FL606/0/broward.pdf.
Petrovic, A.M., N.W. Hummel, and M.J. Carroll. 1986. Nitrogen source effects on nitrate leaching from late fall nitrogen applied to turfgrass. p. 137. In Agronomy abstracts. ASA, Madison, WI.
Petrovic, A.M. 1990. The fate of nitrogenous fertilizers applied to turfgrass. J. Environ. Qual. 19:1-4.
93
Readon, E.A. 1966. New reactants for the colormetric determination of ammonia. Clin. Chim. Acta. 14:403-405.
Rieke, P.E., and B.G. Ellis. 1974. Effects of nitrogen fertilization on nitrate movement under turfgrasses. In E.C. Roberts (ed.) Proc. 2nd Int. Turfgrass Res. Conf. ASA, Madison, WI. 19-21 June 1972. Blacksburg, V.A.
Rosenthal, W.D., and B.W. Hipp. 1993. Field and model estimates of pesticide run-off from turfgrass. p. 208-213. In K.D. Racke and A.R. Leslie (ed.) Pesticides in urban environments: Fate and significance . Am. Chem. Soc., Washington, DC.
Sabey, B.R., W.V. Bartholomew, R. Shaw, and J. Pesek. 1956. Influence of temperature on nitrification in soils. Soil Sci. Soc. Am. J. 20:357-360
Sarasota County, Florida, Ordinance 2007-062 (August 27, 2007).
Sarigumba, T.I., and J.G.A. Fiskell. 1976. Urea transformation in two acid sandy soils. Soil Crop Sci. Florida Proc. 35:150-154.
Sartain, J.B. 1985. Effect of acidity and N source on the growth and thatch accumulation of Tifgreen Bermudagrass and on soil nutrient retention. Agron. J. 77:33-36.
Sartain, J. B. 1992. Effects of Coron and N-Sure liquid slow release N sources on growth and quality of cool and warm-season turfgrass. Turfgrass Research in Florida: A Technical Report. IFAS University of Florida. p. 137-146.
Sartain, J. B. 1999. St. Augustinegrass response to natural organic fertilizers. Turfgrass Research in Florida: A Technical Report. IFAS University of Florida. p. 51-57.
Sartain, J.B., W.L. Hall, R.C. Little, and E.W. Hopwood. 2004. Development of methodologies for characterization of slow-release fertilizers. Soil Crop Sci. Florida Proc. 63:72-75.
Sartain, J.B. 2007. General recommendations for fertilization of turfgrasses on Florida soils. Fla. Coop. Ext. Publication #SL21. http://www.edis.ifas.ufl.edu/LH014.
SAS Institute. 1999. SAS/STAT User’s Guide. Version 8.02. SAS Institute, Cary, NC.
Skogley, C.R., and J.W. King. 1968. Controlled release nitrogen fertilization of turfgrass. Agron. J. 60:61-64.
Skogley, C.R. and C. D. Sawyer. 1992. Field Research. p. 609. In D.V. Waddington et al. (ed.) Turfgrass. Agronomy Monograph 32. ASA, CSSA, and SSSA, Madison, WI.
Smith, H., J.J. Casal, and G.M. Jackson. 1990. Reflection signals and the perception by phytochrome of the proximity of neighbouring vegetation. Plant Cell and Environ. 13: 73-78.

94
Snyder, G. H., E.O. Burt, and J.M. Davidson. 1981. Nitrogen leaching in bermudagrass turf: 2. Effect of nitrogen N source and rates. In ‘Proc. 4th Int. Turfgrass Res. Conf..’ (Ed. R. W. Sheard) pp. 313-324 (University of Guelph: Ontario.) 19-23 July.
Snyder, G.H., B.J. Augustin, and J.M. Davidson. 1984. Moisture sensor-controlled irrigation for reducing N leaching in Bermudagrass turf. Agron. J. 76:964-969.
Snyder, G.H., and J.L. Cisar. 2000. Monitoring vadose-zone soil water for reducing nitrogen leaching on golf courses. p. 243-254. In J.M. Clark and M.P. Kenna (ed.) Fate and management of turfgrass chemicals. Vol. 743. Am. Chem. Soc. Washington, D.C.
Spangenberg, B.G., T. W. Fermanian, and D. J. Wehner. 1986. Evaluation of liquid-applied nitrogen fertilizers on Kentucky bluegrass turf. Agron. J. 1986 78: 1002-1006.
Stanford, G., J. N. Carter, D. T. Westermann, and J. J. Meisinger. Residual nitrate and mineralizable soil nitrogen in relation to nitrogen uptake by irrigated sugarbeets Agron. J. 1977 69: 303-308.
Starr, J.L., and H.C. Deroo. 1981. The fate of nitrogen applied to turfgrass. Crop Sci. 21:531-536.
Subhrajit, K.S. and L.E. Trenholm. 2005. Effect of fertilizer source on water use of St. Augustinegrass and ornamental plants. HortSci 40(7):2164-2166.
Titko, S., J.R. Street, and T.J. Logan. 1987. Volatilization of ammonia from granular and dissolved urea applied to turf. Agron. J. 79:535-540.
Torello, W.A., and D.J. Wehner. 1983. Urease activity in a Kentucky bluegrass turf. Agron. J. 75:654-656.
Torello, W.A., D.J. Wehner, and A.J. Turgeon. 1983. Ammonia volatilization from fertilized turfgrass stands. Agron. J. 75:454-456.
Townsend, T.R., R.W. Howarth, F.A. Bazzaz, M.S. Booth, C.C. Cleveland, S.K. Collinge, A.P. Dobson, P.R. Epstein, E.A. Holland, D.R. Keeney, M.A. Mallin, C.A. Rogers, P. Wayne, and A.H. Wolfe. 2003. Human health effects of a changing global nitrogen cycle. Front Ecol. Environ. 5:240-246.
Trenholm, L.E. and J.B. Unruh. 2007. St. Augustinegrass fertilizer trials. J. Plant Nutrition, 30:453-461.
Trenkel, M.E. 1997. Improved Fertilizer Use Efficiency: Controlled release and stabilized fertilizers in agriculture. Intern. Fertilizer Assoc. Paris, France.
Turner, T.R., and N.W. Hummel, Jr. 1992. Nutritional Requirements and Fertilization. p. 387-439. In D.V. Waddington et al. (ed.) Turfgrass. Agronomy Monograph 32. ASA, CSSA, and SSSA, Madison, WI.

95
U.S. Environmental Protection Agency. 1999. Document 40 CFR Part 503: Biosolids Management Handbook, U.S. EPA Region 8, section 3.5-7, table 3.5.4 (mineralization rates). http://www.epa.gov/region8/water/biosolids/pdf/handbook3.pdf
US Census Bureau. 2008. Estimates and Projections—States. http://www.census.gov/compendia/statab/tables/09s0012.pdf.
Van Dolah, F.M., K.B. Lidie, E.A. Monroe, D. Bhattacharya, L. Campbell, G.J. Doucette, and D. Kamykowski. 2009. The Florida red tide dinoflagellate Karenia brevis: New insights into cellular and molecular processes underlying bloom dynamics. Harmful Algae. 8(4):562-572.
Varshovi, A. 1995. Nitrogen uptake and leaching potential of polymer-coated N fertilizers in turfgrass environment. Dissertation presented to the University of Florida Graduate School, Gainesville, Fl.
Vitousek, P.M., J.D. Aber, R.W. Howarth, G.E. Likens, P.A. Matson, D.W. Schinder, W.H. Schlesinger, and D.G. Tilman. 1997. Human alteration of the gobal nitrogen cycle: Sources and consequences. Ecol. Appl. 7:737-750.
Volk, G.M. and G.C. Horn. 1975. Response curves of various turfgrasses to application of several controlled-release nitrogen sources. Agron. J. 67:201-204.
Waddington, D.V., E.L. Moberg, J.M. Duich, and T.L. Watschke. 1976. Long-term evaluation of slow-release nitrogen sources on turfgrass. Soil Sci. Soc. Am. J. 40:593-597.
Waddington, D.V., J.T. Troll, and D. Hawes. 1963. Effects of Various fertilizers on Turfgrass, Yield, Color, and Composition. Agron. J. 56:221-223.
Weyner, D.J. and J.E. Haley. 1993. Effects of late fall fertilization on turfgrass as influenced by application timing. Int. Turfgrass Res. J. 7:580:586.
Williams, K.E., R.H. Snyder, J.L. Cisar, G.H. Snyder, and J.J. Haydu. 1997. Turf response to coated-urea fertilizer. 1. Visual quality and clipping yields. Int. Turfgrass Res. J. 8:553-562.
Wolf, B. 1982. A comprehensive system of leaf analysis and its use for diagnosing crop nutrient status. Commun. Soil Sci. Plant Anal. 13:1035-1059.
Wolfe, A.H. and Patz J.A. 2002. Reactive nitrogen and Human Health: Acute and Long –term implications. Ambio. 31:120-125.
Wolf, B. and G.H. Snyder. 2003. Sustainable Soils: The place of organic matter in sustainable soils and their productivity. P. 56. The Haworth Press Inc. Binghamton, N.Y.
Ylek, P.L.G, and E.T. Craswell. 1979. Ammonia volatilization from flooded soils. Fert. Res. 2:227-245.

96
BIOGRAPHICAL SKETCH
Neil G. M. Young is the son of Dr. Graham and Anne Young and was born and raised in
Aberdeen, Scotland. Neil spent much of his youth on the golf links with his father, where he
became interested in turfgrass and the environment. Neil worked on golf courses during school
holidays from the age of 13 and pursued a career in turfgrass management the traditional way in
Scotland, by conducting an apprenticeship in greenskeeping. Later, Neil received a Bachelor of
Science degree in turfgrass science from the University of Central Lancashire, England in May
2005. He chose to travel and work internationally in the turfgrass industry for several years
before deciding to attend graduate school. Neil joined the Soil and Water Department at the
University of Florida and began his graduate studies investigating the environmental
implications of turfgrass fertilization under the supervision of Dr. George H. Snyder in May
2007. He received his Master of Science degree from the University of Florida in the Fall of
2009.