Embed Size (px)
Citation preview

Master of Science Thesis EGI-2014-032MSC EKV 1021
KTH Royal Institute of Technology School of Industrial Engineering and Management
Department of Energy Technology, Heat & Power Technology SE-10044 Stockholm, Sweden
To Electrify a Flood Affected Village in Sajawal, Pakistan by Utilizing the
Available Renewable Energy Resources
Amna Waheed

ii
i
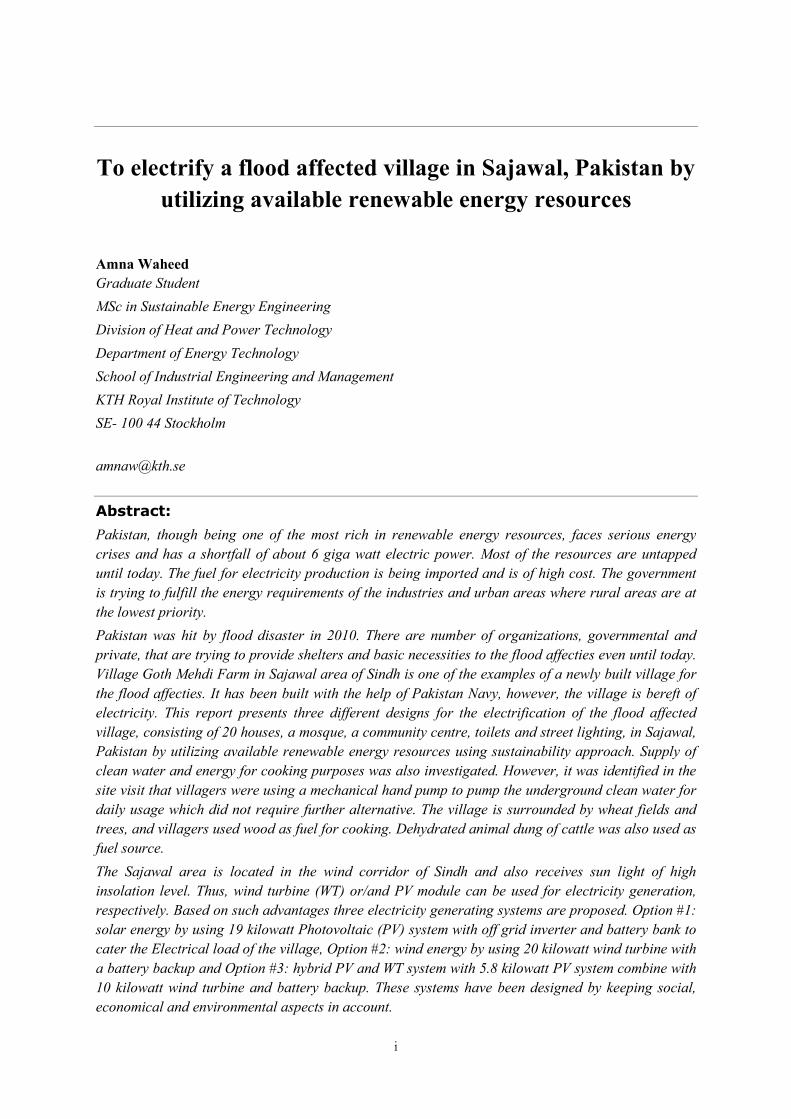
To electrify a flood affected village in Sajawal, Pakistan by utilizing available renewable energy resources
Amna Waheed Graduate Student MSc in Sustainable Energy Engineering Division of Heat and Power Technology Department of Energy Technology School of Industrial Engineering and Management KTH Royal Institute of Technology SE- 100 44 Stockholm [email protected]
Abstract: Pakistan, though being one of the most rich in renewable energy resources, faces serious energy crises and has a shortfall of about 6 giga watt electric power. Most of the resources are untapped until today. The fuel for electricity production is being imported and is of high cost. The government is trying to fulfill the energy requirements of the industries and urban areas where rural areas are at the lowest priority. Pakistan was hit by flood disaster in 2010. There are number of organizations, governmental and private, that are trying to provide shelters and basic necessities to the flood affecties even until today. Village Goth Mehdi Farm in Sajawal area of Sindh is one of the examples of a newly built village for the flood affecties. It has been built with the help of Pakistan Navy, however, the village is bereft of electricity. This report presents three different designs for the electrification of the flood affected village, consisting of 20 houses, a mosque, a community centre, toilets and street lighting, in Sajawal, Pakistan by utilizing available renewable energy resources using sustainability approach. Supply of clean water and energy for cooking purposes was also investigated. However, it was identified in the site visit that villagers were using a mechanical hand pump to pump the underground clean water for daily usage which did not require further alternative. The village is surrounded by wheat fields and trees, and villagers used wood as fuel for cooking. Dehydrated animal dung of cattle was also used as fuel source. The Sajawal area is located in the wind corridor of Sindh and also receives sun light of high insolation level. Thus, wind turbine (WT) or/and PV module can be used for electricity generation, respectively. Based on such advantages three electricity generating systems are proposed. Option #1: solar energy by using 19 kilowatt Photovoltaic (PV) system with off grid inverter and battery bank to cater the Electrical load of the village, Option #2: wind energy by using 20 kilowatt wind turbine with a battery backup and Option #3: hybrid PV and WT system with 5.8 kilowatt PV system combine with 10 kilowatt wind turbine and battery backup. These systems have been designed by keeping social, economical and environmental aspects in account.

ii
The financial comparison showed that the option # 1 required highest amount of capital cost with respect to other options, while option # 3 needed lowest initial investment for installation. Moreover Option 1, solar system, was found to be the most expensive option when battery replacements (every 3 years) were considered over a 20 years life time. Option 3, hybrid wind and solar system, was concluded to be the most economical solution for the Goth Mehdi farms.
KEY WORDS: Power generation; Solar energy; Wind energy; Sustainability; Renewable energy system design; Energy conversion.

iii
Acknowledgments
I am deeply indebted to my supervisor Prof. Anders Malmquist from Kungliga Tekniska Högskolan (KTH) whose help, suggestions and encouragement helped me to complete this study.
Furthermore, the EXPLORE Polygeneration project at KTH, being a part of STandUP for Energy and KIC Innoenergy, is also acknowledged for funding the supervision of this thesis work.
It is with immense gratitude that I also acknowledge the scholarship granted by the Field Studies Programme at KTH, offered by SIDA Swedish International Development Agency and for the technical support by Tuwairqi Steel Mills Limited Engineering (TSMLE), Pakistan. This thesis would not have been possible without the support and cooperation of all of you.
I would also like to thank my husband (soon Dr. Ali Azhar Butt), my two months old daughter (Alina Ali Butt) and my parents (Mr. and Mrs. Abdul Waheed) for their continuous support, love and prayers.

iv
Table of Contents
Abstract: .......................................................................................................................................................................... i
Acknowledgments........................................................................................................................................................ iii
1 Introduction .......................................................................................................................................................... 1
2 Objectives and Requirements ............................................................................................................................ 2
3 Background ........................................................................................................................................................... 3
3.1 Geography .................................................................................................................................................. 3
3.2 Site Description.......................................................................................................................................... 4
3.3 Renewable Resources Available in Pakistan .......................................................................................... 4
4 Methodology ......................................................................................................................................................... 8
4.1 Energy Demand ......................................................................................................................................... 8
4.2 System Components - Their use & Selection criteria ........................................................................ 13
4.3 System Designing .................................................................................................................................... 16
4.4 Battery Cooling ........................................................................................................................................ 19
4.5 Description of cost calculations ............................................................................................................ 21
5 Results .................................................................................................................................................................. 22
5.1 Energy demand of village ....................................................................................................................... 22
5.2 System design ........................................................................................................................................... 22
5.3 Cost calculation ........................................................................................................................................ 25
Sensitivity Analysis ................................................................................................................................................ 26
6 Discussion & Future extension ....................................................................................................................... 27
7 Summary and Conclusions ............................................................................................................................... 28
8 Bibliography ........................................................................................................................................................ 29

v
Table of Annex
Annex - A………………………………..…………………..…………………..…..……..Load details
Annex - B…………………..…………………..…………………..…………Battery sizing calculation
Annex - C……………………..…………………..………………………………….. PV system sizing
Annex - D……………………..…………………..……………..……………….. Wind Turbine sizing
Annex - E……………………………..…………………………………….. Hybrid system calculation
Annex - F………………………..…………………..……...…………….. PV panel spacing calculation
Annex - G……………………..…………………..…………………..……………………….. Costing
Annex - H……………………………..…………………………...……….. Data sheets of equipment
Annex – I.……………………………..…………………………...……….. Data sheets of equipment

vi
Nomenclatures
PV Photovoltaic
WT Wind Turbine
Cp Coefficient of Performance
FF Fill Factor
DOD Depth of Discharge
TV Television
LED Light Emitting Diode
V-I curve Voltage – Current curve
Z Distance between two panels base point
H Collector height
α Collector angle of inclination
β Solar angle
A Swept Area of rotor
V wind velocity
r Density of air
Voc Open circuit voltage
Isc Short circuit current
Pmax Maximum power
KPK Khyber Pakhtoon Khawa
STC Standard Test Condition
MCB Miniature Circuit Breaker
1
1 Introduction Electricity has become the basic necessity of our lives today. The industries and modern human life depends on such an energy source. The rise in the population, increased demand on production, advanced energy based technologies and improved lifestyle of the human beings has increased the demand for the electricity production, tremendously. The electricity is a secondary energy source that can be produced from primary resources such as coal, fossil fuels, gas, oil etc [1]. Such resources are depleting progressively due to which developed countries have already started using renewable resources for the electricity production that are also considered to be environmental friendly. These renewable energy resources include the sun, wind, hydel, biomass, geo thermal etc [2-6].
Sustainable solutions is what the world is aiming towards today by taking into account the environmental impacts, social viability and economical feasibility. Conventional fuels produce CO2 and other type of emissions that contribute to the air and water pollution. In order to reduce these environmental concerns, policy makers have tried to put some penalties on such emissions [7].
European Union (EU) has set the 20-20-20 target that has to be completed by year 2020. The three objectives to be achieved are [8];
i. “A 20% reduction in EU greenhouse gas emissions from 1990 levels; ii. Raising the share of EU energy consumption produced from renewable resources to 20%; iii. A 20% improvement in the EU's energy efficiency.”
There are many countries in the world including Pakistan that are rich in the renewable energy resources. Pakistan is a developing country with low per capita income. Its economy is dependent on the agriculture and industries that have high electricity demand such as textile, steel, cement and food processing etc [9]. The production of electricity in Pakistan is mainly based on the coal, hydel, oil and natural gas. The shortfall of electric energy in Pakistan is increasing day by day. Furthermore, electricity supply losses and theft has increased these numbers. The population of Pakistan consists of 70% living in rural areas and 30% in urban. Only, 16% population of the rural region has access to the electricity grid while others use wood and oil as energy source [10]. Around 38% of population has no electricity at all and they have to find other methods to fulfill their basic necessities. Not only the inhabitants but even the industries are also suffering due to the shortfall of the electric energy. The power shortage is reported to be more than 6 GW [11]. As a consequence, the rural areas get neglected. There is, however, a vast potential in the alternate energies development, and moreover, Pakistan has a great potential of almost all types of renewable energy resources that are untapped. The country receives an abundant sun light all over the year. The annual global irradiance has been estimated to be 1900 – 2200 kWh/m2 [12]. There are major wind corridors present, in two out of four provinces of Pakistan, in Sindh and Balochistan [12]. According to the Pakistan meteorological department report, Sindh has a Gharo-Keti Bandar wind corridor of 9700 km2 with an average wind speed of about 7 m/s at 50m height and is capable of producing 43 GWs [13].
Many regions of Pakistan have suffered number of natural disasters such as floods. A flood disaster hit Pakistan in 2010 and affected more than 100 villages in the Punjab and Sindh provinces. There are number of organizations, governmental and private, that are trying to provide shelters and basic necessities to the flood affecties even until today. Village Goth Mehdi Farm in Sajawal area of Sindh is one of the examples of a newly built village for the flood affecties. It has been built with the help of Pakistan Navy, however, the village is bereft of electricity. For this study, three basic necessities are identified during the visit to the village that includes electricity, availability of clean drinking water and energy for cooking. These necessities were investigated and some solutions are proposed in this report. The solar and wind energy has been the focus for the electricity production whereas biomass for cooking purpose for the study.

2
2 Objectives and Requirements The main objective of this project is to ensure the provision of continuous supply of drinking water, electricity and fuel for cooking in a flood affected village in Sajawal, Pakistan, by utilizing available renewable energy resources of the area, keeping social, environmental and economical aspects in mind.
A system will be proposed to meet the target which will also help to increase the technical knowledge of the villagers who will be maintaining the system thereafter. The prerequisites considered for the designing of the system are as follows;
GENERAL PREREQUISITES
• Site study will be done to know the o electricity requirement of the villagers o arrangement of clean drinking water o supply of fuel for cooking o available facilities
• The system should not be complicated and easily understandable to the local people who will be maintaining it thereafter.
• Maximum utilization of available energy resources. • System should be creating a safe environment for the users and investor, shall be prone to
damages. • Choice of equipment and design shall be reliable enough and should work throughout its
proposed life time. • Usage of clean technology shall be prioritized. • Minimum damage or change in the environment and layout of the village. • Minimum auxiliary consumption for operation of the system.
TECHNICAL PREREQUISITES
• The designed system must supply electricity to 20 houses, a mosque, a community centre and toilets.
• Each house shall be provided with the electricity to run lights, fans, TV, mobile charger and refrigerator.
• Each house will be getting same amount of energy from designed system. • The output voltage, frequency of the system shall comply with local standards of Pakistan • Selected equipment shall be of high efficiency and life time with optimum cost. • System design shall ensure the maximum utilization of equipment and available resource. • A number of systems will be proposed using different arrangement of equipment and available
resources to find a sustainable solution.

3
3 Background Pakistan is suffering from serious energy crises due to rapid increase in population, poor endowment of energy resources, high demand, expanding industries and high cost of imported fuel [14]. The installed power generation capacity in Pakistan is around 23 GW but actual generation hovers around 15 GW. This is due to many reasons; inefficient and outdated power plants, financial crises, available but unextracted resources etc. In this scenario, the country has to face the shortfall of more than 6 GW [11]. As a consequence, the industries are relocating to other countries due to which the economy of the country is weakening. The shortfall of energy highly affects the people of the country as well especially in the summer season when electric fans and air conditions are required at large. In urban areas, the residential consumers have to face a load shedding of at least 4 hours per day and it becomes worst in the rural areas where the load shedding is about 18-20 hours a day. In this energy crisis situation, providing power to a flood affected village such as the Goth Mehdi Farm seems impossible for the government for the time being as the highest priority is to fulfil the energy demands of the industries and urban-rural areas.
3.1 Geography Pakistan is located in Southern Asia and its geographical coordinates are 30N, 70E. The area under consideration for this study is called Goth Mehdi Farm which is situated in the Southern part of Pakistan in the Sindh province. Village is known as Goth in Sindhi language. The Goth Mehdi Farm is located about 1 km from Thatta near Sajawal. Fig. 1 shows the satellite view of Sajawal district (encircled in red) with reference to Karachi city. While the closer view from satellite of Goth Mehdi Farm is shown in Fig. 2.
Fig. 1- Satellite view of the site
Karachi

4
Fig. 2- Closer view of the village from satellite
3.2 Site Description The site (Goth Mehdi Farm) consists of 20 houses, a mosque (prayer room) and a community centre. The houses are built as three blocks of 7, 7 and 6. The authorities have planned to construct a school as well but so far this project has not started. The three faces of the village are surrounded by the wheat fields whereas the fourth face has the road infrastructure that is already in service. Each house has a single room and a kitchen. The material used for building the houses is wheat straws and the house owner might be the one to build his own house. The toilets are built separately for each block. The layout of the Goth Mehdi Farm is as shown in Fig 3.
Fig. 3- Layout of village Goth Mehdi Farm
3.3 Available Renewable Resources in Pakistan Pakistan is a country rich in the renewable energy resources. It has a copious sunlight in all the regions, however, Balochistan gets the maximum sunlight during the year. In fact, Balochistan province can be considered among the regions of highest insolation level in the world. Pakistan also has areas that are capable of catering the whole energy demand of the country by utilizing the wind energy resource. Sindh
5
and Balochistan provinces are rich of such a renewable energy resource. Pakistan is the world’s fourth largest milk producing country with cattle and dairy population of 67 million that is capable of generating 368 million metric tons of animal manure. This manure has the potential to produce 24 GWh of electricity [10]. The estimated amount of municipal solid waste of Pakistan’s 9 cities is around 7 million per annum which has an increasing rate of 2.5% per year. It has the capacity to produce 14 TWh of electricity per annum [11]. Pakistan is gifted with a hydel potential of around 42 GW of which, most lies in the Khyber Pakhtoon Khawa (KPK) province , Northern Areas, Azad and Jammu Kashmir and Punjab. 10 – 11% of energy generation in Pakistan is based on hydel power which is around 7 GW [12].
3.3.1 Solar energy
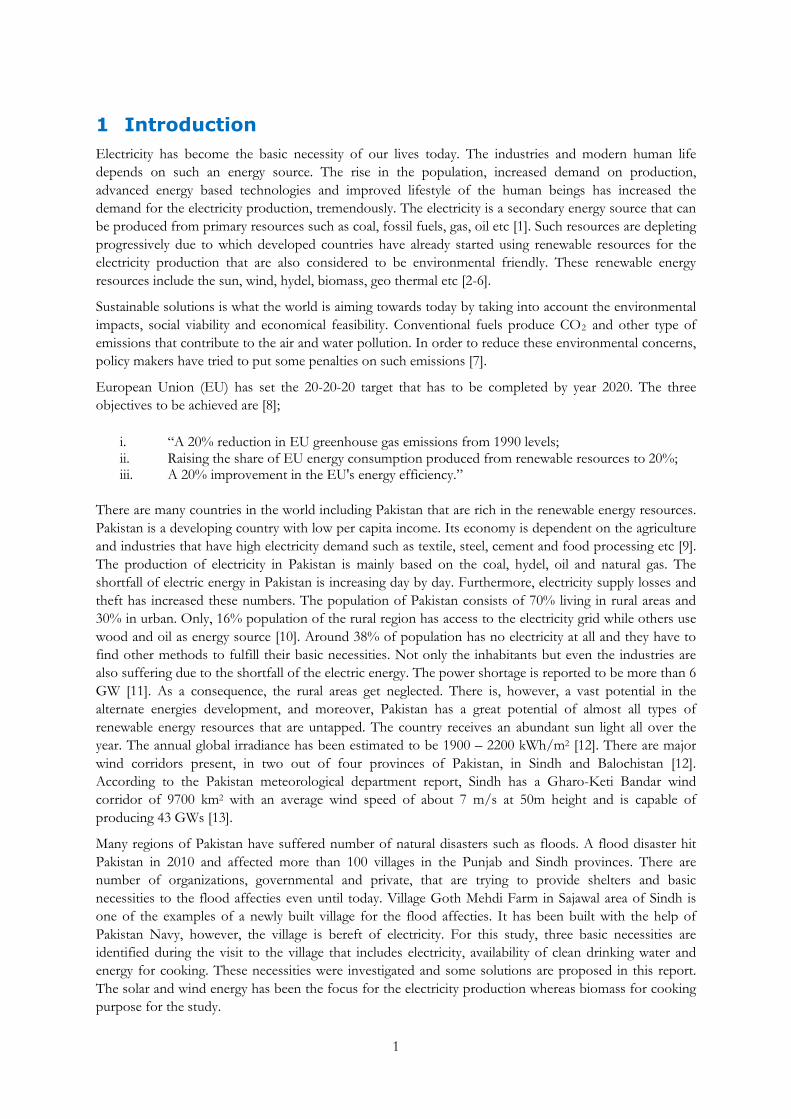
Pakistan is situated in the region that has abundant sun light available all over the year with average insolation level of 5.5 – 6 kWh/m2/day and about 1.8-2.2 MWh/m2 annually with a mean day length of 8 – 8.5 hrs. Fig 4 shows the annually direct normal solar radiation all over Pakistan.
Fig. 4- Pakistan direct normal solar radiation annually [27]
Province Balochistan has highest solar insolation level among other provinces and if quarter of it’s area is covered with solar panels of 20% efficiency, the produced energy would be enough to cover the energy demand of Pakistan [18]. The average solar insolation level in Balochistan is 19-20 MJ/m2/day with an annual mean day time of 8-8.5 hrs which is among the highest in the world. Northern Sindh also has a tremendous potential of harnessing solar energy resource [19].
Balochistan
Sindh
KPK
Punjab

6
Fig. 5- Solar map of Pakistan [20]
3.3.2 Wind energy
In Punjab and KPK province, the average wind speed is measured to be 6.2 to 7.4 m/s and near Karachi, it varies from 6.2 to 6.9 m/s. The Sindh and Balochistan region has areas that are declared as wind corridors. They are not only capable of overcoming the shortfall of energy in Pakistan but also can produce far more than the energy requirement of the country [18]. According to the study by Sindh Board of Investment (SBI), the wind map developed by National Renewable Energy Lab (NREL) with US-AID collaboration, points to Pakistan’s wind energy potential of around 346 GW [21]. Fig 6 presents the wind power classification of Pakistan.
Fig. 6 - Wind speed distribution of Pakistan [15]
Karachi
Lahore
Quetta

7
Wind enters into the wind corridor from Arabian Sea via Karachi and the eastern borders of Sindh province which enters into the wind corridor near Gharo region with wind speed of 5 – 6 m/s. An 85 km long belt from Gharo to Keti Bandar is known as wind corridor travels till Hyderabad, 159 km away from Karachi. As per Alternate Energy Development Board (AEDB), this wind corridor is capable of producing 50 GW. The data provided by AEDB shows a potential of around 21 wind farms that can be installed within this wind corridor [22]. Table-1 provides the annual average wind speed of Gharo site at 30, 50, 60, 67 and 80 meter height for each month of the year. It can be seen from table 1 that the highest wind speed can be achieved in the month of June.
Table-1: Monthly average wind speeds for Gharo
Month Monthly Benchmark Wind Speed
30m 50m 60m 67m 80m
January 4.7 5.1 5.2 5.3 5.4 February 5.1 5.4 5.5 5.6 5.7 March 5.3 5.7 5.8 5.9 5.9 April 7 7.3 7.4 7.6 7.6 May 8.9 9.4 9.6 9.7 9.8 June 10.3 10.9 11.1 11.2 11.3 July 8.4 8.9 9 9.2 9.2 August 9.3 9.8 10 10.2 10.3 September 7.6 8.1 8.2 8.3 8.4 October 4.3 4.6 4.7 4.7 4.8 November 3.8 4.1 4.2 4.3 4.4 December 4.6 4.9 5.1 5.2 5.3
8
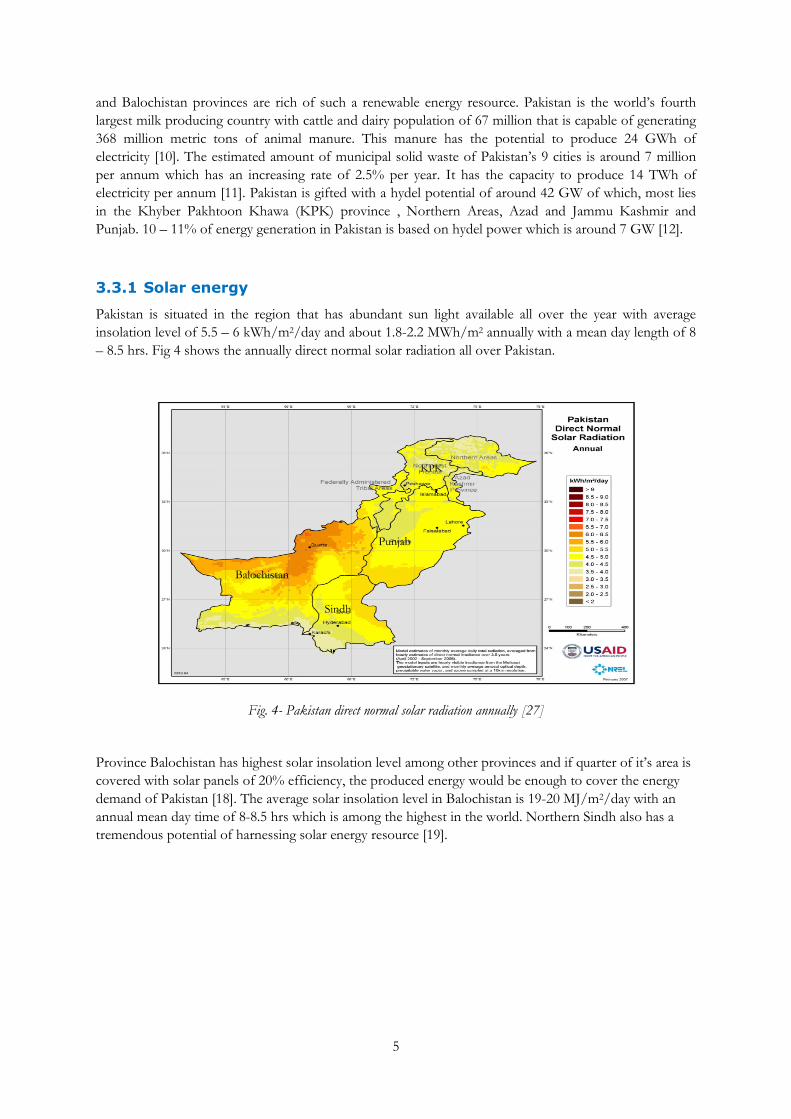
4 Methodology For this study, Goth Mehdi Farm was visited number of times and during the visits, interviews were also conducted that helped to enlist the basic requirements of the inhabitants. The electricity system design was based on the needs of the inhabitants and the available electrical appliances. The wind speed and solar insolation data for this site has been taken from other resources however, rest of the data was collected manually by considering the current situation of the village. The methodology shown in Fig.7 was followed for the study.
Fig. 7 – methodology description of the project
4.1 Basic necessities The study is carried out to cater the basic requirements of Goth Mehdi Farm which includes electricity, drinking water supply and fuel for cooking. In the current situation grid is available in the village which is around 1km away from Goth Mehdi Farms. In the current energy situation of Pakistan, where the requirement of big cities like Karachi and industries are not fulfilled, the small villages have to suffer with long term load shedding. According to the neighboring villagers with grid connection, the availability of electricity is for four hours only and they have to suffer with load shedding for 20 hours. During these four hours they barely charge their mobiles and get some news alert from TV.
4.1.1 Electricity Demand
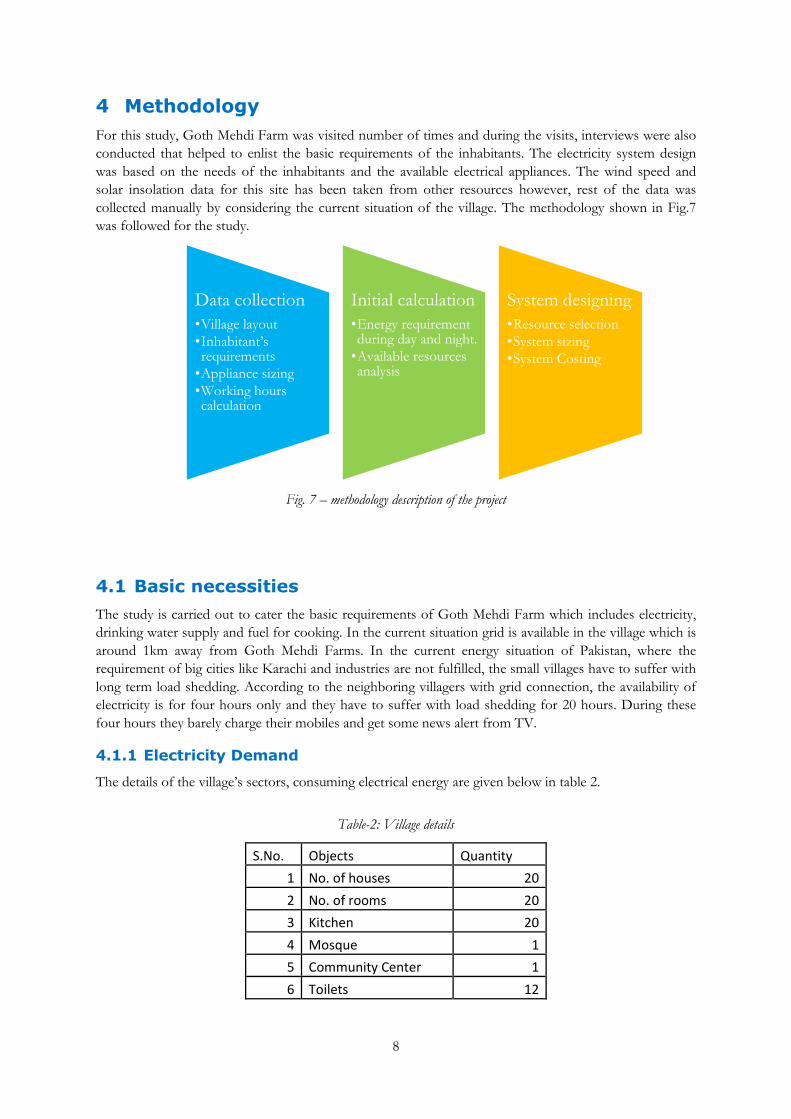
The details of the village’s sectors, consuming electrical energy are given below in table 2.
Table-2: Village details
S.No. Objects Quantity 1 No. of houses 20 2 No. of rooms 20 3 Kitchen 20 4 Mosque 1 5 Community Center 1 6 Toilets 12
Data collection •Village layout •Inhabitant’s requirements
•Appliance sizing •Working hours calculation
Initial calculation •Energy requirement during day and night.
•Available resources analysis
System designing •Resource selection •System sizing •System Costing

9
During the data gathering and the discussion with the villagers, the following were identified as their requirements;
i. Lights ii. Fans iii. TV iv. Refrigerator v. Mobile charger vi. Water pump vii. Heater for winters viii. Cooling system for summers
It was decided to design the electricity systems based on the needs of the inhabitants. However, design for the heating and cooling were not considered as the overall system size would increase and such studies may be done in the later stages.
Electrical load of a single house
According to the technical survey and requirements of the locals, it has been decided to provide each house with the electricity to run following appliances;
a) 2 x 3 W LED lights b) A 50W fan c) A 150 W TV d) A 5W mobile charger e) A 150 W refrigerator will also be provided for each house.
The pictorial view of a house located in Goth Mehdi farm is shown in Fig. 8.
Fig. 8- A house in village Goth Mehdi Farms
Electrical load of a single house in summer
Sajawal is situated in the southern part of Pakistan and the ambient temperature in summer from May to August reaches to about 410C [23]. In such a hot climate, demand for the fans is quite obvious. The overall load requirement increases with an increase in the usage of fans. However, there is an advantage of having a longer day light which is helpful to cater the extra load by the fans. Moreover, it is a normal

10
trend for men in villages of Pakistan to sleep outside in summers to enjoy natural breeze during the night. During the day, men leave for work and women completing their household works, like to gather around with other women of the village. It was observed that the need for the day time consumption light was not the necessity. On the other hand, the possibility of women and children staying at home and watching TV was not neglected. An estimate was made in which running hours during the day for electric fans and watching TV were assumed to be 5 and 2, respectively for each house whereas during the night as 14 and 3, respectively. It was observed that each house had almost two mobile phones that were assumed to be charged 2 hrs during the day and 2 hrs at night. Refrigerators usually get a continuous supply throughout the day, however, they require electricity only for about half of the time when they are operating. Therefore, 6 hrs in the day and 6 hrs at night were the times considered for the electricity supply to the refrigerators.
Electrical load of a single house in winter
During the winters, the minimum average ambient temperature of Sajawal area is about 2 0C. The day length decreases with a demand for more light. However, no electric fans are required in winters. As estimated, running hours per day time for TV are 2 while during the night are 3 for each house. The electricity requirement for mobile charging and refrigerator is assumed to remain the same as during the summer times per house.
Electrical load of the community Center
Community centre is a place that is usually used for meetings or gatherings. Since it has two rooms and a single corridor, therefore, three LED lights of 3 W are proposed, one for each room and one for the corridor. Two 50 W fans are also suggested for each room. The use of this building is not quite often so it is assumed that during the day time, there will be no use of lights but electric fans might be used for half an hour and during the night time this place is used for an hour which means an hour would be the running time for both lights and fans. A photograph of community center is shown in Fig. 9.
Fig. 9- Community centre of Goth Mehdi farms
Electrical load of the mosque
Mosque is used five times a day for prayers and normally it takes 45mins during each prayer time. Mosque is based on a single but relatively bigger room which needs two LED lights of 3 W and two fans of 50 W. There will be no use of lights during the day however, at the night time, it is estimated that the lighting will be required for almost 3 hours. Fans will run for 1.5 hours during the day and 2 hours at the night time. The view from outside of mosque is shown in fig. 10.

11
Fig.10- Mosque in Goth Mehdi Farms
Electrical load of the toilets
Toilets are built collectively for each block of houses and there are in total 12 toilets. 12 LED lights of 3 W are suggested, having a single light in each toilet. In general, each toilet is used for 10-15 minutes so it has been estimated that 1 hour lighting during the night is required for the 12 toilets. The picture of toilets block at Goth Mehdi farm is shown in Fig. 11.
Fig. 11- Toilets in Goth Mehdi farms
Electrical load of the street lights
11 LED lights of 9W are suggested as street light. It has been assumed that the running hours of the street light would be 7.
4.1.2 Energy for cooking
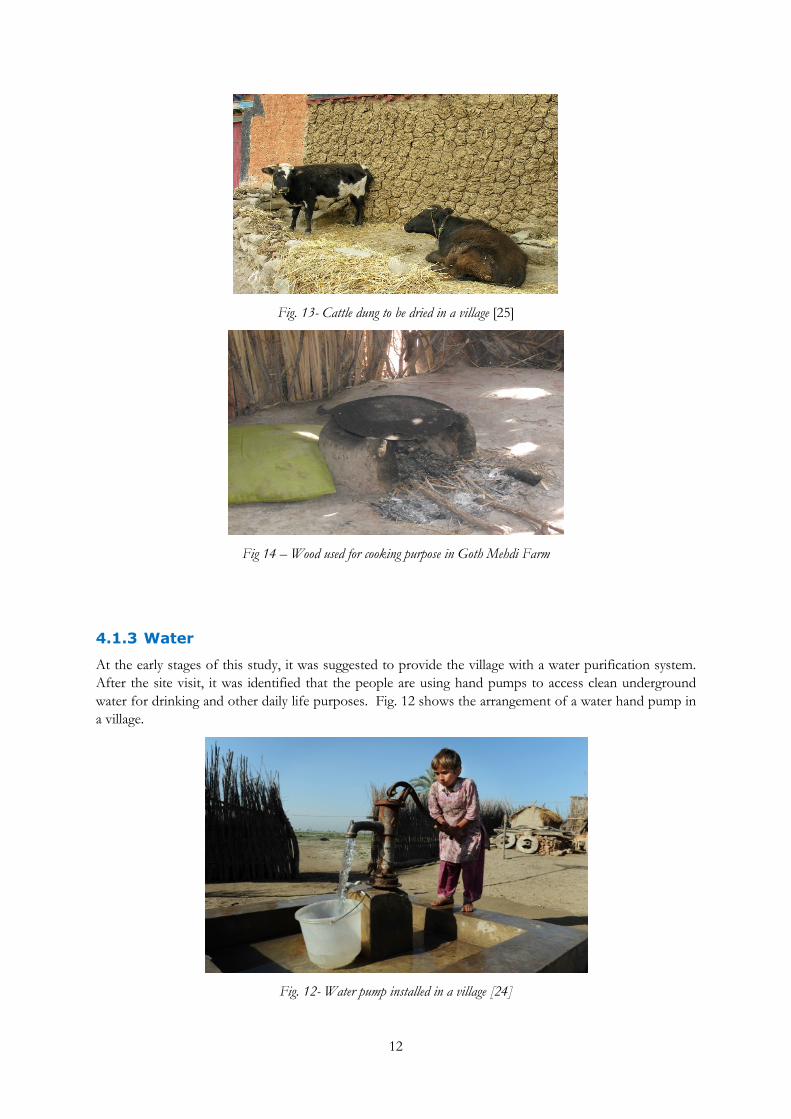
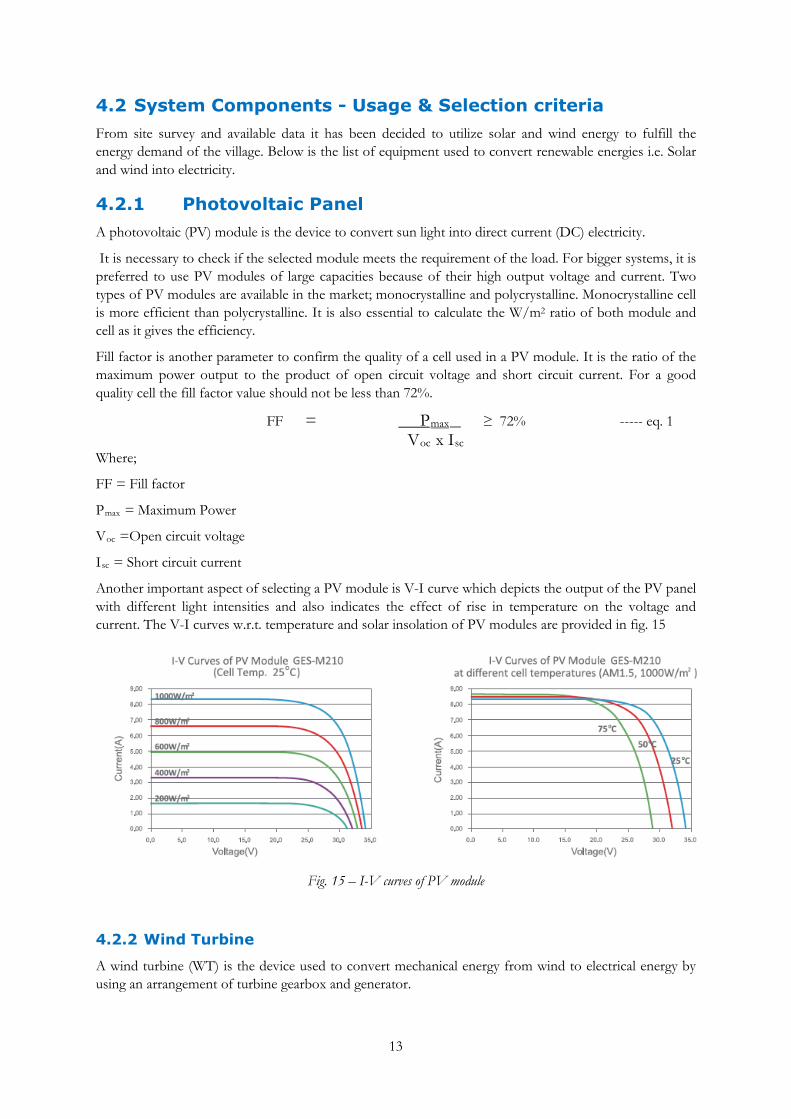
The total number of cattle in the village varies from 12-14 which includes cows and buffalos. Villagers make small flat plates of cattle dung and spread over the walls and floor to be dried in the sun light as shown in fig 13. After this dung has dried, it is burned and used as fuel for cooking purposes as an example. Wood is also burned and used for cooking. Tree branches and field’s waste are spread on the ground, dried in sunlight and then, burned for the cooking purpose as shown in fig 14.
12
Fig. 13- Cattle dung to be dried in a village [25]
Fig 14 – Wood used for cooking purpose in Goth Mehdi Farm
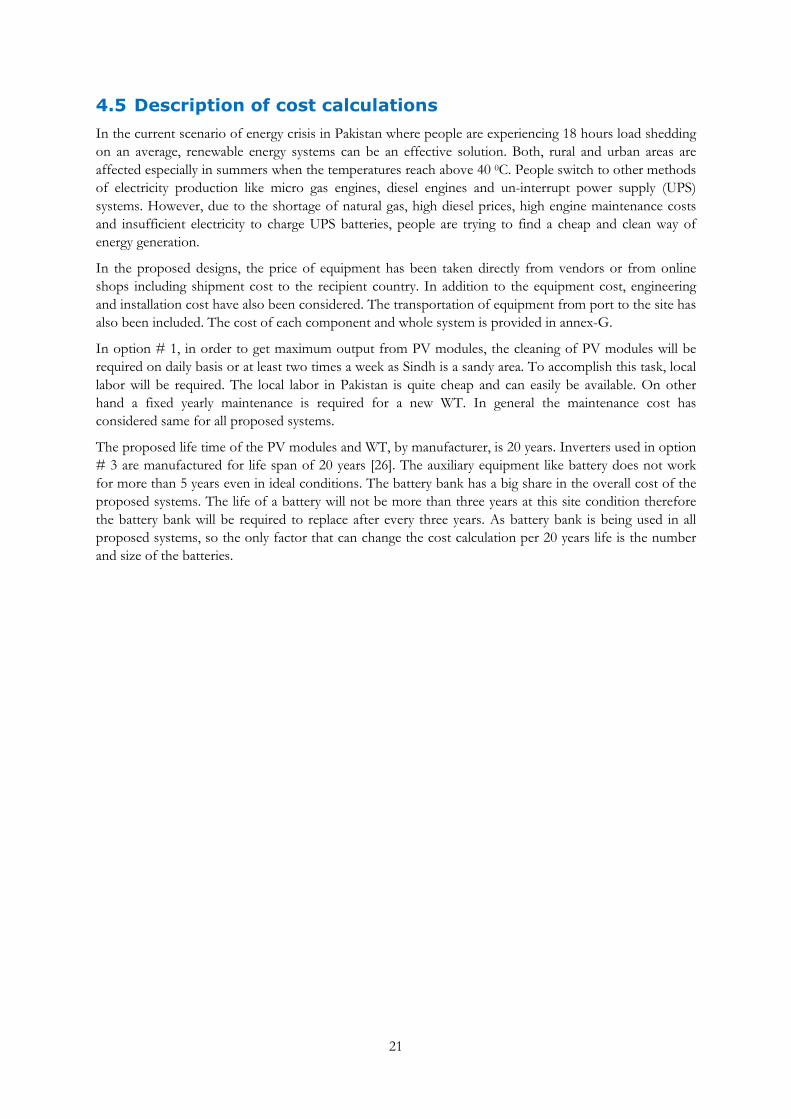
4.1.3 Water
At the early stages of this study, it was suggested to provide the village with a water purification system. After the site visit, it was identified that the people are using hand pumps to access clean underground water for drinking and other daily life purposes. Fig. 12 shows the arrangement of a water hand pump in a village.
Fig. 12- Water pump installed in a village [24]
13
4.2 System Components - Usage & Selection criteria From site survey and available data it has been decided to utilize solar and wind energy to fulfill the energy demand of the village. Below is the list of equipment used to convert renewable energies i.e. Solar and wind into electricity.
4.2.1 Photovoltaic Panel A photovoltaic (PV) module is the device to convert sun light into direct current (DC) electricity.
It is necessary to check if the selected module meets the requirement of the load. For bigger systems, it is preferred to use PV modules of large capacities because of their high output voltage and current. Two types of PV modules are available in the market; monocrystalline and polycrystalline. Monocrystalline cell is more efficient than polycrystalline. It is also essential to calculate the W/m2 ratio of both module and cell as it gives the efficiency.
Fill factor is another parameter to confirm the quality of a cell used in a PV module. It is the ratio of the maximum power output to the product of open circuit voltage and short circuit current. For a good quality cell the fill factor value should not be less than 72%.
FF = Pmax ≥ 72% ----- eq. 1 Voc x Isc
Where;
FF = Fill factor
Pmax = Maximum Power
Voc =Open circuit voltage
Isc = Short circuit current
Another important aspect of selecting a PV module is V-I curve which depicts the output of the PV panel with different light intensities and also indicates the effect of rise in temperature on the voltage and current. The V-I curves w.r.t. temperature and solar insolation of PV modules are provided in fig. 15
Fig. 15 – I-V curves of PV module
4.2.2 Wind Turbine
A wind turbine (WT) is the device used to convert mechanical energy from wind to electrical energy by using an arrangement of turbine gearbox and generator.

14
The selected WT should meet the requirement of the load. The size of an alternator tells the value of the electrical output from the WT system. It is essential to select a WT that is capable of operating at the selected site conditions e.g. wind speed, temperature, air density etc. As in fig. 16, the power curve tells the behavior or output of the WT at different wind speeds.
Fig. 16 - Power curve of CE&P Wind turbine
The WT type selected is based on the wind speed. For low wind speed and small systems, vertical axis wind turbines (VAWT) are preferred while for high wind speed, horizontal axis wind turbines are used. It is essential to calculate the W/m2 ratio of the WT which can be calculated from the rotor swept area and the wind speed.
The coefficient of performance is the ratio between the available energy in the wind and the rated output energy of the wind turbine.
Cp = Rated power output of WTPower available in wind
----- eq.2
Where;
Cp = Coefficient of performance
The output, number of phases, voltage level and frequency of the alternator should be checked and should meet the requirement of the designed systems.
4.2.3 Inverter
An inverter is a device use to convert DC into Alternating Current (AC). Modern inverters do not only invert the supply but also provided with control and protection of system features. In solar energy systems, two types of inverters are widely used; Grid tied inverter and off grid or stand alone inverter.
A grid tied inverter is used in a system which has the provision of grid connection. Electricity can be taken from grid in case of low generation from private system and can be supplied back to grid when generation is exceeded. Backup system is not required in grid tied system if continuous supply from grid is ensured.
An off grid or stand alone inverter is used for island mode operations where connectivity with the grid is not required. This type of system is feasible to use where there is no provision of grid electricity like hilly areas or country sides. In most of the cases battery is being used as a backup system.
The rating and type of inverter should be selected with respect to the size and requirement of the designed system. In this system off grid type has been used in option #1 the system is stand alone and there is no connection with grid. Output voltage and frequency should match the country’s standard. In Pakistan 400V/230V and 50Hz is grid voltage and frequency so the selected inverter should have these values. It is important that the input voltage of the inverter should match with the PV module row

15
arrangement’s voltage. Also an inverter should have the capability to connect all PV rows available in a system. Otherwise an arrangement should be made to connect them together.
The efficiency of an inverter has a great impact on overall efficiency of the system so the most efficient inverter should be selected. One should also check the extra features provided with protection and management of the system like charge controlling, if it is provided within the inverter then separate charge controller is not required. If connectivity with internet or computer is required then inverter should be of communicatable type. The operating conditions like temperature should be verify before selecting an inverter and operating temperature range should be within the temperature range of the site. It is also required to check IP class of the inverter.
4.2.4 Battery
A battery is used to store energy. It is used as a backup in stand alone or off grid systems. In case of unavailability of electricity the stored energy from battery can be used. In this system, deep cycle battery is used which is designed to discharge between 50% and 80% of its capacity.
The battery rating should be capable of catering the load demand of system. The battery ratings can be calculated by the number of amperes used for a certain time period at a certain voltage level. Another important aspect is to concern about the life of the battery as the battery can become the most expensive part of the system if a proper selection has not done.
Depth of discharge (DOD) vs no. of cycles of the battery chart shows the life of the battery with respect to the percentage discharge. A battery with deep depth of discharge and high number of cycles should be selected. It is important to keep the temperature of the room at 20 °C where the battery is stored as the efficiency and life of the battery are affected by the changes in temperature.

16
4.3 System Designing The overall energy demand in summers is more than winters but it is not feasible to design two systems for both seasons. It has decided to designed the system at higher side i.e. with respect to summers and in winters, the extra energy can be used for more street lights or can be sell to the inhabitants or neighboring villagers. After the site visit, technical evaluation of the equipment and going through the needs of the locals, the following options have been offered.
4.3.1 Option #1 (Stand Alone Centralized System)
With respect to the load demand discussed earlier; a system has been designed based on PV modules with battery backup. The output from PV module can be achieved 100% at Standard Test Condition (STC) which is 1000W/m2, 25 0C and 1.5 AM, but in reality the output deviates with respect to site conditions. Site condition always fluctuates and gives less output than rated value. Moreover since fixed mounting structure is offered, the output would be maximum around 12:00 when panels will be facing due south. In summers the estimated length of the day in Sajawal is taken as 9 hours and keeping above factors in mind the factor of 70% output throughout the day and 20% electrical equipment losses have considered during the sizing of system.
As sun is not available at night, the energy demand, at night time, will be fulfilled by the battery bank that will be charged by the PV system during day time. Battery losses are assumed to be 20% and allowable depth of discharge of the battery to be 80%. Formula used to find out the capacity of battery bank is provided in below eq. 3.
𝐶 = 𝐸 𝑥 1000𝑉 𝑥 𝜂 𝑥 𝐷𝑂𝐷
x 10000 ----------------- eq.3
Where;
C = Battery bank capacity in Ah
E = Energy to be stored by battery bank in kWh/day
V = Cell voltage in volts
η = Cell efficiency in %
DOD = Depth of discharge in %
The arrangement of PV modules will be done with respect to the input current and voltage of the inverters. The maximum output voltage and current of PV module is 37.7V and 8.25A. Five sets of 4 kW inverters will be used, each with input current and voltage of 50 A and 150V respectively. Each inverter will be connected to the 16 PV modules in which four sets of parallel connected PV modules will then be connected in series which gives the overall output of 150.8 V and 33A. The designed system capacity can be calculated from eq. 4.
P = 𝐸ℎ 𝑥 𝜂 𝑥 0.7
----------------- eq. 4
Where;
P = Designed system capacity in kW
E = Energy demand in kWh/ day
h = No. of sun light hours in hours
η = equipment efficiency factor
0.7 = solar irradiance factor

17
PV Panel location In order to get maximum output from PV system with fixed mounting structure type it is recommended that the orientation of PV array should face due south with the tilt angle equal to the latitude of the site. In this case study the PV arrays will be placed facing due south and the tilt angle of the array would be 24.70 i.e. the latitude of Sajawal. PV modules will be placed horizontally to reduce stress caused by wind which is a normal practice.
It is essential to keep some distance between two arrays to avoid shading effect which decreases the overall efficiency of the system. The distance between two arrays depends upon the height and tilt of the panel. The formula used to calculate the distance between two adjacent rows is provided in eq. 5. A detail calculation sheet is available in annex-F. The suggested arrangement of adjacent rows is provided in Fig. 17.
𝑍H
= sin(180−(α + β))sinβ
-----------------eq. 5
Where;
Z = distance between two panels base point in meters
H = collector height in meters
α= collector angle of inclination in degrees
β = Solar angle in degrees
Fig. 17- Suggested space between two adjacent rows
In this case study the length of a PV height (H) is 1 meters, collector angle of inclination (α) is 24.70 and solar angle (β) is 900 – 23.50 -24.690 =41.560.
α α

18
4.3.2 Option #2 (Wind energy system)
Normal Wind The selected WT should produce the required energy on daily basis. The energy demand of the village is not too high and can be cater by a small WT. A number of WT have been evaluated to fulfill this load requirement. Generally most of the small wind turbines operate at a height of maximum 10 meters with the rated wind speed of 10 m/s or more. From annex-D, the average wind speed available at height of 10 meters throughout the year is 4 m/sec, which is not enough to produce rated output from the wind turbine.
A 10 KW WT from California Energy & power has been chosen to test; The rated wind speed is 11 m/s with rotor swept area of 30 m2. The output from WT at height of 10meters can be calculated with the help of following eq. 6;
P = 0.5 x r x A x V3 -------------- eq. 6
Where;
P = Power available in air in kW
r = density of air in kg/m3
A = swept area of rotor in m2
V = velocity of air in m/sec
Coefficient of performance tells the efficiency of the WT, below is the equation to find out the value of coefficient of performance of a WT.
Cp = Rated power output of WTPower available in wind
--------------- eq. 2
Where;
Cp = Coefficient of performance of WT
Concentrated wind Another option is to make an arrangement to increase the wind speed at rotor area in order to increase the air density which will subsequently increase the power output from the WT. Fig. 20 shows the result of an experiment where the wind is concentrated between the buildings. The wind concentration increases near the walls at inlet and starts to decrease near the outlet. The wind speed reaches the double of its value near the walls.

19
Fig. 18 - Concentration of wind between adjacent buildings
This arrangement can be made by installing a WT between two adjacent buildings in the direction of air flow but unfortunately this village consists of houses which are not more than 3-4 meters high. [28]
Constructing building or walls to achieve this goal with minimum 10 meter height in this area would be difficult now. Or otherwise there can be an option of constructing the buildings of 10 meters or high, with apartments for the local people and electrify the same building, which can be another case study to be done in the future.
4.3.3 Option # 3 (Hybrid Solar & Wind Energy System)
In this type of system solar, wind energy and battery bank support each other to cater energy demand. During the night time sun is not available but wind is available throughout the day so the deficiency in solar energy would compensate by wind energy. The wind speed at 10 meters height is not enough to produce rated output of the wind. During day time this would be taken care by the PV system and for the night time a battery backup is also provided with WT.
4.4 Battery Cooling The self discharge rate of the battery decreases with increase in operating temperature of the battery. The ambient temperature also affects the life time of the battery. Fig. 19 shows the curve of service life time of the battery with respect to the ambient temperature and it is quite obvious that the life time is decreasing from 25 years when the ambient temperature is 25 0C to 10 years when the ambient temperature is 50 0C.
Fig. 19- Floating service life Vs different temperatures (taken from Leoch battery catalogue)
Fig. 20 shows the curve of discharge capacity of the battery with respect to the ambient temperature and it can be noticed that the discharge capacity is increasing from 60 cycles when the ambient temperature is -20 0C to 110 cycles when the ambient temperature is 50 0C.
Discharge capacity

20
Fig. 20- Discharge capacity and Temperature curve (taken from Leoch battery catalogue)
It is recommended by the battery manufacturers to locate a battery in a clean, dry and ventilated area with the ambient temperature of 0 0C to 20 0C to get maximum efficiency and life time. A high temperature would shorten the service life and over low temperature would lower the capacity available.
Battery cooling method The battery storage room shall be capable of cooling the battery bank to limit the losses due to high ambient temperature of the site during summers. It can be achieved by introducing a ventilation system in the room.
One of the prerequisite for designing the system is to minimize the consumption of energy for the system operation, so a way should be find out which keeps the temperature of the battery bank at required level without draining energy from the system.
This target can be achieve by introducing a hole in the wall, which faces the wind velocity, which lets the air converges and then allow it to enter into the room. As discussed earlier this area has good wind velocity so wind can be used for cooling purpose. If the ambient temperature is too high then a wet cloth can be introduce in the converging duct to cool the air. Another wind outlet will be constructed on the opposite wall, for the wind, to have a path to flow. This arrangement is shown in Fig. 21.
Fig. 21- Battery cooling method
Another arrangement can be the use of fans for cooling of the battery bank, but for this option another electrical setup is required for the operation of fans.
Wind inlet Wind outlet
Battery storage room
21
4.5 Description of cost calculations In the current scenario of energy crisis in Pakistan where people are experiencing 18 hours load shedding on an average, renewable energy systems can be an effective solution. Both, rural and urban areas are affected especially in summers when the temperatures reach above 40 0C. People switch to other methods of electricity production like micro gas engines, diesel engines and un-interrupt power supply (UPS) systems. However, due to the shortage of natural gas, high diesel prices, high engine maintenance costs and insufficient electricity to charge UPS batteries, people are trying to find a cheap and clean way of energy generation.
In the proposed designs, the price of equipment has been taken directly from vendors or from online shops including shipment cost to the recipient country. In addition to the equipment cost, engineering and installation cost have also been considered. The transportation of equipment from port to the site has also been included. The cost of each component and whole system is provided in annex-G.
In option # 1, in order to get maximum output from PV modules, the cleaning of PV modules will be required on daily basis or at least two times a week as Sindh is a sandy area. To accomplish this task, local labor will be required. The local labor in Pakistan is quite cheap and can easily be available. On other hand a fixed yearly maintenance is required for a new WT. In general the maintenance cost has considered same for all proposed systems.
The proposed life time of the PV modules and WT, by manufacturer, is 20 years. Inverters used in option # 3 are manufactured for life span of 20 years [26]. The auxiliary equipment like battery does not work for more than 5 years even in ideal conditions. The battery bank has a big share in the overall cost of the proposed systems. The life of a battery will not be more than three years at this site condition therefore the battery bank will be required to replace after every three years. As battery bank is being used in all proposed systems, so the only factor that can change the cost calculation per 20 years life is the number and size of the batteries.

22
5 Results
5.1 Energy demand of village During summers, based on the active hours of electricity consumption of the electric appliances in a house, the total day time requirement for a single house was estimated to be 1.3 kWh during the day and 2 kWh during the night per 24 hrs time period. The total day time load requirement, for 20 houses, was then calculated to be 26 kWh/day and for the night to be 37 kWh/day. The total electrical energy requirement for the village over the period of 24 hrs was estimated to be around 63 kWh/day.
While based on the electricity consumption hours of a house, during a winter day, the total day and night time electricity requirements are estimated to be 1 kWh and 1 kWh for a single house, respectively. This gives a total day time load requirement of 19 kWh/day and 22 kWh/day for night time for 20 houses. The total energy demand of the village houses over the period of 24hrs is calculated to be 42 kWh/day.
The electrical energy requirement of the community center has estimated to be 0.05 kWh/day during day time and 0.1 kWh/day at night time, summing up to the total load demand of 0.16 kWh/day.
Electrical energy needed by mosque is calculated to be of 0.15 kWh/day during day time and 0.22 kWh/day during night time, which gives the total requirement of 0.4 kWh/day. While, the overall energy consumption of toilets are 0.04 kWh/day.
The detailed calculation of energy demand can be found in annex-A. The overall energy demand is shown in Fig. 22.
Fig. 22 – Day and night load distribution in summer and winter
5.2 System design Based on available data and site conditions three designs are proposed;
0
10
20
30
40
50
60
70
Summer Winter
Estimated Energy demand of village
Night time Load in kWh/day
Day time Load in kWh/day

23
5.2.1 Option #1
This proposal consists of PV modules with battery backup. The block diagram of the design is provided in fig. 23. The energy required, from PV module, at day time has been estimated to be 26 kWh/day and by battery bank is calculated to be 57.6 kWh which gives the net requirement of 84 kWh/day or 17 kW, refer to annex-C. As per calculation sheet, available in annex-B, the required battery bank size, to carry out night time electricity demand, is 28.9 kAh and the proposed battery bank size is 29 kAh.
An arrangement of 80 PV modules of 240 W capacity each has been made with five 4 kW off grid type inverters which gives the output of 20 kW and 24 cells of 1200 Ah, 2V, has been selected to produce 29 kAh. The single line diagram of this system is provided in annex-H. The data sheet of the equipment used in this system is enclosed in annex I.
Fig. 23- Block diagram of PV module with battery backup system (option # 1)
The distance between two adjacent rows of PV modules are calculated to be 1.4 meters. Since the PV module is tilted at an angle of 24.70 so the horizontal distance covered by PV panel would be 0.9 meters. The minimum distance required between two rows is 0.47 meters. This arrangement is shown in below Fig. 24.
Inverter
Battery bank PV Modules
Loads AC line DC line
DC line
476cm Z
α

24
Fig. 24- PV module placement scheme
5.2.2 Option #2
The requirement of the village is estimated to be 62 kWh/day that needs a WT to produce at least 2.5 kW at rated wind speed.
From annex-D, the estimated average power output from a WT of 10 kW at height of 10 meters is 1.1 kW and same calculation has been repeated for 15 meters height, which gives the average output of 1.6 kW. Another WT of 20 kW, with rated wind speed of 10 m/s and swept area of 78.5 sq - meter is selected at height of 10 meters; it gives the output of 2 kW, that is not enough for the calculated load. The output of 20 kW WT at 15 meter height is then calculated which turned to be 3.5 kW which is more than the energy demand but excess energy can be used to charge batteries and these batteries can be rented to the locals and the people who live in nearby villages. The battery bank size for the backup energy is 7 kAh which needs 12 batteries of 550 Ah, 2V. Below, fig. 25 shows the block diagram of the proposed system.
Fig. 25- Block diagram of WT with battery backup system (option # 2)
The connection diagram of this system is provided in annex-H. The technical details of the components can be found in annex I.
5.2.3 Option #3
As discussed in annex-E, 5.5 kW are required to be produced by PV system to cater the load requirement. This design consists of 24 PV modules of 240W each with a 2 kW battery inverter and two 3 kW grid tied inverter with a 10 kW WT and 12 cells of 600 Ah, 2 V. The system will be capable of producing 5.8 kW from PV system, 1.1 kW from WT and 7.2 kAh from battery bank. The block diagram of the offered system is provided in fig. 26.
The rest of the calculation for placement of PV modules and spacing between arrays has done as per Annex-F. The Single line diagram of the system is given in annex-H. The technical specification of the equipment used in this system is provided in annex I.
Battery bank Charge controller Wind Turbine
Loads
Built in inverter

25
Fig. 26- Block diagram of Hybrid system (option # 3) (taken from SMA catalogue)
5.3 Cost calculation Option # 1
The PV modules contribute the most in the initial cost of the system. The cost of the PV modules is taken as $ 2 /watt. The price of each 4 kW off grid inverter is $ 3,000. The cost of each 1200 Ah battery is $ 750. The detail of other equipment cost has been provided in annex-G. The initial investment required for option #1 is US $ 73,300.
Option # 2
In this design the major portion of the initial investment goes for WT that is $50,000 for 20 kW rated power. The required cost of the tower for this WT and 12 x 550 Ah batteries is taken as $ 330 and 6,600 respectively. The amount required to construct the foundation would be equal to $ 2,000. With all other components and costs, the initial investment required for this design is US $ 64,000.
Option # 3
The PV modules and wind turbines are the equipment which are most expensive used in this design. The per watt price of PV module is taken as $ 2 while the cost of 10 kW WT is $ 24,000. The price of a 600 Ah, 2V battery is taken as $ 375. The foundation construction will cost around $ 1,500. The combined cost of all equipment required in this system is US $ 56,500.
The capital cost of proposed systems is provided in Fig. 27.

26
Fig. 27 – Capital cost of proposed systems
Sensitivity Analysis Unfortunately no wind data is available for the Sajawal area. Although two data sets are available for wind energy calculations, recorded at Gharo area which is almost 40 km away from Sajawal but both are located in wind corridor. One set of data, has recorded in year 2002 provides the wind speed at every minute throughout the year but the data for month of April is not available. Excluding the month of April and taking average of 11 months gives the average wind speed of 6.1 m/s at 50 meters height.
The second set of data is new and seems reliable as other wind studies for this area refer to second set of data and provide similar figures. It provides the monthly average wind speed of Gharo area at 50 meters height to be 7m/sec.
The calculations are based on second set of data which seems more reliable than 1st set of data. The difference in the data is may be due to error in equipment, improper installation, fault in data logger, error in reading, lack of technical knowledge etc.
The designed life time of PV modules and WT is 20 years. However the life of a battery for site under observation is not more than 3 years so it needs to be replaced by new ones after every three years. The price of battery for option #1, 2 and 3 are $ 18,000, $ 4,000 and $ 4,500 respectively. After 20 years, the overall cost of the systems due to battery replacement after every three years would be $ 181,300, $ 87,500 and $ 83,500 for option # 1, 2 and 3 respectively.
0
10000
20000
30000
40000
50000
60000
70000
80000
Option # 1 Option # 2 Option # 3
Capital cost Comparision of offered systems in US $
Option # 1
Option # 2
Option # 3

27
6 Discussion & Future extension In this report, three scenarios are discussed to electrify the village. However until now technical and financial aspect of the systems are discussed. The aim of the project also includes the sustainability factor. The system is said to be sustainable if it is economical, social and environmentally viable [29].
The proposed systems are using renewable energy resources which are considered being environmental friendly. There is a chance that installation of WT or PV system at site can create an obstacle for the locals and their cattle. As the village is surrounded by fields so the installation of PV system or WT can annihilate the fields.
Another important fact is that the excessive charging of battery can electrolyze the water to produce hydrogen and oxygen. In case of malfunctioning of the pressure relief valve can result the explosion of battery. The recycling of batteries is also a main issue in this area. Transportation of equipment to the site will also contribute in CO2 emissions.
The per unit energy price of any of the proposed system is far more than the price of electricity sold by the government of Pakistan but due to the shortage and unavailability of electricity proposed three systems are more sustainable than any other cheap conventional thermal energy system.
Installation of this system will help the renewable energy development in Pakistan as it is not as common as it is in Europe. It can also be treated as a demo village and these designs can also be used to electrify other villages of Pakistan. The technical training to the locals, of the installed system, can increase their overall knowledge and can be useful for them to get a job somewhere else related to this system.
The proposed systems can be improved by introducing energy meters with a miniature circuit breaker (MCB) for each house to calculate their energy usage and cut off the supply in case of over usage of energy. This arrangement can be used to sell electricity.
Another arrangement can be done in the future, of portable energy system with availability of portable rechargeable batteries on rent to the village under consideration and to the neighboring villages.

28
7 Summary and Conclusions In this study, the basic necessities of a flood affected village in Sajawal, Pakistan were identified based on the site visits and interviews where clean drinking water, energy for cooking and electricity were found to be the most important ones. It was observed that the inhabitants were pumping water from the water table below whereas wood and dried animal dung was used as fuel resources for cooking purpose as an example. Electricity, however, was identified to be the major and utmost important requirement for the area. From the visits and survey; mosque, houses, community center, toilets and street lights were identified to be places where electricity was required. To fulfill the electrical energy demand of the village, three options have been proposed that utilize the available renewable energy resources to generate electricity namely solar (option 1), wind (option 2) and hybrid solar and wind (option 3).
Option 1 is to avail the solar energy, which is quite abundant in the Sajawal area throughout the year, by using PV modules with a battery backup for the night time. Utilizing sun light is a good option for electricity generation as no fuel cost is involved. However, the costing calculation showed that the initial cost of this system was quite high due to the high costs of the PV module and batteries. Advantage with this system is easy maintenance and repair. Sajawal district lies in a wind corridor which gives it an advantage of generating electricity using the WT with battery backup in case wind speed is not sufficient to cater the load requirements. The load requirement was found to be quite small which demanded for a small WT that operates at lower height. The initial cost for this option 2 was determined to be lesser than the option 1 where PV module was used for the electricity generation. This system is also easy to repair and maintain. Option 3 is to use both solar and wind energy using hybrid arrangement of PV module and wind turbine. This system has an advantage of having small battery backup, PV module and WT. However, the system becomes complex due to usage of more components making maintain and repair difficult. Interestingly, the capital cost required for this option was determined to be the most economical when compared to option 1 and 2. This system also has an advantage of benefiting from both renewable energy resources and battery backup in case one needs maintenance or is inadequate.
Option 1, solar system, was found to be the most expensive option when battery replacements (every 3 years) were considered over a 20 years life time. Option 3, hybrid wind and solar system, was concluded to be the most economical solution for the Goth Mehdi farms.
The primary energy resources are depleting and many countries in the world are facing energy problems due to high fuel costs. The developed countries have already started exploring and benefiting from the renewable energies. It is of greatest interest for the developing countries like Pakistan to adopt such practices to overcome the energy crises in the country. Renewable options can also help in saving the environment and natural resources and reducing costs.

29
8 Bibliography [1] Luis M.A., Ramon A.O. and Galarraga I. 2012. Determinants of energy efficiency investments in the US. Energy Policy Vol.45, pp 551–566.
[2]Nayyer Z.A., Zaigham N.A. and Qadeer A. 2014. Assessment of present conventional and non-conventional energy scenario of Pakistan. Renewable and Sustainable Energy Reviews Vol. 31, pp 543–553.
[3] Józef P. and Tomasz S. 2013. Electricity generation from renewable energy sources in Poland. Renewable energy Vol. 71, pp 286-294.
[4] Andreas W. 1994. Electricity generation from renewable energy sources in Germany — Potentials, costs and implementation strategies. Renewable energy Vol. 5 (5-8), pp 1390-1393.
[5] Richard S. 2011. Evaluating Policies to Increase Electricity Generation from Renewable Energy. Review of Environmental Economics and Policy Vol. 1 (5), pp 45-64.
[6] Hepbasli A. 2008. A key review on exergetic analysis and assessment of renewable energy resources for a sustainable future. Renewable and Sustainable Energy Reviews Vol. 12 (3), pp. 593–661.
[7] Flavin C. and Lenssen N. 1991. A Renewable Energy. Environmental Science and Technology Vol. 25 (5), pp 834–837.
[8] Klessmann C., Held A., Rathmann M. and Ragwitz M. 2011. Status and perspectives of renewable energy policy and deployment in the European Union—what is needed to reach the 2020 targets? Energy Policy Vol. 39 (12), pp 7637–7657.
[9] Industry of Pakistan. (Accessed: 15 July, 2014) http://en.wikipedia.org/wiki/Industry_of_Pakistan
[10] Mohammed A. G. 1995. The energy supply situation in the rural sector of pakistan and the potential of renewable energy technologies, Renewable Energy Vol. 6 (8), pp 941-976.
[11] Khanji H., Mohammad A.U. and Umar K..M. 2015. Assessment of Solar PV Power Generation Potential in Pakistan. Journal of Clean Energy Technologies, Vol. 3 (1), pp 54-56.
[12] Asif M. 2009. Sustainable Energy options for Pakistan, Renewable and Sustainable Energy Reviews Vol. 13 (4), pp 903-909.
[13] Qamar Z.C. and Afzal M. 2004. The Establishment of Commercial Wind Power Plant of 18MW at Ghar. Pakistan Meteorological Department, Technical Report No. PMD-11/2004. Islamabad.
[14] Mohammed G.D. 1995. Energy situation in Pakistan: options and issues, Renewable Energy Vol. 6 (2), pp 151-157.
[15] Pakistan renewable energy Society. (Accessed: 5 February, 2014) http http://www.pres.org.pk/thematic-areas/wind/
[16] Naseem A. 2014. Biomass Energy Potential in Pakistan, Bio energy consult. (Accessed: 5 February, 2014). http://www.bioenergyconsult.com/biomass-pakistan/
[17] Aftab A.K.S. Hydel Power potential. NEPRA. Pakistan. (Accessed: 29 February, 2014) http://www.nepra.org.pk/Policies/Hydel%20Potential%20in%20Pakistan.pdf
[18] Miriam K. The Feasibility Of Renewable Energy In Pakistan. Triple Bottom line. (Accessed: 20 April, 2014) http://www.tbl.com.pk/the-feasibility-of-renewable-energy-in-pakistan/
[19] Mubarik K. 2013. Solar Power in Pakistan. The diplomat. (Accessed: 19 April, 2014) http://thediplomat.com/2013/10/solar-power-in-pakistan/
[20] Solar power in Pakistan (Accessed: 2 February, 2014) http://en.wikipedia.org/wiki/Solar_power_in_Pakistan

30
[21] Imtiaz A. Sindh wants AEDB role in wind energy reduced, Dawn News (Accessed: 29 March, 2014) http://www.dawn.com/news/1039893
[22] Wind Energy in Pakistan. AEDB. (Accessed: 7 February, 2014) http://www.aedb.org/currstatus.htm
[23] Sujawal District (Accessed: 4 February, 2014) http://en.wikipedia.org/wiki/Sujawal_District
[24] Kate A. 2011 World water day- updates from Pakistan, IRC. (Accessed: 7 April, 2014) http://www.rescue.org/blog/world-water-day-update-pakistan
[25] Cow dung, (Accessed: 19 April, 2014) http://en.wikipedia.org/wiki/Cow_dung
[26] SMA inverter, (Accessed: 18 February, 2014) http://www.pvpower.com/smainvertersoverview.html
[27] Khan H. A. and Pervaiz S. 2013. Technological review on solar PV in Pakistan: scope, practices and recommendations for optimized system design. Renewable and Sustainable Energy Reviews Vol. 23, pp 147-154. [28] IP KY. 2007. Renewable energy solutions for the built environment in dense Urban cities. MEng Dissertation. The Hong Kong Polytechnic University.
[29] Ralph H., Harald A.M. and Peter F. 2012. Principal sustainability components: empirical analysis of synergies between the three pillars of sustainability. International Journal of Sustainable Development & World Ecology Vol. 19 (5), pp. 451–459.

31
Annex - A
LOAD DETAILS
No. of houses 20
No. of rooms 20
Kitchen 20
Mosque 1
Community Center 1
Toilets 12
street light 11
Load details per house in summer
Appliances wattage Qty Total operation hrs/day
operation hrs/night
Total Wh/day
Total Wh/night
Light for room 3 1 3 0 3 0 9 Light for kitchen 2 1 2 0 1 0 2 Fan 50 1 50 6 14 300 700 Mobile charger 5 1 5 2 2 10 10 TV 120 1 120 2 3 240 360 Refrigerator 120 1 120 6 6 720 720
Total
1270 1801
For 20 houses 25400 36020 61420 Wh/day
Load details per house in winter
Appliances wattage Qty Total operation hrs/day
operation hrs/night
Total Wh/day
Total Wh/night
Light for room 3 1 3 0 4 0 12 Light for kitchen 2 1 2 0 2 0 4 Fan 50 1 50 0 0 0 0 Mobile charger 5 1 5 2 2 10 10 TV 120 1 120 2 3 240 360 Refrigerator 120 1 120 6 6 720 720
Total
970 1106
For 20 houses 19400 22120 41520 Wh/day

32
Load details of Community Center
Appliances wattage Qty Total operation hrs/day
operation hrs/night
Total Wh/day
Total Wh/night
Lights 3 3 9 0 1 0 9 Fan 50 2 100 0.5 1 50 100
Total
50 109 159 Wh/day
Load details of Mosque
Appliances wattage Qty Total operation hrs/day
operation hrs/night
Total Wh/day
Total Wh/night
Lights 3 2 6 0 3 0 18 Fan 50 2 100 1.5 2 150 200
Total
150 218 368 Wh/day
Load details for Toilets
Appliances wattage Qty Total operation hrs/day
operation hrs/night
Total Wh/day
Total Wh/night
Lights 3 12 36 0 1 0 36
Total
0 36 36 Wh/day
Load details for Street Lighting
Appliances wattage Qty Total operation hrs/day
operation hrs/night
Total Wh/day
Total Wh/night
Lights 9 11 99 0 7 0 693
Total
0 693 693 Wh/day
Total KWh/day required in summer 25.918 37 = 62.7
kWh/day
Total KWh/day required in winter 19.6 23 = 42.7
kWh/day
Annex – B

33
BATTERY SIZING CALCULATION
Summers
Amount of energy to be stored in batteries
36.482 KWh/day battery voltage level (V)
24 V
Efficiency of battery
80 % Allowable DOD
80 %
Required battery bank rating (Ah)
28502 Ah No. of batteries required
24
Alpha Cell OPzV 1200/2V
28800 Ah Total energy required by battery bank
57.6 KWh
Winters
Amount of energy to be stored in batteries
22.582 KWh/day battery voltage level (V)
24 V
Effeciency of battery
80 % Allowable DOD
80 %
Required battery bank rating (Ah)
1470.182 Ah No. of batteries required
12
Alpha Cell OPzV 120/2V
1440 Ah Total energy required by battery bank
34.56 KWh

34
Annex - C
PV SYSTEM SIZING
Summers Loads
Energy required in day time 25.918
Energy required by battery bank 57.6
Total energy to be produced 83.518 KWh/day
Sun is available for 9 hrs 9.279778 KW
Output from PV module factor 13.25683
Other losses
16.57103 KW
Solarworld 240W PV module
No of PV modules
80 PV system requirement 19.2 KW
Winters Load
Energy required in day time 19.918
Energy required by battery bank 34.56
Total energy to be produced 54.478 KWh/day
Sun is available for 7 hrs 7.782571 KW
Output from PV module factor 11.11796
Other losses
13.89745 KW
Solarworld 240W PV module
No of PV modules
56 PV system requirement 13.44 KW

35
Annex - D
WIND TURBINE SIZING
MONTHLY AVERAGE WIND SPEEDS FOR GHARO[7]
Month Monthly Benchmark Wind Speed 10m 15m 30m 50m 60m 67m 80m January 1.8 2.9 3.52 4.5 5.2 5.3 5.4 February 2.3 3.4 4.08 5.08 5.5 5.6 5.7 March 2.5 3.4 4.17 5.1 5.8 5.9 5.9 april 3.9 4.9 5.96 7.14 7.4 7.6 7.6 May 6.6 7.5 9.14 10.58 9.6 9.7 9.8 June 5.8 6.4 7.79 8.95 11.1 11.2 11.3 July 7.2 8.2 9.91 11.34 9 9.2 9.2 August 5.1 5.6 6.86 7.9 10 10.2 10.3 September 5.5 6.2 7.55 8.75 8.2 8.3 8.4 October 1.8 5.5 6.7 4.73 4.7 4.7 4.8 November 1.5 2.6 3.11 3.96 4.2 4.3 4.4 December 1.8 2.9 3.54 4.47 5.1 5.2 5.3
Total energy requirement
62.4 KWh/day
CE&P 10KW WT Rated wind speed
11 m/s Rotor swept area
30 m2
density of air
1.22 kg/m3 Power available in
wind
24.3573 KW WT rated power 10 KW Coeffecient of Power (Cp) 0.410555

36
At 10m Height
Wind speed Power available in wind Power from WT 3.5 784.61 0.32 3.7 926.95 0.38 3.9 1085.54 0.45 5.1 2427.51 1.00 6.5 5025.64 2.06 7.6 8033.26 3.30 6.2 4361.40 1.79 6.8 5754.11 2.36 5.6 3213.77 1.32 3.2 599.65 0.25 2.8 401.72 0.16 3.4 719.26 0.30
Average power 1.14 KW At 15m Height
Wind speed Power available in wind Power from WT 2.9 445.88 0.18 3.4 694.33 0.29 3.4 741.30 0.30 4.9 2164.34 0.89 7.5 7805.93 3.20 6.4 4832.79 1.98 8.2 9949.63 4.08 5.6 3300.34 1.35 6.2 4399.74 1.81 5.5 3074.75 1.26 2.6 307.52 0.13 2.9 453.52 0.19
Average power 1.31 KW
Polaris 20KW WT Rated wind speed
10 m/s Rotor swept area
78.5 m2
density of air
1.22 kg/m3 Power available in
wind
47.885 KW WT rated power 20 KW Coeffecient of Power (Cp) 0.417667
37
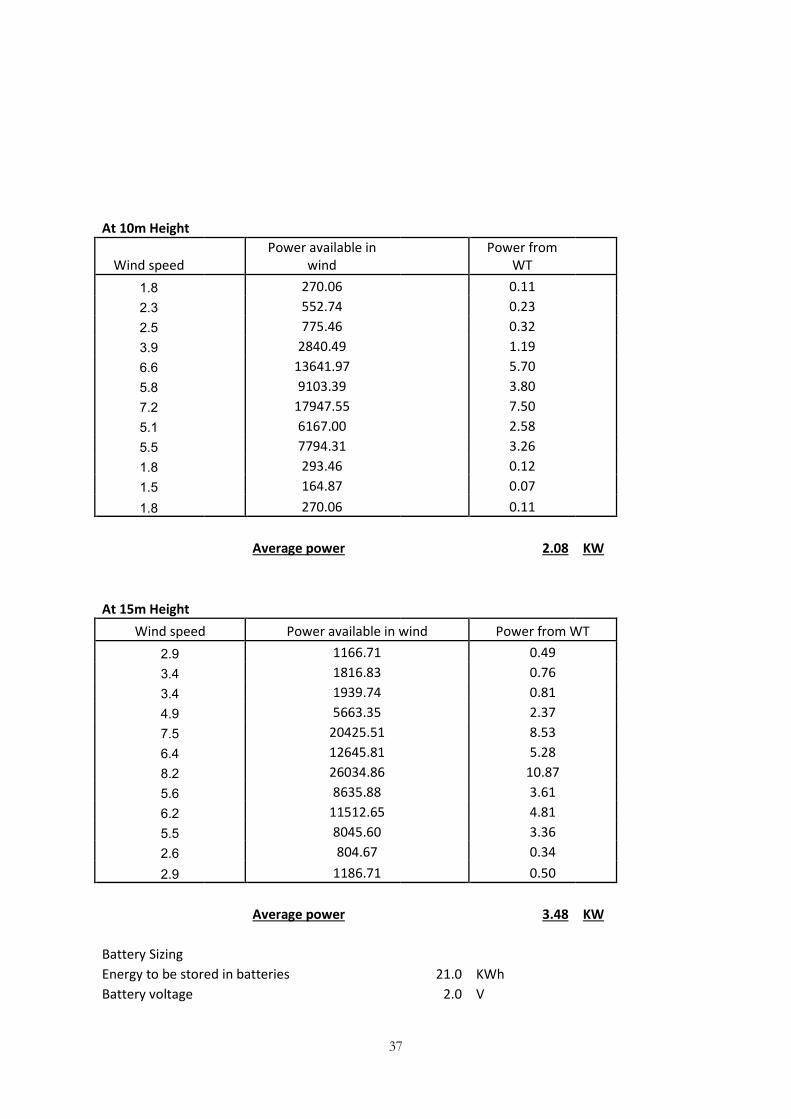
At 10m Height
Wind speed
Power available in wind
Power from WT
1.8 270.06 0.11 2.3 552.74 0.23 2.5 775.46 0.32 3.9 2840.49 1.19 6.6 13641.97 5.70 5.8 9103.39 3.80 7.2 17947.55 7.50 5.1 6167.00 2.58 5.5 7794.31 3.26 1.8 293.46 0.12 1.5 164.87 0.07 1.8 270.06 0.11
Average power 2.08 KW
At 15m Height
Wind speed Power available in wind Power from WT 2.9 1166.71 0.49 3.4 1816.83 0.76 3.4 1939.74 0.81 4.9 5663.35 2.37 7.5 20425.51 8.53 6.4 12645.81 5.28 8.2 26034.86 10.87 5.6 8635.88 3.61 6.2 11512.65 4.81 5.5 8045.60 3.36 2.6 804.67 0.34 2.9 1186.71 0.50
Average power 3.48 KW
Battery Sizing Energy to be stored in batteries 21.0 KWh
Battery voltage
2.0 V

38
Required Ah of battery
10515.9 Ah Efficiency and DOD factor 6730 Ah No. of batteries
12
Battery ratings
550 Ah Charge controller
18 A

39
Annex – E
HYBRID SYSTEM CALCULATION
Summers Loads
Energy required in day time 25.9 KWh/day Energy required at night time 36.5 KWh/day Total energy to be produced 62.4 KWh/day
PV system sizing Availability of sun durind the day 9.0 hrs
Energy to be produced by PV system 2.9 KW Output from PV module factor 4.4 KW Other electrical losses factor 5.5 KW SolarWorld PV module rating 240
No of PV modules 24 PV system requirement 5.8 KW
Wind Energy System (From Annex-D )
Output produced by 10KW WT at 10 m height 1.1 KW Energy produced by WT 27.4 KWh/day
Battery Bank Sizing Battery Bank requirement 9.1 KWh/day
Required rating in Ah 4556 Ah Effeciency of battery 80 % Allowable DOD 80 % Required battery bank rating (Ah) 7118 Ah 300Ah, 2V batteries 12
Energy produced by batteries 7200 KWh/day

40
Annex - F
PV PANEL SPACING CALCULATION
City Latitude
Sajawal 24.69
A Collector Angle of Inclination 24.69
Can be Latitude +/- 15 degrees
B Solar Angle 41.81 H Collector height in Meters (constant) 1.001
1.3756 Z Length in Meters between panel base points 1.3770
Length in Feet between panel base points 4.5176
*Additional spacing should be added between panels as seen
fit by the engineering and site staff
Formula :- Z/H = Sin(180°- (α + β)) / Sin β

41
Annex - G
COSTING
years
System Equipment
Initial investment (US$) 3 6 9 12 15 18 Total
1 PV system PV modules 38400
Mounting structure + Dist box 320
Batteries 18000
Inverter 12000
Cabling + Connectors 3000
Battery racks 50
Engineering & installation 1500
Total 73270 18000 18000 18000 18000 18000 18000 181,270
2
Wind Energy Wind Turbine 50000
Tower 3500
AC panel 500
Foundation 2000
Battery 3960
Charge controller 700
Cabling 1500
Battery racks 50
Engineering & Installation 1500
Total 63710 3960 3960 3960 3960 3960 3960
87,470
3
Hybrid System PV modules 11520
Wind Turbine 24000
Tower 3100
Foundation 1500
Mounting structure + Dist box 96
Batteries 4500
Inverter Off Grid 3300
Inverter battery 1300
Cabling + Connectors 4000
Battery racks 25

42
Engineering & installation 2500
Total 55841 4500 4500 4500 4500 4500 4500 82,841

43
Annex – H
Single line diagram of proposed systems
a) Option no. 1 b) Option no. 2 c) Option no. 3

44
Annex – I
DATA SHEETS OF COMPONENTS
1. PV modules 2. Wind Turbine 3. Inverters 4. Batteries 5. Charge Controller

www.solarworld‑global.com
SW 225/230/235/240 monoGerman quality standardsFully‑automated production lines and seamless monitoring of the process and material ensure the quality that the company sets as its benchmark for its sites worldwide.
Outstanding productsIn Photon test laboratory's endurance test SolarWorld's modules occupied first place in 2008 and in 2009.
SolarWorld Plus‑sortingPlus‑sorting guarantees the highest system efficiency. Only modules that achieve the designated nominal performance or greater in performance tests are despatched.
25 years linear performance guarantee*SolarWorld guarantees a maximum degression in performance of 0.7% p.a. for more than 25 years – a clear additional benefit compared with the conventional two‑stage industry guarantees. In addition, there is a product warranty that covers 5 years.
*in accordance with the applicable SolarWorld service certificate at purchase www.solarworld‑global.com/service‑certificate
The independent Photon magazinecon�rms: SolarWorld is test
winner. Up to 10% more yield!
2008PHOTON MODULE TEST
TEST WINNER
The independent Photon magazinecon�rms: SolarWorld is test
winner. Up to 12% more yield!
2009PHOTON MODULE TEST
TEST WINNER
Length 1675 mmWidth 1001 mm
Height 31 mm1)
Frame AluminumWeight 21,2 kg
23.0
7.201
0 EN
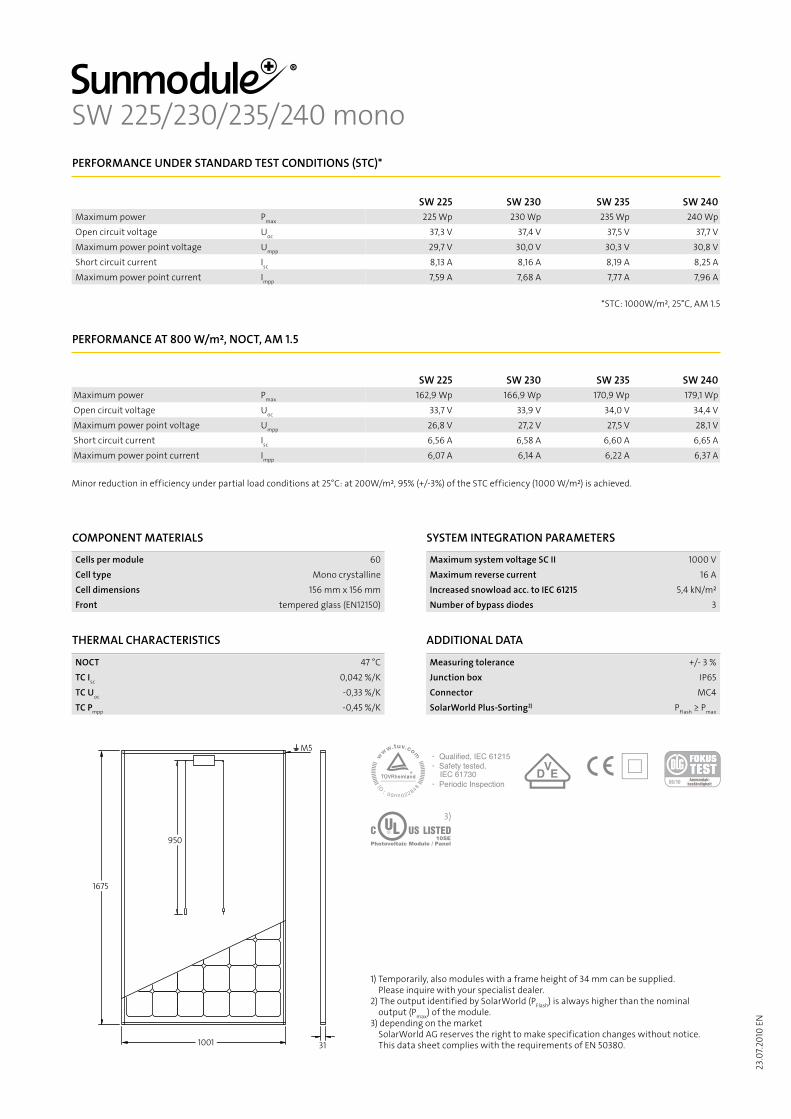
SW 225/230/235/240 monoPERFORMANCE UNDER STANDARD TEST CONDITIONS (STC)*
Maximum power Pmax
Open circuit voltage Uoc
Maximum power point voltage Umpp
Short circuit current Isc
Maximum power point current Impp
SW 225 SW 230 SW 235 SW 240225 Wp 230 Wp 235 Wp 240 Wp
37,3 V 37,4 V 37,5 V 37,7 V29,7 V 30,0 V 30,3 V 30,8 V8,13 A 8,16 A 8,19 A 8,25 A7,59 A 7,68 A 7,77 A 7,96 A
*STC: 1000W/m², 25°C, AM 1.5
PERFORMANCE AT 800 W/m², NOCT, AM 1.5
Maximum power Pmax
Open circuit voltage Uoc
Maximum power point voltage Umpp
Short circuit current Isc
Maximum power point current Impp
SW 225 SW 230 SW 235 SW 240162,9 Wp 166,9 Wp 170,9 Wp 179,1 Wp
33,7 V 33,9 V 34,0 V 34,4 V26,8 V 27,2 V 27,5 V 28,1 V6,56 A 6,58 A 6,60 A 6,65 A6,07 A 6,14 A 6,22 A 6,37 A
Minor reduction in efficiency under partial load conditions at 25°C: at 200W/m², 95% (+/‑3%) of the STC efficiency (1000 W/m²) is achieved.
COMPONENT MATERIALS
Cells per module 60Cell type Mono crystallineCell dimensions 156 mm x 156 mmFront tempered glass (EN12150)
SYSTEM INTEGRATION PARAMETERS
Maximum system voltage SC II 1000 VMaximum reverse current 16 AIncreased snowload acc. to IEC 61215 5,4 kN/m²Number of bypass diodes 3
THERMAL CHARACTERISTICS
NOCT 47 °CTC Isc 0,042 %/KTC Uoc ‑0,33 %/KTC Pmpp ‑0,45 %/K
ADDITIONAL DATA
Measuring tolerance +/‑ 3 %Junction box IP65Connector MC4SolarWorld Plus‑Sorting2) PFlash ≥ Pmax
1675
950
1001
M5
31
3)
Photovoltaic Module / Panel10SE
1) Temporarily, also modules with a frame height of 34 mm can be supplied. Please inquire with your specialist dealer.
2) The output identified by SolarWorld (PFlash) is always higher than the nominal output (Pmax) of the module.
3) depending on the marketSolarWorld AG reserves the right to make specification changes without notice. This data sheet complies with the requirements of EN 50380.

CAL-EPOWER 10 kW Vertical Axis Wind Turbine Statistics General Annual Power Generation At 10 mph (4.5 m/s) 10,000 kwh, at 15 mph (6.7 m/s) 35,000 kwh, at 20 mph (9m/s) 53,000 kwh.
At rated wind speed, 25 mph (11 m/s) 65,000 kwh (given a Rayleigh distribution of wind speeds)
Rated Power 10 kW (10,000 Watts) @ 11 m/s, 12 kW Max
Total Weight 4,000 pounds without tower
Total Height (w/ 15’ Tower) 52 ft (16m)
Turbine Turbine Type Hybrid Savonius / Darrieus vertical axis wind turbine with wind concentrator
Turbine Material Advanced pultruded plastic composites and marine-grade stainless steel
Turbine Color Green, custom colors available
Direction of Rotation Counter-clockwise
Swept Area 323 sq ft (30 sq m)
Rated Speed 11 m/s (25 mph)
Turbine Height 33 ft (10 m)
Turbine Width 10 ft (3 m)
Tip Speed Ratio 50-70%
Concentrator Concentrator Material Advanced pultruded plastic composites and marine-grade stainless steel
Concentrator Height 36 ft (11 m)
Concentrator Width 7 ft (2 m)
Number of Concentrators 1
Electrical Components Inverter Certification UL certification 1741, IEEE 1547, IEEE standard 519-1992
Generator High efficiency air cooled brushless, belt-drive, 12 kW permanent magnet generator
Inverter Integrated, grid tie 208 or 480 VAC 3 phase
Inverter Output 208 or 480 VAC, 3 phase, 60 Hz
Wind Ratings Survival Wind Speed 120 mph (54 m/s) Class 1, IEC Standards
Rated Wind Speed 25 mph (11 m/s)
Cut-in Wind Speed 5 mph (2 m/s)
Foundation Included No
Type Site-dependent
Dimensions Site-dependent
Other Noise Level 50 db (Level of quiet suburban neighborhood)
Warranty 5 year limited, extended contracts available
Standard Engineered in accordance with international standards: IEC 61400-2: Design requirements for small
wind turbines
The Cal ePower 10 kW Wind Turbine
Patent Pending
™
The Cal-ePower 10 kW Wind Turbine Patent #: US 7,744,338
0.0
2.0
4.0
6.0
8.0
10.0
12.0
Po
we
r (k
W)
CE&P Power Curve vs. Other Wind Turbines < 12 kW
CE&P 10 kW Urban Green Energy 10 kW Quiet Revolution 6 kW
Windspire 1.2 kW Gaia Wind 11 kW Bergey Excel 10 kW- S/60-sh3052
Bergey Excel 10 kW- S/60-bw03 Skystream 2.4 kW WePower Falcon 12 kW
Wind Speed m/s (mph)

0.0
2.0
4.0
6.0
8.0
10.0
12.0
Po
wer
(kW
)
CE&P 10 kW Power Curve
Wind Speed m/s (mph)
3** wvAP
$0.00
$5,000.00
$10,000.00
$15,000.00
$20,000.00
$25,000.00
$30,000.00
$35,000.00
$40,000.00
$45,000.00
$50,000.00
$55,000.00
$60,000.00
1 2 3 4 5 6 7 8 9 10 11 12 13 14 15
Ye
arl
y P
ayb
ack p
er
Tu
rbin
e
Average Annual Wind Speed (m/s)
Yearly ROI per CE&P 10 kW Turbine$0.75
$0.70
$0.65
$0.60
$0.55
$0.50
$0.45
$0.40
$0.35
$0.30
$0.25
$0.20
$0.15
$0.10
$0.05
Aerospace-Inspired Technology
Benefits over Competition Highly efficient (30% +) Distributed generation Power produced 5-70 mph Survives winds up to 120 mph Built to last a lifetime (20 years) Low operation & maintenance costs Higher energy density (40 kW/acre vs. 17 kW/acre) Silent operation - even at high speeds and loadings Reduced visual impact means greater public acceptance Minimizes transmission losses; plugs directly into local grid Low profile (<55 ft) = build where taller structures are prohibited
There are no reported bird or bat kills by the CE&P vertical-axis turbine
California Energy & Power’s foundation
is in the aerospace industry. Our Chief
Engineer and President have over 50
years combined experience producing
aerospace components. Their past
projects included many innovative
space and aircraft designs made for
the leading aerospace companies.
To augment our in-house expertise,
we are collaborating with an excellent
team of scientists from the Caltech
Graduate Aeronautical Laboratories in
the ongoing design, testing and
validation of the California Energy &
Power 10 K vertical-axis wind turbine.
If You Have the Wind….
We Have the Way
Because the power in the wind (Pt) increases with the cube
of the wind velocity (vw), high average annual wind speeds
(over 10 m/s), lead to quick payback on your CE&P turbine.
Adaptable Control System
Our unique rotor and concentrator designs make this turbine adaptable to a wide variety of wind
environments. An onboard computer analyses input from the wind vane, anemometer and turbine RPM,
computes how best to optimize power production, and moves the concentrator accordingly, constantly
adjusting it to point into the oncoming wind: If the wind speed is low, the concentrator shifts to increase
the wind velocity into the turbine. Upon achieving optimum power production, the concentrator
constantly adjusts to maintain this output. If RPM gets too high, the concentrator shifts in front of the
blades, reducing the wind into the turbine to maintain a safe operating RPM. At wind speeds above 70
mph, the concentrator moves to block wind completely from the blades and two sets of brakes engage to
stop the turbine. In this manner, we can maintain power production at wind speeds ranging from five to
70 mph – a range that far exceeds any proven wind turbine technology available.
CE&P Adaptable Control System
Power Production With the CE&P turbine, you get high power production over a wider range of wind speeds than other turbines.
Custom Installations We can customize each installation – changing the number of turbines to suit your power needs.
Quick Returns
CE&P wind turbines offer very attractive investment payback periods. A wind environment of at least 11 m/s enables cost recovery in less than five years. Combine this with high energy prices and payback can be achieved in just over two years without subsidies!
For more information, see our website: www.cal-epower.com

The GEO Solar Combi is the ideal solution for off-grid and grid back-up systems. It is a powerful all-in-one solution, delivers unsurpassed clean true sine wave output power and combine with a selectable multistage battery charging current. Applicable for any kinds of load such as home applications, consumer electronic and office equipments. The compact and modular design make utility interactive installations easier and more cost effective. It is a high quality product that offers the best price/ performance ratio in the industry.
GEOPROTEK Solar CombiOff-Grid Solar Inverter, charger,transfer switch and solar power source in one1kW, 1.8kW, 2.5kW, 4kW pure sine wave inverter
Solar PV Array
GS Combi Application
Generator

GSI-1012 / GSI-1012U GSI-1824 / GSI-1824UGSI-2524 / GSI-
2524UGSI-4048 / GSI-4048U
Nominal AC Output Voltage 230VAC Pure Sine Wave / 110VAC Pure Sine Wave
Nominal Output Frequency 50Hz(220VAC) / 60Hz(110VAC)
Continuous AC Output 1000W 1800W 2500W 4000W
Surge Output Capacity 2000W 3600W 5000W 8000W
Output Voltage Harmonic Distortion Factor < 3%
Power Factor -1 to 1
Input AC Voltage (Range) 230VAC(175~275VAC) / 110VAC(90~130VAC)
Input AC Frequency 50Hz(220VAC) / 60Hz(110VAC)
Maximum Input Power 2500W 4500W 5500W 8500W
Maximum Input Solar DC Voltage 60VDC 150VDC
Maximum Solar Charging Current 50A
Input Battery Voltage (Range) 12VDC (10.5~15.5VDC) 24VDC (21~30.5VDC) 48VDC (41~62VDC)
Maximum Battery Charging Current 50A (adjustable)
Charging Voltage 13.8VDC 28.2VDC 28.2VDC 55.2VDC
Peak Efficiency 90%
Transfer Time 12ms
Internal Consumption with No Load (Standby) 36W (<6W) 36W (<6W) 36W (<6W) 42W (<8W)
Device Protection short-circuit, overload, over-temperature
Interface LCD Display, 5LEDs
Dimension: W x H x D (mm) 305 x 500 x 164 338 x 550 x 163
Weight 11.5 kgs 12.0 kgs 12.5 kgs 14.0 kgs
Ambient Temperature Range 0 ~ 40 °C
Relative Humidity 0 ~ 90%, non-condensing
Specification:
GEOPROTEK Tech. Inc.Tel: +886 22533-5283E-mail: [email protected]

Sunny Boy 3000TL / 3600TL / 4000TL / 5000TL SB
300
0TL-2
1 / S
B 36
00TL
-21
/ SB
4000
TL-2
1 / S
B 50
00TL
-21
Economical•Maximumefficiencyof97%•Multi-stringtechnologyinall powerclasses•Costsavingduetofewer parallelstrings•Shademanagementwith OptiTracGlobalPeak
Simple•Withoutfan•Easierwallmounting•SUNCLIXDCplug-insystem•Fastconnection,notools
required
Communicative•Simplecountryconfiguration•Bluetooth®technologyasstandard
Flexible•MaximumDCinputvoltageof
750V•Integratedgridmanagementfunc-
tionsandreactivepowerprovision
Sunny Boy 3000TL / 3600TL / 4000TL / 5000TL with Reactive Power ControlThe same. Only better. The universally usable Sunny Boy.Itallremainsthebest:ThenewtransformerlessSunnyBoyistheidealsolution,especiallyfordemandingPVarraysandpartlyshadedplants.Version21ofthesuccessfulSunnyBoyoffersafurtherarrayofadvantages.It'smoreflexibleinitsrangeofapplications,providesevenmoreefficientyields,andit'seasiertouse.ThehighDCvoltageof750Vprovestobeacostadvantage,sincefewerparallelstringsarerequired.Inaddition,theintegratedgridmanagementfunctionsmakethedevicessuitableforuniversalapplicationsandallowthemtoactivelysupportthegrid.

Sunny Boy 3000TL / 3600TL / 4000TL / 5000TLwith Reactive Power Control
Input (DC)Max.DCpower(@cosφ=1)Max.inputvoltageMPPvoltagerange/ratedinputvoltageMin.inputvoltage/initialinputvoltageMax.inputcurrentinputA/inputBMax.inputcurrentperstringinputA/inputBNumberofindependentMPPinputs/stringsperMPPinputoutput (AC)Ratedpower(@230V,50Hz)Max.apparentACpowerNominalACvoltage/range
ACpowerfrequency/rangeRatedpowerfrequency/ratedgridvoltageMax.outputcurrentPowerfactoratratedpowerDisplacementpowerfactor,adjustableFeed-inphases/connectionphasesEfficiencyMax.efficiency/EuropeanweightedefficiencyProtective devicesDCdisconnectdeviceGroundfaultmonitoring/gridmonitoringDCreversepolarityprotection/ACshort-circuitcurrentcapability/galvanicallyisolatedAll-pole-sensitiveresidual-currentmonitoringunitProtectionclass(accordingtoIEC62103)/overvoltagecategory(accordingtoIEC60664-1)General dataDimensions(W/H/D)WeightOperatingtemperaturerangeNoiseemission(typical)Self-consumption(night)TopologyCoolingconceptDegreeofprotection(accordingtoIEC60529)Climaticcategory(accordingtoIEC60721-3-4)Maximumpermissiblevalueforrelativehumidity(non-condensing)FeaturesDCconnection/ACconnectionDisplayInterface:RS485,Bluetooth,Speedwire/WebconnectMulti-functionrelay/PowerControlModuleWarranty:5/10/15/20/25yearsCertificatesandapprovals(additionalonrequest)
Version:November2013●Standardfeatures ○Optionalfeatures —Notavailable,DataatnominalconditionsTypedesignation
Technical data Sunny Boy 3000TL
Sunny Boy 3600TL
3200W750V
175V...500V/400V125V/150V15A/15A15A/15A2/A:2;B:2
3000W3000VA
220V,230V,240V/180V–280V
50Hz,60Hz/-5Hz…+5Hz50Hz/230V
16A1
0.8overexcited…0.8underexcited1/1
97%/96%
●●/●
●/●/—●
I/III
26kg(57.3lb)–25°C…+60°C(–13°F…+140°F)
25dB(A)1W
TransformerlessConvection
IP654K4H100%
SUNCLIX/SpringclampterminalGraphic
○/●/○○/○
3880W750V
175V...500V/400V125V/150V15A/15A15A/15A2/A:2;B:2
3680W3680VA
220V,230V,240V/180V–280V
50Hz,60Hz/-5Hz…+5Hz50Hz/230V
16A1
0.8overexcited…0.8underexcited1/1
97%/96.3%
●●/●
●/●/—●
I/III
26kg(57.3lb)–25°C…+60°C(–13°F…+140°F)
25dB(A)1W
TransformerlessConvection
IP654K4H100%
SUNCLIX/SpringclampterminalGraphic
○/●/○○/○
●/○/○/○/○AS4777,C10/11,CE,CEI0-21,EN50438¹,G59/2,
G83/1-1,IEC61727,MEA4,NRS097-2-1,PEA4,PPC,PPDS,RD1699,RD661,UTEC15-712,VDE-AR-N4105,VDE0126-1-1
SB3000TL-21 SB3600TL-21
490/519/185mm(19.3/20.4/7.3inches)

Accessories
Input (DC)Max.DCpower(@cosφ=1)Max.inputvoltageMPPvoltagerange/ratedinputvoltageMin.inputvoltage/initialinputvoltageMax.inputcurrentinputA/inputBMax.inputcurrentperstringinputA/inputBNumberofindependentMPPinputs/stringsperMPPinputoutput (AC)Ratedpower(@230V,50Hz)Max.apparentACpowerNominalACvoltage/range
ACpowerfrequency/rangeRatedpowerfrequency/ratedgridvoltageMax.outputcurrentPowerfactoratratedpowerDisplacementpowerfactor,adjustableFeed-inphases/connectionphasesEfficiencyMax.efficiency/EuropeanweightedefficiencyProtective devicesDCdisconnectdeviceGroundfaultmonitoring/gridmonitoringDCreversepolarityprotection/ACshort-circuitcurrentcapability/galvanicallyisolatedAll-pole-sensitiveresidual-currentmonitoringunitProtectionclass(accordingtoIEC62103)/overvoltagecategory(accordingtoIEC60664-1)General dataDimensions(W/H/D)WeightOperatingtemperaturerangeNoiseemission(typical)Self-consumption(night)TopologyCoolingconceptDegreeofprotection(accordingtoIEC60529)Climaticcategory(accordingtoIEC60721-3-4)Maximumpermissiblevalueforrelativehumidity(non-condensing)FeaturesDCconnection/ACconnectionDisplayInterface:RS485,Bluetooth,Speedwire/WebconnectMulti-functionrelay/PowerControlModuleWarranty:5/10/15/20/25yearsCertificatesandapprovals(additionalonrequest)
●Standardfeatures ○Optionalfeatures —Notavailable,DataatnominalconditionsTypedesignation
Technical data Sunny Boy 5000TL
Sunny Boy 4000TL
4200W750V
175V...500V/400V125V/150V15A/15A15A/15A2/A:2;B:2
4000W4000VA
220V,230V,240V/180V–280V
50Hz,60Hz/–5Hz…+5Hz50Hz/230V
22A1
0.8overexcited…0.8underexcited1/1
97%/96.4%
●●/●
●/●/—●
I/III
26kg(57.3lb)–25°C…+60°C(–13°F…+140°F)
25dB(A)1W
TransformerlessConvection
IP654K4H100%
SUNCLIX/SpringclampterminalGraphic
○/●/○○/○
5250W³750V
175V...500V/400V125V/150V15A/15A15A/15A2/A:2;B:2
4600W5000VA²
220V,230V,240V/180V–280V
50Hz,60Hz/–5Hz…+5Hz50Hz/230V
22A1
0.8overexcited…0.8underexcited1/1
97%/96.5%
●●/●
●/●/—●
I/III
26kg(57.3lb)–25°C…+60°C(–13°F…+140°F)
25dB(A)1W
TransformerlessConvection
IP654K4H100%
SUNCLIX/SpringclampterminalGraphic
○/●/○○/○
●/○/○/○/○AS4777,C10/11,CE,CEI0-21,EN50438¹,G59/2,
G83/1-1,IEC61727,MEA4,NRS097-2-1,PEA4,PPC,PPDS,RD1699,RD661,UTEC15-712,VDE-AR-N4105,VDE0126-1-1
SB4000TL-21 SB5000TL-21
RS485interfaceDM-485CB-10
AdditionalfankitFANKIT01-10
Multi-functionrelayMFR01-10
Speedwire/WebconnectinterfaceSWDM-10
PowerControlModulePWCMOD-10
490/519/185mm(19.3/20.4/7.3inches)
¹DoesnotapplytoallnationalappendicesofEN50438²4600VAwithVDE-AR-N-410534825WwithVDE-AR-N41054OnlySB3600TL-21,SB5000TL-21

SMA Solar Technologywww.SMA-Solar.com
www.SunnyPortal.comProfessional management, monitoring and presentation of PV plants
SB50
00TL-21
-DEN
1349
24S
MA
andSu
nnyB
oyarere
gister
edtrad
emarksofS
MA
Solar
Tech
nolog
yAG.B
lueto
oth®
isare
gister
edtrad
emarko
wned
byB
luetoo
thSIG,Inc
.SUN
CLIX
isaregis
tered
trad
emarko
wned
byP
HOEN
IXCO
NTA
CTG
mbH
&Co
.KG.P
rinted
onFS
C-ce
rtified
pap
er.
Allp
rodu
ctsand
servi
cesd
escri
bedasw
ellastec
hnica
ldataaresubje
ctto
chan
ge,e
venforrea
sonsofc
ountr
y-spe
cific
devia
tions,a
tany
timewitho
utno
tice.
SMA
assume
snolia
bilityfo
rerro
rsoromissi
ons.Fo
rcurrent
informa
tion,
seeww
w.SM
A-So
lar.co
m

Sunny ISLAnD 2012 / 2224SI
201
2 / S
I 222
4
Flexible•Forsystemsfrom1to9kW•1-and3-phaseoperation,
connectableinparallelandmodularlyextendable
•ACandDCcoupling
Efficient•Highefficiency•Reliablestate-of-chargecalculation•Intelligentbatterymanagementfor
maximumbatterylife-span
Durable•Forindoorandoutdoorinstallation•Excellentoverloadcharacteristics•Verywidetemperaturerange•5-yearSMAWarranty
Simple•Simpleinstallation•Completeoff-gridmanagement•Easyandremoteconfiguration
andmonitoringwithSunnyRemoteControl
Sunny ISLAnD 2012 / 2224 Compact and powerful for small stand-alone systems
NewSunnyIslandproducts:theSunnyIsland2012and2224extendtheproductrangeforthelowerpowerrange.Thedevicesnotonlyfeaturealltheprovenproductcharacteristicsofthe“bigbrother”SunnyIsland5048–thankstotheirreducedweightandcompactdesign,thenewfamilymembersareeveneasiertohandleandinstall.ThehighIP54protectionclassandtheSunnyRemoteControl(SRC-1)giveyoufullflexibilitywhenchoosinganinstallationlocation.Easy-to-usetechnologyatitsbest:theunbeatablecombinationforoff-gridsystemsofupto9kilowatts.
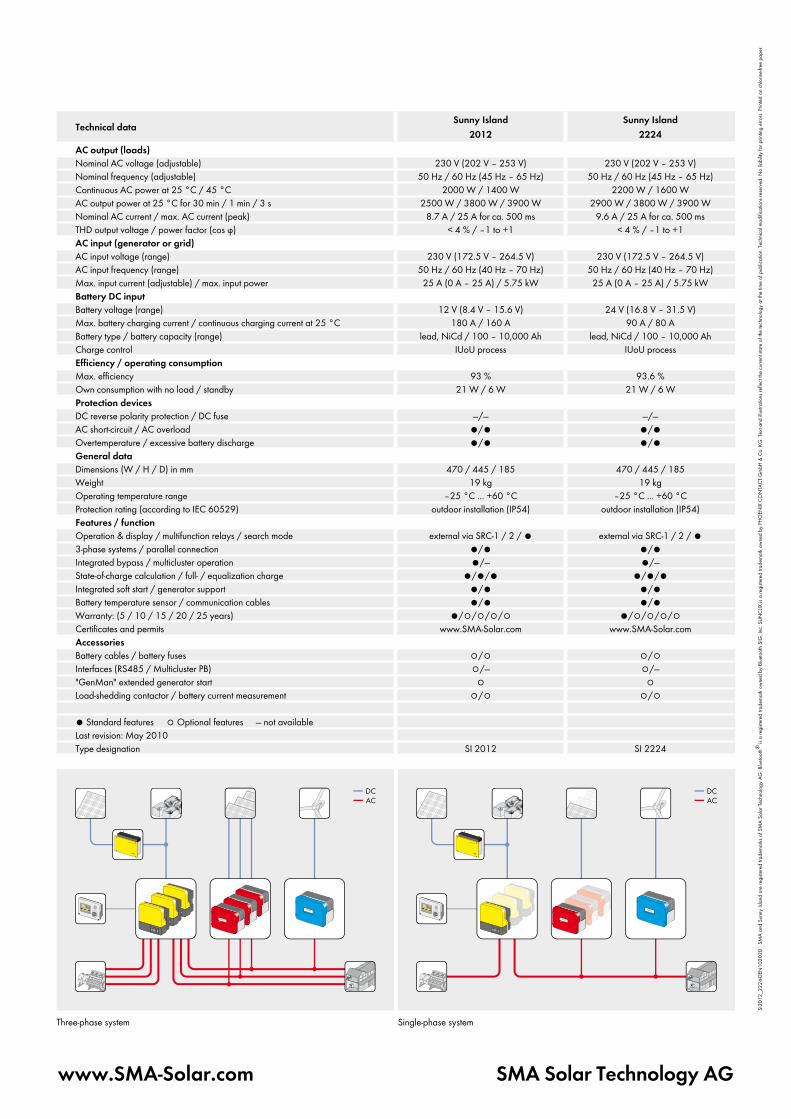
SMA Solar Technology AGwww.SMA-Solar.com
SI20
12_2
224-DE
N10
2020
SM
Aan
dSu
nnyI
sland
arere
gister
edtrad
emarksofS
MA
Solar
Tech
nolog
yAG.B
lueto
oth®
isare
gister
edtrad
emarko
wned
byB
luetoo
thSIG,Inc
.SUN
CLIX
isaregis
tered
trad
emarko
wned
byP
HOEN
IXCO
NTA
CTG
mbH
&Co
.KG.T
exta
ndill
ustra
tionsre
flect
thecu
rrent
state
ofth
etec
hnolo
gyatth
etim
eofpub
lication
.Tec
hnica
lmod
ification
sreserve
d.N
olia
bilityfo
rprin
tingerrors.Pr
inted
onch
lorine
-freepa
per.
Technical dataSunny Island
2012Sunny Island
2224AC output (loads)NominalACvoltage(adjustable) 230V(202V–253V) 230V(202V–253V)Nominalfrequency(adjustable) 50Hz/60Hz(45Hz–65Hz) 50Hz/60Hz(45Hz–65Hz)ContinuousACpowerat25°C/45°C 2000W/1400W 2200W/1600WACoutputpowerat25°Cfor30min/1min/3s 2500W/3800W/3900W 2900W/3800W/3900WNominalACcurrent/max.ACcurrent(peak) 8.7A/25Aforca.500ms 9.6A/25Aforca.500msTHDoutputvoltage/powerfactor(cosϕ) <4%/–1to+1 <4%/–1to+1AC input (generator or grid)ACinputvoltage(range) 230V(172.5V–264.5V) 230V(172.5V–264.5V)ACinputfrequency(range) 50Hz/60Hz(40Hz–70Hz) 50Hz/60Hz(40Hz–70Hz)Max.inputcurrent(adjustable)/max.inputpower 25A(0A–25A)/5.75kW 25A(0A–25A)/5.75kWBattery DC inputBatteryvoltage(range) 12V(8.4V–15.6V) 24V(16.8V–31.5V)Max.batterychargingcurrent/continuouschargingcurrentat25°C 180A/160A 90A/80ABatterytype/batterycapacity(range) lead,NiCd/100–10,000Ah lead,NiCd/100–10,000AhChargecontrol IUoUprocess IUoUprocessEfficiency / operating consumptionMax.efficiency 93% 93.6%Ownconsumptionwithnoload/standby 21W/6W 21W/6WProtection devicesDCreversepolarityprotection/DCfuse —/— —/—ACshort-circuit/ACoverload ●/● ●/●Overtemperature/excessivebatterydischarge ●/● ●/●General dataDimensions(W/H/D)inmm 470/445/185 470/445/185Weight 19kg 19kgOperatingtemperaturerange –25°C...+60°C –25°C...+60°CProtectionrating(accordingtoIEC60529) outdoorinstallation(IP54) outdoorinstallation(IP54)Features / functionOperation&display/multifunctionrelays/searchmode externalviaSRC-1/2/● externalviaSRC-1/2/●3-phasesystems/parallelconnection ●/● ●/●Integratedbypass/multiclusteroperation ●/— ●/—State-of-chargecalculation/full-/equalizationcharge ●/●/● ●/●/●Integratedsoftstart/generatorsupport ●/● ●/●Batterytemperaturesensor/communicationcables ●/● ●/●Warranty:(5/10/15/20/25years) ●/○/○/○/○ ●/○/○/○/○Certificatesandpermits www.SMA-Solar.com www.SMA-Solar.comAccessoriesBatterycables/batteryfuses ○/○ ○/○Interfaces(RS485/MulticlusterPB) ○/— ○/—"GenMan"extendedgeneratorstart ○ ○Load-sheddingcontactor/batterycurrentmeasurement ○/○ ○/○
●Standardfeatures○Optionalfeatures—notavailableLastrevision:May2010Typedesignation SI2012 SI2224
Three-phasesystem Single-phasesystem

AlphaCell™ OPzVGel Lead Acid Battery
> Power range available:
2 volts from 200 – 3,000Ah
> Modular unit structure allows for minimal footprint
> Wide temperature range from -10°C – + 45°C
> Rugged fl ame retardant ABS casing to UL94-VO
> Tubular positive plate design
> 20 year design life
> 3 year - 100% full warranty
The AlphaCell OPzV battery with the combination of Gel and Tubular technologies is designed specifi cally for telecommunication applications. The OPzV, with its absorbed electrolyte technology is the most reliable, versatile and cost eff ective valve regulated battery available on the market today. This long fl oat life and high cycle battery is available in 2 volts ranging from 200 to 3,000 amp-hours. The OPzV requires less space than conventional VRLA batteries and are structurally arranged to eliminate dislodging and slippage caused by vibrations over time.

AlphaCell OPzV Feature Summary
AlphaCell OPzV 2 Volt Standard Warranty: 3 yr full/17 yr prorated Battery Type: Valve regulated lead acid Range of Capacity: 200Ah – 3000Ah Recommended Float Voltage: 2.25VPC @25°C (77°F) Operating Temperature: 25°C (77°F) Terminal Type: Threaded Copper Insert Positive Electrode: Round-grid plate with circular bars available with low antimony or lead calcium plates. Negative Electrode: Flat plate with long life expander and available with low antimony or lead calcium plates. Separation: Microporous separator Electrolyte: Sulfuric acid of 1.24 ± 0.01 kg/l at 20°C Container: High impact, transparent SAN Lid: SAN in dark grey color
Operational Data
Alpha OPzV 2 Volt Water refi lling interval: More than 3 years at 20°C IEC 896-1 Cycles: 1000 cycles Self-discharge: Approx. 3% per month at 20°C Operational Temperature: -20°C to 55°C, recommended -10°C to 30°C Ventilation Requirement: f1=0,5 (low-antimony alloy) according VDE 0510 part 2 Measurements According: DIN 40 737 part 3Tests According: Tested to international standard IEC 60896-21. Conforms to DIN Standard 40742Applicable Standards: DIN 43539 part 5 and IEC 60896-22 Transport: No dangerous goods during road transport
Mechanical Specifi cations
Type Length(in/mm)
Width (in/mm)
Height (in/mm)
Weight(lb/kg)
Hole Size
OPzV 2-200-FR 4.1/103 8.1/206 15.0/380 44.1/20 12mm
OPzV 2-250-FR 4.9/124 8.1/206 15.0/380 52.9/24 12mm
OPzV 2-300-FR 5.7/145 8.1/206 15.0/380 64.0/29 12mm
OPzV 2-350-FR 4.9/124 8.1/206 9.5/496 68.3/31 12mm
OPzV 2-420-FR 5.7/145 8.1/206 9.5/496 79.4/36 12mm
OPzV 2-500-FR 6.5/166 8.1/206 9.5/496 92.6/42 12mm
OPzV 2-600-FR 5.7/145 8.1/206 26.4/671 110/50 12mm
OPzV 2-700-FR 10.0/254 8.2/210 9.5/496 131.2/59.5 12mm
OPzV 2-770-FR 10.0/254 8.2/210 9.5/496 144.4/65.5 12mm
OPzV 2-800-FR 7.5/191 8.2/210 26.4/671 150/68 12mm
OPzV 2-1000-FR 9.2/233 8.2/210 26.4/671 181/82 12mm
OPzV 2-1200-FR 10.8/275 8.2/210 26.4/671 214/97 12mm
OPzV 2-1500-FR 10.8/275 8.2/210 32.3/821 265/120 12mm
OPzV 2-2000-FR 15.7/399 8.3/212 31.4/797 353/160 12mm
OPzV 2-2500-FR 19.2/487 8.3/212 31.4/797 441/200 12mm
OPzV 2-3000-FR 22.7/576 8.3/212 31.4/797 529/240 12mm
H*
H* H*
L
W W
L
W
L
W
L
OPzV 2-200-FROPzV 2-600-FR
OPzV 2-800-FROPzV 2-1500-FR
OPzV 2-2000-FR OPzV 2-3000-FR
H*

End Discharge Voltage 1.70V/Cell(Amp)
Minutes Hours
Type 15 30 1 2 3 4 5 6 8 10
OPzV2-200-FR 249.6 172.0 111.0 66.8 50.0 40.4 34.5 30.0 24.0 21.0
OPzV2-250-FR 312.0 215.0 137.5 83.5 62.5 50.5 42.5 37.0 30.5 26.0
OPzV2-300-FR 374.5 258.0 165.5 100.5 75.0 60.6 51.0 44.5 36.0 30.5
OPzV2-350-FR 408.0 312.0 202.0 124.5 92.0 74.5 63.5 55.0 44.5 38.0
OPzV2-420-FR 489.6 374.5 242.5 149.5 110.5 89.5 76.5 66.0 53.0 45.0
OPzV2-500-FR 571.5 436.8 282.8 174.5 129.0 104.5 90.0 77.0 62.0 52.0
OPzV2-600-FR 636.0 516.0 351.0 241.5 159.0 126.6 106.5 92.5 73.5 62.0
OPzV2-700-FR 742.0 602.0 409.5 250.0 185.5 148.0 124.0 108.0 85.5 72.0
OPzV2-770-FR 816.0 662.0 450.0 275.0 204.0 162.5 136.5 119.0 94.0 78.0
OPzV2-800-FR 848.0 688.0 468.0 285.6 212.0 168.8 141.6 123.5 97.6 82.0
OPzV2-1000-FR 1060.0 860.0 585.0 357.0 265.0 211.0 177.0 154.0 122.0 102.0
OPzV2-1200-FR 1272.0 1032.0 702.5 428.5 318.0 253.5 212.5 184.8 146.5 122.0
OPzV2-1500-FR 1368.0 1164.0 876.0 566.5 420.0 334.8 278.5 238.8 186.0 154.0
OPzV2-2000-FR 1824.0 1552.0 1168.0 755.5 560.0 446.5 371.5 318.5 248.0 205.0
OPzV2-2500-FR 2280.0 1940.0 1460.0 944.0 700.0 558.0 464.0 398.0 310.0 256.0
OPzV2-3000-FR 2736.0 2328.0 1752.0 1132.0 840.0 669.6 556.8 477.6 372.0 307.5
End Discharge Voltage 1.75V/Cell(Amp)
Minutes Hours
Type 15 30 1 2 3 4 5 6 8 10
OPzV 2-200-FR 227.2 164.8 110.0 65.6 50.0 40.0 34.0 29.6 24.0 20.0
OPzV 2-250-FR 284.0 206.0 137.5 82.0 62.5 50.0 42.5 37.0 30.0 26.0
OPzV 2-300-FR 340.8 247.2 165.0 98.4 75.0 60.0 51.0 44.4 36.0 30.0
OPzV 2-350-FR 368.0 290.0 196.0 121.5 90.5 74.0 63.0 55.0 44.0 37.0
OPzV 2-420-FR 441.6 348.0 235.2 145.8 108.6 88.8 75.6 66.0 52.8 44.5
OPzV 2-500-FR 515.2 406.0 274.4 170.5 126.7 103.6 88.2 77.0 61.6 51.8
OPzV 2-600-FR 564.0 468.0 336.0 208.2 156.0 126.0 105.6 92.4 73.2 61.0
OPzV 2-700-FR 658.0 546.0 385.0 243.0 182.0 147.0 123.0 108.0 85.5 71.0
OPzV 2-770-FR 723.0 600.0 423.5 267.0 200.0 162.0 134.0 118.5 94.0 78.0
OPzV 2-800-FR 752.0 624.0 448.0 277.6 208.0 168.0 140.8 123.2 97.6 81.0
OPzV 2-1000-FR 940.0 780.0 560.0 347.0 260.0 210.0 176.0 154.0 122.0 101.0
OPzV 2-1200-FR 1128.0 936.0 672.0 416.5 312.0 252.0 211.2 184.8 146.4 121.0
OPzV 2-1500-FR 1200.0 1056.0 825.0 540.0 403.0 326.4 272.4 234.0 184.8 152.5
OPzV 2-2000-FR 1600.0 1408.0 1100.0 720.0 544.0 435.2 363.2 312.0 246.4 203.5
OPzV 2-2500-FR 2000.0 1760.0 1375.0 900.0 630.0 544.0 454.0 390.0 308.0 254.0
OPzV 2-3000-FR 2400.0 2112.0 1650.0 1080.0 816.0 652.8 544.3 468.0 369.6 305.0

Stecamat 860Processor-controlled charger for lead-acid batteriesThe Stecamat 860 battery charger is available in a range from 12 V to 48 V with a rated power of 720 W to 1,080 W in a sealed casing. The processor-controlled charging process ensures gentle and rapid charging of your battery. The Stecamat 860 also enables the pro-cessing of damaged or totally discharged batteries, ensuring long service life. A LED provides rapid information on the state of charge.
The wide range of features and made-to-measure solutions for your application requirements make for high flexibility of use. This and the easy handling of the device make for trouble-free operation.
Product features ∙ IP 65 jet waterproof case ∙ Half the charging time compared to simple, non-controlled chargers with the same rated current
∙ Optimal for charging batteries with liquid electrolyte and solid gel / absorbed electrolyte (AGM)
∙ Suitable for totally discharged batteries ∙ Constant battery operational readiness through integrated trickle charge
∙ Ready for operation in just a few minutes ∙ Charging below the gassing voltage ∙ Optimal charging of damaged batteries ∙ Individually programmed upon request
Electronic protection functions ∙ Protection in the case of wrong or damaged batteries ∙ Battery overcharge protection ∙ Charger output protected against short circuits, reverse polarity and overvoltage
Display ∙ Multi-coloured LED shows operating statuses
Operation ∙ Mains grid switch
Technical data
Charging rated voltage 12 V 24 V 36 V 48 V
Charging current 50 A 35 A 25 A 18 A
End-of-charge voltage 14.4 V 28.8 V 43.2 V 57.6 V
Trickle charge voltage 13.8 V 27.6 V 41.4 V 55.2 V
Characteristic curve UoIUoIU
Grid voltage 230 V AC ± 10 %
Grid frequency 50 Hz
Mains electricity 3.7 A (230 V) 5,5 A (230 V)
Discharge current during grid failure 1 mA
Protection class I
Casing / ingress protection aluminium / plastic, IP 65
Ambient temperature -40 °C ... +60 °C
Cooling convection
Dimensions X x Y x Z 226 x 535 x 127 mm
Weight approx. 11.5 kg
Options fault messaging, IO card, data communication card,
Steca ventilation system in accordance with EN 50272
Technical data at 25 °C / 77 °F
WALL-MOUNTED UNITS