Embed Size (px)
Citation preview

An Alignment of
The Minnesota Academic Standards for Mathematics 2007
To Connected Mathematics Project 3
©2014
Grade 8 – Algebra 1
An Alignment of The Minnesota Academic Standards for Mathematics 2007 to Connected Mathematics Project 3, ©2014, Grade 8 – Algebra 1
Copyright ©2015 Pearson Education, Inc. or its affiliate(s). All rights reserved
Introduction This document demonstrates how The Minnesota Academic Standards for Mathematics 2007 align with Connected Mathematics Project 3 (CMP3), ©2014. Correlation references are to the units of the Student and Teacher’s Editions. The goal of Connected Mathematics Project 3 is to help students develop mathematical knowledge, conceptual understanding, and procedural skills, along with an awareness of the rich connections between math topics—across grades. Through the “Launch-Explore-Summarize” model, students investigate and solve problems that develop rigorous higher-order thinking skills and problem-solving strategies. Curriculum development for CMP3 has been guided by an important mathematical idea: All students should be able to reason and communicate proficiently in mathematics. They should have knowledge of and skill in the use of the vocabulary, forms of representation, materials, tools, techniques, and intellectual methods of mathematics. This includes the ability to define and solve problems with reason, insight, inventiveness, and technical proficiency. CMP3 uses technology to help teachers implement with fidelity, thus raising student achievement. Easy-to-use mobile tools help with classroom management and capture student work on the go. ExamView® delivers a full suite of assessment tools, and MathXL® provides individualized skills practice. 21st century social networking technology connects CMP3 teachers, while students benefit from interactive digital student pages that allow for instantaneous sharing and effective group work.
An Alignment of The Minnesota Academic Standards for Mathematics 2007 to Connected Mathematics Project 3, ©2014, Grade 8 – Algebra 1
Copyright ©2015 Pearson Education, Inc. or its affiliate(s). All rights reserved
Table of Contents
Thinking With Mathematical Models, Linear and Inverse Variation ........................ 1 Looking for Pythagoras, The Pythagorean Theorem ............................................. 45 Growing, Growing, Growing, Exponential Functions ............................................. 66 Butterflies, Pinwheels, and Wallpaper, Symmetry and Transformations ............ 102 Say It With Symbols, Making Sense of Symbols ................................................. 130 It's In the System, Systems of Linear Equations and Inequalities ...................... 152 Frogs, Fleas, and Painted Cubes, Quadratic Functions ........................................ 192 Function Junction, The Families of Functions ..................................................... 237
An Alignment of The Minnesota Academic Standards for Mathematics 2007 to Connected Mathematics Project 3, ©2014, Grade 8
1
Connected Mathematics Project 3 Grade 8 – Algebra 1
Minnesota Academic Standards in Mathematics
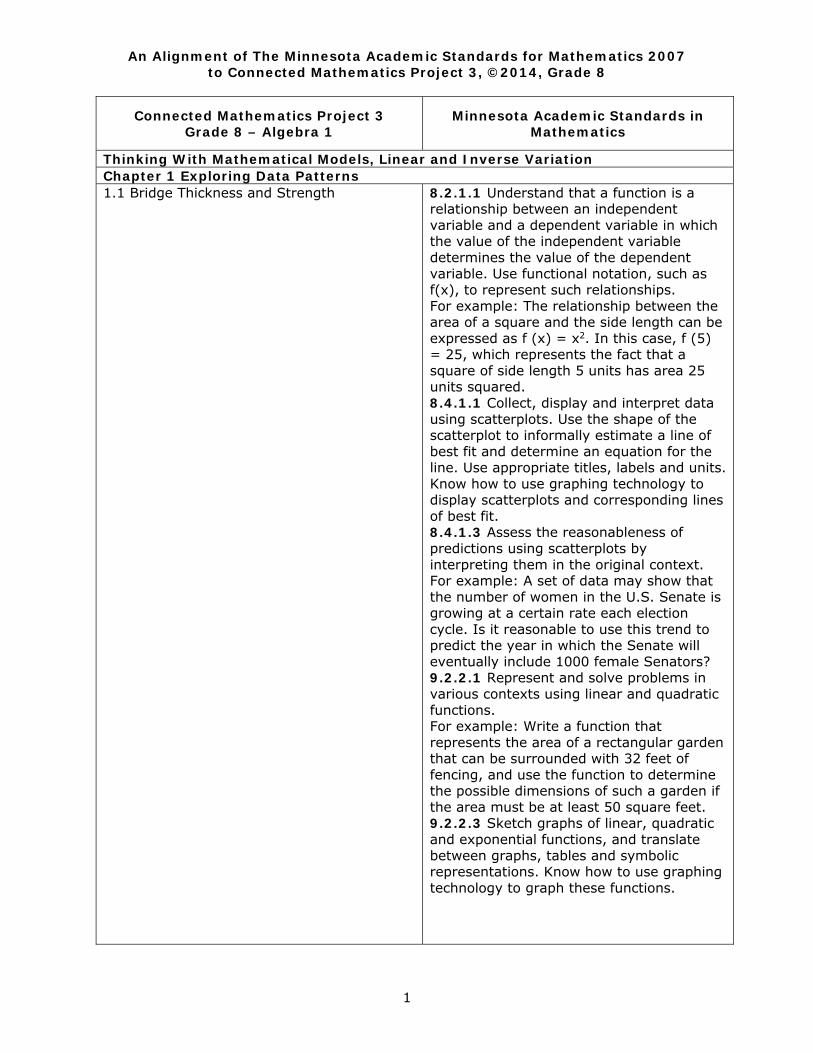
Thinking With Mathematical Models, Linear and Inverse Variation Chapter 1 Exploring Data Patterns 1.1 Bridge Thickness and Strength
8.2.1.1 Understand that a function is a relationship between an independent variable and a dependent variable in which the value of the independent variable determines the value of the dependent variable. Use functional notation, such as f(x), to represent such relationships. For example: The relationship between the area of a square and the side length can be expressed as f (x) = x2. In this case, f (5) = 25, which represents the fact that a square of side length 5 units has area 25 units squared. 8.4.1.1 Collect, display and interpret data using scatterplots. Use the shape of the scatterplot to informally estimate a line of best fit and determine an equation for the line. Use appropriate titles, labels and units. Know how to use graphing technology to display scatterplots and corresponding lines of best fit. 8.4.1.3 Assess the reasonableness of predictions using scatterplots by interpreting them in the original context. For example: A set of data may show that the number of women in the U.S. Senate is growing at a certain rate each election cycle. Is it reasonable to use this trend to predict the year in which the Senate will eventually include 1000 female Senators? 9.2.2.1 Represent and solve problems in various contexts using linear and quadratic functions. For example: Write a function that represents the area of a rectangular garden that can be surrounded with 32 feet of fencing, and use the function to determine the possible dimensions of such a garden if the area must be at least 50 square feet. 9.2.2.3 Sketch graphs of linear, quadratic and exponential functions, and translate between graphs, tables and symbolic representations. Know how to use graphing technology to graph these functions.
An Alignment of The Minnesota Academic Standards for Mathematics 2007 to Connected Mathematics Project 3, ©2014, Grade 8 – Algebra 1
2
Connected Mathematics Project 3 Grade 8 – Algebra 1
Minnesota Academic Standards in Mathematics
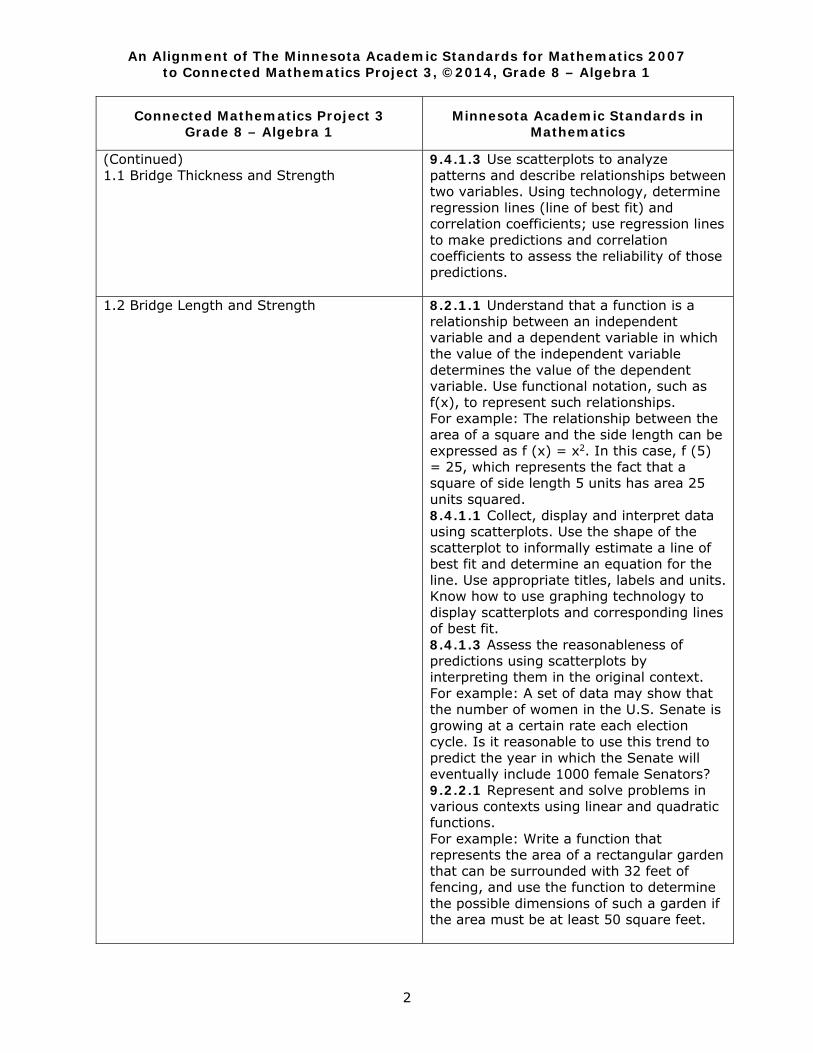
(Continued) 1.1 Bridge Thickness and Strength
9.4.1.3 Use scatterplots to analyze patterns and describe relationships between two variables. Using technology, determine regression lines (line of best fit) and correlation coefficients; use regression lines to make predictions and correlation coefficients to assess the reliability of those predictions.
1.2 Bridge Length and Strength
8.2.1.1 Understand that a function is a relationship between an independent variable and a dependent variable in which the value of the independent variable determines the value of the dependent variable. Use functional notation, such as f(x), to represent such relationships. For example: The relationship between the area of a square and the side length can be expressed as f (x) = x2. In this case, f (5) = 25, which represents the fact that a square of side length 5 units has area 25 units squared. 8.4.1.1 Collect, display and interpret data using scatterplots. Use the shape of the scatterplot to informally estimate a line of best fit and determine an equation for the line. Use appropriate titles, labels and units. Know how to use graphing technology to display scatterplots and corresponding lines of best fit. 8.4.1.3 Assess the reasonableness of predictions using scatterplots by interpreting them in the original context. For example: A set of data may show that the number of women in the U.S. Senate is growing at a certain rate each election cycle. Is it reasonable to use this trend to predict the year in which the Senate will eventually include 1000 female Senators? 9.2.2.1 Represent and solve problems in various contexts using linear and quadratic functions. For example: Write a function that represents the area of a rectangular garden that can be surrounded with 32 feet of fencing, and use the function to determine the possible dimensions of such a garden if the area must be at least 50 square feet.
An Alignment of The Minnesota Academic Standards for Mathematics 2007 to Connected Mathematics Project 3, ©2014, Grade 8 – Algebra 1
3
Connected Mathematics Project 3 Grade 8 – Algebra 1
Minnesota Academic Standards in Mathematics
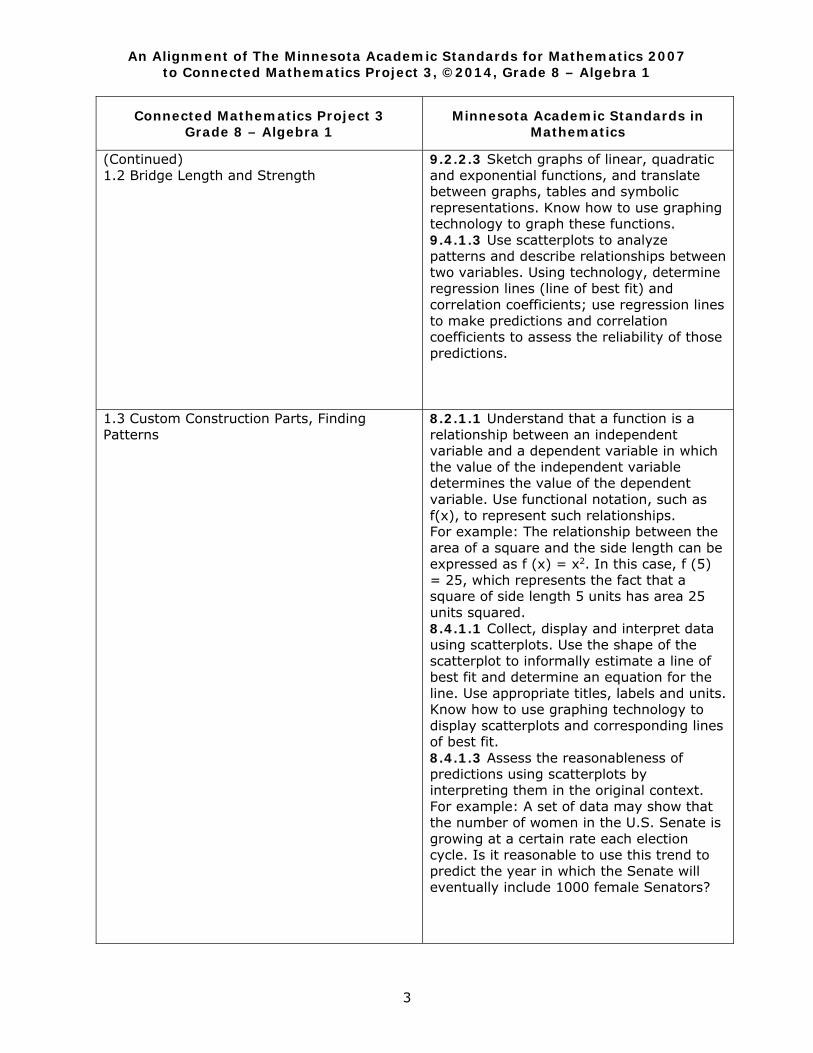
(Continued) 1.2 Bridge Length and Strength
9.2.2.3 Sketch graphs of linear, quadratic and exponential functions, and translate between graphs, tables and symbolic representations. Know how to use graphing technology to graph these functions. 9.4.1.3 Use scatterplots to analyze patterns and describe relationships between two variables. Using technology, determine regression lines (line of best fit) and correlation coefficients; use regression lines to make predictions and correlation coefficients to assess the reliability of those predictions.
1.3 Custom Construction Parts, Finding Patterns
8.2.1.1 Understand that a function is a relationship between an independent variable and a dependent variable in which the value of the independent variable determines the value of the dependent variable. Use functional notation, such as f(x), to represent such relationships. For example: The relationship between the area of a square and the side length can be expressed as f (x) = x2. In this case, f (5) = 25, which represents the fact that a square of side length 5 units has area 25 units squared. 8.4.1.1 Collect, display and interpret data using scatterplots. Use the shape of the scatterplot to informally estimate a line of best fit and determine an equation for the line. Use appropriate titles, labels and units. Know how to use graphing technology to display scatterplots and corresponding lines of best fit. 8.4.1.3 Assess the reasonableness of predictions using scatterplots by interpreting them in the original context. For example: A set of data may show that the number of women in the U.S. Senate is growing at a certain rate each election cycle. Is it reasonable to use this trend to predict the year in which the Senate will eventually include 1000 female Senators?
An Alignment of The Minnesota Academic Standards for Mathematics 2007 to Connected Mathematics Project 3, ©2014, Grade 8 – Algebra 1
4
Connected Mathematics Project 3 Grade 8 – Algebra 1
Minnesota Academic Standards in Mathematics
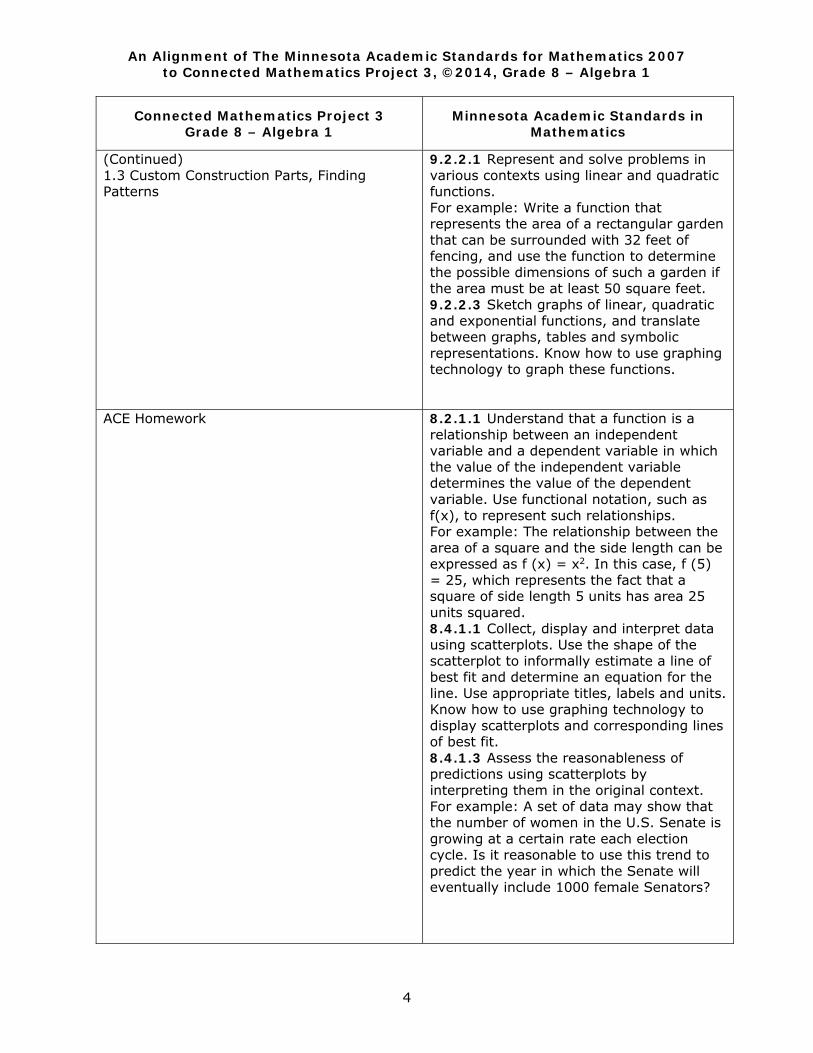
(Continued) 1.3 Custom Construction Parts, Finding Patterns
9.2.2.1 Represent and solve problems in various contexts using linear and quadratic functions. For example: Write a function that represents the area of a rectangular garden that can be surrounded with 32 feet of fencing, and use the function to determine the possible dimensions of such a garden if the area must be at least 50 square feet. 9.2.2.3 Sketch graphs of linear, quadratic and exponential functions, and translate between graphs, tables and symbolic representations. Know how to use graphing technology to graph these functions.
ACE Homework
8.2.1.1 Understand that a function is a relationship between an independent variable and a dependent variable in which the value of the independent variable determines the value of the dependent variable. Use functional notation, such as f(x), to represent such relationships. For example: The relationship between the area of a square and the side length can be expressed as f (x) = x2. In this case, f (5) = 25, which represents the fact that a square of side length 5 units has area 25 units squared. 8.4.1.1 Collect, display and interpret data using scatterplots. Use the shape of the scatterplot to informally estimate a line of best fit and determine an equation for the line. Use appropriate titles, labels and units. Know how to use graphing technology to display scatterplots and corresponding lines of best fit. 8.4.1.3 Assess the reasonableness of predictions using scatterplots by interpreting them in the original context. For example: A set of data may show that the number of women in the U.S. Senate is growing at a certain rate each election cycle. Is it reasonable to use this trend to predict the year in which the Senate will eventually include 1000 female Senators?
An Alignment of The Minnesota Academic Standards for Mathematics 2007 to Connected Mathematics Project 3, ©2014, Grade 8 – Algebra 1
5
Connected Mathematics Project 3 Grade 8 – Algebra 1
Minnesota Academic Standards in Mathematics
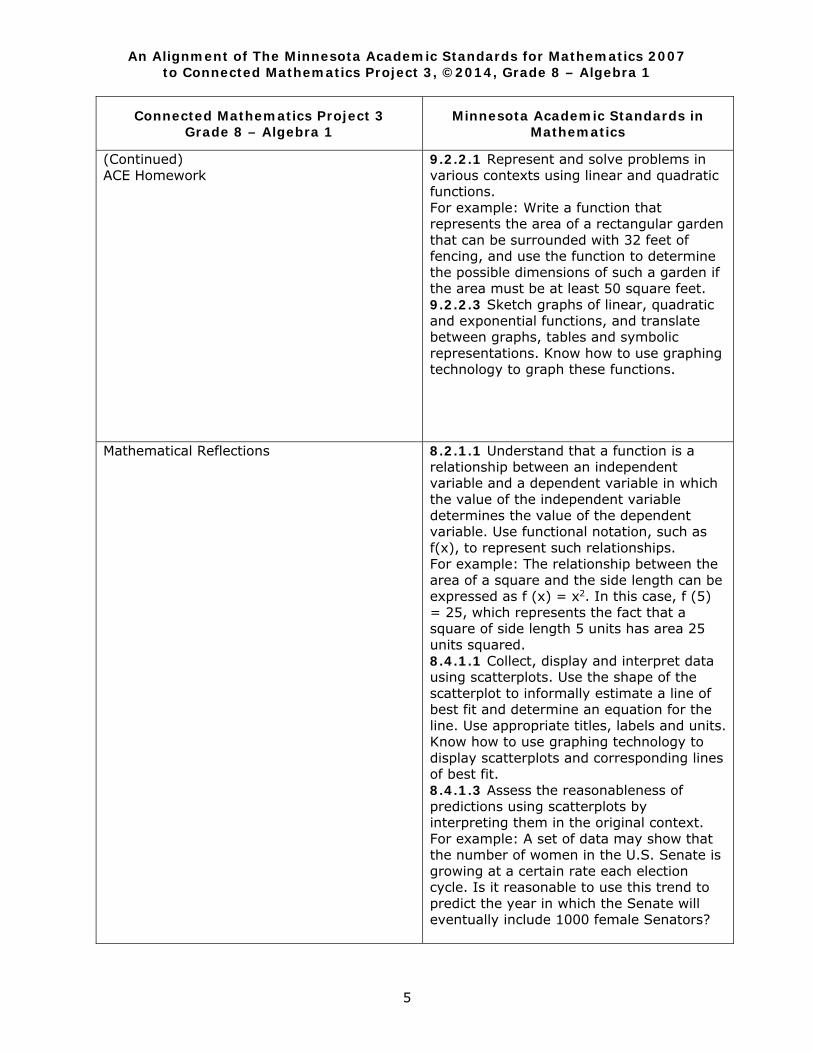
(Continued) ACE Homework
9.2.2.1 Represent and solve problems in various contexts using linear and quadratic functions. For example: Write a function that represents the area of a rectangular garden that can be surrounded with 32 feet of fencing, and use the function to determine the possible dimensions of such a garden if the area must be at least 50 square feet. 9.2.2.3 Sketch graphs of linear, quadratic and exponential functions, and translate between graphs, tables and symbolic representations. Know how to use graphing technology to graph these functions.
Mathematical Reflections
8.2.1.1 Understand that a function is a relationship between an independent variable and a dependent variable in which the value of the independent variable determines the value of the dependent variable. Use functional notation, such as f(x), to represent such relationships. For example: The relationship between the area of a square and the side length can be expressed as f (x) = x2. In this case, f (5) = 25, which represents the fact that a square of side length 5 units has area 25 units squared. 8.4.1.1 Collect, display and interpret data using scatterplots. Use the shape of the scatterplot to informally estimate a line of best fit and determine an equation for the line. Use appropriate titles, labels and units. Know how to use graphing technology to display scatterplots and corresponding lines of best fit. 8.4.1.3 Assess the reasonableness of predictions using scatterplots by interpreting them in the original context. For example: A set of data may show that the number of women in the U.S. Senate is growing at a certain rate each election cycle. Is it reasonable to use this trend to predict the year in which the Senate will eventually include 1000 female Senators?
An Alignment of The Minnesota Academic Standards for Mathematics 2007 to Connected Mathematics Project 3, ©2014, Grade 8 – Algebra 1
6
Connected Mathematics Project 3 Grade 8 – Algebra 1
Minnesota Academic Standards in Mathematics
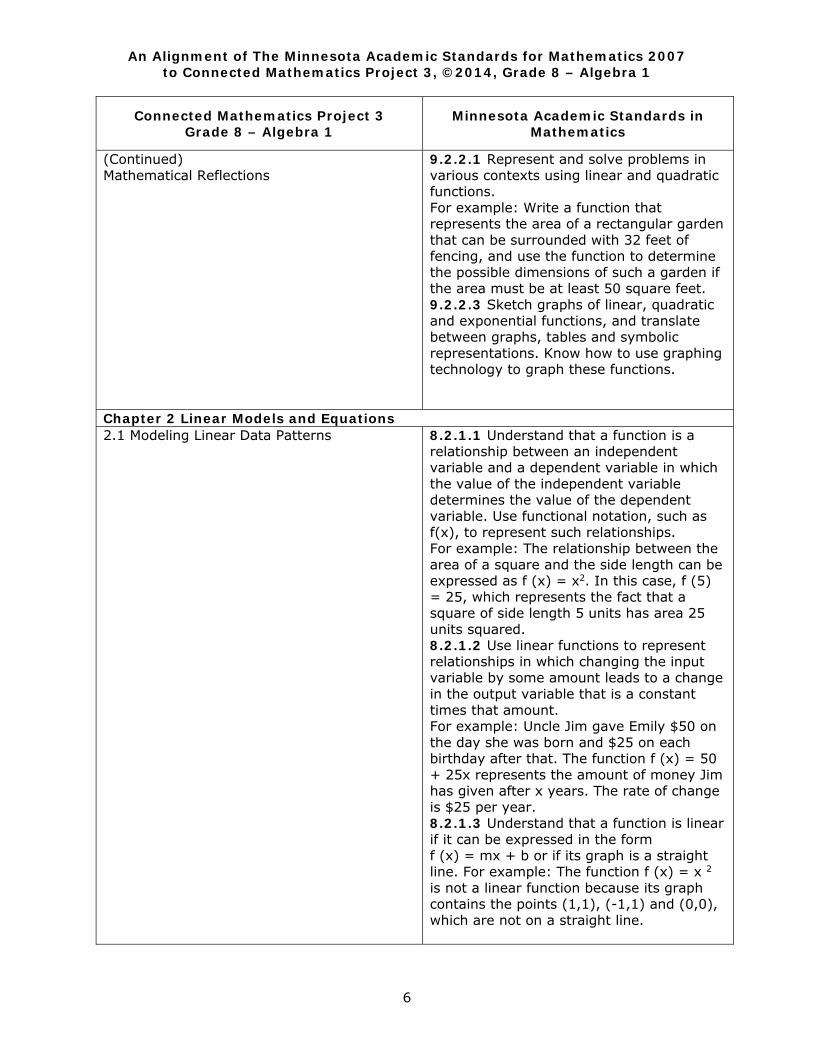
(Continued) Mathematical Reflections
9.2.2.1 Represent and solve problems in various contexts using linear and quadratic functions. For example: Write a function that represents the area of a rectangular garden that can be surrounded with 32 feet of fencing, and use the function to determine the possible dimensions of such a garden if the area must be at least 50 square feet. 9.2.2.3 Sketch graphs of linear, quadratic and exponential functions, and translate between graphs, tables and symbolic representations. Know how to use graphing technology to graph these functions.
Chapter 2 Linear Models and Equations 2.1 Modeling Linear Data Patterns
8.2.1.1 Understand that a function is a relationship between an independent variable and a dependent variable in which the value of the independent variable determines the value of the dependent variable. Use functional notation, such as f(x), to represent such relationships. For example: The relationship between the area of a square and the side length can be expressed as f (x) = x2. In this case, f (5) = 25, which represents the fact that a square of side length 5 units has area 25 units squared. 8.2.1.2 Use linear functions to represent relationships in which changing the input variable by some amount leads to a change in the output variable that is a constant times that amount. For example: Uncle Jim gave Emily $50 on the day she was born and $25 on each birthday after that. The function f (x) = 50 + 25x represents the amount of money Jim has given after x years. The rate of change is $25 per year. 8.2.1.3 Understand that a function is linear if it can be expressed in the form f (x) = mx + b or if its graph is a straight line. For example: The function f (x) = x 2 is not a linear function because its graph contains the points (1,1), (-1,1) and (0,0), which are not on a straight line.
An Alignment of The Minnesota Academic Standards for Mathematics 2007 to Connected Mathematics Project 3, ©2014, Grade 8 – Algebra 1
7
Connected Mathematics Project 3 Grade 8 – Algebra 1
Minnesota Academic Standards in Mathematics
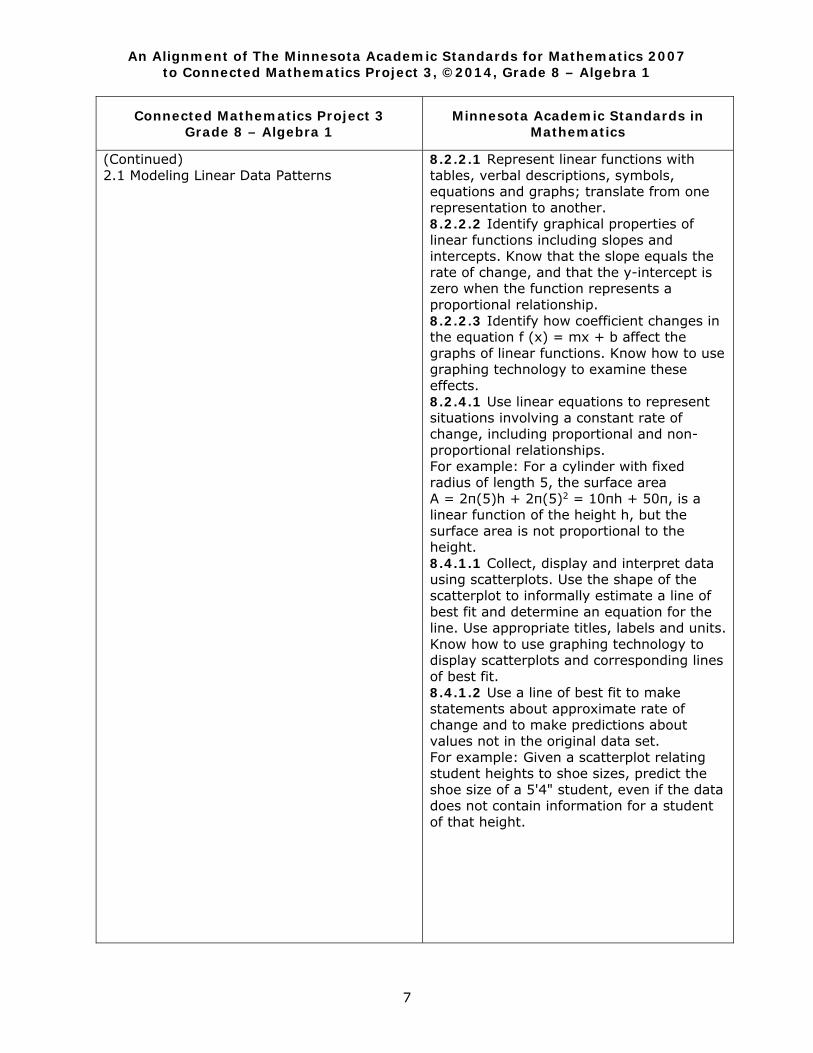
(Continued) 2.1 Modeling Linear Data Patterns
8.2.2.1 Represent linear functions with tables, verbal descriptions, symbols, equations and graphs; translate from one representation to another. 8.2.2.2 Identify graphical properties of linear functions including slopes and intercepts. Know that the slope equals the rate of change, and that the y-intercept is zero when the function represents a proportional relationship. 8.2.2.3 Identify how coefficient changes in the equation f (x) = mx + b affect the graphs of linear functions. Know how to use graphing technology to examine these effects. 8.2.4.1 Use linear equations to represent situations involving a constant rate of change, including proportional and non-proportional relationships. For example: For a cylinder with fixed radius of length 5, the surface area A = 2π(5)h + 2π(5)2 = 10πh + 50π, is a linear function of the height h, but the surface area is not proportional to the height. 8.4.1.1 Collect, display and interpret data using scatterplots. Use the shape of the scatterplot to informally estimate a line of best fit and determine an equation for the line. Use appropriate titles, labels and units. Know how to use graphing technology to display scatterplots and corresponding lines of best fit. 8.4.1.2 Use a line of best fit to make statements about approximate rate of change and to make predictions about values not in the original data set. For example: Given a scatterplot relating student heights to shoe sizes, predict the shoe size of a 5'4" student, even if the data does not contain information for a student of that height.
An Alignment of The Minnesota Academic Standards for Mathematics 2007 to Connected Mathematics Project 3, ©2014, Grade 8 – Algebra 1
8
Connected Mathematics Project 3 Grade 8 – Algebra 1
Minnesota Academic Standards in Mathematics
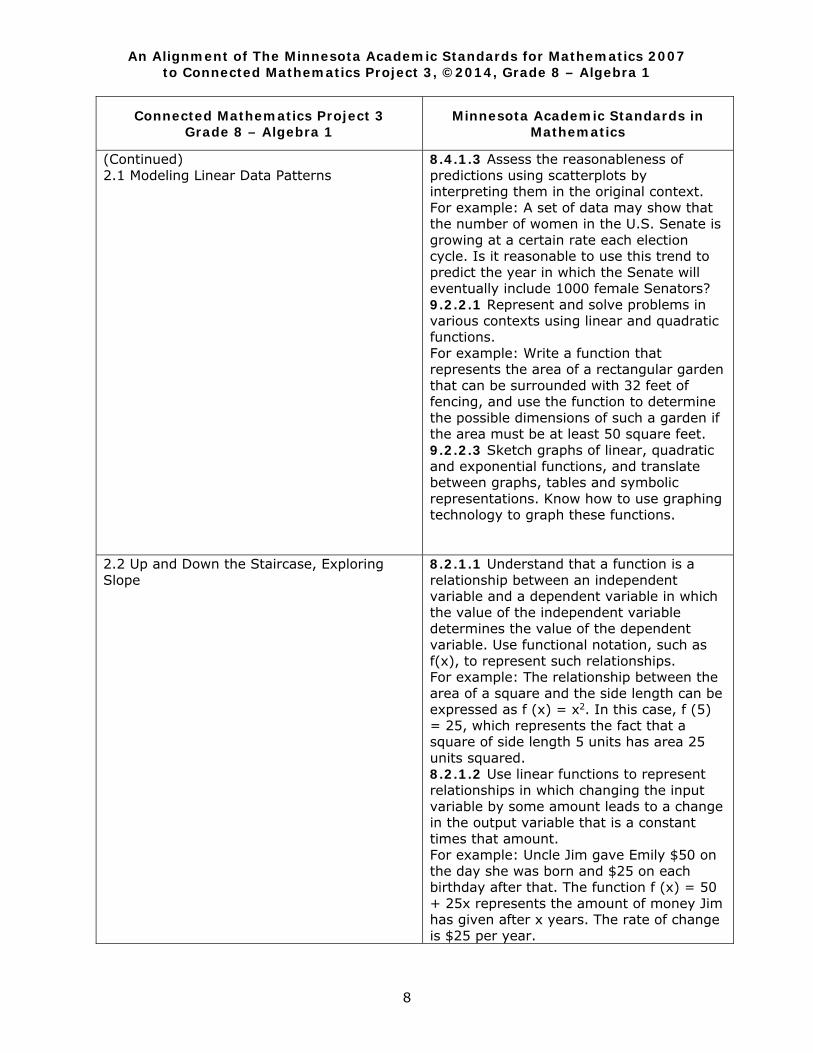
(Continued) 2.1 Modeling Linear Data Patterns
8.4.1.3 Assess the reasonableness of predictions using scatterplots by interpreting them in the original context. For example: A set of data may show that the number of women in the U.S. Senate is growing at a certain rate each election cycle. Is it reasonable to use this trend to predict the year in which the Senate will eventually include 1000 female Senators? 9.2.2.1 Represent and solve problems in various contexts using linear and quadratic functions. For example: Write a function that represents the area of a rectangular garden that can be surrounded with 32 feet of fencing, and use the function to determine the possible dimensions of such a garden if the area must be at least 50 square feet. 9.2.2.3 Sketch graphs of linear, quadratic and exponential functions, and translate between graphs, tables and symbolic representations. Know how to use graphing technology to graph these functions.
2.2 Up and Down the Staircase, Exploring Slope
8.2.1.1 Understand that a function is a relationship between an independent variable and a dependent variable in which the value of the independent variable determines the value of the dependent variable. Use functional notation, such as f(x), to represent such relationships. For example: The relationship between the area of a square and the side length can be expressed as f (x) = x2. In this case, f (5) = 25, which represents the fact that a square of side length 5 units has area 25 units squared. 8.2.1.2 Use linear functions to represent relationships in which changing the input variable by some amount leads to a change in the output variable that is a constant times that amount. For example: Uncle Jim gave Emily $50 on the day she was born and $25 on each birthday after that. The function f (x) = 50 + 25x represents the amount of money Jim has given after x years. The rate of change is $25 per year.
An Alignment of The Minnesota Academic Standards for Mathematics 2007 to Connected Mathematics Project 3, ©2014, Grade 8 – Algebra 1
9
Connected Mathematics Project 3 Grade 8 – Algebra 1
Minnesota Academic Standards in Mathematics
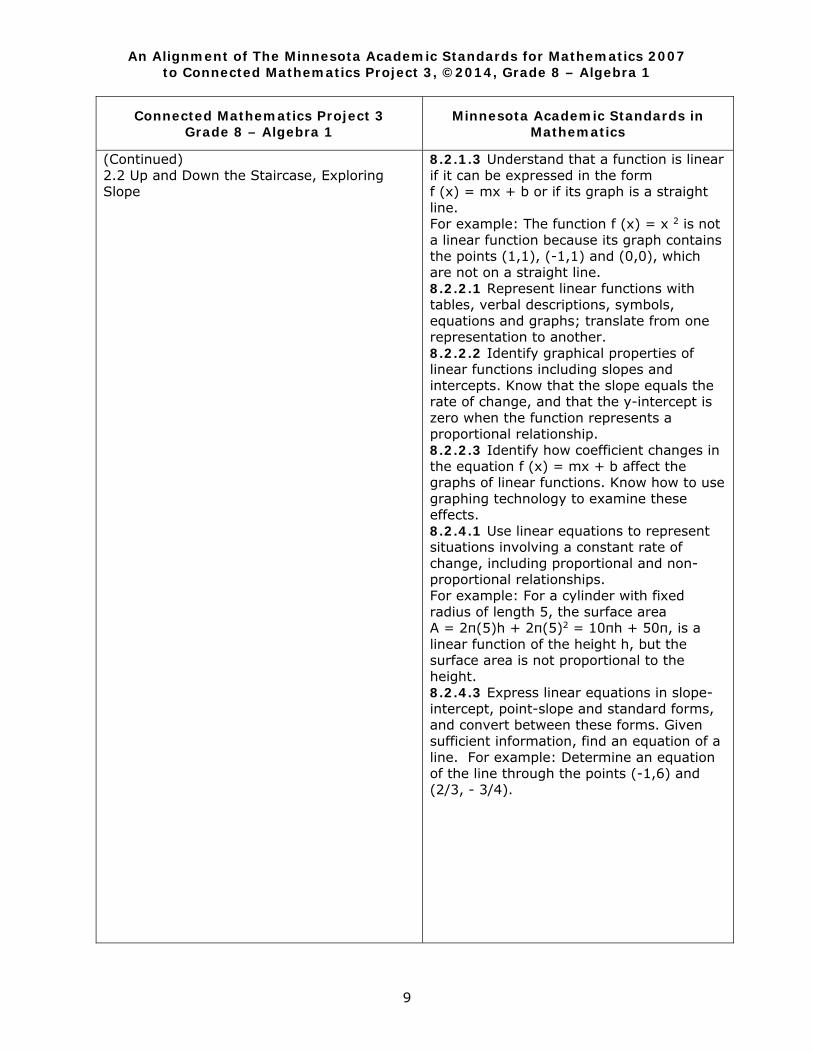
(Continued) 2.2 Up and Down the Staircase, Exploring Slope
8.2.1.3 Understand that a function is linear if it can be expressed in the form f (x) = mx + b or if its graph is a straight line. For example: The function f (x) = x 2 is not a linear function because its graph contains the points (1,1), (-1,1) and (0,0), which are not on a straight line. 8.2.2.1 Represent linear functions with tables, verbal descriptions, symbols, equations and graphs; translate from one representation to another. 8.2.2.2 Identify graphical properties of linear functions including slopes and intercepts. Know that the slope equals the rate of change, and that the y-intercept is zero when the function represents a proportional relationship. 8.2.2.3 Identify how coefficient changes in the equation f (x) = mx + b affect the graphs of linear functions. Know how to use graphing technology to examine these effects. 8.2.4.1 Use linear equations to represent situations involving a constant rate of change, including proportional and non-proportional relationships. For example: For a cylinder with fixed radius of length 5, the surface area A = 2π(5)h + 2π(5)2 = 10πh + 50π, is a linear function of the height h, but the surface area is not proportional to the height. 8.2.4.3 Express linear equations in slope-intercept, point-slope and standard forms, and convert between these forms. Given sufficient information, find an equation of a line. For example: Determine an equation of the line through the points (-1,6) and (2/3, - 3/4).
An Alignment of The Minnesota Academic Standards for Mathematics 2007 to Connected Mathematics Project 3, ©2014, Grade 8 – Algebra 1
10
Connected Mathematics Project 3 Grade 8 – Algebra 1
Minnesota Academic Standards in Mathematics
(Continued) 2.2 Up and Down the Staircase, Exploring Slope
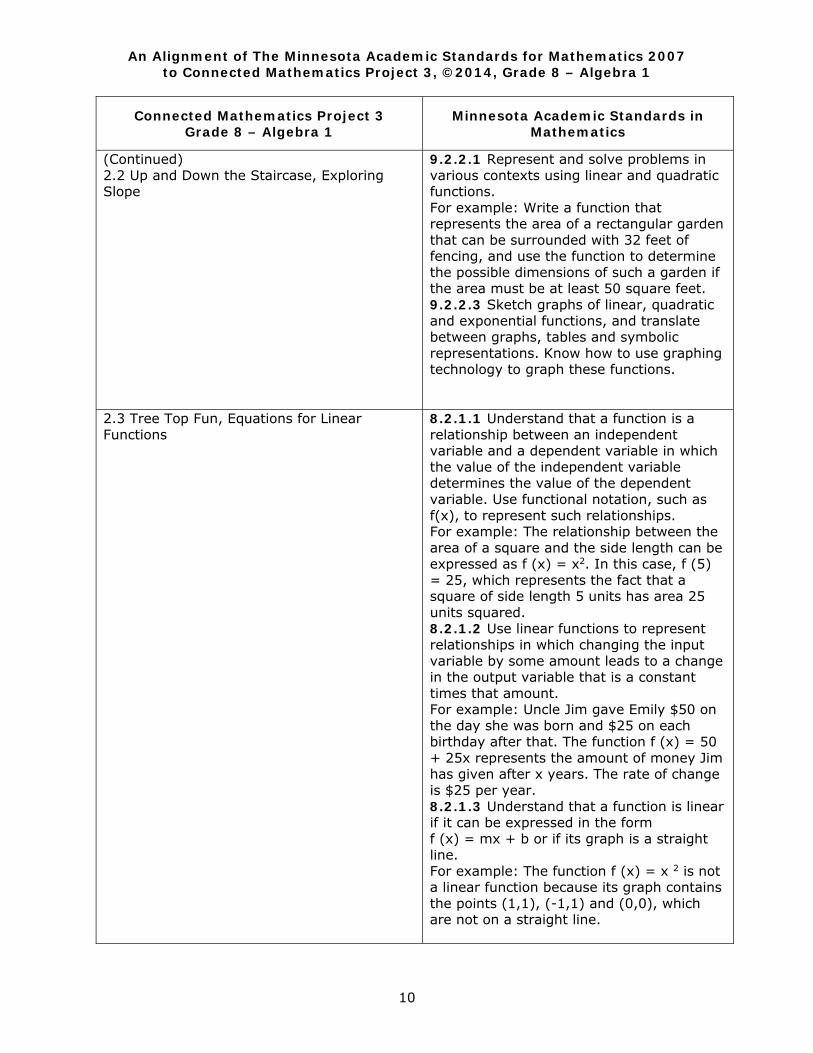
9.2.2.1 Represent and solve problems in various contexts using linear and quadratic functions. For example: Write a function that represents the area of a rectangular garden that can be surrounded with 32 feet of fencing, and use the function to determine the possible dimensions of such a garden if the area must be at least 50 square feet. 9.2.2.3 Sketch graphs of linear, quadratic and exponential functions, and translate between graphs, tables and symbolic representations. Know how to use graphing technology to graph these functions.
2.3 Tree Top Fun, Equations for Linear Functions
8.2.1.1 Understand that a function is a relationship between an independent variable and a dependent variable in which the value of the independent variable determines the value of the dependent variable. Use functional notation, such as f(x), to represent such relationships. For example: The relationship between the area of a square and the side length can be expressed as f (x) = x2. In this case, f (5) = 25, which represents the fact that a square of side length 5 units has area 25 units squared. 8.2.1.2 Use linear functions to represent relationships in which changing the input variable by some amount leads to a change in the output variable that is a constant times that amount. For example: Uncle Jim gave Emily $50 on the day she was born and $25 on each birthday after that. The function f (x) = 50 + 25x represents the amount of money Jim has given after x years. The rate of change is $25 per year. 8.2.1.3 Understand that a function is linear if it can be expressed in the form f (x) = mx + b or if its graph is a straight line. For example: The function f (x) = x 2 is not a linear function because its graph contains the points (1,1), (-1,1) and (0,0), which are not on a straight line.
An Alignment of The Minnesota Academic Standards for Mathematics 2007 to Connected Mathematics Project 3, ©2014, Grade 8 – Algebra 1
11
Connected Mathematics Project 3 Grade 8 – Algebra 1
Minnesota Academic Standards in Mathematics
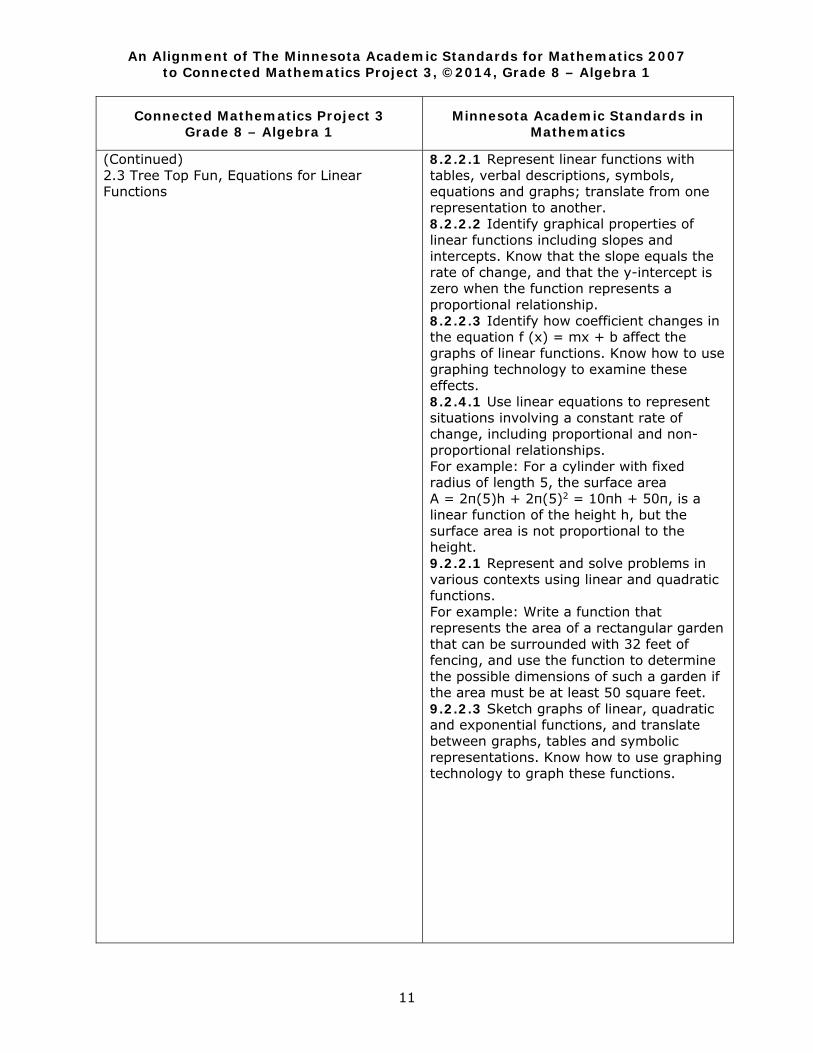
(Continued) 2.3 Tree Top Fun, Equations for Linear Functions
8.2.2.1 Represent linear functions with tables, verbal descriptions, symbols, equations and graphs; translate from one representation to another. 8.2.2.2 Identify graphical properties of linear functions including slopes and intercepts. Know that the slope equals the rate of change, and that the y-intercept is zero when the function represents a proportional relationship. 8.2.2.3 Identify how coefficient changes in the equation f (x) = mx + b affect the graphs of linear functions. Know how to use graphing technology to examine these effects. 8.2.4.1 Use linear equations to represent situations involving a constant rate of change, including proportional and non-proportional relationships. For example: For a cylinder with fixed radius of length 5, the surface area A = 2π(5)h + 2π(5)2 = 10πh + 50π, is a linear function of the height h, but the surface area is not proportional to the height. 9.2.2.1 Represent and solve problems in various contexts using linear and quadratic functions. For example: Write a function that represents the area of a rectangular garden that can be surrounded with 32 feet of fencing, and use the function to determine the possible dimensions of such a garden if the area must be at least 50 square feet. 9.2.2.3 Sketch graphs of linear, quadratic and exponential functions, and translate between graphs, tables and symbolic representations. Know how to use graphing technology to graph these functions.
An Alignment of The Minnesota Academic Standards for Mathematics 2007 to Connected Mathematics Project 3, ©2014, Grade 8 – Algebra 1
12
Connected Mathematics Project 3 Grade 8 – Algebra 1
Minnesota Academic Standards in Mathematics
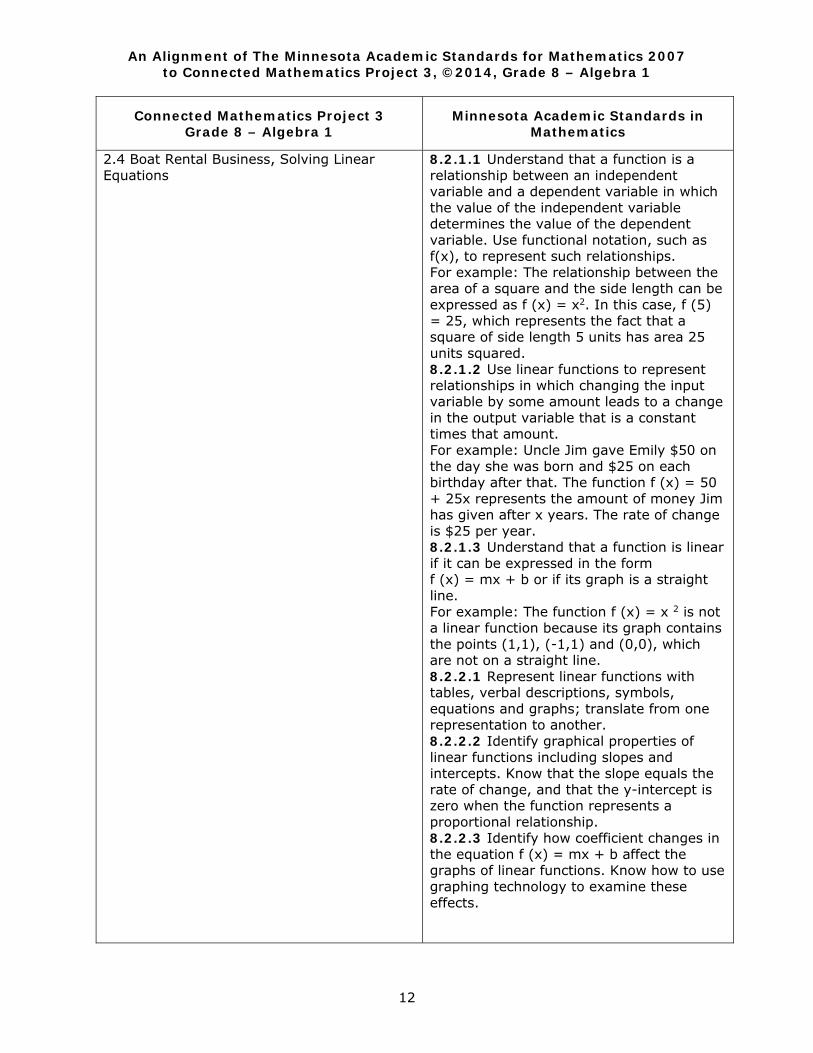
2.4 Boat Rental Business, Solving Linear Equations
8.2.1.1 Understand that a function is a relationship between an independent variable and a dependent variable in which the value of the independent variable determines the value of the dependent variable. Use functional notation, such as f(x), to represent such relationships. For example: The relationship between the area of a square and the side length can be expressed as f (x) = x2. In this case, f (5) = 25, which represents the fact that a square of side length 5 units has area 25 units squared. 8.2.1.2 Use linear functions to represent relationships in which changing the input variable by some amount leads to a change in the output variable that is a constant times that amount. For example: Uncle Jim gave Emily $50 on the day she was born and $25 on each birthday after that. The function f (x) = 50 + 25x represents the amount of money Jim has given after x years. The rate of change is $25 per year. 8.2.1.3 Understand that a function is linear if it can be expressed in the form f (x) = mx + b or if its graph is a straight line. For example: The function f (x) = x 2 is not a linear function because its graph contains the points (1,1), (-1,1) and (0,0), which are not on a straight line. 8.2.2.1 Represent linear functions with tables, verbal descriptions, symbols, equations and graphs; translate from one representation to another. 8.2.2.2 Identify graphical properties of linear functions including slopes and intercepts. Know that the slope equals the rate of change, and that the y-intercept is zero when the function represents a proportional relationship. 8.2.2.3 Identify how coefficient changes in the equation f (x) = mx + b affect the graphs of linear functions. Know how to use graphing technology to examine these effects.
An Alignment of The Minnesota Academic Standards for Mathematics 2007 to Connected Mathematics Project 3, ©2014, Grade 8 – Algebra 1
13
Connected Mathematics Project 3 Grade 8 – Algebra 1
Minnesota Academic Standards in Mathematics
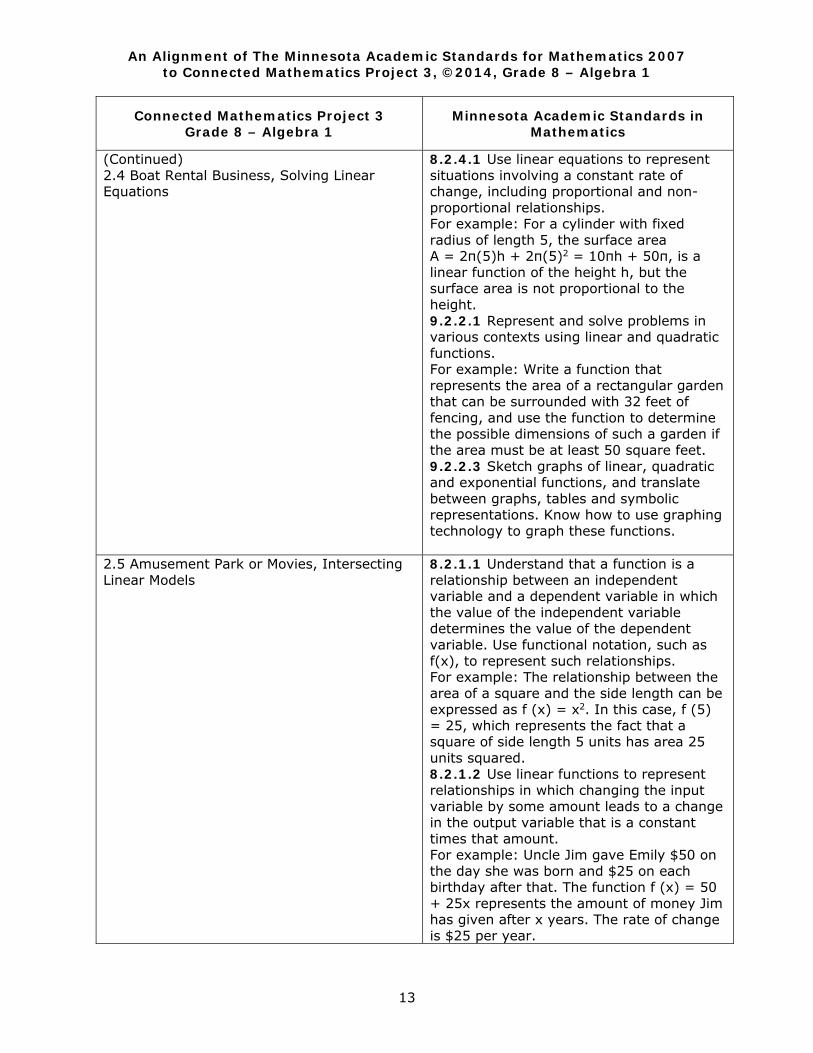
(Continued) 2.4 Boat Rental Business, Solving Linear Equations
8.2.4.1 Use linear equations to represent situations involving a constant rate of change, including proportional and non-proportional relationships. For example: For a cylinder with fixed radius of length 5, the surface area A = 2π(5)h + 2π(5)2 = 10πh + 50π, is a linear function of the height h, but the surface area is not proportional to the height. 9.2.2.1 Represent and solve problems in various contexts using linear and quadratic functions. For example: Write a function that represents the area of a rectangular garden that can be surrounded with 32 feet of fencing, and use the function to determine the possible dimensions of such a garden if the area must be at least 50 square feet. 9.2.2.3 Sketch graphs of linear, quadratic and exponential functions, and translate between graphs, tables and symbolic representations. Know how to use graphing technology to graph these functions.
2.5 Amusement Park or Movies, Intersecting Linear Models
8.2.1.1 Understand that a function is a relationship between an independent variable and a dependent variable in which the value of the independent variable determines the value of the dependent variable. Use functional notation, such as f(x), to represent such relationships. For example: The relationship between the area of a square and the side length can be expressed as f (x) = x2. In this case, f (5) = 25, which represents the fact that a square of side length 5 units has area 25 units squared. 8.2.1.2 Use linear functions to represent relationships in which changing the input variable by some amount leads to a change in the output variable that is a constant times that amount. For example: Uncle Jim gave Emily $50 on the day she was born and $25 on each birthday after that. The function f (x) = 50 + 25x represents the amount of money Jim has given after x years. The rate of change is $25 per year.
An Alignment of The Minnesota Academic Standards for Mathematics 2007 to Connected Mathematics Project 3, ©2014, Grade 8 – Algebra 1
14
Connected Mathematics Project 3 Grade 8 – Algebra 1
Minnesota Academic Standards in Mathematics
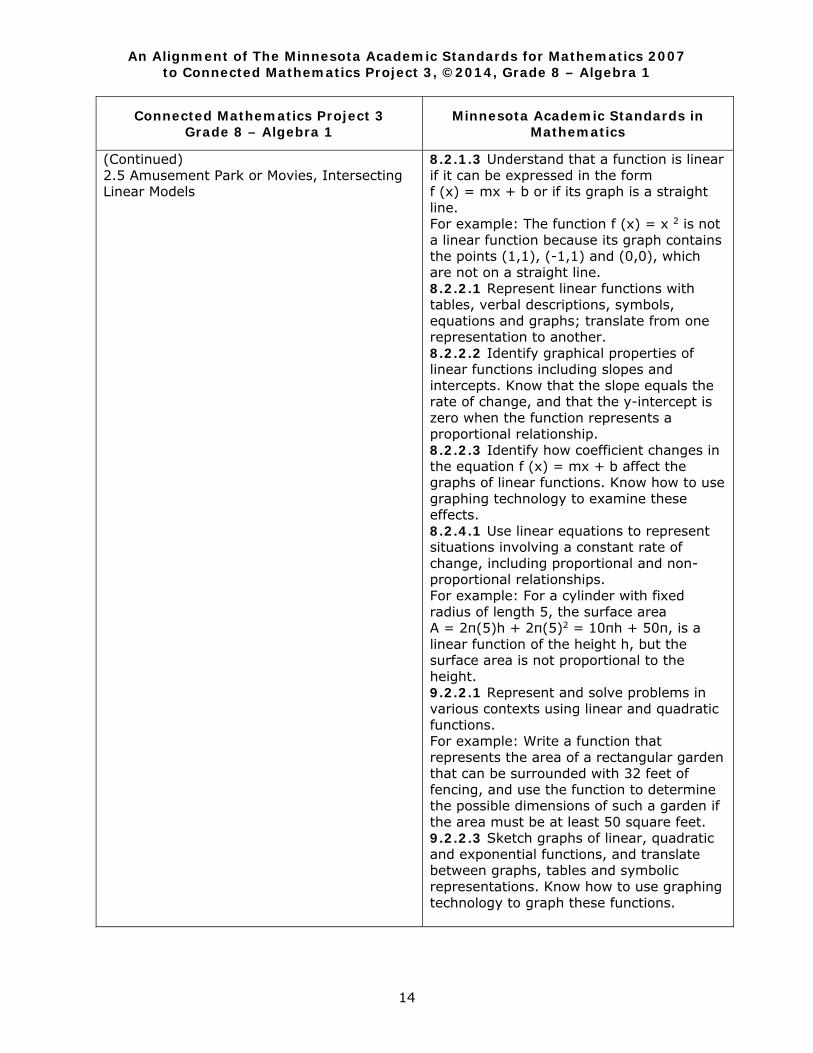
(Continued) 2.5 Amusement Park or Movies, Intersecting Linear Models
8.2.1.3 Understand that a function is linear if it can be expressed in the form f (x) = mx + b or if its graph is a straight line. For example: The function f (x) = x 2 is not a linear function because its graph contains the points (1,1), (-1,1) and (0,0), which are not on a straight line. 8.2.2.1 Represent linear functions with tables, verbal descriptions, symbols, equations and graphs; translate from one representation to another. 8.2.2.2 Identify graphical properties of linear functions including slopes and intercepts. Know that the slope equals the rate of change, and that the y-intercept is zero when the function represents a proportional relationship. 8.2.2.3 Identify how coefficient changes in the equation f (x) = mx + b affect the graphs of linear functions. Know how to use graphing technology to examine these effects. 8.2.4.1 Use linear equations to represent situations involving a constant rate of change, including proportional and non-proportional relationships. For example: For a cylinder with fixed radius of length 5, the surface area A = 2π(5)h + 2π(5)2 = 10πh + 50π, is a linear function of the height h, but the surface area is not proportional to the height. 9.2.2.1 Represent and solve problems in various contexts using linear and quadratic functions. For example: Write a function that represents the area of a rectangular garden that can be surrounded with 32 feet of fencing, and use the function to determine the possible dimensions of such a garden if the area must be at least 50 square feet. 9.2.2.3 Sketch graphs of linear, quadratic and exponential functions, and translate between graphs, tables and symbolic representations. Know how to use graphing technology to graph these functions.
An Alignment of The Minnesota Academic Standards for Mathematics 2007 to Connected Mathematics Project 3, ©2014, Grade 8 – Algebra 1
15
Connected Mathematics Project 3 Grade 8 – Algebra 1
Minnesota Academic Standards in Mathematics
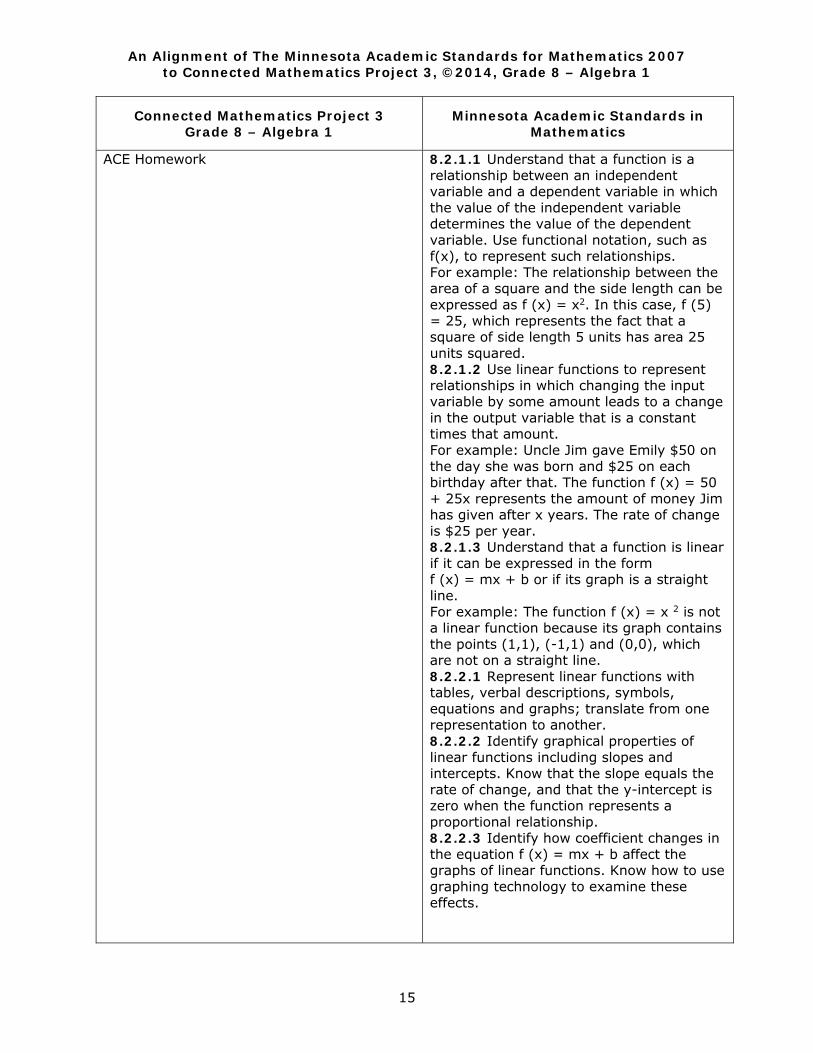
ACE Homework
8.2.1.1 Understand that a function is a relationship between an independent variable and a dependent variable in which the value of the independent variable determines the value of the dependent variable. Use functional notation, such as f(x), to represent such relationships. For example: The relationship between the area of a square and the side length can be expressed as f (x) = x2. In this case, f (5) = 25, which represents the fact that a square of side length 5 units has area 25 units squared. 8.2.1.2 Use linear functions to represent relationships in which changing the input variable by some amount leads to a change in the output variable that is a constant times that amount. For example: Uncle Jim gave Emily $50 on the day she was born and $25 on each birthday after that. The function f (x) = 50 + 25x represents the amount of money Jim has given after x years. The rate of change is $25 per year. 8.2.1.3 Understand that a function is linear if it can be expressed in the form f (x) = mx + b or if its graph is a straight line. For example: The function f (x) = x 2 is not a linear function because its graph contains the points (1,1), (-1,1) and (0,0), which are not on a straight line. 8.2.2.1 Represent linear functions with tables, verbal descriptions, symbols, equations and graphs; translate from one representation to another. 8.2.2.2 Identify graphical properties of linear functions including slopes and intercepts. Know that the slope equals the rate of change, and that the y-intercept is zero when the function represents a proportional relationship. 8.2.2.3 Identify how coefficient changes in the equation f (x) = mx + b affect the graphs of linear functions. Know how to use graphing technology to examine these effects.
An Alignment of The Minnesota Academic Standards for Mathematics 2007 to Connected Mathematics Project 3, ©2014, Grade 8 – Algebra 1
16
Connected Mathematics Project 3 Grade 8 – Algebra 1
Minnesota Academic Standards in Mathematics
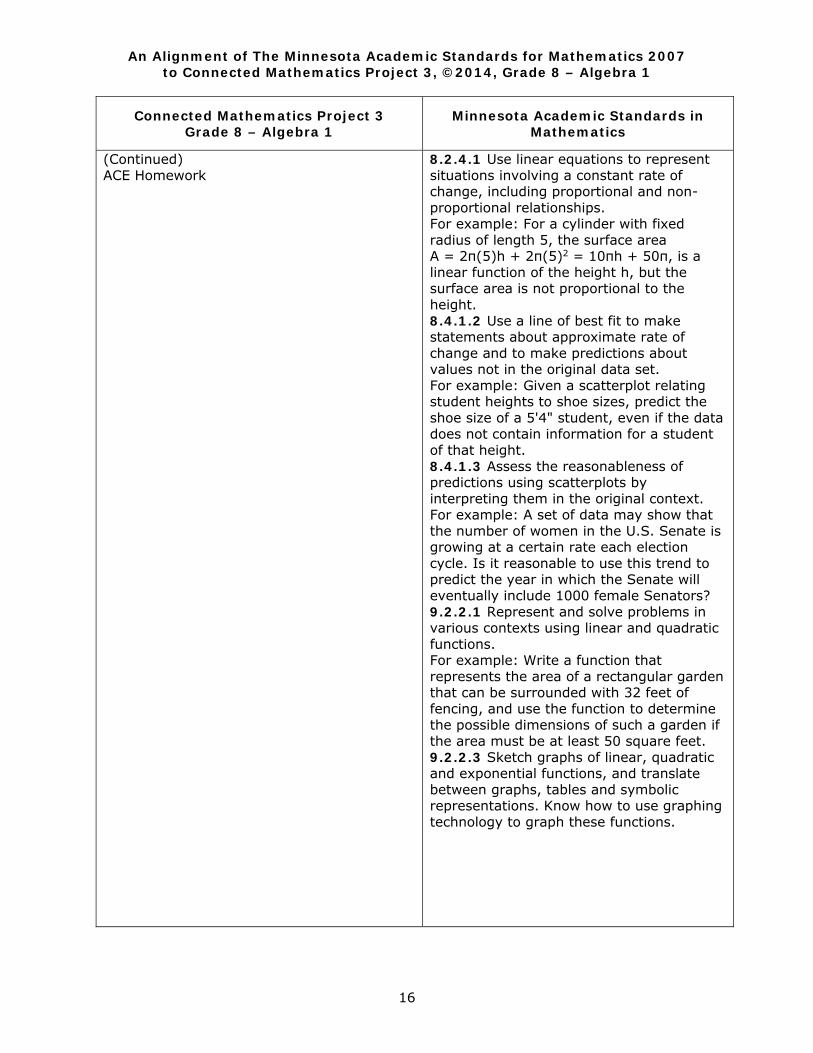
(Continued) ACE Homework
8.2.4.1 Use linear equations to represent situations involving a constant rate of change, including proportional and non-proportional relationships. For example: For a cylinder with fixed radius of length 5, the surface area A = 2π(5)h + 2π(5)2 = 10πh + 50π, is a linear function of the height h, but the surface area is not proportional to the height. 8.4.1.2 Use a line of best fit to make statements about approximate rate of change and to make predictions about values not in the original data set. For example: Given a scatterplot relating student heights to shoe sizes, predict the shoe size of a 5'4" student, even if the data does not contain information for a student of that height. 8.4.1.3 Assess the reasonableness of predictions using scatterplots by interpreting them in the original context. For example: A set of data may show that the number of women in the U.S. Senate is growing at a certain rate each election cycle. Is it reasonable to use this trend to predict the year in which the Senate will eventually include 1000 female Senators? 9.2.2.1 Represent and solve problems in various contexts using linear and quadratic functions. For example: Write a function that represents the area of a rectangular garden that can be surrounded with 32 feet of fencing, and use the function to determine the possible dimensions of such a garden if the area must be at least 50 square feet. 9.2.2.3 Sketch graphs of linear, quadratic and exponential functions, and translate between graphs, tables and symbolic representations. Know how to use graphing technology to graph these functions.

An Alignment of The Minnesota Academic Standards for Mathematics 2007 to Connected Mathematics Project 3, ©2014, Grade 8 – Algebra 1
17
Connected Mathematics Project 3 Grade 8 – Algebra 1
Minnesota Academic Standards in Mathematics
Mathematical Reflections
8.2.1.1 Understand that a function is a relationship between an independent variable and a dependent variable in which the value of the independent variable determines the value of the dependent variable. Use functional notation, such as f(x), to represent such relationships. For example: The relationship between the area of a square and the side length can be expressed as f (x) = x2. In this case, f (5) = 25, which represents the fact that a square of side length 5 units has area 25 units squared. 8.2.1.2 Use linear functions to represent relationships in which changing the input variable by some amount leads to a change in the output variable that is a constant times that amount. For example: Uncle Jim gave Emily $50 on the day she was born and $25 on each birthday after that. The function f (x) = 50 + 25x represents the amount of money Jim has given after x years. The rate of change is $25 per year. 8.2.1.3 Understand that a function is linear if it can be expressed in the form f (x) = mx + b or if its graph is a straight line. For example: The function f (x) = x 2 is not a linear function because its graph contains the points (1,1), (-1,1) and (0,0), which are not on a straight line. 8.2.2.1 Represent linear functions with tables, verbal descriptions, symbols, equations and graphs; translate from one representation to another. 8.2.2.2 Identify graphical properties of linear functions including slopes and intercepts. Know that the slope equals the rate of change, and that the y-intercept is zero when the function represents a proportional relationship. 8.2.2.3 Identify how coefficient changes in the equation f (x) = mx + b affect the graphs of linear functions. Know how to use graphing technology to examine these effects.
An Alignment of The Minnesota Academic Standards for Mathematics 2007 to Connected Mathematics Project 3, ©2014, Grade 8 – Algebra 1
18
Connected Mathematics Project 3 Grade 8 – Algebra 1
Minnesota Academic Standards in Mathematics
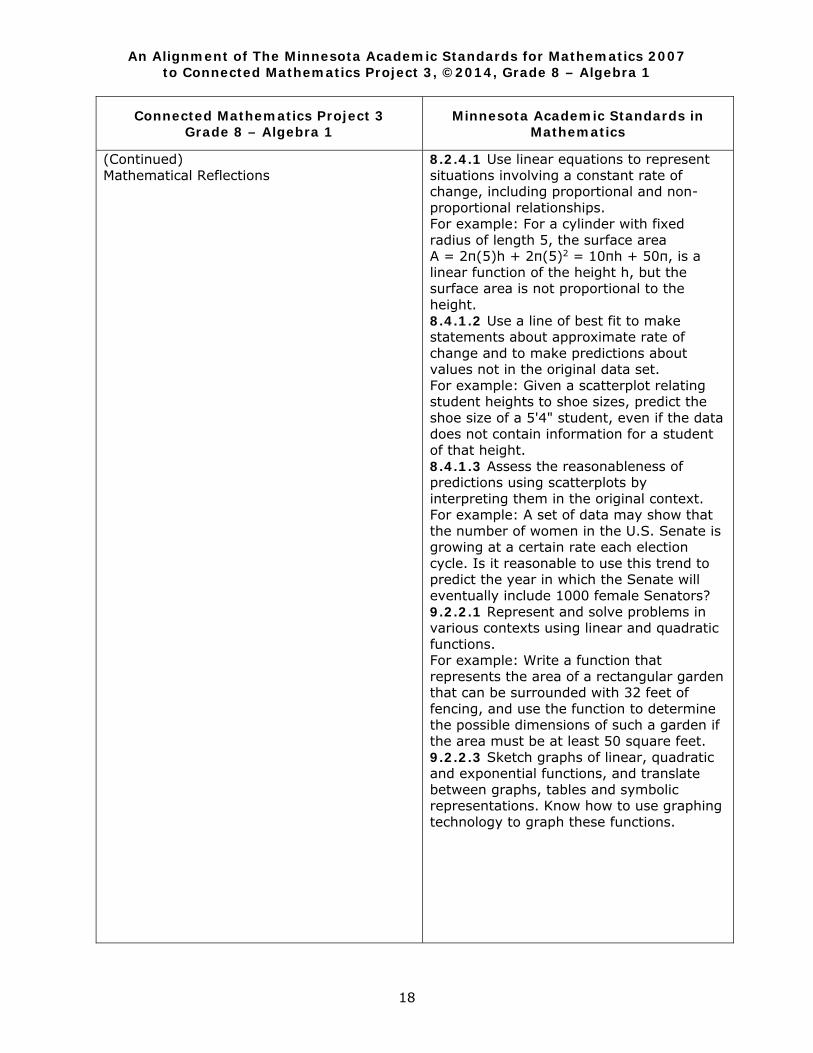
(Continued) Mathematical Reflections
8.2.4.1 Use linear equations to represent situations involving a constant rate of change, including proportional and non-proportional relationships. For example: For a cylinder with fixed radius of length 5, the surface area A = 2π(5)h + 2π(5)2 = 10πh + 50π, is a linear function of the height h, but the surface area is not proportional to the height. 8.4.1.2 Use a line of best fit to make statements about approximate rate of change and to make predictions about values not in the original data set. For example: Given a scatterplot relating student heights to shoe sizes, predict the shoe size of a 5'4" student, even if the data does not contain information for a student of that height. 8.4.1.3 Assess the reasonableness of predictions using scatterplots by interpreting them in the original context. For example: A set of data may show that the number of women in the U.S. Senate is growing at a certain rate each election cycle. Is it reasonable to use this trend to predict the year in which the Senate will eventually include 1000 female Senators? 9.2.2.1 Represent and solve problems in various contexts using linear and quadratic functions. For example: Write a function that represents the area of a rectangular garden that can be surrounded with 32 feet of fencing, and use the function to determine the possible dimensions of such a garden if the area must be at least 50 square feet. 9.2.2.3 Sketch graphs of linear, quadratic and exponential functions, and translate between graphs, tables and symbolic representations. Know how to use graphing technology to graph these functions.
An Alignment of The Minnesota Academic Standards for Mathematics 2007 to Connected Mathematics Project 3, ©2014, Grade 8 – Algebra 1
19
Connected Mathematics Project 3 Grade 8 – Algebra 1
Minnesota Academic Standards in Mathematics
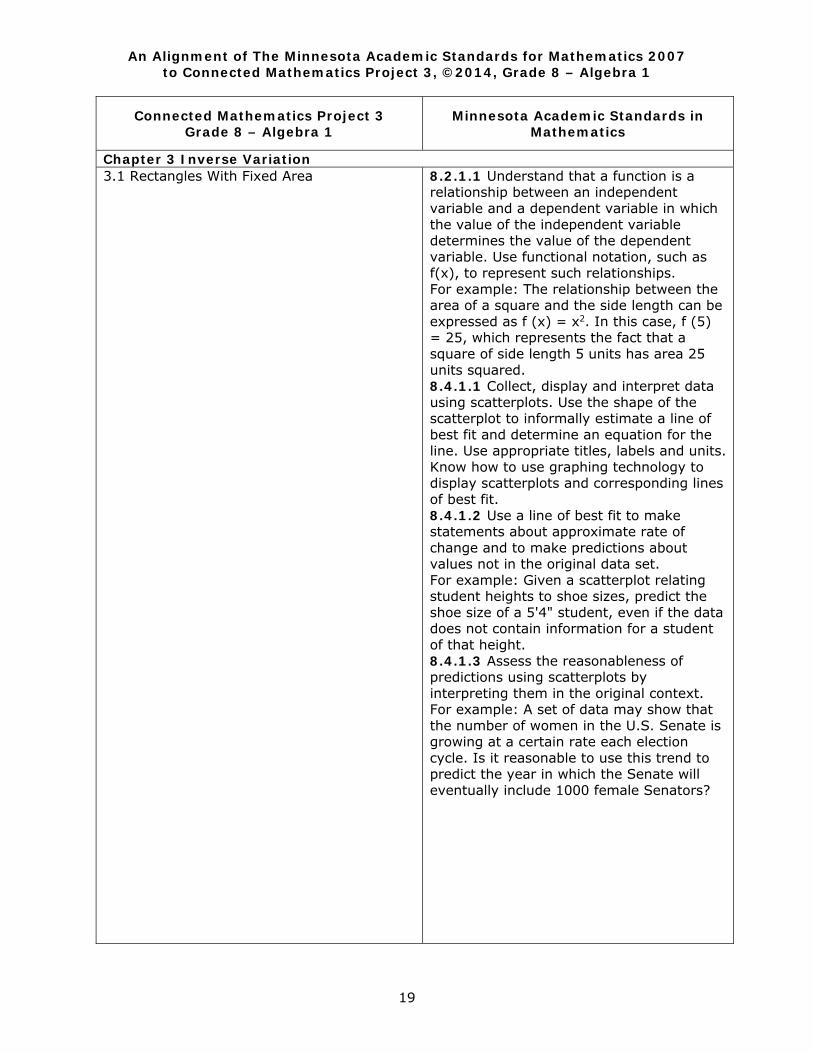
Chapter 3 Inverse Variation 3.1 Rectangles With Fixed Area
8.2.1.1 Understand that a function is a relationship between an independent variable and a dependent variable in which the value of the independent variable determines the value of the dependent variable. Use functional notation, such as f(x), to represent such relationships. For example: The relationship between the area of a square and the side length can be expressed as f (x) = x2. In this case, f (5) = 25, which represents the fact that a square of side length 5 units has area 25 units squared. 8.4.1.1 Collect, display and interpret data using scatterplots. Use the shape of the scatterplot to informally estimate a line of best fit and determine an equation for the line. Use appropriate titles, labels and units. Know how to use graphing technology to display scatterplots and corresponding lines of best fit. 8.4.1.2 Use a line of best fit to make statements about approximate rate of change and to make predictions about values not in the original data set. For example: Given a scatterplot relating student heights to shoe sizes, predict the shoe size of a 5'4" student, even if the data does not contain information for a student of that height. 8.4.1.3 Assess the reasonableness of predictions using scatterplots by interpreting them in the original context. For example: A set of data may show that the number of women in the U.S. Senate is growing at a certain rate each election cycle. Is it reasonable to use this trend to predict the year in which the Senate will eventually include 1000 female Senators?

An Alignment of The Minnesota Academic Standards for Mathematics 2007 to Connected Mathematics Project 3, ©2014, Grade 8 – Algebra 1
20
Connected Mathematics Project 3 Grade 8 – Algebra 1
Minnesota Academic Standards in Mathematics
3.2 Distance, Speed and Time
8.2.1.1 Understand that a function is a relationship between an independent variable and a dependent variable in which the value of the independent variable determines the value of the dependent variable. Use functional notation, such as f(x), to represent such relationships. For example: The relationship between the area of a square and the side length can be expressed as f (x) = x2. In this case, f (5) = 25, which represents the fact that a square of side length 5 units has area 25 units squared. 8.2.1.2 Use linear functions to represent relationships in which changing the input variable by some amount leads to a change in the output variable that is a constant times that amount. For example: Uncle Jim gave Emily $50 on the day she was born and $25 on each birthday after that. The function f (x) = 50 + 25x represents the amount of money Jim has given after x years. The rate of change is $25 per year. 8.2.1.3 Understand that a function is linear if it can be expressed in the form f (x) = mx + b or if its graph is a straight line. For example: The function f (x) = x 2 is not a linear function because its graph contains the points (1,1), (-1,1) and (0,0), which are not on a straight line. 8.2.2.1 Represent linear functions with tables, verbal descriptions, symbols, equations and graphs; translate from one representation to another. 8.2.2.2 Identify graphical properties of linear functions including slopes and intercepts. Know that the slope equals the rate of change, and that the y-intercept is zero when the function represents a proportional relationship. 8.2.2.3 Identify how coefficient changes in the equation f (x) = mx + b affect the graphs of linear functions. Know how to use graphing technology to examine these effects.
An Alignment of The Minnesota Academic Standards for Mathematics 2007 to Connected Mathematics Project 3, ©2014, Grade 8 – Algebra 1
21
Connected Mathematics Project 3 Grade 8 – Algebra 1
Minnesota Academic Standards in Mathematics
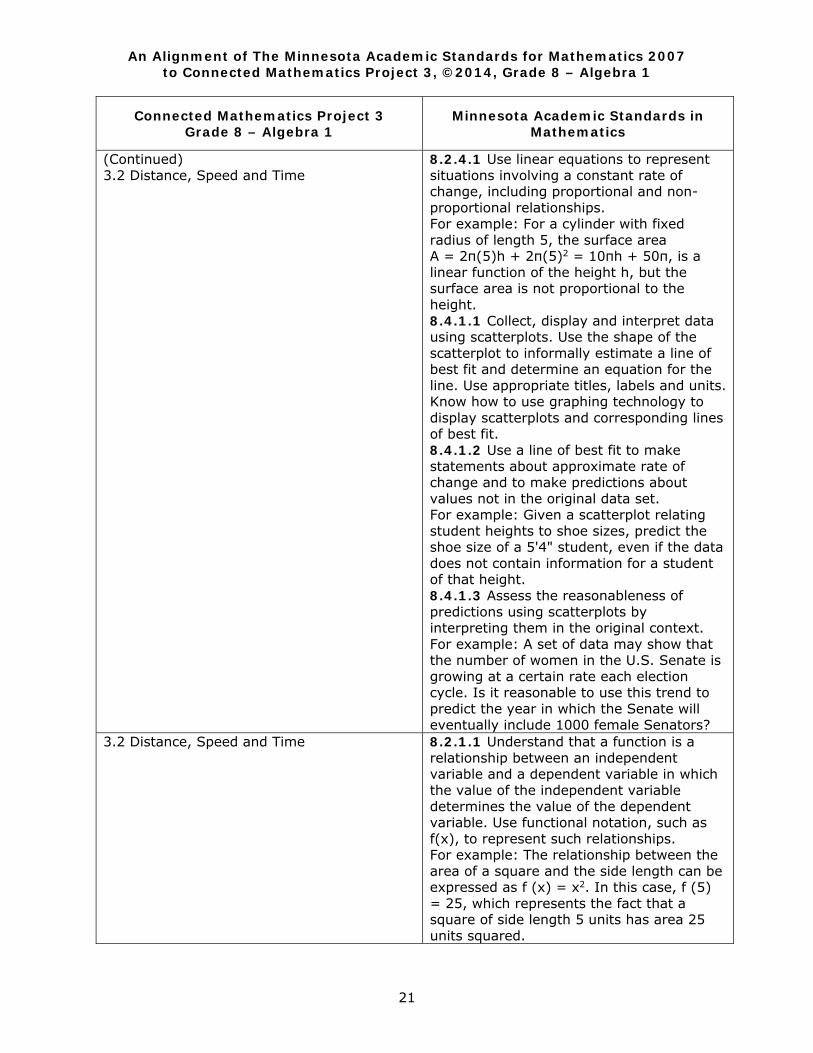
(Continued) 3.2 Distance, Speed and Time
8.2.4.1 Use linear equations to represent situations involving a constant rate of change, including proportional and non-proportional relationships. For example: For a cylinder with fixed radius of length 5, the surface area A = 2π(5)h + 2π(5)2 = 10πh + 50π, is a linear function of the height h, but the surface area is not proportional to the height. 8.4.1.1 Collect, display and interpret data using scatterplots. Use the shape of the scatterplot to informally estimate a line of best fit and determine an equation for the line. Use appropriate titles, labels and units. Know how to use graphing technology to display scatterplots and corresponding lines of best fit. 8.4.1.2 Use a line of best fit to make statements about approximate rate of change and to make predictions about values not in the original data set. For example: Given a scatterplot relating student heights to shoe sizes, predict the shoe size of a 5'4" student, even if the data does not contain information for a student of that height. 8.4.1.3 Assess the reasonableness of predictions using scatterplots by interpreting them in the original context. For example: A set of data may show that the number of women in the U.S. Senate is growing at a certain rate each election cycle. Is it reasonable to use this trend to predict the year in which the Senate will eventually include 1000 female Senators?
3.2 Distance, Speed and Time
8.2.1.1 Understand that a function is a relationship between an independent variable and a dependent variable in which the value of the independent variable determines the value of the dependent variable. Use functional notation, such as f(x), to represent such relationships. For example: The relationship between the area of a square and the side length can be expressed as f (x) = x2. In this case, f (5) = 25, which represents the fact that a square of side length 5 units has area 25 units squared.
An Alignment of The Minnesota Academic Standards for Mathematics 2007 to Connected Mathematics Project 3, ©2014, Grade 8 – Algebra 1
22
Connected Mathematics Project 3 Grade 8 – Algebra 1
Minnesota Academic Standards in Mathematics
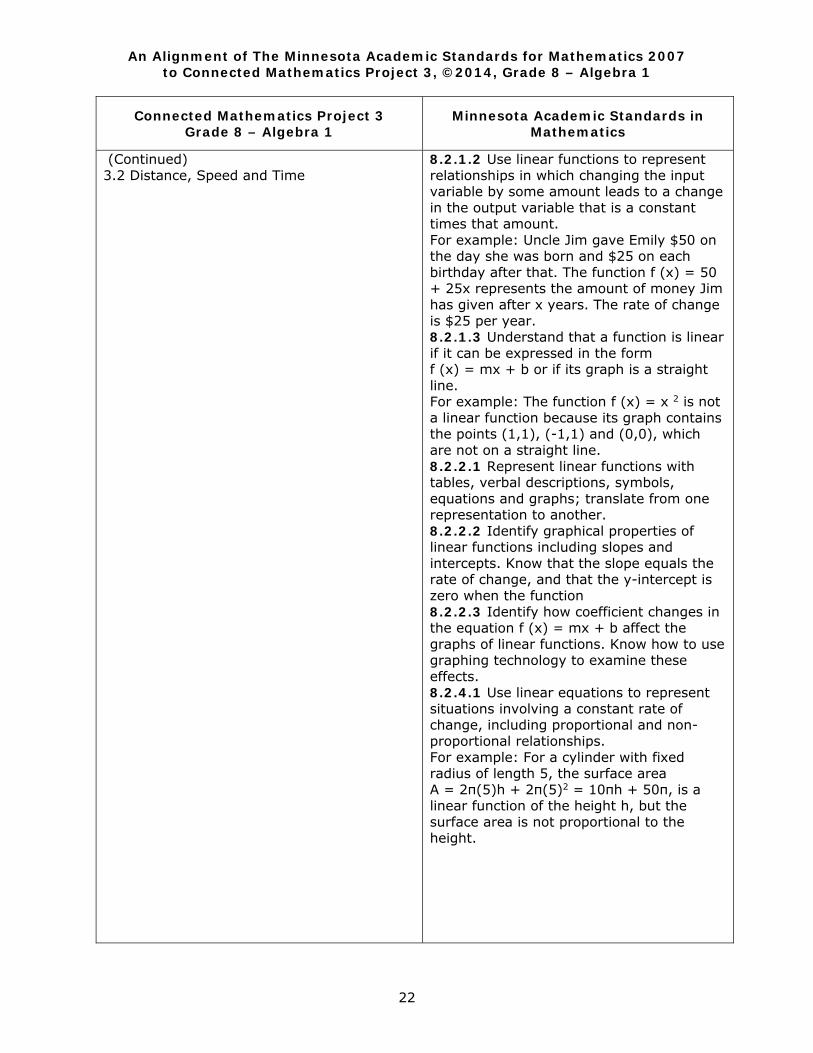
(Continued) 3.2 Distance, Speed and Time
8.2.1.2 Use linear functions to represent relationships in which changing the input variable by some amount leads to a change in the output variable that is a constant times that amount. For example: Uncle Jim gave Emily $50 on the day she was born and $25 on each birthday after that. The function f (x) = 50 + 25x represents the amount of money Jim has given after x years. The rate of change is $25 per year. 8.2.1.3 Understand that a function is linear if it can be expressed in the form f (x) = mx + b or if its graph is a straight line. For example: The function f (x) = x 2 is not a linear function because its graph contains the points (1,1), (-1,1) and (0,0), which are not on a straight line. 8.2.2.1 Represent linear functions with tables, verbal descriptions, symbols, equations and graphs; translate from one representation to another. 8.2.2.2 Identify graphical properties of linear functions including slopes and intercepts. Know that the slope equals the rate of change, and that the y-intercept is zero when the function 8.2.2.3 Identify how coefficient changes in the equation f (x) = mx + b affect the graphs of linear functions. Know how to use graphing technology to examine these effects. 8.2.4.1 Use linear equations to represent situations involving a constant rate of change, including proportional and non-proportional relationships. For example: For a cylinder with fixed radius of length 5, the surface area A = 2π(5)h + 2π(5)2 = 10πh + 50π, is a linear function of the height h, but the surface area is not proportional to the height.
An Alignment of The Minnesota Academic Standards for Mathematics 2007 to Connected Mathematics Project 3, ©2014, Grade 8 – Algebra 1
23
Connected Mathematics Project 3 Grade 8 – Algebra 1
Minnesota Academic Standards in Mathematics
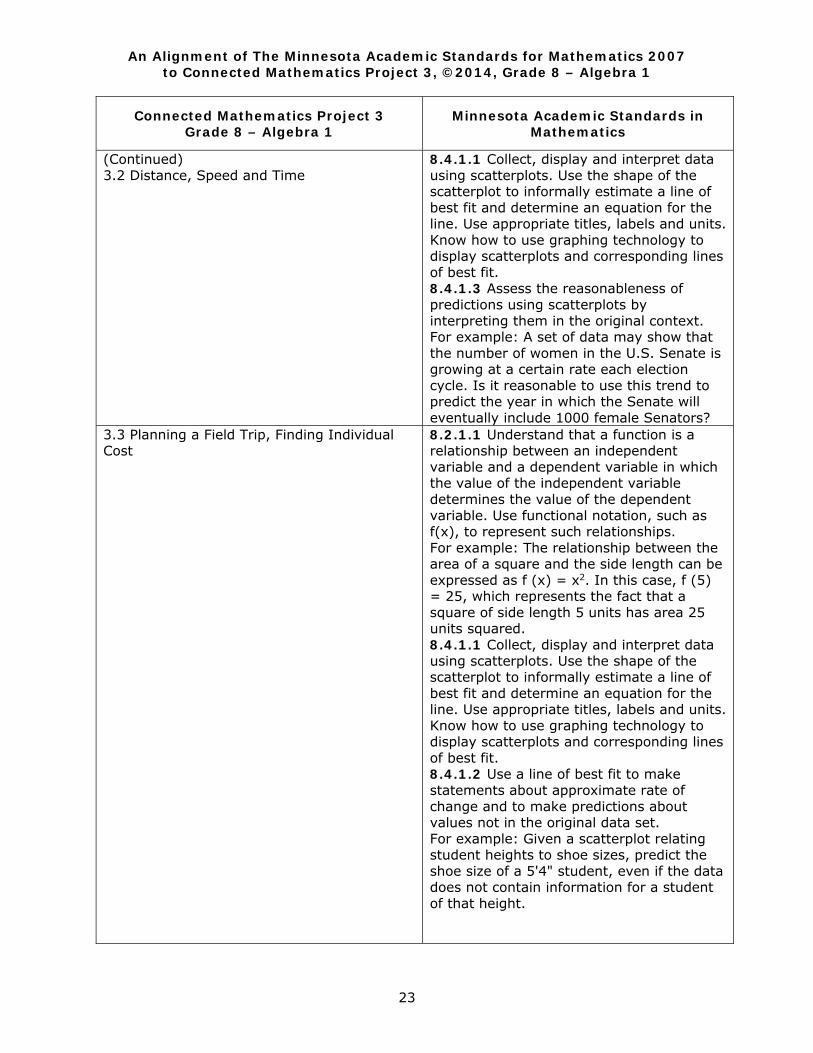
(Continued) 3.2 Distance, Speed and Time
8.4.1.1 Collect, display and interpret data using scatterplots. Use the shape of the scatterplot to informally estimate a line of best fit and determine an equation for the line. Use appropriate titles, labels and units. Know how to use graphing technology to display scatterplots and corresponding lines of best fit. 8.4.1.3 Assess the reasonableness of predictions using scatterplots by interpreting them in the original context. For example: A set of data may show that the number of women in the U.S. Senate is growing at a certain rate each election cycle. Is it reasonable to use this trend to predict the year in which the Senate will eventually include 1000 female Senators?
3.3 Planning a Field Trip, Finding Individual Cost
8.2.1.1 Understand that a function is a relationship between an independent variable and a dependent variable in which the value of the independent variable determines the value of the dependent variable. Use functional notation, such as f(x), to represent such relationships. For example: The relationship between the area of a square and the side length can be expressed as f (x) = x2. In this case, f (5) = 25, which represents the fact that a square of side length 5 units has area 25 units squared. 8.4.1.1 Collect, display and interpret data using scatterplots. Use the shape of the scatterplot to informally estimate a line of best fit and determine an equation for the line. Use appropriate titles, labels and units. Know how to use graphing technology to display scatterplots and corresponding lines of best fit. 8.4.1.2 Use a line of best fit to make statements about approximate rate of change and to make predictions about values not in the original data set. For example: Given a scatterplot relating student heights to shoe sizes, predict the shoe size of a 5'4" student, even if the data does not contain information for a student of that height.
An Alignment of The Minnesota Academic Standards for Mathematics 2007 to Connected Mathematics Project 3, ©2014, Grade 8 – Algebra 1
24
Connected Mathematics Project 3 Grade 8 – Algebra 1
Minnesota Academic Standards in Mathematics
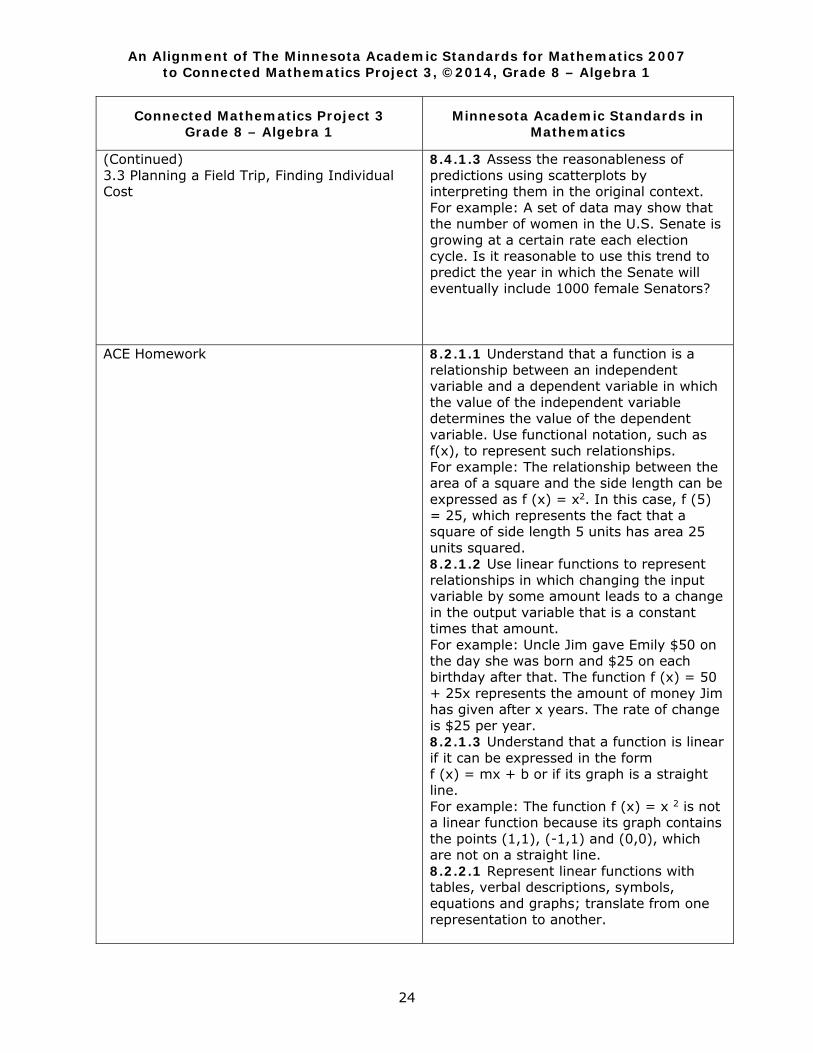
(Continued) 3.3 Planning a Field Trip, Finding Individual Cost
8.4.1.3 Assess the reasonableness of predictions using scatterplots by interpreting them in the original context. For example: A set of data may show that the number of women in the U.S. Senate is growing at a certain rate each election cycle. Is it reasonable to use this trend to predict the year in which the Senate will eventually include 1000 female Senators?
ACE Homework
8.2.1.1 Understand that a function is a relationship between an independent variable and a dependent variable in which the value of the independent variable determines the value of the dependent variable. Use functional notation, such as f(x), to represent such relationships. For example: The relationship between the area of a square and the side length can be expressed as f (x) = x2. In this case, f (5) = 25, which represents the fact that a square of side length 5 units has area 25 units squared. 8.2.1.2 Use linear functions to represent relationships in which changing the input variable by some amount leads to a change in the output variable that is a constant times that amount. For example: Uncle Jim gave Emily $50 on the day she was born and $25 on each birthday after that. The function f (x) = 50 + 25x represents the amount of money Jim has given after x years. The rate of change is $25 per year. 8.2.1.3 Understand that a function is linear if it can be expressed in the form f (x) = mx + b or if its graph is a straight line. For example: The function f (x) = x 2 is not a linear function because its graph contains the points (1,1), (-1,1) and (0,0), which are not on a straight line. 8.2.2.1 Represent linear functions with tables, verbal descriptions, symbols, equations and graphs; translate from one representation to another.
An Alignment of The Minnesota Academic Standards for Mathematics 2007 to Connected Mathematics Project 3, ©2014, Grade 8 – Algebra 1
25
Connected Mathematics Project 3 Grade 8 – Algebra 1
Minnesota Academic Standards in Mathematics
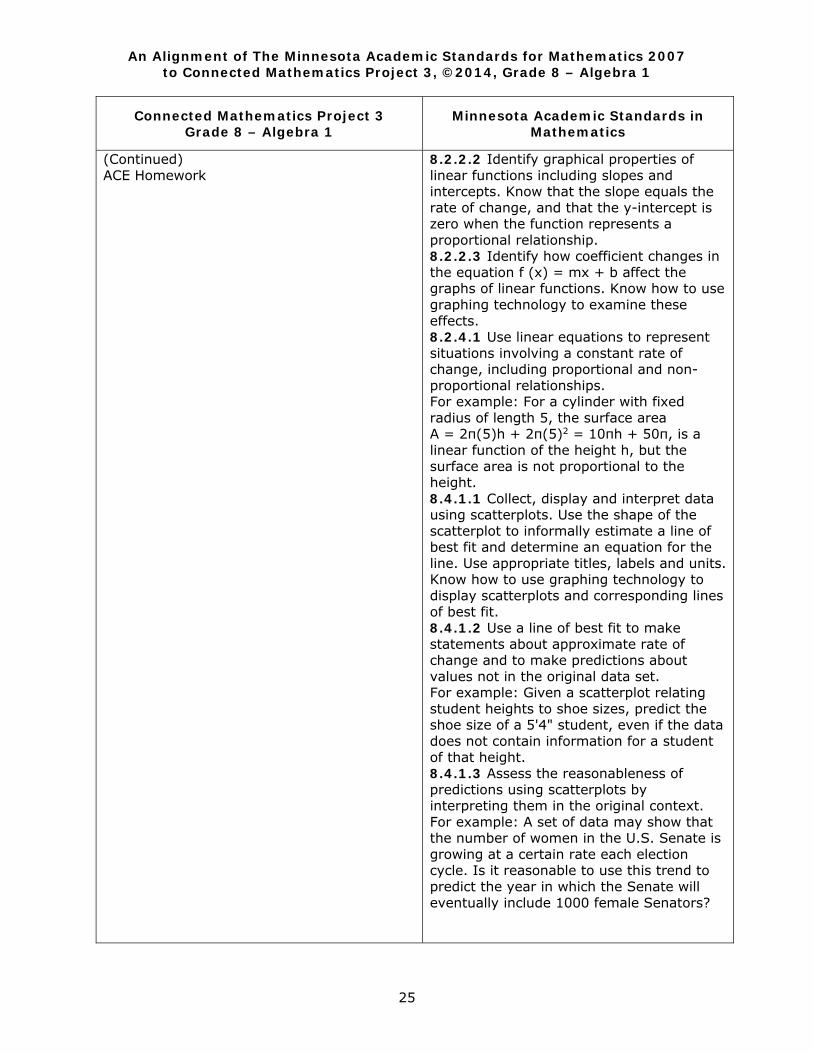
(Continued) ACE Homework
8.2.2.2 Identify graphical properties of linear functions including slopes and intercepts. Know that the slope equals the rate of change, and that the y-intercept is zero when the function represents a proportional relationship. 8.2.2.3 Identify how coefficient changes in the equation f (x) = mx + b affect the graphs of linear functions. Know how to use graphing technology to examine these effects. 8.2.4.1 Use linear equations to represent situations involving a constant rate of change, including proportional and non-proportional relationships. For example: For a cylinder with fixed radius of length 5, the surface area A = 2π(5)h + 2π(5)2 = 10πh + 50π, is a linear function of the height h, but the surface area is not proportional to the height. 8.4.1.1 Collect, display and interpret data using scatterplots. Use the shape of the scatterplot to informally estimate a line of best fit and determine an equation for the line. Use appropriate titles, labels and units. Know how to use graphing technology to display scatterplots and corresponding lines of best fit. 8.4.1.2 Use a line of best fit to make statements about approximate rate of change and to make predictions about values not in the original data set. For example: Given a scatterplot relating student heights to shoe sizes, predict the shoe size of a 5'4" student, even if the data does not contain information for a student of that height. 8.4.1.3 Assess the reasonableness of predictions using scatterplots by interpreting them in the original context. For example: A set of data may show that the number of women in the U.S. Senate is growing at a certain rate each election cycle. Is it reasonable to use this trend to predict the year in which the Senate will eventually include 1000 female Senators?
An Alignment of The Minnesota Academic Standards for Mathematics 2007 to Connected Mathematics Project 3, ©2014, Grade 8 – Algebra 1
26
Connected Mathematics Project 3 Grade 8 – Algebra 1
Minnesota Academic Standards in Mathematics
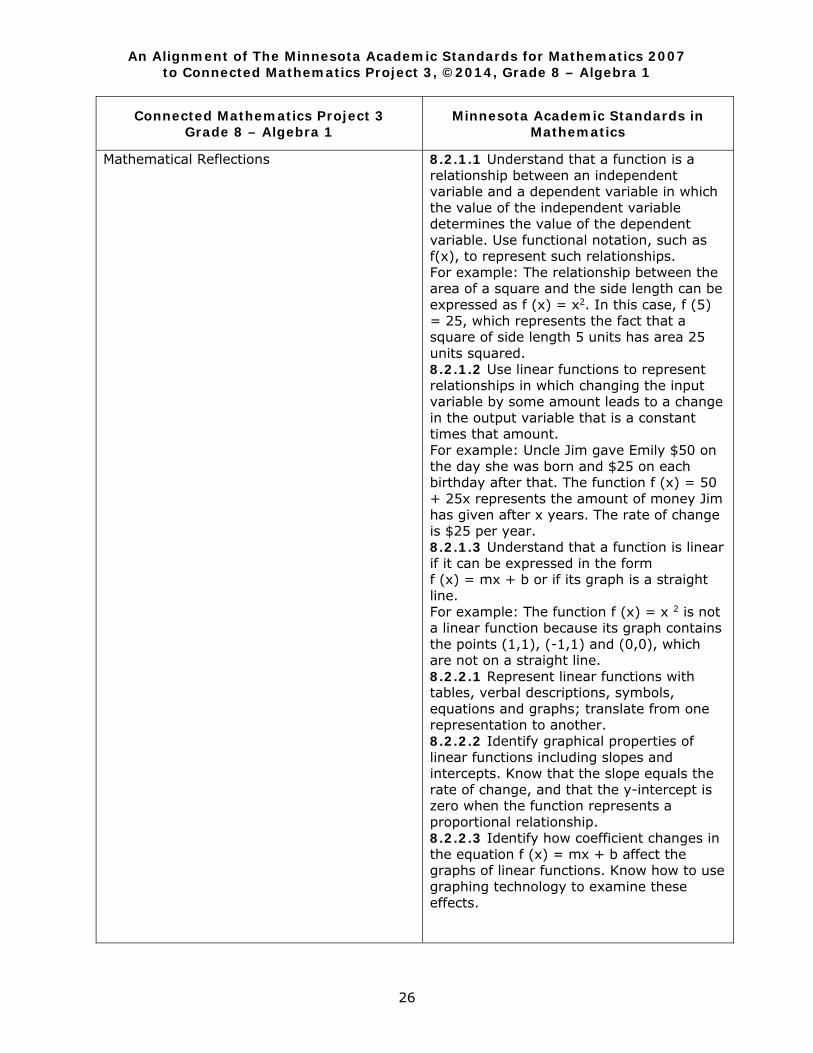
Mathematical Reflections
8.2.1.1 Understand that a function is a relationship between an independent variable and a dependent variable in which the value of the independent variable determines the value of the dependent variable. Use functional notation, such as f(x), to represent such relationships. For example: The relationship between the area of a square and the side length can be expressed as f (x) = x2. In this case, f (5) = 25, which represents the fact that a square of side length 5 units has area 25 units squared. 8.2.1.2 Use linear functions to represent relationships in which changing the input variable by some amount leads to a change in the output variable that is a constant times that amount. For example: Uncle Jim gave Emily $50 on the day she was born and $25 on each birthday after that. The function f (x) = 50 + 25x represents the amount of money Jim has given after x years. The rate of change is $25 per year. 8.2.1.3 Understand that a function is linear if it can be expressed in the form f (x) = mx + b or if its graph is a straight line. For example: The function f (x) = x 2 is not a linear function because its graph contains the points (1,1), (-1,1) and (0,0), which are not on a straight line. 8.2.2.1 Represent linear functions with tables, verbal descriptions, symbols, equations and graphs; translate from one representation to another. 8.2.2.2 Identify graphical properties of linear functions including slopes and intercepts. Know that the slope equals the rate of change, and that the y-intercept is zero when the function represents a proportional relationship. 8.2.2.3 Identify how coefficient changes in the equation f (x) = mx + b affect the graphs of linear functions. Know how to use graphing technology to examine these effects.
An Alignment of The Minnesota Academic Standards for Mathematics 2007 to Connected Mathematics Project 3, ©2014, Grade 8 – Algebra 1
27
Connected Mathematics Project 3 Grade 8 – Algebra 1
Minnesota Academic Standards in Mathematics
(Continued) Mathematical Reflections
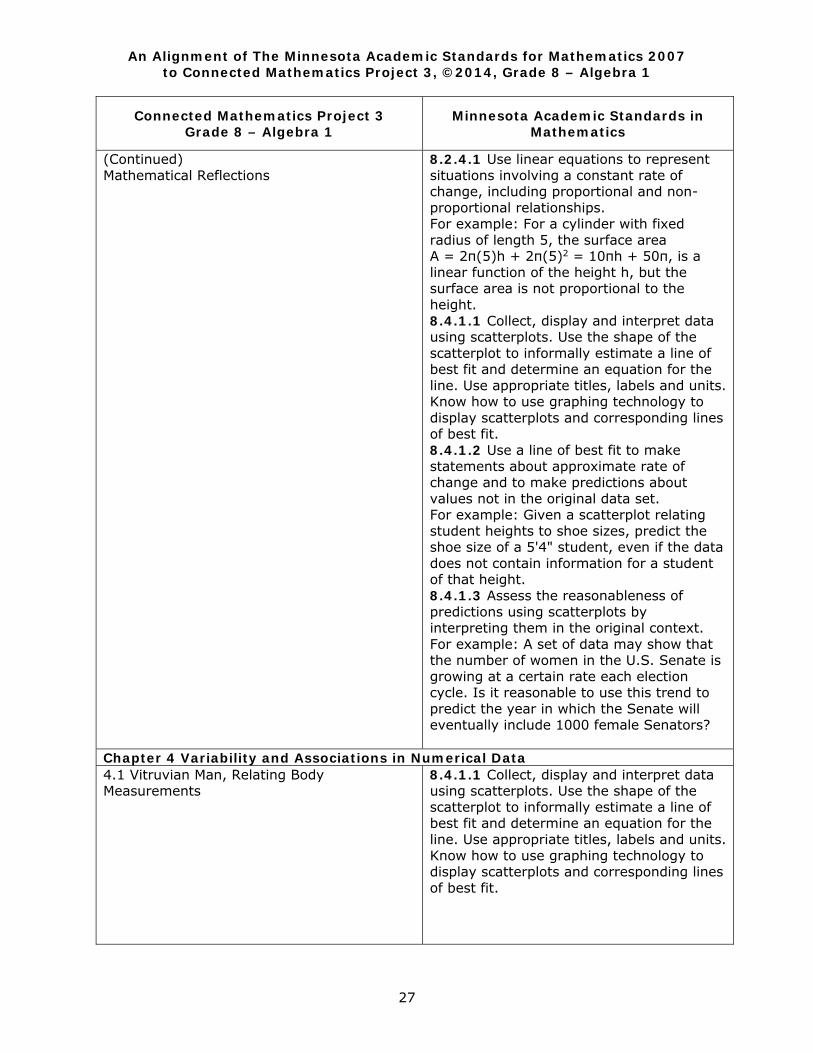
8.2.4.1 Use linear equations to represent situations involving a constant rate of change, including proportional and non-proportional relationships. For example: For a cylinder with fixed radius of length 5, the surface area A = 2π(5)h + 2π(5)2 = 10πh + 50π, is a linear function of the height h, but the surface area is not proportional to the height. 8.4.1.1 Collect, display and interpret data using scatterplots. Use the shape of the scatterplot to informally estimate a line of best fit and determine an equation for the line. Use appropriate titles, labels and units. Know how to use graphing technology to display scatterplots and corresponding lines of best fit. 8.4.1.2 Use a line of best fit to make statements about approximate rate of change and to make predictions about values not in the original data set. For example: Given a scatterplot relating student heights to shoe sizes, predict the shoe size of a 5'4" student, even if the data does not contain information for a student of that height. 8.4.1.3 Assess the reasonableness of predictions using scatterplots by interpreting them in the original context. For example: A set of data may show that the number of women in the U.S. Senate is growing at a certain rate each election cycle. Is it reasonable to use this trend to predict the year in which the Senate will eventually include 1000 female Senators?
Chapter 4 Variability and Associations in Numerical Data 4.1 Vitruvian Man, Relating Body Measurements
8.4.1.1 Collect, display and interpret data using scatterplots. Use the shape of the scatterplot to informally estimate a line of best fit and determine an equation for the line. Use appropriate titles, labels and units. Know how to use graphing technology to display scatterplots and corresponding lines of best fit.
An Alignment of The Minnesota Academic Standards for Mathematics 2007 to Connected Mathematics Project 3, ©2014, Grade 8 – Algebra 1
28
Connected Mathematics Project 3 Grade 8 – Algebra 1
Minnesota Academic Standards in Mathematics
(Continued) 4.1 Vitruvian Man, Relating Body Measurements
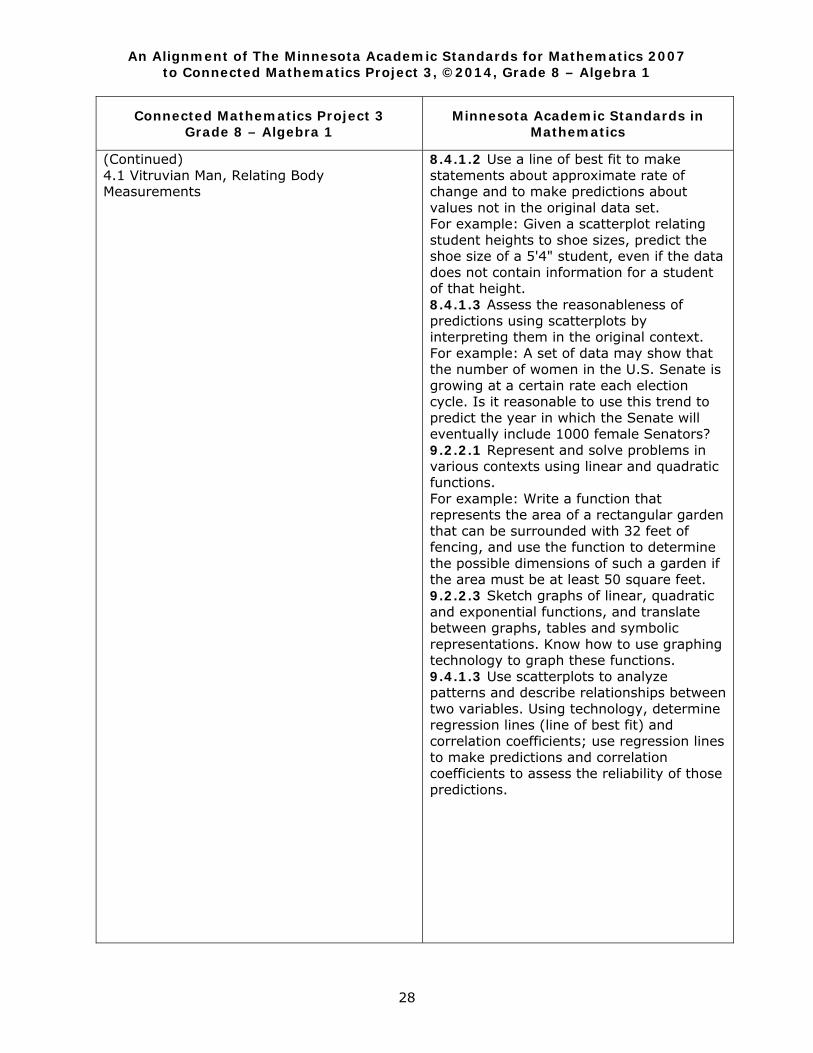
8.4.1.2 Use a line of best fit to make statements about approximate rate of change and to make predictions about values not in the original data set. For example: Given a scatterplot relating student heights to shoe sizes, predict the shoe size of a 5'4" student, even if the data does not contain information for a student of that height. 8.4.1.3 Assess the reasonableness of predictions using scatterplots by interpreting them in the original context. For example: A set of data may show that the number of women in the U.S. Senate is growing at a certain rate each election cycle. Is it reasonable to use this trend to predict the year in which the Senate will eventually include 1000 female Senators? 9.2.2.1 Represent and solve problems in various contexts using linear and quadratic functions. For example: Write a function that represents the area of a rectangular garden that can be surrounded with 32 feet of fencing, and use the function to determine the possible dimensions of such a garden if the area must be at least 50 square feet. 9.2.2.3 Sketch graphs of linear, quadratic and exponential functions, and translate between graphs, tables and symbolic representations. Know how to use graphing technology to graph these functions. 9.4.1.3 Use scatterplots to analyze patterns and describe relationships between two variables. Using technology, determine regression lines (line of best fit) and correlation coefficients; use regression lines to make predictions and correlation coefficients to assess the reliability of those predictions.
An Alignment of The Minnesota Academic Standards for Mathematics 2007 to Connected Mathematics Project 3, ©2014, Grade 8 – Algebra 1
29
Connected Mathematics Project 3 Grade 8 – Algebra 1
Minnesota Academic Standards in Mathematics
(Continued) 4.1 Vitruvian Man, Relating Body Measurements
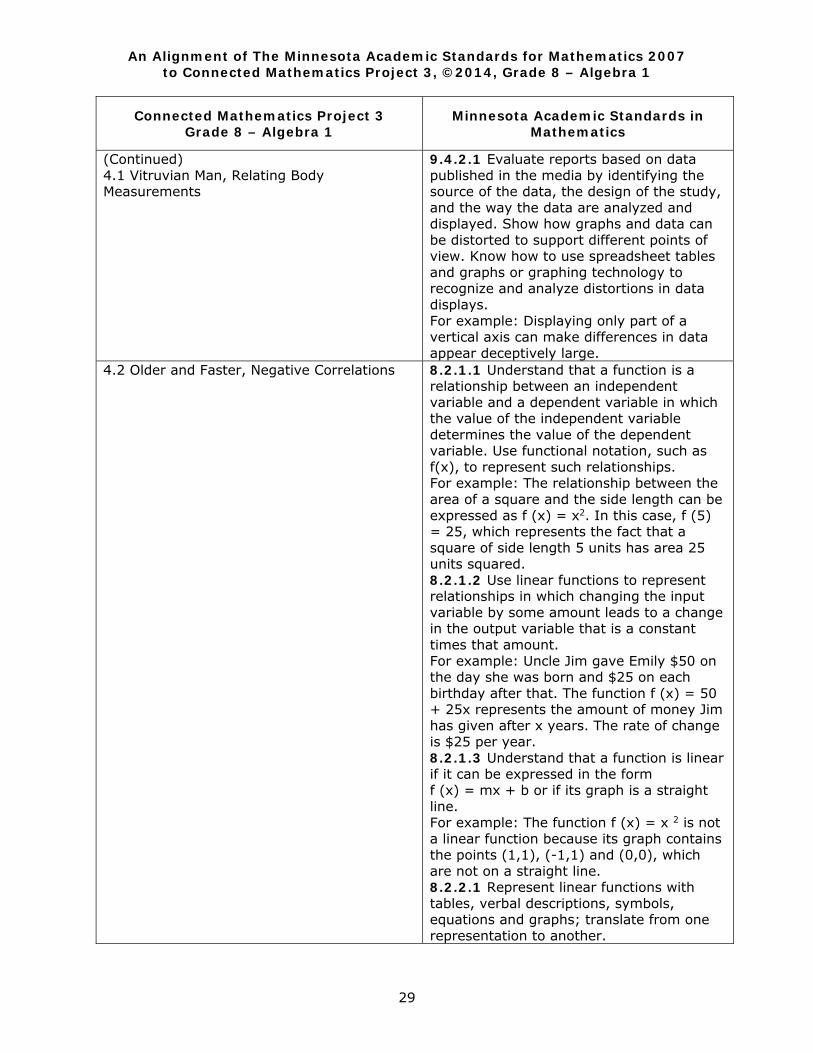
9.4.2.1 Evaluate reports based on data published in the media by identifying the source of the data, the design of the study, and the way the data are analyzed and displayed. Show how graphs and data can be distorted to support different points of view. Know how to use spreadsheet tables and graphs or graphing technology to recognize and analyze distortions in data displays. For example: Displaying only part of a vertical axis can make differences in data appear deceptively large.
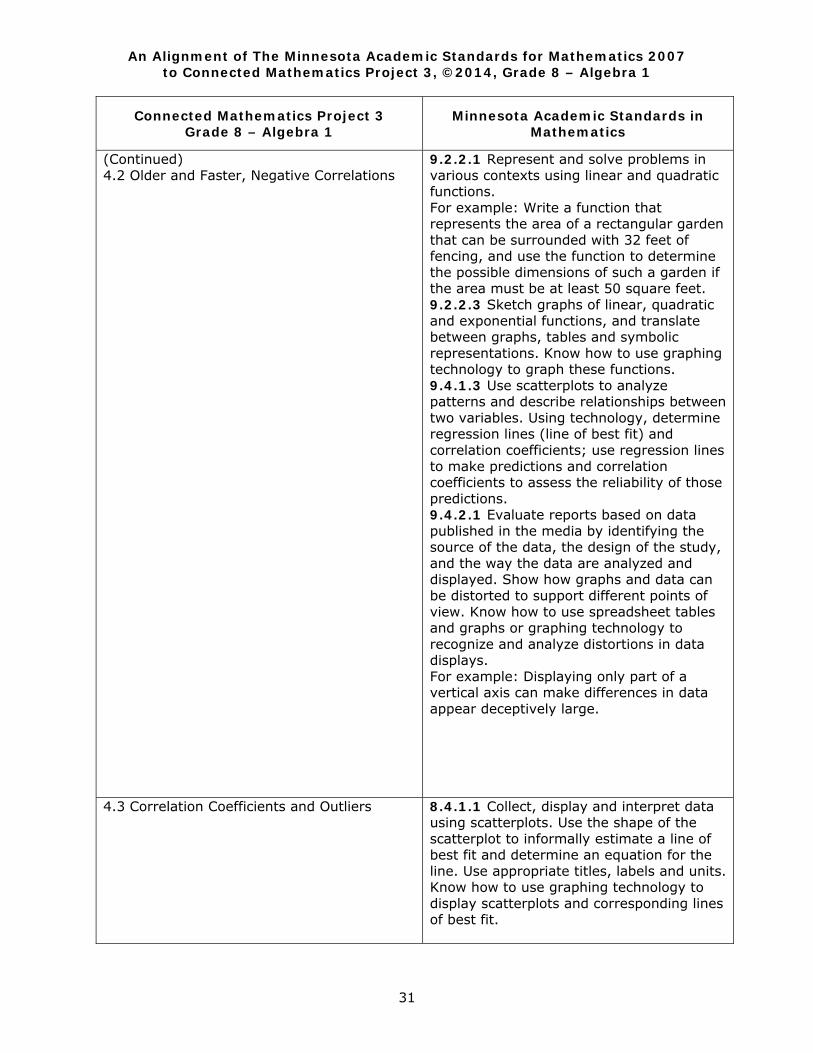
4.2 Older and Faster, Negative Correlations
8.2.1.1 Understand that a function is a relationship between an independent variable and a dependent variable in which the value of the independent variable determines the value of the dependent variable. Use functional notation, such as f(x), to represent such relationships. For example: The relationship between the area of a square and the side length can be expressed as f (x) = x2. In this case, f (5) = 25, which represents the fact that a square of side length 5 units has area 25 units squared. 8.2.1.2 Use linear functions to represent relationships in which changing the input variable by some amount leads to a change in the output variable that is a constant times that amount. For example: Uncle Jim gave Emily $50 on the day she was born and $25 on each birthday after that. The function f (x) = 50 + 25x represents the amount of money Jim has given after x years. The rate of change is $25 per year. 8.2.1.3 Understand that a function is linear if it can be expressed in the form f (x) = mx + b or if its graph is a straight line. For example: The function f (x) = x 2 is not a linear function because its graph contains the points (1,1), (-1,1) and (0,0), which are not on a straight line. 8.2.2.1 Represent linear functions with tables, verbal descriptions, symbols, equations and graphs; translate from one representation to another.
An Alignment of The Minnesota Academic Standards for Mathematics 2007 to Connected Mathematics Project 3, ©2014, Grade 8 – Algebra 1
30
Connected Mathematics Project 3 Grade 8 – Algebra 1
Minnesota Academic Standards in Mathematics
(Continued) 4.2 Older and Faster, Negative Correlations
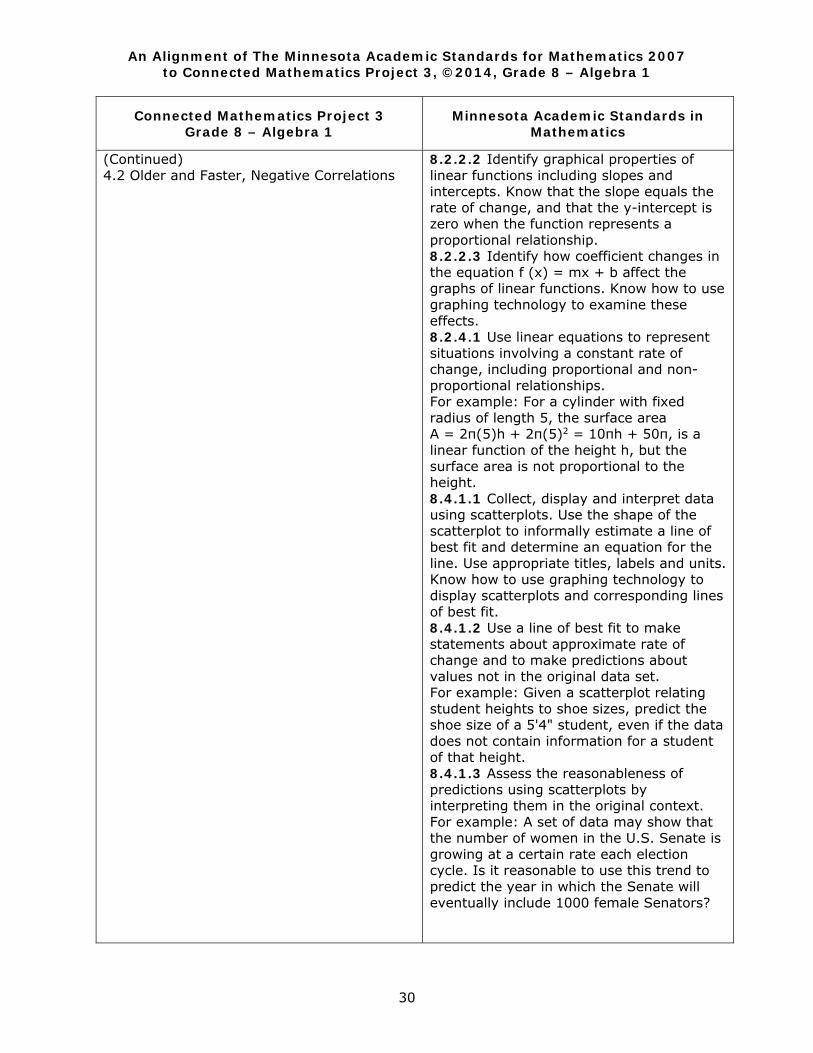
8.2.2.2 Identify graphical properties of linear functions including slopes and intercepts. Know that the slope equals the rate of change, and that the y-intercept is zero when the function represents a proportional relationship. 8.2.2.3 Identify how coefficient changes in the equation f (x) = mx + b affect the graphs of linear functions. Know how to use graphing technology to examine these effects. 8.2.4.1 Use linear equations to represent situations involving a constant rate of change, including proportional and non-proportional relationships. For example: For a cylinder with fixed radius of length 5, the surface area A = 2π(5)h + 2π(5)2 = 10πh + 50π, is a linear function of the height h, but the surface area is not proportional to the height. 8.4.1.1 Collect, display and interpret data using scatterplots. Use the shape of the scatterplot to informally estimate a line of best fit and determine an equation for the line. Use appropriate titles, labels and units. Know how to use graphing technology to display scatterplots and corresponding lines of best fit. 8.4.1.2 Use a line of best fit to make statements about approximate rate of change and to make predictions about values not in the original data set. For example: Given a scatterplot relating student heights to shoe sizes, predict the shoe size of a 5'4" student, even if the data does not contain information for a student of that height. 8.4.1.3 Assess the reasonableness of predictions using scatterplots by interpreting them in the original context. For example: A set of data may show that the number of women in the U.S. Senate is growing at a certain rate each election cycle. Is it reasonable to use this trend to predict the year in which the Senate will eventually include 1000 female Senators?
An Alignment of The Minnesota Academic Standards for Mathematics 2007 to Connected Mathematics Project 3, ©2014, Grade 8 – Algebra 1
31
Connected Mathematics Project 3 Grade 8 – Algebra 1
Minnesota Academic Standards in Mathematics
(Continued) 4.2 Older and Faster, Negative Correlations
9.2.2.1 Represent and solve problems in various contexts using linear and quadratic functions. For example: Write a function that represents the area of a rectangular garden that can be surrounded with 32 feet of fencing, and use the function to determine the possible dimensions of such a garden if the area must be at least 50 square feet. 9.2.2.3 Sketch graphs of linear, quadratic and exponential functions, and translate between graphs, tables and symbolic representations. Know how to use graphing technology to graph these functions. 9.4.1.3 Use scatterplots to analyze patterns and describe relationships between two variables. Using technology, determine regression lines (line of best fit) and correlation coefficients; use regression lines to make predictions and correlation coefficients to assess the reliability of those predictions. 9.4.2.1 Evaluate reports based on data published in the media by identifying the source of the data, the design of the study, and the way the data are analyzed and displayed. Show how graphs and data can be distorted to support different points of view. Know how to use spreadsheet tables and graphs or graphing technology to recognize and analyze distortions in data displays. For example: Displaying only part of a vertical axis can make differences in data appear deceptively large.
4.3 Correlation Coefficients and Outliers
8.4.1.1 Collect, display and interpret data using scatterplots. Use the shape of the scatterplot to informally estimate a line of best fit and determine an equation for the line. Use appropriate titles, labels and units. Know how to use graphing technology to display scatterplots and corresponding lines of best fit.

An Alignment of The Minnesota Academic Standards for Mathematics 2007 to Connected Mathematics Project 3, ©2014, Grade 8 – Algebra 1
32
Connected Mathematics Project 3 Grade 8 – Algebra 1
Minnesota Academic Standards in Mathematics
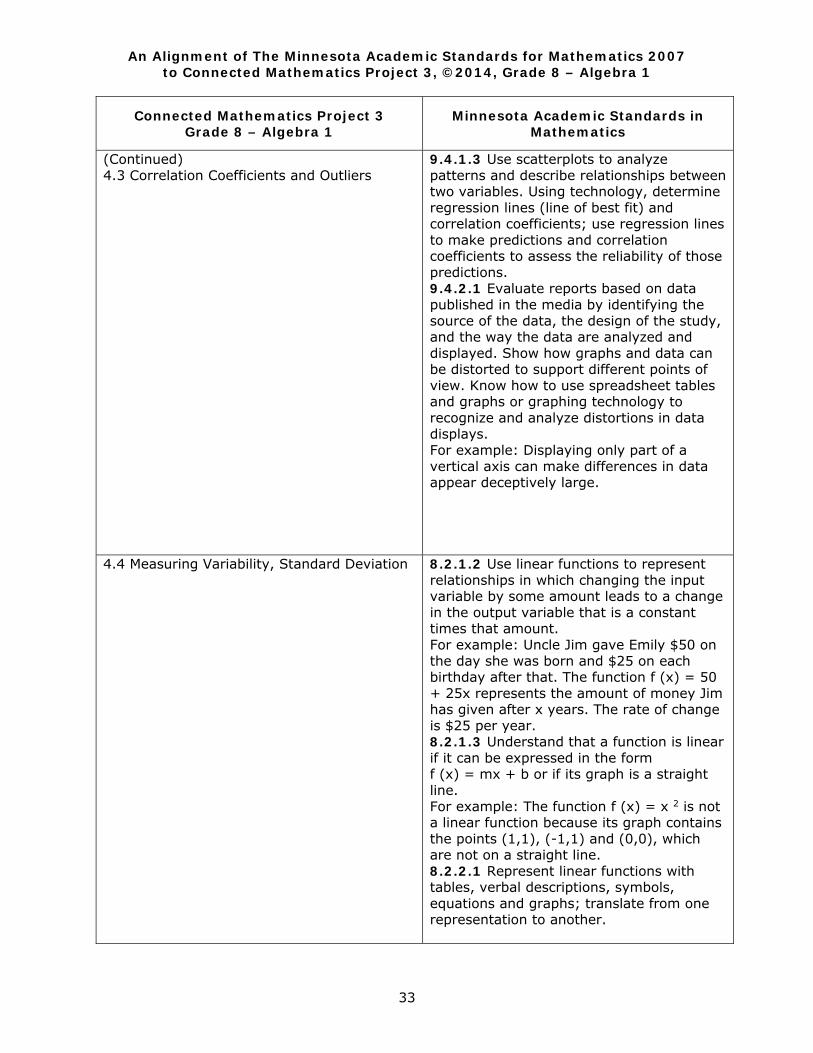
(Continued) 4.3 Correlation Coefficients and Outliers
8.4.1.2 Use a line of best fit to make statements about approximate rate of change and to make predictions about values not in the original data set. For example: Given a scatterplot relating student heights to shoe sizes, predict the shoe size of a 5'4" student, even if the data does not contain information for a student of that height. 8.4.1.3 Assess the reasonableness of predictions using scatterplots by interpreting them in the original context. For example: A set of data may show that the number of women in the U.S. Senate is growing at a certain rate each election cycle. Is it reasonable to use this trend to predict the year in which the Senate will eventually include 1000 female Senators? 9.2.2.1 Represent and solve problems in various contexts using linear and quadratic functions. For example: Write a function that represents the area of a rectangular garden that can be surrounded with 32 feet of fencing, and use the function to determine the possible dimensions of such a garden if the area must be at least 50 square feet. 9.2.2.3 Sketch graphs of linear, quadratic and exponential functions, and translate between graphs, tables and symbolic representations. Know how to use graphing technology to graph these functions. 9.4.1.2 Analyze the effects on summary statistics of changes in data sets. For example: Understand how inserting or deleting a data point may affect the mean and standard deviation. Another example: Understand how the median and interquartile range are affected when the entire data set is transformed by adding a constant to each data value or multiplying each data value by a constant.
An Alignment of The Minnesota Academic Standards for Mathematics 2007 to Connected Mathematics Project 3, ©2014, Grade 8 – Algebra 1
33
Connected Mathematics Project 3 Grade 8 – Algebra 1
Minnesota Academic Standards in Mathematics
(Continued) 4.3 Correlation Coefficients and Outliers
9.4.1.3 Use scatterplots to analyze patterns and describe relationships between two variables. Using technology, determine regression lines (line of best fit) and correlation coefficients; use regression lines to make predictions and correlation coefficients to assess the reliability of those predictions. 9.4.2.1 Evaluate reports based on data published in the media by identifying the source of the data, the design of the study, and the way the data are analyzed and displayed. Show how graphs and data can be distorted to support different points of view. Know how to use spreadsheet tables and graphs or graphing technology to recognize and analyze distortions in data displays. For example: Displaying only part of a vertical axis can make differences in data appear deceptively large.
4.4 Measuring Variability, Standard Deviation
8.2.1.2 Use linear functions to represent relationships in which changing the input variable by some amount leads to a change in the output variable that is a constant times that amount. For example: Uncle Jim gave Emily $50 on the day she was born and $25 on each birthday after that. The function f (x) = 50 + 25x represents the amount of money Jim has given after x years. The rate of change is $25 per year. 8.2.1.3 Understand that a function is linear if it can be expressed in the form f (x) = mx + b or if its graph is a straight line. For example: The function f (x) = x 2 is not a linear function because its graph contains the points (1,1), (-1,1) and (0,0), which are not on a straight line. 8.2.2.1 Represent linear functions with tables, verbal descriptions, symbols, equations and graphs; translate from one representation to another.
An Alignment of The Minnesota Academic Standards for Mathematics 2007 to Connected Mathematics Project 3, ©2014, Grade 8 – Algebra 1
34
Connected Mathematics Project 3 Grade 8 – Algebra 1
Minnesota Academic Standards in Mathematics
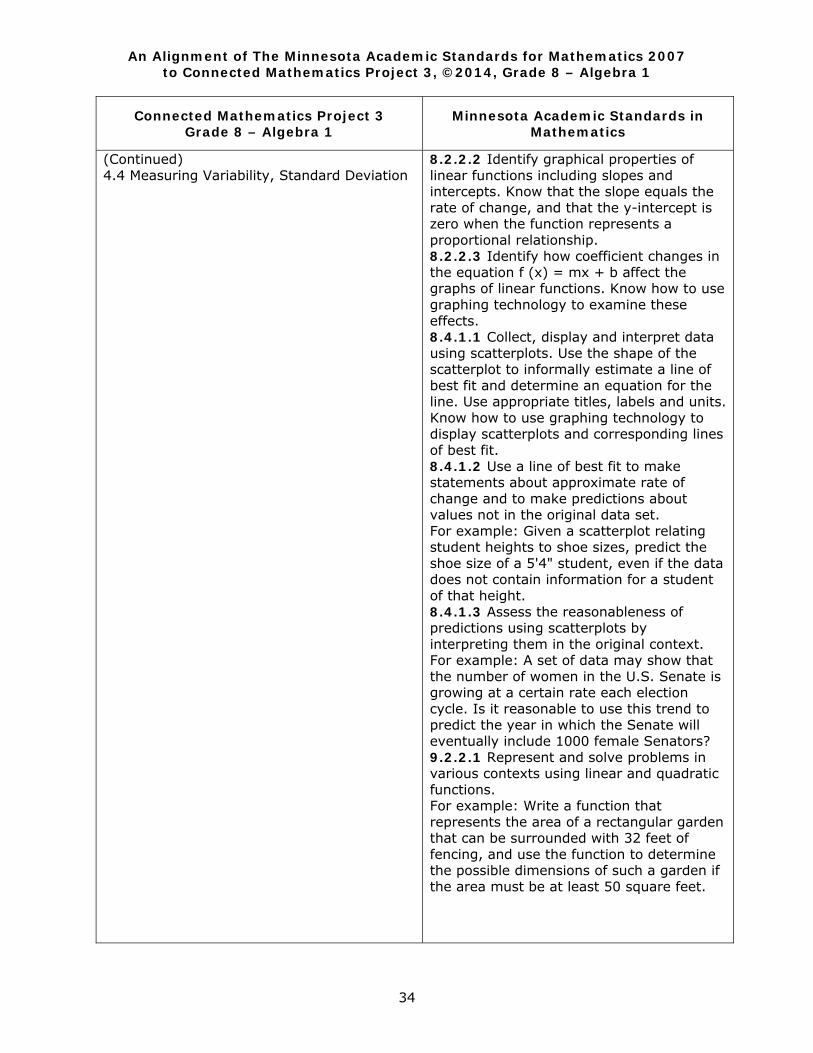
(Continued) 4.4 Measuring Variability, Standard Deviation
8.2.2.2 Identify graphical properties of linear functions including slopes and intercepts. Know that the slope equals the rate of change, and that the y-intercept is zero when the function represents a proportional relationship. 8.2.2.3 Identify how coefficient changes in the equation f (x) = mx + b affect the graphs of linear functions. Know how to use graphing technology to examine these effects. 8.4.1.1 Collect, display and interpret data using scatterplots. Use the shape of the scatterplot to informally estimate a line of best fit and determine an equation for the line. Use appropriate titles, labels and units. Know how to use graphing technology to display scatterplots and corresponding lines of best fit. 8.4.1.2 Use a line of best fit to make statements about approximate rate of change and to make predictions about values not in the original data set. For example: Given a scatterplot relating student heights to shoe sizes, predict the shoe size of a 5'4" student, even if the data does not contain information for a student of that height. 8.4.1.3 Assess the reasonableness of predictions using scatterplots by interpreting them in the original context. For example: A set of data may show that the number of women in the U.S. Senate is growing at a certain rate each election cycle. Is it reasonable to use this trend to predict the year in which the Senate will eventually include 1000 female Senators? 9.2.2.1 Represent and solve problems in various contexts using linear and quadratic functions. For example: Write a function that represents the area of a rectangular garden that can be surrounded with 32 feet of fencing, and use the function to determine the possible dimensions of such a garden if the area must be at least 50 square feet.
An Alignment of The Minnesota Academic Standards for Mathematics 2007 to Connected Mathematics Project 3, ©2014, Grade 8 – Algebra 1
35
Connected Mathematics Project 3 Grade 8 – Algebra 1
Minnesota Academic Standards in Mathematics
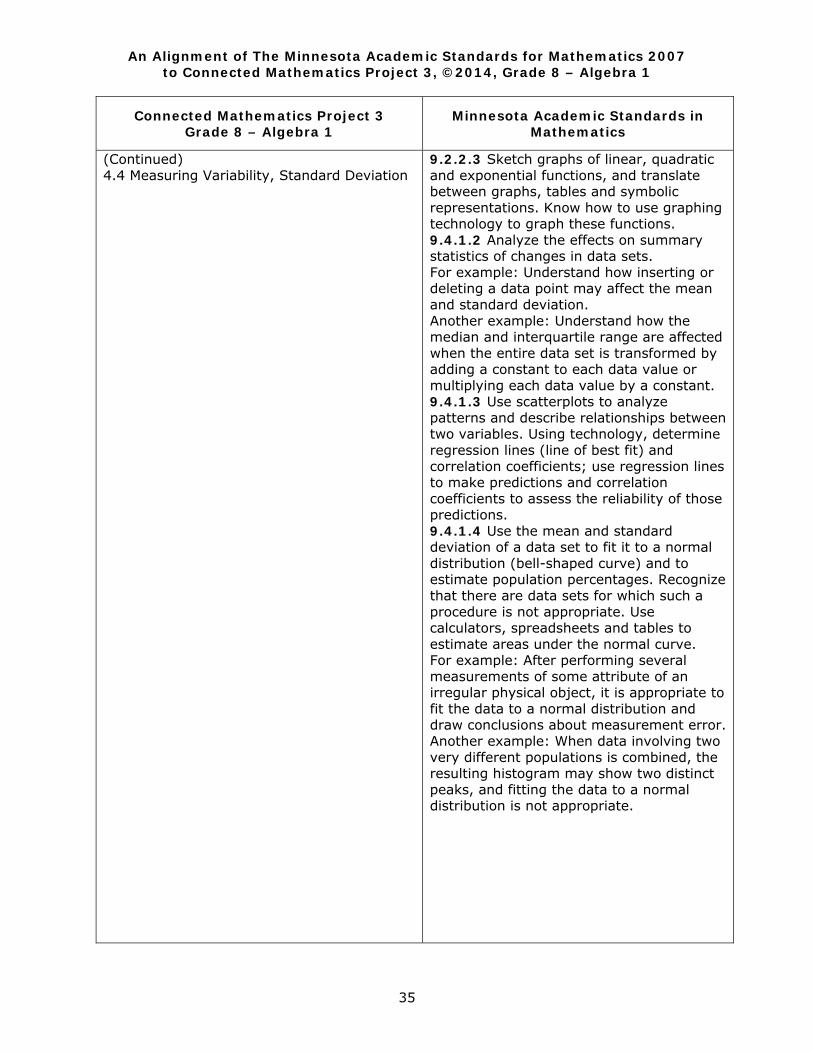
(Continued) 4.4 Measuring Variability, Standard Deviation
9.2.2.3 Sketch graphs of linear, quadratic and exponential functions, and translate between graphs, tables and symbolic representations. Know how to use graphing technology to graph these functions. 9.4.1.2 Analyze the effects on summary statistics of changes in data sets. For example: Understand how inserting or deleting a data point may affect the mean and standard deviation. Another example: Understand how the median and interquartile range are affected when the entire data set is transformed by adding a constant to each data value or multiplying each data value by a constant. 9.4.1.3 Use scatterplots to analyze patterns and describe relationships between two variables. Using technology, determine regression lines (line of best fit) and correlation coefficients; use regression lines to make predictions and correlation coefficients to assess the reliability of those predictions. 9.4.1.4 Use the mean and standard deviation of a data set to fit it to a normal distribution (bell-shaped curve) and to estimate population percentages. Recognize that there are data sets for which such a procedure is not appropriate. Use calculators, spreadsheets and tables to estimate areas under the normal curve. For example: After performing several measurements of some attribute of an irregular physical object, it is appropriate to fit the data to a normal distribution and draw conclusions about measurement error. Another example: When data involving two very different populations is combined, the resulting histogram may show two distinct peaks, and fitting the data to a normal distribution is not appropriate.
An Alignment of The Minnesota Academic Standards for Mathematics 2007 to Connected Mathematics Project 3, ©2014, Grade 8 – Algebra 1
36
Connected Mathematics Project 3 Grade 8 – Algebra 1
Minnesota Academic Standards in Mathematics
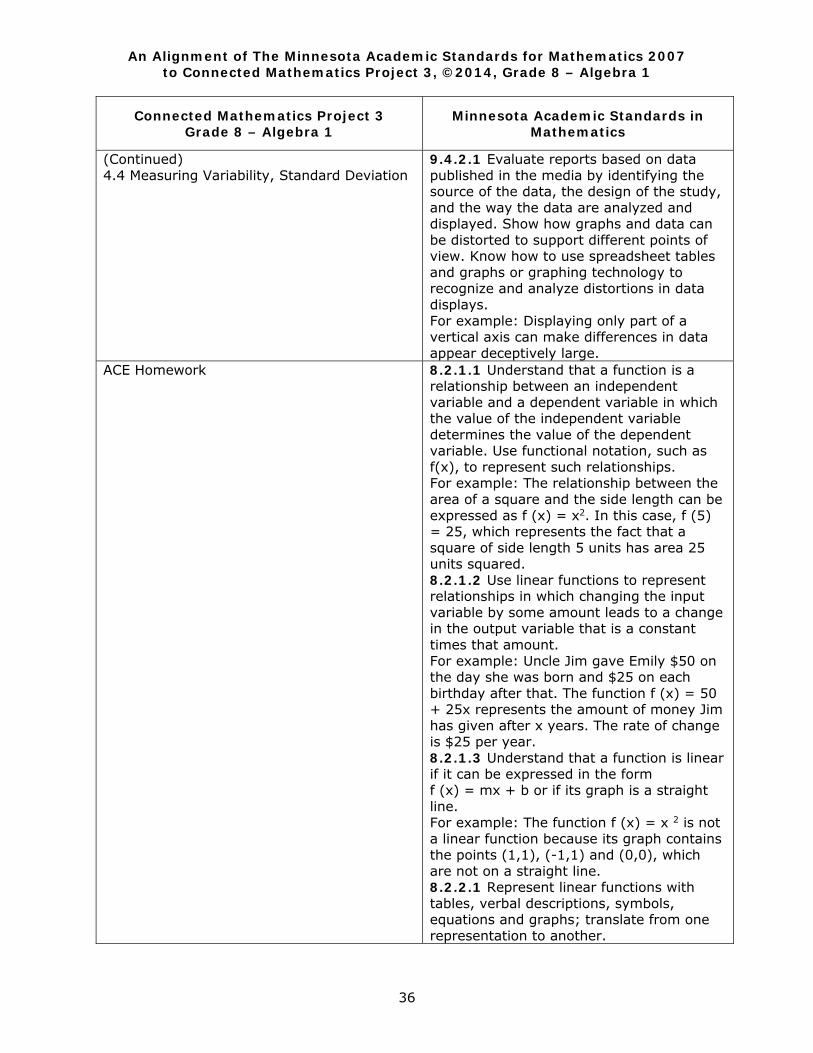
(Continued) 4.4 Measuring Variability, Standard Deviation
9.4.2.1 Evaluate reports based on data published in the media by identifying the source of the data, the design of the study, and the way the data are analyzed and displayed. Show how graphs and data can be distorted to support different points of view. Know how to use spreadsheet tables and graphs or graphing technology to recognize and analyze distortions in data displays. For example: Displaying only part of a vertical axis can make differences in data appear deceptively large.
ACE Homework
8.2.1.1 Understand that a function is a relationship between an independent variable and a dependent variable in which the value of the independent variable determines the value of the dependent variable. Use functional notation, such as f(x), to represent such relationships. For example: The relationship between the area of a square and the side length can be expressed as f (x) = x2. In this case, f (5) = 25, which represents the fact that a square of side length 5 units has area 25 units squared. 8.2.1.2 Use linear functions to represent relationships in which changing the input variable by some amount leads to a change in the output variable that is a constant times that amount. For example: Uncle Jim gave Emily $50 on the day she was born and $25 on each birthday after that. The function f (x) = 50 + 25x represents the amount of money Jim has given after x years. The rate of change is $25 per year. 8.2.1.3 Understand that a function is linear if it can be expressed in the form f (x) = mx + b or if its graph is a straight line. For example: The function f (x) = x 2 is not a linear function because its graph contains the points (1,1), (-1,1) and (0,0), which are not on a straight line. 8.2.2.1 Represent linear functions with tables, verbal descriptions, symbols, equations and graphs; translate from one representation to another.

An Alignment of The Minnesota Academic Standards for Mathematics 2007 to Connected Mathematics Project 3, ©2014, Grade 8 – Algebra 1
37
Connected Mathematics Project 3 Grade 8 – Algebra 1
Minnesota Academic Standards in Mathematics
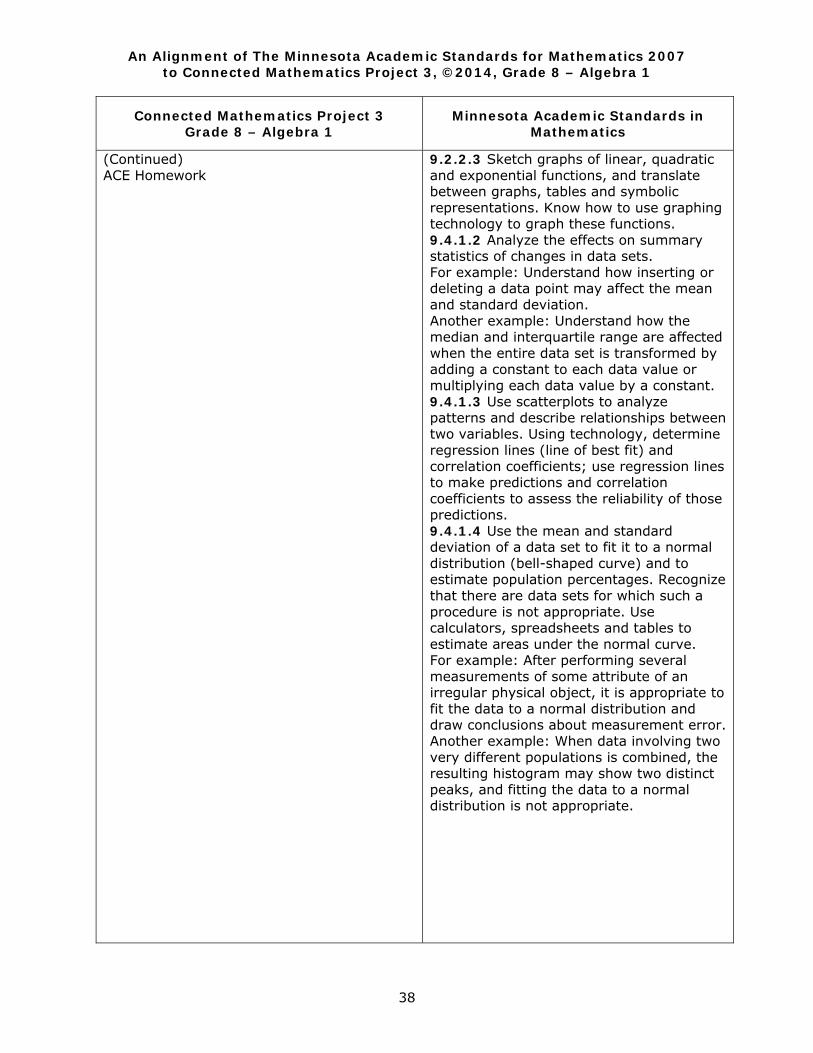
(Continued) ACE Homework
8.2.2.2 Identify graphical properties of linear functions including slopes and intercepts. Know that the slope equals the rate of change, and that the y-intercept is zero when the function represents a proportional relationship. 8.2.2.3 Identify how coefficient changes in the equation f (x) = mx + b affect the graphs of linear functions. Know how to use graphing technology to examine these effects. 8.4.1.1 Collect, display and interpret data using scatterplots. Use the shape of the scatterplot to informally estimate a line of best fit and determine an equation for the line. Use appropriate titles, labels and units. Know how to use graphing technology to display scatterplots and corresponding lines of best fit. 8.4.1.2 Use a line of best fit to make statements about approximate rate of change and to make predictions about values not in the original data set. For example: Given a scatterplot relating student heights to shoe sizes, predict the shoe size of a 5'4" student, even if the data does not contain information for a student of that height. 8.4.1.3 Assess the reasonableness of predictions using scatterplots by interpreting them in the original context. For example: A set of data may show that the number of women in the U.S. Senate is growing at a certain rate each election cycle. Is it reasonable to use this trend to predict the year in which the Senate will eventually include 1000 female Senators? 9.2.2.1 Represent and solve problems in various contexts using linear and quadratic functions. For example: Write a function that represents the area of a rectangular garden that can be surrounded with 32 feet of fencing, and use the function to determine the possible dimensions of such a garden if the area must be at least 50 square feet.
An Alignment of The Minnesota Academic Standards for Mathematics 2007 to Connected Mathematics Project 3, ©2014, Grade 8 – Algebra 1
38
Connected Mathematics Project 3 Grade 8 – Algebra 1
Minnesota Academic Standards in Mathematics
(Continued) ACE Homework
9.2.2.3 Sketch graphs of linear, quadratic and exponential functions, and translate between graphs, tables and symbolic representations. Know how to use graphing technology to graph these functions. 9.4.1.2 Analyze the effects on summary statistics of changes in data sets. For example: Understand how inserting or deleting a data point may affect the mean and standard deviation. Another example: Understand how the median and interquartile range are affected when the entire data set is transformed by adding a constant to each data value or multiplying each data value by a constant. 9.4.1.3 Use scatterplots to analyze patterns and describe relationships between two variables. Using technology, determine regression lines (line of best fit) and correlation coefficients; use regression lines to make predictions and correlation coefficients to assess the reliability of those predictions. 9.4.1.4 Use the mean and standard deviation of a data set to fit it to a normal distribution (bell-shaped curve) and to estimate population percentages. Recognize that there are data sets for which such a procedure is not appropriate. Use calculators, spreadsheets and tables to estimate areas under the normal curve. For example: After performing several measurements of some attribute of an irregular physical object, it is appropriate to fit the data to a normal distribution and draw conclusions about measurement error. Another example: When data involving two very different populations is combined, the resulting histogram may show two distinct peaks, and fitting the data to a normal distribution is not appropriate.

An Alignment of The Minnesota Academic Standards for Mathematics 2007 to Connected Mathematics Project 3, ©2014, Grade 8 – Algebra 1
39
Connected Mathematics Project 3 Grade 8 – Algebra 1
Minnesota Academic Standards in Mathematics
(Continued) ACE Homework
9.4.2.1 Evaluate reports based on data published in the media by identifying the source of the data, the design of the study, and the way the data are analyzed and displayed. Show how graphs and data can be distorted to support different points of view. Know how to use spreadsheet tables and graphs or graphing technology to recognize and analyze distortions in data displays. For example: Displaying only part of a vertical axis can make differences in data appear deceptively large.
Mathematical Reflections
8.2.1.1 Understand that a function is a relationship between an independent variable and a dependent variable in which the value of the independent variable determines the value of the dependent variable. Use functional notation, such as f(x), to represent such relationships. For example: The relationship between the area of a square and the side length can be expressed as f (x) = x2. In this case, f (5) = 25, which represents the fact that a square of side length 5 units has area 25 units squared. 8.2.1.2 Use linear functions to represent relationships in which changing the input variable by some amount leads to a change in the output variable that is a constant times that amount. For example: Uncle Jim gave Emily $50 on the day she was born and $25 on each birthday after that. The function f (x) = 50 + 25x represents the amount of money Jim has given after x years. The rate of change is $25 per year. 8.2.1.3 Understand that a function is linear if it can be expressed in the form f (x) = mx + b or if its graph is a straight line. For example: The function f (x) = x 2 is not a linear function because its graph contains the points (1,1), (-1,1) and (0,0), which are not on a straight line. 8.2.2.1 Represent linear functions with tables, verbal descriptions, symbols, equations and graphs; translate from one representation to another.
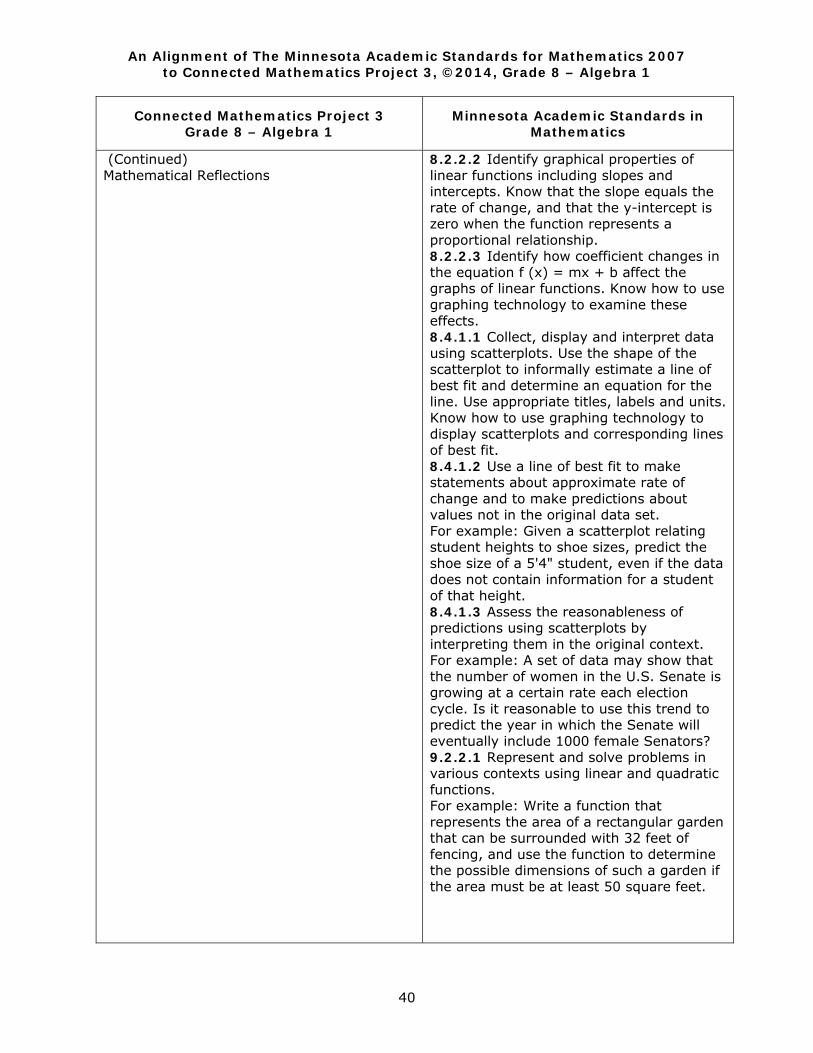
An Alignment of The Minnesota Academic Standards for Mathematics 2007 to Connected Mathematics Project 3, ©2014, Grade 8 – Algebra 1
40
Connected Mathematics Project 3 Grade 8 – Algebra 1
Minnesota Academic Standards in Mathematics
(Continued) Mathematical Reflections
8.2.2.2 Identify graphical properties of linear functions including slopes and intercepts. Know that the slope equals the rate of change, and that the y-intercept is zero when the function represents a proportional relationship. 8.2.2.3 Identify how coefficient changes in the equation f (x) = mx + b affect the graphs of linear functions. Know how to use graphing technology to examine these effects. 8.4.1.1 Collect, display and interpret data using scatterplots. Use the shape of the scatterplot to informally estimate a line of best fit and determine an equation for the line. Use appropriate titles, labels and units. Know how to use graphing technology to display scatterplots and corresponding lines of best fit. 8.4.1.2 Use a line of best fit to make statements about approximate rate of change and to make predictions about values not in the original data set. For example: Given a scatterplot relating student heights to shoe sizes, predict the shoe size of a 5'4" student, even if the data does not contain information for a student of that height. 8.4.1.3 Assess the reasonableness of predictions using scatterplots by interpreting them in the original context. For example: A set of data may show that the number of women in the U.S. Senate is growing at a certain rate each election cycle. Is it reasonable to use this trend to predict the year in which the Senate will eventually include 1000 female Senators? 9.2.2.1 Represent and solve problems in various contexts using linear and quadratic functions. For example: Write a function that represents the area of a rectangular garden that can be surrounded with 32 feet of fencing, and use the function to determine the possible dimensions of such a garden if the area must be at least 50 square feet.
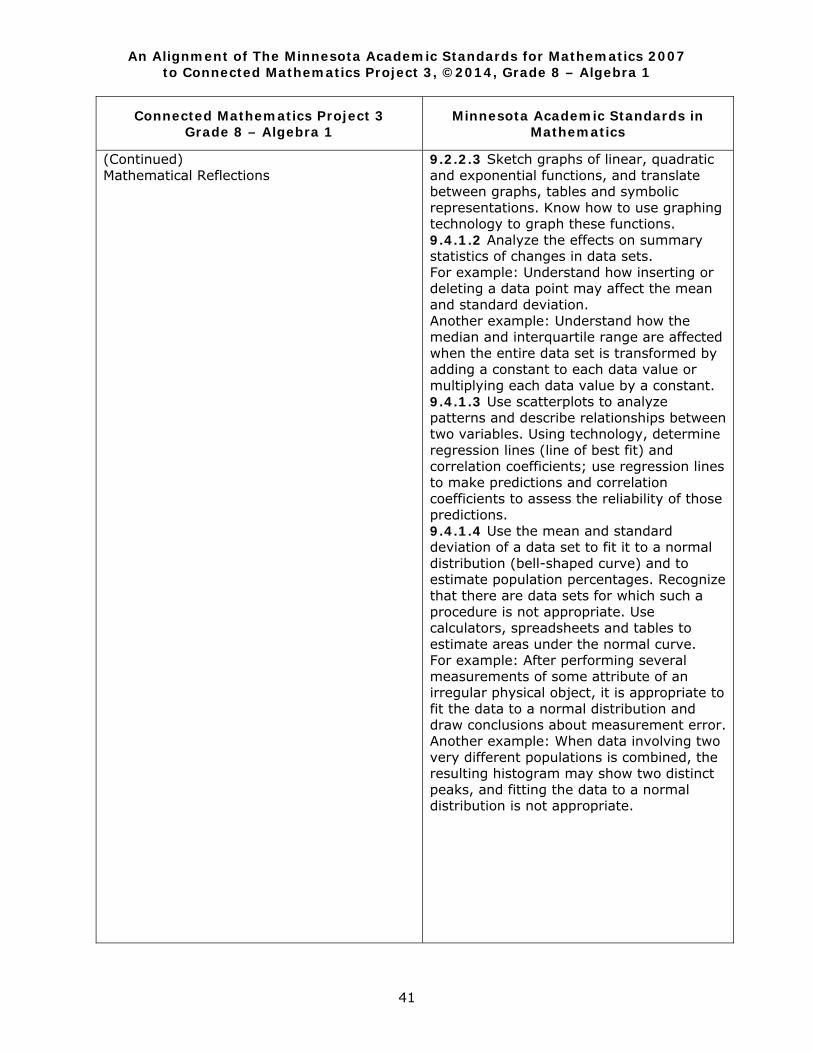
An Alignment of The Minnesota Academic Standards for Mathematics 2007 to Connected Mathematics Project 3, ©2014, Grade 8 – Algebra 1
41
Connected Mathematics Project 3 Grade 8 – Algebra 1
Minnesota Academic Standards in Mathematics
(Continued) Mathematical Reflections
9.2.2.3 Sketch graphs of linear, quadratic and exponential functions, and translate between graphs, tables and symbolic representations. Know how to use graphing technology to graph these functions. 9.4.1.2 Analyze the effects on summary statistics of changes in data sets. For example: Understand how inserting or deleting a data point may affect the mean and standard deviation. Another example: Understand how the median and interquartile range are affected when the entire data set is transformed by adding a constant to each data value or multiplying each data value by a constant. 9.4.1.3 Use scatterplots to analyze patterns and describe relationships between two variables. Using technology, determine regression lines (line of best fit) and correlation coefficients; use regression lines to make predictions and correlation coefficients to assess the reliability of those predictions. 9.4.1.4 Use the mean and standard deviation of a data set to fit it to a normal distribution (bell-shaped curve) and to estimate population percentages. Recognize that there are data sets for which such a procedure is not appropriate. Use calculators, spreadsheets and tables to estimate areas under the normal curve. For example: After performing several measurements of some attribute of an irregular physical object, it is appropriate to fit the data to a normal distribution and draw conclusions about measurement error. Another example: When data involving two very different populations is combined, the resulting histogram may show two distinct peaks, and fitting the data to a normal distribution is not appropriate.
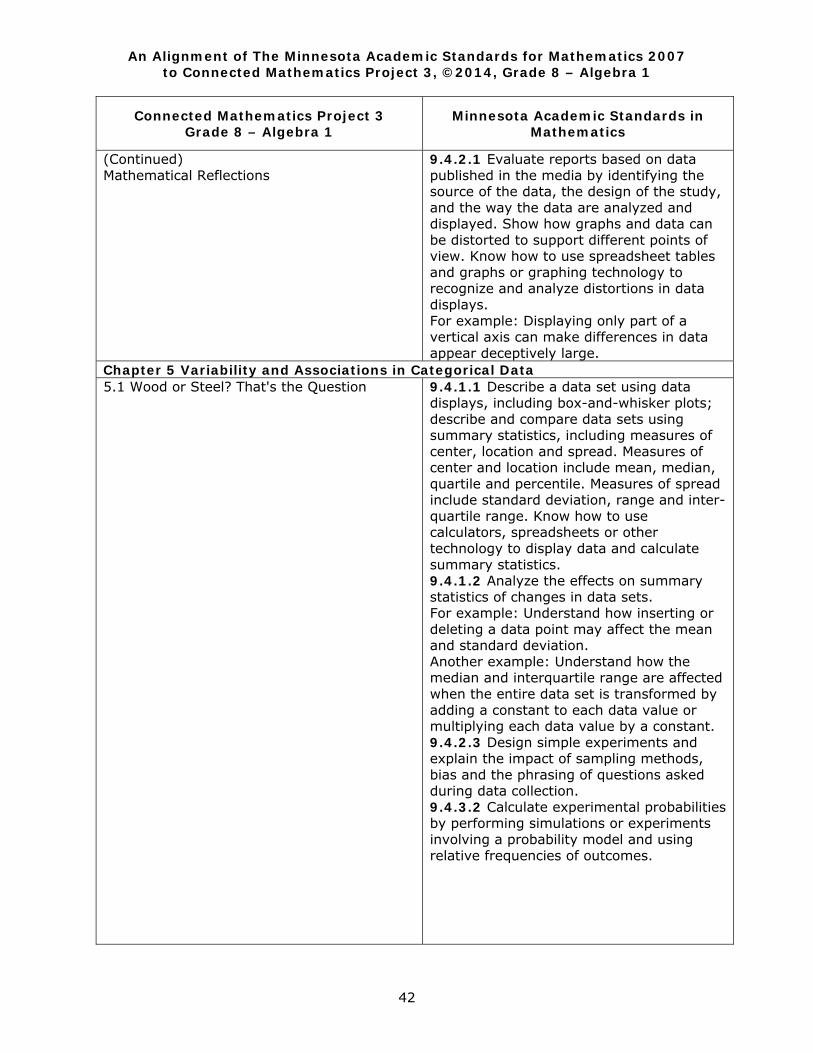
An Alignment of The Minnesota Academic Standards for Mathematics 2007 to Connected Mathematics Project 3, ©2014, Grade 8 – Algebra 1
42
Connected Mathematics Project 3 Grade 8 – Algebra 1
Minnesota Academic Standards in Mathematics
(Continued) Mathematical Reflections
9.4.2.1 Evaluate reports based on data published in the media by identifying the source of the data, the design of the study, and the way the data are analyzed and displayed. Show how graphs and data can be distorted to support different points of view. Know how to use spreadsheet tables and graphs or graphing technology to recognize and analyze distortions in data displays. For example: Displaying only part of a vertical axis can make differences in data appear deceptively large.
Chapter 5 Variability and Associations in Categorical Data 5.1 Wood or Steel? That's the Question 9.4.1.1 Describe a data set using data
displays, including box-and-whisker plots; describe and compare data sets using summary statistics, including measures of center, location and spread. Measures of center and location include mean, median, quartile and percentile. Measures of spread include standard deviation, range and inter-quartile range. Know how to use calculators, spreadsheets or other technology to display data and calculate summary statistics. 9.4.1.2 Analyze the effects on summary statistics of changes in data sets. For example: Understand how inserting or deleting a data point may affect the mean and standard deviation. Another example: Understand how the median and interquartile range are affected when the entire data set is transformed by adding a constant to each data value or multiplying each data value by a constant. 9.4.2.3 Design simple experiments and explain the impact of sampling methods, bias and the phrasing of questions asked during data collection. 9.4.3.2 Calculate experimental probabilities by performing simulations or experiments involving a probability model and using relative frequencies of outcomes.
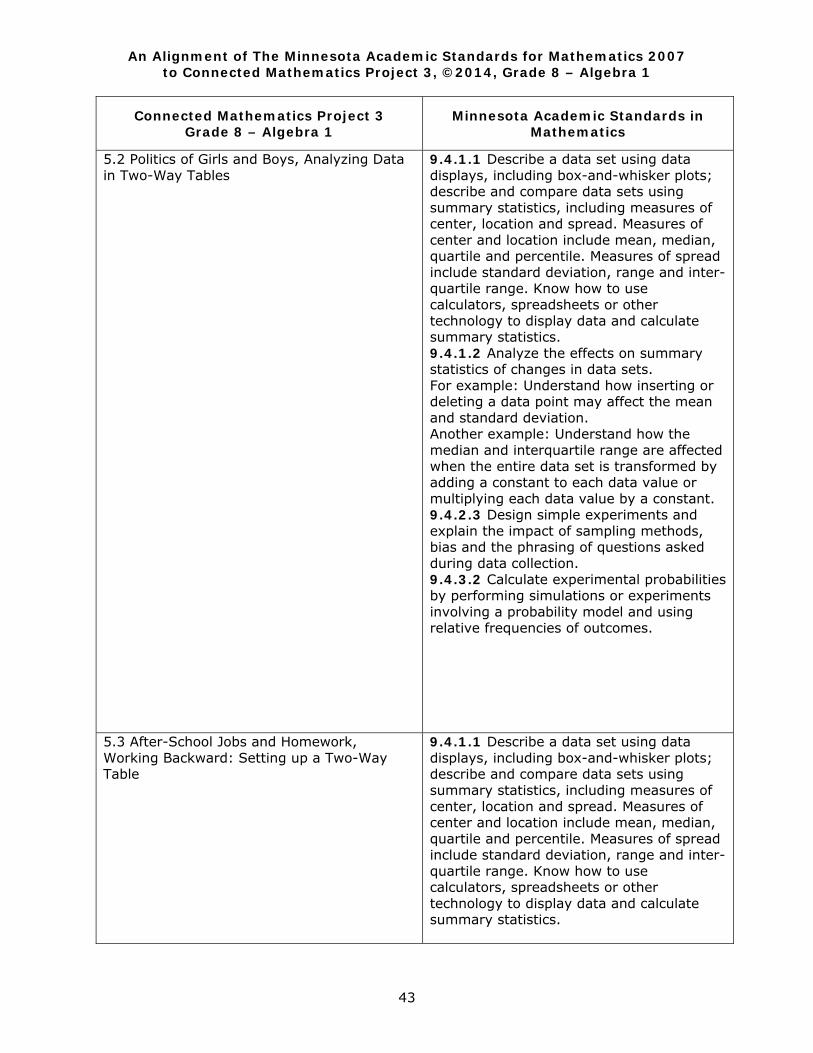
An Alignment of The Minnesota Academic Standards for Mathematics 2007 to Connected Mathematics Project 3, ©2014, Grade 8 – Algebra 1
43
Connected Mathematics Project 3 Grade 8 – Algebra 1
Minnesota Academic Standards in Mathematics
5.2 Politics of Girls and Boys, Analyzing Data in Two-Way Tables
9.4.1.1 Describe a data set using data displays, including box-and-whisker plots; describe and compare data sets using summary statistics, including measures of center, location and spread. Measures of center and location include mean, median, quartile and percentile. Measures of spread include standard deviation, range and inter-quartile range. Know how to use calculators, spreadsheets or other technology to display data and calculate summary statistics. 9.4.1.2 Analyze the effects on summary statistics of changes in data sets. For example: Understand how inserting or deleting a data point may affect the mean and standard deviation. Another example: Understand how the median and interquartile range are affected when the entire data set is transformed by adding a constant to each data value or multiplying each data value by a constant. 9.4.2.3 Design simple experiments and explain the impact of sampling methods, bias and the phrasing of questions asked during data collection. 9.4.3.2 Calculate experimental probabilities by performing simulations or experiments involving a probability model and using relative frequencies of outcomes.
5.3 After-School Jobs and Homework, Working Backward: Setting up a Two-Way Table
9.4.1.1 Describe a data set using data displays, including box-and-whisker plots; describe and compare data sets using summary statistics, including measures of center, location and spread. Measures of center and location include mean, median, quartile and percentile. Measures of spread include standard deviation, range and inter-quartile range. Know how to use calculators, spreadsheets or other technology to display data and calculate summary statistics.
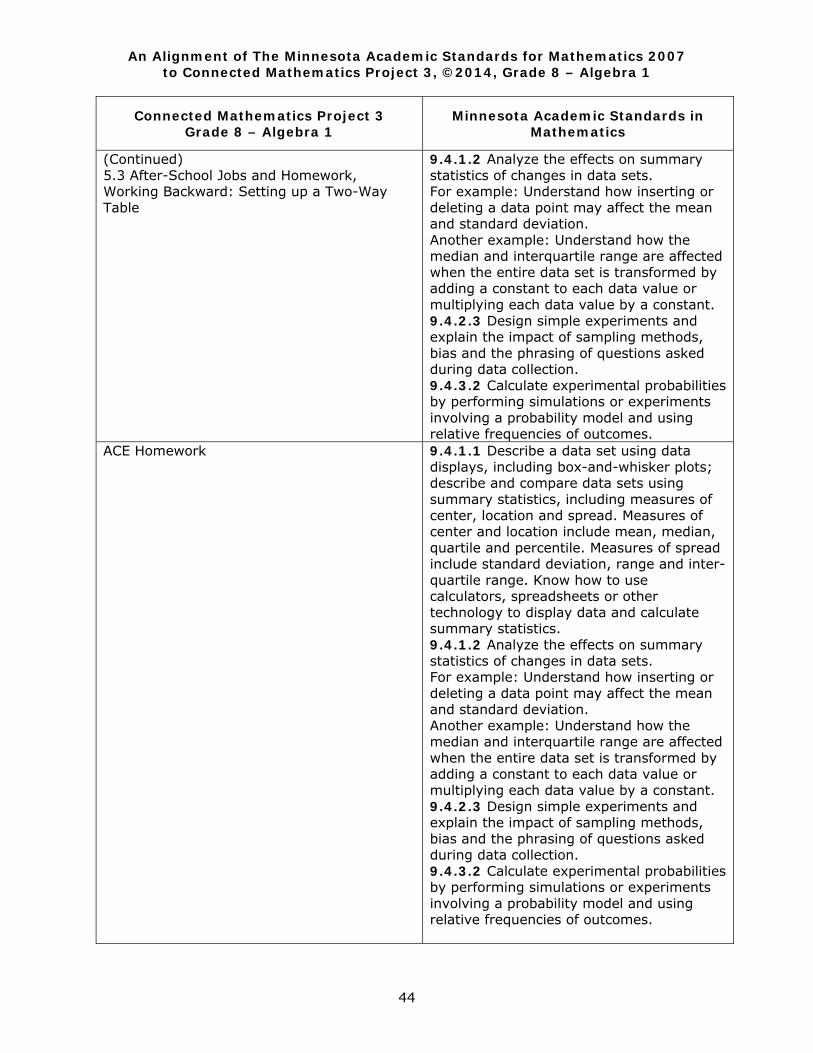
An Alignment of The Minnesota Academic Standards for Mathematics 2007 to Connected Mathematics Project 3, ©2014, Grade 8 – Algebra 1
44
Connected Mathematics Project 3 Grade 8 – Algebra 1
Minnesota Academic Standards in Mathematics
(Continued) 5.3 After-School Jobs and Homework, Working Backward: Setting up a Two-Way Table
9.4.1.2 Analyze the effects on summary statistics of changes in data sets. For example: Understand how inserting or deleting a data point may affect the mean and standard deviation. Another example: Understand how the median and interquartile range are affected when the entire data set is transformed by adding a constant to each data value or multiplying each data value by a constant. 9.4.2.3 Design simple experiments and explain the impact of sampling methods, bias and the phrasing of questions asked during data collection. 9.4.3.2 Calculate experimental probabilities by performing simulations or experiments involving a probability model and using relative frequencies of outcomes.
ACE Homework 9.4.1.1 Describe a data set using data displays, including box-and-whisker plots; describe and compare data sets using summary statistics, including measures of center, location and spread. Measures of center and location include mean, median, quartile and percentile. Measures of spread include standard deviation, range and inter-quartile range. Know how to use calculators, spreadsheets or other technology to display data and calculate summary statistics. 9.4.1.2 Analyze the effects on summary statistics of changes in data sets. For example: Understand how inserting or deleting a data point may affect the mean and standard deviation. Another example: Understand how the median and interquartile range are affected when the entire data set is transformed by adding a constant to each data value or multiplying each data value by a constant. 9.4.2.3 Design simple experiments and explain the impact of sampling methods, bias and the phrasing of questions asked during data collection. 9.4.3.2 Calculate experimental probabilities by performing simulations or experiments involving a probability model and using relative frequencies of outcomes.
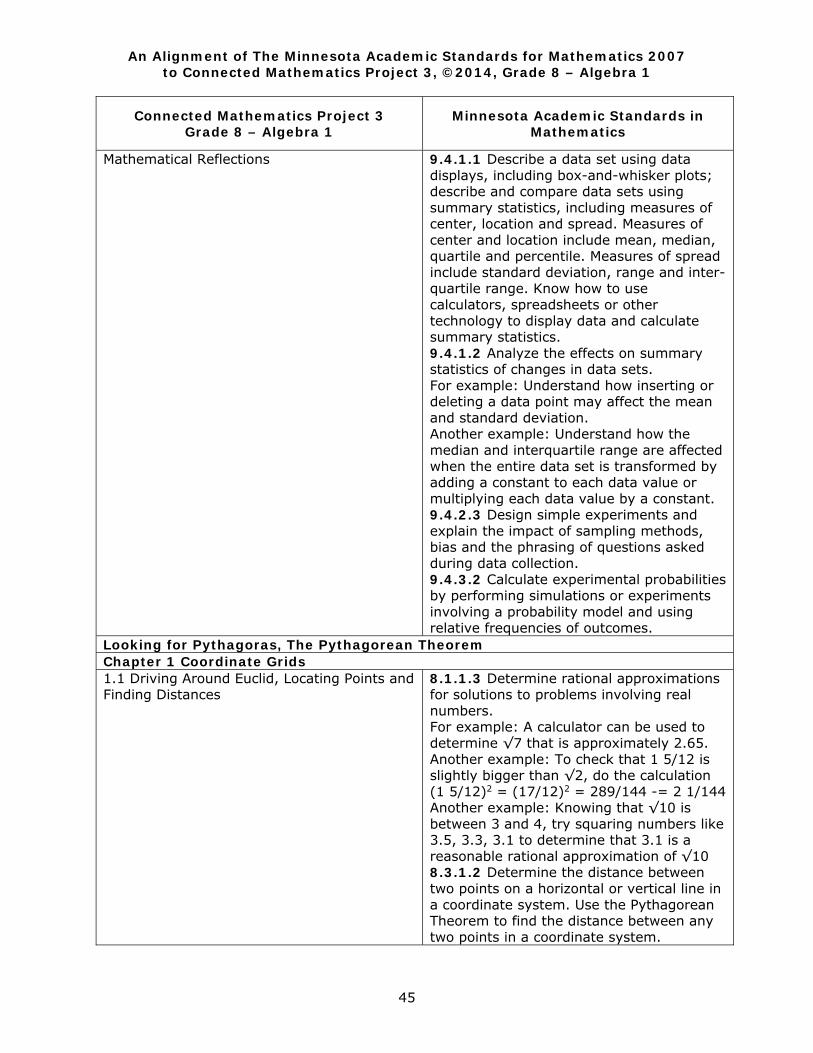
An Alignment of The Minnesota Academic Standards for Mathematics 2007 to Connected Mathematics Project 3, ©2014, Grade 8 – Algebra 1
45
Connected Mathematics Project 3 Grade 8 – Algebra 1
Minnesota Academic Standards in Mathematics
Mathematical Reflections
9.4.1.1 Describe a data set using data displays, including box-and-whisker plots; describe and compare data sets using summary statistics, including measures of center, location and spread. Measures of center and location include mean, median, quartile and percentile. Measures of spread include standard deviation, range and inter-quartile range. Know how to use calculators, spreadsheets or other technology to display data and calculate summary statistics. 9.4.1.2 Analyze the effects on summary statistics of changes in data sets. For example: Understand how inserting or deleting a data point may affect the mean and standard deviation. Another example: Understand how the median and interquartile range are affected when the entire data set is transformed by adding a constant to each data value or multiplying each data value by a constant. 9.4.2.3 Design simple experiments and explain the impact of sampling methods, bias and the phrasing of questions asked during data collection. 9.4.3.2 Calculate experimental probabilities by performing simulations or experiments involving a probability model and using relative frequencies of outcomes.
Looking for Pythagoras, The Pythagorean Theorem Chapter 1 Coordinate Grids 1.1 Driving Around Euclid, Locating Points and Finding Distances
8.1.1.3 Determine rational approximations for solutions to problems involving real numbers. For example: A calculator can be used to determine √7 that is approximately 2.65. Another example: To check that 1 5/12 is slightly bigger than √2, do the calculation (1 5/12)2 = (17/12)2 = 289/144 -= 2 1/144 Another example: Knowing that √10 is between 3 and 4, try squaring numbers like 3.5, 3.3, 3.1 to determine that 3.1 is a reasonable rational approximation of √10 8.3.1.2 Determine the distance between two points on a horizontal or vertical line in a coordinate system. Use the Pythagorean Theorem to find the distance between any two points in a coordinate system.
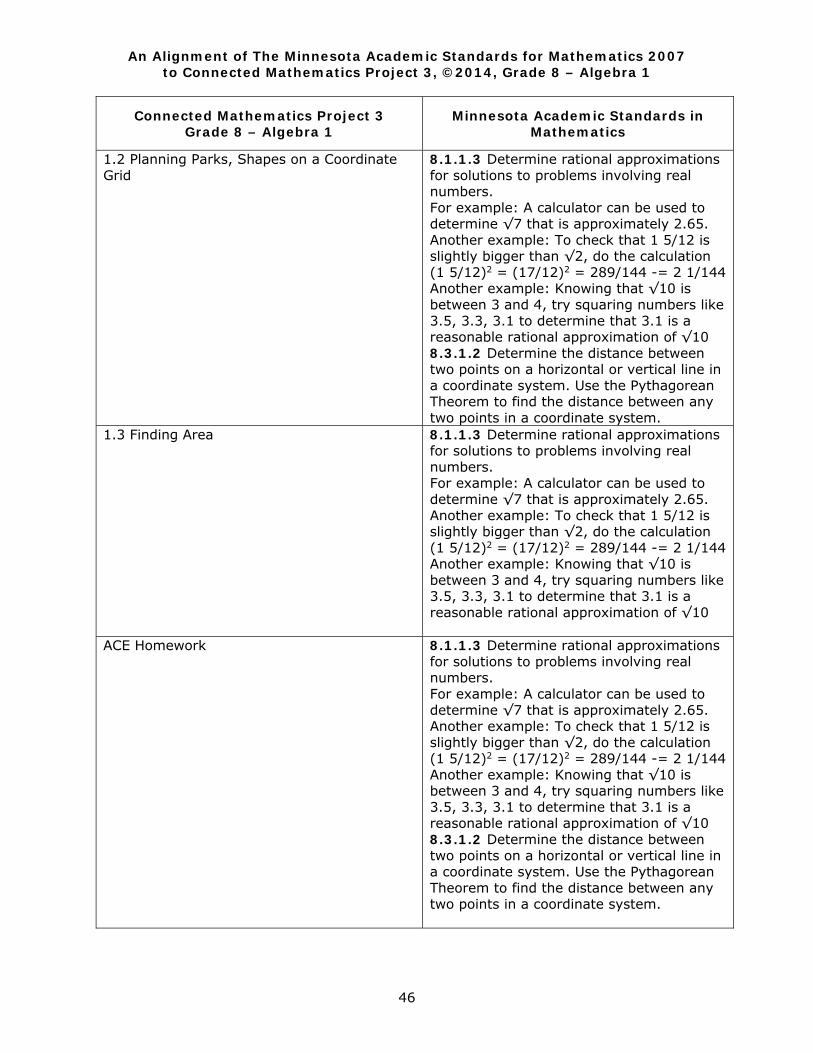
An Alignment of The Minnesota Academic Standards for Mathematics 2007 to Connected Mathematics Project 3, ©2014, Grade 8 – Algebra 1
46
Connected Mathematics Project 3 Grade 8 – Algebra 1
Minnesota Academic Standards in Mathematics
1.2 Planning Parks, Shapes on a Coordinate Grid
8.1.1.3 Determine rational approximations for solutions to problems involving real numbers. For example: A calculator can be used to determine √7 that is approximately 2.65. Another example: To check that 1 5/12 is slightly bigger than √2, do the calculation (1 5/12)2 = (17/12)2 = 289/144 -= 2 1/144 Another example: Knowing that √10 is between 3 and 4, try squaring numbers like 3.5, 3.3, 3.1 to determine that 3.1 is a reasonable rational approximation of √10 8.3.1.2 Determine the distance between two points on a horizontal or vertical line in a coordinate system. Use the Pythagorean Theorem to find the distance between any two points in a coordinate system.
1.3 Finding Area 8.1.1.3 Determine rational approximations for solutions to problems involving real numbers. For example: A calculator can be used to determine √7 that is approximately 2.65. Another example: To check that 1 5/12 is slightly bigger than √2, do the calculation (1 5/12)2 = (17/12)2 = 289/144 -= 2 1/144 Another example: Knowing that √10 is between 3 and 4, try squaring numbers like 3.5, 3.3, 3.1 to determine that 3.1 is a reasonable rational approximation of √10
ACE Homework 8.1.1.3 Determine rational approximations for solutions to problems involving real numbers. For example: A calculator can be used to determine √7 that is approximately 2.65. Another example: To check that 1 5/12 is slightly bigger than √2, do the calculation (1 5/12)2 = (17/12)2 = 289/144 -= 2 1/144 Another example: Knowing that √10 is between 3 and 4, try squaring numbers like 3.5, 3.3, 3.1 to determine that 3.1 is a reasonable rational approximation of √10 8.3.1.2 Determine the distance between two points on a horizontal or vertical line in a coordinate system. Use the Pythagorean Theorem to find the distance between any two points in a coordinate system.
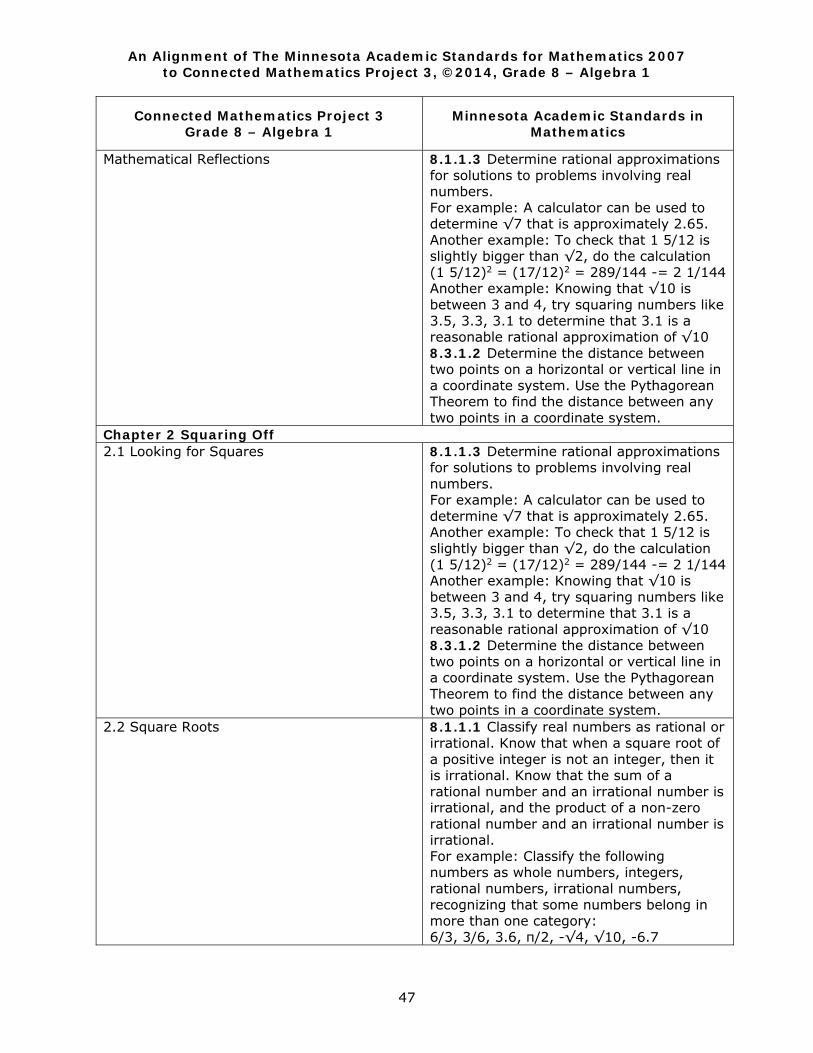
An Alignment of The Minnesota Academic Standards for Mathematics 2007 to Connected Mathematics Project 3, ©2014, Grade 8 – Algebra 1
47
Connected Mathematics Project 3 Grade 8 – Algebra 1
Minnesota Academic Standards in Mathematics
Mathematical Reflections
8.1.1.3 Determine rational approximations for solutions to problems involving real numbers. For example: A calculator can be used to determine √7 that is approximately 2.65. Another example: To check that 1 5/12 is slightly bigger than √2, do the calculation (1 5/12)2 = (17/12)2 = 289/144 -= 2 1/144 Another example: Knowing that √10 is between 3 and 4, try squaring numbers like 3.5, 3.3, 3.1 to determine that 3.1 is a reasonable rational approximation of √10 8.3.1.2 Determine the distance between two points on a horizontal or vertical line in a coordinate system. Use the Pythagorean Theorem to find the distance between any two points in a coordinate system.
Chapter 2 Squaring Off 2.1 Looking for Squares
8.1.1.3 Determine rational approximations for solutions to problems involving real numbers. For example: A calculator can be used to determine √7 that is approximately 2.65. Another example: To check that 1 5/12 is slightly bigger than √2, do the calculation (1 5/12)2 = (17/12)2 = 289/144 -= 2 1/144 Another example: Knowing that √10 is between 3 and 4, try squaring numbers like 3.5, 3.3, 3.1 to determine that 3.1 is a reasonable rational approximation of √10 8.3.1.2 Determine the distance between two points on a horizontal or vertical line in a coordinate system. Use the Pythagorean Theorem to find the distance between any two points in a coordinate system.
2.2 Square Roots
8.1.1.1 Classify real numbers as rational or irrational. Know that when a square root of a positive integer is not an integer, then it is irrational. Know that the sum of a rational number and an irrational number is irrational, and the product of a non-zero rational number and an irrational number is irrational. For example: Classify the following numbers as whole numbers, integers, rational numbers, irrational numbers, recognizing that some numbers belong in more than one category: 6/3, 3/6, 3.6, π/2, -√4, √10, -6.7
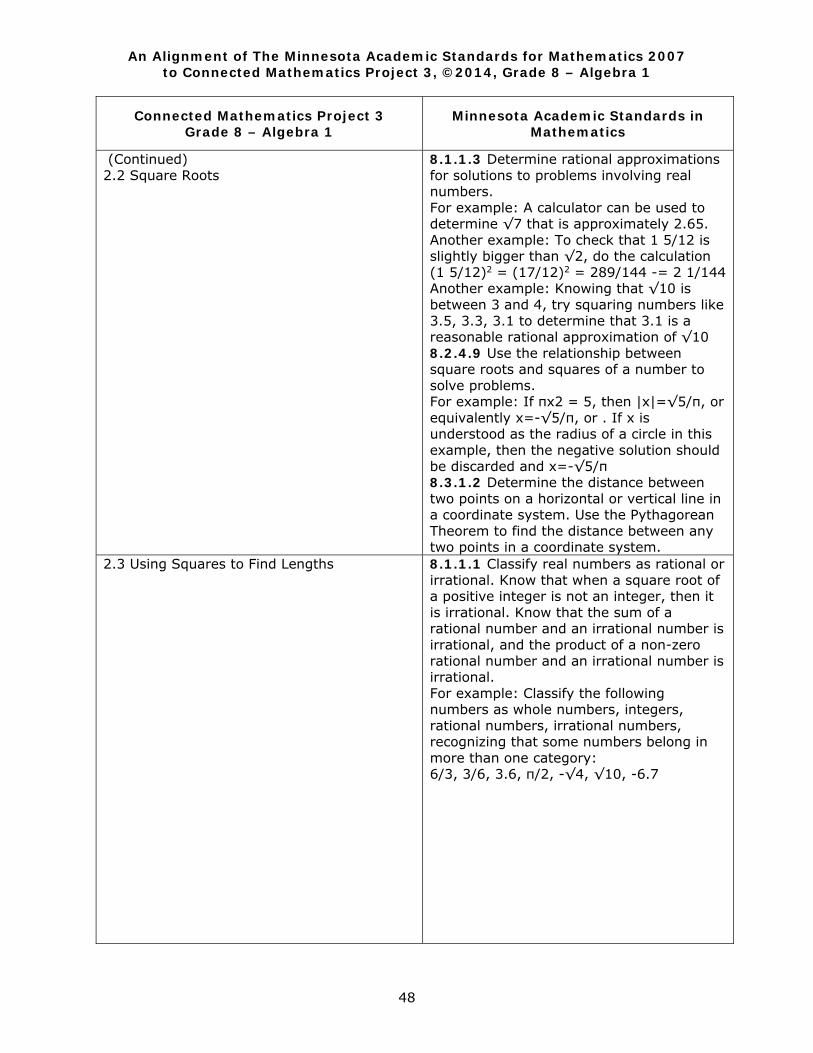
An Alignment of The Minnesota Academic Standards for Mathematics 2007 to Connected Mathematics Project 3, ©2014, Grade 8 – Algebra 1
48
Connected Mathematics Project 3 Grade 8 – Algebra 1
Minnesota Academic Standards in Mathematics
(Continued) 2.2 Square Roots
8.1.1.3 Determine rational approximations for solutions to problems involving real numbers. For example: A calculator can be used to determine √7 that is approximately 2.65. Another example: To check that 1 5/12 is slightly bigger than √2, do the calculation (1 5/12)2 = (17/12)2 = 289/144 -= 2 1/144 Another example: Knowing that √10 is between 3 and 4, try squaring numbers like 3.5, 3.3, 3.1 to determine that 3.1 is a reasonable rational approximation of √10 8.2.4.9 Use the relationship between square roots and squares of a number to solve problems. For example: If πx2 = 5, then |x|=√5/π, or equivalently x=-√5/π, or . If x is understood as the radius of a circle in this example, then the negative solution should be discarded and x=-√5/π 8.3.1.2 Determine the distance between two points on a horizontal or vertical line in a coordinate system. Use the Pythagorean Theorem to find the distance between any two points in a coordinate system.
2.3 Using Squares to Find Lengths
8.1.1.1 Classify real numbers as rational or irrational. Know that when a square root of a positive integer is not an integer, then it is irrational. Know that the sum of a rational number and an irrational number is irrational, and the product of a non-zero rational number and an irrational number is irrational. For example: Classify the following numbers as whole numbers, integers, rational numbers, irrational numbers, recognizing that some numbers belong in more than one category: 6/3, 3/6, 3.6, π/2, -√4, √10, -6.7
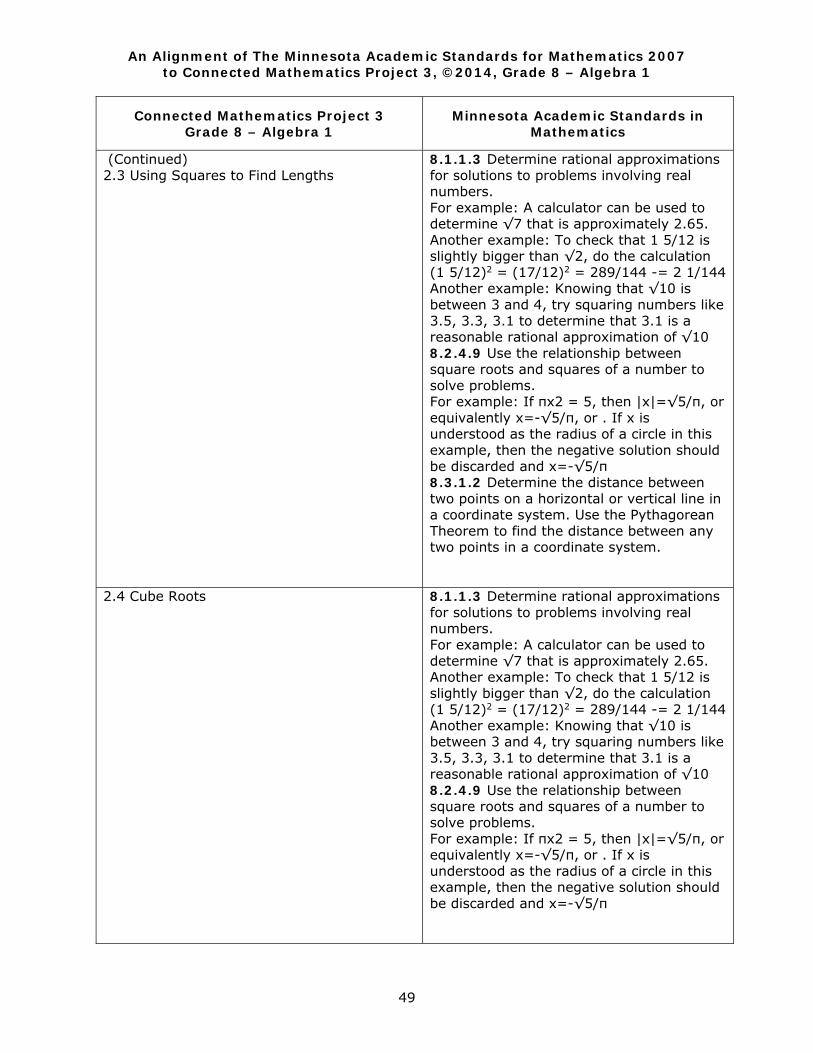
An Alignment of The Minnesota Academic Standards for Mathematics 2007 to Connected Mathematics Project 3, ©2014, Grade 8 – Algebra 1
49
Connected Mathematics Project 3 Grade 8 – Algebra 1
Minnesota Academic Standards in Mathematics
(Continued) 2.3 Using Squares to Find Lengths
8.1.1.3 Determine rational approximations for solutions to problems involving real numbers. For example: A calculator can be used to determine √7 that is approximately 2.65. Another example: To check that 1 5/12 is slightly bigger than √2, do the calculation (1 5/12)2 = (17/12)2 = 289/144 -= 2 1/144 Another example: Knowing that √10 is between 3 and 4, try squaring numbers like 3.5, 3.3, 3.1 to determine that 3.1 is a reasonable rational approximation of √10 8.2.4.9 Use the relationship between square roots and squares of a number to solve problems. For example: If πx2 = 5, then |x|=√5/π, or equivalently x=-√5/π, or . If x is understood as the radius of a circle in this example, then the negative solution should be discarded and x=-√5/π 8.3.1.2 Determine the distance between two points on a horizontal or vertical line in a coordinate system. Use the Pythagorean Theorem to find the distance between any two points in a coordinate system.
2.4 Cube Roots 8.1.1.3 Determine rational approximations for solutions to problems involving real numbers. For example: A calculator can be used to determine √7 that is approximately 2.65. Another example: To check that 1 5/12 is slightly bigger than √2, do the calculation (1 5/12)2 = (17/12)2 = 289/144 -= 2 1/144 Another example: Knowing that √10 is between 3 and 4, try squaring numbers like 3.5, 3.3, 3.1 to determine that 3.1 is a reasonable rational approximation of √10 8.2.4.9 Use the relationship between square roots and squares of a number to solve problems. For example: If πx2 = 5, then |x|=√5/π, or equivalently x=-√5/π, or . If x is understood as the radius of a circle in this example, then the negative solution should be discarded and x=-√5/π
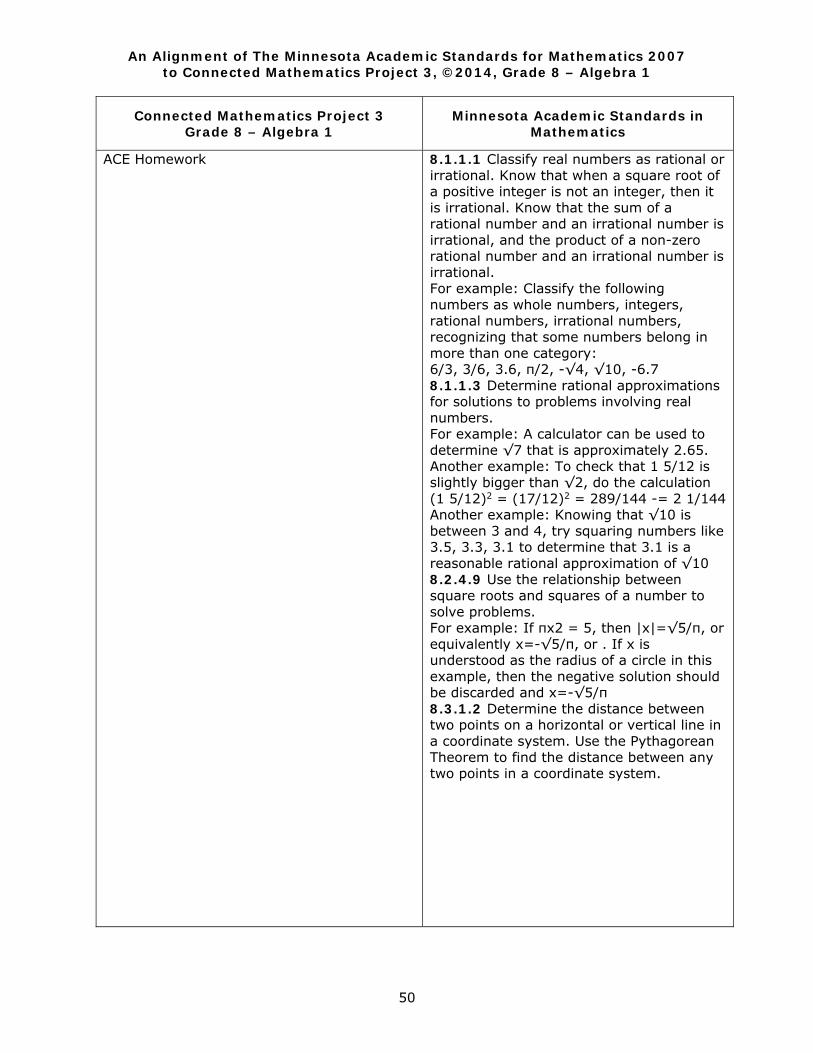
An Alignment of The Minnesota Academic Standards for Mathematics 2007 to Connected Mathematics Project 3, ©2014, Grade 8 – Algebra 1
50
Connected Mathematics Project 3 Grade 8 – Algebra 1
Minnesota Academic Standards in Mathematics
ACE Homework
8.1.1.1 Classify real numbers as rational or irrational. Know that when a square root of a positive integer is not an integer, then it is irrational. Know that the sum of a rational number and an irrational number is irrational, and the product of a non-zero rational number and an irrational number is irrational. For example: Classify the following numbers as whole numbers, integers, rational numbers, irrational numbers, recognizing that some numbers belong in more than one category: 6/3, 3/6, 3.6, π/2, -√4, √10, -6.7 8.1.1.3 Determine rational approximations for solutions to problems involving real numbers. For example: A calculator can be used to determine √7 that is approximately 2.65. Another example: To check that 1 5/12 is slightly bigger than √2, do the calculation (1 5/12)2 = (17/12)2 = 289/144 -= 2 1/144 Another example: Knowing that √10 is between 3 and 4, try squaring numbers like 3.5, 3.3, 3.1 to determine that 3.1 is a reasonable rational approximation of √10 8.2.4.9 Use the relationship between square roots and squares of a number to solve problems. For example: If πx2 = 5, then |x|=√5/π, or equivalently x=-√5/π, or . If x is understood as the radius of a circle in this example, then the negative solution should be discarded and x=-√5/π 8.3.1.2 Determine the distance between two points on a horizontal or vertical line in a coordinate system. Use the Pythagorean Theorem to find the distance between any two points in a coordinate system.

An Alignment of The Minnesota Academic Standards for Mathematics 2007 to Connected Mathematics Project 3, ©2014, Grade 8 – Algebra 1
51
Connected Mathematics Project 3 Grade 8 – Algebra 1
Minnesota Academic Standards in Mathematics
Mathematical Reflections
8.1.1.1 Classify real numbers as rational or irrational. Know that when a square root of a positive integer is not an integer, then it is irrational. Know that the sum of a rational number and an irrational number is irrational, and the product of a non-zero rational number and an irrational number is irrational. For example: Classify the following numbers as whole numbers, integers, rational numbers, irrational numbers, recognizing that some numbers belong in more than one category: 6/3, 3/6, 3.6, π/2, -√4, √10, -6.7 8.1.1.3 Determine rational approximations for solutions to problems involving real numbers. For example: A calculator can be used to determine √7 that is approximately 2.65. Another example: To check that 1 5/12 is slightly bigger than √2, do the calculation (1 5/12)2 = (17/12)2 = 289/144 -= 2 1/144 Another example: Knowing that √10 is between 3 and 4, try squaring numbers like 3.5, 3.3, 3.1 to determine that 3.1 is a reasonable rational approximation of √10 8.2.4.9 Use the relationship between square roots and squares of a number to solve problems. For example: If πx2 = 5, then |x|=√5/π, or equivalently x=-√5/π, or . If x is understood as the radius of a circle in this example, then the negative solution should be discarded and x=-√5/π 8.3.1.2 Determine the distance between two points on a horizontal or vertical line in a coordinate system. Use the Pythagorean Theorem to find the distance between any two points in a coordinate system.
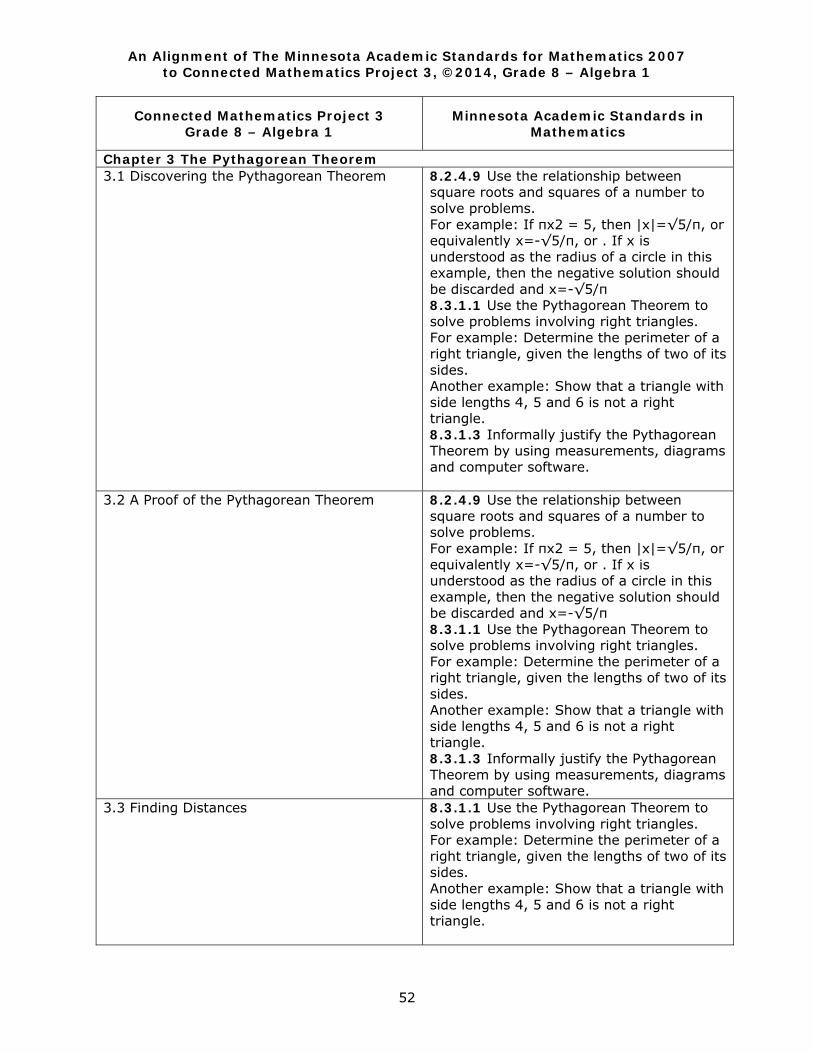
An Alignment of The Minnesota Academic Standards for Mathematics 2007 to Connected Mathematics Project 3, ©2014, Grade 8 – Algebra 1
52
Connected Mathematics Project 3 Grade 8 – Algebra 1
Minnesota Academic Standards in Mathematics
Chapter 3 The Pythagorean Theorem 3.1 Discovering the Pythagorean Theorem 8.2.4.9 Use the relationship between
square roots and squares of a number to solve problems. For example: If πx2 = 5, then |x|=√5/π, or equivalently x=-√5/π, or . If x is understood as the radius of a circle in this example, then the negative solution should be discarded and x=-√5/π 8.3.1.1 Use the Pythagorean Theorem to solve problems involving right triangles. For example: Determine the perimeter of a right triangle, given the lengths of two of its sides. Another example: Show that a triangle with side lengths 4, 5 and 6 is not a right triangle. 8.3.1.3 Informally justify the Pythagorean Theorem by using measurements, diagrams and computer software.
3.2 A Proof of the Pythagorean Theorem 8.2.4.9 Use the relationship between square roots and squares of a number to solve problems. For example: If πx2 = 5, then |x|=√5/π, or equivalently x=-√5/π, or . If x is understood as the radius of a circle in this example, then the negative solution should be discarded and x=-√5/π 8.3.1.1 Use the Pythagorean Theorem to solve problems involving right triangles. For example: Determine the perimeter of a right triangle, given the lengths of two of its sides. Another example: Show that a triangle with side lengths 4, 5 and 6 is not a right triangle. 8.3.1.3 Informally justify the Pythagorean Theorem by using measurements, diagrams and computer software.
3.3 Finding Distances 8.3.1.1 Use the Pythagorean Theorem to solve problems involving right triangles. For example: Determine the perimeter of a right triangle, given the lengths of two of its sides. Another example: Show that a triangle with side lengths 4, 5 and 6 is not a right triangle.
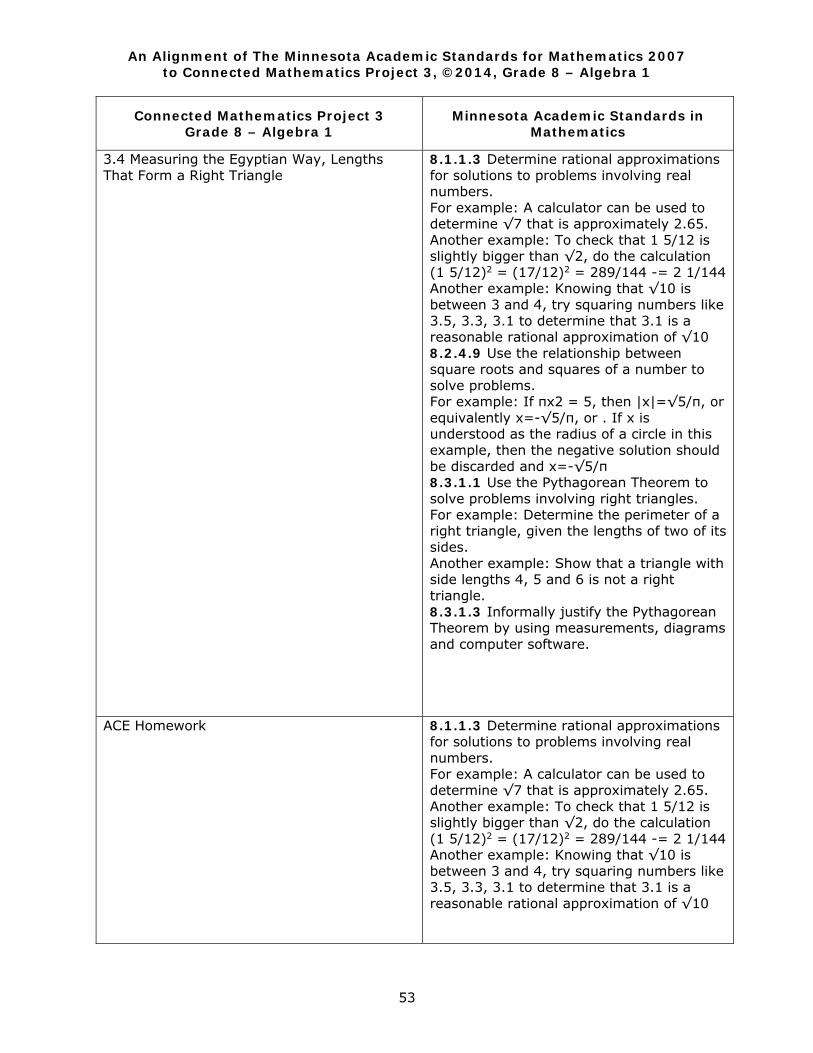
An Alignment of The Minnesota Academic Standards for Mathematics 2007 to Connected Mathematics Project 3, ©2014, Grade 8 – Algebra 1
53
Connected Mathematics Project 3 Grade 8 – Algebra 1
Minnesota Academic Standards in Mathematics
3.4 Measuring the Egyptian Way, Lengths That Form a Right Triangle
8.1.1.3 Determine rational approximations for solutions to problems involving real numbers. For example: A calculator can be used to determine √7 that is approximately 2.65. Another example: To check that 1 5/12 is slightly bigger than √2, do the calculation (1 5/12)2 = (17/12)2 = 289/144 -= 2 1/144 Another example: Knowing that √10 is between 3 and 4, try squaring numbers like 3.5, 3.3, 3.1 to determine that 3.1 is a reasonable rational approximation of √10 8.2.4.9 Use the relationship between square roots and squares of a number to solve problems. For example: If πx2 = 5, then |x|=√5/π, or equivalently x=-√5/π, or . If x is understood as the radius of a circle in this example, then the negative solution should be discarded and x=-√5/π 8.3.1.1 Use the Pythagorean Theorem to solve problems involving right triangles. For example: Determine the perimeter of a right triangle, given the lengths of two of its sides. Another example: Show that a triangle with side lengths 4, 5 and 6 is not a right triangle. 8.3.1.3 Informally justify the Pythagorean Theorem by using measurements, diagrams and computer software.
ACE Homework
8.1.1.3 Determine rational approximations for solutions to problems involving real numbers. For example: A calculator can be used to determine √7 that is approximately 2.65. Another example: To check that 1 5/12 is slightly bigger than √2, do the calculation (1 5/12)2 = (17/12)2 = 289/144 -= 2 1/144 Another example: Knowing that √10 is between 3 and 4, try squaring numbers like 3.5, 3.3, 3.1 to determine that 3.1 is a reasonable rational approximation of √10
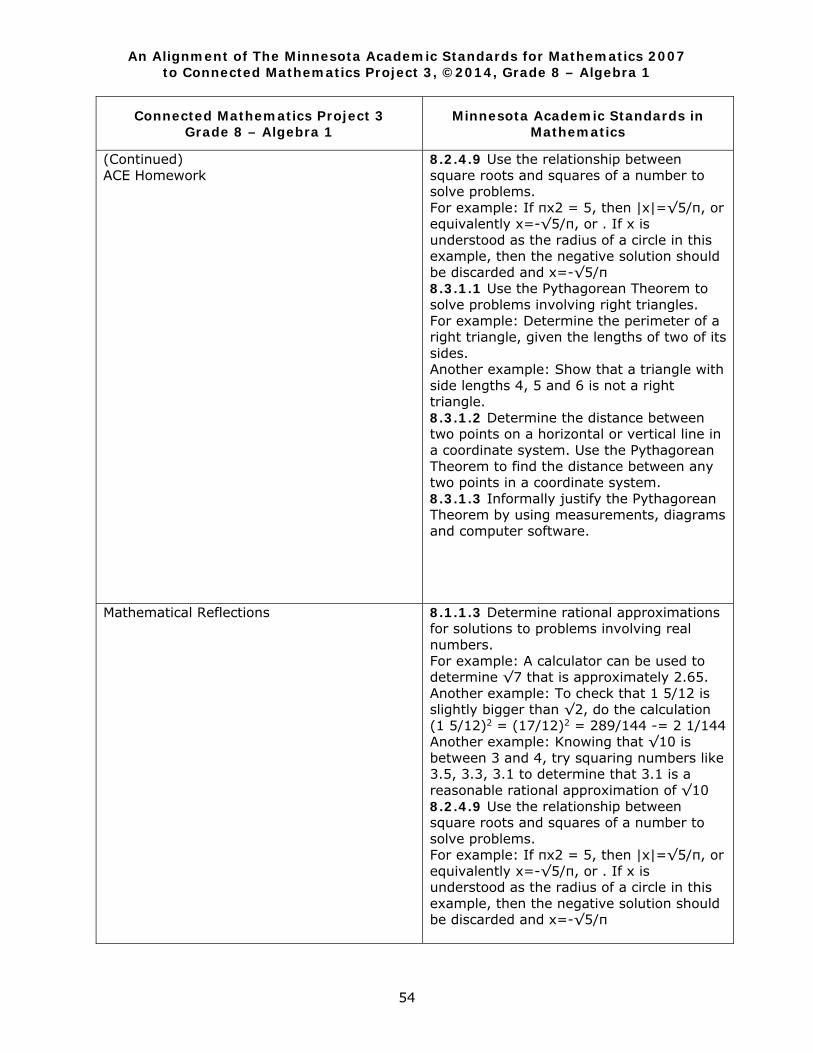
An Alignment of The Minnesota Academic Standards for Mathematics 2007 to Connected Mathematics Project 3, ©2014, Grade 8 – Algebra 1
54
Connected Mathematics Project 3 Grade 8 – Algebra 1
Minnesota Academic Standards in Mathematics
(Continued) ACE Homework
8.2.4.9 Use the relationship between square roots and squares of a number to solve problems. For example: If πx2 = 5, then |x|=√5/π, or equivalently x=-√5/π, or . If x is understood as the radius of a circle in this example, then the negative solution should be discarded and x=-√5/π 8.3.1.1 Use the Pythagorean Theorem to solve problems involving right triangles. For example: Determine the perimeter of a right triangle, given the lengths of two of its sides. Another example: Show that a triangle with side lengths 4, 5 and 6 is not a right triangle. 8.3.1.2 Determine the distance between two points on a horizontal or vertical line in a coordinate system. Use the Pythagorean Theorem to find the distance between any two points in a coordinate system. 8.3.1.3 Informally justify the Pythagorean Theorem by using measurements, diagrams and computer software.
Mathematical Reflections
8.1.1.3 Determine rational approximations for solutions to problems involving real numbers. For example: A calculator can be used to determine √7 that is approximately 2.65. Another example: To check that 1 5/12 is slightly bigger than √2, do the calculation (1 5/12)2 = (17/12)2 = 289/144 -= 2 1/144 Another example: Knowing that √10 is between 3 and 4, try squaring numbers like 3.5, 3.3, 3.1 to determine that 3.1 is a reasonable rational approximation of √10 8.2.4.9 Use the relationship between square roots and squares of a number to solve problems. For example: If πx2 = 5, then |x|=√5/π, or equivalently x=-√5/π, or . If x is understood as the radius of a circle in this example, then the negative solution should be discarded and x=-√5/π
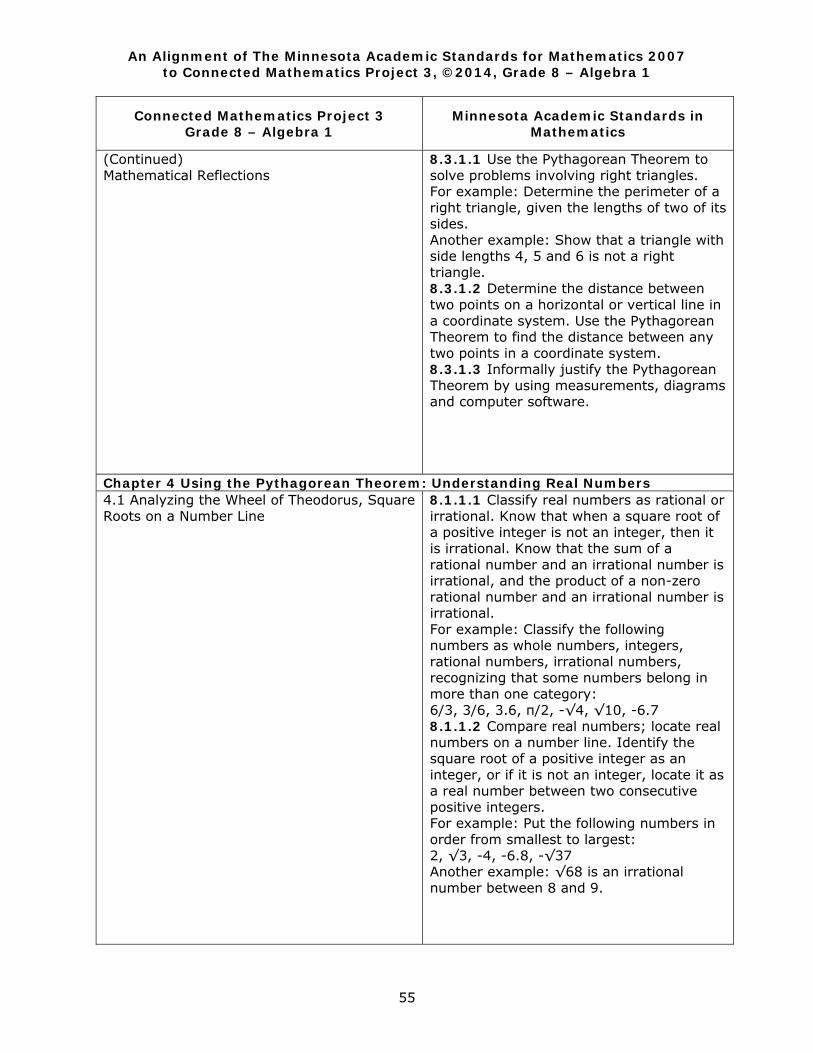
An Alignment of The Minnesota Academic Standards for Mathematics 2007 to Connected Mathematics Project 3, ©2014, Grade 8 – Algebra 1
55
Connected Mathematics Project 3 Grade 8 – Algebra 1
Minnesota Academic Standards in Mathematics
(Continued) Mathematical Reflections
8.3.1.1 Use the Pythagorean Theorem to solve problems involving right triangles. For example: Determine the perimeter of a right triangle, given the lengths of two of its sides. Another example: Show that a triangle with side lengths 4, 5 and 6 is not a right triangle. 8.3.1.2 Determine the distance between two points on a horizontal or vertical line in a coordinate system. Use the Pythagorean Theorem to find the distance between any two points in a coordinate system. 8.3.1.3 Informally justify the Pythagorean Theorem by using measurements, diagrams and computer software.
Chapter 4 Using the Pythagorean Theorem: Understanding Real Numbers 4.1 Analyzing the Wheel of Theodorus, Square Roots on a Number Line
8.1.1.1 Classify real numbers as rational or irrational. Know that when a square root of a positive integer is not an integer, then it is irrational. Know that the sum of a rational number and an irrational number is irrational, and the product of a non-zero rational number and an irrational number is irrational. For example: Classify the following numbers as whole numbers, integers, rational numbers, irrational numbers, recognizing that some numbers belong in more than one category: 6/3, 3/6, 3.6, π/2, -√4, √10, -6.7 8.1.1.2 Compare real numbers; locate real numbers on a number line. Identify the square root of a positive integer as an integer, or if it is not an integer, locate it as a real number between two consecutive positive integers. For example: Put the following numbers in order from smallest to largest: 2, √3, -4, -6.8, -√37 Another example: √68 is an irrational number between 8 and 9.
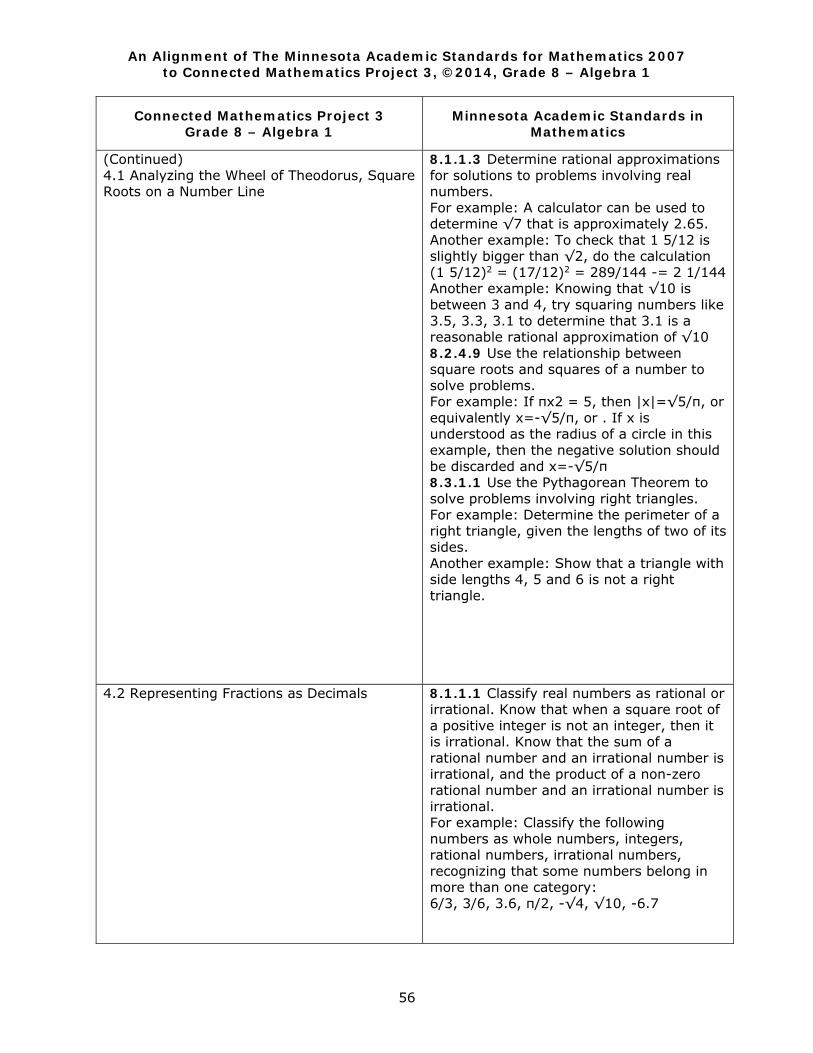
An Alignment of The Minnesota Academic Standards for Mathematics 2007 to Connected Mathematics Project 3, ©2014, Grade 8 – Algebra 1
56
Connected Mathematics Project 3 Grade 8 – Algebra 1
Minnesota Academic Standards in Mathematics
(Continued) 4.1 Analyzing the Wheel of Theodorus, Square Roots on a Number Line
8.1.1.3 Determine rational approximations for solutions to problems involving real numbers. For example: A calculator can be used to determine √7 that is approximately 2.65. Another example: To check that 1 5/12 is slightly bigger than √2, do the calculation (1 5/12)2 = (17/12)2 = 289/144 -= 2 1/144 Another example: Knowing that √10 is between 3 and 4, try squaring numbers like 3.5, 3.3, 3.1 to determine that 3.1 is a reasonable rational approximation of √10 8.2.4.9 Use the relationship between square roots and squares of a number to solve problems. For example: If πx2 = 5, then |x|=√5/π, or equivalently x=-√5/π, or . If x is understood as the radius of a circle in this example, then the negative solution should be discarded and x=-√5/π 8.3.1.1 Use the Pythagorean Theorem to solve problems involving right triangles. For example: Determine the perimeter of a right triangle, given the lengths of two of its sides. Another example: Show that a triangle with side lengths 4, 5 and 6 is not a right triangle.
4.2 Representing Fractions as Decimals
8.1.1.1 Classify real numbers as rational or irrational. Know that when a square root of a positive integer is not an integer, then it is irrational. Know that the sum of a rational number and an irrational number is irrational, and the product of a non-zero rational number and an irrational number is irrational. For example: Classify the following numbers as whole numbers, integers, rational numbers, irrational numbers, recognizing that some numbers belong in more than one category: 6/3, 3/6, 3.6, π/2, -√4, √10, -6.7

An Alignment of The Minnesota Academic Standards for Mathematics 2007 to Connected Mathematics Project 3, ©2014, Grade 8 – Algebra 1
57
Connected Mathematics Project 3 Grade 8 – Algebra 1
Minnesota Academic Standards in Mathematics
(Continued) 4.2 Representing Fractions as Decimals
8.1.1.3 Determine rational approximations for solutions to problems involving real numbers. For example: A calculator can be used to determine √7 that is approximately 2.65. Another example: To check that 1 5/12 is slightly bigger than √2, do the calculation (1 5/12)2 = (17/12)2 = 289/144 -= 2 1/144 Another example: Knowing that √10 is between 3 and 4, try squaring numbers like 3.5, 3.3, 3.1 to determine that 3.1 is a reasonable rational approximation of √10
4.3 Representing Decimals as Fractions
8.1.1.1 Classify real numbers as rational or irrational. Know that when a square root of a positive integer is not an integer, then it is irrational. Know that the sum of a rational number and an irrational number is irrational, and the product of a non-zero rational number and an irrational number is irrational. For example: Classify the following numbers as whole numbers, integers, rational numbers, irrational numbers, recognizing that some numbers belong in more than one category: 6/3, 3/6, 3.6, π/2, -√4, √10, -6.7 8.1.1.3 Determine rational approximations for solutions to problems involving real numbers. For example: A calculator can be used to determine √7 that is approximately 2.65. Another example: To check that 1 5/12 is slightly bigger than √2, do the calculation (1 5/12)2 = (17/12)2 = 289/144 -= 2 1/144 Another example: Knowing that √10 is between 3 and 4, try squaring numbers like 3.5, 3.3, 3.1 to determine that 3.1 is a reasonable rational approximation of √10
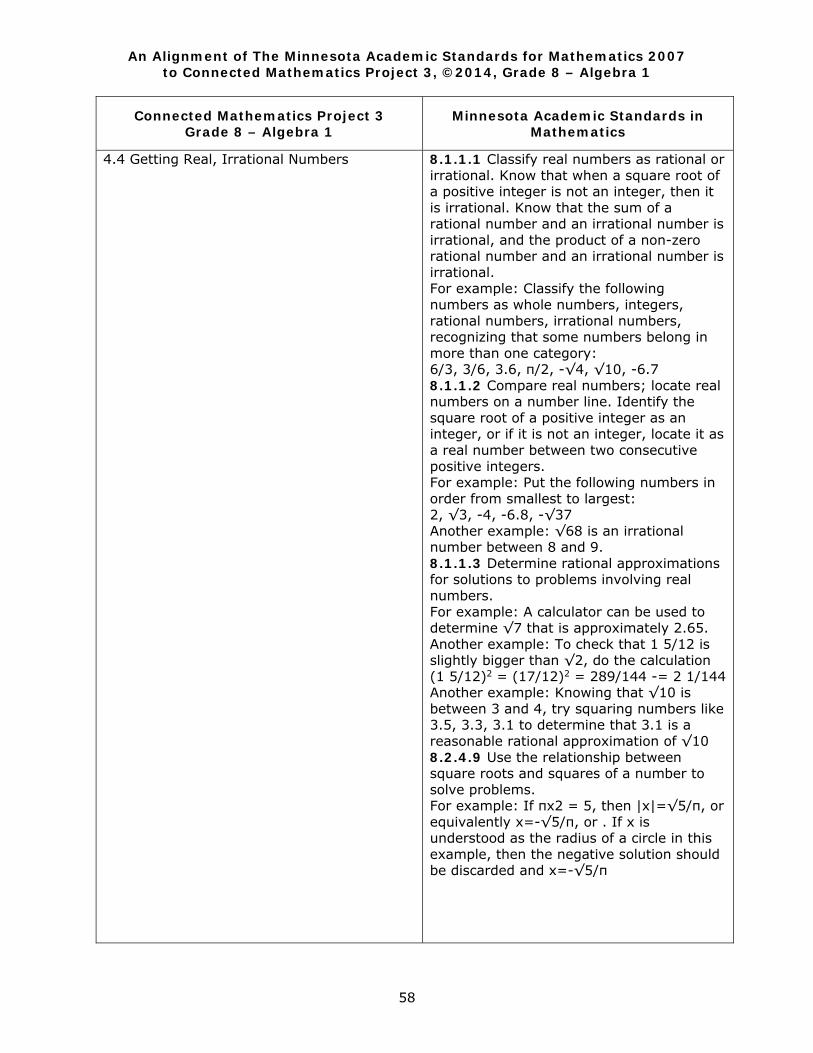
An Alignment of The Minnesota Academic Standards for Mathematics 2007 to Connected Mathematics Project 3, ©2014, Grade 8 – Algebra 1
58
Connected Mathematics Project 3 Grade 8 – Algebra 1
Minnesota Academic Standards in Mathematics
4.4 Getting Real, Irrational Numbers
8.1.1.1 Classify real numbers as rational or irrational. Know that when a square root of a positive integer is not an integer, then it is irrational. Know that the sum of a rational number and an irrational number is irrational, and the product of a non-zero rational number and an irrational number is irrational. For example: Classify the following numbers as whole numbers, integers, rational numbers, irrational numbers, recognizing that some numbers belong in more than one category: 6/3, 3/6, 3.6, π/2, -√4, √10, -6.7 8.1.1.2 Compare real numbers; locate real numbers on a number line. Identify the square root of a positive integer as an integer, or if it is not an integer, locate it as a real number between two consecutive positive integers. For example: Put the following numbers in order from smallest to largest: 2, √3, -4, -6.8, -√37 Another example: √68 is an irrational number between 8 and 9. 8.1.1.3 Determine rational approximations for solutions to problems involving real numbers. For example: A calculator can be used to determine √7 that is approximately 2.65. Another example: To check that 1 5/12 is slightly bigger than √2, do the calculation (1 5/12)2 = (17/12)2 = 289/144 -= 2 1/144 Another example: Knowing that √10 is between 3 and 4, try squaring numbers like 3.5, 3.3, 3.1 to determine that 3.1 is a reasonable rational approximation of √10 8.2.4.9 Use the relationship between square roots and squares of a number to solve problems. For example: If πx2 = 5, then |x|=√5/π, or equivalently x=-√5/π, or . If x is understood as the radius of a circle in this example, then the negative solution should be discarded and x=-√5/π
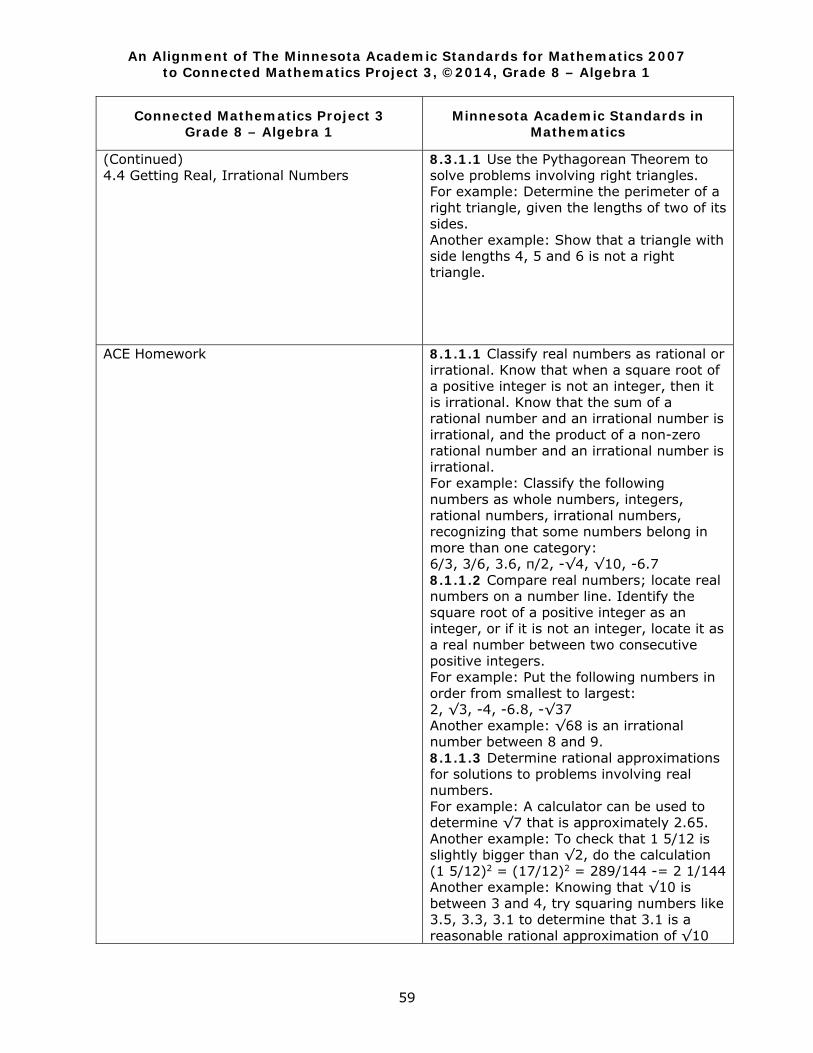
An Alignment of The Minnesota Academic Standards for Mathematics 2007 to Connected Mathematics Project 3, ©2014, Grade 8 – Algebra 1
59
Connected Mathematics Project 3 Grade 8 – Algebra 1
Minnesota Academic Standards in Mathematics
(Continued) 4.4 Getting Real, Irrational Numbers
8.3.1.1 Use the Pythagorean Theorem to solve problems involving right triangles. For example: Determine the perimeter of a right triangle, given the lengths of two of its sides. Another example: Show that a triangle with side lengths 4, 5 and 6 is not a right triangle.
ACE Homework
8.1.1.1 Classify real numbers as rational or irrational. Know that when a square root of a positive integer is not an integer, then it is irrational. Know that the sum of a rational number and an irrational number is irrational, and the product of a non-zero rational number and an irrational number is irrational. For example: Classify the following numbers as whole numbers, integers, rational numbers, irrational numbers, recognizing that some numbers belong in more than one category: 6/3, 3/6, 3.6, π/2, -√4, √10, -6.7 8.1.1.2 Compare real numbers; locate real numbers on a number line. Identify the square root of a positive integer as an integer, or if it is not an integer, locate it as a real number between two consecutive positive integers. For example: Put the following numbers in order from smallest to largest: 2, √3, -4, -6.8, -√37 Another example: √68 is an irrational number between 8 and 9. 8.1.1.3 Determine rational approximations for solutions to problems involving real numbers. For example: A calculator can be used to determine √7 that is approximately 2.65. Another example: To check that 1 5/12 is slightly bigger than √2, do the calculation (1 5/12)2 = (17/12)2 = 289/144 -= 2 1/144 Another example: Knowing that √10 is between 3 and 4, try squaring numbers like 3.5, 3.3, 3.1 to determine that 3.1 is a reasonable rational approximation of √10

An Alignment of The Minnesota Academic Standards for Mathematics 2007 to Connected Mathematics Project 3, ©2014, Grade 8 – Algebra 1
60
Connected Mathematics Project 3 Grade 8 – Algebra 1
Minnesota Academic Standards in Mathematics
(Continued) ACE Homework
8.2.4.9 Use the relationship between square roots and squares of a number to solve problems. For example: If πx2 = 5, then |x|=√5/π, or equivalently x=-√5/π, or . If x is understood as the radius of a circle in this example, then the negative solution should be discarded and x=-√5/π 8.3.1.1 Use the Pythagorean Theorem to solve problems involving right triangles. For example: Determine the perimeter of a right triangle, given the lengths of two of its sides. Another example: Show that a triangle with side lengths 4, 5 and 6 is not a right triangle.
Mathematical Reflections
8.1.1.1 Classify real numbers as rational or irrational. Know that when a square root of a positive integer is not an integer, then it is irrational. Know that the sum of a rational number and an irrational number is irrational, and the product of a non-zero rational number and an irrational number is irrational. For example: Classify the following numbers as whole numbers, integers, rational numbers, irrational numbers, recognizing that some numbers belong in more than one category: 6/3, 3/6, 3.6, π/2, -√4, √10, -6.7 8.1.1.2 Compare real numbers; locate real numbers on a number line. Identify the square root of a positive integer as an integer, or if it is not an integer, locate it as a real number between two consecutive positive integers. For example: Put the following numbers in order from smallest to largest: 2, √3, -4, -6.8, -√37 Another example: √68 is an irrational number between 8 and 9.
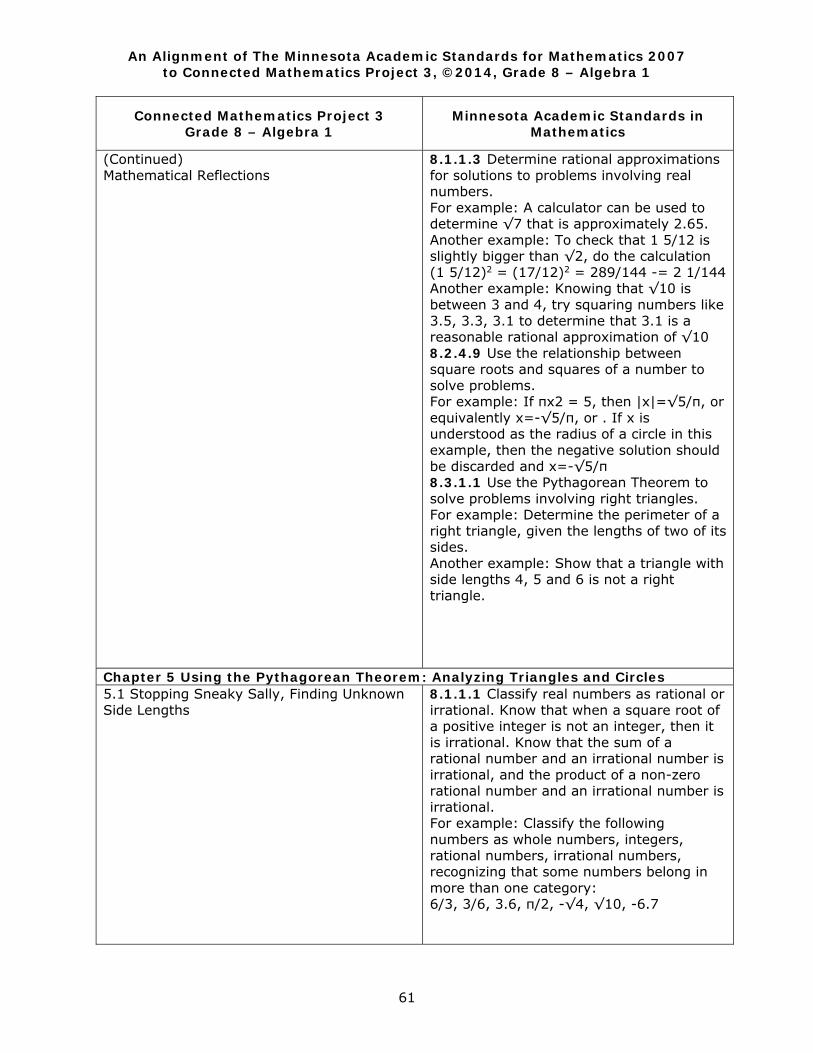
An Alignment of The Minnesota Academic Standards for Mathematics 2007 to Connected Mathematics Project 3, ©2014, Grade 8 – Algebra 1
61
Connected Mathematics Project 3 Grade 8 – Algebra 1
Minnesota Academic Standards in Mathematics
(Continued) Mathematical Reflections
8.1.1.3 Determine rational approximations for solutions to problems involving real numbers. For example: A calculator can be used to determine √7 that is approximately 2.65. Another example: To check that 1 5/12 is slightly bigger than √2, do the calculation (1 5/12)2 = (17/12)2 = 289/144 -= 2 1/144 Another example: Knowing that √10 is between 3 and 4, try squaring numbers like 3.5, 3.3, 3.1 to determine that 3.1 is a reasonable rational approximation of √10 8.2.4.9 Use the relationship between square roots and squares of a number to solve problems. For example: If πx2 = 5, then |x|=√5/π, or equivalently x=-√5/π, or . If x is understood as the radius of a circle in this example, then the negative solution should be discarded and x=-√5/π 8.3.1.1 Use the Pythagorean Theorem to solve problems involving right triangles. For example: Determine the perimeter of a right triangle, given the lengths of two of its sides. Another example: Show that a triangle with side lengths 4, 5 and 6 is not a right triangle.
Chapter 5 Using the Pythagorean Theorem: Analyzing Triangles and Circles 5.1 Stopping Sneaky Sally, Finding Unknown Side Lengths
8.1.1.1 Classify real numbers as rational or irrational. Know that when a square root of a positive integer is not an integer, then it is irrational. Know that the sum of a rational number and an irrational number is irrational, and the product of a non-zero rational number and an irrational number is irrational. For example: Classify the following numbers as whole numbers, integers, rational numbers, irrational numbers, recognizing that some numbers belong in more than one category: 6/3, 3/6, 3.6, π/2, -√4, √10, -6.7
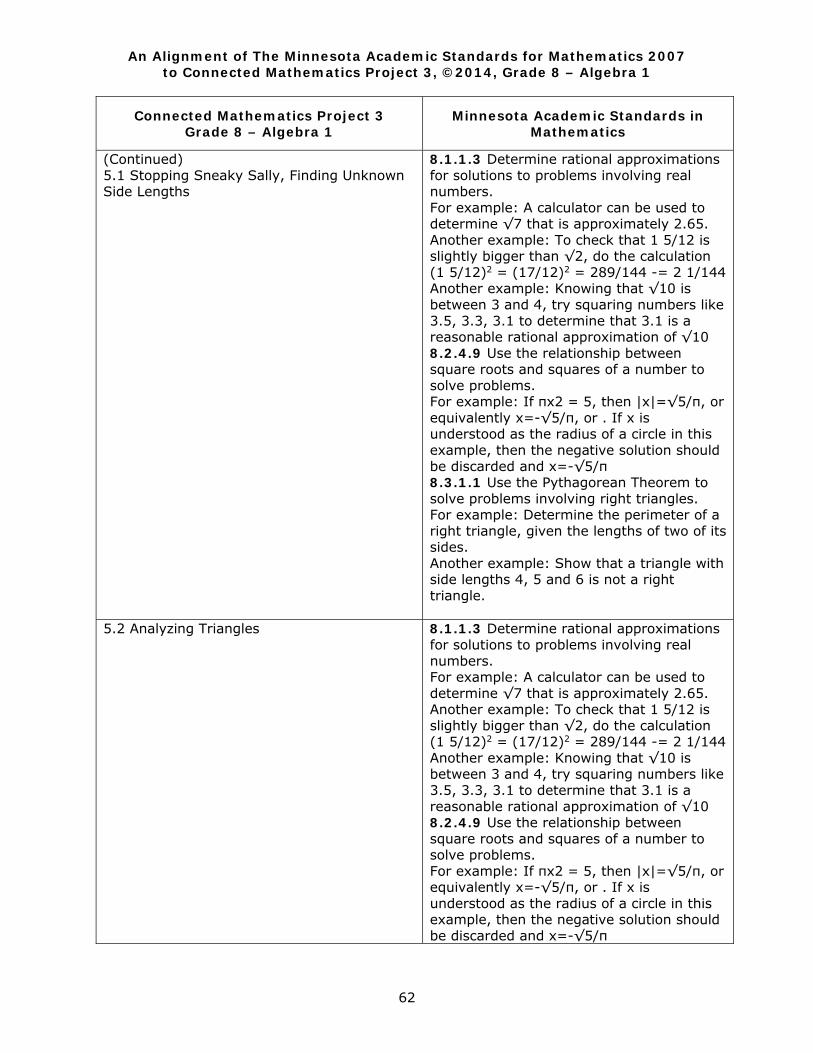
An Alignment of The Minnesota Academic Standards for Mathematics 2007 to Connected Mathematics Project 3, ©2014, Grade 8 – Algebra 1
62
Connected Mathematics Project 3 Grade 8 – Algebra 1
Minnesota Academic Standards in Mathematics
(Continued) 5.1 Stopping Sneaky Sally, Finding Unknown Side Lengths
8.1.1.3 Determine rational approximations for solutions to problems involving real numbers. For example: A calculator can be used to determine √7 that is approximately 2.65. Another example: To check that 1 5/12 is slightly bigger than √2, do the calculation (1 5/12)2 = (17/12)2 = 289/144 -= 2 1/144 Another example: Knowing that √10 is between 3 and 4, try squaring numbers like 3.5, 3.3, 3.1 to determine that 3.1 is a reasonable rational approximation of √10 8.2.4.9 Use the relationship between square roots and squares of a number to solve problems. For example: If πx2 = 5, then |x|=√5/π, or equivalently x=-√5/π, or . If x is understood as the radius of a circle in this example, then the negative solution should be discarded and x=-√5/π 8.3.1.1 Use the Pythagorean Theorem to solve problems involving right triangles. For example: Determine the perimeter of a right triangle, given the lengths of two of its sides. Another example: Show that a triangle with side lengths 4, 5 and 6 is not a right triangle.
5.2 Analyzing Triangles
8.1.1.3 Determine rational approximations for solutions to problems involving real numbers. For example: A calculator can be used to determine √7 that is approximately 2.65. Another example: To check that 1 5/12 is slightly bigger than √2, do the calculation (1 5/12)2 = (17/12)2 = 289/144 -= 2 1/144 Another example: Knowing that √10 is between 3 and 4, try squaring numbers like 3.5, 3.3, 3.1 to determine that 3.1 is a reasonable rational approximation of √10 8.2.4.9 Use the relationship between square roots and squares of a number to solve problems. For example: If πx2 = 5, then |x|=√5/π, or equivalently x=-√5/π, or . If x is understood as the radius of a circle in this example, then the negative solution should be discarded and x=-√5/π
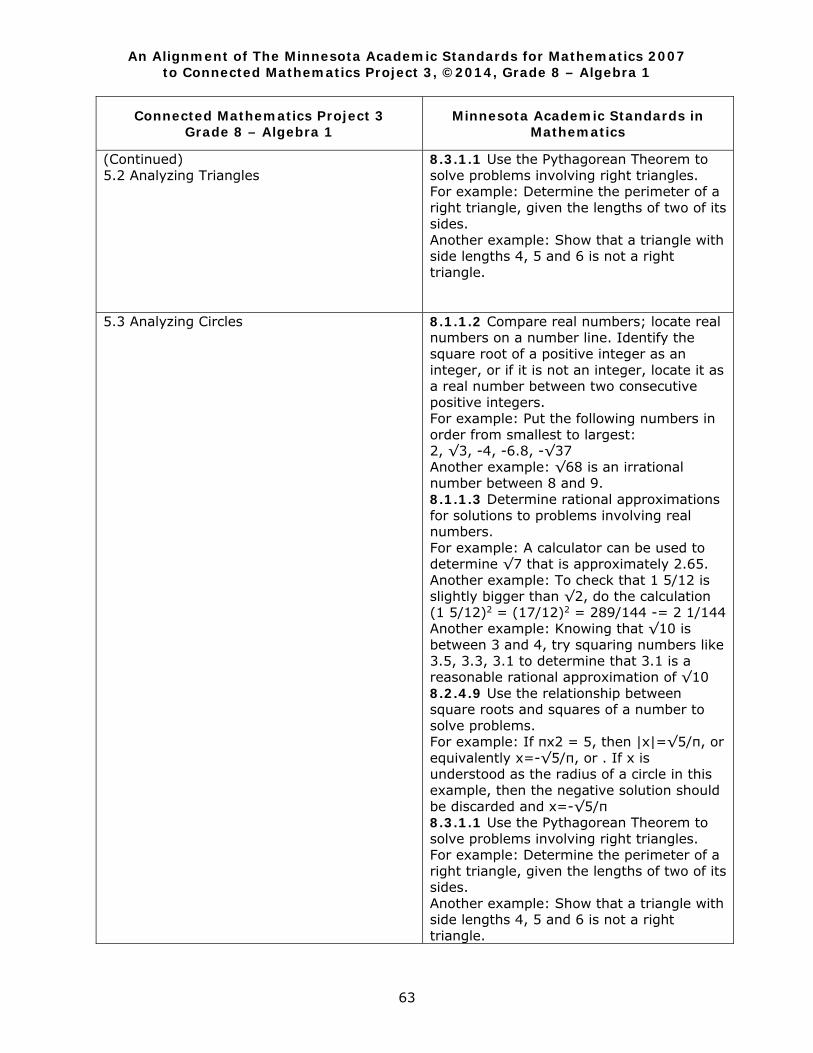
An Alignment of The Minnesota Academic Standards for Mathematics 2007 to Connected Mathematics Project 3, ©2014, Grade 8 – Algebra 1
63
Connected Mathematics Project 3 Grade 8 – Algebra 1
Minnesota Academic Standards in Mathematics
(Continued) 5.2 Analyzing Triangles
8.3.1.1 Use the Pythagorean Theorem to solve problems involving right triangles. For example: Determine the perimeter of a right triangle, given the lengths of two of its sides. Another example: Show that a triangle with side lengths 4, 5 and 6 is not a right triangle.
5.3 Analyzing Circles
8.1.1.2 Compare real numbers; locate real numbers on a number line. Identify the square root of a positive integer as an integer, or if it is not an integer, locate it as a real number between two consecutive positive integers. For example: Put the following numbers in order from smallest to largest: 2, √3, -4, -6.8, -√37 Another example: √68 is an irrational number between 8 and 9. 8.1.1.3 Determine rational approximations for solutions to problems involving real numbers. For example: A calculator can be used to determine √7 that is approximately 2.65. Another example: To check that 1 5/12 is slightly bigger than √2, do the calculation (1 5/12)2 = (17/12)2 = 289/144 -= 2 1/144 Another example: Knowing that √10 is between 3 and 4, try squaring numbers like 3.5, 3.3, 3.1 to determine that 3.1 is a reasonable rational approximation of √10 8.2.4.9 Use the relationship between square roots and squares of a number to solve problems. For example: If πx2 = 5, then |x|=√5/π, or equivalently x=-√5/π, or . If x is understood as the radius of a circle in this example, then the negative solution should be discarded and x=-√5/π 8.3.1.1 Use the Pythagorean Theorem to solve problems involving right triangles. For example: Determine the perimeter of a right triangle, given the lengths of two of its sides. Another example: Show that a triangle with side lengths 4, 5 and 6 is not a right triangle.

An Alignment of The Minnesota Academic Standards for Mathematics 2007 to Connected Mathematics Project 3, ©2014, Grade 8 – Algebra 1
64
Connected Mathematics Project 3 Grade 8 – Algebra 1
Minnesota Academic Standards in Mathematics
(Continued) 5.3 Analyzing Circles
8.3.1.2 Determine the distance between two points on a horizontal or vertical line in a coordinate system. Use the Pythagorean Theorem to find the distance between any two points in a coordinate system.
ACE Homework
8.1.1.1 Classify real numbers as rational or irrational. Know that when a square root of a positive integer is not an integer, then it is irrational. Know that the sum of a rational number and an irrational number is irrational, and the product of a non-zero rational number and an irrational number is irrational. For example: Classify the following numbers as whole numbers, integers, rational numbers, irrational numbers, recognizing that some numbers belong in more than one category: 6/3, 3/6, 3.6, π/2, -√4, √10, -6.7 8.1.1.2 Compare real numbers; locate real numbers on a number line. Identify the square root of a positive integer as an integer, or if it is not an integer, locate it as a real number between two consecutive positive integers. For example: Put the following numbers in order from smallest to largest: 2, √3, -4, -6.8, -√37 Another example: √68 is an irrational number between 8 and 9. 8.1.1.3 Determine rational approximations for solutions to problems involving real numbers. For example: A calculator can be used to determine √7 that is approximately 2.65. Another example: To check that 1 5/12 is slightly bigger than √2, do the calculation (1 5/12)2 = (17/12)2 = 289/144 -= 2 1/144 Another example: Knowing that √10 is between 3 and 4, try squaring numbers like 3.5, 3.3, 3.1 to determine that 3.1 is a reasonable rational approximation of √10
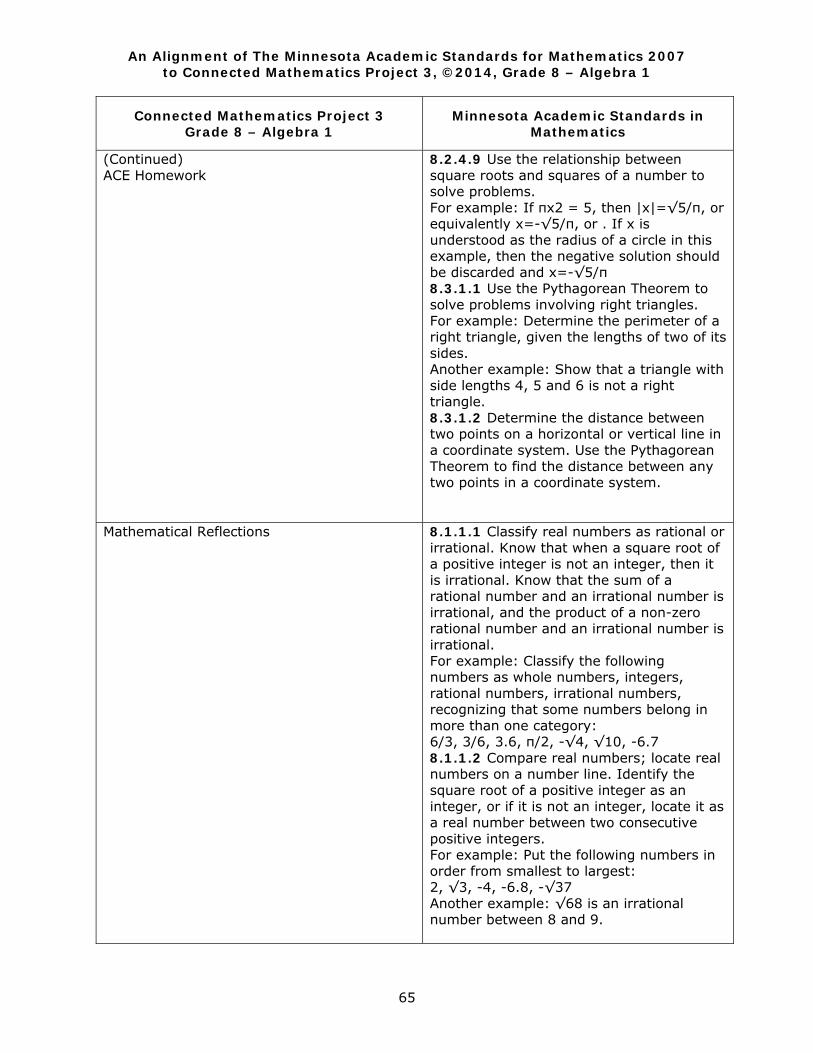
An Alignment of The Minnesota Academic Standards for Mathematics 2007 to Connected Mathematics Project 3, ©2014, Grade 8 – Algebra 1
65
Connected Mathematics Project 3 Grade 8 – Algebra 1
Minnesota Academic Standards in Mathematics
(Continued) ACE Homework
8.2.4.9 Use the relationship between square roots and squares of a number to solve problems. For example: If πx2 = 5, then |x|=√5/π, or equivalently x=-√5/π, or . If x is understood as the radius of a circle in this example, then the negative solution should be discarded and x=-√5/π 8.3.1.1 Use the Pythagorean Theorem to solve problems involving right triangles. For example: Determine the perimeter of a right triangle, given the lengths of two of its sides. Another example: Show that a triangle with side lengths 4, 5 and 6 is not a right triangle. 8.3.1.2 Determine the distance between two points on a horizontal or vertical line in a coordinate system. Use the Pythagorean Theorem to find the distance between any two points in a coordinate system.
Mathematical Reflections
8.1.1.1 Classify real numbers as rational or irrational. Know that when a square root of a positive integer is not an integer, then it is irrational. Know that the sum of a rational number and an irrational number is irrational, and the product of a non-zero rational number and an irrational number is irrational. For example: Classify the following numbers as whole numbers, integers, rational numbers, irrational numbers, recognizing that some numbers belong in more than one category: 6/3, 3/6, 3.6, π/2, -√4, √10, -6.7 8.1.1.2 Compare real numbers; locate real numbers on a number line. Identify the square root of a positive integer as an integer, or if it is not an integer, locate it as a real number between two consecutive positive integers. For example: Put the following numbers in order from smallest to largest: 2, √3, -4, -6.8, -√37 Another example: √68 is an irrational number between 8 and 9.
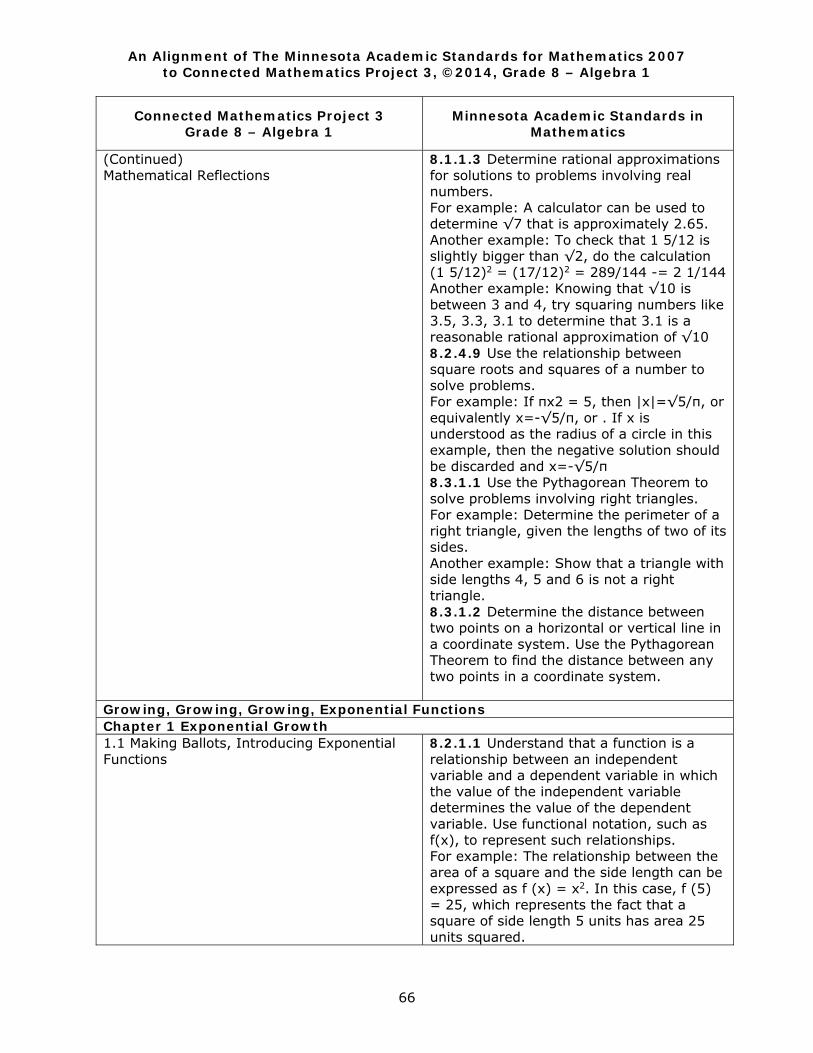
An Alignment of The Minnesota Academic Standards for Mathematics 2007 to Connected Mathematics Project 3, ©2014, Grade 8 – Algebra 1
66
Connected Mathematics Project 3 Grade 8 – Algebra 1
Minnesota Academic Standards in Mathematics
(Continued) Mathematical Reflections
8.1.1.3 Determine rational approximations for solutions to problems involving real numbers. For example: A calculator can be used to determine √7 that is approximately 2.65. Another example: To check that 1 5/12 is slightly bigger than √2, do the calculation (1 5/12)2 = (17/12)2 = 289/144 -= 2 1/144 Another example: Knowing that √10 is between 3 and 4, try squaring numbers like 3.5, 3.3, 3.1 to determine that 3.1 is a reasonable rational approximation of √10 8.2.4.9 Use the relationship between square roots and squares of a number to solve problems. For example: If πx2 = 5, then |x|=√5/π, or equivalently x=-√5/π, or . If x is understood as the radius of a circle in this example, then the negative solution should be discarded and x=-√5/π 8.3.1.1 Use the Pythagorean Theorem to solve problems involving right triangles. For example: Determine the perimeter of a right triangle, given the lengths of two of its sides. Another example: Show that a triangle with side lengths 4, 5 and 6 is not a right triangle. 8.3.1.2 Determine the distance between two points on a horizontal or vertical line in a coordinate system. Use the Pythagorean Theorem to find the distance between any two points in a coordinate system.
Growing, Growing, Growing, Exponential Functions Chapter 1 Exponential Growth 1.1 Making Ballots, Introducing Exponential Functions
8.2.1.1 Understand that a function is a relationship between an independent variable and a dependent variable in which the value of the independent variable determines the value of the dependent variable. Use functional notation, such as f(x), to represent such relationships. For example: The relationship between the area of a square and the side length can be expressed as f (x) = x2. In this case, f (5) = 25, which represents the fact that a square of side length 5 units has area 25 units squared.
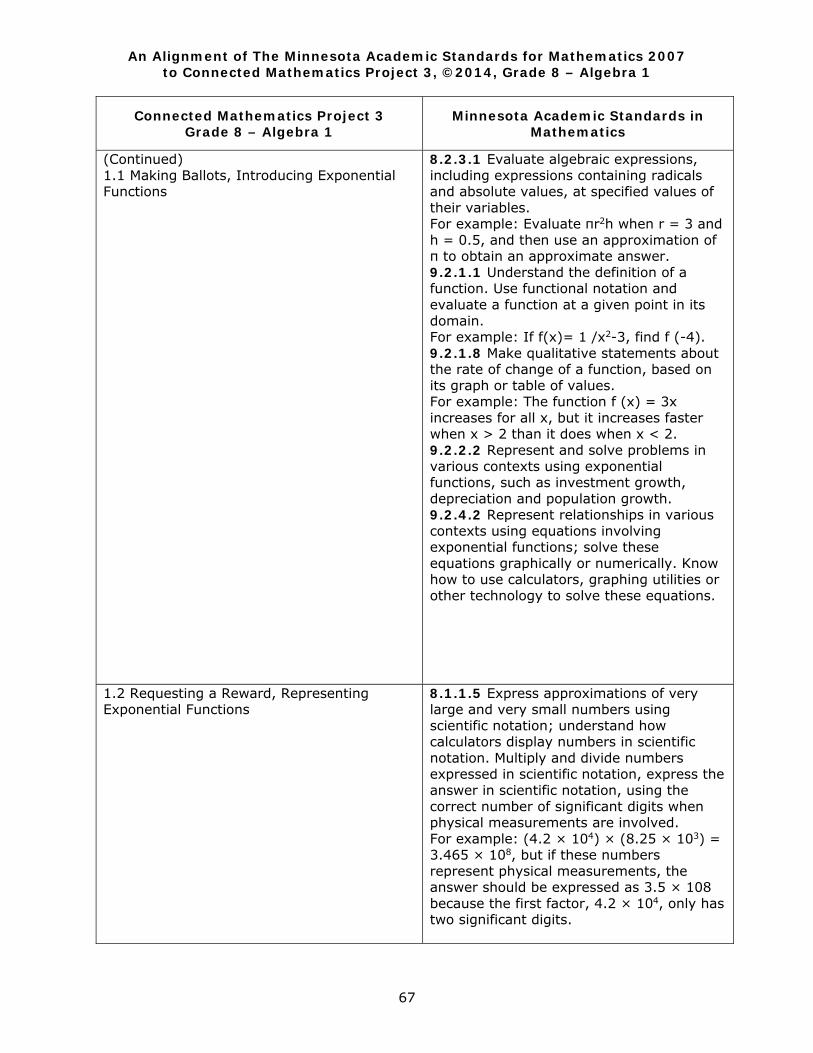
An Alignment of The Minnesota Academic Standards for Mathematics 2007 to Connected Mathematics Project 3, ©2014, Grade 8 – Algebra 1
67
Connected Mathematics Project 3 Grade 8 – Algebra 1
Minnesota Academic Standards in Mathematics
(Continued) 1.1 Making Ballots, Introducing Exponential Functions
8.2.3.1 Evaluate algebraic expressions, including expressions containing radicals and absolute values, at specified values of their variables. For example: Evaluate πr2h when r = 3 and h = 0.5, and then use an approximation of π to obtain an approximate answer. 9.2.1.1 Understand the definition of a function. Use functional notation and evaluate a function at a given point in its domain. For example: If f(x)= 1 /x2-3, find f (-4). 9.2.1.8 Make qualitative statements about the rate of change of a function, based on its graph or table of values. For example: The function f (x) = 3x increases for all x, but it increases faster when x > 2 than it does when x < 2. 9.2.2.2 Represent and solve problems in various contexts using exponential functions, such as investment growth, depreciation and population growth. 9.2.4.2 Represent relationships in various contexts using equations involving exponential functions; solve these equations graphically or numerically. Know how to use calculators, graphing utilities or other technology to solve these equations.
1.2 Requesting a Reward, Representing Exponential Functions
8.1.1.5 Express approximations of very large and very small numbers using scientific notation; understand how calculators display numbers in scientific notation. Multiply and divide numbers expressed in scientific notation, express the answer in scientific notation, using the correct number of significant digits when physical measurements are involved. For example: (4.2 × 104) × (8.25 × 103) = 3.465 × 10⁸, but if these numbers represent physical measurements, the answer should be expressed as 3.5 × 10⁸ because the first factor, 4.2 × 10⁴, only has two significant digits.
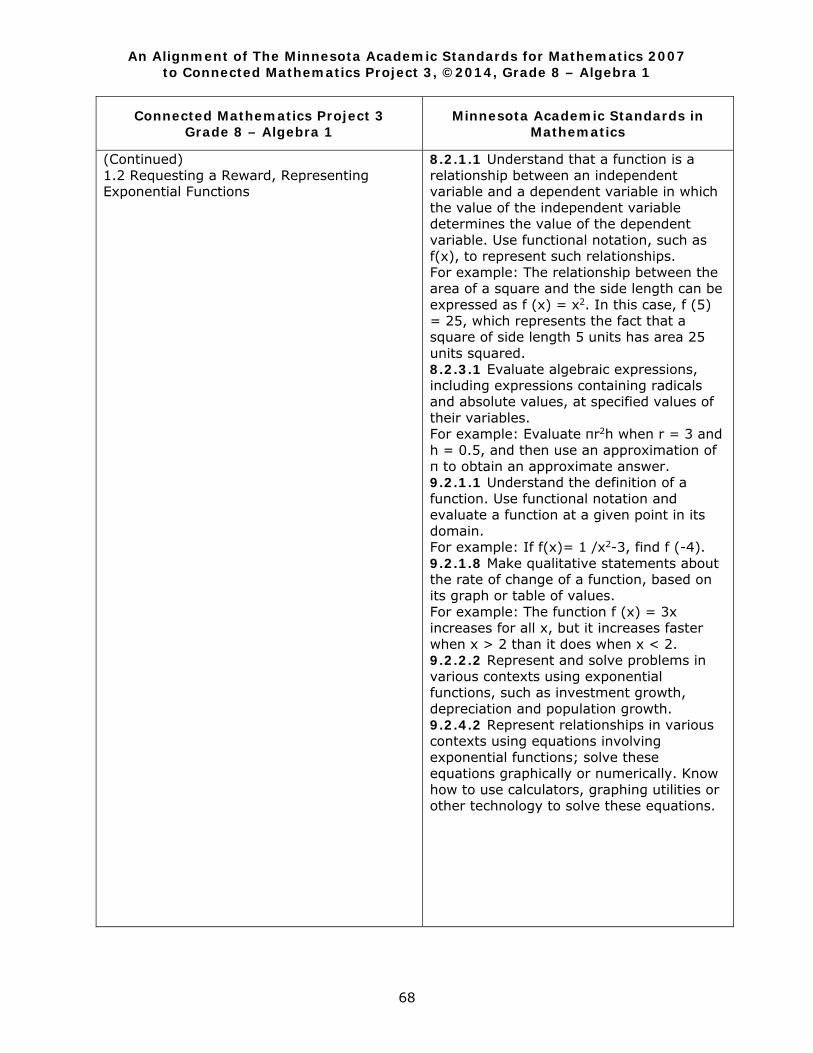
An Alignment of The Minnesota Academic Standards for Mathematics 2007 to Connected Mathematics Project 3, ©2014, Grade 8 – Algebra 1
68
Connected Mathematics Project 3 Grade 8 – Algebra 1
Minnesota Academic Standards in Mathematics
(Continued) 1.2 Requesting a Reward, Representing Exponential Functions
8.2.1.1 Understand that a function is a relationship between an independent variable and a dependent variable in which the value of the independent variable determines the value of the dependent variable. Use functional notation, such as f(x), to represent such relationships. For example: The relationship between the area of a square and the side length can be expressed as f (x) = x2. In this case, f (5) = 25, which represents the fact that a square of side length 5 units has area 25 units squared. 8.2.3.1 Evaluate algebraic expressions, including expressions containing radicals and absolute values, at specified values of their variables. For example: Evaluate πr2h when r = 3 and h = 0.5, and then use an approximation of π to obtain an approximate answer. 9.2.1.1 Understand the definition of a function. Use functional notation and evaluate a function at a given point in its domain. For example: If f(x)= 1 /x2-3, find f (-4). 9.2.1.8 Make qualitative statements about the rate of change of a function, based on its graph or table of values. For example: The function f (x) = 3x increases for all x, but it increases faster when x > 2 than it does when x < 2. 9.2.2.2 Represent and solve problems in various contexts using exponential functions, such as investment growth, depreciation and population growth. 9.2.4.2 Represent relationships in various contexts using equations involving exponential functions; solve these equations graphically or numerically. Know how to use calculators, graphing utilities or other technology to solve these equations.
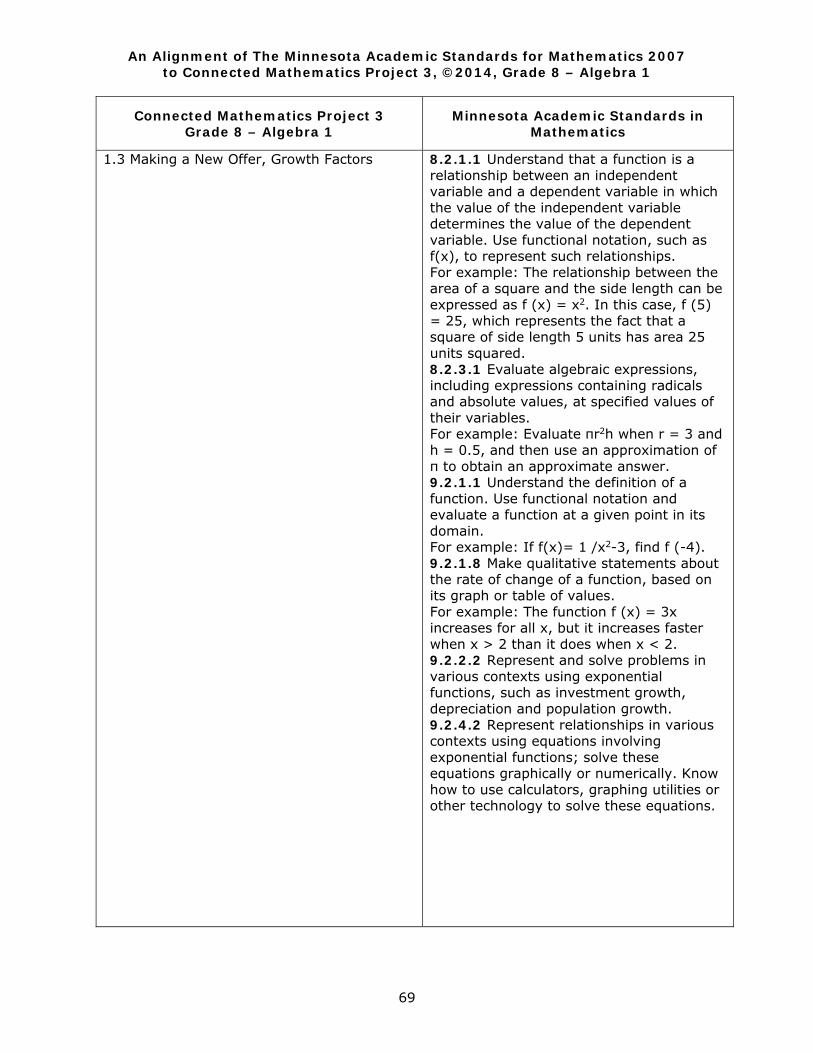
An Alignment of The Minnesota Academic Standards for Mathematics 2007 to Connected Mathematics Project 3, ©2014, Grade 8 – Algebra 1
69
Connected Mathematics Project 3 Grade 8 – Algebra 1
Minnesota Academic Standards in Mathematics
1.3 Making a New Offer, Growth Factors
8.2.1.1 Understand that a function is a relationship between an independent variable and a dependent variable in which the value of the independent variable determines the value of the dependent variable. Use functional notation, such as f(x), to represent such relationships. For example: The relationship between the area of a square and the side length can be expressed as f (x) = x2. In this case, f (5) = 25, which represents the fact that a square of side length 5 units has area 25 units squared. 8.2.3.1 Evaluate algebraic expressions, including expressions containing radicals and absolute values, at specified values of their variables. For example: Evaluate πr2h when r = 3 and h = 0.5, and then use an approximation of π to obtain an approximate answer. 9.2.1.1 Understand the definition of a function. Use functional notation and evaluate a function at a given point in its domain. For example: If f(x)= 1 /x2-3, find f (-4). 9.2.1.8 Make qualitative statements about the rate of change of a function, based on its graph or table of values. For example: The function f (x) = 3x increases for all x, but it increases faster when x > 2 than it does when x < 2. 9.2.2.2 Represent and solve problems in various contexts using exponential functions, such as investment growth, depreciation and population growth. 9.2.4.2 Represent relationships in various contexts using equations involving exponential functions; solve these equations graphically or numerically. Know how to use calculators, graphing utilities or other technology to solve these equations.
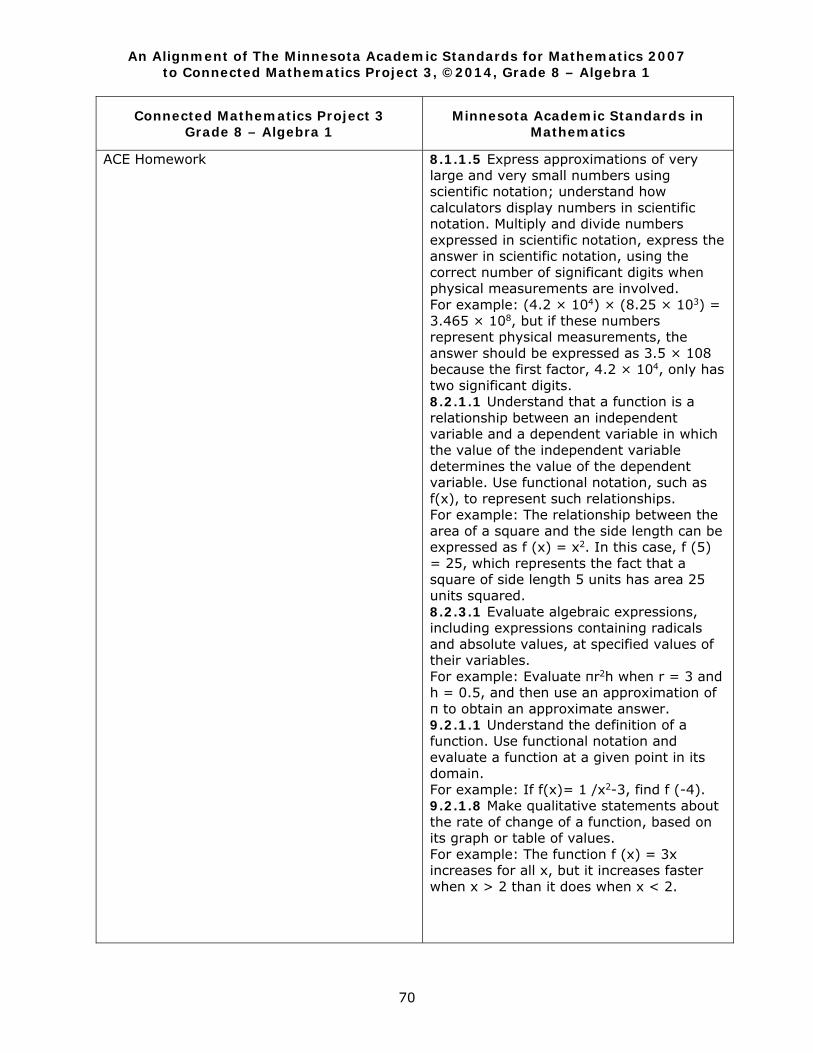
An Alignment of The Minnesota Academic Standards for Mathematics 2007 to Connected Mathematics Project 3, ©2014, Grade 8 – Algebra 1
70
Connected Mathematics Project 3 Grade 8 – Algebra 1
Minnesota Academic Standards in Mathematics
ACE Homework
8.1.1.5 Express approximations of very large and very small numbers using scientific notation; understand how calculators display numbers in scientific notation. Multiply and divide numbers expressed in scientific notation, express the answer in scientific notation, using the correct number of significant digits when physical measurements are involved. For example: (4.2 × 104) × (8.25 × 103) = 3.465 × 10⁸, but if these numbers represent physical measurements, the answer should be expressed as 3.5 × 10⁸ because the first factor, 4.2 × 10⁴, only has two significant digits. 8.2.1.1 Understand that a function is a relationship between an independent variable and a dependent variable in which the value of the independent variable determines the value of the dependent variable. Use functional notation, such as f(x), to represent such relationships. For example: The relationship between the area of a square and the side length can be expressed as f (x) = x2. In this case, f (5) = 25, which represents the fact that a square of side length 5 units has area 25 units squared. 8.2.3.1 Evaluate algebraic expressions, including expressions containing radicals and absolute values, at specified values of their variables. For example: Evaluate πr2h when r = 3 and h = 0.5, and then use an approximation of π to obtain an approximate answer. 9.2.1.1 Understand the definition of a function. Use functional notation and evaluate a function at a given point in its domain. For example: If f(x)= 1 /x2-3, find f (-4). 9.2.1.8 Make qualitative statements about the rate of change of a function, based on its graph or table of values. For example: The function f (x) = 3x increases for all x, but it increases faster when x > 2 than it does when x < 2.
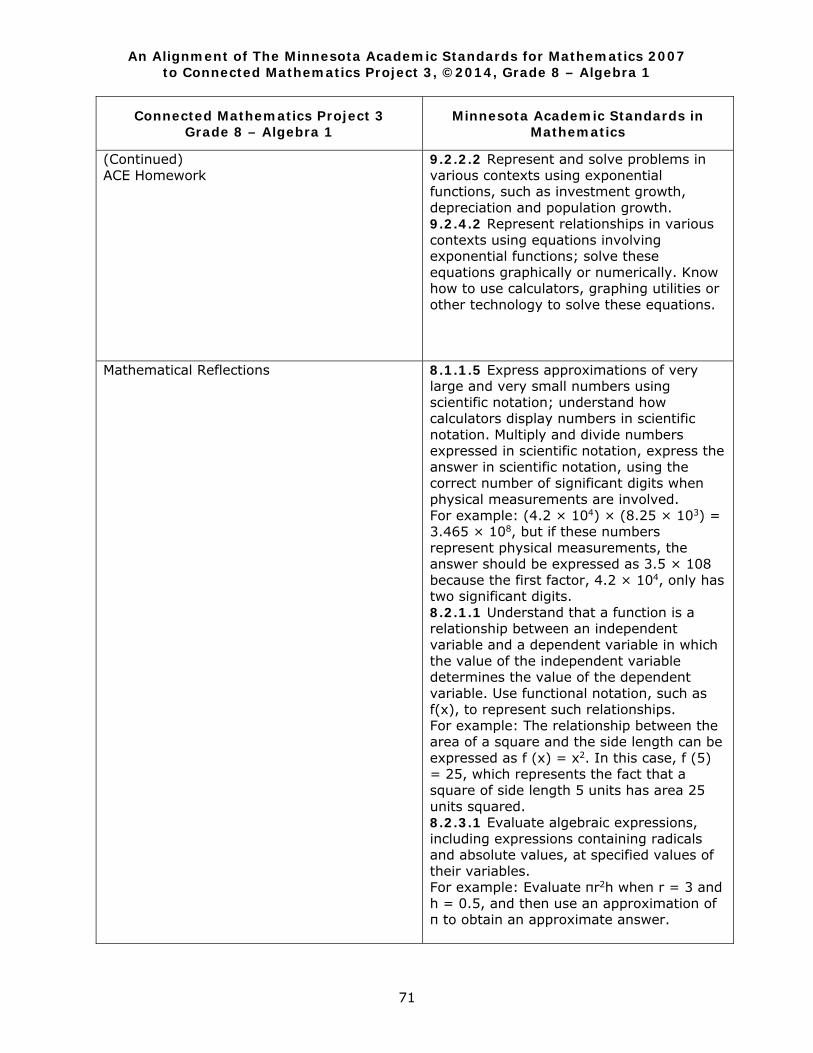
An Alignment of The Minnesota Academic Standards for Mathematics 2007 to Connected Mathematics Project 3, ©2014, Grade 8 – Algebra 1
71
Connected Mathematics Project 3 Grade 8 – Algebra 1
Minnesota Academic Standards in Mathematics
(Continued) ACE Homework
9.2.2.2 Represent and solve problems in various contexts using exponential functions, such as investment growth, depreciation and population growth. 9.2.4.2 Represent relationships in various contexts using equations involving exponential functions; solve these equations graphically or numerically. Know how to use calculators, graphing utilities or other technology to solve these equations.
Mathematical Reflections
8.1.1.5 Express approximations of very large and very small numbers using scientific notation; understand how calculators display numbers in scientific notation. Multiply and divide numbers expressed in scientific notation, express the answer in scientific notation, using the correct number of significant digits when physical measurements are involved. For example: (4.2 × 104) × (8.25 × 103) = 3.465 × 10⁸, but if these numbers represent physical measurements, the answer should be expressed as 3.5 × 10⁸ because the first factor, 4.2 × 10⁴, only has two significant digits. 8.2.1.1 Understand that a function is a relationship between an independent variable and a dependent variable in which the value of the independent variable determines the value of the dependent variable. Use functional notation, such as f(x), to represent such relationships. For example: The relationship between the area of a square and the side length can be expressed as f (x) = x2. In this case, f (5) = 25, which represents the fact that a square of side length 5 units has area 25 units squared. 8.2.3.1 Evaluate algebraic expressions, including expressions containing radicals and absolute values, at specified values of their variables. For example: Evaluate πr2h when r = 3 and h = 0.5, and then use an approximation of π to obtain an approximate answer.
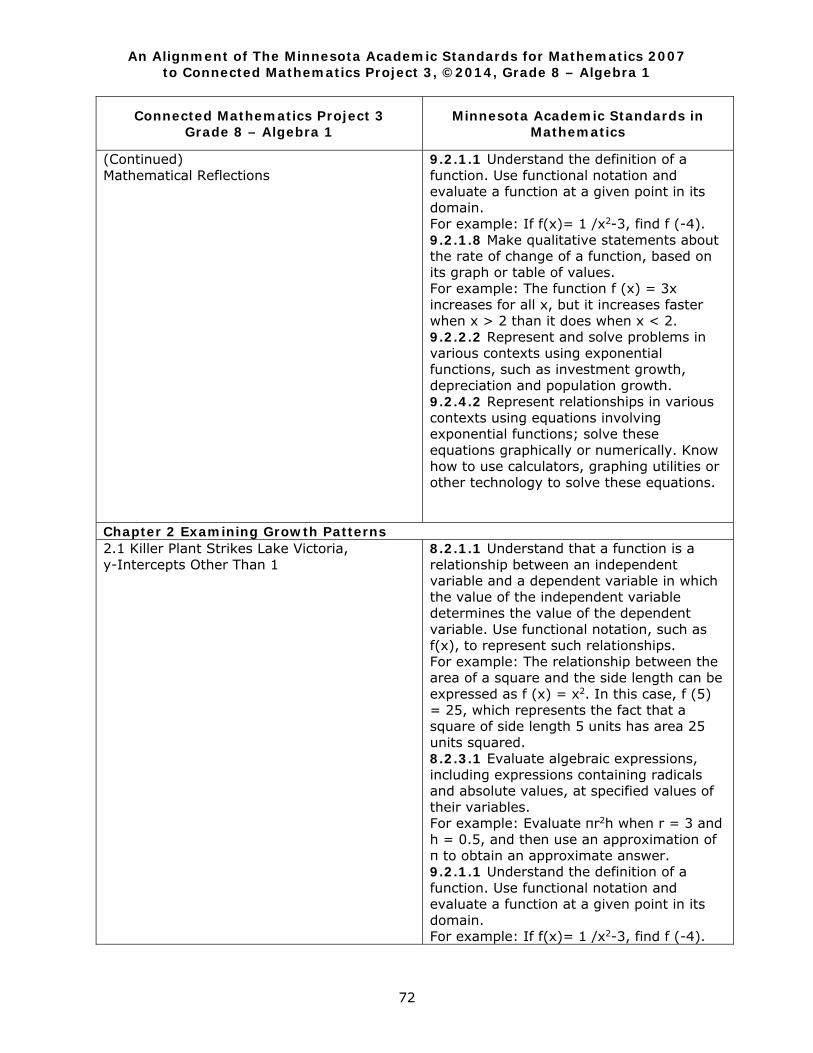
An Alignment of The Minnesota Academic Standards for Mathematics 2007 to Connected Mathematics Project 3, ©2014, Grade 8 – Algebra 1
72
Connected Mathematics Project 3 Grade 8 – Algebra 1
Minnesota Academic Standards in Mathematics
(Continued) Mathematical Reflections
9.2.1.1 Understand the definition of a function. Use functional notation and evaluate a function at a given point in its domain. For example: If f(x)= 1 /x2-3, find f (-4). 9.2.1.8 Make qualitative statements about the rate of change of a function, based on its graph or table of values. For example: The function f (x) = 3x increases for all x, but it increases faster when x > 2 than it does when x < 2. 9.2.2.2 Represent and solve problems in various contexts using exponential functions, such as investment growth, depreciation and population growth. 9.2.4.2 Represent relationships in various contexts using equations involving exponential functions; solve these equations graphically or numerically. Know how to use calculators, graphing utilities or other technology to solve these equations.
Chapter 2 Examining Growth Patterns 2.1 Killer Plant Strikes Lake Victoria, y-Intercepts Other Than 1
8.2.1.1 Understand that a function is a relationship between an independent variable and a dependent variable in which the value of the independent variable determines the value of the dependent variable. Use functional notation, such as f(x), to represent such relationships. For example: The relationship between the area of a square and the side length can be expressed as f (x) = x2. In this case, f (5) = 25, which represents the fact that a square of side length 5 units has area 25 units squared. 8.2.3.1 Evaluate algebraic expressions, including expressions containing radicals and absolute values, at specified values of their variables. For example: Evaluate πr2h when r = 3 and h = 0.5, and then use an approximation of π to obtain an approximate answer. 9.2.1.1 Understand the definition of a function. Use functional notation and evaluate a function at a given point in its domain. For example: If f(x)= 1 /x2-3, find f (-4).
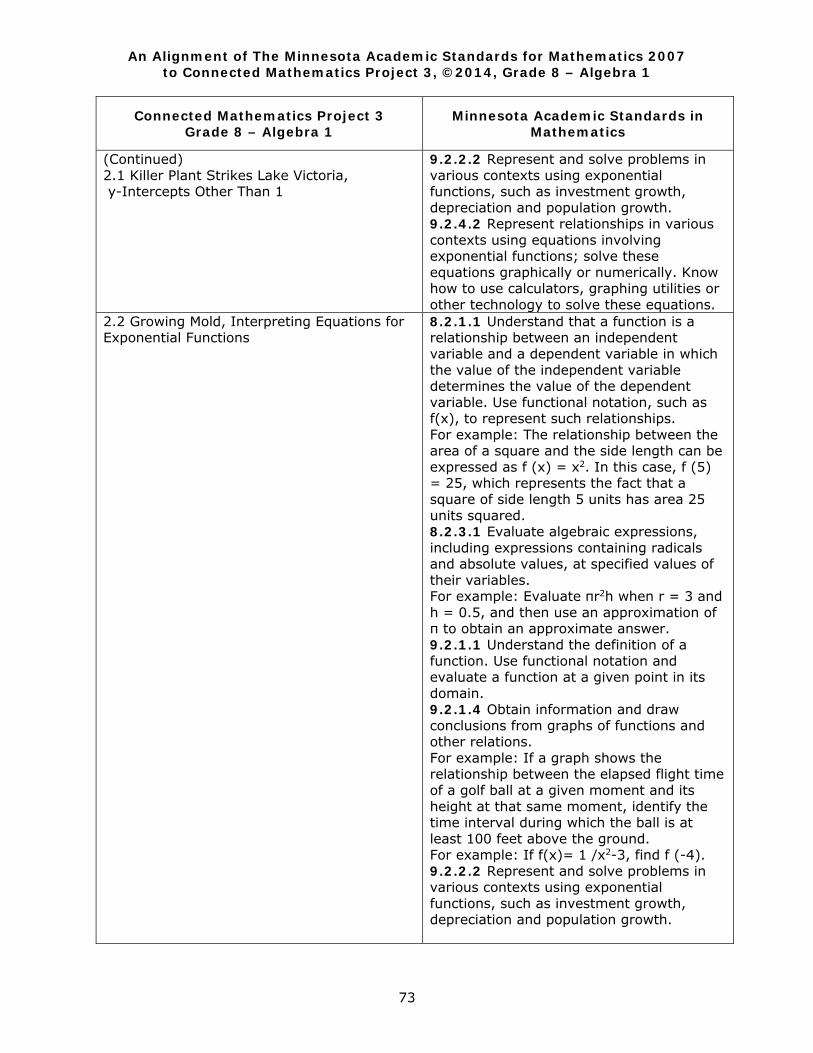
An Alignment of The Minnesota Academic Standards for Mathematics 2007 to Connected Mathematics Project 3, ©2014, Grade 8 – Algebra 1
73
Connected Mathematics Project 3 Grade 8 – Algebra 1
Minnesota Academic Standards in Mathematics
(Continued) 2.1 Killer Plant Strikes Lake Victoria, y-Intercepts Other Than 1
9.2.2.2 Represent and solve problems in various contexts using exponential functions, such as investment growth, depreciation and population growth. 9.2.4.2 Represent relationships in various contexts using equations involving exponential functions; solve these equations graphically or numerically. Know how to use calculators, graphing utilities or other technology to solve these equations.
2.2 Growing Mold, Interpreting Equations for Exponential Functions
8.2.1.1 Understand that a function is a relationship between an independent variable and a dependent variable in which the value of the independent variable determines the value of the dependent variable. Use functional notation, such as f(x), to represent such relationships. For example: The relationship between the area of a square and the side length can be expressed as f (x) = x2. In this case, f (5) = 25, which represents the fact that a square of side length 5 units has area 25 units squared. 8.2.3.1 Evaluate algebraic expressions, including expressions containing radicals and absolute values, at specified values of their variables. For example: Evaluate πr2h when r = 3 and h = 0.5, and then use an approximation of π to obtain an approximate answer. 9.2.1.1 Understand the definition of a function. Use functional notation and evaluate a function at a given point in its domain. 9.2.1.4 Obtain information and draw conclusions from graphs of functions and other relations. For example: If a graph shows the relationship between the elapsed flight time of a golf ball at a given moment and its height at that same moment, identify the time interval during which the ball is at least 100 feet above the ground. For example: If f(x)= 1 /x2-3, find f (-4). 9.2.2.2 Represent and solve problems in various contexts using exponential functions, such as investment growth, depreciation and population growth.
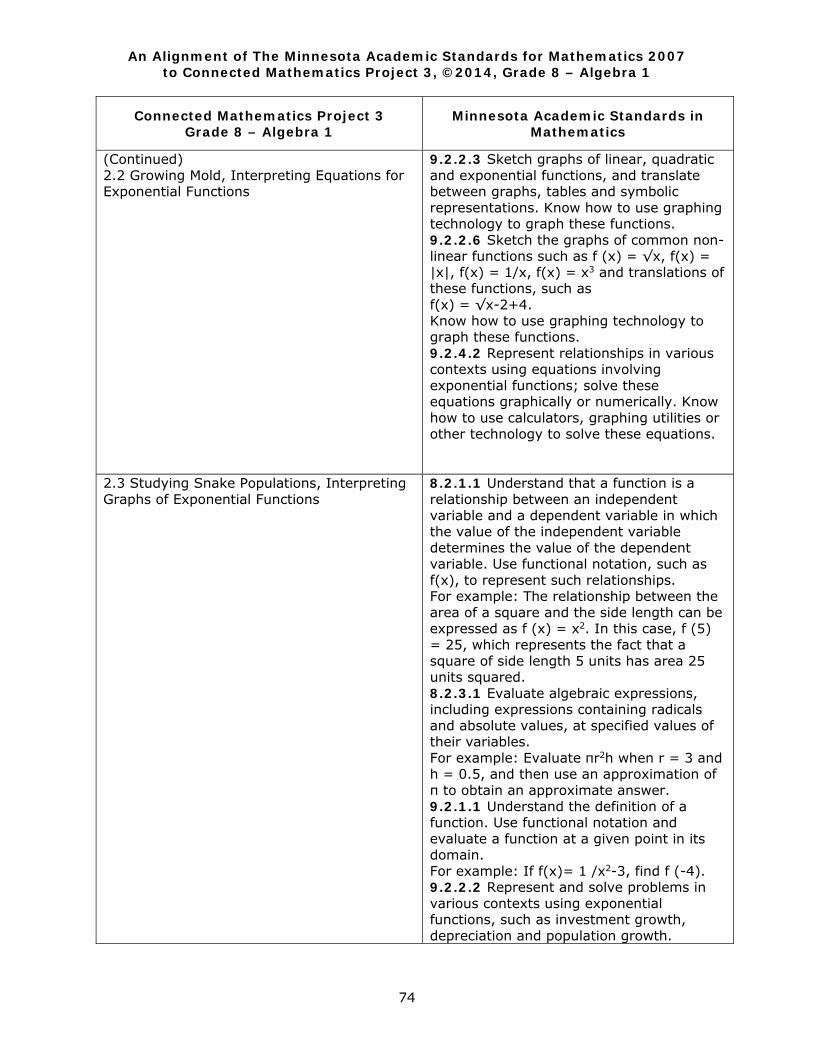
An Alignment of The Minnesota Academic Standards for Mathematics 2007 to Connected Mathematics Project 3, ©2014, Grade 8 – Algebra 1
74
Connected Mathematics Project 3 Grade 8 – Algebra 1
Minnesota Academic Standards in Mathematics
(Continued) 2.2 Growing Mold, Interpreting Equations for Exponential Functions
9.2.2.3 Sketch graphs of linear, quadratic and exponential functions, and translate between graphs, tables and symbolic representations. Know how to use graphing technology to graph these functions. 9.2.2.6 Sketch the graphs of common non-linear functions such as f (x) = √x, f(x) = |x|, f(x) = 1/x, f(x) = x3 and translations of these functions, such as f(x) = √x-2+4. Know how to use graphing technology to graph these functions. 9.2.4.2 Represent relationships in various contexts using equations involving exponential functions; solve these equations graphically or numerically. Know how to use calculators, graphing utilities or other technology to solve these equations.
2.3 Studying Snake Populations, Interpreting Graphs of Exponential Functions
8.2.1.1 Understand that a function is a relationship between an independent variable and a dependent variable in which the value of the independent variable determines the value of the dependent variable. Use functional notation, such as f(x), to represent such relationships. For example: The relationship between the area of a square and the side length can be expressed as f (x) = x2. In this case, f (5) = 25, which represents the fact that a square of side length 5 units has area 25 units squared. 8.2.3.1 Evaluate algebraic expressions, including expressions containing radicals and absolute values, at specified values of their variables. For example: Evaluate πr2h when r = 3 and h = 0.5, and then use an approximation of π to obtain an approximate answer. 9.2.1.1 Understand the definition of a function. Use functional notation and evaluate a function at a given point in its domain. For example: If f(x)= 1 /x2-3, find f (-4). 9.2.2.2 Represent and solve problems in various contexts using exponential functions, such as investment growth, depreciation and population growth.
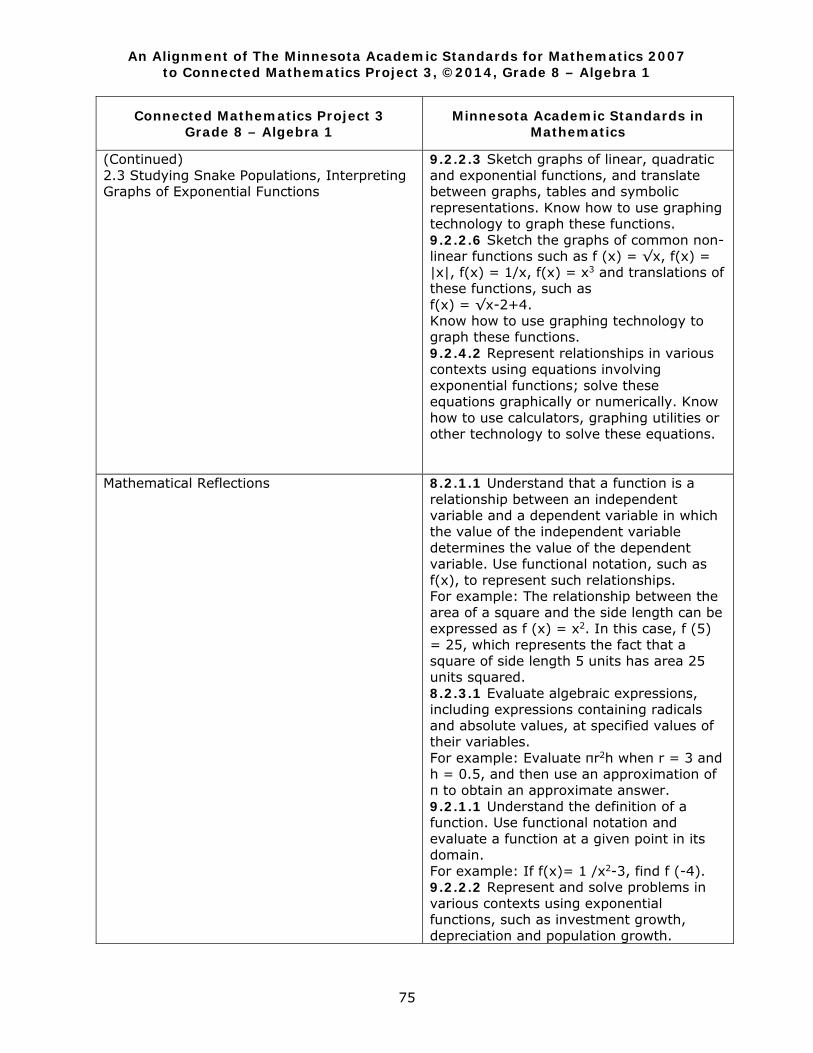
An Alignment of The Minnesota Academic Standards for Mathematics 2007 to Connected Mathematics Project 3, ©2014, Grade 8 – Algebra 1
75
Connected Mathematics Project 3 Grade 8 – Algebra 1
Minnesota Academic Standards in Mathematics
(Continued) 2.3 Studying Snake Populations, Interpreting Graphs of Exponential Functions
9.2.2.3 Sketch graphs of linear, quadratic and exponential functions, and translate between graphs, tables and symbolic representations. Know how to use graphing technology to graph these functions. 9.2.2.6 Sketch the graphs of common non-linear functions such as f (x) = √x, f(x) = |x|, f(x) = 1/x, f(x) = x3 and translations of these functions, such as f(x) = √x-2+4. Know how to use graphing technology to graph these functions. 9.2.4.2 Represent relationships in various contexts using equations involving exponential functions; solve these equations graphically or numerically. Know how to use calculators, graphing utilities or other technology to solve these equations.
Mathematical Reflections
8.2.1.1 Understand that a function is a relationship between an independent variable and a dependent variable in which the value of the independent variable determines the value of the dependent variable. Use functional notation, such as f(x), to represent such relationships. For example: The relationship between the area of a square and the side length can be expressed as f (x) = x2. In this case, f (5) = 25, which represents the fact that a square of side length 5 units has area 25 units squared. 8.2.3.1 Evaluate algebraic expressions, including expressions containing radicals and absolute values, at specified values of their variables. For example: Evaluate πr2h when r = 3 and h = 0.5, and then use an approximation of π to obtain an approximate answer. 9.2.1.1 Understand the definition of a function. Use functional notation and evaluate a function at a given point in its domain. For example: If f(x)= 1 /x2-3, find f (-4). 9.2.2.2 Represent and solve problems in various contexts using exponential functions, such as investment growth, depreciation and population growth.
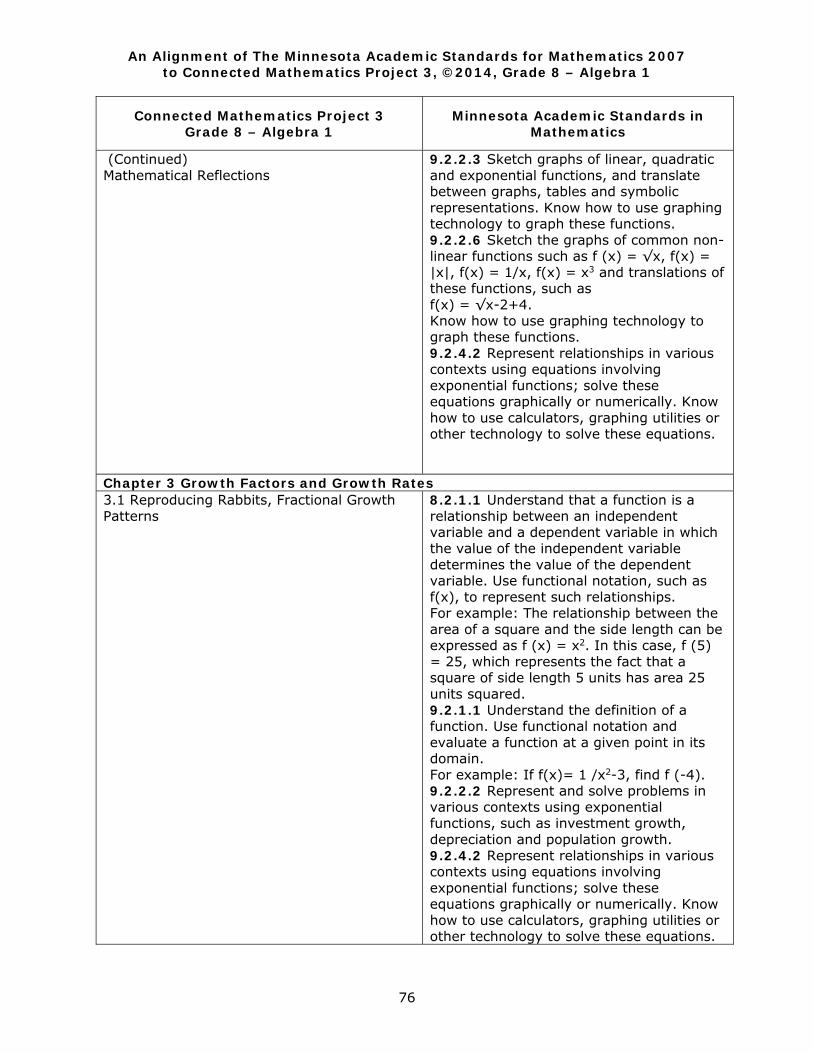
An Alignment of The Minnesota Academic Standards for Mathematics 2007 to Connected Mathematics Project 3, ©2014, Grade 8 – Algebra 1
76
Connected Mathematics Project 3 Grade 8 – Algebra 1
Minnesota Academic Standards in Mathematics
(Continued) Mathematical Reflections
9.2.2.3 Sketch graphs of linear, quadratic and exponential functions, and translate between graphs, tables and symbolic representations. Know how to use graphing technology to graph these functions. 9.2.2.6 Sketch the graphs of common non-linear functions such as f (x) = √x, f(x) = |x|, f(x) = 1/x, f(x) = x3 and translations of these functions, such as f(x) = √x-2+4. Know how to use graphing technology to graph these functions. 9.2.4.2 Represent relationships in various contexts using equations involving exponential functions; solve these equations graphically or numerically. Know how to use calculators, graphing utilities or other technology to solve these equations.
Chapter 3 Growth Factors and Growth Rates 3.1 Reproducing Rabbits, Fractional Growth Patterns
8.2.1.1 Understand that a function is a relationship between an independent variable and a dependent variable in which the value of the independent variable determines the value of the dependent variable. Use functional notation, such as f(x), to represent such relationships. For example: The relationship between the area of a square and the side length can be expressed as f (x) = x2. In this case, f (5) = 25, which represents the fact that a square of side length 5 units has area 25 units squared. 9.2.1.1 Understand the definition of a function. Use functional notation and evaluate a function at a given point in its domain. For example: If f(x)= 1 /x2-3, find f (-4). 9.2.2.2 Represent and solve problems in various contexts using exponential functions, such as investment growth, depreciation and population growth. 9.2.4.2 Represent relationships in various contexts using equations involving exponential functions; solve these equations graphically or numerically. Know how to use calculators, graphing utilities or other technology to solve these equations.
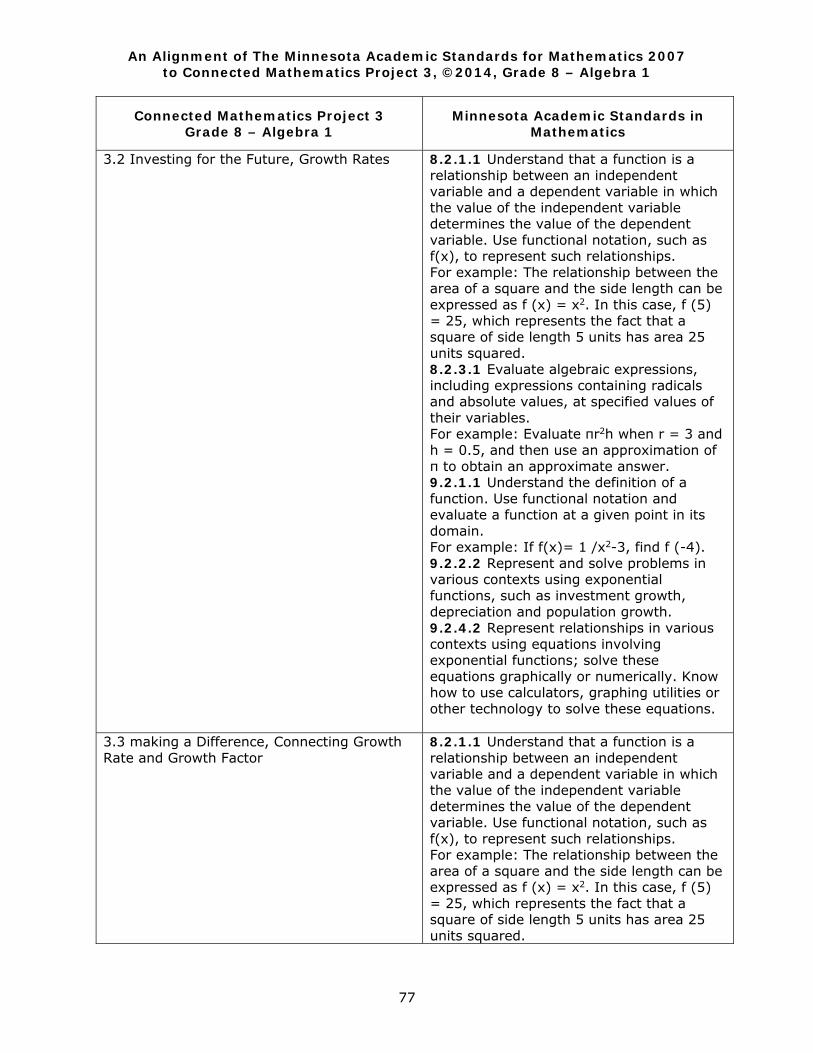
An Alignment of The Minnesota Academic Standards for Mathematics 2007 to Connected Mathematics Project 3, ©2014, Grade 8 – Algebra 1
77
Connected Mathematics Project 3 Grade 8 – Algebra 1
Minnesota Academic Standards in Mathematics
3.2 Investing for the Future, Growth Rates
8.2.1.1 Understand that a function is a relationship between an independent variable and a dependent variable in which the value of the independent variable determines the value of the dependent variable. Use functional notation, such as f(x), to represent such relationships. For example: The relationship between the area of a square and the side length can be expressed as f (x) = x2. In this case, f (5) = 25, which represents the fact that a square of side length 5 units has area 25 units squared. 8.2.3.1 Evaluate algebraic expressions, including expressions containing radicals and absolute values, at specified values of their variables. For example: Evaluate πr2h when r = 3 and h = 0.5, and then use an approximation of π to obtain an approximate answer. 9.2.1.1 Understand the definition of a function. Use functional notation and evaluate a function at a given point in its domain. For example: If f(x)= 1 /x2-3, find f (-4). 9.2.2.2 Represent and solve problems in various contexts using exponential functions, such as investment growth, depreciation and population growth. 9.2.4.2 Represent relationships in various contexts using equations involving exponential functions; solve these equations graphically or numerically. Know how to use calculators, graphing utilities or other technology to solve these equations.
3.3 making a Difference, Connecting Growth Rate and Growth Factor
8.2.1.1 Understand that a function is a relationship between an independent variable and a dependent variable in which the value of the independent variable determines the value of the dependent variable. Use functional notation, such as f(x), to represent such relationships. For example: The relationship between the area of a square and the side length can be expressed as f (x) = x2. In this case, f (5) = 25, which represents the fact that a square of side length 5 units has area 25 units squared.
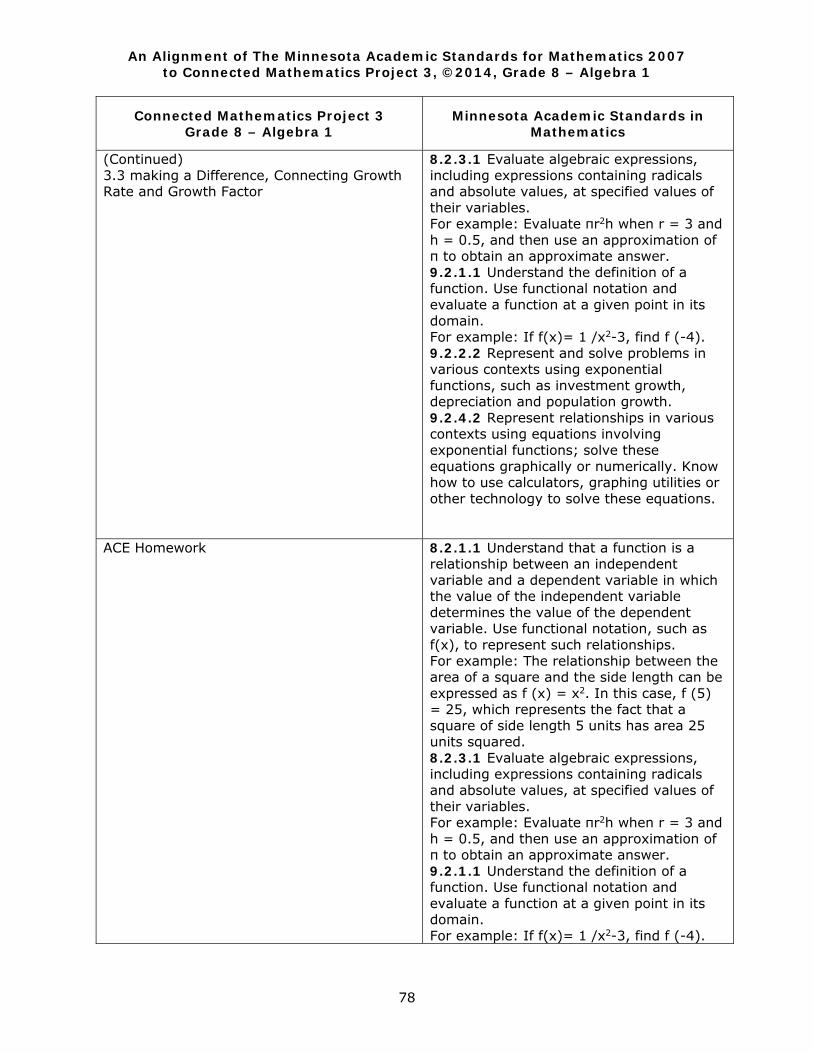
An Alignment of The Minnesota Academic Standards for Mathematics 2007 to Connected Mathematics Project 3, ©2014, Grade 8 – Algebra 1
78
Connected Mathematics Project 3 Grade 8 – Algebra 1
Minnesota Academic Standards in Mathematics
(Continued) 3.3 making a Difference, Connecting Growth Rate and Growth Factor
8.2.3.1 Evaluate algebraic expressions, including expressions containing radicals and absolute values, at specified values of their variables. For example: Evaluate πr2h when r = 3 and h = 0.5, and then use an approximation of π to obtain an approximate answer. 9.2.1.1 Understand the definition of a function. Use functional notation and evaluate a function at a given point in its domain. For example: If f(x)= 1 /x2-3, find f (-4). 9.2.2.2 Represent and solve problems in various contexts using exponential functions, such as investment growth, depreciation and population growth. 9.2.4.2 Represent relationships in various contexts using equations involving exponential functions; solve these equations graphically or numerically. Know how to use calculators, graphing utilities or other technology to solve these equations.
ACE Homework
8.2.1.1 Understand that a function is a relationship between an independent variable and a dependent variable in which the value of the independent variable determines the value of the dependent variable. Use functional notation, such as f(x), to represent such relationships. For example: The relationship between the area of a square and the side length can be expressed as f (x) = x2. In this case, f (5) = 25, which represents the fact that a square of side length 5 units has area 25 units squared. 8.2.3.1 Evaluate algebraic expressions, including expressions containing radicals and absolute values, at specified values of their variables. For example: Evaluate πr2h when r = 3 and h = 0.5, and then use an approximation of π to obtain an approximate answer. 9.2.1.1 Understand the definition of a function. Use functional notation and evaluate a function at a given point in its domain. For example: If f(x)= 1 /x2-3, find f (-4).
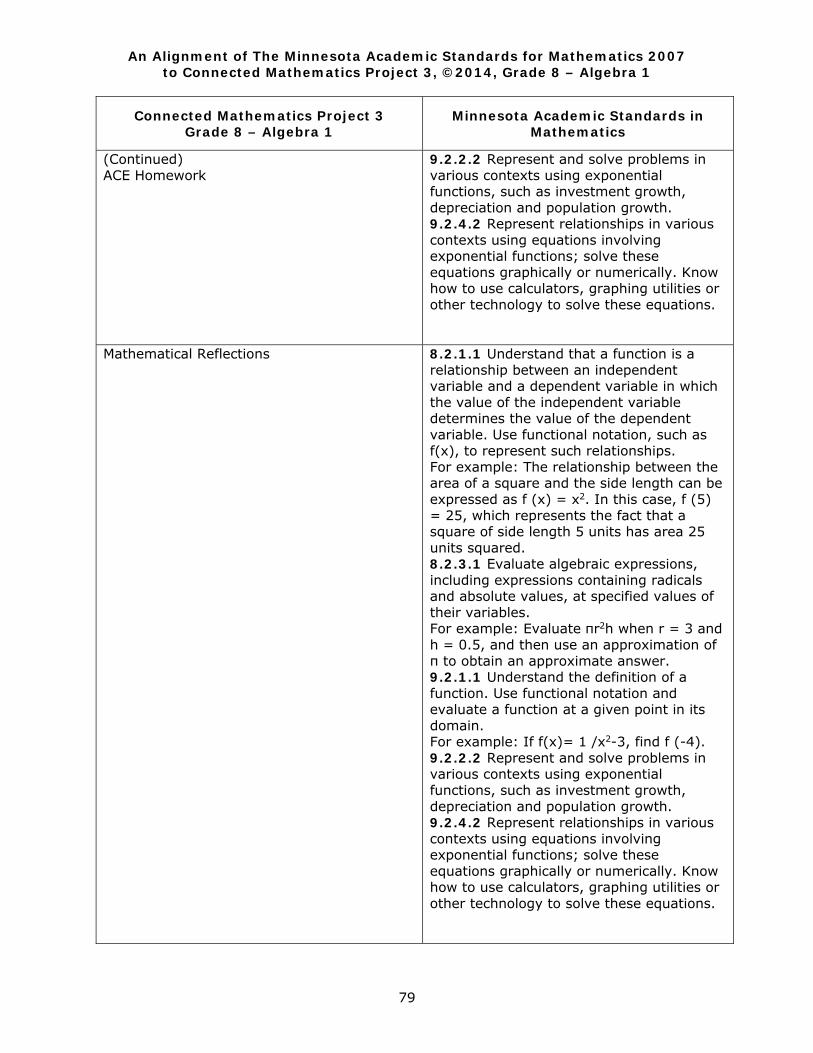
An Alignment of The Minnesota Academic Standards for Mathematics 2007 to Connected Mathematics Project 3, ©2014, Grade 8 – Algebra 1
79
Connected Mathematics Project 3 Grade 8 – Algebra 1
Minnesota Academic Standards in Mathematics
(Continued) ACE Homework
9.2.2.2 Represent and solve problems in various contexts using exponential functions, such as investment growth, depreciation and population growth. 9.2.4.2 Represent relationships in various contexts using equations involving exponential functions; solve these equations graphically or numerically. Know how to use calculators, graphing utilities or other technology to solve these equations.
Mathematical Reflections
8.2.1.1 Understand that a function is a relationship between an independent variable and a dependent variable in which the value of the independent variable determines the value of the dependent variable. Use functional notation, such as f(x), to represent such relationships. For example: The relationship between the area of a square and the side length can be expressed as f (x) = x2. In this case, f (5) = 25, which represents the fact that a square of side length 5 units has area 25 units squared. 8.2.3.1 Evaluate algebraic expressions, including expressions containing radicals and absolute values, at specified values of their variables. For example: Evaluate πr2h when r = 3 and h = 0.5, and then use an approximation of π to obtain an approximate answer. 9.2.1.1 Understand the definition of a function. Use functional notation and evaluate a function at a given point in its domain. For example: If f(x)= 1 /x2-3, find f (-4). 9.2.2.2 Represent and solve problems in various contexts using exponential functions, such as investment growth, depreciation and population growth. 9.2.4.2 Represent relationships in various contexts using equations involving exponential functions; solve these equations graphically or numerically. Know how to use calculators, graphing utilities or other technology to solve these equations.
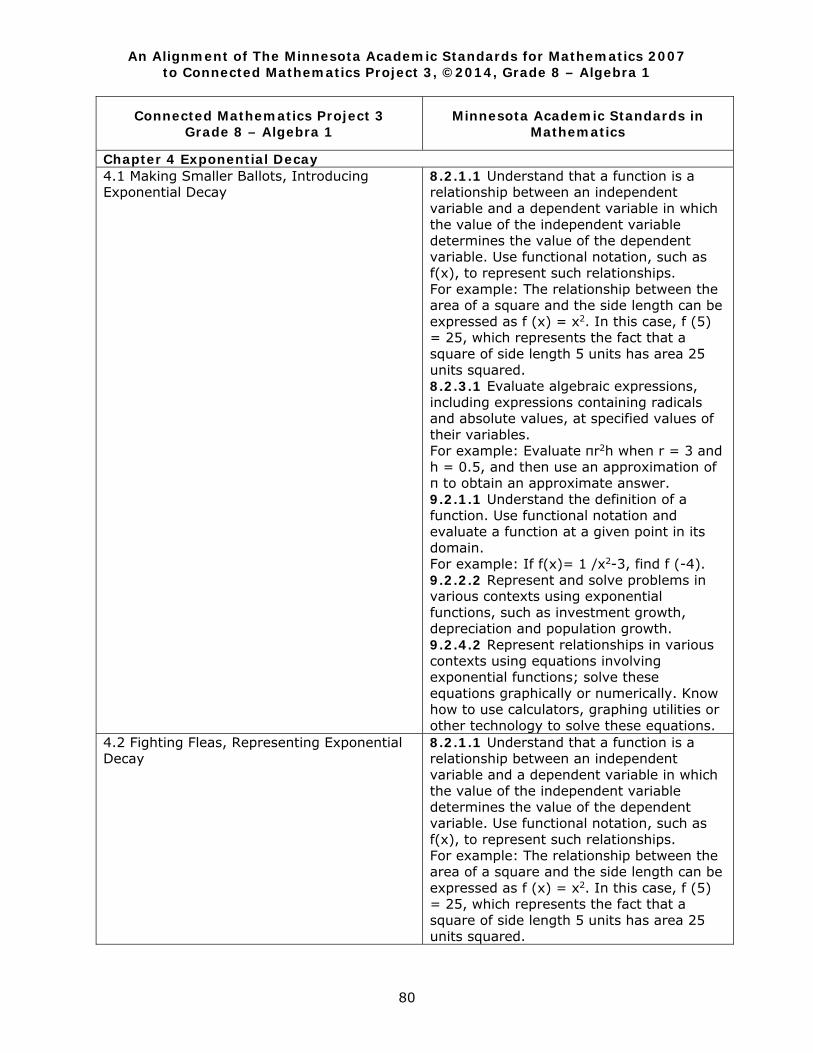
An Alignment of The Minnesota Academic Standards for Mathematics 2007 to Connected Mathematics Project 3, ©2014, Grade 8 – Algebra 1
80
Connected Mathematics Project 3 Grade 8 – Algebra 1
Minnesota Academic Standards in Mathematics
Chapter 4 Exponential Decay 4.1 Making Smaller Ballots, Introducing Exponential Decay
8.2.1.1 Understand that a function is a relationship between an independent variable and a dependent variable in which the value of the independent variable determines the value of the dependent variable. Use functional notation, such as f(x), to represent such relationships. For example: The relationship between the area of a square and the side length can be expressed as f (x) = x2. In this case, f (5) = 25, which represents the fact that a square of side length 5 units has area 25 units squared. 8.2.3.1 Evaluate algebraic expressions, including expressions containing radicals and absolute values, at specified values of their variables. For example: Evaluate πr2h when r = 3 and h = 0.5, and then use an approximation of π to obtain an approximate answer. 9.2.1.1 Understand the definition of a function. Use functional notation and evaluate a function at a given point in its domain. For example: If f(x)= 1 /x2-3, find f (-4). 9.2.2.2 Represent and solve problems in various contexts using exponential functions, such as investment growth, depreciation and population growth. 9.2.4.2 Represent relationships in various contexts using equations involving exponential functions; solve these equations graphically or numerically. Know how to use calculators, graphing utilities or other technology to solve these equations.
4.2 Fighting Fleas, Representing Exponential Decay
8.2.1.1 Understand that a function is a relationship between an independent variable and a dependent variable in which the value of the independent variable determines the value of the dependent variable. Use functional notation, such as f(x), to represent such relationships. For example: The relationship between the area of a square and the side length can be expressed as f (x) = x2. In this case, f (5) = 25, which represents the fact that a square of side length 5 units has area 25 units squared.
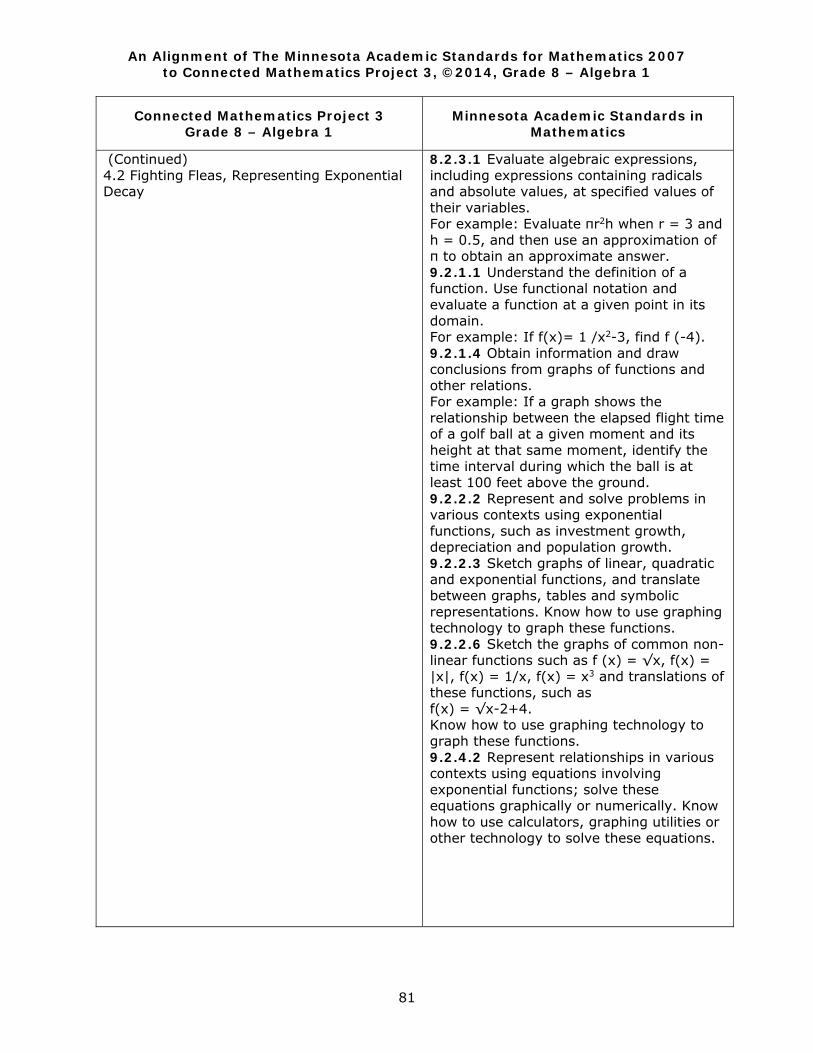
An Alignment of The Minnesota Academic Standards for Mathematics 2007 to Connected Mathematics Project 3, ©2014, Grade 8 – Algebra 1
81
Connected Mathematics Project 3 Grade 8 – Algebra 1
Minnesota Academic Standards in Mathematics
(Continued) 4.2 Fighting Fleas, Representing Exponential Decay
8.2.3.1 Evaluate algebraic expressions, including expressions containing radicals and absolute values, at specified values of their variables. For example: Evaluate πr2h when r = 3 and h = 0.5, and then use an approximation of π to obtain an approximate answer. 9.2.1.1 Understand the definition of a function. Use functional notation and evaluate a function at a given point in its domain. For example: If f(x)= 1 /x2-3, find f (-4). 9.2.1.4 Obtain information and draw conclusions from graphs of functions and other relations. For example: If a graph shows the relationship between the elapsed flight time of a golf ball at a given moment and its height at that same moment, identify the time interval during which the ball is at least 100 feet above the ground. 9.2.2.2 Represent and solve problems in various contexts using exponential functions, such as investment growth, depreciation and population growth. 9.2.2.3 Sketch graphs of linear, quadratic and exponential functions, and translate between graphs, tables and symbolic representations. Know how to use graphing technology to graph these functions. 9.2.2.6 Sketch the graphs of common non-linear functions such as f (x) = √x, f(x) = |x|, f(x) = 1/x, f(x) = x3 and translations of these functions, such as f(x) = √x-2+4. Know how to use graphing technology to graph these functions. 9.2.4.2 Represent relationships in various contexts using equations involving exponential functions; solve these equations graphically or numerically. Know how to use calculators, graphing utilities or other technology to solve these equations.
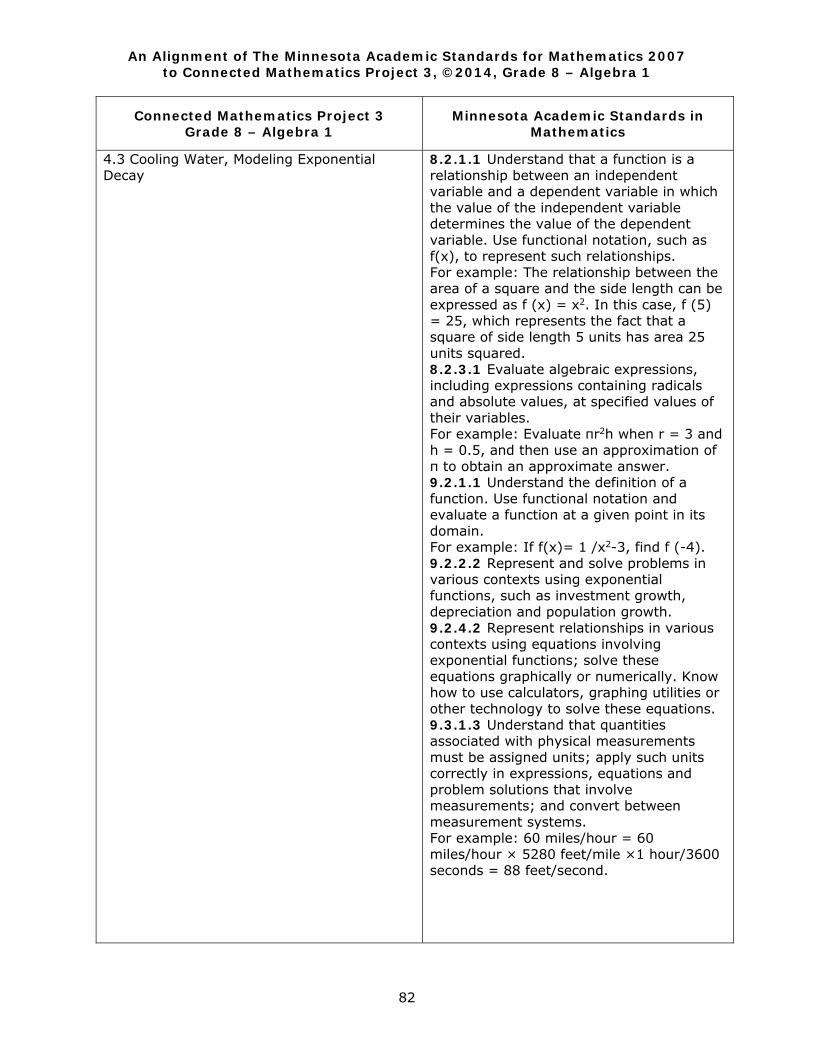
An Alignment of The Minnesota Academic Standards for Mathematics 2007 to Connected Mathematics Project 3, ©2014, Grade 8 – Algebra 1
82
Connected Mathematics Project 3 Grade 8 – Algebra 1
Minnesota Academic Standards in Mathematics
4.3 Cooling Water, Modeling Exponential Decay
8.2.1.1 Understand that a function is a relationship between an independent variable and a dependent variable in which the value of the independent variable determines the value of the dependent variable. Use functional notation, such as f(x), to represent such relationships. For example: The relationship between the area of a square and the side length can be expressed as f (x) = x2. In this case, f (5) = 25, which represents the fact that a square of side length 5 units has area 25 units squared. 8.2.3.1 Evaluate algebraic expressions, including expressions containing radicals and absolute values, at specified values of their variables. For example: Evaluate πr2h when r = 3 and h = 0.5, and then use an approximation of π to obtain an approximate answer. 9.2.1.1 Understand the definition of a function. Use functional notation and evaluate a function at a given point in its domain. For example: If f(x)= 1 /x2-3, find f (-4). 9.2.2.2 Represent and solve problems in various contexts using exponential functions, such as investment growth, depreciation and population growth. 9.2.4.2 Represent relationships in various contexts using equations involving exponential functions; solve these equations graphically or numerically. Know how to use calculators, graphing utilities or other technology to solve these equations. 9.3.1.3 Understand that quantities associated with physical measurements must be assigned units; apply such units correctly in expressions, equations and problem solutions that involve measurements; and convert between measurement systems. For example: 60 miles/hour = 60 miles/hour × 5280 feet/mile ×1 hour/3600 seconds = 88 feet/second.
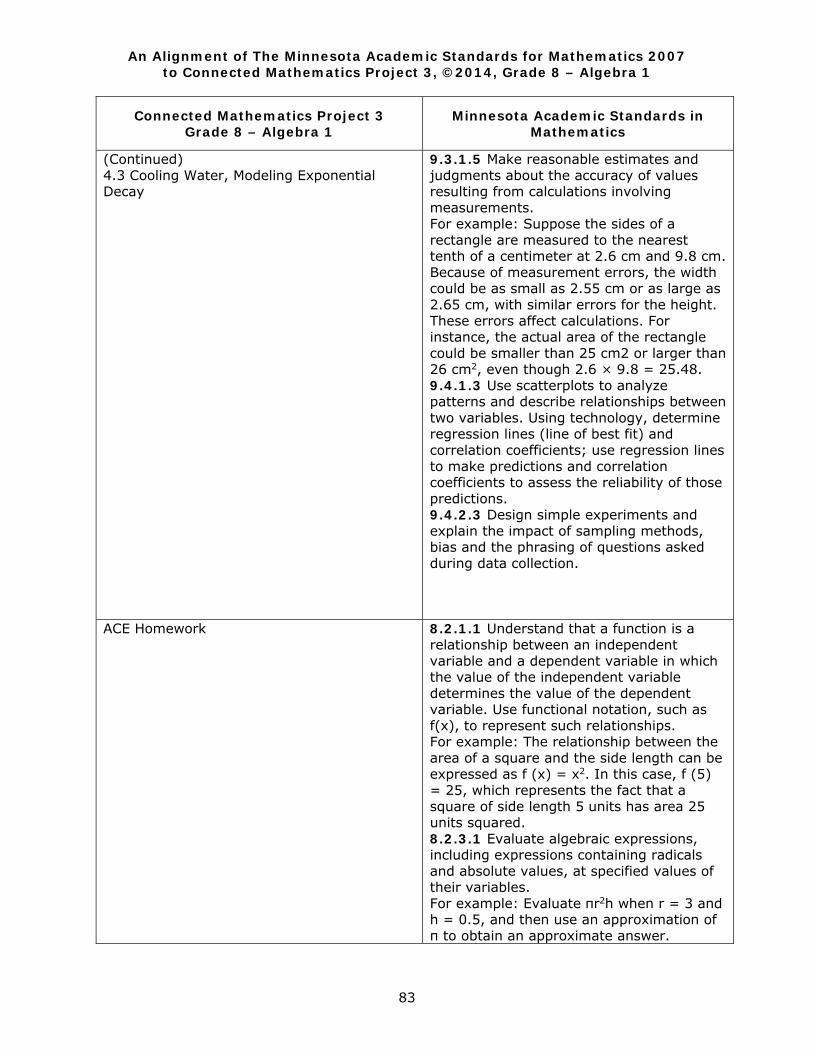
An Alignment of The Minnesota Academic Standards for Mathematics 2007 to Connected Mathematics Project 3, ©2014, Grade 8 – Algebra 1
83
Connected Mathematics Project 3 Grade 8 – Algebra 1
Minnesota Academic Standards in Mathematics
(Continued) 4.3 Cooling Water, Modeling Exponential Decay
9.3.1.5 Make reasonable estimates and judgments about the accuracy of values resulting from calculations involving measurements. For example: Suppose the sides of a rectangle are measured to the nearest tenth of a centimeter at 2.6 cm and 9.8 cm. Because of measurement errors, the width could be as small as 2.55 cm or as large as 2.65 cm, with similar errors for the height. These errors affect calculations. For instance, the actual area of the rectangle could be smaller than 25 cm2 or larger than 26 cm2, even though 2.6 × 9.8 = 25.48. 9.4.1.3 Use scatterplots to analyze patterns and describe relationships between two variables. Using technology, determine regression lines (line of best fit) and correlation coefficients; use regression lines to make predictions and correlation coefficients to assess the reliability of those predictions. 9.4.2.3 Design simple experiments and explain the impact of sampling methods, bias and the phrasing of questions asked during data collection.
ACE Homework
8.2.1.1 Understand that a function is a relationship between an independent variable and a dependent variable in which the value of the independent variable determines the value of the dependent variable. Use functional notation, such as f(x), to represent such relationships. For example: The relationship between the area of a square and the side length can be expressed as f (x) = x2. In this case, f (5) = 25, which represents the fact that a square of side length 5 units has area 25 units squared. 8.2.3.1 Evaluate algebraic expressions, including expressions containing radicals and absolute values, at specified values of their variables. For example: Evaluate πr2h when r = 3 and h = 0.5, and then use an approximation of π to obtain an approximate answer.
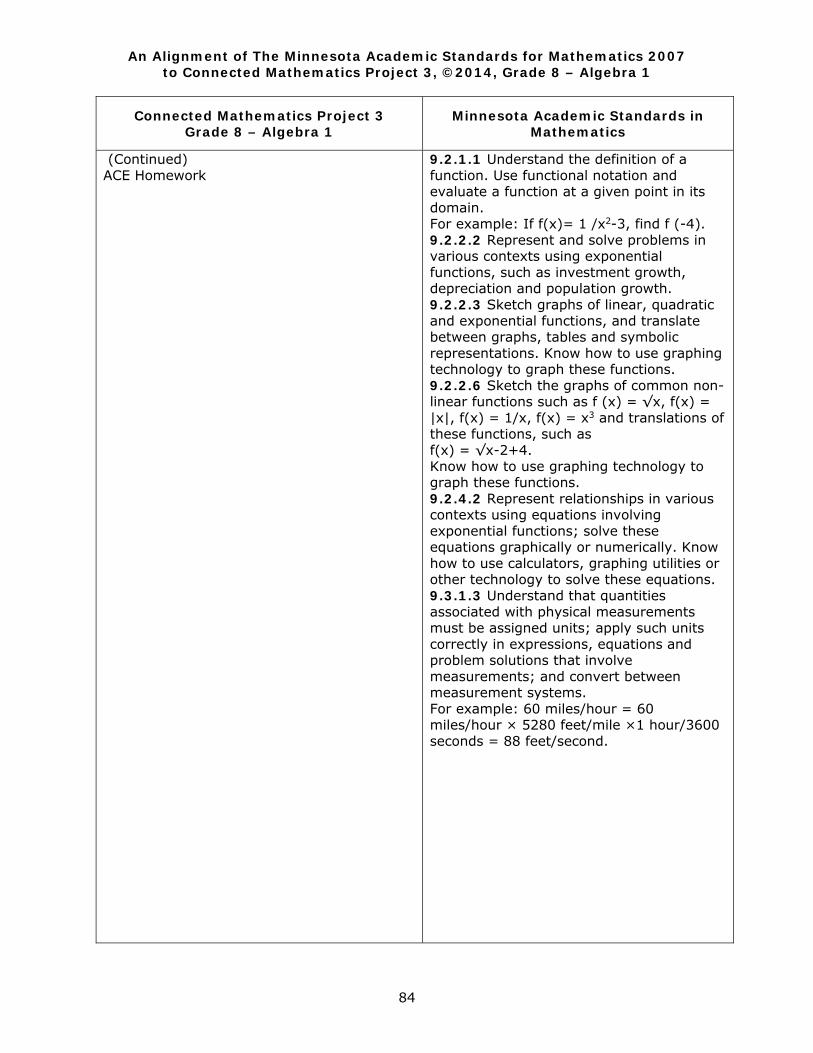
An Alignment of The Minnesota Academic Standards for Mathematics 2007 to Connected Mathematics Project 3, ©2014, Grade 8 – Algebra 1
84
Connected Mathematics Project 3 Grade 8 – Algebra 1
Minnesota Academic Standards in Mathematics
(Continued) ACE Homework
9.2.1.1 Understand the definition of a function. Use functional notation and evaluate a function at a given point in its domain. For example: If f(x)= 1 /x2-3, find f (-4). 9.2.2.2 Represent and solve problems in various contexts using exponential functions, such as investment growth, depreciation and population growth. 9.2.2.3 Sketch graphs of linear, quadratic and exponential functions, and translate between graphs, tables and symbolic representations. Know how to use graphing technology to graph these functions. 9.2.2.6 Sketch the graphs of common non-linear functions such as f (x) = √x, f(x) = |x|, f(x) = 1/x, f(x) = x3 and translations of these functions, such as f(x) = √x-2+4. Know how to use graphing technology to graph these functions. 9.2.4.2 Represent relationships in various contexts using equations involving exponential functions; solve these equations graphically or numerically. Know how to use calculators, graphing utilities or other technology to solve these equations. 9.3.1.3 Understand that quantities associated with physical measurements must be assigned units; apply such units correctly in expressions, equations and problem solutions that involve measurements; and convert between measurement systems. For example: 60 miles/hour = 60 miles/hour × 5280 feet/mile ×1 hour/3600 seconds = 88 feet/second.
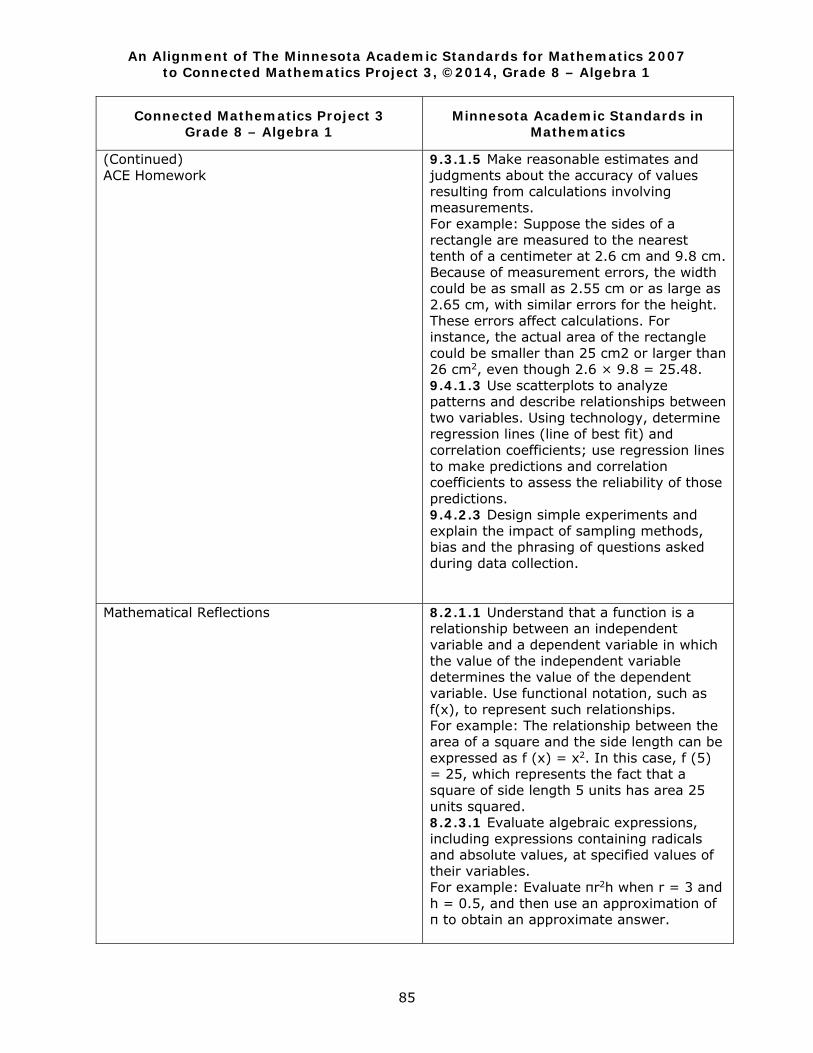
An Alignment of The Minnesota Academic Standards for Mathematics 2007 to Connected Mathematics Project 3, ©2014, Grade 8 – Algebra 1
85
Connected Mathematics Project 3 Grade 8 – Algebra 1
Minnesota Academic Standards in Mathematics
(Continued) ACE Homework
9.3.1.5 Make reasonable estimates and judgments about the accuracy of values resulting from calculations involving measurements. For example: Suppose the sides of a rectangle are measured to the nearest tenth of a centimeter at 2.6 cm and 9.8 cm. Because of measurement errors, the width could be as small as 2.55 cm or as large as 2.65 cm, with similar errors for the height. These errors affect calculations. For instance, the actual area of the rectangle could be smaller than 25 cm2 or larger than 26 cm2, even though 2.6 × 9.8 = 25.48. 9.4.1.3 Use scatterplots to analyze patterns and describe relationships between two variables. Using technology, determine regression lines (line of best fit) and correlation coefficients; use regression lines to make predictions and correlation coefficients to assess the reliability of those predictions. 9.4.2.3 Design simple experiments and explain the impact of sampling methods, bias and the phrasing of questions asked during data collection.
Mathematical Reflections
8.2.1.1 Understand that a function is a relationship between an independent variable and a dependent variable in which the value of the independent variable determines the value of the dependent variable. Use functional notation, such as f(x), to represent such relationships. For example: The relationship between the area of a square and the side length can be expressed as f (x) = x2. In this case, f (5) = 25, which represents the fact that a square of side length 5 units has area 25 units squared. 8.2.3.1 Evaluate algebraic expressions, including expressions containing radicals and absolute values, at specified values of their variables. For example: Evaluate πr2h when r = 3 and h = 0.5, and then use an approximation of π to obtain an approximate answer.
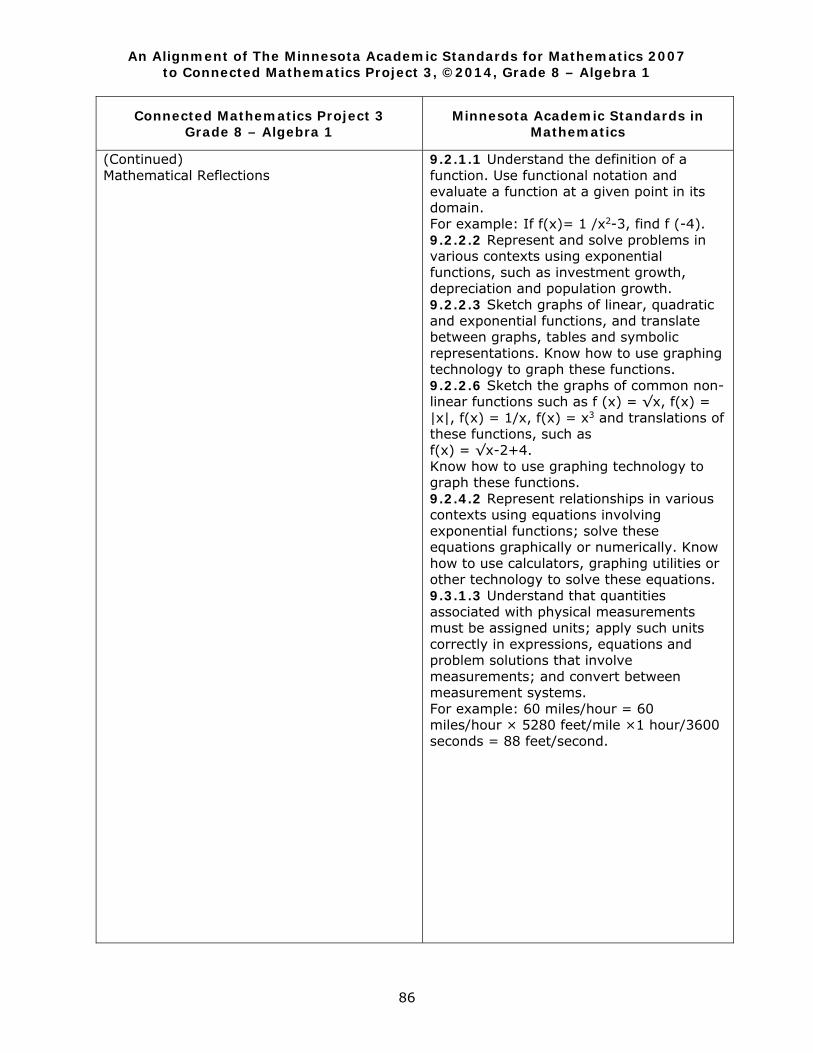
An Alignment of The Minnesota Academic Standards for Mathematics 2007 to Connected Mathematics Project 3, ©2014, Grade 8 – Algebra 1
86
Connected Mathematics Project 3 Grade 8 – Algebra 1
Minnesota Academic Standards in Mathematics
(Continued) Mathematical Reflections
9.2.1.1 Understand the definition of a function. Use functional notation and evaluate a function at a given point in its domain. For example: If f(x)= 1 /x2-3, find f (-4). 9.2.2.2 Represent and solve problems in various contexts using exponential functions, such as investment growth, depreciation and population growth. 9.2.2.3 Sketch graphs of linear, quadratic and exponential functions, and translate between graphs, tables and symbolic representations. Know how to use graphing technology to graph these functions. 9.2.2.6 Sketch the graphs of common non-linear functions such as f (x) = √x, f(x) = |x|, f(x) = 1/x, f(x) = x3 and translations of these functions, such as f(x) = √x-2+4. Know how to use graphing technology to graph these functions. 9.2.4.2 Represent relationships in various contexts using equations involving exponential functions; solve these equations graphically or numerically. Know how to use calculators, graphing utilities or other technology to solve these equations. 9.3.1.3 Understand that quantities associated with physical measurements must be assigned units; apply such units correctly in expressions, equations and problem solutions that involve measurements; and convert between measurement systems. For example: 60 miles/hour = 60 miles/hour × 5280 feet/mile ×1 hour/3600 seconds = 88 feet/second.
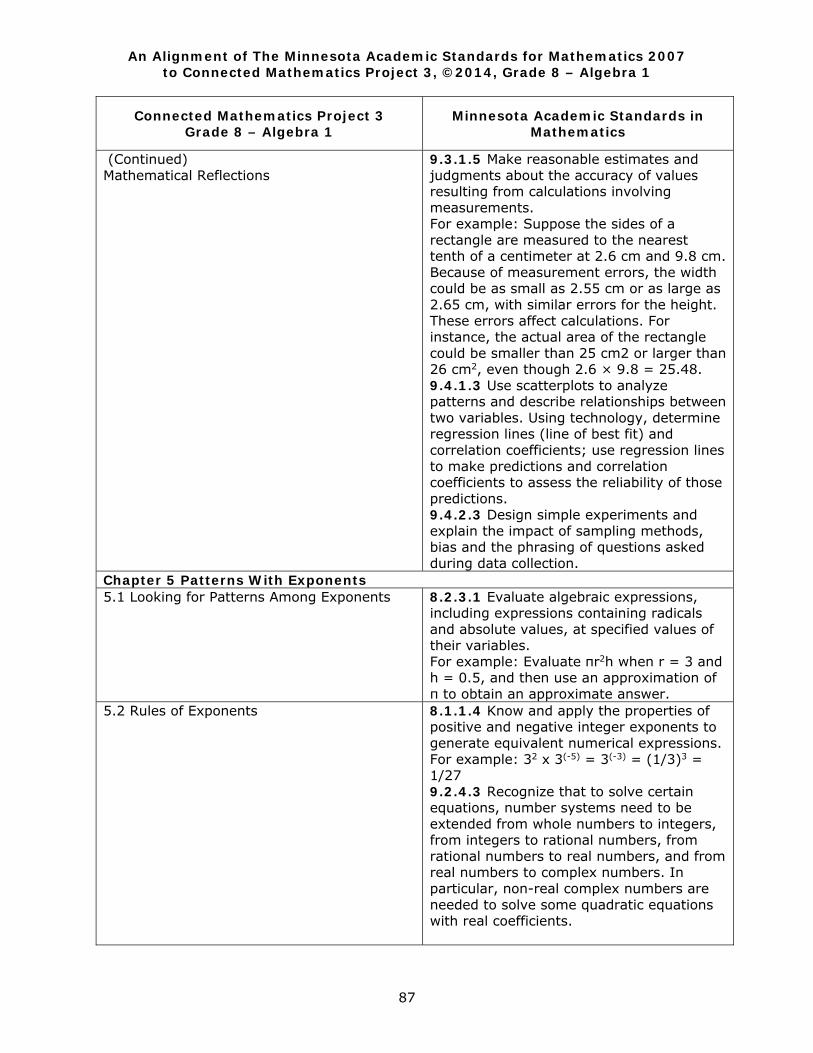
An Alignment of The Minnesota Academic Standards for Mathematics 2007 to Connected Mathematics Project 3, ©2014, Grade 8 – Algebra 1
87
Connected Mathematics Project 3 Grade 8 – Algebra 1
Minnesota Academic Standards in Mathematics
(Continued) Mathematical Reflections
9.3.1.5 Make reasonable estimates and judgments about the accuracy of values resulting from calculations involving measurements. For example: Suppose the sides of a rectangle are measured to the nearest tenth of a centimeter at 2.6 cm and 9.8 cm. Because of measurement errors, the width could be as small as 2.55 cm or as large as 2.65 cm, with similar errors for the height. These errors affect calculations. For instance, the actual area of the rectangle could be smaller than 25 cm2 or larger than 26 cm2, even though 2.6 × 9.8 = 25.48. 9.4.1.3 Use scatterplots to analyze patterns and describe relationships between two variables. Using technology, determine regression lines (line of best fit) and correlation coefficients; use regression lines to make predictions and correlation coefficients to assess the reliability of those predictions. 9.4.2.3 Design simple experiments and explain the impact of sampling methods, bias and the phrasing of questions asked during data collection.
Chapter 5 Patterns With Exponents 5.1 Looking for Patterns Among Exponents 8.2.3.1 Evaluate algebraic expressions,
including expressions containing radicals and absolute values, at specified values of their variables. For example: Evaluate πr2h when r = 3 and h = 0.5, and then use an approximation of π to obtain an approximate answer.
5.2 Rules of Exponents 8.1.1.4 Know and apply the properties of positive and negative integer exponents to generate equivalent numerical expressions. For example: 32 x 3(-5) = 3(-3) = (1/3)3 = 1/27 9.2.4.3 Recognize that to solve certain equations, number systems need to be extended from whole numbers to integers, from integers to rational numbers, from rational numbers to real numbers, and from real numbers to complex numbers. In particular, non-real complex numbers are needed to solve some quadratic equations with real coefficients.
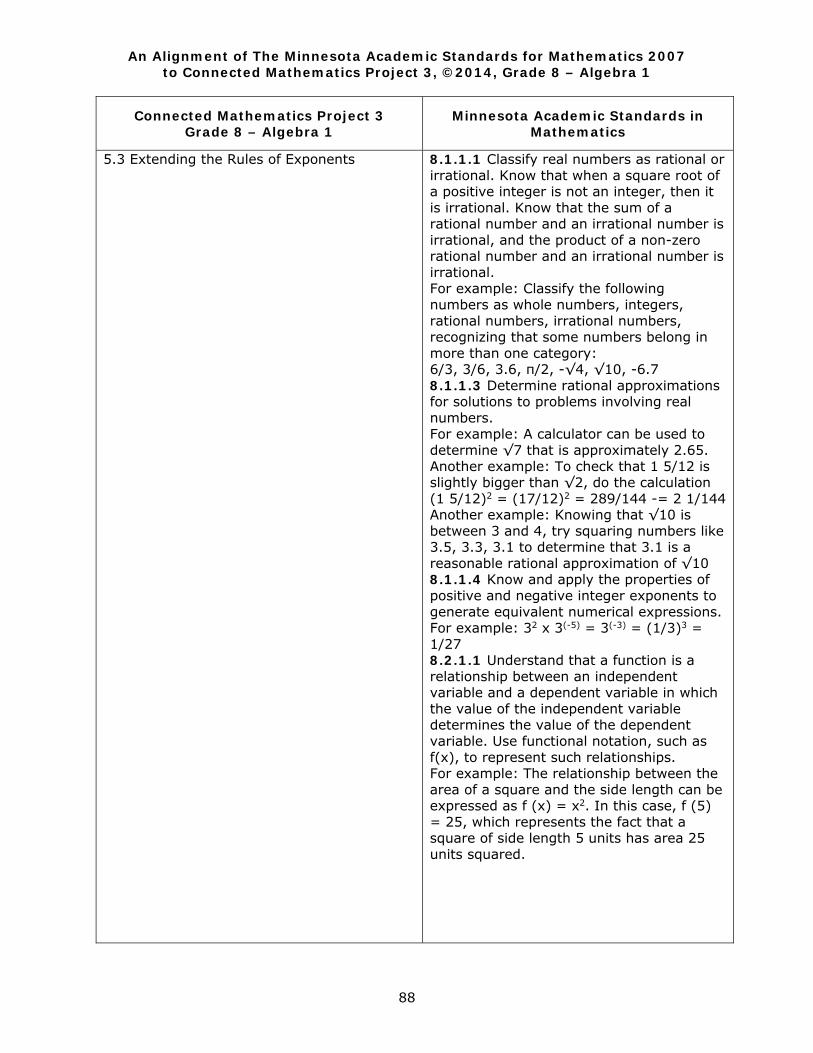
An Alignment of The Minnesota Academic Standards for Mathematics 2007 to Connected Mathematics Project 3, ©2014, Grade 8 – Algebra 1
88
Connected Mathematics Project 3 Grade 8 – Algebra 1
Minnesota Academic Standards in Mathematics
5.3 Extending the Rules of Exponents
8.1.1.1 Classify real numbers as rational or irrational. Know that when a square root of a positive integer is not an integer, then it is irrational. Know that the sum of a rational number and an irrational number is irrational, and the product of a non-zero rational number and an irrational number is irrational. For example: Classify the following numbers as whole numbers, integers, rational numbers, irrational numbers, recognizing that some numbers belong in more than one category: 6/3, 3/6, 3.6, π/2, -√4, √10, -6.7 8.1.1.3 Determine rational approximations for solutions to problems involving real numbers. For example: A calculator can be used to determine √7 that is approximately 2.65. Another example: To check that 1 5/12 is slightly bigger than √2, do the calculation (1 5/12)2 = (17/12)2 = 289/144 -= 2 1/144 Another example: Knowing that √10 is between 3 and 4, try squaring numbers like 3.5, 3.3, 3.1 to determine that 3.1 is a reasonable rational approximation of √10 8.1.1.4 Know and apply the properties of positive and negative integer exponents to generate equivalent numerical expressions. For example: 32 x 3(-5) = 3(-3) = (1/3)3 = 1/27 8.2.1.1 Understand that a function is a relationship between an independent variable and a dependent variable in which the value of the independent variable determines the value of the dependent variable. Use functional notation, such as f(x), to represent such relationships. For example: The relationship between the area of a square and the side length can be expressed as f (x) = x2. In this case, f (5) = 25, which represents the fact that a square of side length 5 units has area 25 units squared.
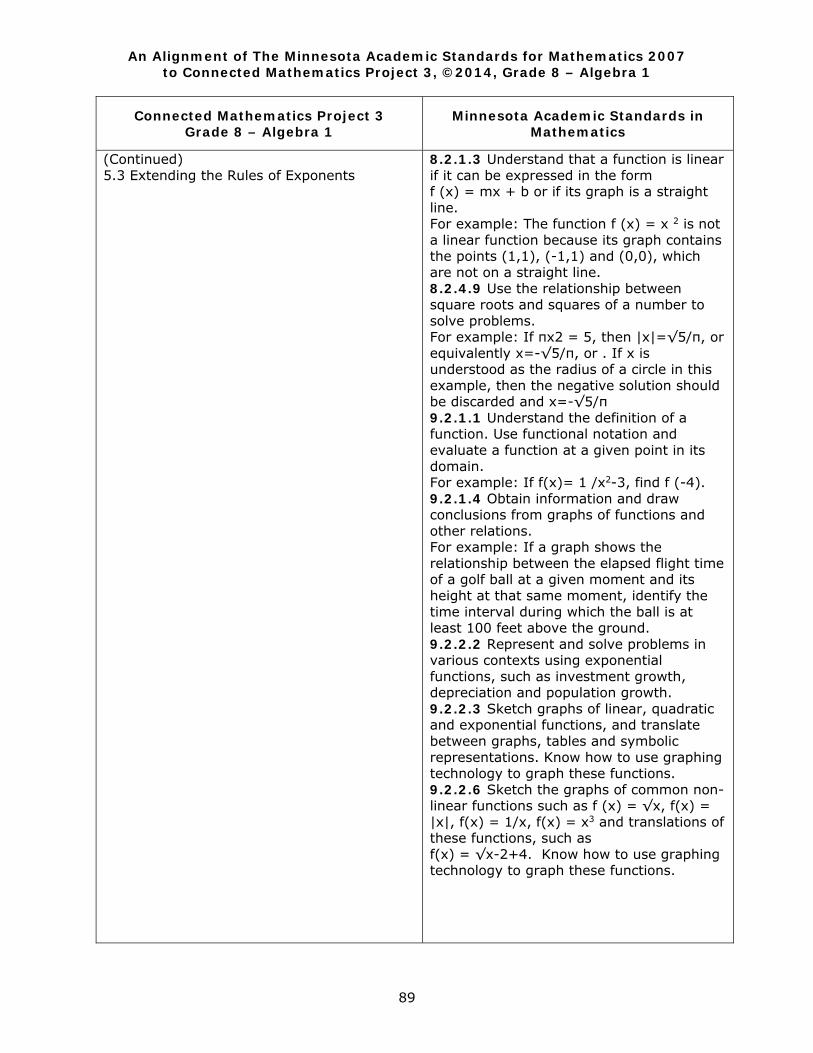
An Alignment of The Minnesota Academic Standards for Mathematics 2007 to Connected Mathematics Project 3, ©2014, Grade 8 – Algebra 1
89
Connected Mathematics Project 3 Grade 8 – Algebra 1
Minnesota Academic Standards in Mathematics
(Continued) 5.3 Extending the Rules of Exponents
8.2.1.3 Understand that a function is linear if it can be expressed in the form f (x) = mx + b or if its graph is a straight line. For example: The function f (x) = x 2 is not a linear function because its graph contains the points (1,1), (-1,1) and (0,0), which are not on a straight line. 8.2.4.9 Use the relationship between square roots and squares of a number to solve problems. For example: If πx2 = 5, then |x|=√5/π, or equivalently x=-√5/π, or . If x is understood as the radius of a circle in this example, then the negative solution should be discarded and x=-√5/π 9.2.1.1 Understand the definition of a function. Use functional notation and evaluate a function at a given point in its domain. For example: If f(x)= 1 /x2-3, find f (-4). 9.2.1.4 Obtain information and draw conclusions from graphs of functions and other relations. For example: If a graph shows the relationship between the elapsed flight time of a golf ball at a given moment and its height at that same moment, identify the time interval during which the ball is at least 100 feet above the ground. 9.2.2.2 Represent and solve problems in various contexts using exponential functions, such as investment growth, depreciation and population growth. 9.2.2.3 Sketch graphs of linear, quadratic and exponential functions, and translate between graphs, tables and symbolic representations. Know how to use graphing technology to graph these functions. 9.2.2.6 Sketch the graphs of common non-linear functions such as f (x) = √x, f(x) = |x|, f(x) = 1/x, f(x) = x3 and translations of these functions, such as f(x) = √x-2+4. Know how to use graphing technology to graph these functions.
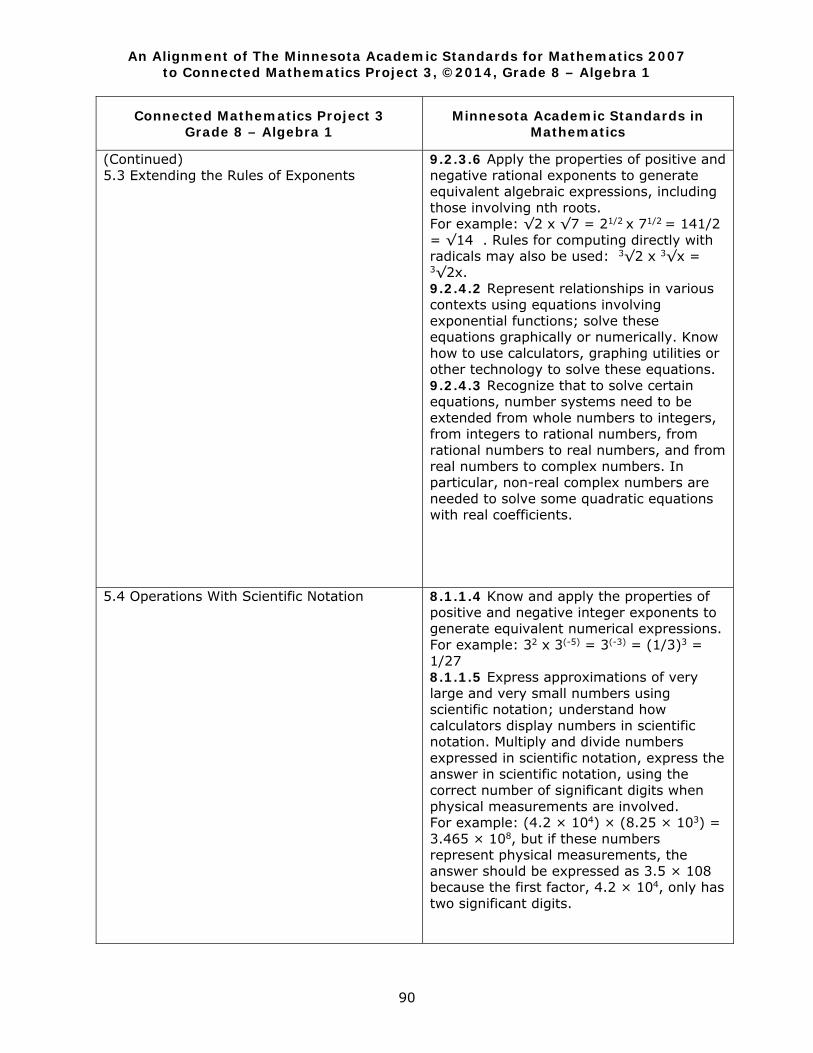
An Alignment of The Minnesota Academic Standards for Mathematics 2007 to Connected Mathematics Project 3, ©2014, Grade 8 – Algebra 1
90
Connected Mathematics Project 3 Grade 8 – Algebra 1
Minnesota Academic Standards in Mathematics
(Continued) 5.3 Extending the Rules of Exponents
9.2.3.6 Apply the properties of positive and negative rational exponents to generate equivalent algebraic expressions, including those involving nth roots. For example: √2 x √7 = 21/2 x 71/2 = 141/2 = √14 . Rules for computing directly with radicals may also be used: 3√2 x 3√x = 3√2x. 9.2.4.2 Represent relationships in various contexts using equations involving exponential functions; solve these equations graphically or numerically. Know how to use calculators, graphing utilities or other technology to solve these equations. 9.2.4.3 Recognize that to solve certain equations, number systems need to be extended from whole numbers to integers, from integers to rational numbers, from rational numbers to real numbers, and from real numbers to complex numbers. In particular, non-real complex numbers are needed to solve some quadratic equations with real coefficients.
5.4 Operations With Scientific Notation
8.1.1.4 Know and apply the properties of positive and negative integer exponents to generate equivalent numerical expressions. For example: 32 x 3(-5) = 3(-3) = (1/3)3 = 1/27 8.1.1.5 Express approximations of very large and very small numbers using scientific notation; understand how calculators display numbers in scientific notation. Multiply and divide numbers expressed in scientific notation, express the answer in scientific notation, using the correct number of significant digits when physical measurements are involved. For example: (4.2 × 104) × (8.25 × 103) = 3.465 × 10⁸, but if these numbers represent physical measurements, the answer should be expressed as 3.5 × 10⁸ because the first factor, 4.2 × 10⁴, only has two significant digits.

An Alignment of The Minnesota Academic Standards for Mathematics 2007 to Connected Mathematics Project 3, ©2014, Grade 8 – Algebra 1
91
Connected Mathematics Project 3 Grade 8 – Algebra 1
Minnesota Academic Standards in Mathematics
(Continued) 5.4 Operations With Scientific Notation
9.3.1.3 Understand that quantities associated with physical measurements must be assigned units; apply such units correctly in expressions, equations and problem solutions that involve measurements; and convert between measurement systems. For example: 60 miles/hour = 60 miles/hour × 5280 feet/mile ×1 hour/3600 seconds = 88 feet/second.
5.5 Revisiting Exponential Functions
8.1.1.1 Classify real numbers as rational or irrational. Know that when a square root of a positive integer is not an integer, then it is irrational. Know that the sum of a rational number and an irrational number is irrational, and the product of a non-zero rational number and an irrational number is irrational. For example: Classify the following numbers as whole numbers, integers, rational numbers, irrational numbers, recognizing that some numbers belong in more than one category: 6/3, 3/6, 3.6, π/2, -√4, √10, -6.7 8.1.1.3 Determine rational approximations for solutions to problems involving real numbers. For example: A calculator can be used to determine √7 that is approximately 2.65. Another example: To check that 1 5/12 is slightly bigger than √2, do the calculation (1 5/12)2 = (17/12)2 = 289/144 -= 2 1/144 Another example: Knowing that √10 is between 3 and 4, try squaring numbers like 3.5, 3.3, 3.1 to determine that 3.1 is a reasonable rational approximation of √10 8.1.1.4 Know and apply the properties of positive and negative integer exponents to generate equivalent numerical expressions. For example: 32 x 3(-5) = 3(-3) = (1/3)3 = 1/27
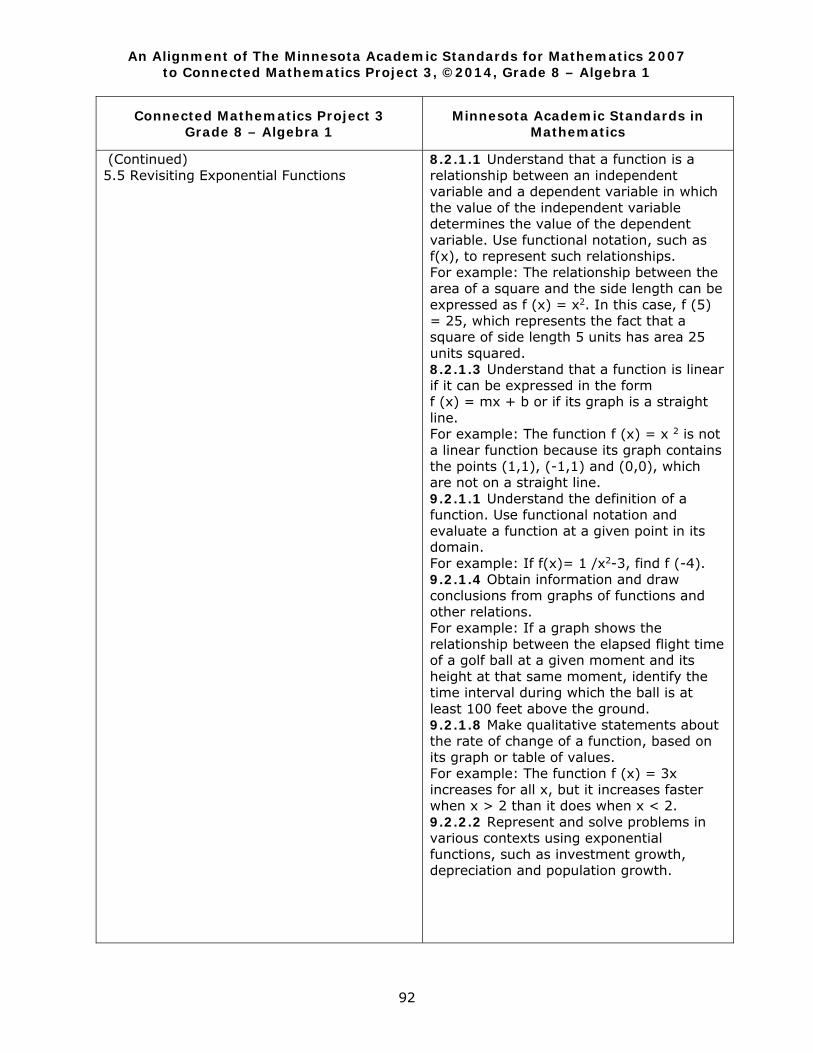
An Alignment of The Minnesota Academic Standards for Mathematics 2007 to Connected Mathematics Project 3, ©2014, Grade 8 – Algebra 1
92
Connected Mathematics Project 3 Grade 8 – Algebra 1
Minnesota Academic Standards in Mathematics
(Continued) 5.5 Revisiting Exponential Functions
8.2.1.1 Understand that a function is a relationship between an independent variable and a dependent variable in which the value of the independent variable determines the value of the dependent variable. Use functional notation, such as f(x), to represent such relationships. For example: The relationship between the area of a square and the side length can be expressed as f (x) = x2. In this case, f (5) = 25, which represents the fact that a square of side length 5 units has area 25 units squared. 8.2.1.3 Understand that a function is linear if it can be expressed in the form f (x) = mx + b or if its graph is a straight line. For example: The function f (x) = x 2 is not a linear function because its graph contains the points (1,1), (-1,1) and (0,0), which are not on a straight line. 9.2.1.1 Understand the definition of a function. Use functional notation and evaluate a function at a given point in its domain. For example: If f(x)= 1 /x2-3, find f (-4). 9.2.1.4 Obtain information and draw conclusions from graphs of functions and other relations. For example: If a graph shows the relationship between the elapsed flight time of a golf ball at a given moment and its height at that same moment, identify the time interval during which the ball is at least 100 feet above the ground. 9.2.1.8 Make qualitative statements about the rate of change of a function, based on its graph or table of values. For example: The function f (x) = 3x increases for all x, but it increases faster when x > 2 than it does when x < 2. 9.2.2.2 Represent and solve problems in various contexts using exponential functions, such as investment growth, depreciation and population growth.
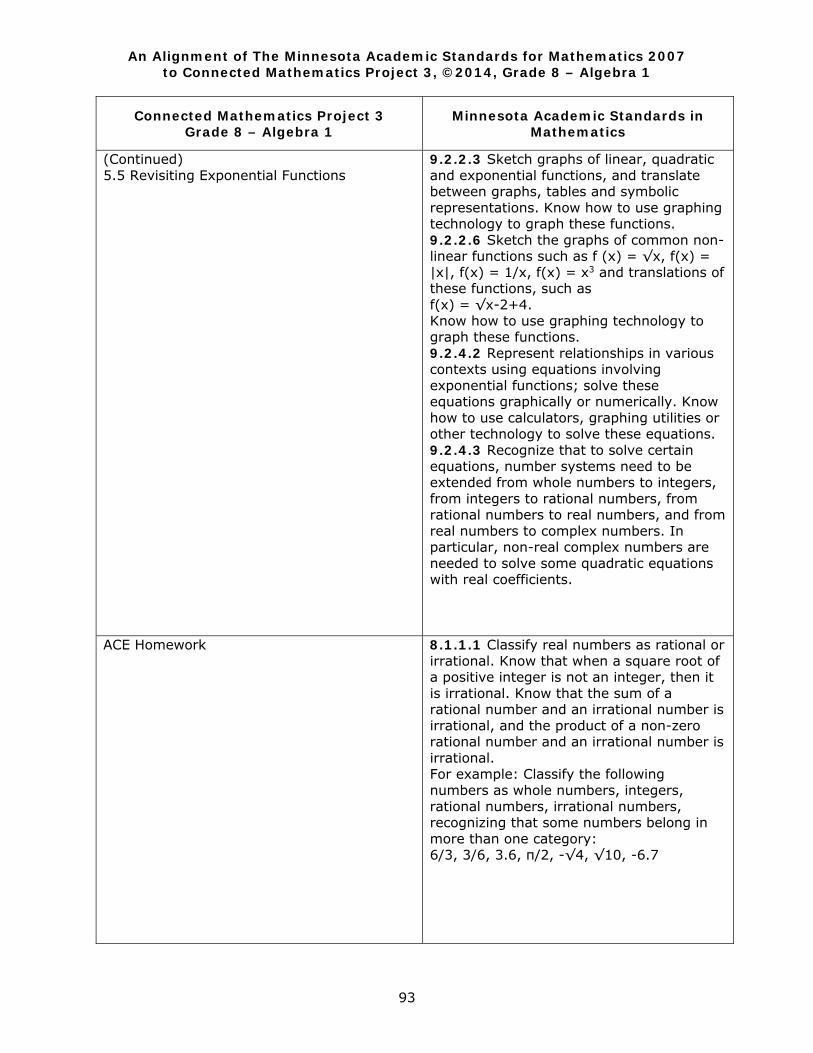
An Alignment of The Minnesota Academic Standards for Mathematics 2007 to Connected Mathematics Project 3, ©2014, Grade 8 – Algebra 1
93
Connected Mathematics Project 3 Grade 8 – Algebra 1
Minnesota Academic Standards in Mathematics
(Continued) 5.5 Revisiting Exponential Functions
9.2.2.3 Sketch graphs of linear, quadratic and exponential functions, and translate between graphs, tables and symbolic representations. Know how to use graphing technology to graph these functions. 9.2.2.6 Sketch the graphs of common non-linear functions such as f (x) = √x, f(x) = |x|, f(x) = 1/x, f(x) = x3 and translations of these functions, such as f(x) = √x-2+4. Know how to use graphing technology to graph these functions. 9.2.4.2 Represent relationships in various contexts using equations involving exponential functions; solve these equations graphically or numerically. Know how to use calculators, graphing utilities or other technology to solve these equations. 9.2.4.3 Recognize that to solve certain equations, number systems need to be extended from whole numbers to integers, from integers to rational numbers, from rational numbers to real numbers, and from real numbers to complex numbers. In particular, non-real complex numbers are needed to solve some quadratic equations with real coefficients.
ACE Homework
8.1.1.1 Classify real numbers as rational or irrational. Know that when a square root of a positive integer is not an integer, then it is irrational. Know that the sum of a rational number and an irrational number is irrational, and the product of a non-zero rational number and an irrational number is irrational. For example: Classify the following numbers as whole numbers, integers, rational numbers, irrational numbers, recognizing that some numbers belong in more than one category: 6/3, 3/6, 3.6, π/2, -√4, √10, -6.7
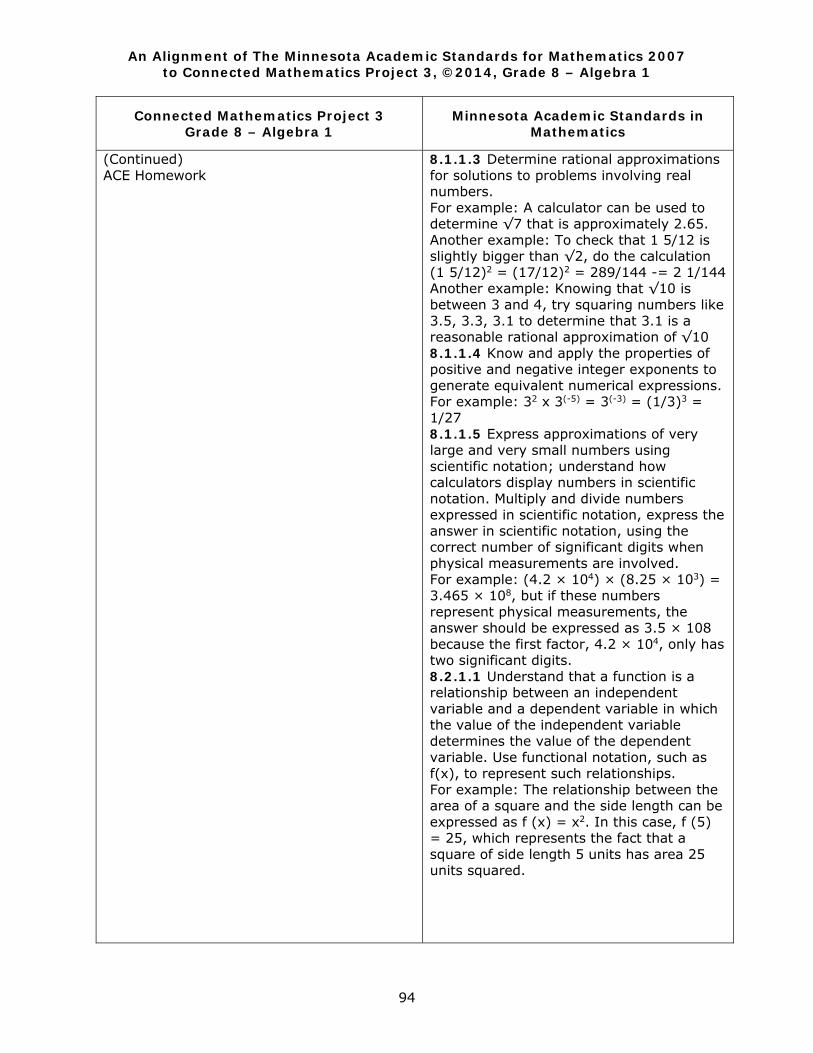
An Alignment of The Minnesota Academic Standards for Mathematics 2007 to Connected Mathematics Project 3, ©2014, Grade 8 – Algebra 1
94
Connected Mathematics Project 3 Grade 8 – Algebra 1
Minnesota Academic Standards in Mathematics
(Continued) ACE Homework
8.1.1.3 Determine rational approximations for solutions to problems involving real numbers. For example: A calculator can be used to determine √7 that is approximately 2.65. Another example: To check that 1 5/12 is slightly bigger than √2, do the calculation (1 5/12)2 = (17/12)2 = 289/144 -= 2 1/144 Another example: Knowing that √10 is between 3 and 4, try squaring numbers like 3.5, 3.3, 3.1 to determine that 3.1 is a reasonable rational approximation of √10 8.1.1.4 Know and apply the properties of positive and negative integer exponents to generate equivalent numerical expressions. For example: 32 x 3(-5) = 3(-3) = (1/3)3 = 1/27 8.1.1.5 Express approximations of very large and very small numbers using scientific notation; understand how calculators display numbers in scientific notation. Multiply and divide numbers expressed in scientific notation, express the answer in scientific notation, using the correct number of significant digits when physical measurements are involved. For example: (4.2 × 104) × (8.25 × 103) = 3.465 × 10⁸, but if these numbers represent physical measurements, the answer should be expressed as 3.5 × 10⁸ because the first factor, 4.2 × 10⁴, only has two significant digits. 8.2.1.1 Understand that a function is a relationship between an independent variable and a dependent variable in which the value of the independent variable determines the value of the dependent variable. Use functional notation, such as f(x), to represent such relationships. For example: The relationship between the area of a square and the side length can be expressed as f (x) = x2. In this case, f (5) = 25, which represents the fact that a square of side length 5 units has area 25 units squared.
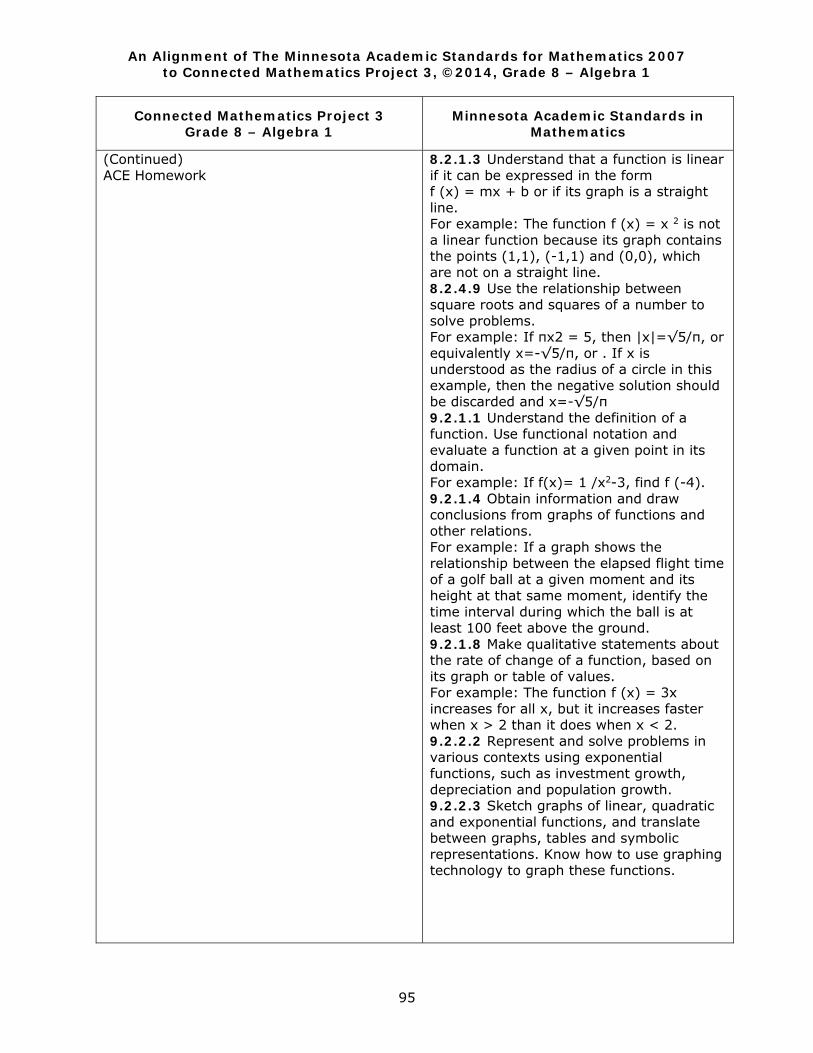
An Alignment of The Minnesota Academic Standards for Mathematics 2007 to Connected Mathematics Project 3, ©2014, Grade 8 – Algebra 1
95
Connected Mathematics Project 3 Grade 8 – Algebra 1
Minnesota Academic Standards in Mathematics
(Continued) ACE Homework
8.2.1.3 Understand that a function is linear if it can be expressed in the form f (x) = mx + b or if its graph is a straight line. For example: The function f (x) = x 2 is not a linear function because its graph contains the points (1,1), (-1,1) and (0,0), which are not on a straight line. 8.2.4.9 Use the relationship between square roots and squares of a number to solve problems. For example: If πx2 = 5, then |x|=√5/π, or equivalently x=-√5/π, or . If x is understood as the radius of a circle in this example, then the negative solution should be discarded and x=-√5/π 9.2.1.1 Understand the definition of a function. Use functional notation and evaluate a function at a given point in its domain. For example: If f(x)= 1 /x2-3, find f (-4). 9.2.1.4 Obtain information and draw conclusions from graphs of functions and other relations. For example: If a graph shows the relationship between the elapsed flight time of a golf ball at a given moment and its height at that same moment, identify the time interval during which the ball is at least 100 feet above the ground. 9.2.1.8 Make qualitative statements about the rate of change of a function, based on its graph or table of values. For example: The function f (x) = 3x increases for all x, but it increases faster when x > 2 than it does when x < 2. 9.2.2.2 Represent and solve problems in various contexts using exponential functions, such as investment growth, depreciation and population growth. 9.2.2.3 Sketch graphs of linear, quadratic and exponential functions, and translate between graphs, tables and symbolic representations. Know how to use graphing technology to graph these functions.
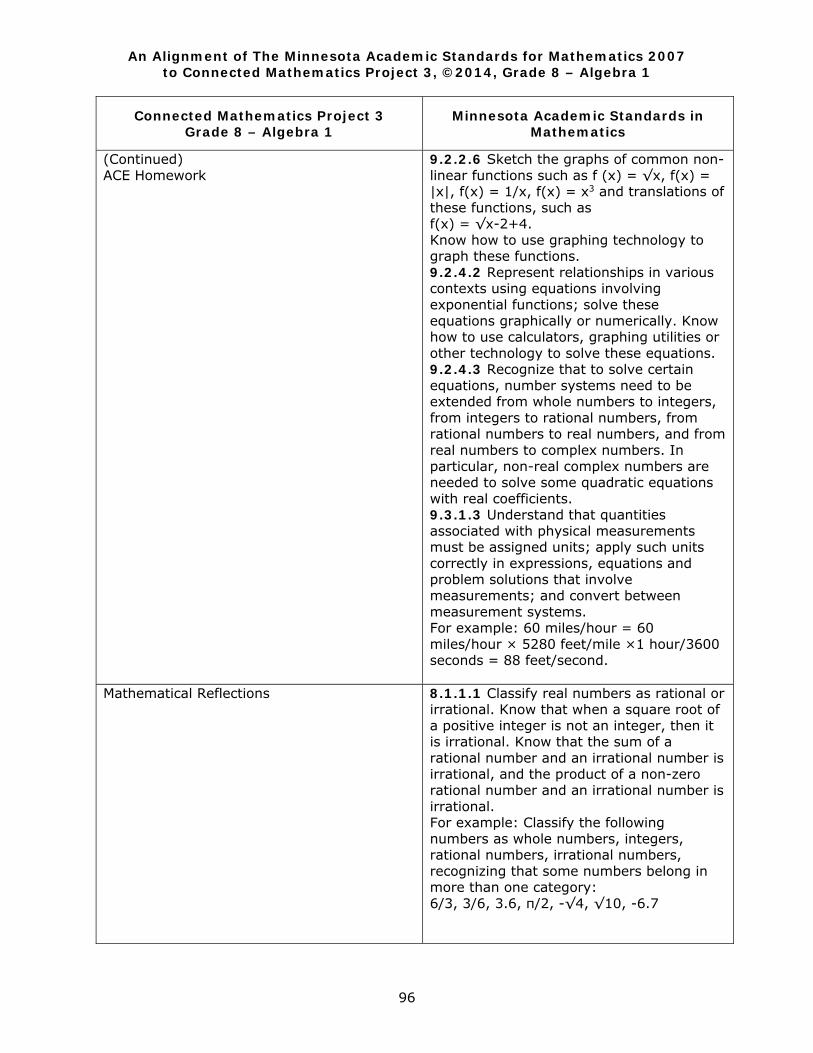
An Alignment of The Minnesota Academic Standards for Mathematics 2007 to Connected Mathematics Project 3, ©2014, Grade 8 – Algebra 1
96
Connected Mathematics Project 3 Grade 8 – Algebra 1
Minnesota Academic Standards in Mathematics
(Continued) ACE Homework
9.2.2.6 Sketch the graphs of common non-linear functions such as f (x) = √x, f(x) = |x|, f(x) = 1/x, f(x) = x3 and translations of these functions, such as f(x) = √x-2+4. Know how to use graphing technology to graph these functions. 9.2.4.2 Represent relationships in various contexts using equations involving exponential functions; solve these equations graphically or numerically. Know how to use calculators, graphing utilities or other technology to solve these equations. 9.2.4.3 Recognize that to solve certain equations, number systems need to be extended from whole numbers to integers, from integers to rational numbers, from rational numbers to real numbers, and from real numbers to complex numbers. In particular, non-real complex numbers are needed to solve some quadratic equations with real coefficients. 9.3.1.3 Understand that quantities associated with physical measurements must be assigned units; apply such units correctly in expressions, equations and problem solutions that involve measurements; and convert between measurement systems. For example: 60 miles/hour = 60 miles/hour × 5280 feet/mile ×1 hour/3600 seconds = 88 feet/second.
Mathematical Reflections
8.1.1.1 Classify real numbers as rational or irrational. Know that when a square root of a positive integer is not an integer, then it is irrational. Know that the sum of a rational number and an irrational number is irrational, and the product of a non-zero rational number and an irrational number is irrational. For example: Classify the following numbers as whole numbers, integers, rational numbers, irrational numbers, recognizing that some numbers belong in more than one category: 6/3, 3/6, 3.6, π/2, -√4, √10, -6.7
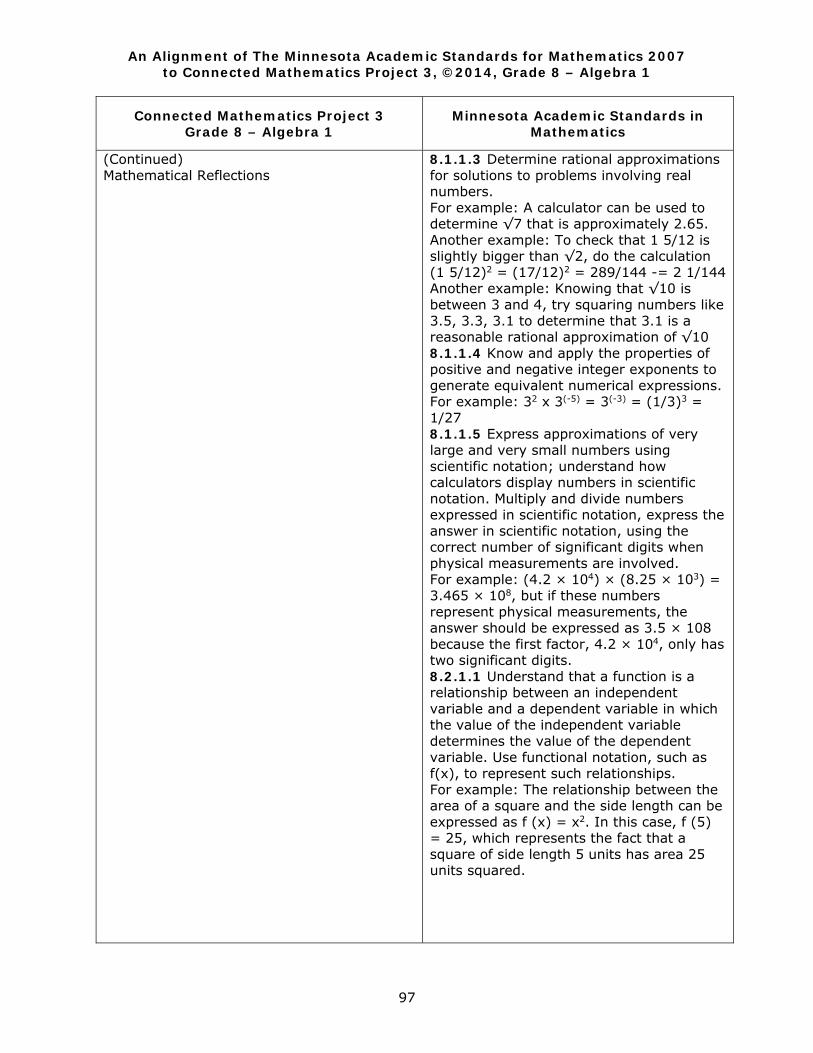
An Alignment of The Minnesota Academic Standards for Mathematics 2007 to Connected Mathematics Project 3, ©2014, Grade 8 – Algebra 1
97
Connected Mathematics Project 3 Grade 8 – Algebra 1
Minnesota Academic Standards in Mathematics
(Continued) Mathematical Reflections
8.1.1.3 Determine rational approximations for solutions to problems involving real numbers. For example: A calculator can be used to determine √7 that is approximately 2.65. Another example: To check that 1 5/12 is slightly bigger than √2, do the calculation (1 5/12)2 = (17/12)2 = 289/144 -= 2 1/144 Another example: Knowing that √10 is between 3 and 4, try squaring numbers like 3.5, 3.3, 3.1 to determine that 3.1 is a reasonable rational approximation of √10 8.1.1.4 Know and apply the properties of positive and negative integer exponents to generate equivalent numerical expressions. For example: 32 x 3(-5) = 3(-3) = (1/3)3 = 1/27 8.1.1.5 Express approximations of very large and very small numbers using scientific notation; understand how calculators display numbers in scientific notation. Multiply and divide numbers expressed in scientific notation, express the answer in scientific notation, using the correct number of significant digits when physical measurements are involved. For example: (4.2 × 104) × (8.25 × 103) = 3.465 × 10⁸, but if these numbers represent physical measurements, the answer should be expressed as 3.5 × 10⁸ because the first factor, 4.2 × 10⁴, only has two significant digits. 8.2.1.1 Understand that a function is a relationship between an independent variable and a dependent variable in which the value of the independent variable determines the value of the dependent variable. Use functional notation, such as f(x), to represent such relationships. For example: The relationship between the area of a square and the side length can be expressed as f (x) = x2. In this case, f (5) = 25, which represents the fact that a square of side length 5 units has area 25 units squared.
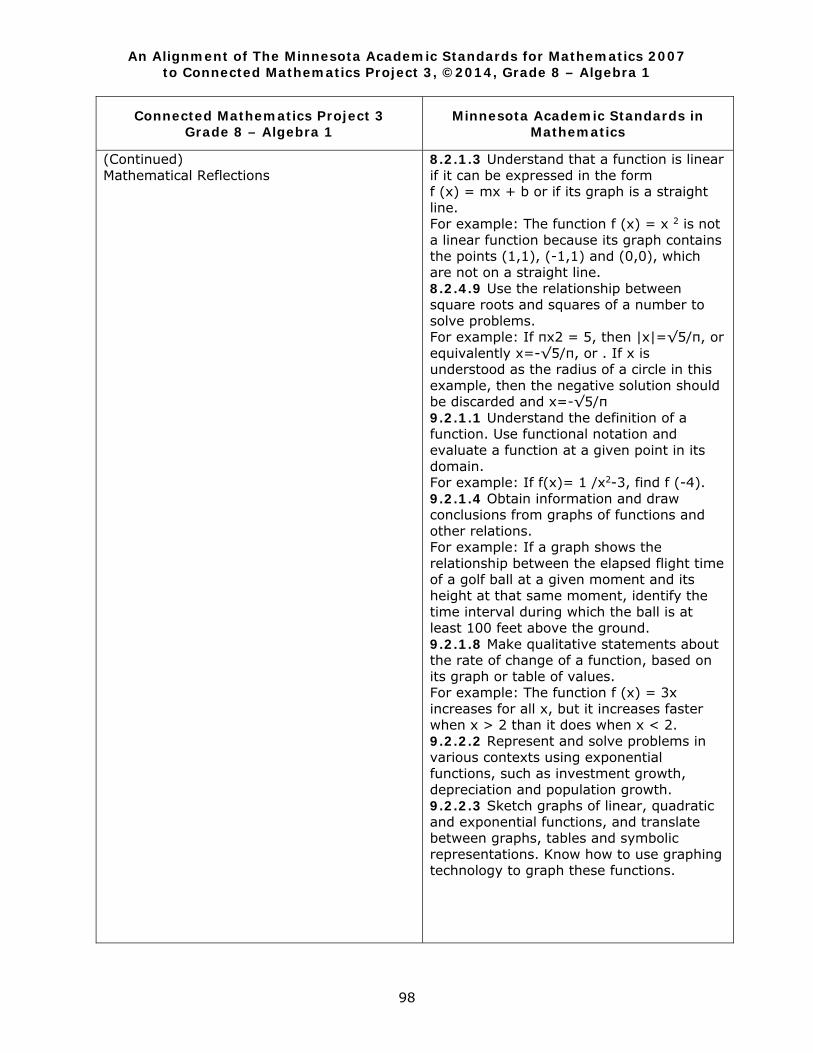
An Alignment of The Minnesota Academic Standards for Mathematics 2007 to Connected Mathematics Project 3, ©2014, Grade 8 – Algebra 1
98
Connected Mathematics Project 3 Grade 8 – Algebra 1
Minnesota Academic Standards in Mathematics
(Continued) Mathematical Reflections
8.2.1.3 Understand that a function is linear if it can be expressed in the form f (x) = mx + b or if its graph is a straight line. For example: The function f (x) = x 2 is not a linear function because its graph contains the points (1,1), (-1,1) and (0,0), which are not on a straight line. 8.2.4.9 Use the relationship between square roots and squares of a number to solve problems. For example: If πx2 = 5, then |x|=√5/π, or equivalently x=-√5/π, or . If x is understood as the radius of a circle in this example, then the negative solution should be discarded and x=-√5/π 9.2.1.1 Understand the definition of a function. Use functional notation and evaluate a function at a given point in its domain. For example: If f(x)= 1 /x2-3, find f (-4). 9.2.1.4 Obtain information and draw conclusions from graphs of functions and other relations. For example: If a graph shows the relationship between the elapsed flight time of a golf ball at a given moment and its height at that same moment, identify the time interval during which the ball is at least 100 feet above the ground. 9.2.1.8 Make qualitative statements about the rate of change of a function, based on its graph or table of values. For example: The function f (x) = 3x increases for all x, but it increases faster when x > 2 than it does when x < 2. 9.2.2.2 Represent and solve problems in various contexts using exponential functions, such as investment growth, depreciation and population growth. 9.2.2.3 Sketch graphs of linear, quadratic and exponential functions, and translate between graphs, tables and symbolic representations. Know how to use graphing technology to graph these functions.
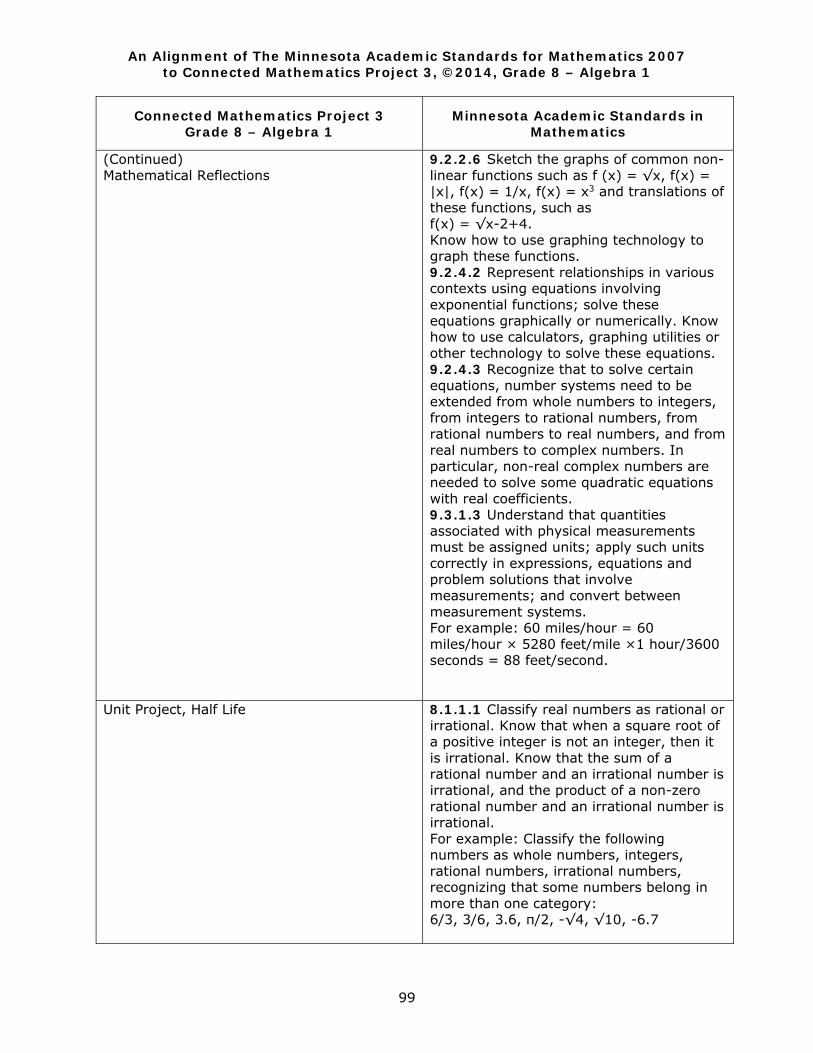
An Alignment of The Minnesota Academic Standards for Mathematics 2007 to Connected Mathematics Project 3, ©2014, Grade 8 – Algebra 1
99
Connected Mathematics Project 3 Grade 8 – Algebra 1
Minnesota Academic Standards in Mathematics
(Continued) Mathematical Reflections
9.2.2.6 Sketch the graphs of common non-linear functions such as f (x) = √x, f(x) = |x|, f(x) = 1/x, f(x) = x3 and translations of these functions, such as f(x) = √x-2+4. Know how to use graphing technology to graph these functions. 9.2.4.2 Represent relationships in various contexts using equations involving exponential functions; solve these equations graphically or numerically. Know how to use calculators, graphing utilities or other technology to solve these equations. 9.2.4.3 Recognize that to solve certain equations, number systems need to be extended from whole numbers to integers, from integers to rational numbers, from rational numbers to real numbers, and from real numbers to complex numbers. In particular, non-real complex numbers are needed to solve some quadratic equations with real coefficients. 9.3.1.3 Understand that quantities associated with physical measurements must be assigned units; apply such units correctly in expressions, equations and problem solutions that involve measurements; and convert between measurement systems. For example: 60 miles/hour = 60 miles/hour × 5280 feet/mile ×1 hour/3600 seconds = 88 feet/second.
Unit Project, Half Life
8.1.1.1 Classify real numbers as rational or irrational. Know that when a square root of a positive integer is not an integer, then it is irrational. Know that the sum of a rational number and an irrational number is irrational, and the product of a non-zero rational number and an irrational number is irrational. For example: Classify the following numbers as whole numbers, integers, rational numbers, irrational numbers, recognizing that some numbers belong in more than one category: 6/3, 3/6, 3.6, π/2, -√4, √10, -6.7
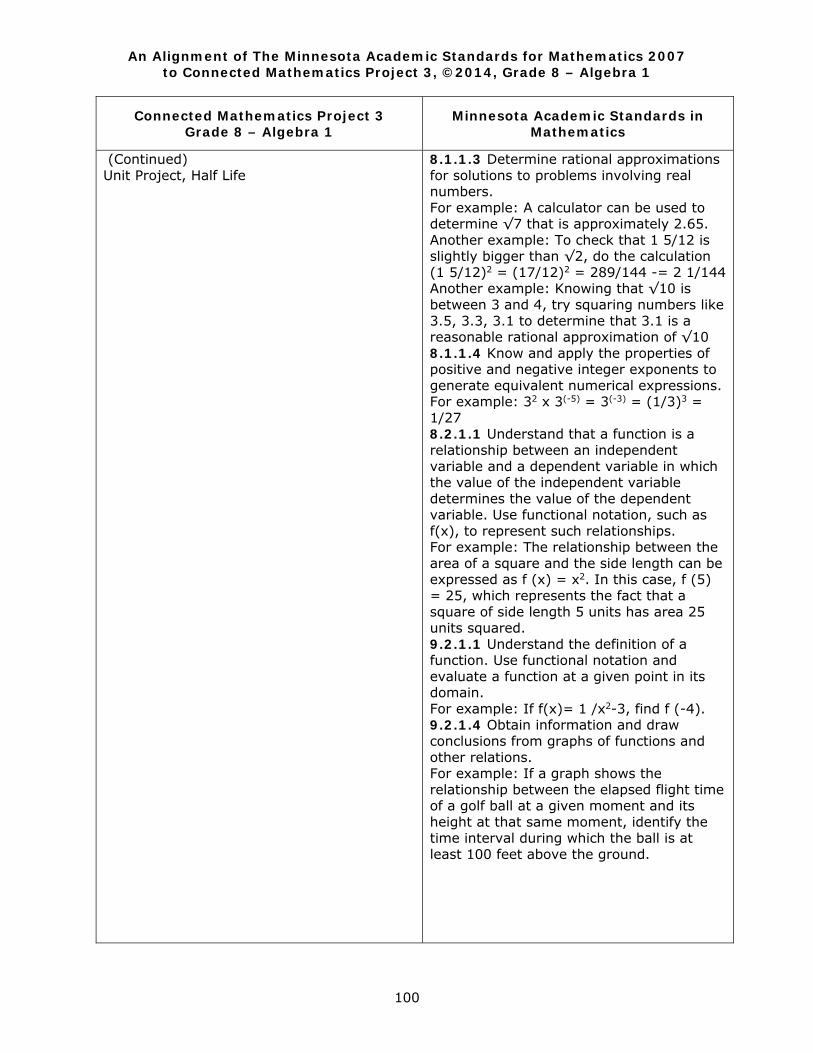
An Alignment of The Minnesota Academic Standards for Mathematics 2007 to Connected Mathematics Project 3, ©2014, Grade 8 – Algebra 1
100
Connected Mathematics Project 3 Grade 8 – Algebra 1
Minnesota Academic Standards in Mathematics
(Continued) Unit Project, Half Life
8.1.1.3 Determine rational approximations for solutions to problems involving real numbers. For example: A calculator can be used to determine √7 that is approximately 2.65. Another example: To check that 1 5/12 is slightly bigger than √2, do the calculation (1 5/12)2 = (17/12)2 = 289/144 -= 2 1/144 Another example: Knowing that √10 is between 3 and 4, try squaring numbers like 3.5, 3.3, 3.1 to determine that 3.1 is a reasonable rational approximation of √10 8.1.1.4 Know and apply the properties of positive and negative integer exponents to generate equivalent numerical expressions. For example: 32 x 3(-5) = 3(-3) = (1/3)3 = 1/27 8.2.1.1 Understand that a function is a relationship between an independent variable and a dependent variable in which the value of the independent variable determines the value of the dependent variable. Use functional notation, such as f(x), to represent such relationships. For example: The relationship between the area of a square and the side length can be expressed as f (x) = x2. In this case, f (5) = 25, which represents the fact that a square of side length 5 units has area 25 units squared. 9.2.1.1 Understand the definition of a function. Use functional notation and evaluate a function at a given point in its domain. For example: If f(x)= 1 /x2-3, find f (-4). 9.2.1.4 Obtain information and draw conclusions from graphs of functions and other relations. For example: If a graph shows the relationship between the elapsed flight time of a golf ball at a given moment and its height at that same moment, identify the time interval during which the ball is at least 100 feet above the ground.
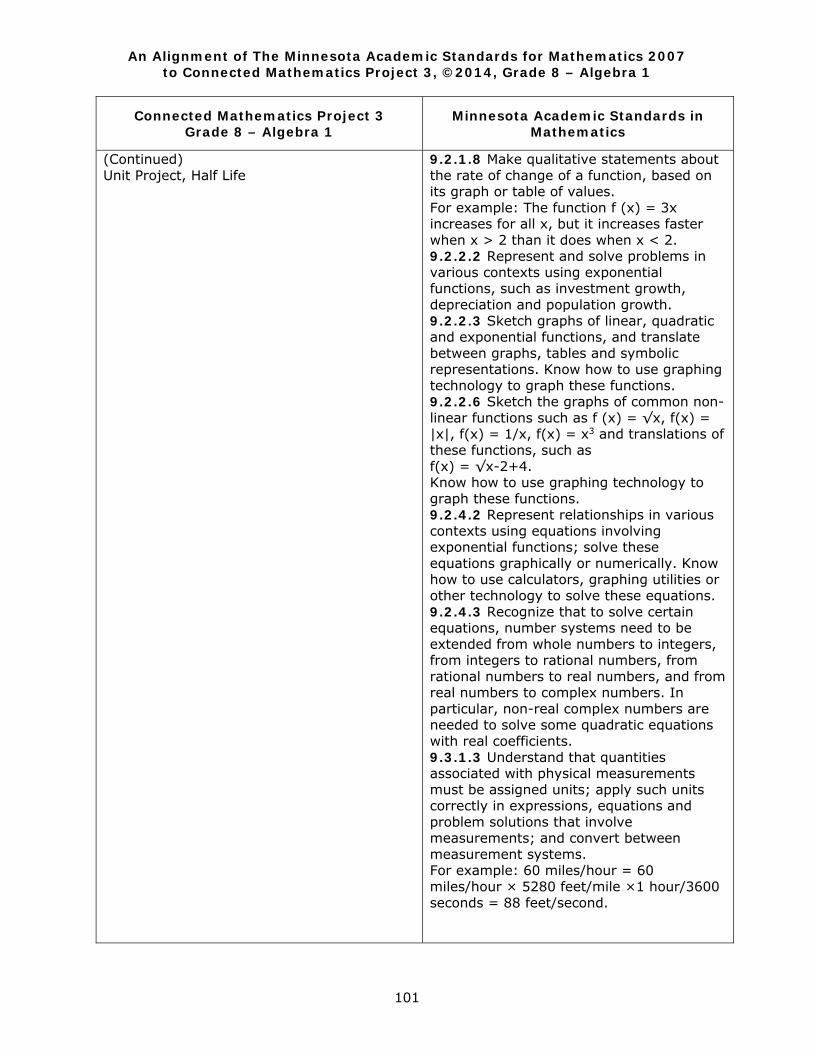
An Alignment of The Minnesota Academic Standards for Mathematics 2007 to Connected Mathematics Project 3, ©2014, Grade 8 – Algebra 1
101
Connected Mathematics Project 3 Grade 8 – Algebra 1
Minnesota Academic Standards in Mathematics
(Continued) Unit Project, Half Life
9.2.1.8 Make qualitative statements about the rate of change of a function, based on its graph or table of values. For example: The function f (x) = 3x increases for all x, but it increases faster when x > 2 than it does when x < 2. 9.2.2.2 Represent and solve problems in various contexts using exponential functions, such as investment growth, depreciation and population growth. 9.2.2.3 Sketch graphs of linear, quadratic and exponential functions, and translate between graphs, tables and symbolic representations. Know how to use graphing technology to graph these functions. 9.2.2.6 Sketch the graphs of common non-linear functions such as f (x) = √x, f(x) = |x|, f(x) = 1/x, f(x) = x3 and translations of these functions, such as f(x) = √x-2+4. Know how to use graphing technology to graph these functions. 9.2.4.2 Represent relationships in various contexts using equations involving exponential functions; solve these equations graphically or numerically. Know how to use calculators, graphing utilities or other technology to solve these equations. 9.2.4.3 Recognize that to solve certain equations, number systems need to be extended from whole numbers to integers, from integers to rational numbers, from rational numbers to real numbers, and from real numbers to complex numbers. In particular, non-real complex numbers are needed to solve some quadratic equations with real coefficients. 9.3.1.3 Understand that quantities associated with physical measurements must be assigned units; apply such units correctly in expressions, equations and problem solutions that involve measurements; and convert between measurement systems. For example: 60 miles/hour = 60 miles/hour × 5280 feet/mile ×1 hour/3600 seconds = 88 feet/second.
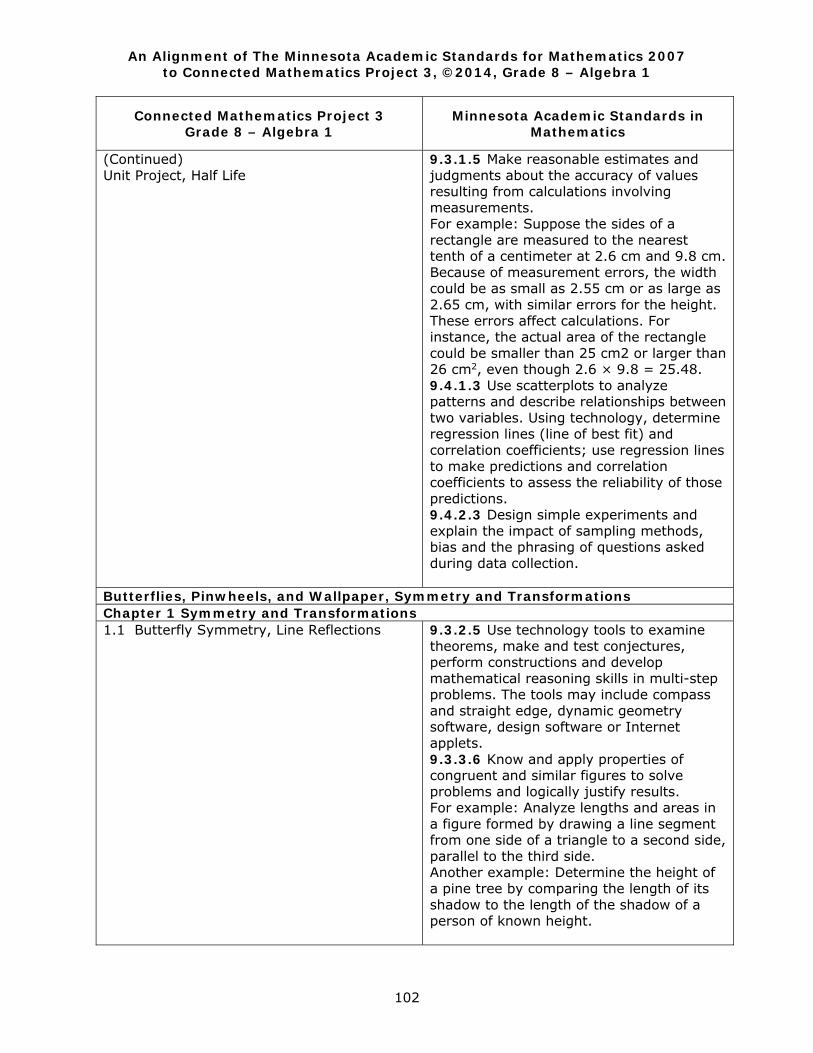
An Alignment of The Minnesota Academic Standards for Mathematics 2007 to Connected Mathematics Project 3, ©2014, Grade 8 – Algebra 1
102
Connected Mathematics Project 3 Grade 8 – Algebra 1
Minnesota Academic Standards in Mathematics
(Continued) Unit Project, Half Life
9.3.1.5 Make reasonable estimates and judgments about the accuracy of values resulting from calculations involving measurements. For example: Suppose the sides of a rectangle are measured to the nearest tenth of a centimeter at 2.6 cm and 9.8 cm. Because of measurement errors, the width could be as small as 2.55 cm or as large as 2.65 cm, with similar errors for the height. These errors affect calculations. For instance, the actual area of the rectangle could be smaller than 25 cm2 or larger than 26 cm2, even though 2.6 × 9.8 = 25.48. 9.4.1.3 Use scatterplots to analyze patterns and describe relationships between two variables. Using technology, determine regression lines (line of best fit) and correlation coefficients; use regression lines to make predictions and correlation coefficients to assess the reliability of those predictions. 9.4.2.3 Design simple experiments and explain the impact of sampling methods, bias and the phrasing of questions asked during data collection.
Butterflies, Pinwheels, and Wallpaper, Symmetry and Transformations Chapter 1 Symmetry and Transformations 1.1 Butterfly Symmetry, Line Reflections
9.3.2.5 Use technology tools to examine theorems, make and test conjectures, perform constructions and develop mathematical reasoning skills in multi-step problems. The tools may include compass and straight edge, dynamic geometry software, design software or Internet applets. 9.3.3.6 Know and apply properties of congruent and similar figures to solve problems and logically justify results. For example: Analyze lengths and areas in a figure formed by drawing a line segment from one side of a triangle to a second side, parallel to the third side. Another example: Determine the height of a pine tree by comparing the length of its shadow to the length of the shadow of a person of known height.
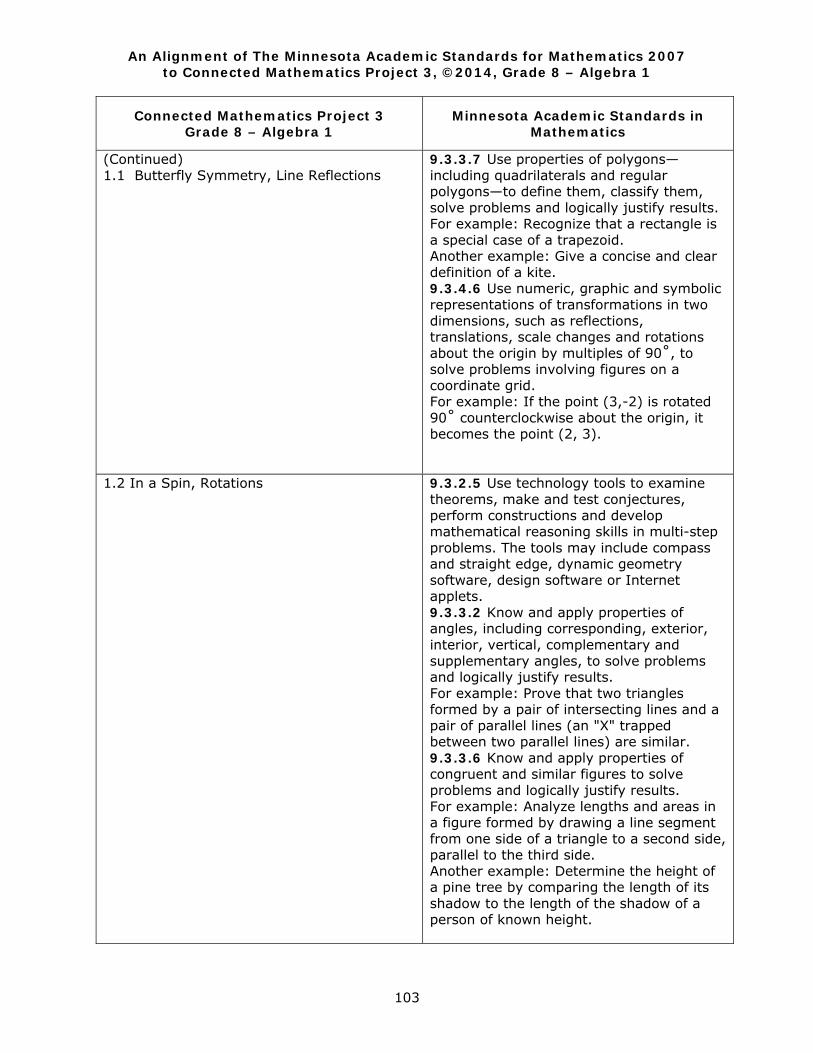
An Alignment of The Minnesota Academic Standards for Mathematics 2007 to Connected Mathematics Project 3, ©2014, Grade 8 – Algebra 1
103
Connected Mathematics Project 3 Grade 8 – Algebra 1
Minnesota Academic Standards in Mathematics
(Continued) 1.1 Butterfly Symmetry, Line Reflections
9.3.3.7 Use properties of polygons—including quadrilaterals and regular polygons—to define them, classify them, solve problems and logically justify results. For example: Recognize that a rectangle is a special case of a trapezoid. Another example: Give a concise and clear definition of a kite. 9.3.4.6 Use numeric, graphic and symbolic representations of transformations in two dimensions, such as reflections, translations, scale changes and rotations about the origin by multiples of 90˚, to solve problems involving figures on a coordinate grid. For example: If the point (3,-2) is rotated 90˚ counterclockwise about the origin, it becomes the point (2, 3).
1.2 In a Spin, Rotations
9.3.2.5 Use technology tools to examine theorems, make and test conjectures, perform constructions and develop mathematical reasoning skills in multi-step problems. The tools may include compass and straight edge, dynamic geometry software, design software or Internet applets. 9.3.3.2 Know and apply properties of angles, including corresponding, exterior, interior, vertical, complementary and supplementary angles, to solve problems and logically justify results. For example: Prove that two triangles formed by a pair of intersecting lines and a pair of parallel lines (an "X" trapped between two parallel lines) are similar. 9.3.3.6 Know and apply properties of congruent and similar figures to solve problems and logically justify results. For example: Analyze lengths and areas in a figure formed by drawing a line segment from one side of a triangle to a second side, parallel to the third side. Another example: Determine the height of a pine tree by comparing the length of its shadow to the length of the shadow of a person of known height.
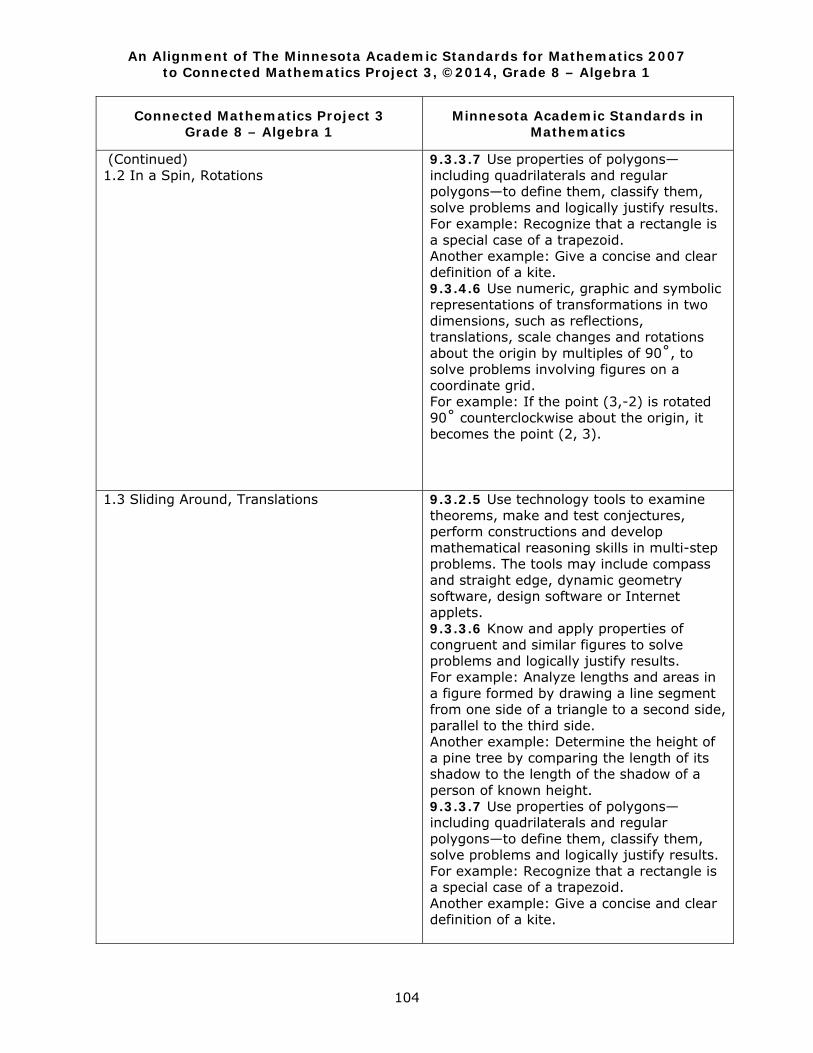
An Alignment of The Minnesota Academic Standards for Mathematics 2007 to Connected Mathematics Project 3, ©2014, Grade 8 – Algebra 1
104
Connected Mathematics Project 3 Grade 8 – Algebra 1
Minnesota Academic Standards in Mathematics
(Continued) 1.2 In a Spin, Rotations
9.3.3.7 Use properties of polygons—including quadrilaterals and regular polygons—to define them, classify them, solve problems and logically justify results. For example: Recognize that a rectangle is a special case of a trapezoid. Another example: Give a concise and clear definition of a kite. 9.3.4.6 Use numeric, graphic and symbolic representations of transformations in two dimensions, such as reflections, translations, scale changes and rotations about the origin by multiples of 90˚, to solve problems involving figures on a coordinate grid. For example: If the point (3,-2) is rotated 90˚ counterclockwise about the origin, it becomes the point (2, 3).
1.3 Sliding Around, Translations
9.3.2.5 Use technology tools to examine theorems, make and test conjectures, perform constructions and develop mathematical reasoning skills in multi-step problems. The tools may include compass and straight edge, dynamic geometry software, design software or Internet applets. 9.3.3.6 Know and apply properties of congruent and similar figures to solve problems and logically justify results. For example: Analyze lengths and areas in a figure formed by drawing a line segment from one side of a triangle to a second side, parallel to the third side. Another example: Determine the height of a pine tree by comparing the length of its shadow to the length of the shadow of a person of known height. 9.3.3.7 Use properties of polygons—including quadrilaterals and regular polygons—to define them, classify them, solve problems and logically justify results. For example: Recognize that a rectangle is a special case of a trapezoid. Another example: Give a concise and clear definition of a kite.
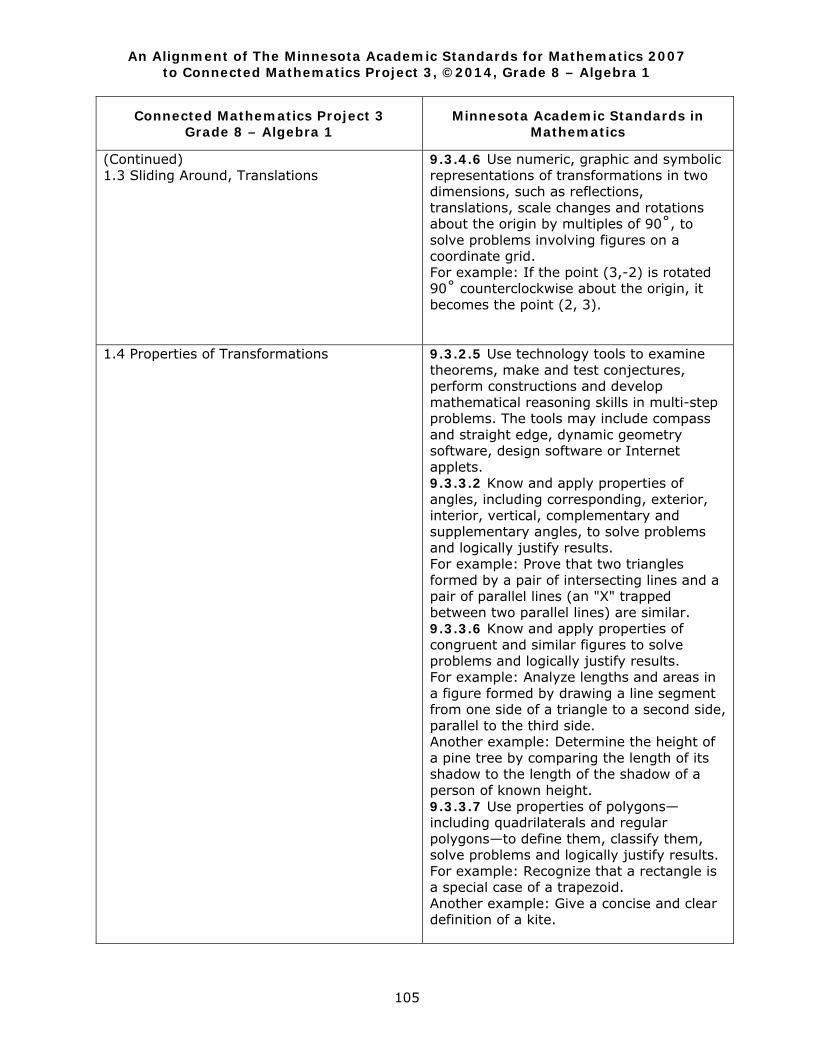
An Alignment of The Minnesota Academic Standards for Mathematics 2007 to Connected Mathematics Project 3, ©2014, Grade 8 – Algebra 1
105
Connected Mathematics Project 3 Grade 8 – Algebra 1
Minnesota Academic Standards in Mathematics
(Continued) 1.3 Sliding Around, Translations
9.3.4.6 Use numeric, graphic and symbolic representations of transformations in two dimensions, such as reflections, translations, scale changes and rotations about the origin by multiples of 90˚, to solve problems involving figures on a coordinate grid. For example: If the point (3,-2) is rotated 90˚ counterclockwise about the origin, it becomes the point (2, 3).
1.4 Properties of Transformations
9.3.2.5 Use technology tools to examine theorems, make and test conjectures, perform constructions and develop mathematical reasoning skills in multi-step problems. The tools may include compass and straight edge, dynamic geometry software, design software or Internet applets. 9.3.3.2 Know and apply properties of angles, including corresponding, exterior, interior, vertical, complementary and supplementary angles, to solve problems and logically justify results. For example: Prove that two triangles formed by a pair of intersecting lines and a pair of parallel lines (an "X" trapped between two parallel lines) are similar. 9.3.3.6 Know and apply properties of congruent and similar figures to solve problems and logically justify results. For example: Analyze lengths and areas in a figure formed by drawing a line segment from one side of a triangle to a second side, parallel to the third side. Another example: Determine the height of a pine tree by comparing the length of its shadow to the length of the shadow of a person of known height. 9.3.3.7 Use properties of polygons—including quadrilaterals and regular polygons—to define them, classify them, solve problems and logically justify results. For example: Recognize that a rectangle is a special case of a trapezoid. Another example: Give a concise and clear definition of a kite.
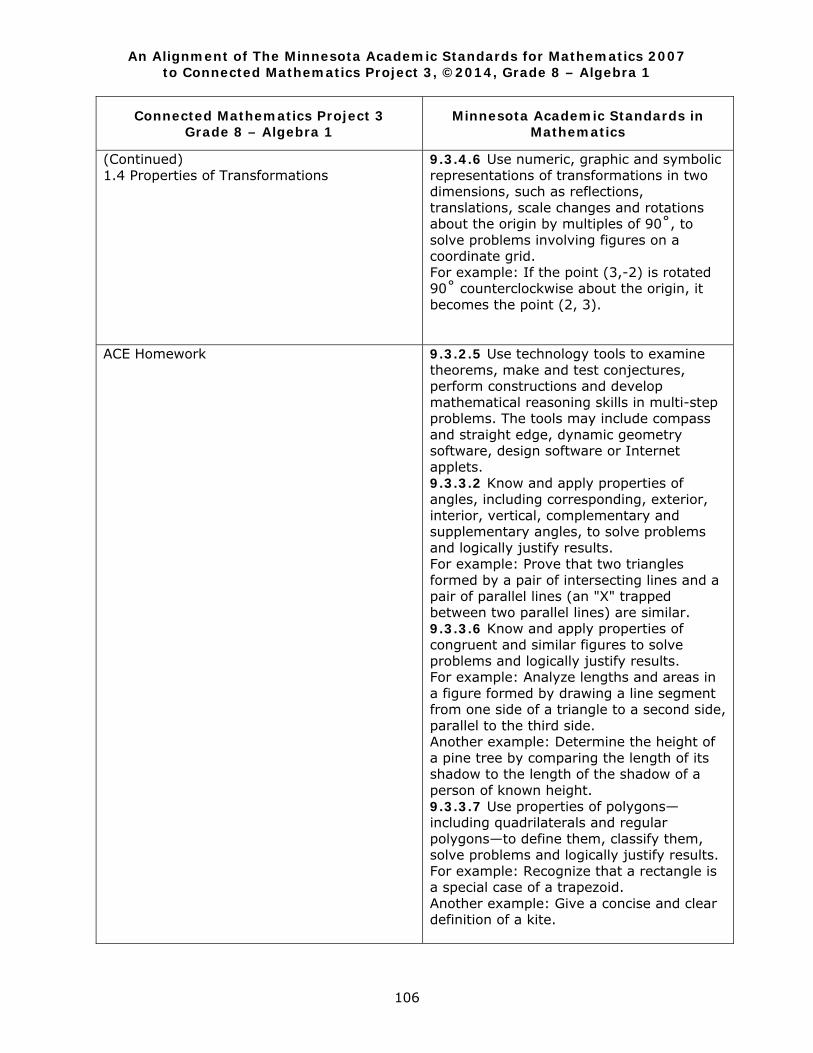
An Alignment of The Minnesota Academic Standards for Mathematics 2007 to Connected Mathematics Project 3, ©2014, Grade 8 – Algebra 1
106
Connected Mathematics Project 3 Grade 8 – Algebra 1
Minnesota Academic Standards in Mathematics
(Continued) 1.4 Properties of Transformations
9.3.4.6 Use numeric, graphic and symbolic representations of transformations in two dimensions, such as reflections, translations, scale changes and rotations about the origin by multiples of 90˚, to solve problems involving figures on a coordinate grid. For example: If the point (3,-2) is rotated 90˚ counterclockwise about the origin, it becomes the point (2, 3).
ACE Homework
9.3.2.5 Use technology tools to examine theorems, make and test conjectures, perform constructions and develop mathematical reasoning skills in multi-step problems. The tools may include compass and straight edge, dynamic geometry software, design software or Internet applets. 9.3.3.2 Know and apply properties of angles, including corresponding, exterior, interior, vertical, complementary and supplementary angles, to solve problems and logically justify results. For example: Prove that two triangles formed by a pair of intersecting lines and a pair of parallel lines (an "X" trapped between two parallel lines) are similar. 9.3.3.6 Know and apply properties of congruent and similar figures to solve problems and logically justify results. For example: Analyze lengths and areas in a figure formed by drawing a line segment from one side of a triangle to a second side, parallel to the third side. Another example: Determine the height of a pine tree by comparing the length of its shadow to the length of the shadow of a person of known height. 9.3.3.7 Use properties of polygons—including quadrilaterals and regular polygons—to define them, classify them, solve problems and logically justify results. For example: Recognize that a rectangle is a special case of a trapezoid. Another example: Give a concise and clear definition of a kite.
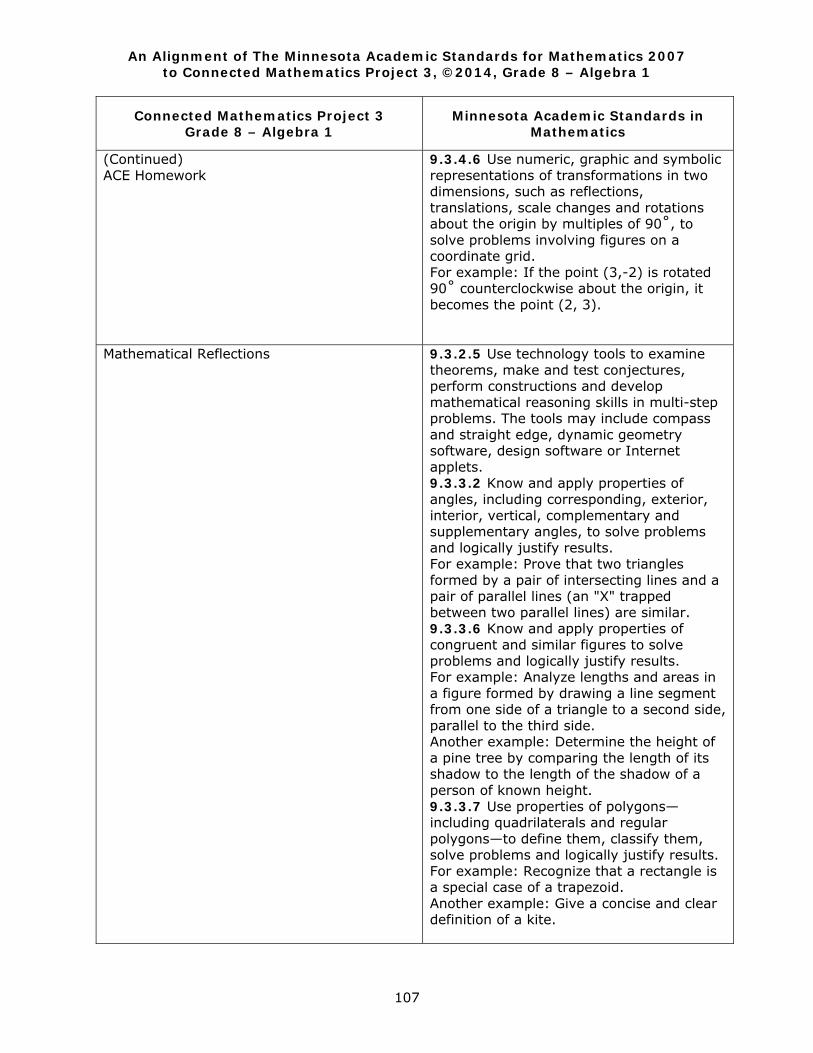
An Alignment of The Minnesota Academic Standards for Mathematics 2007 to Connected Mathematics Project 3, ©2014, Grade 8 – Algebra 1
107
Connected Mathematics Project 3 Grade 8 – Algebra 1
Minnesota Academic Standards in Mathematics
(Continued) ACE Homework
9.3.4.6 Use numeric, graphic and symbolic representations of transformations in two dimensions, such as reflections, translations, scale changes and rotations about the origin by multiples of 90˚, to solve problems involving figures on a coordinate grid. For example: If the point (3,-2) is rotated 90˚ counterclockwise about the origin, it becomes the point (2, 3).
Mathematical Reflections
9.3.2.5 Use technology tools to examine theorems, make and test conjectures, perform constructions and develop mathematical reasoning skills in multi-step problems. The tools may include compass and straight edge, dynamic geometry software, design software or Internet applets. 9.3.3.2 Know and apply properties of angles, including corresponding, exterior, interior, vertical, complementary and supplementary angles, to solve problems and logically justify results. For example: Prove that two triangles formed by a pair of intersecting lines and a pair of parallel lines (an "X" trapped between two parallel lines) are similar. 9.3.3.6 Know and apply properties of congruent and similar figures to solve problems and logically justify results. For example: Analyze lengths and areas in a figure formed by drawing a line segment from one side of a triangle to a second side, parallel to the third side. Another example: Determine the height of a pine tree by comparing the length of its shadow to the length of the shadow of a person of known height. 9.3.3.7 Use properties of polygons—including quadrilaterals and regular polygons—to define them, classify them, solve problems and logically justify results. For example: Recognize that a rectangle is a special case of a trapezoid. Another example: Give a concise and clear definition of a kite.

An Alignment of The Minnesota Academic Standards for Mathematics 2007 to Connected Mathematics Project 3, ©2014, Grade 8 – Algebra 1
108
Connected Mathematics Project 3 Grade 8 – Algebra 1
Minnesota Academic Standards in Mathematics
(Continued) Mathematical Reflections
9.3.4.6 Use numeric, graphic and symbolic representations of transformations in two dimensions, such as reflections, translations, scale changes and rotations about the origin by multiples of 90˚, to solve problems involving figures on a coordinate grid. For example: If the point (3,-2) is rotated 90˚ counterclockwise about the origin, it becomes the point (2, 3).
Chapter 2 Transformations and Congruence 2.1 Connecting Congruent Polygons
9.3.2.5 Use technology tools to examine theorems, make and test conjectures, perform constructions and develop mathematical reasoning skills in multi-step problems. The tools may include compass and straight edge, dynamic geometry software, design software or Internet applets. 9.3.3.2 Know and apply properties of angles, including corresponding, exterior, interior, vertical, complementary and supplementary angles, to solve problems and logically justify results. For example: Prove that two triangles formed by a pair of intersecting lines and a pair of parallel lines (an "X" trapped between two parallel lines) are similar. 9.3.3.2 Know and apply properties of angles, including corresponding, exterior, interior, vertical, complementary and supplementary angles, to solve problems and logically justify results. For example: Prove that two triangles formed by a pair of intersecting lines and a pair of parallel lines (an "X" trapped between two parallel lines) are similar. 9.3.3.6 Know and apply properties of congruent and similar figures to solve problems and logically justify results. For example: Analyze lengths and areas in a figure formed by drawing a line segment from one side of a triangle to a second side, parallel to the third side. Another example: Determine the height of a pine tree by comparing the length of its shadow to the length of the shadow of a person of known height.
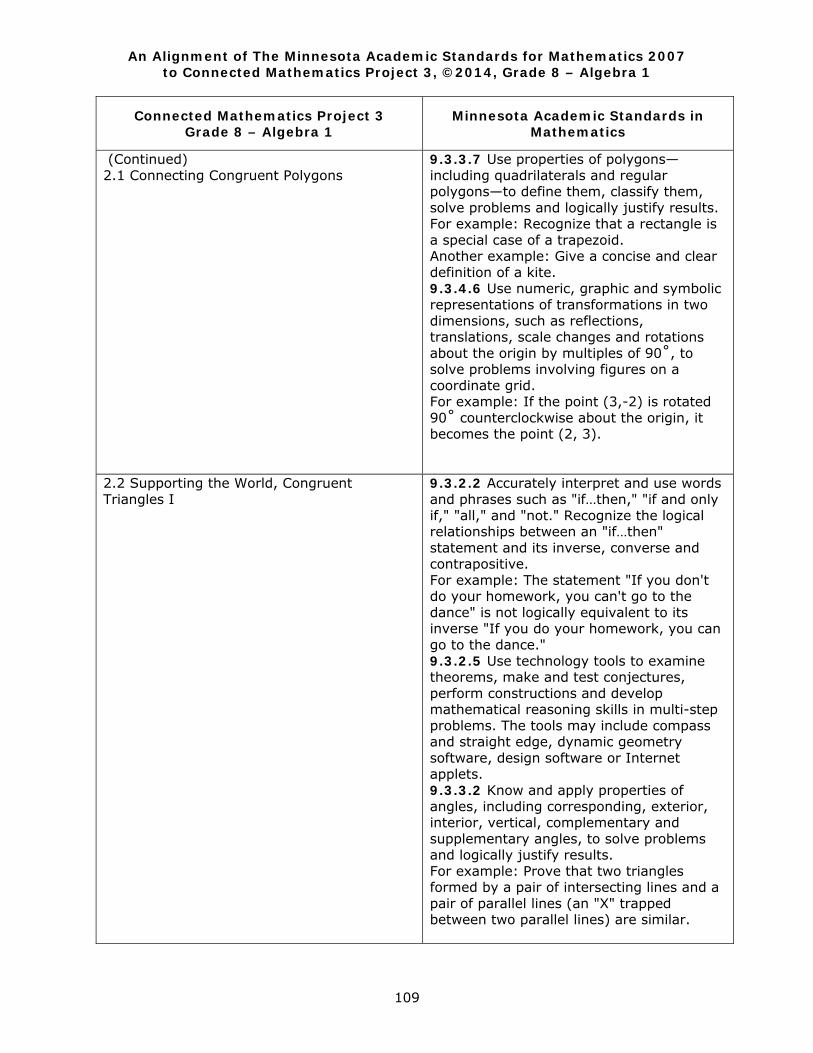
An Alignment of The Minnesota Academic Standards for Mathematics 2007 to Connected Mathematics Project 3, ©2014, Grade 8 – Algebra 1
109
Connected Mathematics Project 3 Grade 8 – Algebra 1
Minnesota Academic Standards in Mathematics
(Continued) 2.1 Connecting Congruent Polygons
9.3.3.7 Use properties of polygons—including quadrilaterals and regular polygons—to define them, classify them, solve problems and logically justify results. For example: Recognize that a rectangle is a special case of a trapezoid. Another example: Give a concise and clear definition of a kite. 9.3.4.6 Use numeric, graphic and symbolic representations of transformations in two dimensions, such as reflections, translations, scale changes and rotations about the origin by multiples of 90˚, to solve problems involving figures on a coordinate grid. For example: If the point (3,-2) is rotated 90˚ counterclockwise about the origin, it becomes the point (2, 3).
2.2 Supporting the World, Congruent Triangles I
9.3.2.2 Accurately interpret and use words and phrases such as "if…then," "if and only if," "all," and "not." Recognize the logical relationships between an "if…then" statement and its inverse, converse and contrapositive. For example: The statement "If you don't do your homework, you can't go to the dance" is not logically equivalent to its inverse "If you do your homework, you can go to the dance." 9.3.2.5 Use technology tools to examine theorems, make and test conjectures, perform constructions and develop mathematical reasoning skills in multi-step problems. The tools may include compass and straight edge, dynamic geometry software, design software or Internet applets. 9.3.3.2 Know and apply properties of angles, including corresponding, exterior, interior, vertical, complementary and supplementary angles, to solve problems and logically justify results. For example: Prove that two triangles formed by a pair of intersecting lines and a pair of parallel lines (an "X" trapped between two parallel lines) are similar.
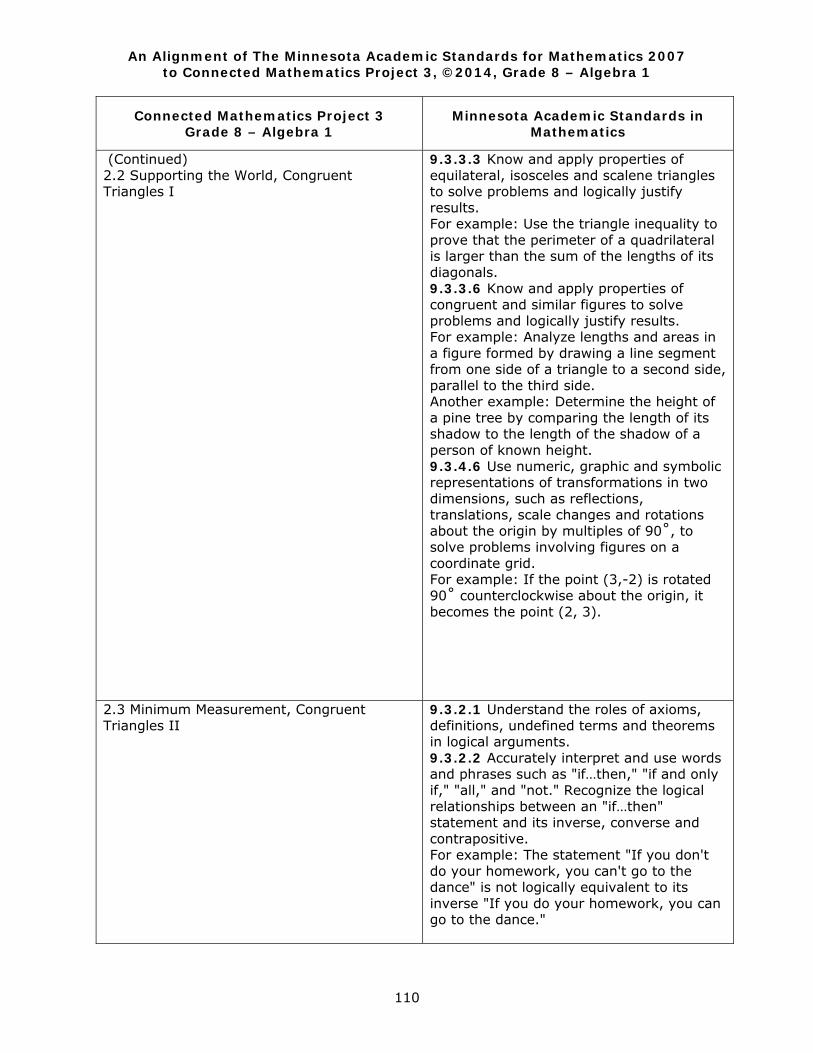
An Alignment of The Minnesota Academic Standards for Mathematics 2007 to Connected Mathematics Project 3, ©2014, Grade 8 – Algebra 1
110
Connected Mathematics Project 3 Grade 8 – Algebra 1
Minnesota Academic Standards in Mathematics
(Continued) 2.2 Supporting the World, Congruent Triangles I
9.3.3.3 Know and apply properties of equilateral, isosceles and scalene triangles to solve problems and logically justify results. For example: Use the triangle inequality to prove that the perimeter of a quadrilateral is larger than the sum of the lengths of its diagonals. 9.3.3.6 Know and apply properties of congruent and similar figures to solve problems and logically justify results. For example: Analyze lengths and areas in a figure formed by drawing a line segment from one side of a triangle to a second side, parallel to the third side. Another example: Determine the height of a pine tree by comparing the length of its shadow to the length of the shadow of a person of known height. 9.3.4.6 Use numeric, graphic and symbolic representations of transformations in two dimensions, such as reflections, translations, scale changes and rotations about the origin by multiples of 90˚, to solve problems involving figures on a coordinate grid. For example: If the point (3,-2) is rotated 90˚ counterclockwise about the origin, it becomes the point (2, 3).
2.3 Minimum Measurement, Congruent Triangles II
9.3.2.1 Understand the roles of axioms, definitions, undefined terms and theorems in logical arguments. 9.3.2.2 Accurately interpret and use words and phrases such as "if…then," "if and only if," "all," and "not." Recognize the logical relationships between an "if…then" statement and its inverse, converse and contrapositive. For example: The statement "If you don't do your homework, you can't go to the dance" is not logically equivalent to its inverse "If you do your homework, you can go to the dance."

An Alignment of The Minnesota Academic Standards for Mathematics 2007 to Connected Mathematics Project 3, ©2014, Grade 8 – Algebra 1
111
Connected Mathematics Project 3 Grade 8 – Algebra 1
Minnesota Academic Standards in Mathematics
(Continued) 2.3 Minimum Measurement, Congruent Triangles II
9.3.2.5 Use technology tools to examine theorems, make and test conjectures, perform constructions and develop mathematical reasoning skills in multi-step problems. The tools may include compass and straight edge, dynamic geometry software, design software or Internet applets. 9.3.3.2 Know and apply properties of angles, including corresponding, exterior, interior, vertical, complementary and supplementary angles, to solve problems and logically justify results. For example: Prove that two triangles formed by a pair of intersecting lines and a pair of parallel lines (an "X" trapped between two parallel lines) are similar. 9.3.3.3 Know and apply properties of equilateral, isosceles and scalene triangles to solve problems and logically justify results. For example: Use the triangle inequality to prove that the perimeter of a quadrilateral is larger than the sum of the lengths of its diagonals. 9.3.3.6 Know and apply properties of congruent and similar figures to solve problems and logically justify results. For example: Analyze lengths and areas in a figure formed by drawing a line segment from one side of a triangle to a second side, parallel to the third side. Another example: Determine the height of a pine tree by comparing the length of its shadow to the length of the shadow of a person of known height. 9.3.4.6 Use numeric, graphic and symbolic representations of transformations in two dimensions, such as reflections, translations, scale changes and rotations about the origin by multiples of 90˚, to solve problems involving figures on a coordinate grid. For example: If the point (3,-2) is rotated 90˚ counterclockwise about the origin, it becomes the point (2, 3).

An Alignment of The Minnesota Academic Standards for Mathematics 2007 to Connected Mathematics Project 3, ©2014, Grade 8 – Algebra 1
112
Connected Mathematics Project 3 Grade 8 – Algebra 1
Minnesota Academic Standards in Mathematics
ACE Homework
9.3.2.1 Understand the roles of axioms, definitions, undefined terms and theorems in logical arguments. 9.3.2.2 Accurately interpret and use words and phrases such as "if…then," "if and only if," "all," and "not." Recognize the logical relationships between an "if…then" statement and its inverse, converse and contrapositive. For example: The statement "If you don't do your homework, you can't go to the dance" is not logically equivalent to its inverse "If you do your homework, you can go to the dance." 9.3.2.5 Use technology tools to examine theorems, make and test conjectures, perform constructions and develop mathematical reasoning skills in multi-step problems. The tools may include compass and straight edge, dynamic geometry software, design software or Internet applets. 9.3.3.2 Know and apply properties of angles, including corresponding, exterior, interior, vertical, complementary and supplementary angles, to solve problems and logically justify results. For example: Prove that two triangles formed by a pair of intersecting lines and a pair of parallel lines (an "X" trapped between two parallel lines) are similar. 9.3.3.3 Know and apply properties of equilateral, isosceles and scalene triangles to solve problems and logically justify results. For example: Use the triangle inequality to prove that the perimeter of a quadrilateral is larger than the sum of the lengths of its diagonals.
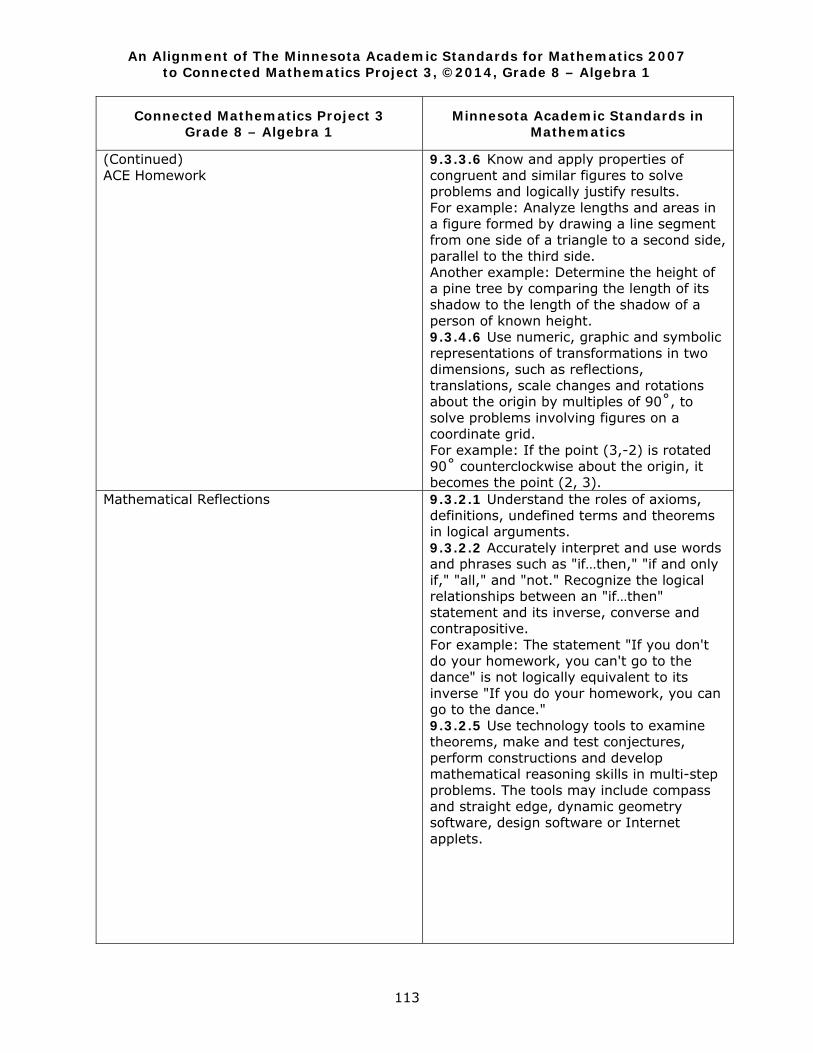
An Alignment of The Minnesota Academic Standards for Mathematics 2007 to Connected Mathematics Project 3, ©2014, Grade 8 – Algebra 1
113
Connected Mathematics Project 3 Grade 8 – Algebra 1
Minnesota Academic Standards in Mathematics
(Continued) ACE Homework
9.3.3.6 Know and apply properties of congruent and similar figures to solve problems and logically justify results. For example: Analyze lengths and areas in a figure formed by drawing a line segment from one side of a triangle to a second side, parallel to the third side. Another example: Determine the height of a pine tree by comparing the length of its shadow to the length of the shadow of a person of known height. 9.3.4.6 Use numeric, graphic and symbolic representations of transformations in two dimensions, such as reflections, translations, scale changes and rotations about the origin by multiples of 90˚, to solve problems involving figures on a coordinate grid. For example: If the point (3,-2) is rotated 90˚ counterclockwise about the origin, it becomes the point (2, 3).
Mathematical Reflections
9.3.2.1 Understand the roles of axioms, definitions, undefined terms and theorems in logical arguments. 9.3.2.2 Accurately interpret and use words and phrases such as "if…then," "if and only if," "all," and "not." Recognize the logical relationships between an "if…then" statement and its inverse, converse and contrapositive. For example: The statement "If you don't do your homework, you can't go to the dance" is not logically equivalent to its inverse "If you do your homework, you can go to the dance." 9.3.2.5 Use technology tools to examine theorems, make and test conjectures, perform constructions and develop mathematical reasoning skills in multi-step problems. The tools may include compass and straight edge, dynamic geometry software, design software or Internet applets.
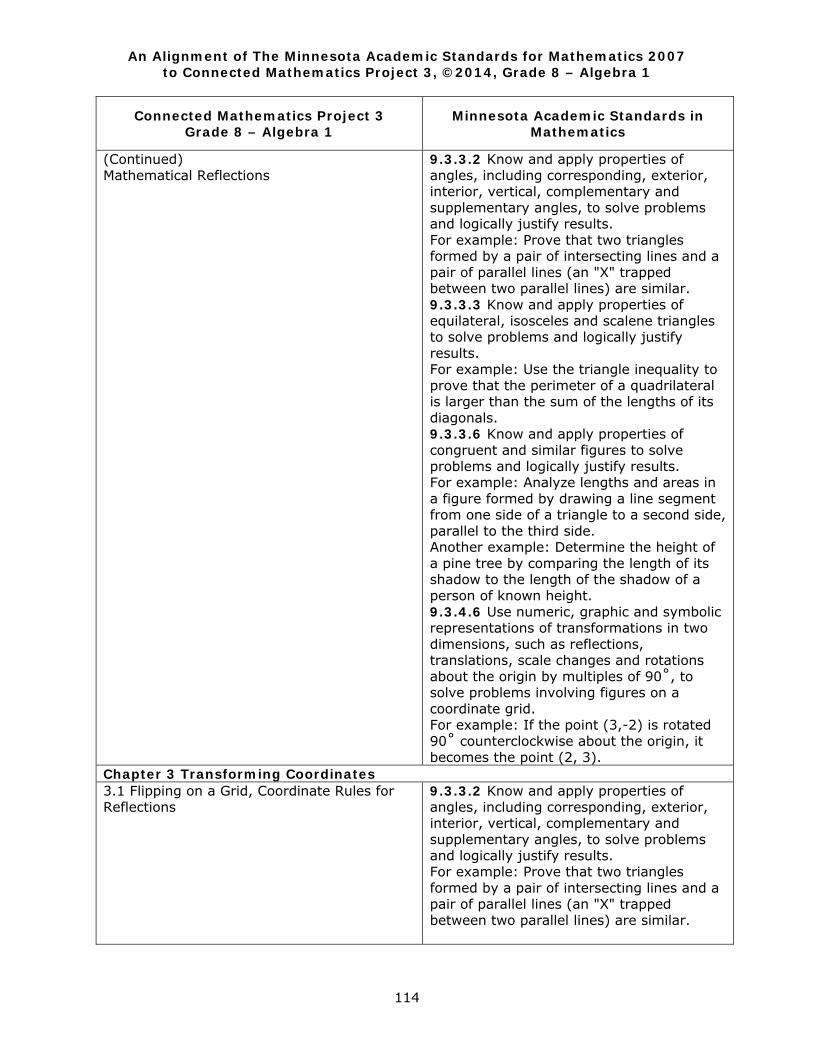
An Alignment of The Minnesota Academic Standards for Mathematics 2007 to Connected Mathematics Project 3, ©2014, Grade 8 – Algebra 1
114
Connected Mathematics Project 3 Grade 8 – Algebra 1
Minnesota Academic Standards in Mathematics
(Continued) Mathematical Reflections
9.3.3.2 Know and apply properties of angles, including corresponding, exterior, interior, vertical, complementary and supplementary angles, to solve problems and logically justify results. For example: Prove that two triangles formed by a pair of intersecting lines and a pair of parallel lines (an "X" trapped between two parallel lines) are similar. 9.3.3.3 Know and apply properties of equilateral, isosceles and scalene triangles to solve problems and logically justify results. For example: Use the triangle inequality to prove that the perimeter of a quadrilateral is larger than the sum of the lengths of its diagonals. 9.3.3.6 Know and apply properties of congruent and similar figures to solve problems and logically justify results. For example: Analyze lengths and areas in a figure formed by drawing a line segment from one side of a triangle to a second side, parallel to the third side. Another example: Determine the height of a pine tree by comparing the length of its shadow to the length of the shadow of a person of known height. 9.3.4.6 Use numeric, graphic and symbolic representations of transformations in two dimensions, such as reflections, translations, scale changes and rotations about the origin by multiples of 90˚, to solve problems involving figures on a coordinate grid. For example: If the point (3,-2) is rotated 90˚ counterclockwise about the origin, it becomes the point (2, 3).
Chapter 3 Transforming Coordinates 3.1 Flipping on a Grid, Coordinate Rules for Reflections
9.3.3.2 Know and apply properties of angles, including corresponding, exterior, interior, vertical, complementary and supplementary angles, to solve problems and logically justify results. For example: Prove that two triangles formed by a pair of intersecting lines and a pair of parallel lines (an "X" trapped between two parallel lines) are similar.
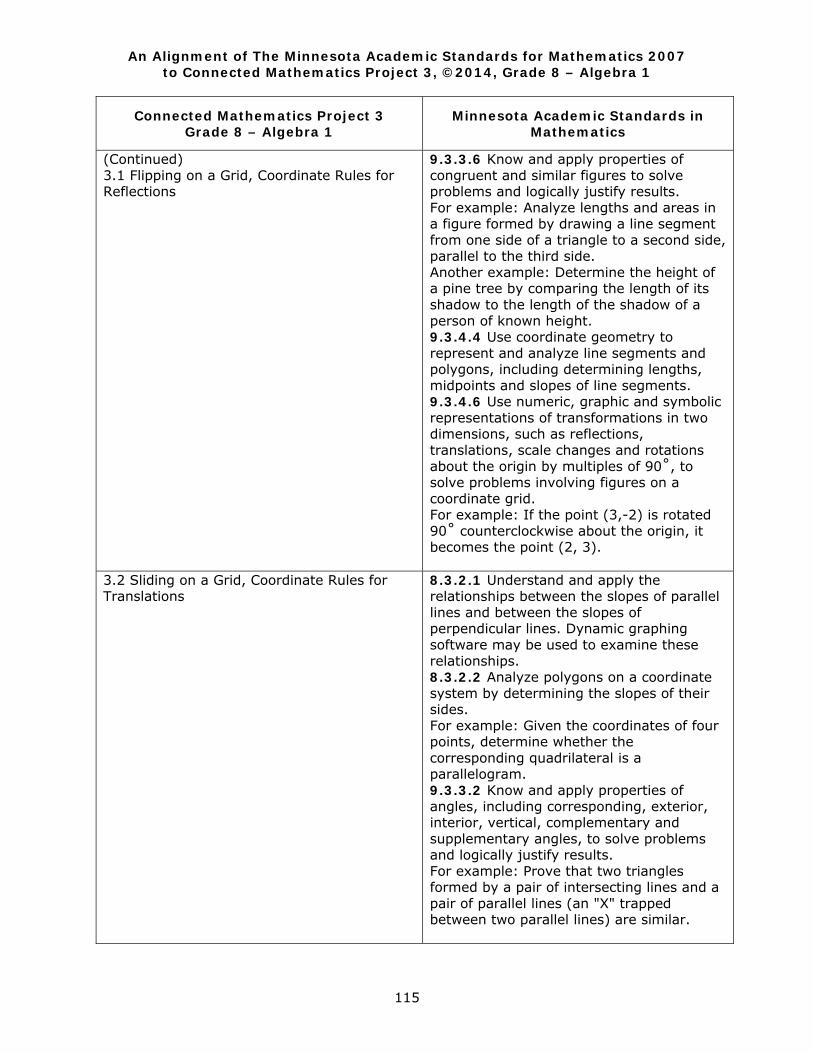
An Alignment of The Minnesota Academic Standards for Mathematics 2007 to Connected Mathematics Project 3, ©2014, Grade 8 – Algebra 1
115
Connected Mathematics Project 3 Grade 8 – Algebra 1
Minnesota Academic Standards in Mathematics
(Continued) 3.1 Flipping on a Grid, Coordinate Rules for Reflections
9.3.3.6 Know and apply properties of congruent and similar figures to solve problems and logically justify results. For example: Analyze lengths and areas in a figure formed by drawing a line segment from one side of a triangle to a second side, parallel to the third side. Another example: Determine the height of a pine tree by comparing the length of its shadow to the length of the shadow of a person of known height. 9.3.4.4 Use coordinate geometry to represent and analyze line segments and polygons, including determining lengths, midpoints and slopes of line segments. 9.3.4.6 Use numeric, graphic and symbolic representations of transformations in two dimensions, such as reflections, translations, scale changes and rotations about the origin by multiples of 90˚, to solve problems involving figures on a coordinate grid. For example: If the point (3,-2) is rotated 90˚ counterclockwise about the origin, it becomes the point (2, 3).
3.2 Sliding on a Grid, Coordinate Rules for Translations
8.3.2.1 Understand and apply the relationships between the slopes of parallel lines and between the slopes of perpendicular lines. Dynamic graphing software may be used to examine these relationships. 8.3.2.2 Analyze polygons on a coordinate system by determining the slopes of their sides. For example: Given the coordinates of four points, determine whether the corresponding quadrilateral is a parallelogram. 9.3.3.2 Know and apply properties of angles, including corresponding, exterior, interior, vertical, complementary and supplementary angles, to solve problems and logically justify results. For example: Prove that two triangles formed by a pair of intersecting lines and a pair of parallel lines (an "X" trapped between two parallel lines) are similar.
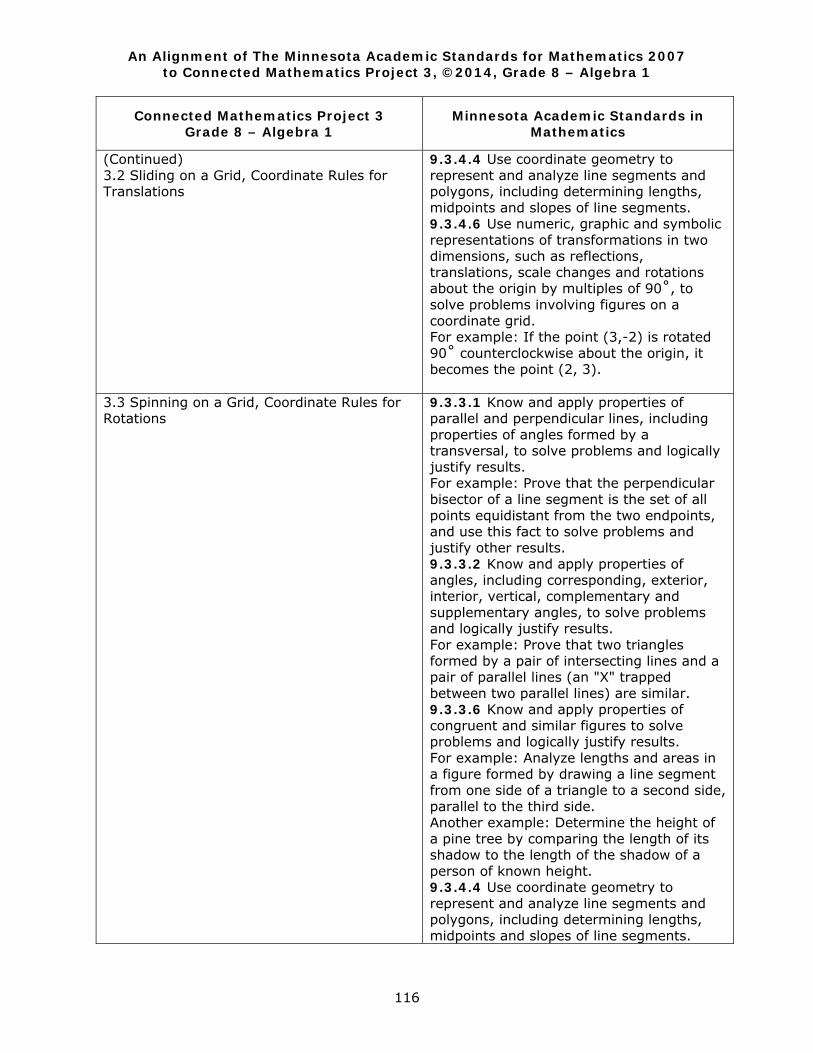
An Alignment of The Minnesota Academic Standards for Mathematics 2007 to Connected Mathematics Project 3, ©2014, Grade 8 – Algebra 1
116
Connected Mathematics Project 3 Grade 8 – Algebra 1
Minnesota Academic Standards in Mathematics
(Continued) 3.2 Sliding on a Grid, Coordinate Rules for Translations
9.3.4.4 Use coordinate geometry to represent and analyze line segments and polygons, including determining lengths, midpoints and slopes of line segments. 9.3.4.6 Use numeric, graphic and symbolic representations of transformations in two dimensions, such as reflections, translations, scale changes and rotations about the origin by multiples of 90˚, to solve problems involving figures on a coordinate grid. For example: If the point (3,-2) is rotated 90˚ counterclockwise about the origin, it becomes the point (2, 3).
3.3 Spinning on a Grid, Coordinate Rules for Rotations
9.3.3.1 Know and apply properties of parallel and perpendicular lines, including properties of angles formed by a transversal, to solve problems and logically justify results. For example: Prove that the perpendicular bisector of a line segment is the set of all points equidistant from the two endpoints, and use this fact to solve problems and justify other results. 9.3.3.2 Know and apply properties of angles, including corresponding, exterior, interior, vertical, complementary and supplementary angles, to solve problems and logically justify results. For example: Prove that two triangles formed by a pair of intersecting lines and a pair of parallel lines (an "X" trapped between two parallel lines) are similar. 9.3.3.6 Know and apply properties of congruent and similar figures to solve problems and logically justify results. For example: Analyze lengths and areas in a figure formed by drawing a line segment from one side of a triangle to a second side, parallel to the third side. Another example: Determine the height of a pine tree by comparing the length of its shadow to the length of the shadow of a person of known height. 9.3.4.4 Use coordinate geometry to represent and analyze line segments and polygons, including determining lengths, midpoints and slopes of line segments.
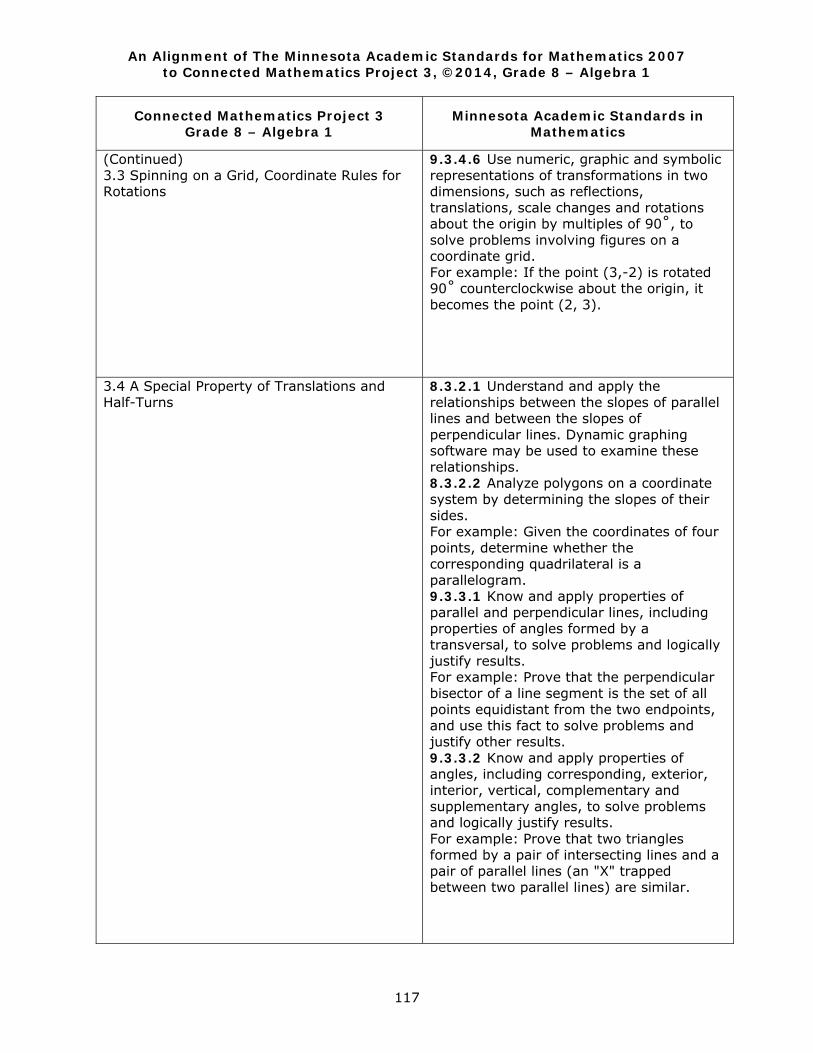
An Alignment of The Minnesota Academic Standards for Mathematics 2007 to Connected Mathematics Project 3, ©2014, Grade 8 – Algebra 1
117
Connected Mathematics Project 3 Grade 8 – Algebra 1
Minnesota Academic Standards in Mathematics
(Continued) 3.3 Spinning on a Grid, Coordinate Rules for Rotations
9.3.4.6 Use numeric, graphic and symbolic representations of transformations in two dimensions, such as reflections, translations, scale changes and rotations about the origin by multiples of 90˚, to solve problems involving figures on a coordinate grid. For example: If the point (3,-2) is rotated 90˚ counterclockwise about the origin, it becomes the point (2, 3).
3.4 A Special Property of Translations and Half-Turns
8.3.2.1 Understand and apply the relationships between the slopes of parallel lines and between the slopes of perpendicular lines. Dynamic graphing software may be used to examine these relationships. 8.3.2.2 Analyze polygons on a coordinate system by determining the slopes of their sides. For example: Given the coordinates of four points, determine whether the corresponding quadrilateral is a parallelogram. 9.3.3.1 Know and apply properties of parallel and perpendicular lines, including properties of angles formed by a transversal, to solve problems and logically justify results. For example: Prove that the perpendicular bisector of a line segment is the set of all points equidistant from the two endpoints, and use this fact to solve problems and justify other results. 9.3.3.2 Know and apply properties of angles, including corresponding, exterior, interior, vertical, complementary and supplementary angles, to solve problems and logically justify results. For example: Prove that two triangles formed by a pair of intersecting lines and a pair of parallel lines (an "X" trapped between two parallel lines) are similar.
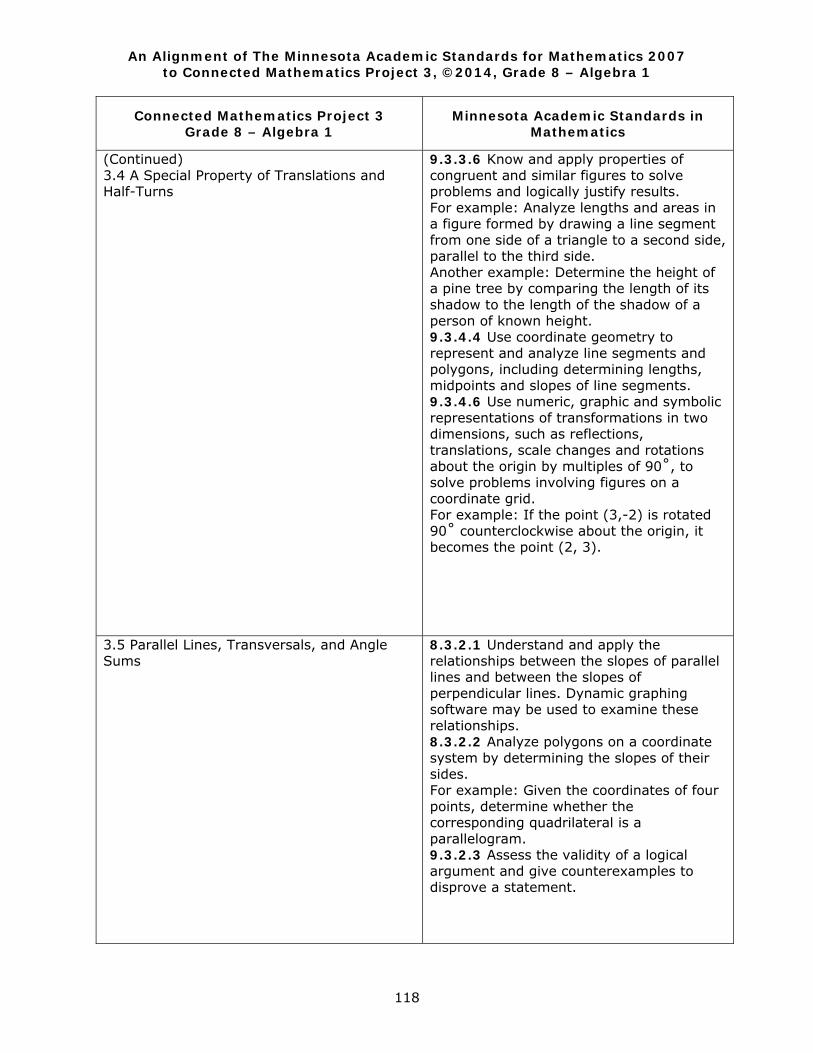
An Alignment of The Minnesota Academic Standards for Mathematics 2007 to Connected Mathematics Project 3, ©2014, Grade 8 – Algebra 1
118
Connected Mathematics Project 3 Grade 8 – Algebra 1
Minnesota Academic Standards in Mathematics
(Continued) 3.4 A Special Property of Translations and Half-Turns
9.3.3.6 Know and apply properties of congruent and similar figures to solve problems and logically justify results. For example: Analyze lengths and areas in a figure formed by drawing a line segment from one side of a triangle to a second side, parallel to the third side. Another example: Determine the height of a pine tree by comparing the length of its shadow to the length of the shadow of a person of known height. 9.3.4.4 Use coordinate geometry to represent and analyze line segments and polygons, including determining lengths, midpoints and slopes of line segments. 9.3.4.6 Use numeric, graphic and symbolic representations of transformations in two dimensions, such as reflections, translations, scale changes and rotations about the origin by multiples of 90˚, to solve problems involving figures on a coordinate grid. For example: If the point (3,-2) is rotated 90˚ counterclockwise about the origin, it becomes the point (2, 3).
3.5 Parallel Lines, Transversals, and Angle Sums
8.3.2.1 Understand and apply the relationships between the slopes of parallel lines and between the slopes of perpendicular lines. Dynamic graphing software may be used to examine these relationships. 8.3.2.2 Analyze polygons on a coordinate system by determining the slopes of their sides. For example: Given the coordinates of four points, determine whether the corresponding quadrilateral is a parallelogram. 9.3.2.3 Assess the validity of a logical argument and give counterexamples to disprove a statement.
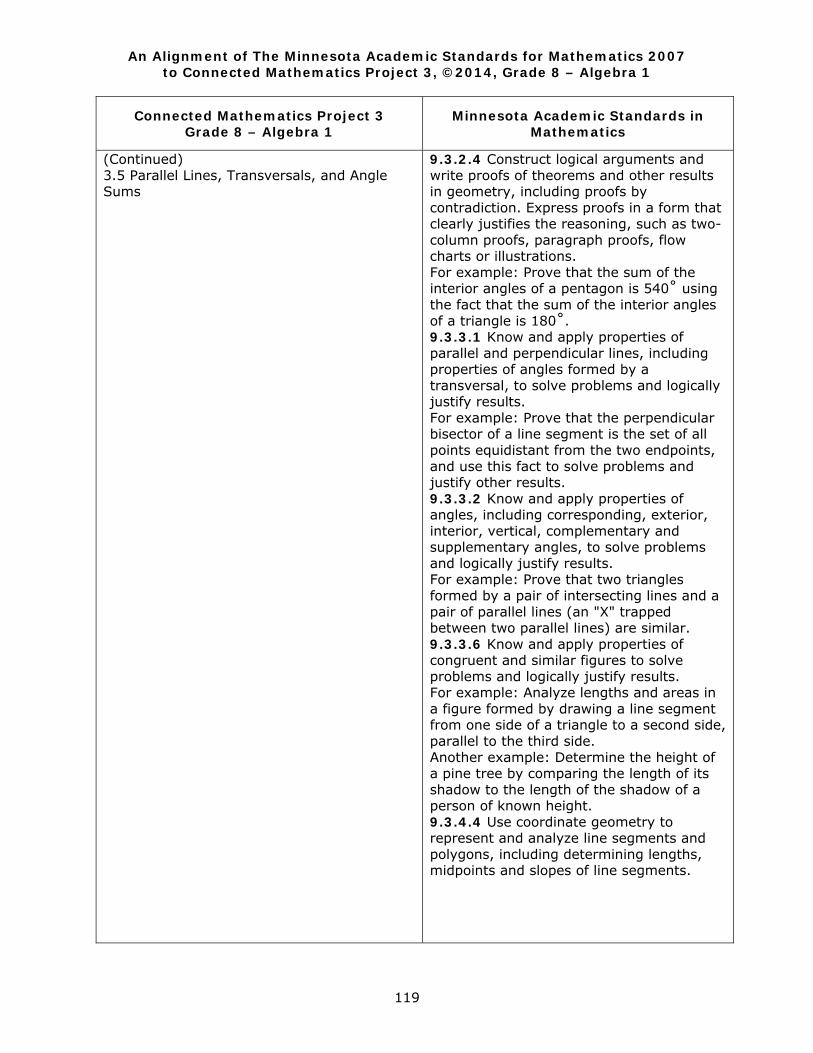
An Alignment of The Minnesota Academic Standards for Mathematics 2007 to Connected Mathematics Project 3, ©2014, Grade 8 – Algebra 1
119
Connected Mathematics Project 3 Grade 8 – Algebra 1
Minnesota Academic Standards in Mathematics
(Continued) 3.5 Parallel Lines, Transversals, and Angle Sums
9.3.2.4 Construct logical arguments and write proofs of theorems and other results in geometry, including proofs by contradiction. Express proofs in a form that clearly justifies the reasoning, such as two-column proofs, paragraph proofs, flow charts or illustrations. For example: Prove that the sum of the interior angles of a pentagon is 540˚ using the fact that the sum of the interior angles of a triangle is 180˚. 9.3.3.1 Know and apply properties of parallel and perpendicular lines, including properties of angles formed by a transversal, to solve problems and logically justify results. For example: Prove that the perpendicular bisector of a line segment is the set of all points equidistant from the two endpoints, and use this fact to solve problems and justify other results. 9.3.3.2 Know and apply properties of angles, including corresponding, exterior, interior, vertical, complementary and supplementary angles, to solve problems and logically justify results. For example: Prove that two triangles formed by a pair of intersecting lines and a pair of parallel lines (an "X" trapped between two parallel lines) are similar. 9.3.3.6 Know and apply properties of congruent and similar figures to solve problems and logically justify results. For example: Analyze lengths and areas in a figure formed by drawing a line segment from one side of a triangle to a second side, parallel to the third side. Another example: Determine the height of a pine tree by comparing the length of its shadow to the length of the shadow of a person of known height. 9.3.4.4 Use coordinate geometry to represent and analyze line segments and polygons, including determining lengths, midpoints and slopes of line segments.
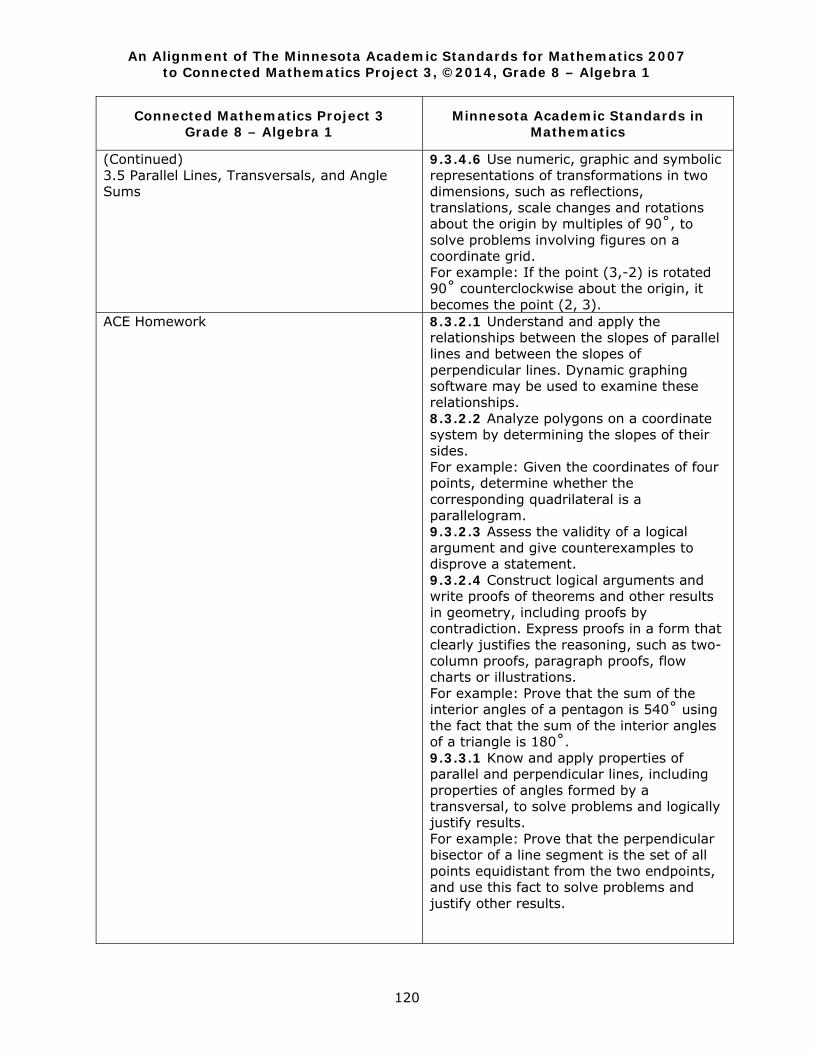
An Alignment of The Minnesota Academic Standards for Mathematics 2007 to Connected Mathematics Project 3, ©2014, Grade 8 – Algebra 1
120
Connected Mathematics Project 3 Grade 8 – Algebra 1
Minnesota Academic Standards in Mathematics
(Continued) 3.5 Parallel Lines, Transversals, and Angle Sums
9.3.4.6 Use numeric, graphic and symbolic representations of transformations in two dimensions, such as reflections, translations, scale changes and rotations about the origin by multiples of 90˚, to solve problems involving figures on a coordinate grid. For example: If the point (3,-2) is rotated 90˚ counterclockwise about the origin, it becomes the point (2, 3).
ACE Homework
8.3.2.1 Understand and apply the relationships between the slopes of parallel lines and between the slopes of perpendicular lines. Dynamic graphing software may be used to examine these relationships. 8.3.2.2 Analyze polygons on a coordinate system by determining the slopes of their sides. For example: Given the coordinates of four points, determine whether the corresponding quadrilateral is a parallelogram. 9.3.2.3 Assess the validity of a logical argument and give counterexamples to disprove a statement. 9.3.2.4 Construct logical arguments and write proofs of theorems and other results in geometry, including proofs by contradiction. Express proofs in a form that clearly justifies the reasoning, such as two-column proofs, paragraph proofs, flow charts or illustrations. For example: Prove that the sum of the interior angles of a pentagon is 540˚ using the fact that the sum of the interior angles of a triangle is 180˚. 9.3.3.1 Know and apply properties of parallel and perpendicular lines, including properties of angles formed by a transversal, to solve problems and logically justify results. For example: Prove that the perpendicular bisector of a line segment is the set of all points equidistant from the two endpoints, and use this fact to solve problems and justify other results.
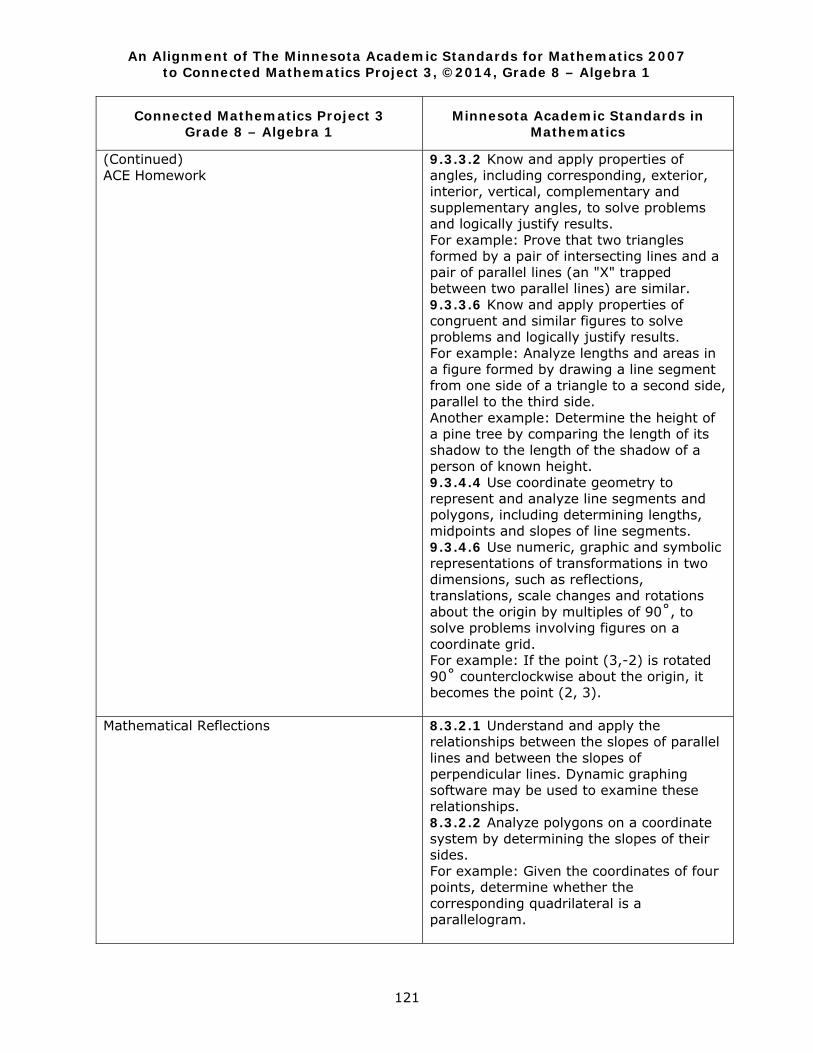
An Alignment of The Minnesota Academic Standards for Mathematics 2007 to Connected Mathematics Project 3, ©2014, Grade 8 – Algebra 1
121
Connected Mathematics Project 3 Grade 8 – Algebra 1
Minnesota Academic Standards in Mathematics
(Continued) ACE Homework
9.3.3.2 Know and apply properties of angles, including corresponding, exterior, interior, vertical, complementary and supplementary angles, to solve problems and logically justify results. For example: Prove that two triangles formed by a pair of intersecting lines and a pair of parallel lines (an "X" trapped between two parallel lines) are similar. 9.3.3.6 Know and apply properties of congruent and similar figures to solve problems and logically justify results. For example: Analyze lengths and areas in a figure formed by drawing a line segment from one side of a triangle to a second side, parallel to the third side. Another example: Determine the height of a pine tree by comparing the length of its shadow to the length of the shadow of a person of known height. 9.3.4.4 Use coordinate geometry to represent and analyze line segments and polygons, including determining lengths, midpoints and slopes of line segments. 9.3.4.6 Use numeric, graphic and symbolic representations of transformations in two dimensions, such as reflections, translations, scale changes and rotations about the origin by multiples of 90˚, to solve problems involving figures on a coordinate grid. For example: If the point (3,-2) is rotated 90˚ counterclockwise about the origin, it becomes the point (2, 3).
Mathematical Reflections
8.3.2.1 Understand and apply the relationships between the slopes of parallel lines and between the slopes of perpendicular lines. Dynamic graphing software may be used to examine these relationships. 8.3.2.2 Analyze polygons on a coordinate system by determining the slopes of their sides. For example: Given the coordinates of four points, determine whether the corresponding quadrilateral is a parallelogram.
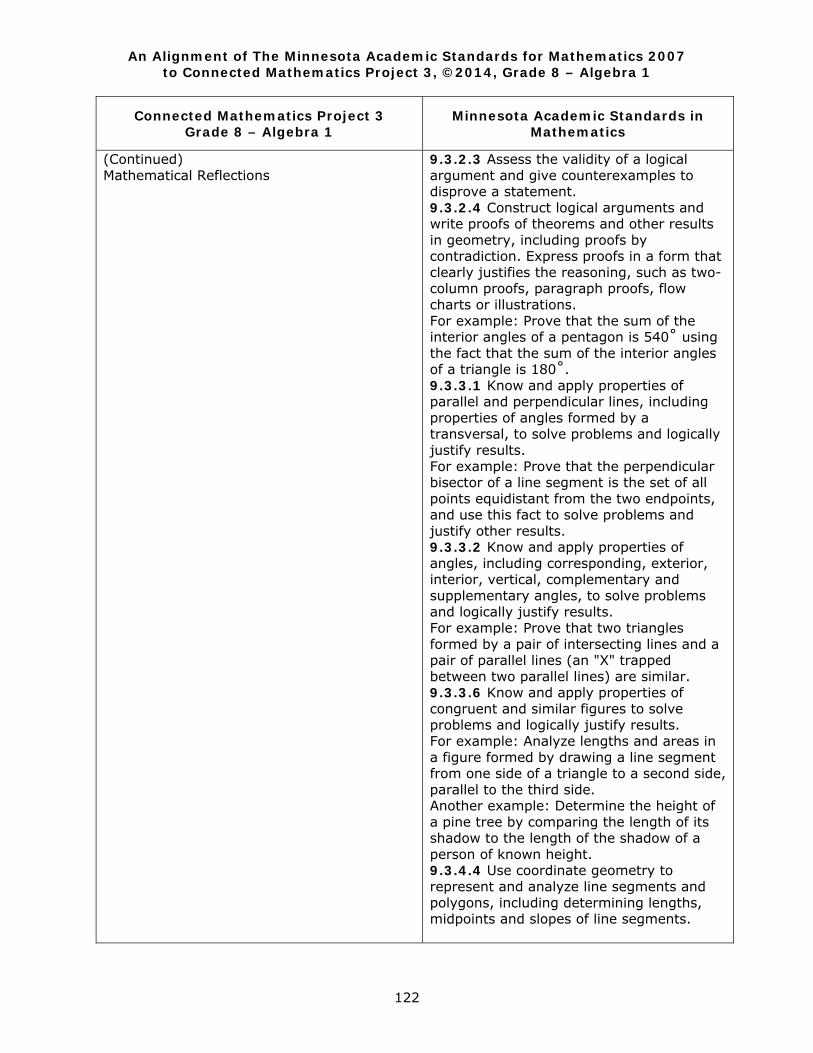
An Alignment of The Minnesota Academic Standards for Mathematics 2007 to Connected Mathematics Project 3, ©2014, Grade 8 – Algebra 1
122
Connected Mathematics Project 3 Grade 8 – Algebra 1
Minnesota Academic Standards in Mathematics
(Continued) Mathematical Reflections
9.3.2.3 Assess the validity of a logical argument and give counterexamples to disprove a statement. 9.3.2.4 Construct logical arguments and write proofs of theorems and other results in geometry, including proofs by contradiction. Express proofs in a form that clearly justifies the reasoning, such as two-column proofs, paragraph proofs, flow charts or illustrations. For example: Prove that the sum of the interior angles of a pentagon is 540˚ using the fact that the sum of the interior angles of a triangle is 180˚. 9.3.3.1 Know and apply properties of parallel and perpendicular lines, including properties of angles formed by a transversal, to solve problems and logically justify results. For example: Prove that the perpendicular bisector of a line segment is the set of all points equidistant from the two endpoints, and use this fact to solve problems and justify other results. 9.3.3.2 Know and apply properties of angles, including corresponding, exterior, interior, vertical, complementary and supplementary angles, to solve problems and logically justify results. For example: Prove that two triangles formed by a pair of intersecting lines and a pair of parallel lines (an "X" trapped between two parallel lines) are similar. 9.3.3.6 Know and apply properties of congruent and similar figures to solve problems and logically justify results. For example: Analyze lengths and areas in a figure formed by drawing a line segment from one side of a triangle to a second side, parallel to the third side. Another example: Determine the height of a pine tree by comparing the length of its shadow to the length of the shadow of a person of known height. 9.3.4.4 Use coordinate geometry to represent and analyze line segments and polygons, including determining lengths, midpoints and slopes of line segments.
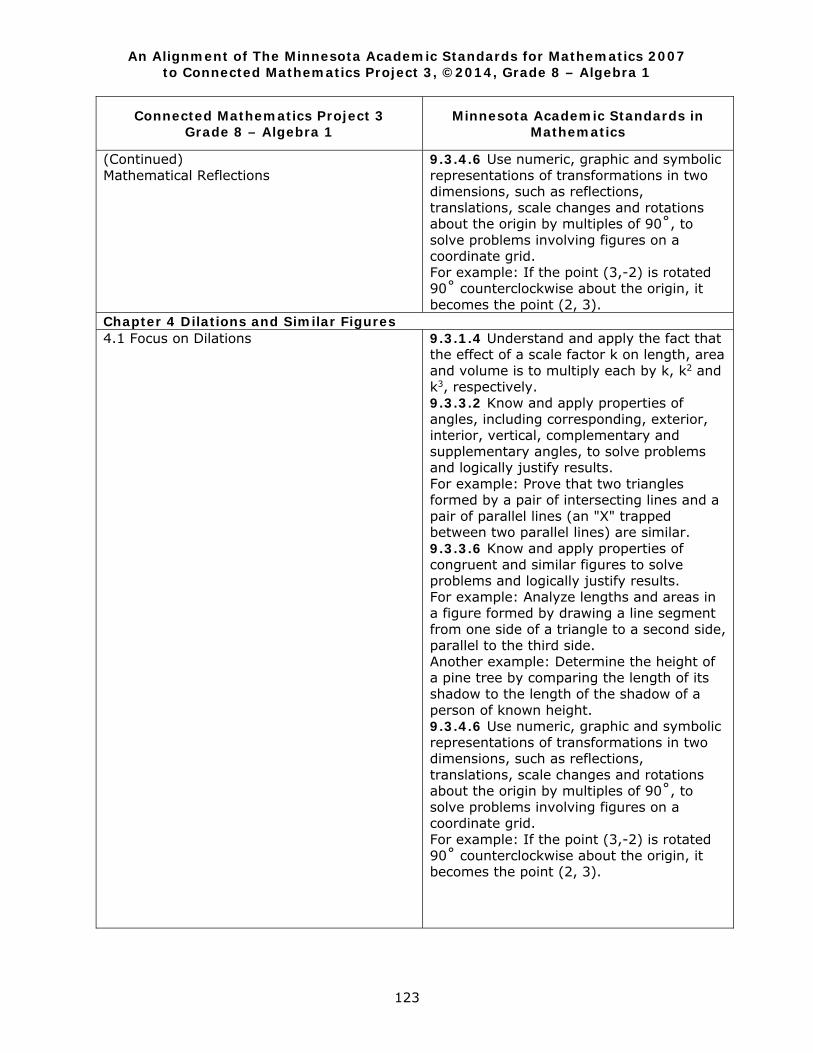
An Alignment of The Minnesota Academic Standards for Mathematics 2007 to Connected Mathematics Project 3, ©2014, Grade 8 – Algebra 1
123
Connected Mathematics Project 3 Grade 8 – Algebra 1
Minnesota Academic Standards in Mathematics
(Continued) Mathematical Reflections
9.3.4.6 Use numeric, graphic and symbolic representations of transformations in two dimensions, such as reflections, translations, scale changes and rotations about the origin by multiples of 90˚, to solve problems involving figures on a coordinate grid. For example: If the point (3,-2) is rotated 90˚ counterclockwise about the origin, it becomes the point (2, 3).
Chapter 4 Dilations and Similar Figures 4.1 Focus on Dilations
9.3.1.4 Understand and apply the fact that the effect of a scale factor k on length, area and volume is to multiply each by k, k2 and k3, respectively. 9.3.3.2 Know and apply properties of angles, including corresponding, exterior, interior, vertical, complementary and supplementary angles, to solve problems and logically justify results. For example: Prove that two triangles formed by a pair of intersecting lines and a pair of parallel lines (an "X" trapped between two parallel lines) are similar. 9.3.3.6 Know and apply properties of congruent and similar figures to solve problems and logically justify results. For example: Analyze lengths and areas in a figure formed by drawing a line segment from one side of a triangle to a second side, parallel to the third side. Another example: Determine the height of a pine tree by comparing the length of its shadow to the length of the shadow of a person of known height. 9.3.4.6 Use numeric, graphic and symbolic representations of transformations in two dimensions, such as reflections, translations, scale changes and rotations about the origin by multiples of 90˚, to solve problems involving figures on a coordinate grid. For example: If the point (3,-2) is rotated 90˚ counterclockwise about the origin, it becomes the point (2, 3).
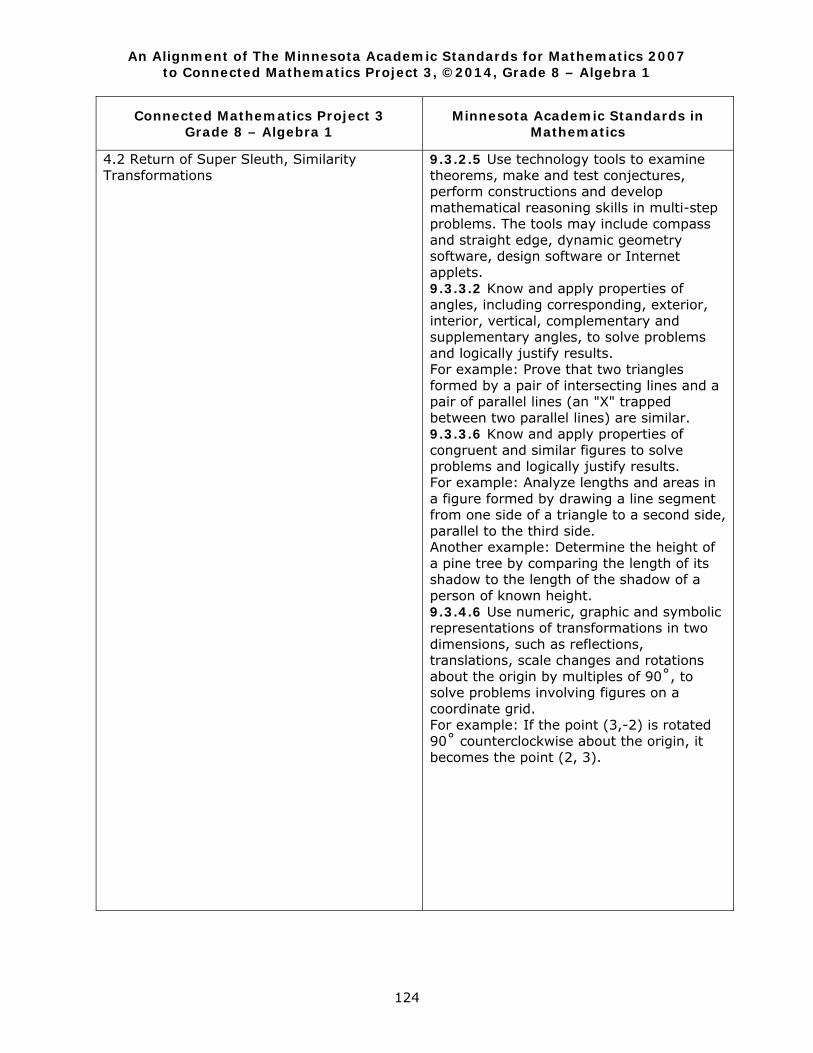
An Alignment of The Minnesota Academic Standards for Mathematics 2007 to Connected Mathematics Project 3, ©2014, Grade 8 – Algebra 1
124
Connected Mathematics Project 3 Grade 8 – Algebra 1
Minnesota Academic Standards in Mathematics
4.2 Return of Super Sleuth, Similarity Transformations
9.3.2.5 Use technology tools to examine theorems, make and test conjectures, perform constructions and develop mathematical reasoning skills in multi-step problems. The tools may include compass and straight edge, dynamic geometry software, design software or Internet applets. 9.3.3.2 Know and apply properties of angles, including corresponding, exterior, interior, vertical, complementary and supplementary angles, to solve problems and logically justify results. For example: Prove that two triangles formed by a pair of intersecting lines and a pair of parallel lines (an "X" trapped between two parallel lines) are similar. 9.3.3.6 Know and apply properties of congruent and similar figures to solve problems and logically justify results. For example: Analyze lengths and areas in a figure formed by drawing a line segment from one side of a triangle to a second side, parallel to the third side. Another example: Determine the height of a pine tree by comparing the length of its shadow to the length of the shadow of a person of known height. 9.3.4.6 Use numeric, graphic and symbolic representations of transformations in two dimensions, such as reflections, translations, scale changes and rotations about the origin by multiples of 90˚, to solve problems involving figures on a coordinate grid. For example: If the point (3,-2) is rotated 90˚ counterclockwise about the origin, it becomes the point (2, 3).

An Alignment of The Minnesota Academic Standards for Mathematics 2007 to Connected Mathematics Project 3, ©2014, Grade 8 – Algebra 1
125
Connected Mathematics Project 3 Grade 8 – Algebra 1
Minnesota Academic Standards in Mathematics
4.3 Checking Similarity Without Transformations
9.3.2.3 Assess the validity of a logical argument and give counterexamples to disprove a statement. 9.3.2.4 Construct logical arguments and write proofs of theorems and other results in geometry, including proofs by contradiction. Express proofs in a form that clearly justifies the reasoning, such as two-column proofs, paragraph proofs, flow charts or illustrations. For example: Prove that the sum of the interior angles of a pentagon is 540˚ using the fact that the sum of the interior angles of a triangle is 180˚. 9.3.3.2 Know and apply properties of angles, including corresponding, exterior, interior, vertical, complementary and supplementary angles, to solve problems and logically justify results. For example: Prove that two triangles formed by a pair of intersecting lines and a pair of parallel lines (an "X" trapped between two parallel lines) are similar. 9.3.3.6 Know and apply properties of congruent and similar figures to solve problems and logically justify results. For example: Analyze lengths and areas in a figure formed by drawing a line segment from one side of a triangle to a second side, parallel to the third side. Another example: Determine the height of a pine tree by comparing the length of its shadow to the length of the shadow of a person of known height. 9.3.4.6 Use numeric, graphic and symbolic representations of transformations in two dimensions, such as reflections, translations, scale changes and rotations about the origin by multiples of 90˚, to solve problems involving figures on a coordinate grid. For example: If the point (3,-2) is rotated 90˚ counterclockwise about the origin, it becomes the point (2, 3).
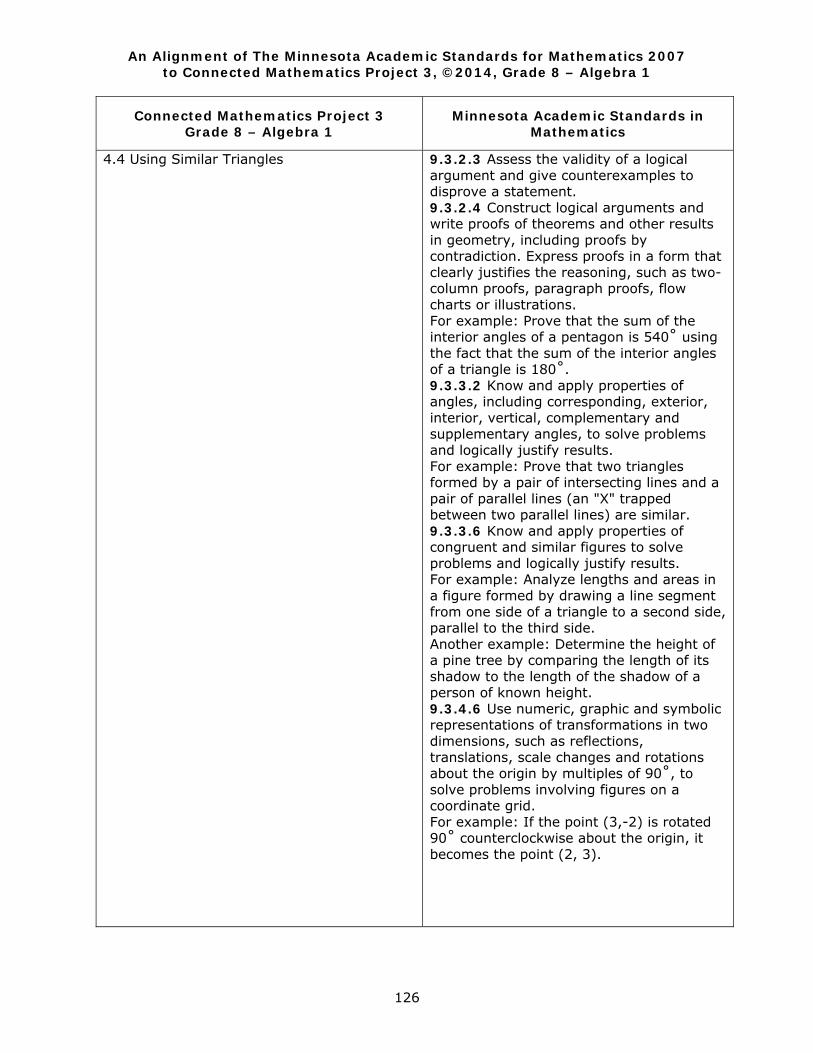
An Alignment of The Minnesota Academic Standards for Mathematics 2007 to Connected Mathematics Project 3, ©2014, Grade 8 – Algebra 1
126
Connected Mathematics Project 3 Grade 8 – Algebra 1
Minnesota Academic Standards in Mathematics
4.4 Using Similar Triangles
9.3.2.3 Assess the validity of a logical argument and give counterexamples to disprove a statement. 9.3.2.4 Construct logical arguments and write proofs of theorems and other results in geometry, including proofs by contradiction. Express proofs in a form that clearly justifies the reasoning, such as two-column proofs, paragraph proofs, flow charts or illustrations. For example: Prove that the sum of the interior angles of a pentagon is 540˚ using the fact that the sum of the interior angles of a triangle is 180˚. 9.3.3.2 Know and apply properties of angles, including corresponding, exterior, interior, vertical, complementary and supplementary angles, to solve problems and logically justify results. For example: Prove that two triangles formed by a pair of intersecting lines and a pair of parallel lines (an "X" trapped between two parallel lines) are similar. 9.3.3.6 Know and apply properties of congruent and similar figures to solve problems and logically justify results. For example: Analyze lengths and areas in a figure formed by drawing a line segment from one side of a triangle to a second side, parallel to the third side. Another example: Determine the height of a pine tree by comparing the length of its shadow to the length of the shadow of a person of known height. 9.3.4.6 Use numeric, graphic and symbolic representations of transformations in two dimensions, such as reflections, translations, scale changes and rotations about the origin by multiples of 90˚, to solve problems involving figures on a coordinate grid. For example: If the point (3,-2) is rotated 90˚ counterclockwise about the origin, it becomes the point (2, 3).
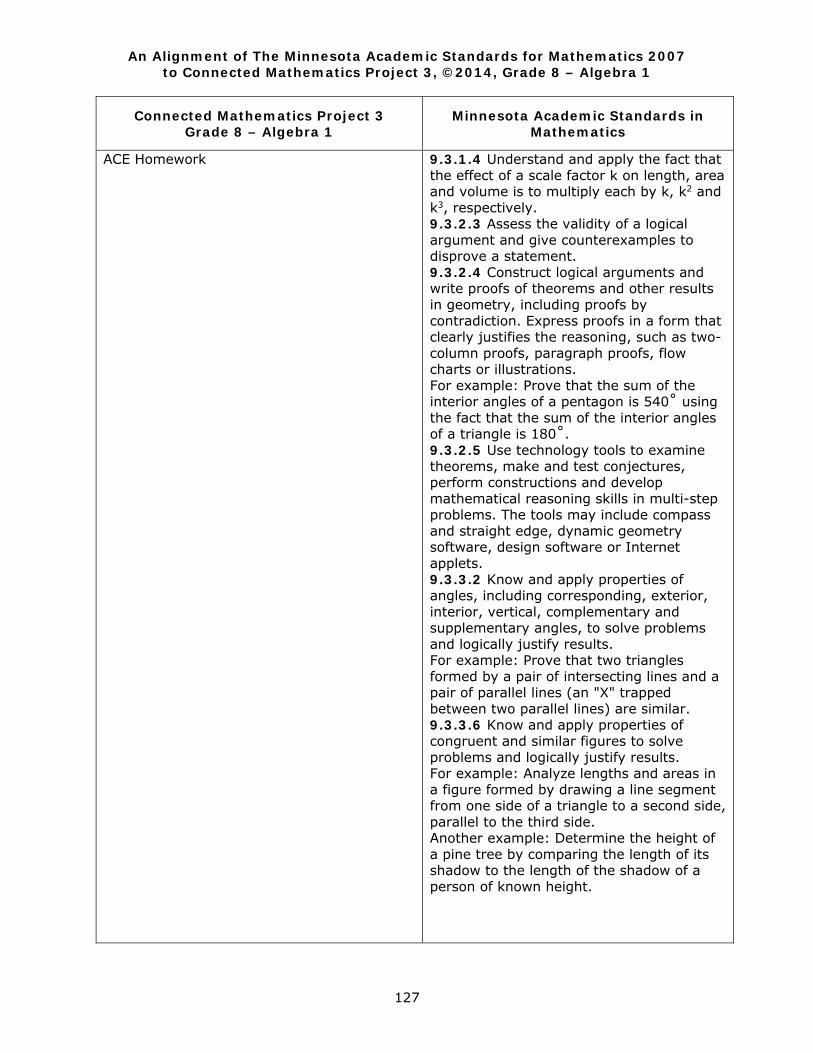
An Alignment of The Minnesota Academic Standards for Mathematics 2007 to Connected Mathematics Project 3, ©2014, Grade 8 – Algebra 1
127
Connected Mathematics Project 3 Grade 8 – Algebra 1
Minnesota Academic Standards in Mathematics
ACE Homework
9.3.1.4 Understand and apply the fact that the effect of a scale factor k on length, area and volume is to multiply each by k, k2 and k3, respectively. 9.3.2.3 Assess the validity of a logical argument and give counterexamples to disprove a statement. 9.3.2.4 Construct logical arguments and write proofs of theorems and other results in geometry, including proofs by contradiction. Express proofs in a form that clearly justifies the reasoning, such as two-column proofs, paragraph proofs, flow charts or illustrations. For example: Prove that the sum of the interior angles of a pentagon is 540˚ using the fact that the sum of the interior angles of a triangle is 180˚. 9.3.2.5 Use technology tools to examine theorems, make and test conjectures, perform constructions and develop mathematical reasoning skills in multi-step problems. The tools may include compass and straight edge, dynamic geometry software, design software or Internet applets. 9.3.3.2 Know and apply properties of angles, including corresponding, exterior, interior, vertical, complementary and supplementary angles, to solve problems and logically justify results. For example: Prove that two triangles formed by a pair of intersecting lines and a pair of parallel lines (an "X" trapped between two parallel lines) are similar. 9.3.3.6 Know and apply properties of congruent and similar figures to solve problems and logically justify results. For example: Analyze lengths and areas in a figure formed by drawing a line segment from one side of a triangle to a second side, parallel to the third side. Another example: Determine the height of a pine tree by comparing the length of its shadow to the length of the shadow of a person of known height.
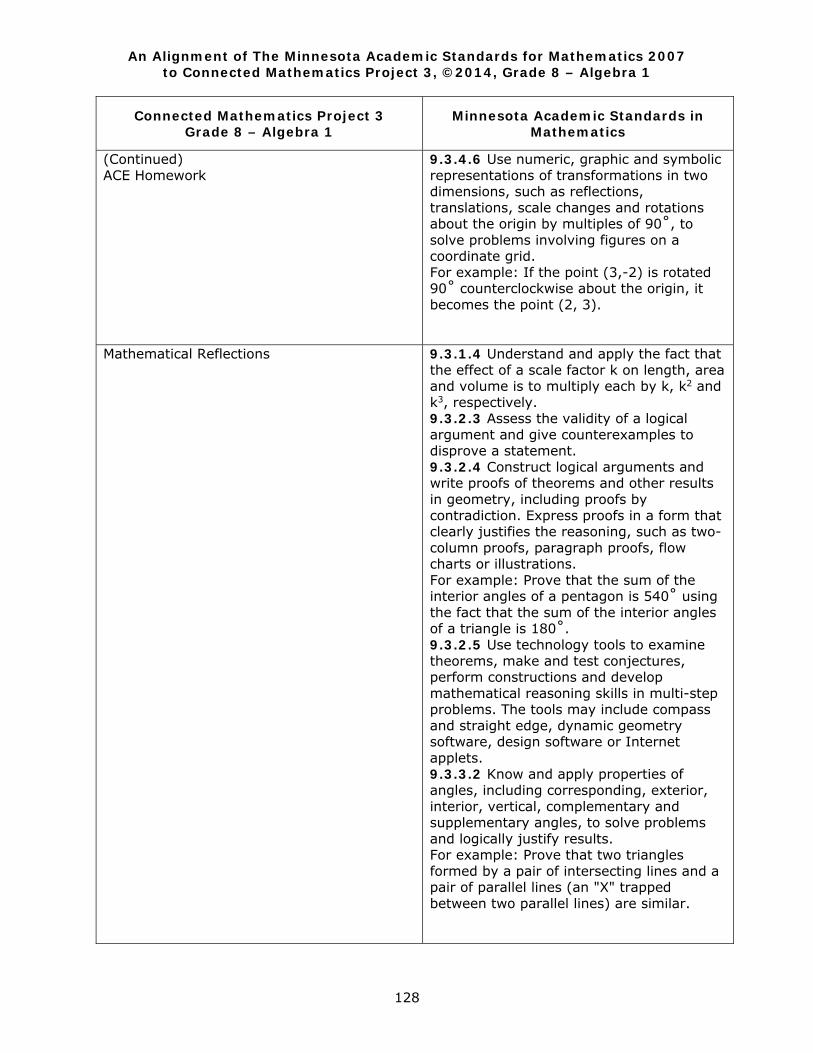
An Alignment of The Minnesota Academic Standards for Mathematics 2007 to Connected Mathematics Project 3, ©2014, Grade 8 – Algebra 1
128
Connected Mathematics Project 3 Grade 8 – Algebra 1
Minnesota Academic Standards in Mathematics
(Continued) ACE Homework
9.3.4.6 Use numeric, graphic and symbolic representations of transformations in two dimensions, such as reflections, translations, scale changes and rotations about the origin by multiples of 90˚, to solve problems involving figures on a coordinate grid. For example: If the point (3,-2) is rotated 90˚ counterclockwise about the origin, it becomes the point (2, 3).
Mathematical Reflections
9.3.1.4 Understand and apply the fact that the effect of a scale factor k on length, area and volume is to multiply each by k, k2 and k3, respectively. 9.3.2.3 Assess the validity of a logical argument and give counterexamples to disprove a statement. 9.3.2.4 Construct logical arguments and write proofs of theorems and other results in geometry, including proofs by contradiction. Express proofs in a form that clearly justifies the reasoning, such as two-column proofs, paragraph proofs, flow charts or illustrations. For example: Prove that the sum of the interior angles of a pentagon is 540˚ using the fact that the sum of the interior angles of a triangle is 180˚. 9.3.2.5 Use technology tools to examine theorems, make and test conjectures, perform constructions and develop mathematical reasoning skills in multi-step problems. The tools may include compass and straight edge, dynamic geometry software, design software or Internet applets. 9.3.3.2 Know and apply properties of angles, including corresponding, exterior, interior, vertical, complementary and supplementary angles, to solve problems and logically justify results. For example: Prove that two triangles formed by a pair of intersecting lines and a pair of parallel lines (an "X" trapped between two parallel lines) are similar.
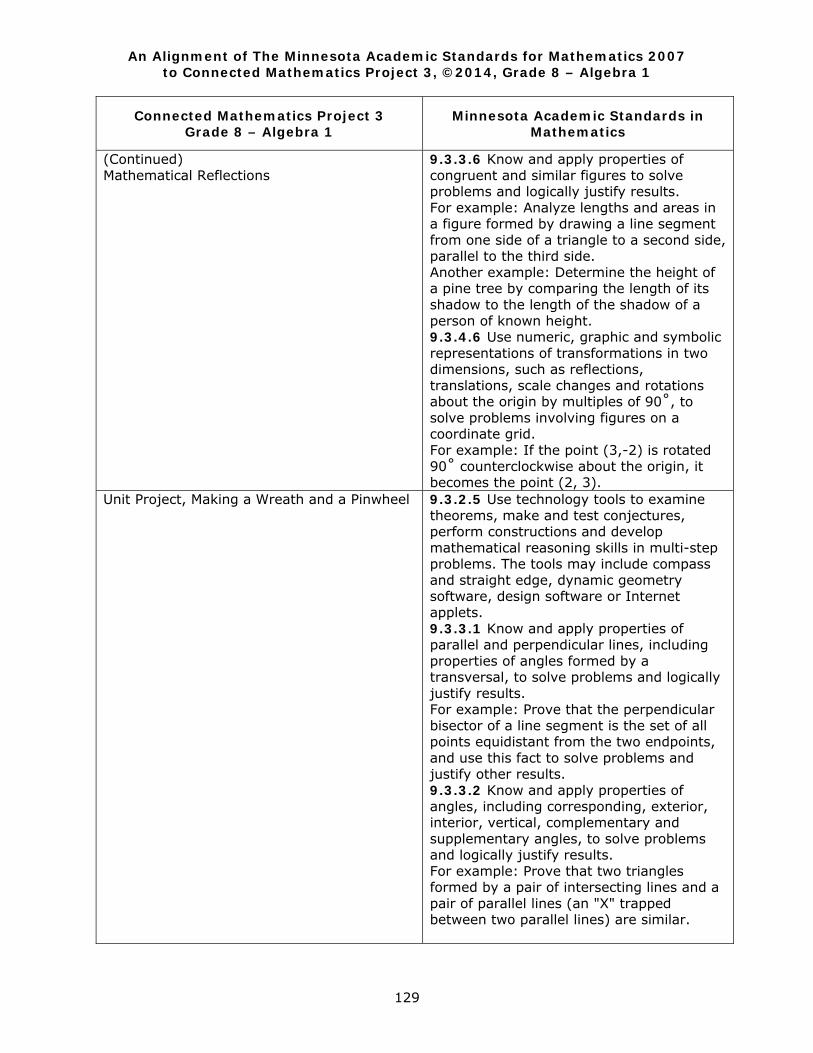
An Alignment of The Minnesota Academic Standards for Mathematics 2007 to Connected Mathematics Project 3, ©2014, Grade 8 – Algebra 1
129
Connected Mathematics Project 3 Grade 8 – Algebra 1
Minnesota Academic Standards in Mathematics
(Continued) Mathematical Reflections
9.3.3.6 Know and apply properties of congruent and similar figures to solve problems and logically justify results. For example: Analyze lengths and areas in a figure formed by drawing a line segment from one side of a triangle to a second side, parallel to the third side. Another example: Determine the height of a pine tree by comparing the length of its shadow to the length of the shadow of a person of known height. 9.3.4.6 Use numeric, graphic and symbolic representations of transformations in two dimensions, such as reflections, translations, scale changes and rotations about the origin by multiples of 90˚, to solve problems involving figures on a coordinate grid. For example: If the point (3,-2) is rotated 90˚ counterclockwise about the origin, it becomes the point (2, 3).
Unit Project, Making a Wreath and a Pinwheel
9.3.2.5 Use technology tools to examine theorems, make and test conjectures, perform constructions and develop mathematical reasoning skills in multi-step problems. The tools may include compass and straight edge, dynamic geometry software, design software or Internet applets. 9.3.3.1 Know and apply properties of parallel and perpendicular lines, including properties of angles formed by a transversal, to solve problems and logically justify results. For example: Prove that the perpendicular bisector of a line segment is the set of all points equidistant from the two endpoints, and use this fact to solve problems and justify other results. 9.3.3.2 Know and apply properties of angles, including corresponding, exterior, interior, vertical, complementary and supplementary angles, to solve problems and logically justify results. For example: Prove that two triangles formed by a pair of intersecting lines and a pair of parallel lines (an "X" trapped between two parallel lines) are similar.
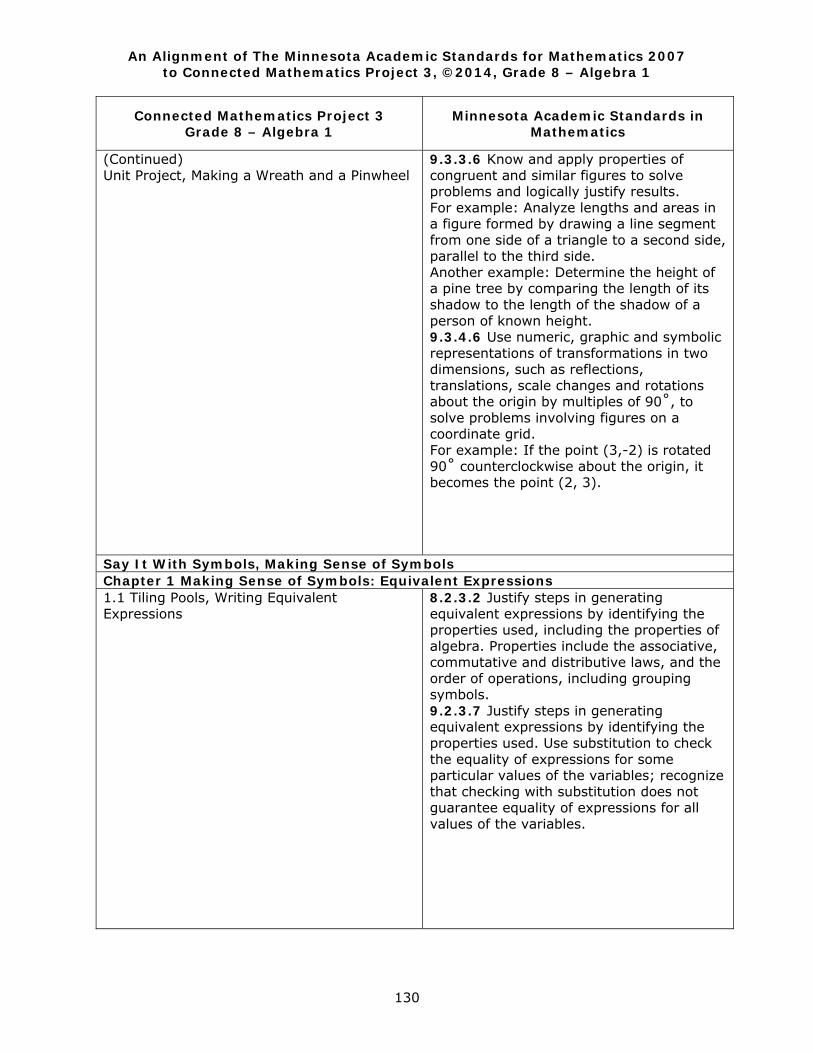
An Alignment of The Minnesota Academic Standards for Mathematics 2007 to Connected Mathematics Project 3, ©2014, Grade 8 – Algebra 1
130
Connected Mathematics Project 3 Grade 8 – Algebra 1
Minnesota Academic Standards in Mathematics
(Continued) Unit Project, Making a Wreath and a Pinwheel
9.3.3.6 Know and apply properties of congruent and similar figures to solve problems and logically justify results. For example: Analyze lengths and areas in a figure formed by drawing a line segment from one side of a triangle to a second side, parallel to the third side. Another example: Determine the height of a pine tree by comparing the length of its shadow to the length of the shadow of a person of known height. 9.3.4.6 Use numeric, graphic and symbolic representations of transformations in two dimensions, such as reflections, translations, scale changes and rotations about the origin by multiples of 90˚, to solve problems involving figures on a coordinate grid. For example: If the point (3,-2) is rotated 90˚ counterclockwise about the origin, it becomes the point (2, 3).
Say It With Symbols, Making Sense of Symbols Chapter 1 Making Sense of Symbols: Equivalent Expressions 1.1 Tiling Pools, Writing Equivalent Expressions
8.2.3.2 Justify steps in generating equivalent expressions by identifying the properties used, including the properties of algebra. Properties include the associative, commutative and distributive laws, and the order of operations, including grouping symbols. 9.2.3.7 Justify steps in generating equivalent expressions by identifying the properties used. Use substitution to check the equality of expressions for some particular values of the variables; recognize that checking with substitution does not guarantee equality of expressions for all values of the variables.
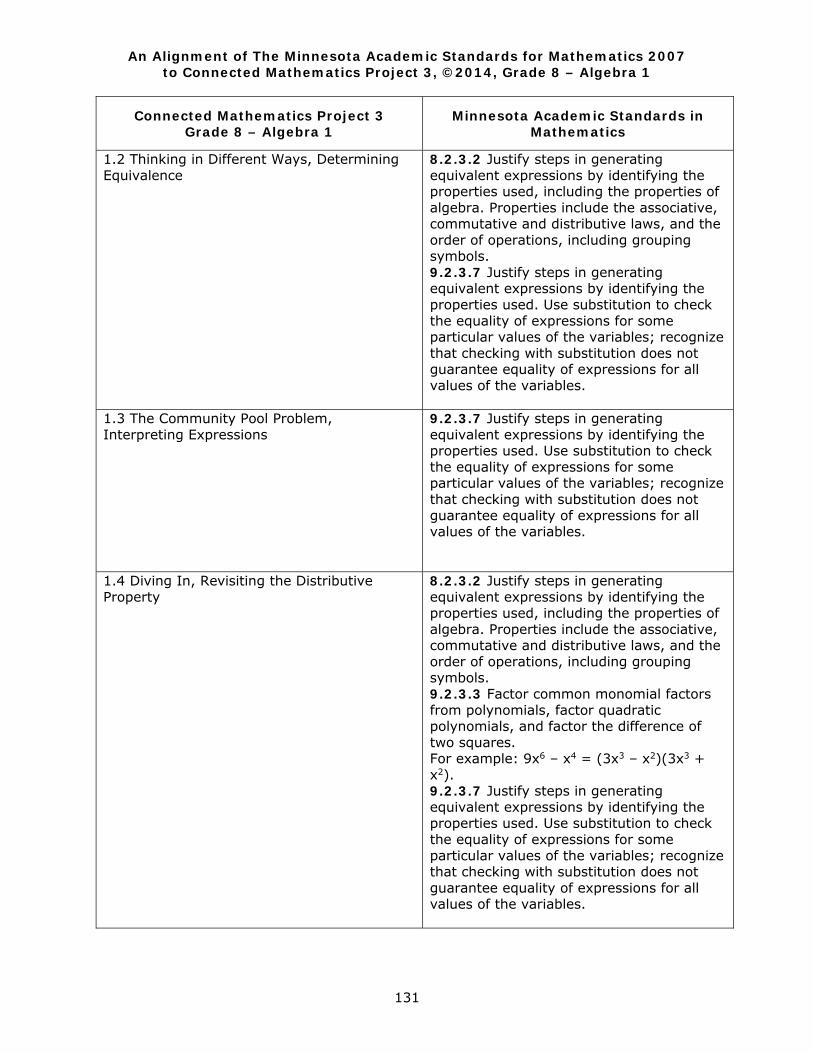
An Alignment of The Minnesota Academic Standards for Mathematics 2007 to Connected Mathematics Project 3, ©2014, Grade 8 – Algebra 1
131
Connected Mathematics Project 3 Grade 8 – Algebra 1
Minnesota Academic Standards in Mathematics
1.2 Thinking in Different Ways, Determining Equivalence
8.2.3.2 Justify steps in generating equivalent expressions by identifying the properties used, including the properties of algebra. Properties include the associative, commutative and distributive laws, and the order of operations, including grouping symbols. 9.2.3.7 Justify steps in generating equivalent expressions by identifying the properties used. Use substitution to check the equality of expressions for some particular values of the variables; recognize that checking with substitution does not guarantee equality of expressions for all values of the variables.
1.3 The Community Pool Problem, Interpreting Expressions
9.2.3.7 Justify steps in generating equivalent expressions by identifying the properties used. Use substitution to check the equality of expressions for some particular values of the variables; recognize that checking with substitution does not guarantee equality of expressions for all values of the variables.
1.4 Diving In, Revisiting the Distributive Property
8.2.3.2 Justify steps in generating equivalent expressions by identifying the properties used, including the properties of algebra. Properties include the associative, commutative and distributive laws, and the order of operations, including grouping symbols. 9.2.3.3 Factor common monomial factors from polynomials, factor quadratic polynomials, and factor the difference of two squares. For example: 9x6 – x4 = (3x3 – x2)(3x3 + x2). 9.2.3.7 Justify steps in generating equivalent expressions by identifying the properties used. Use substitution to check the equality of expressions for some particular values of the variables; recognize that checking with substitution does not guarantee equality of expressions for all values of the variables.
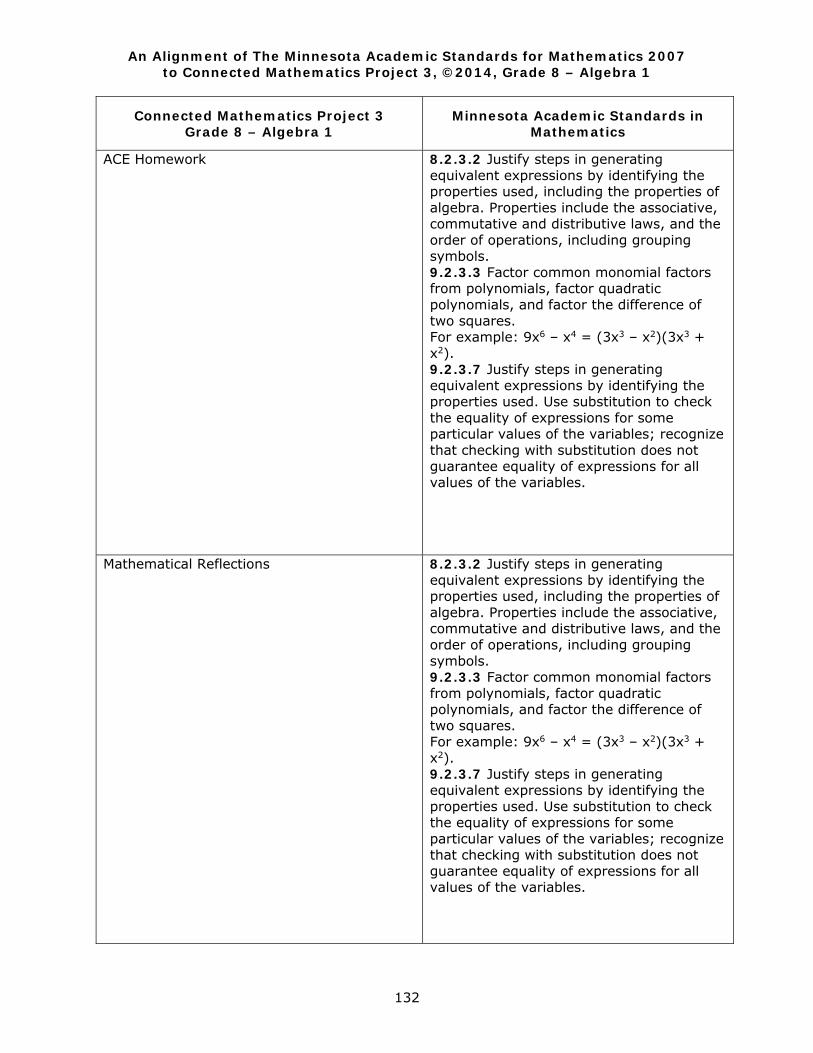
An Alignment of The Minnesota Academic Standards for Mathematics 2007 to Connected Mathematics Project 3, ©2014, Grade 8 – Algebra 1
132
Connected Mathematics Project 3 Grade 8 – Algebra 1
Minnesota Academic Standards in Mathematics
ACE Homework 8.2.3.2 Justify steps in generating equivalent expressions by identifying the properties used, including the properties of algebra. Properties include the associative, commutative and distributive laws, and the order of operations, including grouping symbols. 9.2.3.3 Factor common monomial factors from polynomials, factor quadratic polynomials, and factor the difference of two squares. For example: 9x6 – x4 = (3x3 – x2)(3x3 + x2). 9.2.3.7 Justify steps in generating equivalent expressions by identifying the properties used. Use substitution to check the equality of expressions for some particular values of the variables; recognize that checking with substitution does not guarantee equality of expressions for all values of the variables.
Mathematical Reflections 8.2.3.2 Justify steps in generating equivalent expressions by identifying the properties used, including the properties of algebra. Properties include the associative, commutative and distributive laws, and the order of operations, including grouping symbols. 9.2.3.3 Factor common monomial factors from polynomials, factor quadratic polynomials, and factor the difference of two squares. For example: 9x6 – x4 = (3x3 – x2)(3x3 + x2). 9.2.3.7 Justify steps in generating equivalent expressions by identifying the properties used. Use substitution to check the equality of expressions for some particular values of the variables; recognize that checking with substitution does not guarantee equality of expressions for all values of the variables.
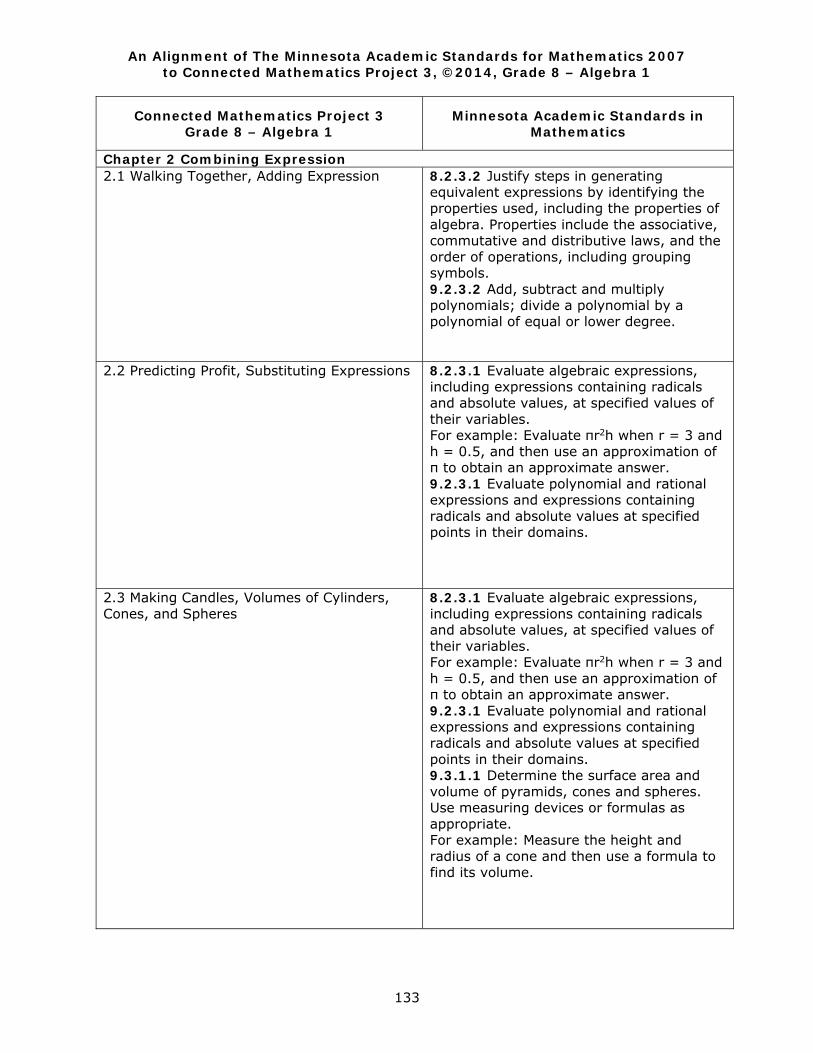
An Alignment of The Minnesota Academic Standards for Mathematics 2007 to Connected Mathematics Project 3, ©2014, Grade 8 – Algebra 1
133
Connected Mathematics Project 3 Grade 8 – Algebra 1
Minnesota Academic Standards in Mathematics
Chapter 2 Combining Expression 2.1 Walking Together, Adding Expression 8.2.3.2 Justify steps in generating
equivalent expressions by identifying the properties used, including the properties of algebra. Properties include the associative, commutative and distributive laws, and the order of operations, including grouping symbols. 9.2.3.2 Add, subtract and multiply polynomials; divide a polynomial by a polynomial of equal or lower degree.
2.2 Predicting Profit, Substituting Expressions 8.2.3.1 Evaluate algebraic expressions, including expressions containing radicals and absolute values, at specified values of their variables. For example: Evaluate πr2h when r = 3 and h = 0.5, and then use an approximation of π to obtain an approximate answer. 9.2.3.1 Evaluate polynomial and rational expressions and expressions containing radicals and absolute values at specified points in their domains.
2.3 Making Candles, Volumes of Cylinders, Cones, and Spheres
8.2.3.1 Evaluate algebraic expressions, including expressions containing radicals and absolute values, at specified values of their variables. For example: Evaluate πr2h when r = 3 and h = 0.5, and then use an approximation of π to obtain an approximate answer. 9.2.3.1 Evaluate polynomial and rational expressions and expressions containing radicals and absolute values at specified points in their domains. 9.3.1.1 Determine the surface area and volume of pyramids, cones and spheres. Use measuring devices or formulas as appropriate. For example: Measure the height and radius of a cone and then use a formula to find its volume.
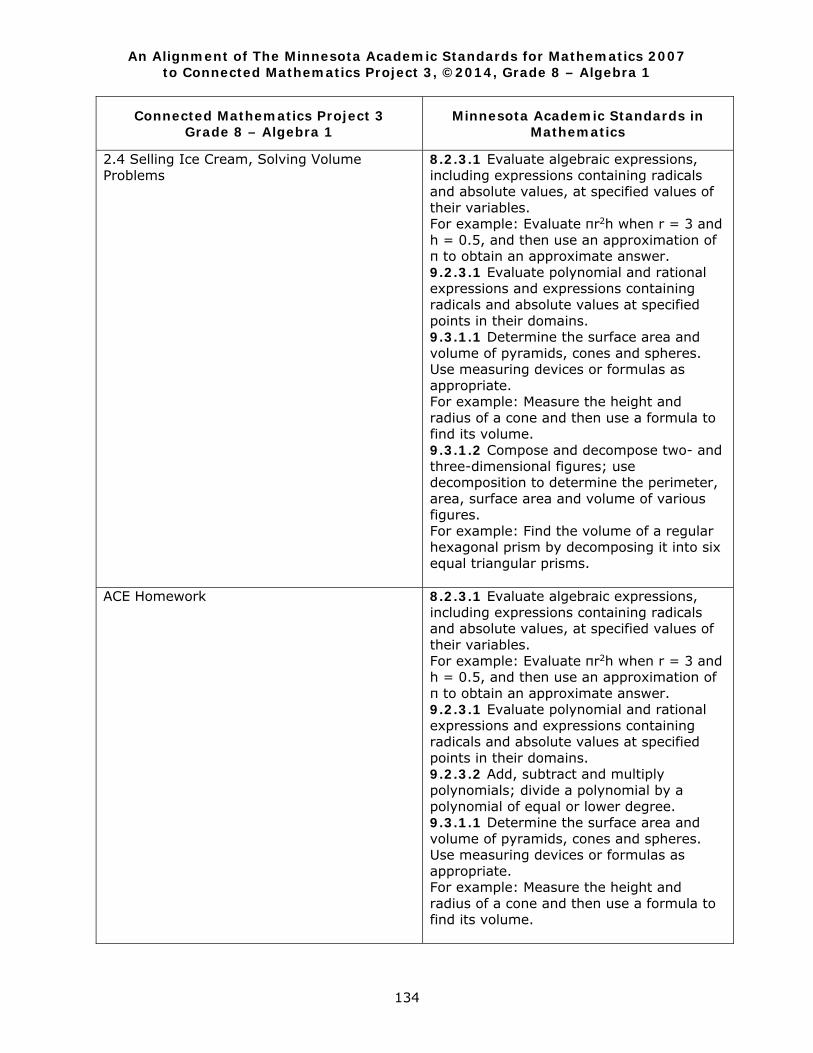
An Alignment of The Minnesota Academic Standards for Mathematics 2007 to Connected Mathematics Project 3, ©2014, Grade 8 – Algebra 1
134
Connected Mathematics Project 3 Grade 8 – Algebra 1
Minnesota Academic Standards in Mathematics
2.4 Selling Ice Cream, Solving Volume Problems
8.2.3.1 Evaluate algebraic expressions, including expressions containing radicals and absolute values, at specified values of their variables. For example: Evaluate πr2h when r = 3 and h = 0.5, and then use an approximation of π to obtain an approximate answer. 9.2.3.1 Evaluate polynomial and rational expressions and expressions containing radicals and absolute values at specified points in their domains. 9.3.1.1 Determine the surface area and volume of pyramids, cones and spheres. Use measuring devices or formulas as appropriate. For example: Measure the height and radius of a cone and then use a formula to find its volume. 9.3.1.2 Compose and decompose two- and three-dimensional figures; use decomposition to determine the perimeter, area, surface area and volume of various figures. For example: Find the volume of a regular hexagonal prism by decomposing it into six equal triangular prisms.
ACE Homework
8.2.3.1 Evaluate algebraic expressions, including expressions containing radicals and absolute values, at specified values of their variables. For example: Evaluate πr2h when r = 3 and h = 0.5, and then use an approximation of π to obtain an approximate answer. 9.2.3.1 Evaluate polynomial and rational expressions and expressions containing radicals and absolute values at specified points in their domains. 9.2.3.2 Add, subtract and multiply polynomials; divide a polynomial by a polynomial of equal or lower degree. 9.3.1.1 Determine the surface area and volume of pyramids, cones and spheres. Use measuring devices or formulas as appropriate. For example: Measure the height and radius of a cone and then use a formula to find its volume.
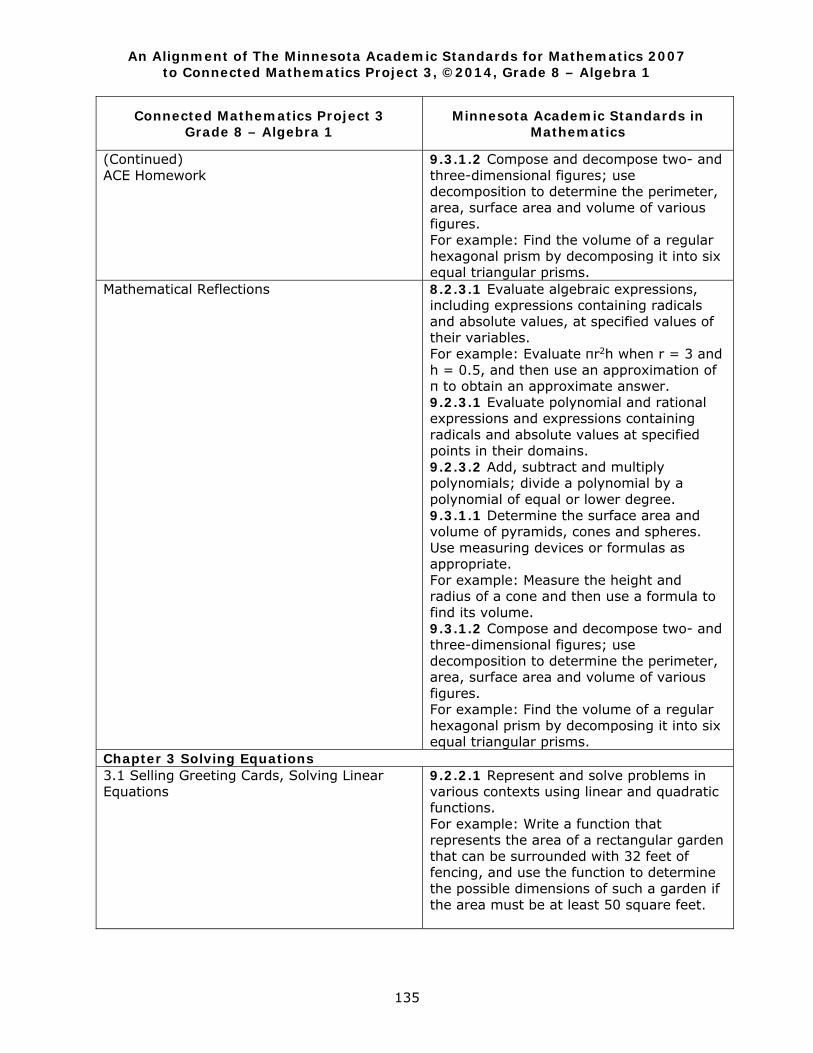
An Alignment of The Minnesota Academic Standards for Mathematics 2007 to Connected Mathematics Project 3, ©2014, Grade 8 – Algebra 1
135
Connected Mathematics Project 3 Grade 8 – Algebra 1
Minnesota Academic Standards in Mathematics
(Continued) ACE Homework
9.3.1.2 Compose and decompose two- and three-dimensional figures; use decomposition to determine the perimeter, area, surface area and volume of various figures. For example: Find the volume of a regular hexagonal prism by decomposing it into six equal triangular prisms.
Mathematical Reflections 8.2.3.1 Evaluate algebraic expressions, including expressions containing radicals and absolute values, at specified values of their variables. For example: Evaluate πr2h when r = 3 and h = 0.5, and then use an approximation of π to obtain an approximate answer. 9.2.3.1 Evaluate polynomial and rational expressions and expressions containing radicals and absolute values at specified points in their domains. 9.2.3.2 Add, subtract and multiply polynomials; divide a polynomial by a polynomial of equal or lower degree. 9.3.1.1 Determine the surface area and volume of pyramids, cones and spheres. Use measuring devices or formulas as appropriate. For example: Measure the height and radius of a cone and then use a formula to find its volume. 9.3.1.2 Compose and decompose two- and three-dimensional figures; use decomposition to determine the perimeter, area, surface area and volume of various figures. For example: Find the volume of a regular hexagonal prism by decomposing it into six equal triangular prisms.
Chapter 3 Solving Equations 3.1 Selling Greeting Cards, Solving Linear Equations
9.2.2.1 Represent and solve problems in various contexts using linear and quadratic functions. For example: Write a function that represents the area of a rectangular garden that can be surrounded with 32 feet of fencing, and use the function to determine the possible dimensions of such a garden if the area must be at least 50 square feet.

An Alignment of The Minnesota Academic Standards for Mathematics 2007 to Connected Mathematics Project 3, ©2014, Grade 8 – Algebra 1
136
Connected Mathematics Project 3 Grade 8 – Algebra 1
Minnesota Academic Standards in Mathematics
3.2 Comparing Cost, Solving More Linear Equations
9.2.2.1 Represent and solve problems in various contexts using linear and quadratic functions. For example: Write a function that represents the area of a rectangular garden that can be surrounded with 32 feet of fencing, and use the function to determine the possible dimensions of such a garden if the area must be at least 50 square feet.
3.3 Factoring Quadratic Equations 8.2.3.2 Justify steps in generating equivalent expressions by identifying the properties used, including the properties of algebra. Properties include the associative, commutative and distributive laws, and the order of operations, including grouping symbols. 9.2.3.3 Factor common monomial factors from polynomials, factor quadratic polynomials, and factor the difference of two squares. For example: 9x6 – x4 = (3x3 – x2)(3x3 + x2). 9.2.3.7 Justify steps in generating equivalent expressions by identifying the properties used. Use substitution to check the equality of expressions for some particular values of the variables; recognize that checking with substitution does not guarantee equality of expressions for all values of the variables.
3.4 Solving Quadratic Equations
8.2.3.2 Justify steps in generating equivalent expressions by identifying the properties used, including the properties of algebra. Properties include the associative, commutative and distributive laws, and the order of operations, including grouping symbols. 9.2.3.3 Factor common monomial factors from polynomials, factor quadratic polynomials, and factor the difference of two squares. For example: 9x6 – x4 = (3x3 – x2)(3x3 + x2).
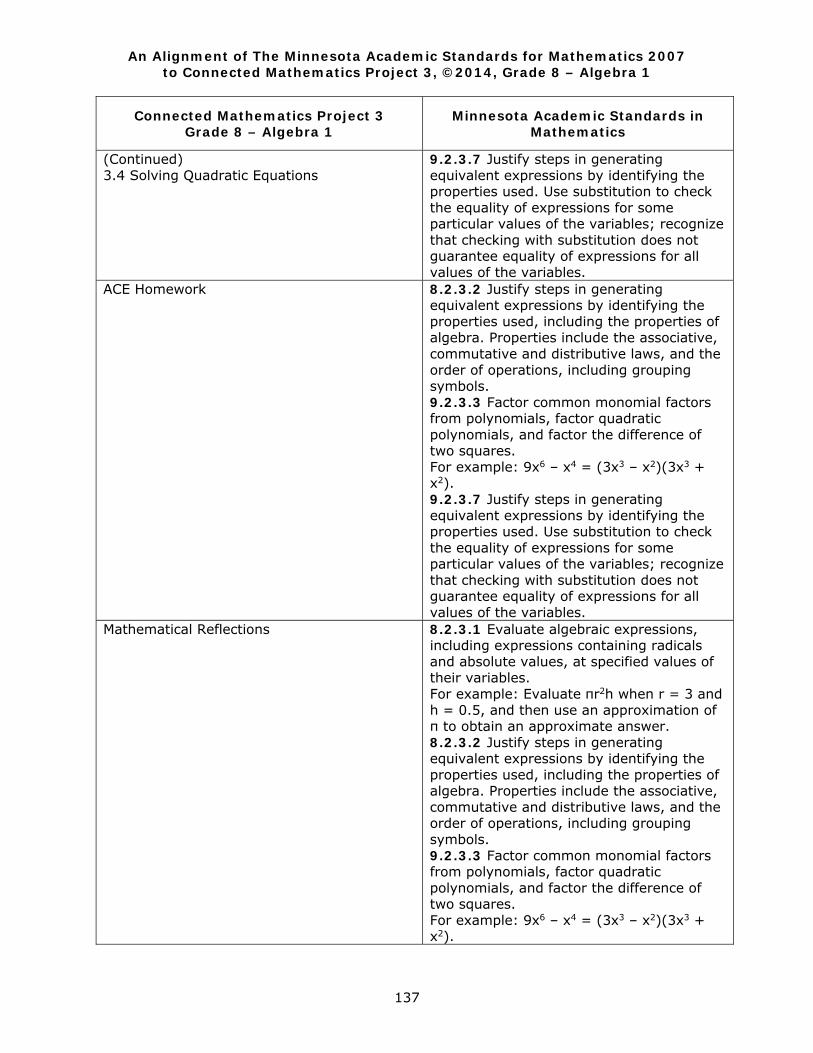
An Alignment of The Minnesota Academic Standards for Mathematics 2007 to Connected Mathematics Project 3, ©2014, Grade 8 – Algebra 1
137
Connected Mathematics Project 3 Grade 8 – Algebra 1
Minnesota Academic Standards in Mathematics
(Continued) 3.4 Solving Quadratic Equations
9.2.3.7 Justify steps in generating equivalent expressions by identifying the properties used. Use substitution to check the equality of expressions for some particular values of the variables; recognize that checking with substitution does not guarantee equality of expressions for all values of the variables.
ACE Homework 8.2.3.2 Justify steps in generating equivalent expressions by identifying the properties used, including the properties of algebra. Properties include the associative, commutative and distributive laws, and the order of operations, including grouping symbols. 9.2.3.3 Factor common monomial factors from polynomials, factor quadratic polynomials, and factor the difference of two squares. For example: 9x6 – x4 = (3x3 – x2)(3x3 + x2). 9.2.3.7 Justify steps in generating equivalent expressions by identifying the properties used. Use substitution to check the equality of expressions for some particular values of the variables; recognize that checking with substitution does not guarantee equality of expressions for all values of the variables.
Mathematical Reflections
8.2.3.1 Evaluate algebraic expressions, including expressions containing radicals and absolute values, at specified values of their variables. For example: Evaluate πr2h when r = 3 and h = 0.5, and then use an approximation of π to obtain an approximate answer. 8.2.3.2 Justify steps in generating equivalent expressions by identifying the properties used, including the properties of algebra. Properties include the associative, commutative and distributive laws, and the order of operations, including grouping symbols. 9.2.3.3 Factor common monomial factors from polynomials, factor quadratic polynomials, and factor the difference of two squares. For example: 9x6 – x4 = (3x3 – x2)(3x3 + x2).

An Alignment of The Minnesota Academic Standards for Mathematics 2007 to Connected Mathematics Project 3, ©2014, Grade 8 – Algebra 1
138
Connected Mathematics Project 3 Grade 8 – Algebra 1
Minnesota Academic Standards in Mathematics
(Continued) Mathematical Reflections
9.2.3.7 Justify steps in generating equivalent expressions by identifying the properties used. Use substitution to check the equality of expressions for some particular values of the variables; recognize that checking with substitution does not guarantee equality of expressions for all values of the variables.
Chapter 4 Looking Back at Functions 4.1 Pumping Water, Looking at Patterns of Change
8.2.1.1 Understand that a function is a relationship between an independent variable and a dependent variable in which the value of the independent variable determines the value of the dependent variable. Use functional notation, such as f(x), to represent such relationships. For example: The relationship between the area of a square and the side length can be expressed as f (x) = x2. In this case, f (5) = 25, which represents the fact that a square of side length 5 units has area 25 units squared. 8.2.1.2 Use linear functions to represent relationships in which changing the input variable by some amount leads to a change in the output variable that is a constant times that amount. For example: Uncle Jim gave Emily $50 on the day she was born and $25 on each birthday after that. The function f (x) = 50 + 25x represents the amount of money Jim has given after x years. The rate of change is $25 per year. 8.2.1.3 Understand that a function is linear if it can be expressed in the form f (x) = mx + b or if its graph is a straight line. For example: The function f (x) = x 2 is not a linear function because its graph contains the points (1,1), (-1,1) and (0,0), which are not on a straight line.
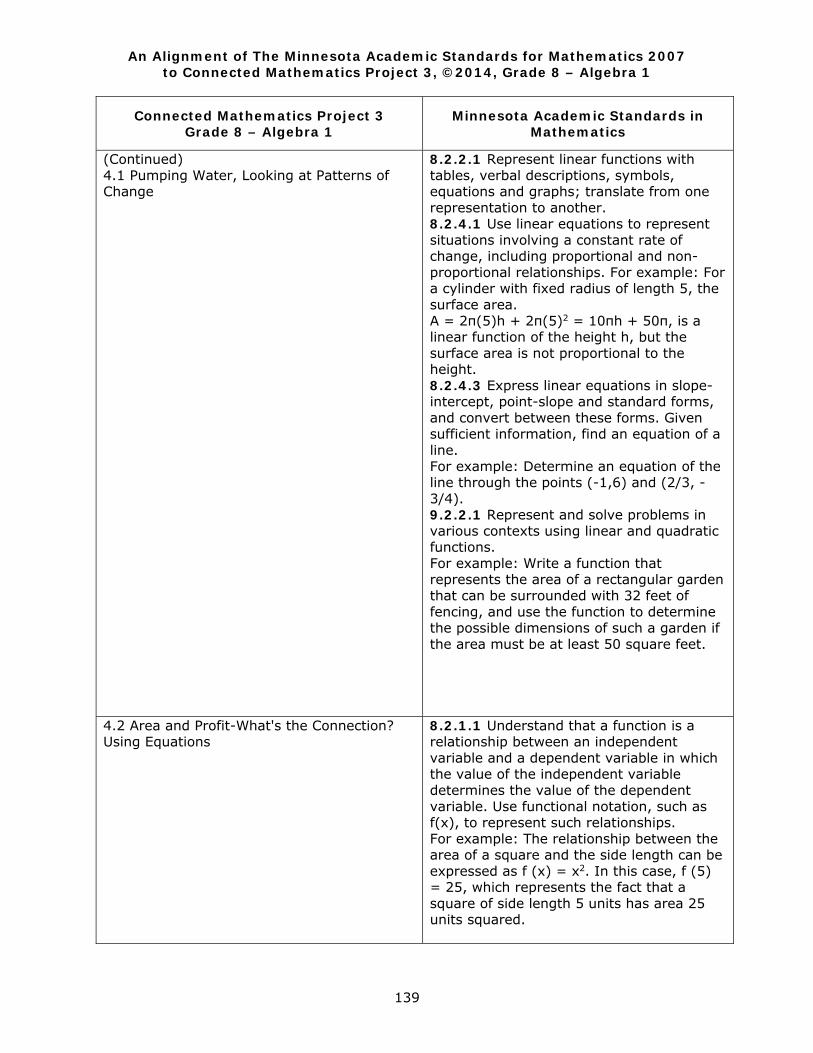
An Alignment of The Minnesota Academic Standards for Mathematics 2007 to Connected Mathematics Project 3, ©2014, Grade 8 – Algebra 1
139
Connected Mathematics Project 3 Grade 8 – Algebra 1
Minnesota Academic Standards in Mathematics
(Continued) 4.1 Pumping Water, Looking at Patterns of Change
8.2.2.1 Represent linear functions with tables, verbal descriptions, symbols, equations and graphs; translate from one representation to another. 8.2.4.1 Use linear equations to represent situations involving a constant rate of change, including proportional and non-proportional relationships. For example: For a cylinder with fixed radius of length 5, the surface area. A = 2π(5)h + 2π(5)2 = 10πh + 50π, is a linear function of the height h, but the surface area is not proportional to the height. 8.2.4.3 Express linear equations in slope-intercept, point-slope and standard forms, and convert between these forms. Given sufficient information, find an equation of a line. For example: Determine an equation of the line through the points (-1,6) and (2/3, - 3/4). 9.2.2.1 Represent and solve problems in various contexts using linear and quadratic functions. For example: Write a function that represents the area of a rectangular garden that can be surrounded with 32 feet of fencing, and use the function to determine the possible dimensions of such a garden if the area must be at least 50 square feet.
4.2 Area and Profit-What's the Connection? Using Equations
8.2.1.1 Understand that a function is a relationship between an independent variable and a dependent variable in which the value of the independent variable determines the value of the dependent variable. Use functional notation, such as f(x), to represent such relationships. For example: The relationship between the area of a square and the side length can be expressed as f (x) = x2. In this case, f (5) = 25, which represents the fact that a square of side length 5 units has area 25 units squared.
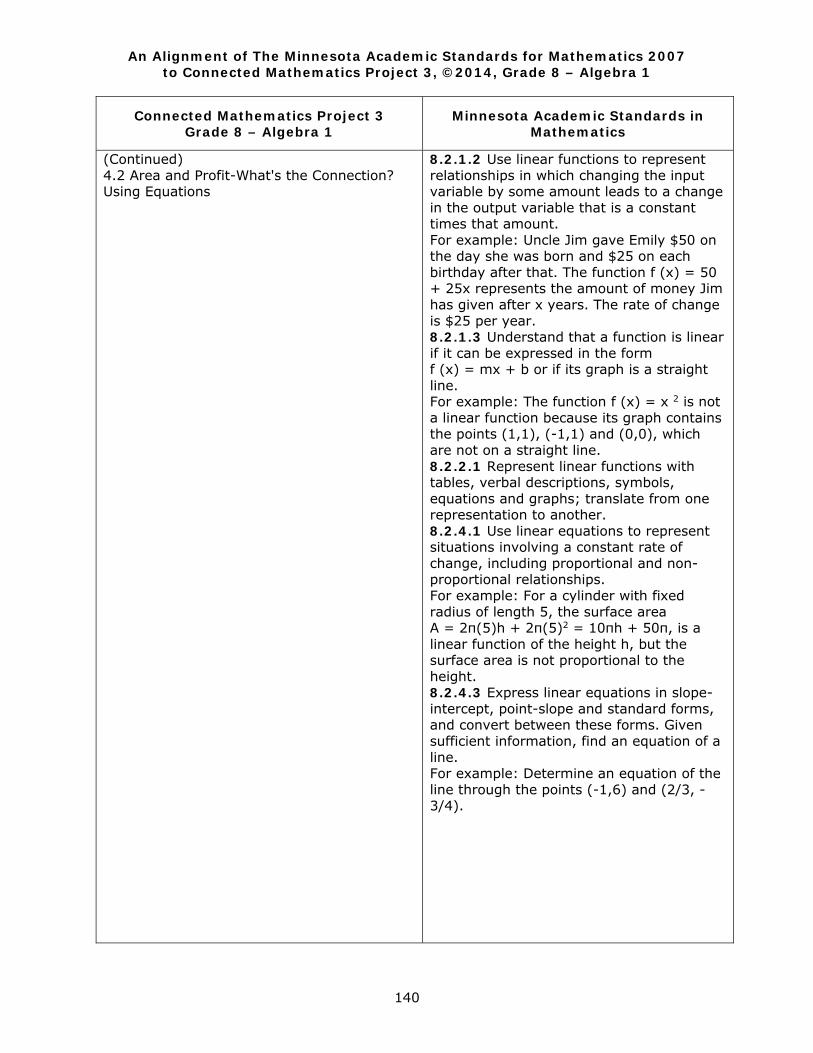
An Alignment of The Minnesota Academic Standards for Mathematics 2007 to Connected Mathematics Project 3, ©2014, Grade 8 – Algebra 1
140
Connected Mathematics Project 3 Grade 8 – Algebra 1
Minnesota Academic Standards in Mathematics
(Continued) 4.2 Area and Profit-What's the Connection? Using Equations
8.2.1.2 Use linear functions to represent relationships in which changing the input variable by some amount leads to a change in the output variable that is a constant times that amount. For example: Uncle Jim gave Emily $50 on the day she was born and $25 on each birthday after that. The function f (x) = 50 + 25x represents the amount of money Jim has given after x years. The rate of change is $25 per year. 8.2.1.3 Understand that a function is linear if it can be expressed in the form f (x) = mx + b or if its graph is a straight line. For example: The function f (x) = x 2 is not a linear function because its graph contains the points (1,1), (-1,1) and (0,0), which are not on a straight line. 8.2.2.1 Represent linear functions with tables, verbal descriptions, symbols, equations and graphs; translate from one representation to another. 8.2.4.1 Use linear equations to represent situations involving a constant rate of change, including proportional and non-proportional relationships. For example: For a cylinder with fixed radius of length 5, the surface area A = 2π(5)h + 2π(5)2 = 10πh + 50π, is a linear function of the height h, but the surface area is not proportional to the height. 8.2.4.3 Express linear equations in slope-intercept, point-slope and standard forms, and convert between these forms. Given sufficient information, find an equation of a line. For example: Determine an equation of the line through the points (-1,6) and (2/3, - 3/4).
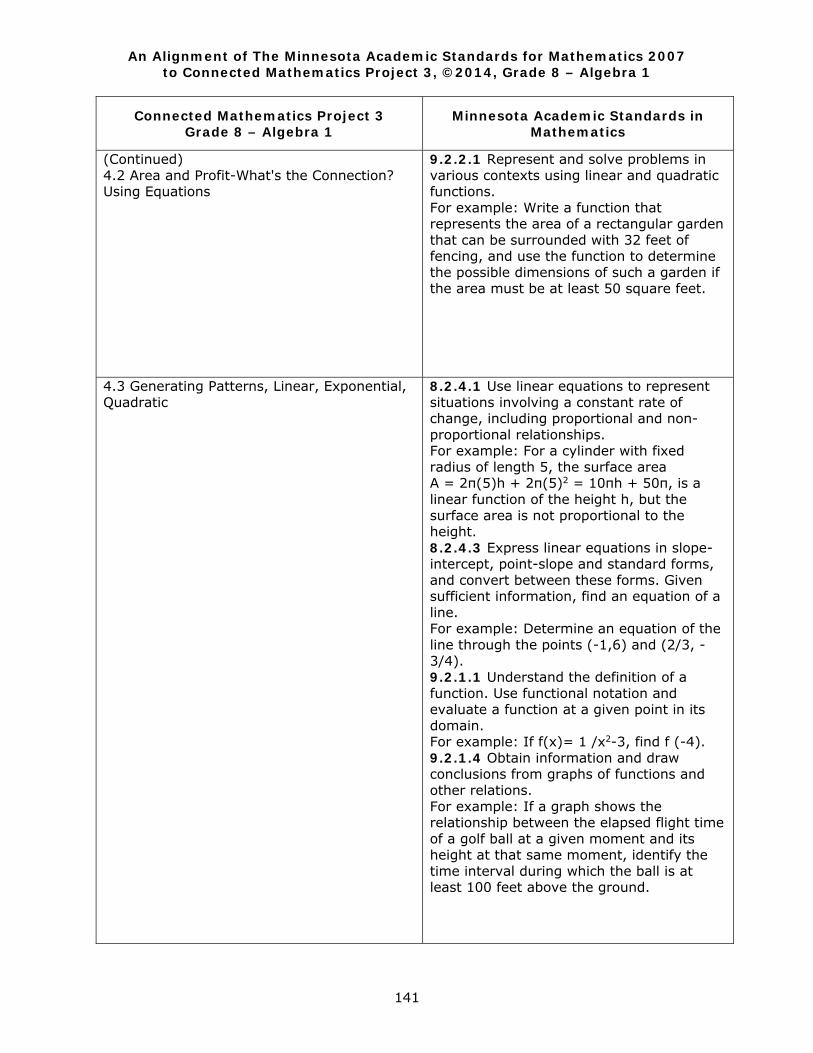
An Alignment of The Minnesota Academic Standards for Mathematics 2007 to Connected Mathematics Project 3, ©2014, Grade 8 – Algebra 1
141
Connected Mathematics Project 3 Grade 8 – Algebra 1
Minnesota Academic Standards in Mathematics
(Continued) 4.2 Area and Profit-What's the Connection? Using Equations
9.2.2.1 Represent and solve problems in various contexts using linear and quadratic functions. For example: Write a function that represents the area of a rectangular garden that can be surrounded with 32 feet of fencing, and use the function to determine the possible dimensions of such a garden if the area must be at least 50 square feet.
4.3 Generating Patterns, Linear, Exponential, Quadratic
8.2.4.1 Use linear equations to represent situations involving a constant rate of change, including proportional and non-proportional relationships. For example: For a cylinder with fixed radius of length 5, the surface area A = 2π(5)h + 2π(5)2 = 10πh + 50π, is a linear function of the height h, but the surface area is not proportional to the height. 8.2.4.3 Express linear equations in slope-intercept, point-slope and standard forms, and convert between these forms. Given sufficient information, find an equation of a line. For example: Determine an equation of the line through the points (-1,6) and (2/3, - 3/4). 9.2.1.1 Understand the definition of a function. Use functional notation and evaluate a function at a given point in its domain. For example: If f(x)= 1 /x2-3, find f (-4). 9.2.1.4 Obtain information and draw conclusions from graphs of functions and other relations. For example: If a graph shows the relationship between the elapsed flight time of a golf ball at a given moment and its height at that same moment, identify the time interval during which the ball is at least 100 feet above the ground.
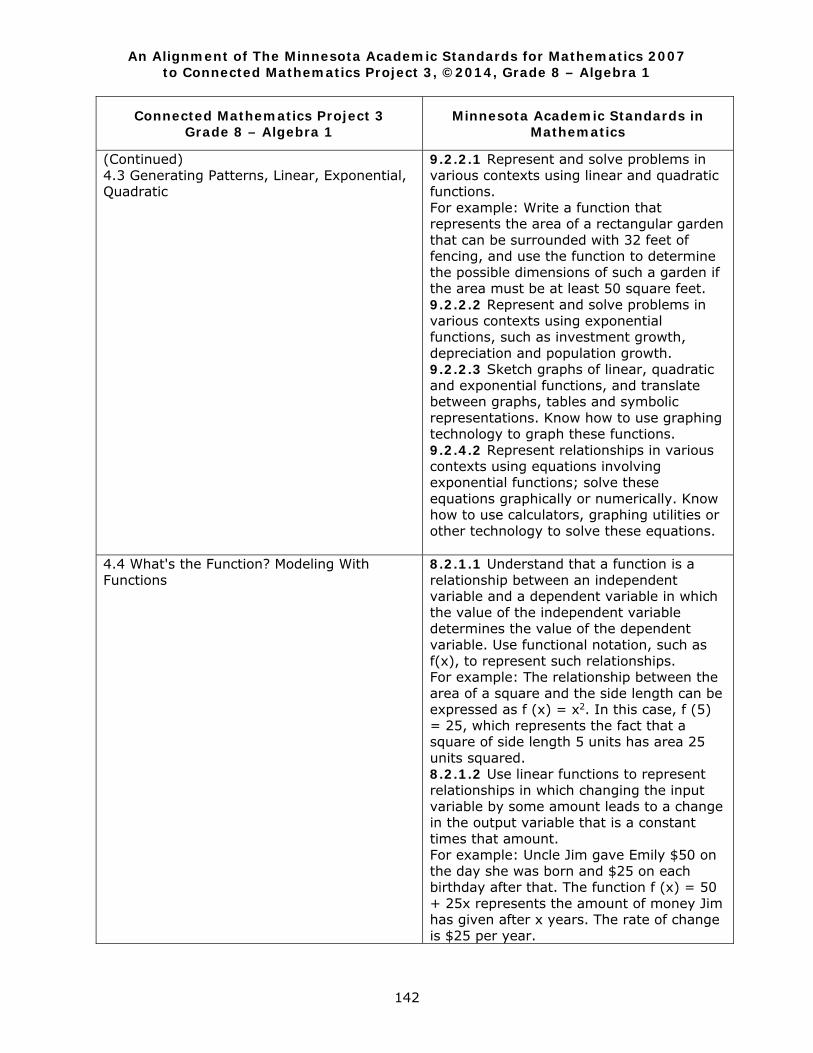
An Alignment of The Minnesota Academic Standards for Mathematics 2007 to Connected Mathematics Project 3, ©2014, Grade 8 – Algebra 1
142
Connected Mathematics Project 3 Grade 8 – Algebra 1
Minnesota Academic Standards in Mathematics
(Continued) 4.3 Generating Patterns, Linear, Exponential, Quadratic
9.2.2.1 Represent and solve problems in various contexts using linear and quadratic functions. For example: Write a function that represents the area of a rectangular garden that can be surrounded with 32 feet of fencing, and use the function to determine the possible dimensions of such a garden if the area must be at least 50 square feet. 9.2.2.2 Represent and solve problems in various contexts using exponential functions, such as investment growth, depreciation and population growth. 9.2.2.3 Sketch graphs of linear, quadratic and exponential functions, and translate between graphs, tables and symbolic representations. Know how to use graphing technology to graph these functions. 9.2.4.2 Represent relationships in various contexts using equations involving exponential functions; solve these equations graphically or numerically. Know how to use calculators, graphing utilities or other technology to solve these equations.
4.4 What's the Function? Modeling With Functions
8.2.1.1 Understand that a function is a relationship between an independent variable and a dependent variable in which the value of the independent variable determines the value of the dependent variable. Use functional notation, such as f(x), to represent such relationships. For example: The relationship between the area of a square and the side length can be expressed as f (x) = x2. In this case, f (5) = 25, which represents the fact that a square of side length 5 units has area 25 units squared. 8.2.1.2 Use linear functions to represent relationships in which changing the input variable by some amount leads to a change in the output variable that is a constant times that amount. For example: Uncle Jim gave Emily $50 on the day she was born and $25 on each birthday after that. The function f (x) = 50 + 25x represents the amount of money Jim has given after x years. The rate of change is $25 per year.
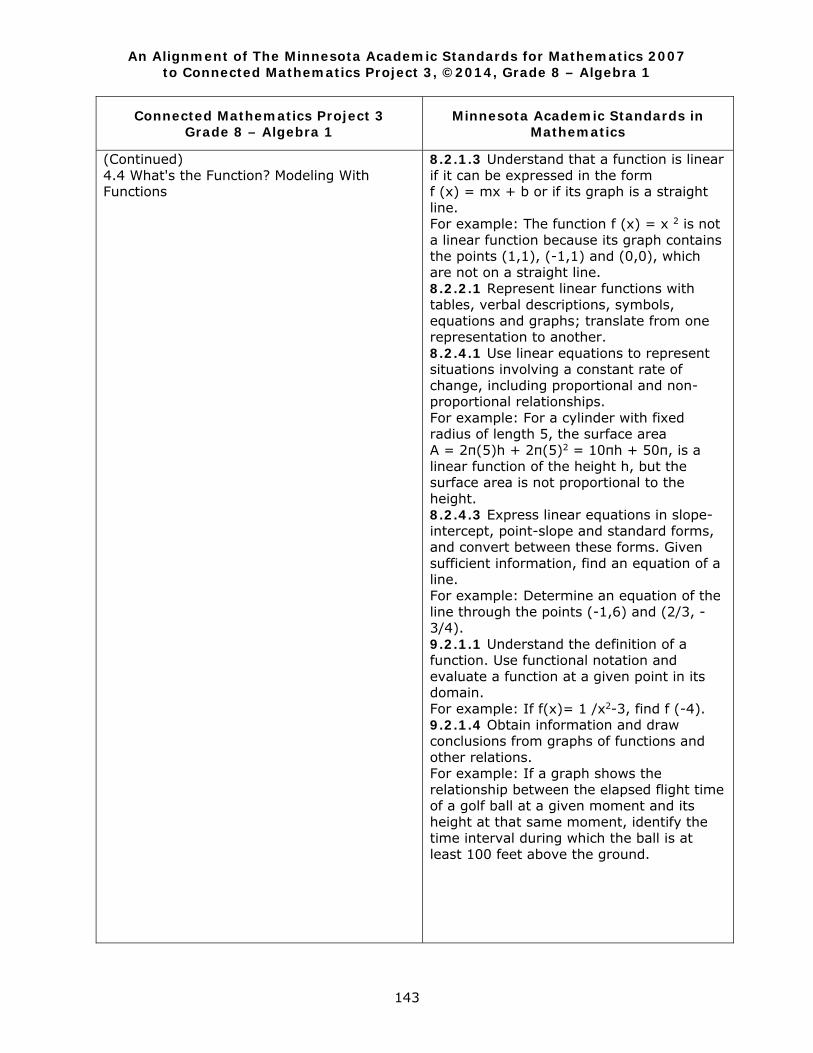
An Alignment of The Minnesota Academic Standards for Mathematics 2007 to Connected Mathematics Project 3, ©2014, Grade 8 – Algebra 1
143
Connected Mathematics Project 3 Grade 8 – Algebra 1
Minnesota Academic Standards in Mathematics
(Continued) 4.4 What's the Function? Modeling With Functions
8.2.1.3 Understand that a function is linear if it can be expressed in the form f (x) = mx + b or if its graph is a straight line. For example: The function f (x) = x 2 is not a linear function because its graph contains the points (1,1), (-1,1) and (0,0), which are not on a straight line. 8.2.2.1 Represent linear functions with tables, verbal descriptions, symbols, equations and graphs; translate from one representation to another. 8.2.4.1 Use linear equations to represent situations involving a constant rate of change, including proportional and non-proportional relationships. For example: For a cylinder with fixed radius of length 5, the surface area A = 2π(5)h + 2π(5)2 = 10πh + 50π, is a linear function of the height h, but the surface area is not proportional to the height. 8.2.4.3 Express linear equations in slope-intercept, point-slope and standard forms, and convert between these forms. Given sufficient information, find an equation of a line. For example: Determine an equation of the line through the points (-1,6) and (2/3, - 3/4). 9.2.1.1 Understand the definition of a function. Use functional notation and evaluate a function at a given point in its domain. For example: If f(x)= 1 /x2-3, find f (-4). 9.2.1.4 Obtain information and draw conclusions from graphs of functions and other relations. For example: If a graph shows the relationship between the elapsed flight time of a golf ball at a given moment and its height at that same moment, identify the time interval during which the ball is at least 100 feet above the ground.
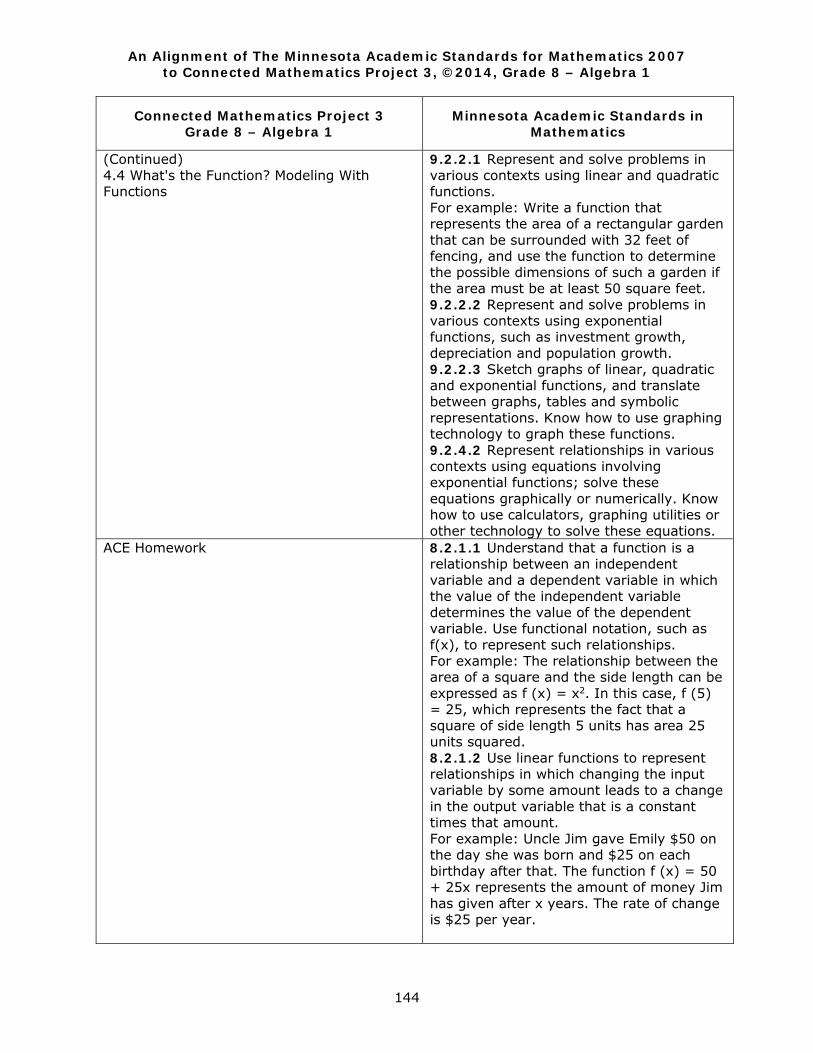
An Alignment of The Minnesota Academic Standards for Mathematics 2007 to Connected Mathematics Project 3, ©2014, Grade 8 – Algebra 1
144
Connected Mathematics Project 3 Grade 8 – Algebra 1
Minnesota Academic Standards in Mathematics
(Continued) 4.4 What's the Function? Modeling With Functions
9.2.2.1 Represent and solve problems in various contexts using linear and quadratic functions. For example: Write a function that represents the area of a rectangular garden that can be surrounded with 32 feet of fencing, and use the function to determine the possible dimensions of such a garden if the area must be at least 50 square feet. 9.2.2.2 Represent and solve problems in various contexts using exponential functions, such as investment growth, depreciation and population growth. 9.2.2.3 Sketch graphs of linear, quadratic and exponential functions, and translate between graphs, tables and symbolic representations. Know how to use graphing technology to graph these functions. 9.2.4.2 Represent relationships in various contexts using equations involving exponential functions; solve these equations graphically or numerically. Know how to use calculators, graphing utilities or other technology to solve these equations.
ACE Homework
8.2.1.1 Understand that a function is a relationship between an independent variable and a dependent variable in which the value of the independent variable determines the value of the dependent variable. Use functional notation, such as f(x), to represent such relationships. For example: The relationship between the area of a square and the side length can be expressed as f (x) = x2. In this case, f (5) = 25, which represents the fact that a square of side length 5 units has area 25 units squared. 8.2.1.2 Use linear functions to represent relationships in which changing the input variable by some amount leads to a change in the output variable that is a constant times that amount. For example: Uncle Jim gave Emily $50 on the day she was born and $25 on each birthday after that. The function f (x) = 50 + 25x represents the amount of money Jim has given after x years. The rate of change is $25 per year.

An Alignment of The Minnesota Academic Standards for Mathematics 2007 to Connected Mathematics Project 3, ©2014, Grade 8 – Algebra 1
145
Connected Mathematics Project 3 Grade 8 – Algebra 1
Minnesota Academic Standards in Mathematics
(Continued) ACE Homework
8.2.1.3 Understand that a function is linear if it can be expressed in the form f (x) = mx + b or if its graph is a straight line. For example: The function f (x) = x 2 is not a linear function because its graph contains the points (1,1), (-1,1) and (0,0), which are not on a straight line. 8.2.2.1 Represent linear functions with tables, verbal descriptions, symbols, equations and graphs; translate from one representation to another. 8.2.4.1 Use linear equations to represent situations involving a constant rate of change, including proportional and non-proportional relationships. For example: For a cylinder with fixed radius of length 5, the surface area A = 2π(5)h + 2π(5)2 = 10πh + 50π, is a linear function of the height h, but the surface area is not proportional to the height. 8.2.4.3 Express linear equations in slope-intercept, point-slope and standard forms, and convert between these forms. Given sufficient information, find an equation of a line. For example: Determine an equation of the line through the points (-1,6) and (2/3, - 3/4). 9.2.1.1 Understand the definition of a function. Use functional notation and evaluate a function at a given point in its domain. For example: If f(x)= 1 /x2-3, find f (-4). 9.2.1.4 Obtain information and draw conclusions from graphs of functions and other relations. For example: If a graph shows the relationship between the elapsed flight time of a golf ball at a given moment and its height at that same moment, identify the time interval during which the ball is at least 100 feet above the ground.
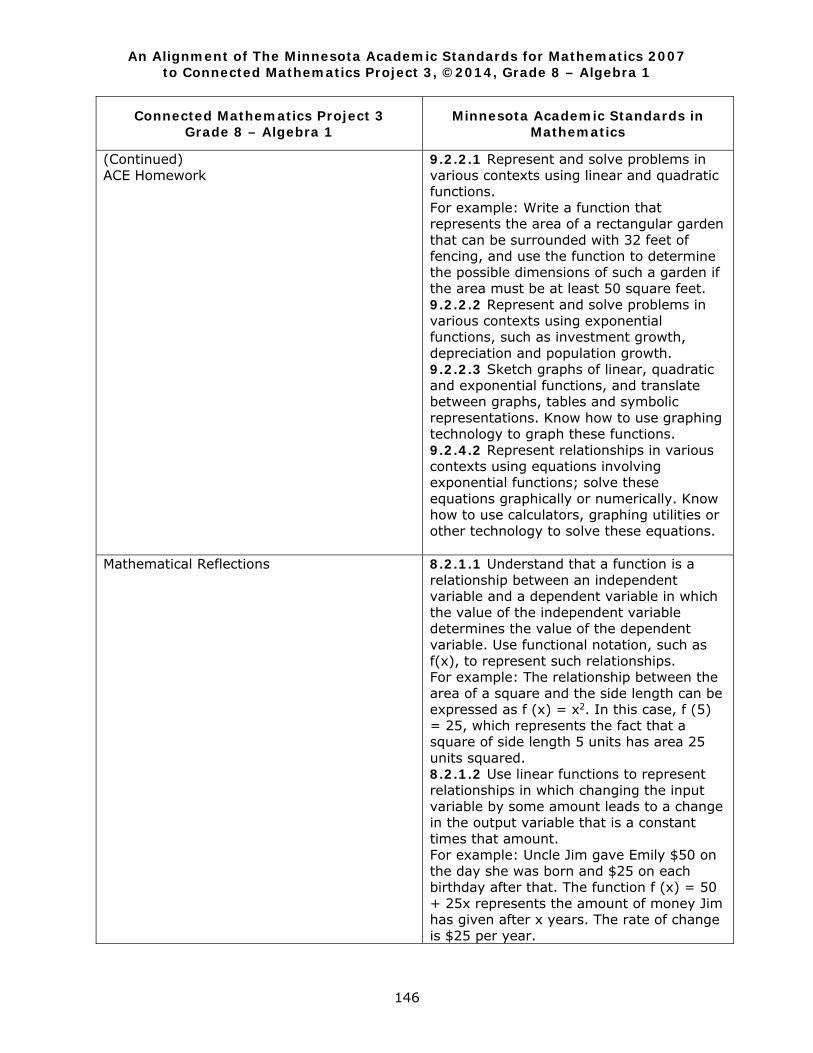
An Alignment of The Minnesota Academic Standards for Mathematics 2007 to Connected Mathematics Project 3, ©2014, Grade 8 – Algebra 1
146
Connected Mathematics Project 3 Grade 8 – Algebra 1
Minnesota Academic Standards in Mathematics
(Continued) ACE Homework
9.2.2.1 Represent and solve problems in various contexts using linear and quadratic functions. For example: Write a function that represents the area of a rectangular garden that can be surrounded with 32 feet of fencing, and use the function to determine the possible dimensions of such a garden if the area must be at least 50 square feet. 9.2.2.2 Represent and solve problems in various contexts using exponential functions, such as investment growth, depreciation and population growth. 9.2.2.3 Sketch graphs of linear, quadratic and exponential functions, and translate between graphs, tables and symbolic representations. Know how to use graphing technology to graph these functions. 9.2.4.2 Represent relationships in various contexts using equations involving exponential functions; solve these equations graphically or numerically. Know how to use calculators, graphing utilities or other technology to solve these equations.
Mathematical Reflections
8.2.1.1 Understand that a function is a relationship between an independent variable and a dependent variable in which the value of the independent variable determines the value of the dependent variable. Use functional notation, such as f(x), to represent such relationships. For example: The relationship between the area of a square and the side length can be expressed as f (x) = x2. In this case, f (5) = 25, which represents the fact that a square of side length 5 units has area 25 units squared. 8.2.1.2 Use linear functions to represent relationships in which changing the input variable by some amount leads to a change in the output variable that is a constant times that amount. For example: Uncle Jim gave Emily $50 on the day she was born and $25 on each birthday after that. The function f (x) = 50 + 25x represents the amount of money Jim has given after x years. The rate of change is $25 per year.
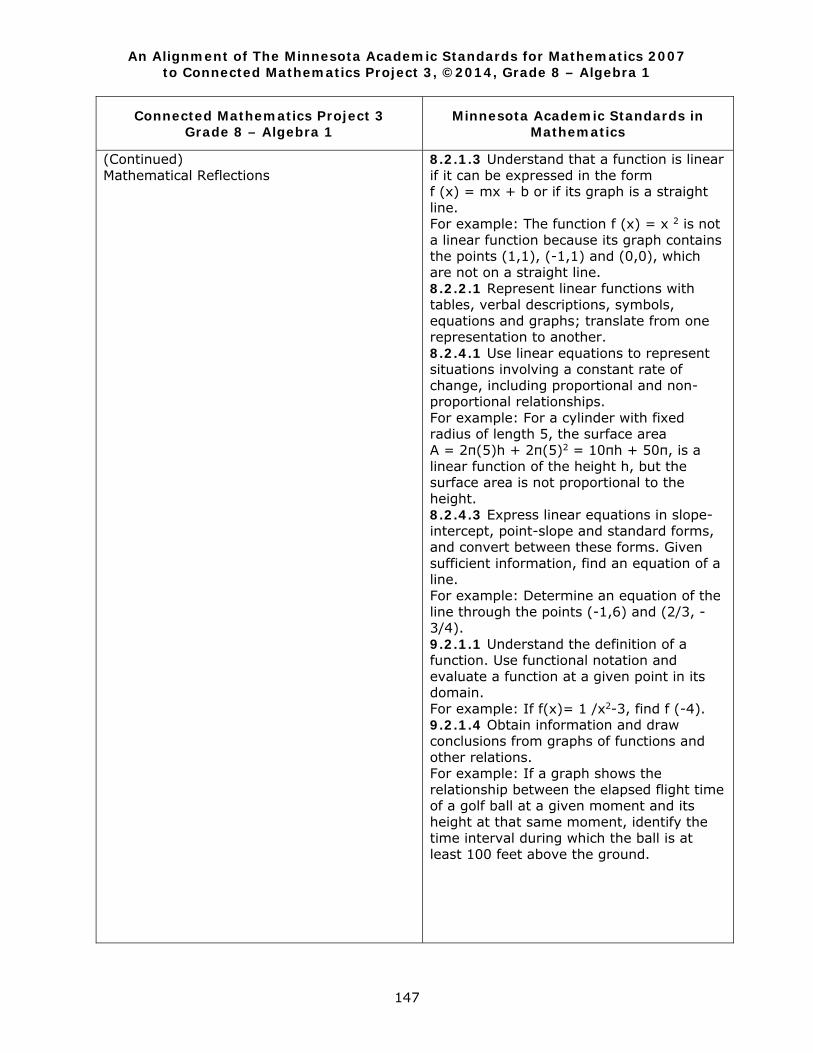
An Alignment of The Minnesota Academic Standards for Mathematics 2007 to Connected Mathematics Project 3, ©2014, Grade 8 – Algebra 1
147
Connected Mathematics Project 3 Grade 8 – Algebra 1
Minnesota Academic Standards in Mathematics
(Continued) Mathematical Reflections
8.2.1.3 Understand that a function is linear if it can be expressed in the form f (x) = mx + b or if its graph is a straight line. For example: The function f (x) = x 2 is not a linear function because its graph contains the points (1,1), (-1,1) and (0,0), which are not on a straight line. 8.2.2.1 Represent linear functions with tables, verbal descriptions, symbols, equations and graphs; translate from one representation to another. 8.2.4.1 Use linear equations to represent situations involving a constant rate of change, including proportional and non-proportional relationships. For example: For a cylinder with fixed radius of length 5, the surface area A = 2π(5)h + 2π(5)2 = 10πh + 50π, is a linear function of the height h, but the surface area is not proportional to the height. 8.2.4.3 Express linear equations in slope-intercept, point-slope and standard forms, and convert between these forms. Given sufficient information, find an equation of a line. For example: Determine an equation of the line through the points (-1,6) and (2/3, - 3/4). 9.2.1.1 Understand the definition of a function. Use functional notation and evaluate a function at a given point in its domain. For example: If f(x)= 1 /x2-3, find f (-4). 9.2.1.4 Obtain information and draw conclusions from graphs of functions and other relations. For example: If a graph shows the relationship between the elapsed flight time of a golf ball at a given moment and its height at that same moment, identify the time interval during which the ball is at least 100 feet above the ground.

An Alignment of The Minnesota Academic Standards for Mathematics 2007 to Connected Mathematics Project 3, ©2014, Grade 8 – Algebra 1
148
Connected Mathematics Project 3 Grade 8 – Algebra 1
Minnesota Academic Standards in Mathematics
(Continued) Mathematical Reflections
9.2.2.1 Represent and solve problems in various contexts using linear and quadratic functions. For example: Write a function that represents the area of a rectangular garden that can be surrounded with 32 feet of fencing, and use the function to determine the possible dimensions of such a garden if the area must be at least 50 square feet. 9.2.2.2 Represent and solve problems in various contexts using exponential functions, such as investment growth, depreciation and population growth. 9.2.2.3 Sketch graphs of linear, quadratic and exponential functions, and translate between graphs, tables and symbolic representations. Know how to use graphing technology to graph these functions. 9.2.4.2 Represent relationships in various contexts using equations involving exponential functions; solve these equations graphically or numerically. Know how to use calculators, graphing utilities or other technology to solve these equations.
Chapter 5 Reasoning With Symbols 5.1 Using Algebra to Solve a Puzzle 8.2.3.2 Justify steps in generating
equivalent expressions by identifying the properties used, including the properties of algebra. Properties include the associative, commutative and distributive laws, and the order of operations, including grouping symbols. 9.2.3.7 Justify steps in generating equivalent expressions by identifying the properties used. Use substitution to check the equality of expressions for some particular values of the variables; recognize that checking with substitution does not guarantee equality of expressions for all values of the variables.
5.2 Odd and Even Revisited
8.2.3.2 Justify steps in generating equivalent expressions by identifying the properties used, including the properties of algebra. Properties include the associative, commutative and distributive laws, and the order of operations, including grouping symbols.
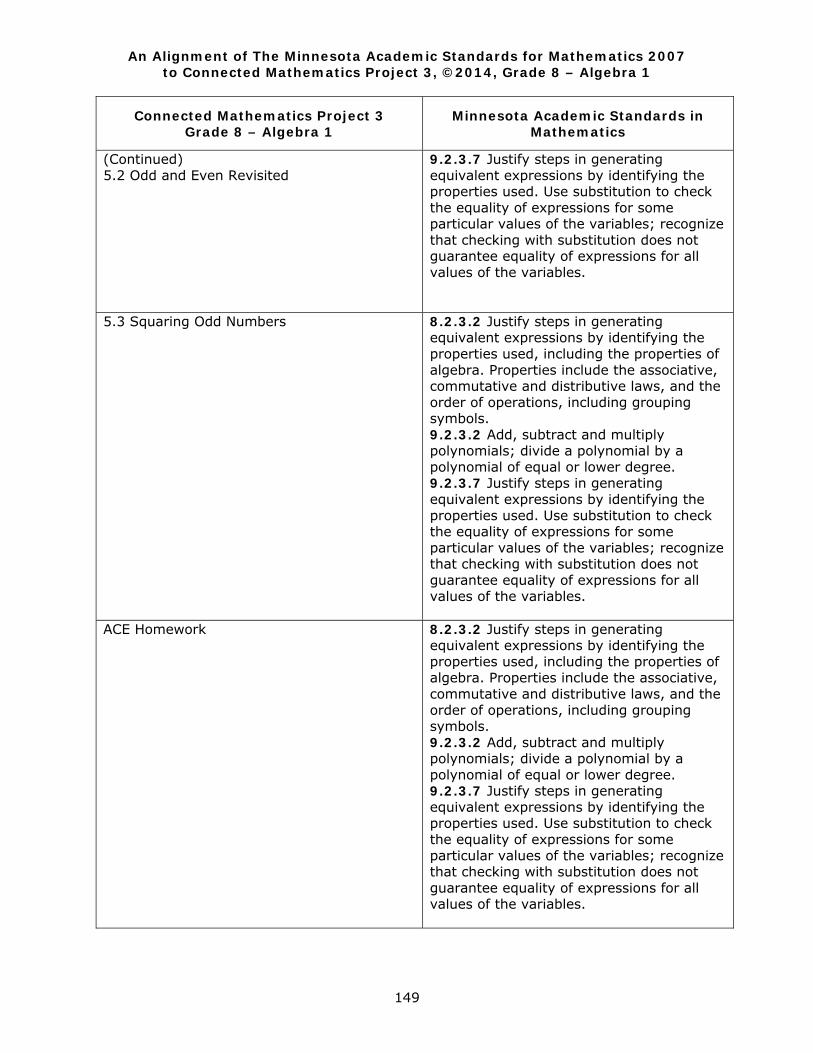
An Alignment of The Minnesota Academic Standards for Mathematics 2007 to Connected Mathematics Project 3, ©2014, Grade 8 – Algebra 1
149
Connected Mathematics Project 3 Grade 8 – Algebra 1
Minnesota Academic Standards in Mathematics
(Continued) 5.2 Odd and Even Revisited
9.2.3.7 Justify steps in generating equivalent expressions by identifying the properties used. Use substitution to check the equality of expressions for some particular values of the variables; recognize that checking with substitution does not guarantee equality of expressions for all values of the variables.
5.3 Squaring Odd Numbers 8.2.3.2 Justify steps in generating equivalent expressions by identifying the properties used, including the properties of algebra. Properties include the associative, commutative and distributive laws, and the order of operations, including grouping symbols. 9.2.3.2 Add, subtract and multiply polynomials; divide a polynomial by a polynomial of equal or lower degree. 9.2.3.7 Justify steps in generating equivalent expressions by identifying the properties used. Use substitution to check the equality of expressions for some particular values of the variables; recognize that checking with substitution does not guarantee equality of expressions for all values of the variables.
ACE Homework 8.2.3.2 Justify steps in generating equivalent expressions by identifying the properties used, including the properties of algebra. Properties include the associative, commutative and distributive laws, and the order of operations, including grouping symbols. 9.2.3.2 Add, subtract and multiply polynomials; divide a polynomial by a polynomial of equal or lower degree. 9.2.3.7 Justify steps in generating equivalent expressions by identifying the properties used. Use substitution to check the equality of expressions for some particular values of the variables; recognize that checking with substitution does not guarantee equality of expressions for all values of the variables.
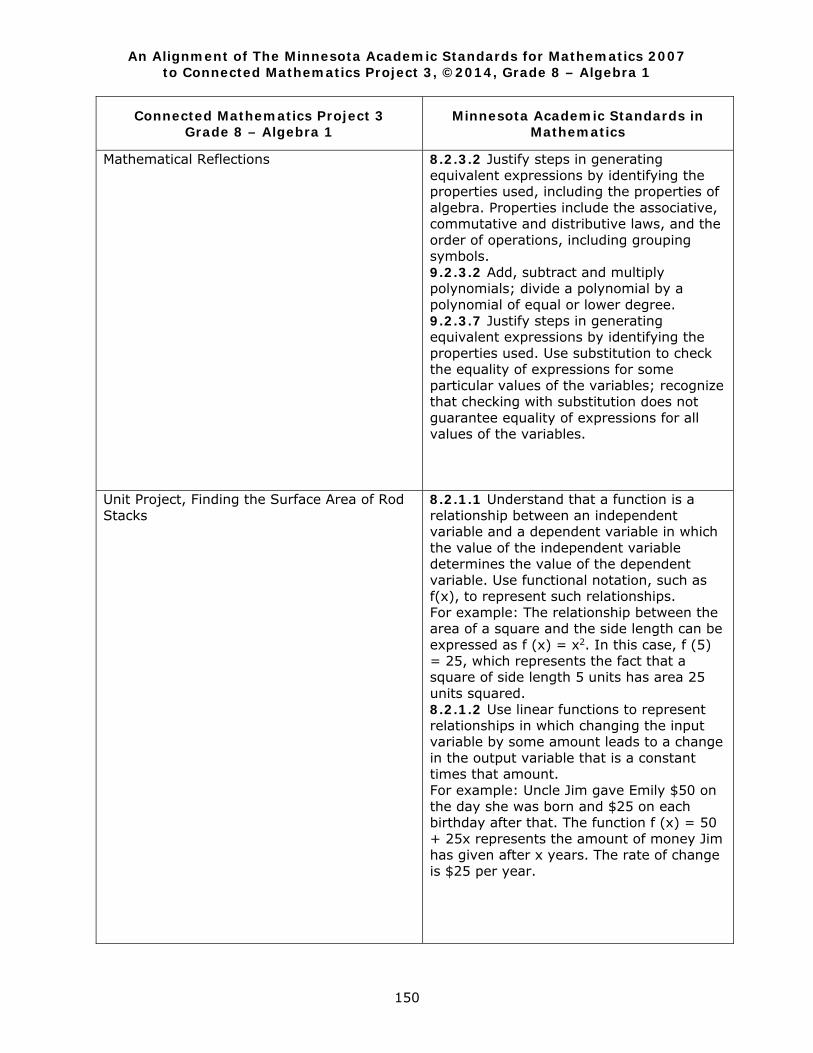
An Alignment of The Minnesota Academic Standards for Mathematics 2007 to Connected Mathematics Project 3, ©2014, Grade 8 – Algebra 1
150
Connected Mathematics Project 3 Grade 8 – Algebra 1
Minnesota Academic Standards in Mathematics
Mathematical Reflections 8.2.3.2 Justify steps in generating equivalent expressions by identifying the properties used, including the properties of algebra. Properties include the associative, commutative and distributive laws, and the order of operations, including grouping symbols. 9.2.3.2 Add, subtract and multiply polynomials; divide a polynomial by a polynomial of equal or lower degree. 9.2.3.7 Justify steps in generating equivalent expressions by identifying the properties used. Use substitution to check the equality of expressions for some particular values of the variables; recognize that checking with substitution does not guarantee equality of expressions for all values of the variables.
Unit Project, Finding the Surface Area of Rod Stacks
8.2.1.1 Understand that a function is a relationship between an independent variable and a dependent variable in which the value of the independent variable determines the value of the dependent variable. Use functional notation, such as f(x), to represent such relationships. For example: The relationship between the area of a square and the side length can be expressed as f (x) = x2. In this case, f (5) = 25, which represents the fact that a square of side length 5 units has area 25 units squared. 8.2.1.2 Use linear functions to represent relationships in which changing the input variable by some amount leads to a change in the output variable that is a constant times that amount. For example: Uncle Jim gave Emily $50 on the day she was born and $25 on each birthday after that. The function f (x) = 50 + 25x represents the amount of money Jim has given after x years. The rate of change is $25 per year.
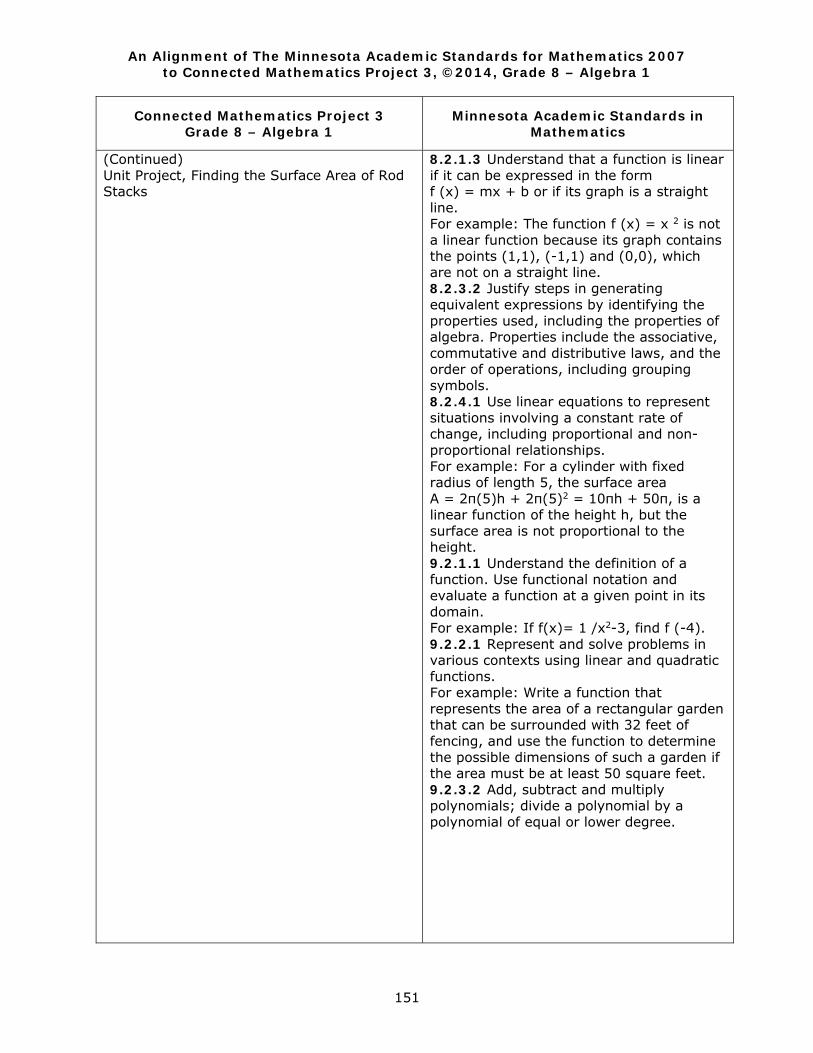
An Alignment of The Minnesota Academic Standards for Mathematics 2007 to Connected Mathematics Project 3, ©2014, Grade 8 – Algebra 1
151
Connected Mathematics Project 3 Grade 8 – Algebra 1
Minnesota Academic Standards in Mathematics
(Continued) Unit Project, Finding the Surface Area of Rod Stacks
8.2.1.3 Understand that a function is linear if it can be expressed in the form f (x) = mx + b or if its graph is a straight line. For example: The function f (x) = x 2 is not a linear function because its graph contains the points (1,1), (-1,1) and (0,0), which are not on a straight line. 8.2.3.2 Justify steps in generating equivalent expressions by identifying the properties used, including the properties of algebra. Properties include the associative, commutative and distributive laws, and the order of operations, including grouping symbols. 8.2.4.1 Use linear equations to represent situations involving a constant rate of change, including proportional and non-proportional relationships. For example: For a cylinder with fixed radius of length 5, the surface area A = 2π(5)h + 2π(5)2 = 10πh + 50π, is a linear function of the height h, but the surface area is not proportional to the height. 9.2.1.1 Understand the definition of a function. Use functional notation and evaluate a function at a given point in its domain. For example: If f(x)= 1 /x2-3, find f (-4). 9.2.2.1 Represent and solve problems in various contexts using linear and quadratic functions. For example: Write a function that represents the area of a rectangular garden that can be surrounded with 32 feet of fencing, and use the function to determine the possible dimensions of such a garden if the area must be at least 50 square feet. 9.2.3.2 Add, subtract and multiply polynomials; divide a polynomial by a polynomial of equal or lower degree.
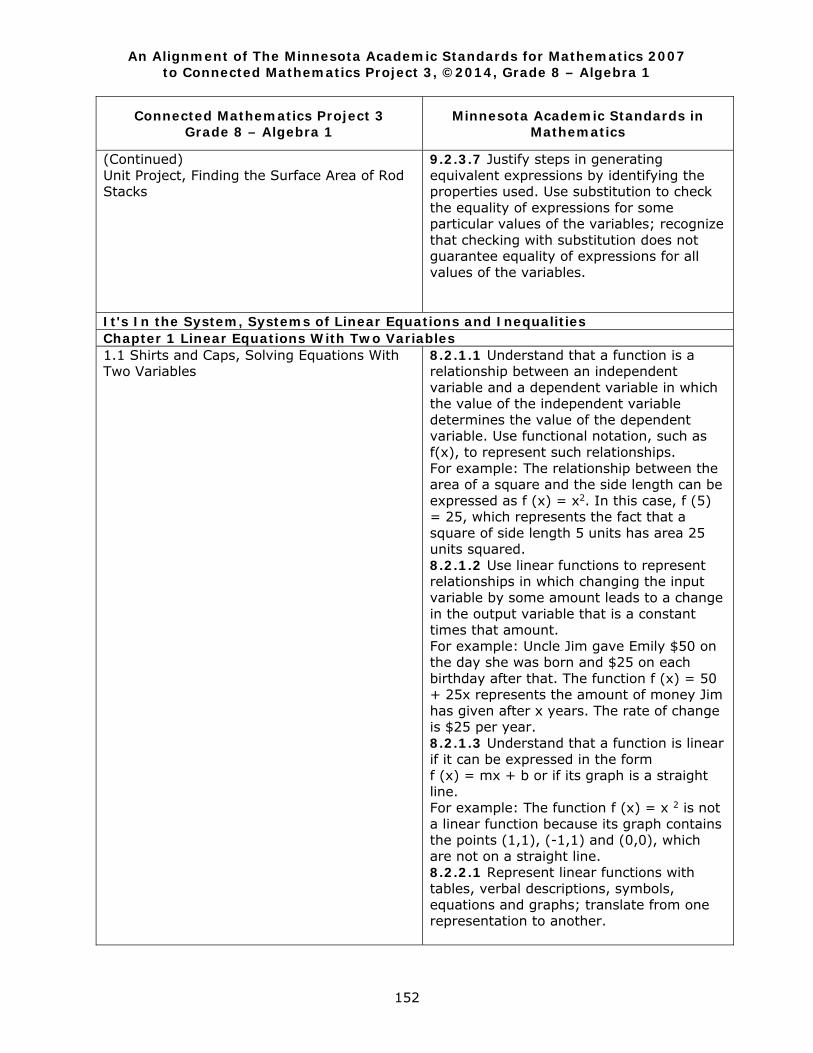
An Alignment of The Minnesota Academic Standards for Mathematics 2007 to Connected Mathematics Project 3, ©2014, Grade 8 – Algebra 1
152
Connected Mathematics Project 3 Grade 8 – Algebra 1
Minnesota Academic Standards in Mathematics
(Continued) Unit Project, Finding the Surface Area of Rod Stacks
9.2.3.7 Justify steps in generating equivalent expressions by identifying the properties used. Use substitution to check the equality of expressions for some particular values of the variables; recognize that checking with substitution does not guarantee equality of expressions for all values of the variables.
It's In the System, Systems of Linear Equations and Inequalities Chapter 1 Linear Equations With Two Variables 1.1 Shirts and Caps, Solving Equations With Two Variables
8.2.1.1 Understand that a function is a relationship between an independent variable and a dependent variable in which the value of the independent variable determines the value of the dependent variable. Use functional notation, such as f(x), to represent such relationships. For example: The relationship between the area of a square and the side length can be expressed as f (x) = x2. In this case, f (5) = 25, which represents the fact that a square of side length 5 units has area 25 units squared. 8.2.1.2 Use linear functions to represent relationships in which changing the input variable by some amount leads to a change in the output variable that is a constant times that amount. For example: Uncle Jim gave Emily $50 on the day she was born and $25 on each birthday after that. The function f (x) = 50 + 25x represents the amount of money Jim has given after x years. The rate of change is $25 per year. 8.2.1.3 Understand that a function is linear if it can be expressed in the form f (x) = mx + b or if its graph is a straight line. For example: The function f (x) = x 2 is not a linear function because its graph contains the points (1,1), (-1,1) and (0,0), which are not on a straight line. 8.2.2.1 Represent linear functions with tables, verbal descriptions, symbols, equations and graphs; translate from one representation to another.
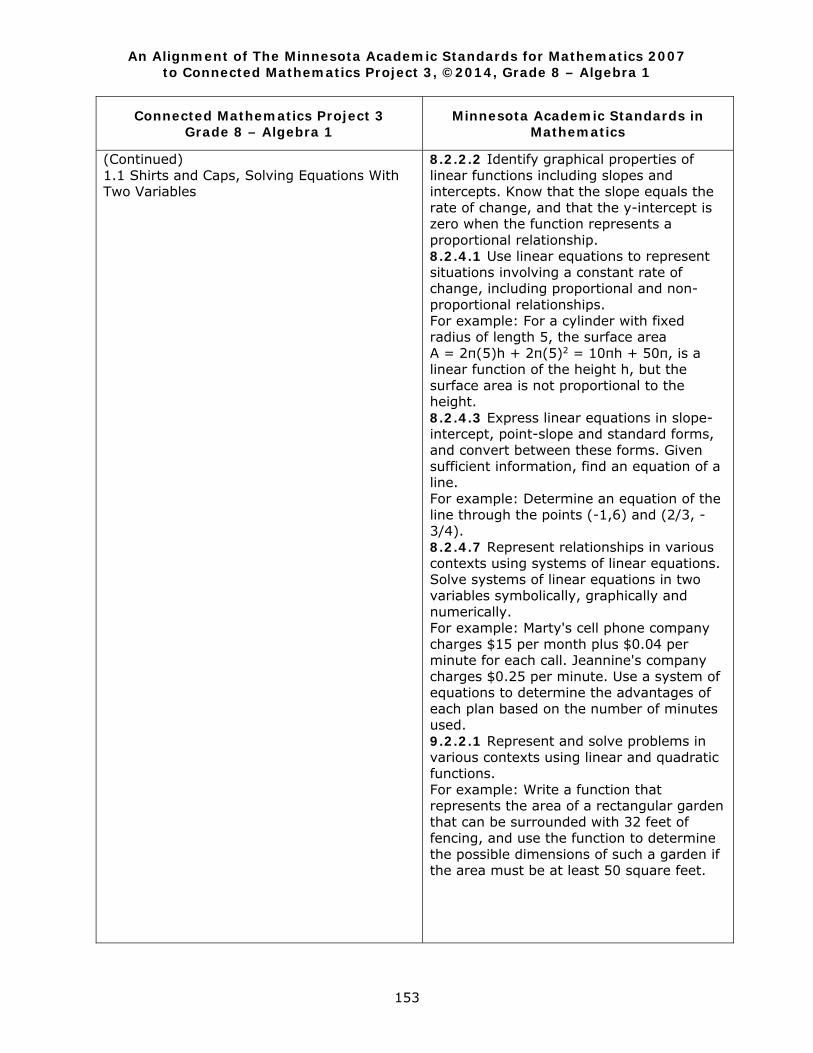
An Alignment of The Minnesota Academic Standards for Mathematics 2007 to Connected Mathematics Project 3, ©2014, Grade 8 – Algebra 1
153
Connected Mathematics Project 3 Grade 8 – Algebra 1
Minnesota Academic Standards in Mathematics
(Continued) 1.1 Shirts and Caps, Solving Equations With Two Variables
8.2.2.2 Identify graphical properties of linear functions including slopes and intercepts. Know that the slope equals the rate of change, and that the y-intercept is zero when the function represents a proportional relationship. 8.2.4.1 Use linear equations to represent situations involving a constant rate of change, including proportional and non-proportional relationships. For example: For a cylinder with fixed radius of length 5, the surface area A = 2π(5)h + 2π(5)2 = 10πh + 50π, is a linear function of the height h, but the surface area is not proportional to the height. 8.2.4.3 Express linear equations in slope-intercept, point-slope and standard forms, and convert between these forms. Given sufficient information, find an equation of a line. For example: Determine an equation of the line through the points (-1,6) and (2/3, - 3/4). 8.2.4.7 Represent relationships in various contexts using systems of linear equations. Solve systems of linear equations in two variables symbolically, graphically and numerically. For example: Marty's cell phone company charges $15 per month plus $0.04 per minute for each call. Jeannine's company charges $0.25 per minute. Use a system of equations to determine the advantages of each plan based on the number of minutes used. 9.2.2.1 Represent and solve problems in various contexts using linear and quadratic functions. For example: Write a function that represents the area of a rectangular garden that can be surrounded with 32 feet of fencing, and use the function to determine the possible dimensions of such a garden if the area must be at least 50 square feet.

An Alignment of The Minnesota Academic Standards for Mathematics 2007 to Connected Mathematics Project 3, ©2014, Grade 8 – Algebra 1
154
Connected Mathematics Project 3 Grade 8 – Algebra 1
Minnesota Academic Standards in Mathematics
1.2 Connecting Ax + By = C and y = mx + b
8.2.1.1 Understand that a function is a relationship between an independent variable and a dependent variable in which the value of the independent variable determines the value of the dependent variable. Use functional notation, such as f(x), to represent such relationships. For example: The relationship between the area of a square and the side length can be expressed as f (x) = x2. In this case, f (5) = 25, which represents the fact that a square of side length 5 units has area 25 units squared. 8.2.1.2 Use linear functions to represent relationships in which changing the input variable by some amount leads to a change in the output variable that is a constant times that amount. For example: Uncle Jim gave Emily $50 on the day she was born and $25 on each birthday after that. The function f (x) = 50 + 25x represents the amount of money Jim has given after x years. The rate of change is $25 per year. 8.2.1.3 Understand that a function is linear if it can be expressed in the form f (x) = mx + b or if its graph is a straight line. For example: The function f (x) = x 2 is not a linear function because its graph contains the points (1,1), (-1,1) and (0,0), which are not on a straight line. 8.2.2.1 Represent linear functions with tables, verbal descriptions, symbols, equations and graphs; translate from one representation to another. 8.2.2.2 Identify graphical properties of linear functions including slopes and intercepts. Know that the slope equals the rate of change, and that the y-intercept is zero when the function represents a proportional relationship.
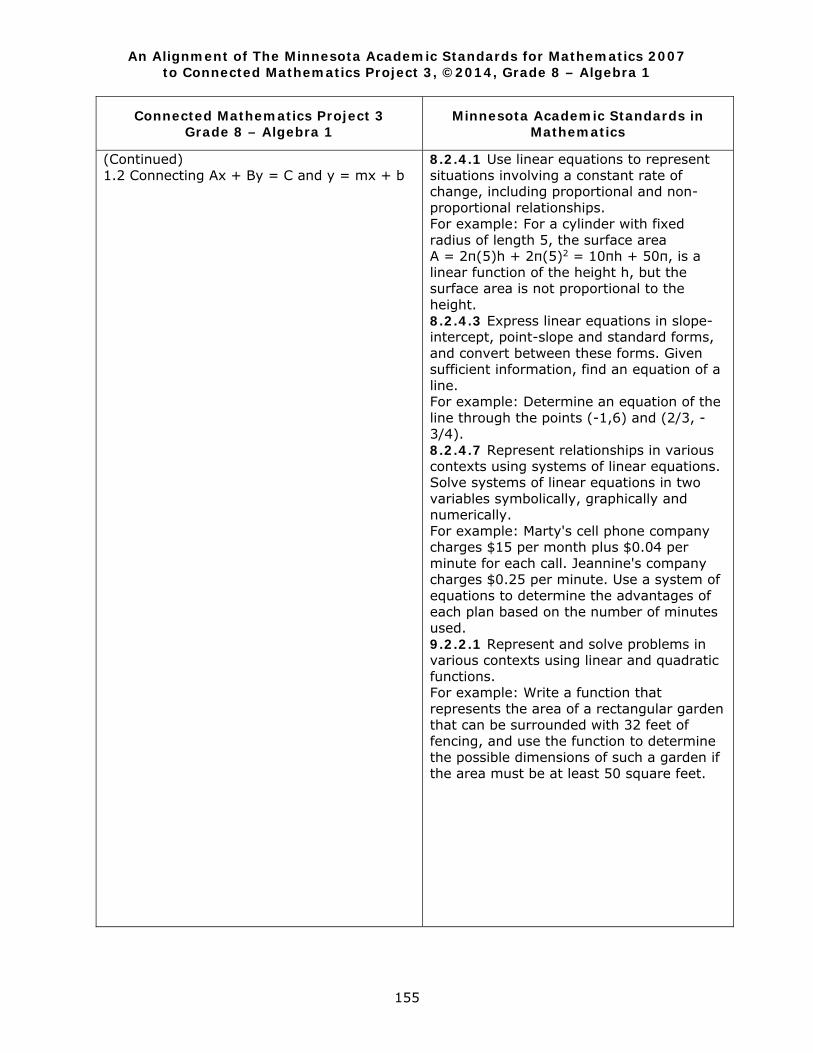
An Alignment of The Minnesota Academic Standards for Mathematics 2007 to Connected Mathematics Project 3, ©2014, Grade 8 – Algebra 1
155
Connected Mathematics Project 3 Grade 8 – Algebra 1
Minnesota Academic Standards in Mathematics
(Continued) 1.2 Connecting Ax + By = C and y = mx + b
8.2.4.1 Use linear equations to represent situations involving a constant rate of change, including proportional and non-proportional relationships. For example: For a cylinder with fixed radius of length 5, the surface area A = 2π(5)h + 2π(5)2 = 10πh + 50π, is a linear function of the height h, but the surface area is not proportional to the height. 8.2.4.3 Express linear equations in slope-intercept, point-slope and standard forms, and convert between these forms. Given sufficient information, find an equation of a line. For example: Determine an equation of the line through the points (-1,6) and (2/3, - 3/4). 8.2.4.7 Represent relationships in various contexts using systems of linear equations. Solve systems of linear equations in two variables symbolically, graphically and numerically. For example: Marty's cell phone company charges $15 per month plus $0.04 per minute for each call. Jeannine's company charges $0.25 per minute. Use a system of equations to determine the advantages of each plan based on the number of minutes used. 9.2.2.1 Represent and solve problems in various contexts using linear and quadratic functions. For example: Write a function that represents the area of a rectangular garden that can be surrounded with 32 feet of fencing, and use the function to determine the possible dimensions of such a garden if the area must be at least 50 square feet.

An Alignment of The Minnesota Academic Standards for Mathematics 2007 to Connected Mathematics Project 3, ©2014, Grade 8 – Algebra 1
156
Connected Mathematics Project 3 Grade 8 – Algebra 1
Minnesota Academic Standards in Mathematics
1.3 Booster Club Members, Intersecting Lines
8.2.1.1 Understand that a function is a relationship between an independent variable and a dependent variable in which the value of the independent variable determines the value of the dependent variable. Use functional notation, such as f(x), to represent such relationships. For example: The relationship between the area of a square and the side length can be expressed as f (x) = x2. In this case, f (5) = 25, which represents the fact that a square of side length 5 units has area 25 units squared. 8.2.1.2 Use linear functions to represent relationships in which changing the input variable by some amount leads to a change in the output variable that is a constant times that amount. For example: Uncle Jim gave Emily $50 on the day she was born and $25 on each birthday after that. The function f (x) = 50 + 25x represents the amount of money Jim has given after x years. The rate of change is $25 per year. 8.2.1.3 Understand that a function is linear if it can be expressed in the form f (x) = mx + b or if its graph is a straight line. For example: The function f (x) = x 2 is not a linear function because its graph contains the points (1,1), (-1,1) and (0,0), which are not on a straight line. 8.2.2.1 Represent linear functions with tables, verbal descriptions, symbols, equations and graphs; translate from one representation to another. 8.2.2.2 Identify graphical properties of linear functions including slopes and intercepts. Know that the slope equals the rate of change, and that the y-intercept is zero when the function represents a proportional relationship.
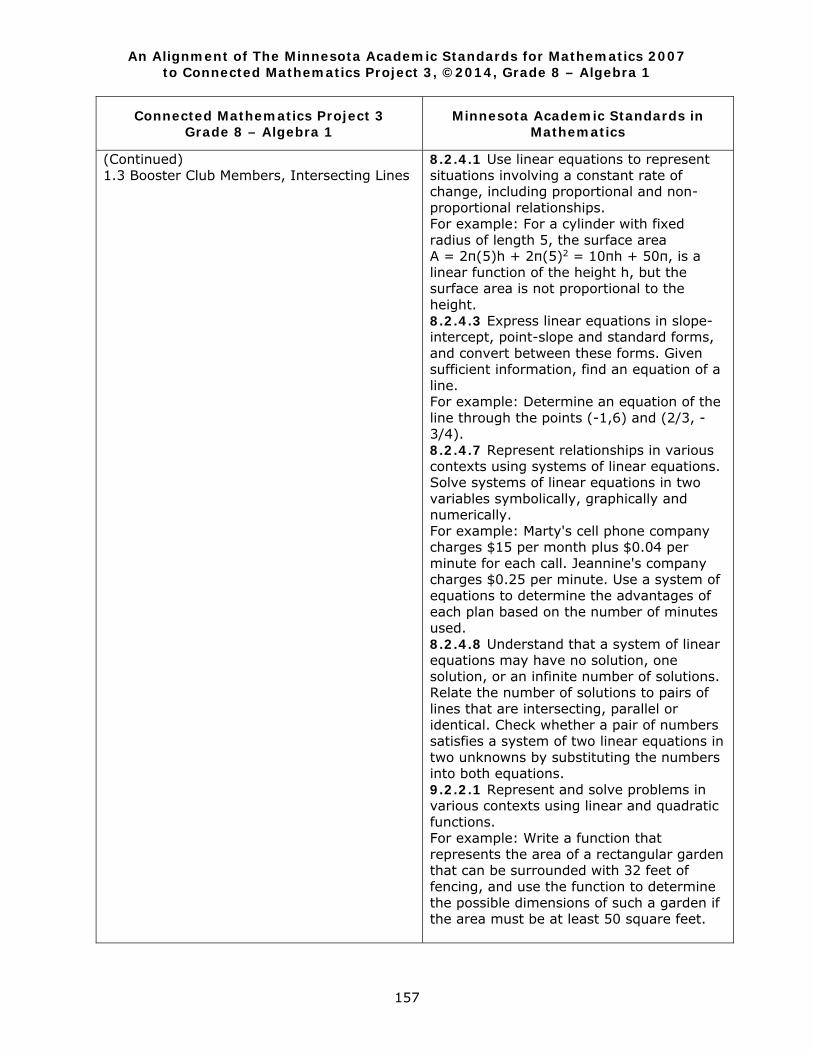
An Alignment of The Minnesota Academic Standards for Mathematics 2007 to Connected Mathematics Project 3, ©2014, Grade 8 – Algebra 1
157
Connected Mathematics Project 3 Grade 8 – Algebra 1
Minnesota Academic Standards in Mathematics
(Continued) 1.3 Booster Club Members, Intersecting Lines
8.2.4.1 Use linear equations to represent situations involving a constant rate of change, including proportional and non-proportional relationships. For example: For a cylinder with fixed radius of length 5, the surface area A = 2π(5)h + 2π(5)2 = 10πh + 50π, is a linear function of the height h, but the surface area is not proportional to the height. 8.2.4.3 Express linear equations in slope-intercept, point-slope and standard forms, and convert between these forms. Given sufficient information, find an equation of a line. For example: Determine an equation of the line through the points (-1,6) and (2/3, - 3/4). 8.2.4.7 Represent relationships in various contexts using systems of linear equations. Solve systems of linear equations in two variables symbolically, graphically and numerically. For example: Marty's cell phone company charges $15 per month plus $0.04 per minute for each call. Jeannine's company charges $0.25 per minute. Use a system of equations to determine the advantages of each plan based on the number of minutes used. 8.2.4.8 Understand that a system of linear equations may have no solution, one solution, or an infinite number of solutions. Relate the number of solutions to pairs of lines that are intersecting, parallel or identical. Check whether a pair of numbers satisfies a system of two linear equations in two unknowns by substituting the numbers into both equations. 9.2.2.1 Represent and solve problems in various contexts using linear and quadratic functions. For example: Write a function that represents the area of a rectangular garden that can be surrounded with 32 feet of fencing, and use the function to determine the possible dimensions of such a garden if the area must be at least 50 square feet.
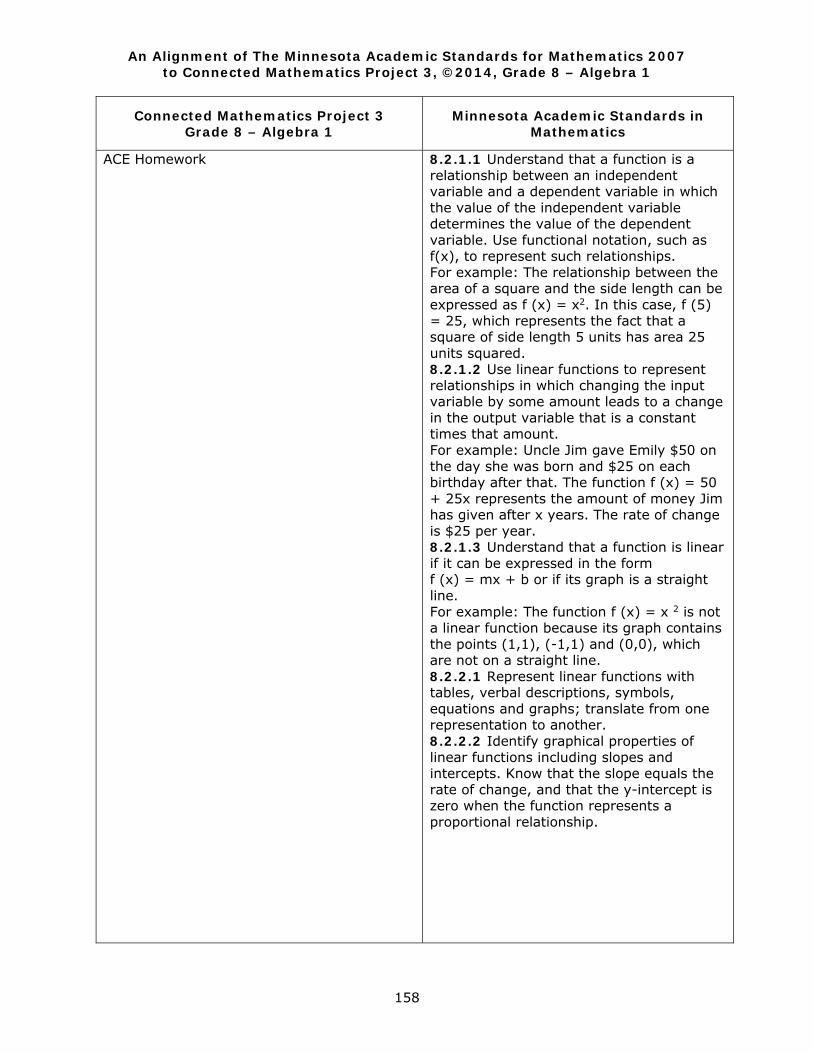
An Alignment of The Minnesota Academic Standards for Mathematics 2007 to Connected Mathematics Project 3, ©2014, Grade 8 – Algebra 1
158
Connected Mathematics Project 3 Grade 8 – Algebra 1
Minnesota Academic Standards in Mathematics
ACE Homework
8.2.1.1 Understand that a function is a relationship between an independent variable and a dependent variable in which the value of the independent variable determines the value of the dependent variable. Use functional notation, such as f(x), to represent such relationships. For example: The relationship between the area of a square and the side length can be expressed as f (x) = x2. In this case, f (5) = 25, which represents the fact that a square of side length 5 units has area 25 units squared. 8.2.1.2 Use linear functions to represent relationships in which changing the input variable by some amount leads to a change in the output variable that is a constant times that amount. For example: Uncle Jim gave Emily $50 on the day she was born and $25 on each birthday after that. The function f (x) = 50 + 25x represents the amount of money Jim has given after x years. The rate of change is $25 per year. 8.2.1.3 Understand that a function is linear if it can be expressed in the form f (x) = mx + b or if its graph is a straight line. For example: The function f (x) = x 2 is not a linear function because its graph contains the points (1,1), (-1,1) and (0,0), which are not on a straight line. 8.2.2.1 Represent linear functions with tables, verbal descriptions, symbols, equations and graphs; translate from one representation to another. 8.2.2.2 Identify graphical properties of linear functions including slopes and intercepts. Know that the slope equals the rate of change, and that the y-intercept is zero when the function represents a proportional relationship.

An Alignment of The Minnesota Academic Standards for Mathematics 2007 to Connected Mathematics Project 3, ©2014, Grade 8 – Algebra 1
159
Connected Mathematics Project 3 Grade 8 – Algebra 1
Minnesota Academic Standards in Mathematics
(Continued) ACE Homework
8.2.4.1 Use linear equations to represent situations involving a constant rate of change, including proportional and non-proportional relationships. For example: For a cylinder with fixed radius of length 5, the surface area A = 2π(5)h + 2π(5)2 = 10πh + 50π, is a linear function of the height h, but the surface area is not proportional to the height. 8.2.4.3 Express linear equations in slope-intercept, point-slope and standard forms, and convert between these forms. Given sufficient information, find an equation of a line. For example: Determine an equation of the line through the points (-1,6) and (2/3, - 3/4). 8.2.4.7 Represent relationships in various contexts using systems of linear equations. Solve systems of linear equations in two variables symbolically, graphically and numerically. For example: Marty's cell phone company charges $15 per month plus $0.04 per minute for each call. Jeannine's company charges $0.25 per minute. Use a system of equations to determine the advantages of each plan based on the number of minutes used. 8.2.4.8 Understand that a system of linear equations may have no solution, one solution, or an infinite number of solutions. Relate the number of solutions to pairs of lines that are intersecting, parallel or identical. Check whether a pair of numbers satisfies a system of two linear equations in two unknowns by substituting the numbers into both equations. 9.2.2.1 Represent and solve problems in various contexts using linear and quadratic functions. For example: Write a function that represents the area of a rectangular garden that can be surrounded with 32 feet of fencing, and use the function to determine the possible dimensions of such a garden if the area must be at least 50 square feet.
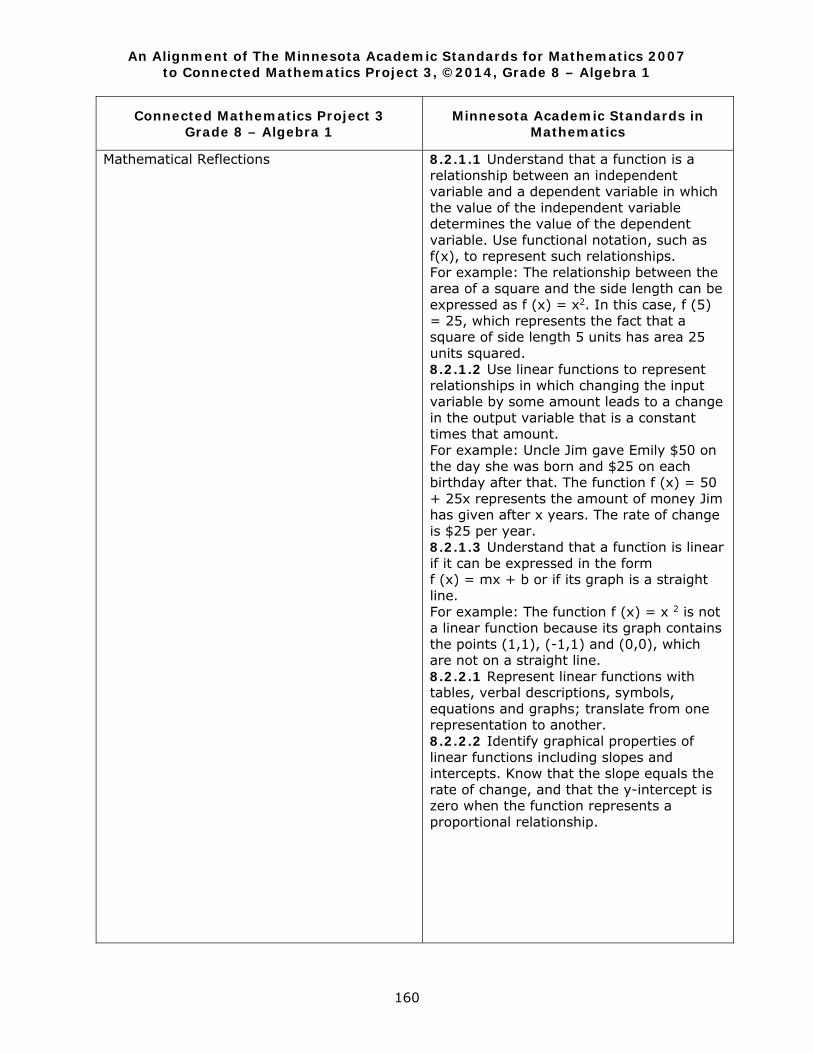
An Alignment of The Minnesota Academic Standards for Mathematics 2007 to Connected Mathematics Project 3, ©2014, Grade 8 – Algebra 1
160
Connected Mathematics Project 3 Grade 8 – Algebra 1
Minnesota Academic Standards in Mathematics
Mathematical Reflections
8.2.1.1 Understand that a function is a relationship between an independent variable and a dependent variable in which the value of the independent variable determines the value of the dependent variable. Use functional notation, such as f(x), to represent such relationships. For example: The relationship between the area of a square and the side length can be expressed as f (x) = x2. In this case, f (5) = 25, which represents the fact that a square of side length 5 units has area 25 units squared. 8.2.1.2 Use linear functions to represent relationships in which changing the input variable by some amount leads to a change in the output variable that is a constant times that amount. For example: Uncle Jim gave Emily $50 on the day she was born and $25 on each birthday after that. The function f (x) = 50 + 25x represents the amount of money Jim has given after x years. The rate of change is $25 per year. 8.2.1.3 Understand that a function is linear if it can be expressed in the form f (x) = mx + b or if its graph is a straight line. For example: The function f (x) = x 2 is not a linear function because its graph contains the points (1,1), (-1,1) and (0,0), which are not on a straight line. 8.2.2.1 Represent linear functions with tables, verbal descriptions, symbols, equations and graphs; translate from one representation to another. 8.2.2.2 Identify graphical properties of linear functions including slopes and intercepts. Know that the slope equals the rate of change, and that the y-intercept is zero when the function represents a proportional relationship.
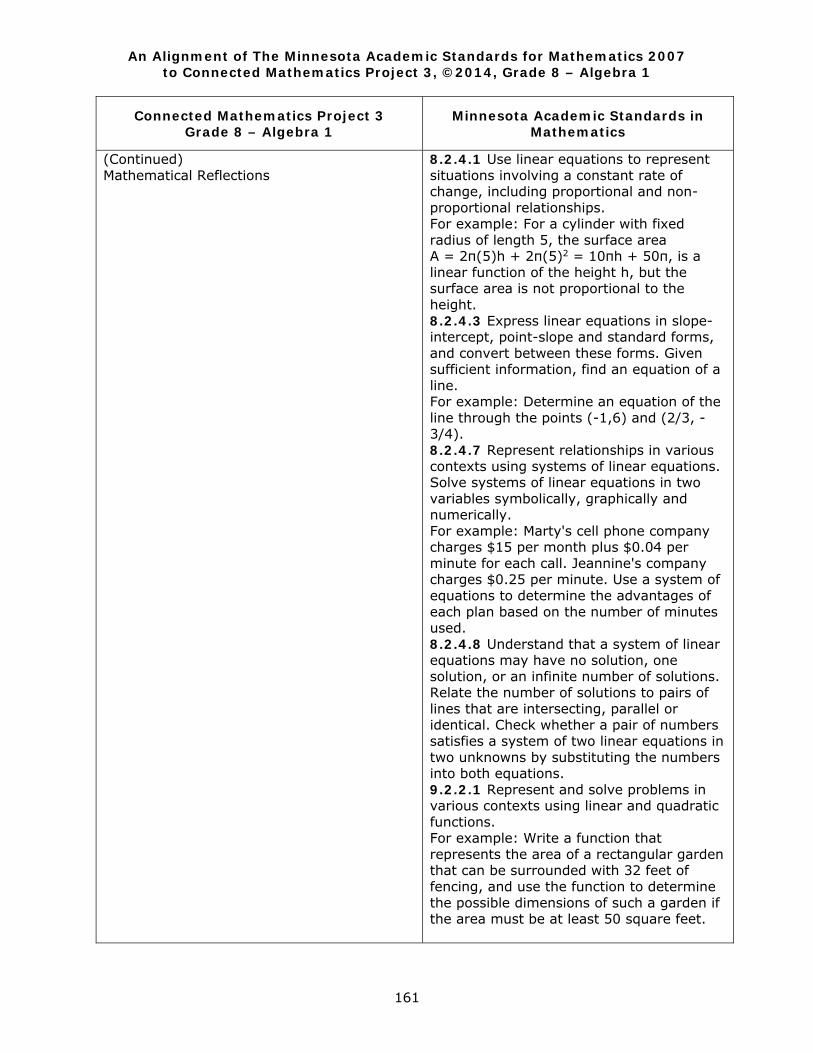
An Alignment of The Minnesota Academic Standards for Mathematics 2007 to Connected Mathematics Project 3, ©2014, Grade 8 – Algebra 1
161
Connected Mathematics Project 3 Grade 8 – Algebra 1
Minnesota Academic Standards in Mathematics
(Continued) Mathematical Reflections
8.2.4.1 Use linear equations to represent situations involving a constant rate of change, including proportional and non-proportional relationships. For example: For a cylinder with fixed radius of length 5, the surface area A = 2π(5)h + 2π(5)2 = 10πh + 50π, is a linear function of the height h, but the surface area is not proportional to the height. 8.2.4.3 Express linear equations in slope-intercept, point-slope and standard forms, and convert between these forms. Given sufficient information, find an equation of a line. For example: Determine an equation of the line through the points (-1,6) and (2/3, - 3/4). 8.2.4.7 Represent relationships in various contexts using systems of linear equations. Solve systems of linear equations in two variables symbolically, graphically and numerically. For example: Marty's cell phone company charges $15 per month plus $0.04 per minute for each call. Jeannine's company charges $0.25 per minute. Use a system of equations to determine the advantages of each plan based on the number of minutes used. 8.2.4.8 Understand that a system of linear equations may have no solution, one solution, or an infinite number of solutions. Relate the number of solutions to pairs of lines that are intersecting, parallel or identical. Check whether a pair of numbers satisfies a system of two linear equations in two unknowns by substituting the numbers into both equations. 9.2.2.1 Represent and solve problems in various contexts using linear and quadratic functions. For example: Write a function that represents the area of a rectangular garden that can be surrounded with 32 feet of fencing, and use the function to determine the possible dimensions of such a garden if the area must be at least 50 square feet.
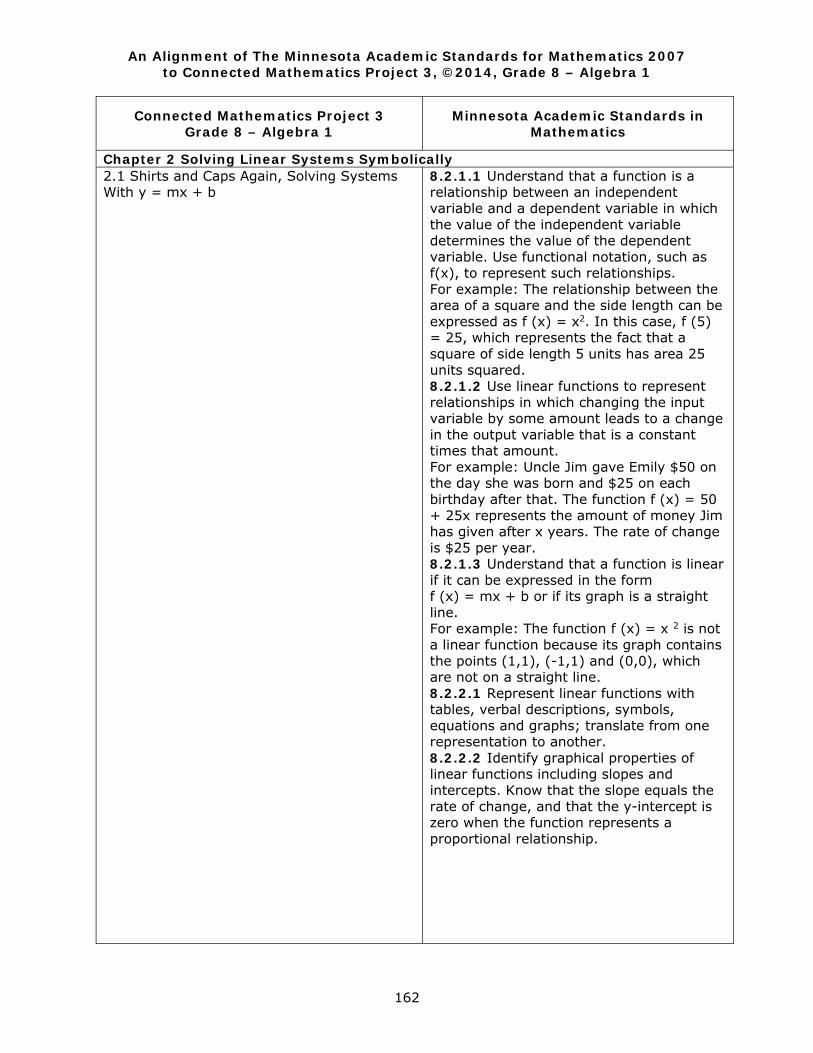
An Alignment of The Minnesota Academic Standards for Mathematics 2007 to Connected Mathematics Project 3, ©2014, Grade 8 – Algebra 1
162
Connected Mathematics Project 3 Grade 8 – Algebra 1
Minnesota Academic Standards in Mathematics
Chapter 2 Solving Linear Systems Symbolically 2.1 Shirts and Caps Again, Solving Systems With y = mx + b
8.2.1.1 Understand that a function is a relationship between an independent variable and a dependent variable in which the value of the independent variable determines the value of the dependent variable. Use functional notation, such as f(x), to represent such relationships. For example: The relationship between the area of a square and the side length can be expressed as f (x) = x2. In this case, f (5) = 25, which represents the fact that a square of side length 5 units has area 25 units squared. 8.2.1.2 Use linear functions to represent relationships in which changing the input variable by some amount leads to a change in the output variable that is a constant times that amount. For example: Uncle Jim gave Emily $50 on the day she was born and $25 on each birthday after that. The function f (x) = 50 + 25x represents the amount of money Jim has given after x years. The rate of change is $25 per year. 8.2.1.3 Understand that a function is linear if it can be expressed in the form f (x) = mx + b or if its graph is a straight line. For example: The function f (x) = x 2 is not a linear function because its graph contains the points (1,1), (-1,1) and (0,0), which are not on a straight line. 8.2.2.1 Represent linear functions with tables, verbal descriptions, symbols, equations and graphs; translate from one representation to another. 8.2.2.2 Identify graphical properties of linear functions including slopes and intercepts. Know that the slope equals the rate of change, and that the y-intercept is zero when the function represents a proportional relationship.

An Alignment of The Minnesota Academic Standards for Mathematics 2007 to Connected Mathematics Project 3, ©2014, Grade 8 – Algebra 1
163
Connected Mathematics Project 3 Grade 8 – Algebra 1
Minnesota Academic Standards in Mathematics
(Continued) 2.1 Shirts and Caps Again, Solving Systems With y = mx + b
8.2.4.1 Use linear equations to represent situations involving a constant rate of change, including proportional and non-proportional relationships. For example: For a cylinder with fixed radius of length 5, the surface area A = 2π(5)h + 2π(5)2 = 10πh + 50π, is a linear function of the height h, but the surface area is not proportional to the height. 8.2.4.3 Express linear equations in slope-intercept, point-slope and standard forms, and convert between these forms. Given sufficient information, find an equation of a line. For example: Determine an equation of the line through the points (-1,6) and (2/3, - 3/4). 8.2.4.7 Represent relationships in various contexts using systems of linear equations. Solve systems of linear equations in two variables symbolically, graphically and numerically. For example: Marty's cell phone company charges $15 per month plus $0.04 per minute for each call. Jeannine's company charges $0.25 per minute. Use a system of equations to determine the advantages of each plan based on the number of minutes used. 9.2.2.1 Represent and solve problems in various contexts using linear and quadratic functions. For example: Write a function that represents the area of a rectangular garden that can be surrounded with 32 feet of fencing, and use the function to determine the possible dimensions of such a garden if the area must be at least 50 square feet.
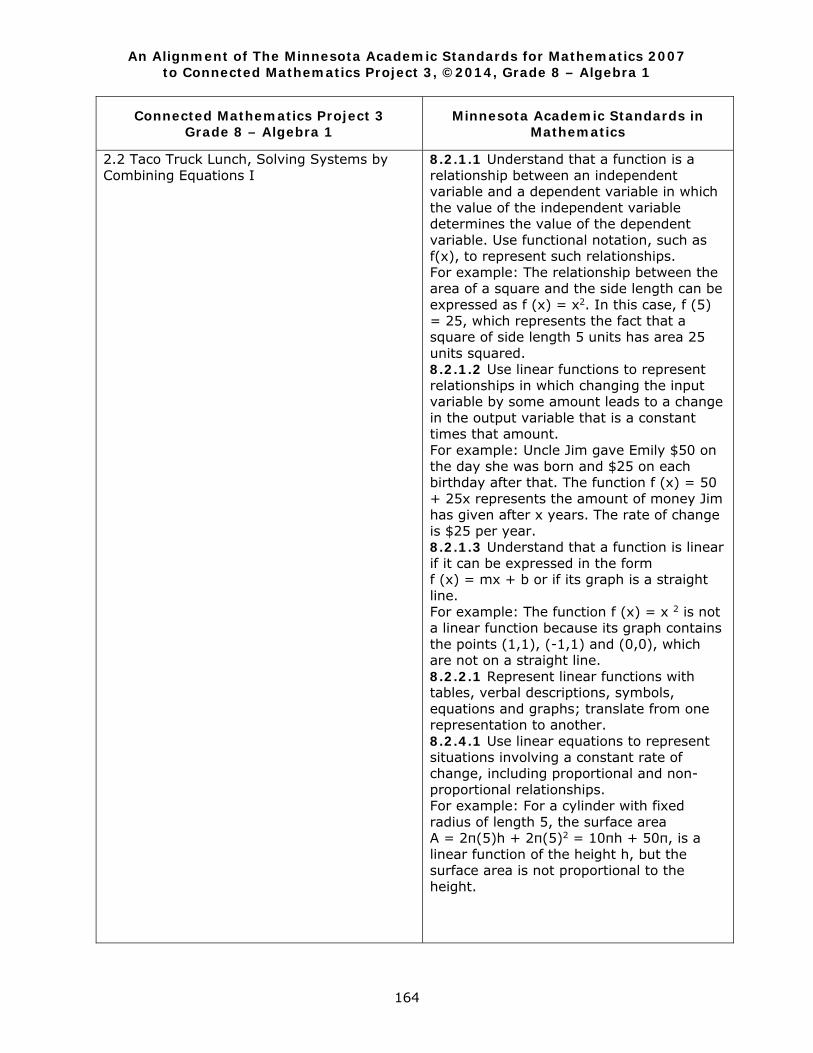
An Alignment of The Minnesota Academic Standards for Mathematics 2007 to Connected Mathematics Project 3, ©2014, Grade 8 – Algebra 1
164
Connected Mathematics Project 3 Grade 8 – Algebra 1
Minnesota Academic Standards in Mathematics
2.2 Taco Truck Lunch, Solving Systems by Combining Equations I
8.2.1.1 Understand that a function is a relationship between an independent variable and a dependent variable in which the value of the independent variable determines the value of the dependent variable. Use functional notation, such as f(x), to represent such relationships. For example: The relationship between the area of a square and the side length can be expressed as f (x) = x2. In this case, f (5) = 25, which represents the fact that a square of side length 5 units has area 25 units squared. 8.2.1.2 Use linear functions to represent relationships in which changing the input variable by some amount leads to a change in the output variable that is a constant times that amount. For example: Uncle Jim gave Emily $50 on the day she was born and $25 on each birthday after that. The function f (x) = 50 + 25x represents the amount of money Jim has given after x years. The rate of change is $25 per year. 8.2.1.3 Understand that a function is linear if it can be expressed in the form f (x) = mx + b or if its graph is a straight line. For example: The function f (x) = x 2 is not a linear function because its graph contains the points (1,1), (-1,1) and (0,0), which are not on a straight line. 8.2.2.1 Represent linear functions with tables, verbal descriptions, symbols, equations and graphs; translate from one representation to another. 8.2.4.1 Use linear equations to represent situations involving a constant rate of change, including proportional and non-proportional relationships. For example: For a cylinder with fixed radius of length 5, the surface area A = 2π(5)h + 2π(5)2 = 10πh + 50π, is a linear function of the height h, but the surface area is not proportional to the height.
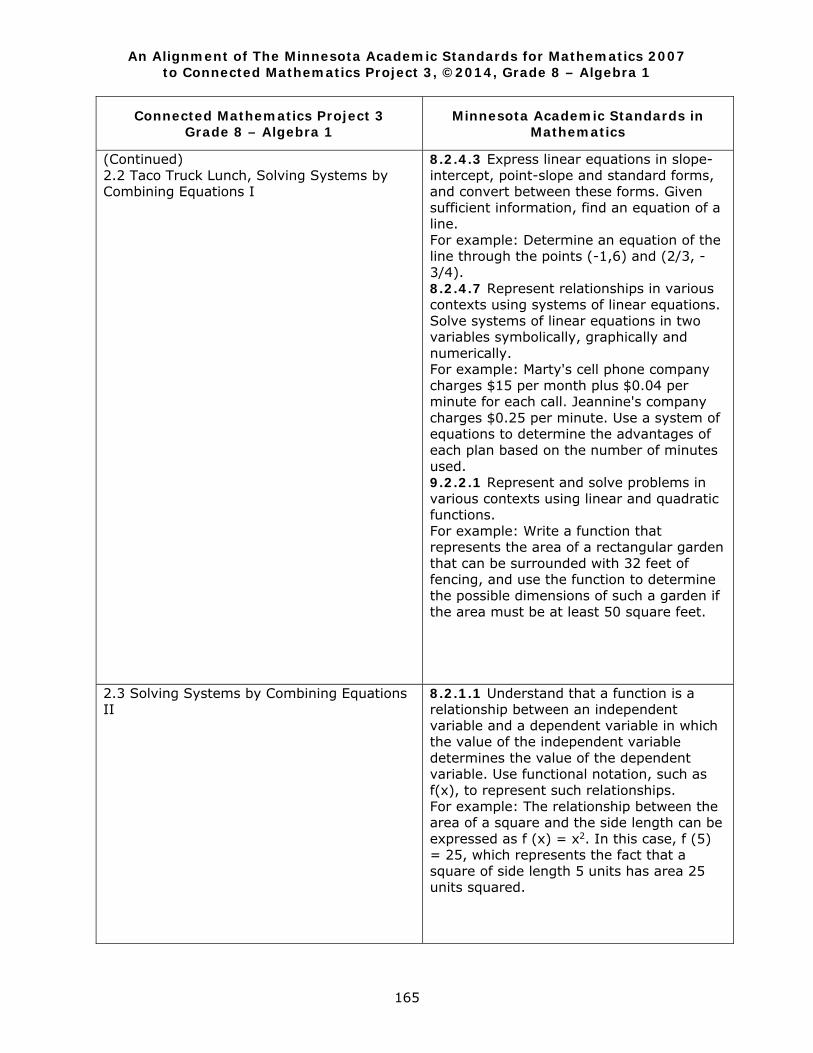
An Alignment of The Minnesota Academic Standards for Mathematics 2007 to Connected Mathematics Project 3, ©2014, Grade 8 – Algebra 1
165
Connected Mathematics Project 3 Grade 8 – Algebra 1
Minnesota Academic Standards in Mathematics
(Continued) 2.2 Taco Truck Lunch, Solving Systems by Combining Equations I
8.2.4.3 Express linear equations in slope-intercept, point-slope and standard forms, and convert between these forms. Given sufficient information, find an equation of a line. For example: Determine an equation of the line through the points (-1,6) and (2/3, - 3/4). 8.2.4.7 Represent relationships in various contexts using systems of linear equations. Solve systems of linear equations in two variables symbolically, graphically and numerically. For example: Marty's cell phone company charges $15 per month plus $0.04 per minute for each call. Jeannine's company charges $0.25 per minute. Use a system of equations to determine the advantages of each plan based on the number of minutes used. 9.2.2.1 Represent and solve problems in various contexts using linear and quadratic functions. For example: Write a function that represents the area of a rectangular garden that can be surrounded with 32 feet of fencing, and use the function to determine the possible dimensions of such a garden if the area must be at least 50 square feet.
2.3 Solving Systems by Combining Equations II
8.2.1.1 Understand that a function is a relationship between an independent variable and a dependent variable in which the value of the independent variable determines the value of the dependent variable. Use functional notation, such as f(x), to represent such relationships. For example: The relationship between the area of a square and the side length can be expressed as f (x) = x2. In this case, f (5) = 25, which represents the fact that a square of side length 5 units has area 25 units squared.

An Alignment of The Minnesota Academic Standards for Mathematics 2007 to Connected Mathematics Project 3, ©2014, Grade 8 – Algebra 1
166
Connected Mathematics Project 3 Grade 8 – Algebra 1
Minnesota Academic Standards in Mathematics
(Continued) 2.3 Solving Systems by Combining Equations II
8.2.1.2 Use linear functions to represent relationships in which changing the input variable by some amount leads to a change in the output variable that is a constant times that amount. For example: Uncle Jim gave Emily $50 on the day she was born and $25 on each birthday after that. The function f (x) = 50 + 25x represents the amount of money Jim has given after x years. The rate of change is $25 per year. 8.2.1.3 Understand that a function is linear if it can be expressed in the form f (x) = mx + b or if its graph is a straight line. For example: The function f (x) = x 2 is not a linear function because its graph contains the points (1,1), (-1,1) and (0,0), which are not on a straight line. 8.2.2.1 Represent linear functions with tables, verbal descriptions, symbols, equations and graphs; translate from one representation to another. 8.2.4.1 Use linear equations to represent situations involving a constant rate of change, including proportional and non-proportional relationships. For example: For a cylinder with fixed radius of length 5, the surface area A = 2π(5)h + 2π(5)2 = 10πh + 50π, is a linear function of the height h, but the surface area is not proportional to the height. 8.2.4.3 Express linear equations in slope-intercept, point-slope and standard forms, and convert between these forms. Given sufficient information, find an equation of a line. For example: Determine an equation of the line through the points (-1,6) and (2/3, - 3/4).
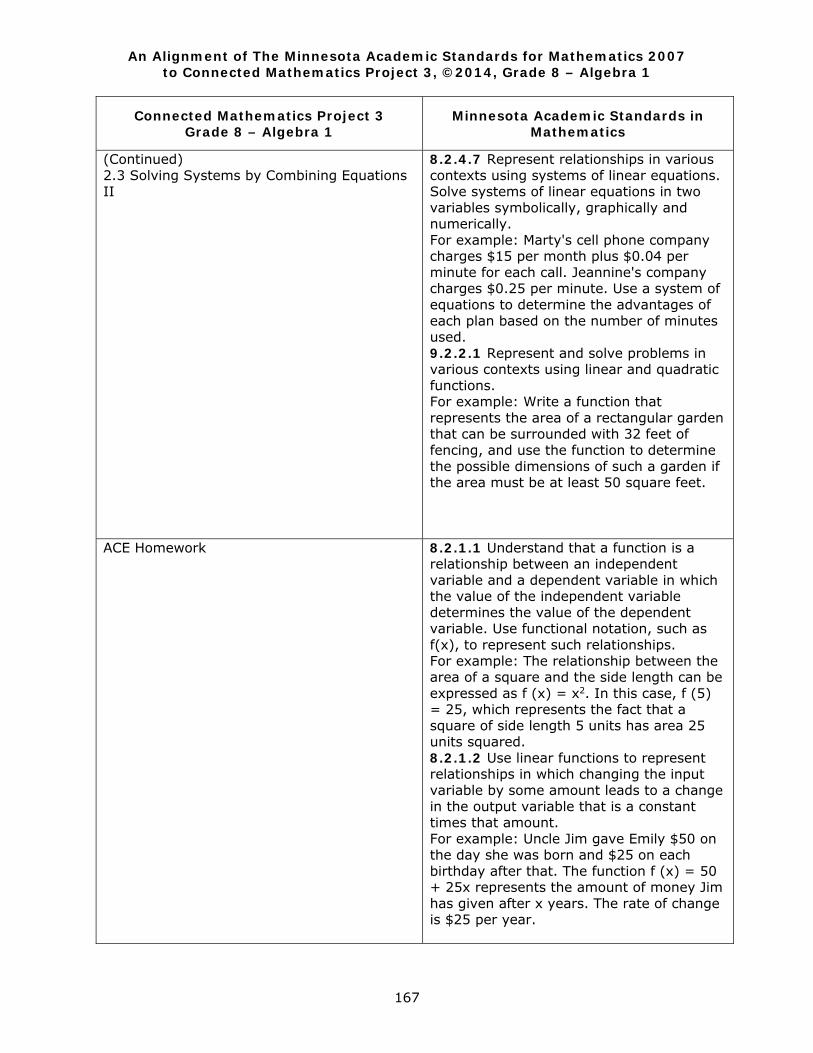
An Alignment of The Minnesota Academic Standards for Mathematics 2007 to Connected Mathematics Project 3, ©2014, Grade 8 – Algebra 1
167
Connected Mathematics Project 3 Grade 8 – Algebra 1
Minnesota Academic Standards in Mathematics
(Continued) 2.3 Solving Systems by Combining Equations II
8.2.4.7 Represent relationships in various contexts using systems of linear equations. Solve systems of linear equations in two variables symbolically, graphically and numerically. For example: Marty's cell phone company charges $15 per month plus $0.04 per minute for each call. Jeannine's company charges $0.25 per minute. Use a system of equations to determine the advantages of each plan based on the number of minutes used. 9.2.2.1 Represent and solve problems in various contexts using linear and quadratic functions. For example: Write a function that represents the area of a rectangular garden that can be surrounded with 32 feet of fencing, and use the function to determine the possible dimensions of such a garden if the area must be at least 50 square feet.
ACE Homework
8.2.1.1 Understand that a function is a relationship between an independent variable and a dependent variable in which the value of the independent variable determines the value of the dependent variable. Use functional notation, such as f(x), to represent such relationships. For example: The relationship between the area of a square and the side length can be expressed as f (x) = x2. In this case, f (5) = 25, which represents the fact that a square of side length 5 units has area 25 units squared. 8.2.1.2 Use linear functions to represent relationships in which changing the input variable by some amount leads to a change in the output variable that is a constant times that amount. For example: Uncle Jim gave Emily $50 on the day she was born and $25 on each birthday after that. The function f (x) = 50 + 25x represents the amount of money Jim has given after x years. The rate of change is $25 per year.
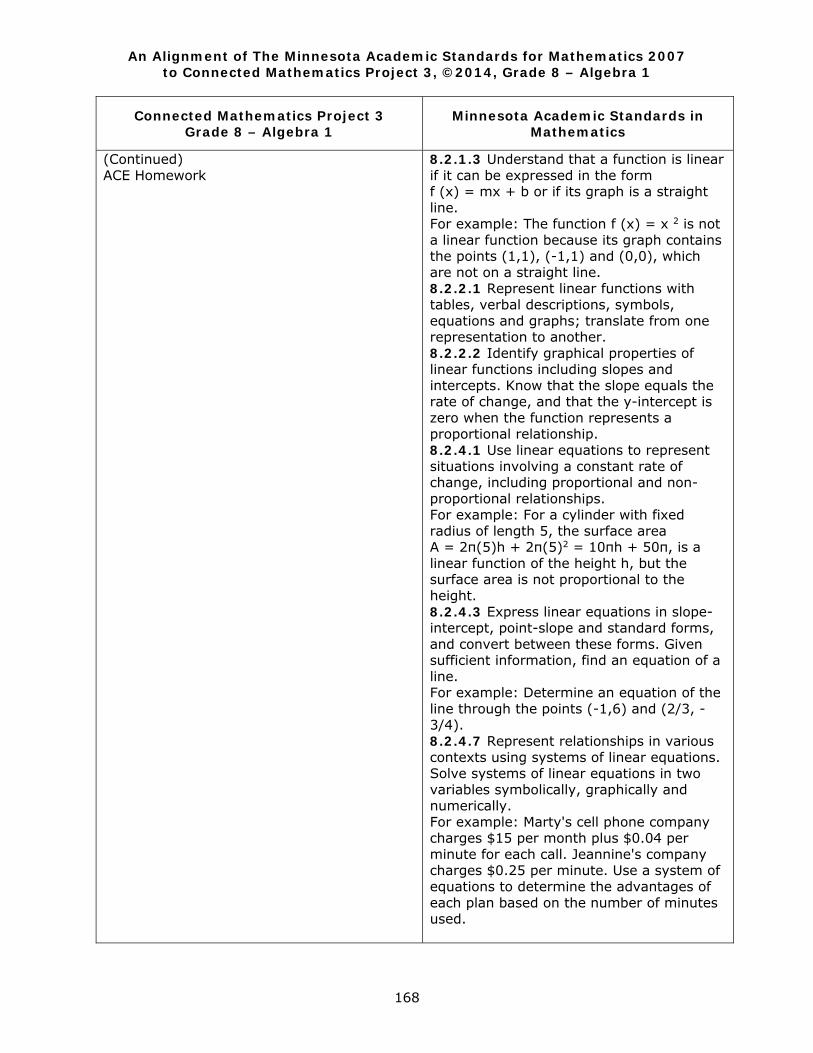
An Alignment of The Minnesota Academic Standards for Mathematics 2007 to Connected Mathematics Project 3, ©2014, Grade 8 – Algebra 1
168
Connected Mathematics Project 3 Grade 8 – Algebra 1
Minnesota Academic Standards in Mathematics
(Continued) ACE Homework
8.2.1.3 Understand that a function is linear if it can be expressed in the form f (x) = mx + b or if its graph is a straight line. For example: The function f (x) = x 2 is not a linear function because its graph contains the points (1,1), (-1,1) and (0,0), which are not on a straight line. 8.2.2.1 Represent linear functions with tables, verbal descriptions, symbols, equations and graphs; translate from one representation to another. 8.2.2.2 Identify graphical properties of linear functions including slopes and intercepts. Know that the slope equals the rate of change, and that the y-intercept is zero when the function represents a proportional relationship. 8.2.4.1 Use linear equations to represent situations involving a constant rate of change, including proportional and non-proportional relationships. For example: For a cylinder with fixed radius of length 5, the surface area A = 2π(5)h + 2π(5)2 = 10πh + 50π, is a linear function of the height h, but the surface area is not proportional to the height. 8.2.4.3 Express linear equations in slope-intercept, point-slope and standard forms, and convert between these forms. Given sufficient information, find an equation of a line. For example: Determine an equation of the line through the points (-1,6) and (2/3, - 3/4). 8.2.4.7 Represent relationships in various contexts using systems of linear equations. Solve systems of linear equations in two variables symbolically, graphically and numerically. For example: Marty's cell phone company charges $15 per month plus $0.04 per minute for each call. Jeannine's company charges $0.25 per minute. Use a system of equations to determine the advantages of each plan based on the number of minutes used.
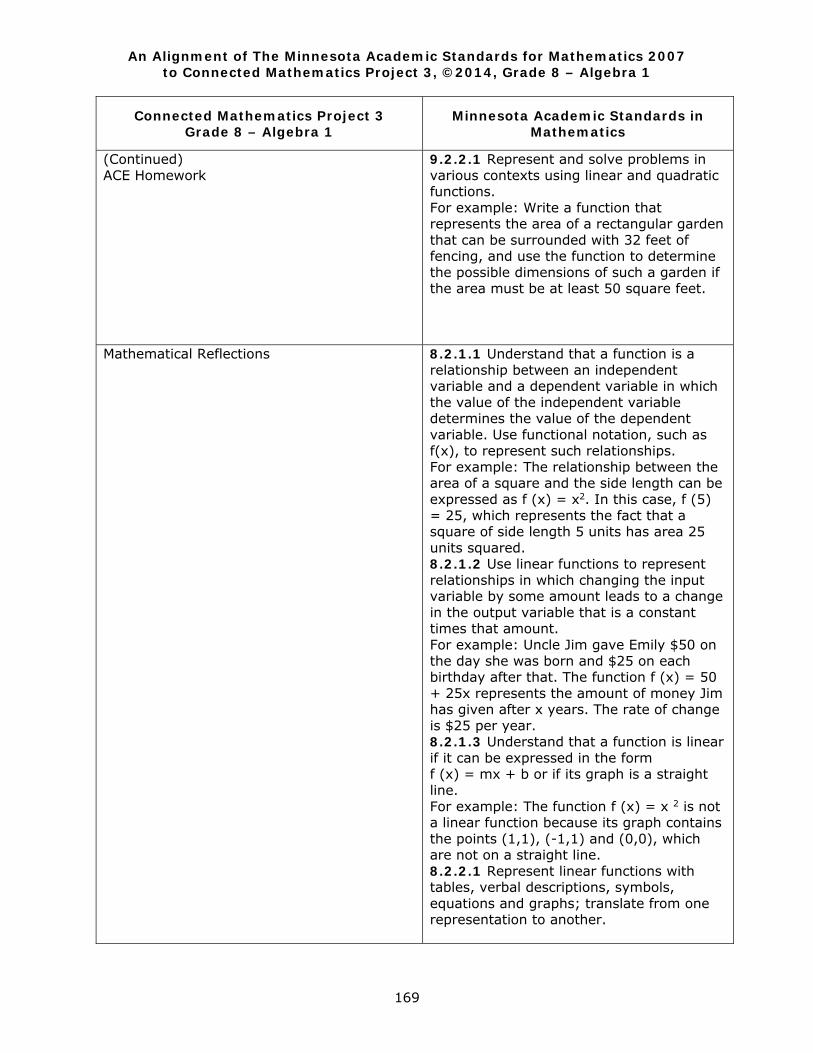
An Alignment of The Minnesota Academic Standards for Mathematics 2007 to Connected Mathematics Project 3, ©2014, Grade 8 – Algebra 1
169
Connected Mathematics Project 3 Grade 8 – Algebra 1
Minnesota Academic Standards in Mathematics
(Continued) ACE Homework
9.2.2.1 Represent and solve problems in various contexts using linear and quadratic functions. For example: Write a function that represents the area of a rectangular garden that can be surrounded with 32 feet of fencing, and use the function to determine the possible dimensions of such a garden if the area must be at least 50 square feet.
Mathematical Reflections
8.2.1.1 Understand that a function is a relationship between an independent variable and a dependent variable in which the value of the independent variable determines the value of the dependent variable. Use functional notation, such as f(x), to represent such relationships. For example: The relationship between the area of a square and the side length can be expressed as f (x) = x2. In this case, f (5) = 25, which represents the fact that a square of side length 5 units has area 25 units squared. 8.2.1.2 Use linear functions to represent relationships in which changing the input variable by some amount leads to a change in the output variable that is a constant times that amount. For example: Uncle Jim gave Emily $50 on the day she was born and $25 on each birthday after that. The function f (x) = 50 + 25x represents the amount of money Jim has given after x years. The rate of change is $25 per year. 8.2.1.3 Understand that a function is linear if it can be expressed in the form f (x) = mx + b or if its graph is a straight line. For example: The function f (x) = x 2 is not a linear function because its graph contains the points (1,1), (-1,1) and (0,0), which are not on a straight line. 8.2.2.1 Represent linear functions with tables, verbal descriptions, symbols, equations and graphs; translate from one representation to another.
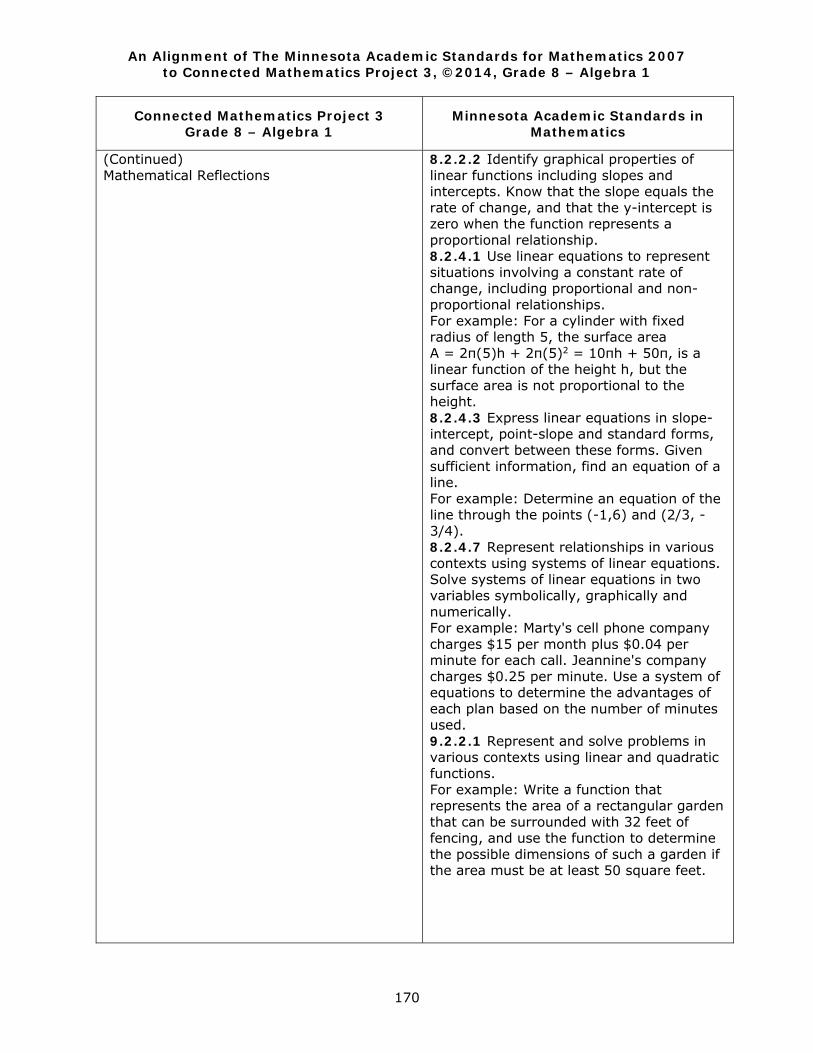
An Alignment of The Minnesota Academic Standards for Mathematics 2007 to Connected Mathematics Project 3, ©2014, Grade 8 – Algebra 1
170
Connected Mathematics Project 3 Grade 8 – Algebra 1
Minnesota Academic Standards in Mathematics
(Continued) Mathematical Reflections
8.2.2.2 Identify graphical properties of linear functions including slopes and intercepts. Know that the slope equals the rate of change, and that the y-intercept is zero when the function represents a proportional relationship. 8.2.4.1 Use linear equations to represent situations involving a constant rate of change, including proportional and non-proportional relationships. For example: For a cylinder with fixed radius of length 5, the surface area A = 2π(5)h + 2π(5)2 = 10πh + 50π, is a linear function of the height h, but the surface area is not proportional to the height. 8.2.4.3 Express linear equations in slope-intercept, point-slope and standard forms, and convert between these forms. Given sufficient information, find an equation of a line. For example: Determine an equation of the line through the points (-1,6) and (2/3, - 3/4). 8.2.4.7 Represent relationships in various contexts using systems of linear equations. Solve systems of linear equations in two variables symbolically, graphically and numerically. For example: Marty's cell phone company charges $15 per month plus $0.04 per minute for each call. Jeannine's company charges $0.25 per minute. Use a system of equations to determine the advantages of each plan based on the number of minutes used. 9.2.2.1 Represent and solve problems in various contexts using linear and quadratic functions. For example: Write a function that represents the area of a rectangular garden that can be surrounded with 32 feet of fencing, and use the function to determine the possible dimensions of such a garden if the area must be at least 50 square feet.
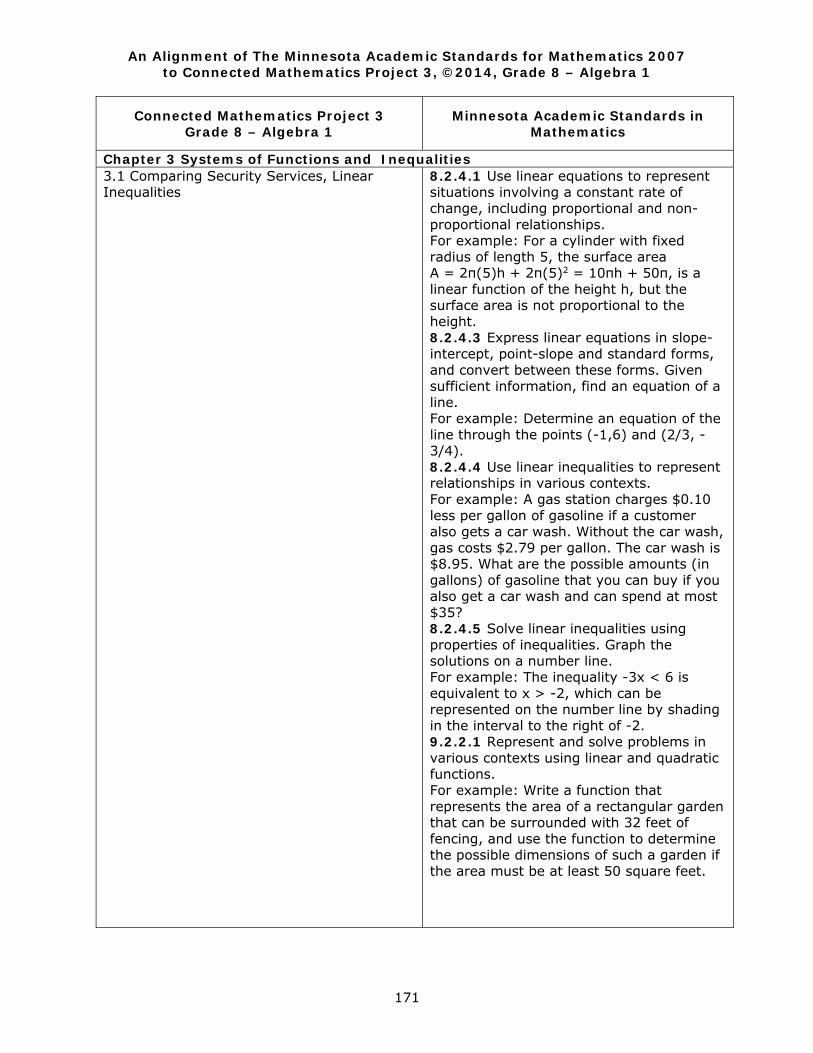
An Alignment of The Minnesota Academic Standards for Mathematics 2007 to Connected Mathematics Project 3, ©2014, Grade 8 – Algebra 1
171
Connected Mathematics Project 3 Grade 8 – Algebra 1
Minnesota Academic Standards in Mathematics
Chapter 3 Systems of Functions and Inequalities 3.1 Comparing Security Services, Linear Inequalities
8.2.4.1 Use linear equations to represent situations involving a constant rate of change, including proportional and non-proportional relationships. For example: For a cylinder with fixed radius of length 5, the surface area A = 2π(5)h + 2π(5)2 = 10πh + 50π, is a linear function of the height h, but the surface area is not proportional to the height. 8.2.4.3 Express linear equations in slope-intercept, point-slope and standard forms, and convert between these forms. Given sufficient information, find an equation of a line. For example: Determine an equation of the line through the points (-1,6) and (2/3, - 3/4). 8.2.4.4 Use linear inequalities to represent relationships in various contexts. For example: A gas station charges $0.10 less per gallon of gasoline if a customer also gets a car wash. Without the car wash, gas costs $2.79 per gallon. The car wash is $8.95. What are the possible amounts (in gallons) of gasoline that you can buy if you also get a car wash and can spend at most $35? 8.2.4.5 Solve linear inequalities using properties of inequalities. Graph the solutions on a number line. For example: The inequality -3x < 6 is equivalent to x > -2, which can be represented on the number line by shading in the interval to the right of -2. 9.2.2.1 Represent and solve problems in various contexts using linear and quadratic functions. For example: Write a function that represents the area of a rectangular garden that can be surrounded with 32 feet of fencing, and use the function to determine the possible dimensions of such a garden if the area must be at least 50 square feet.
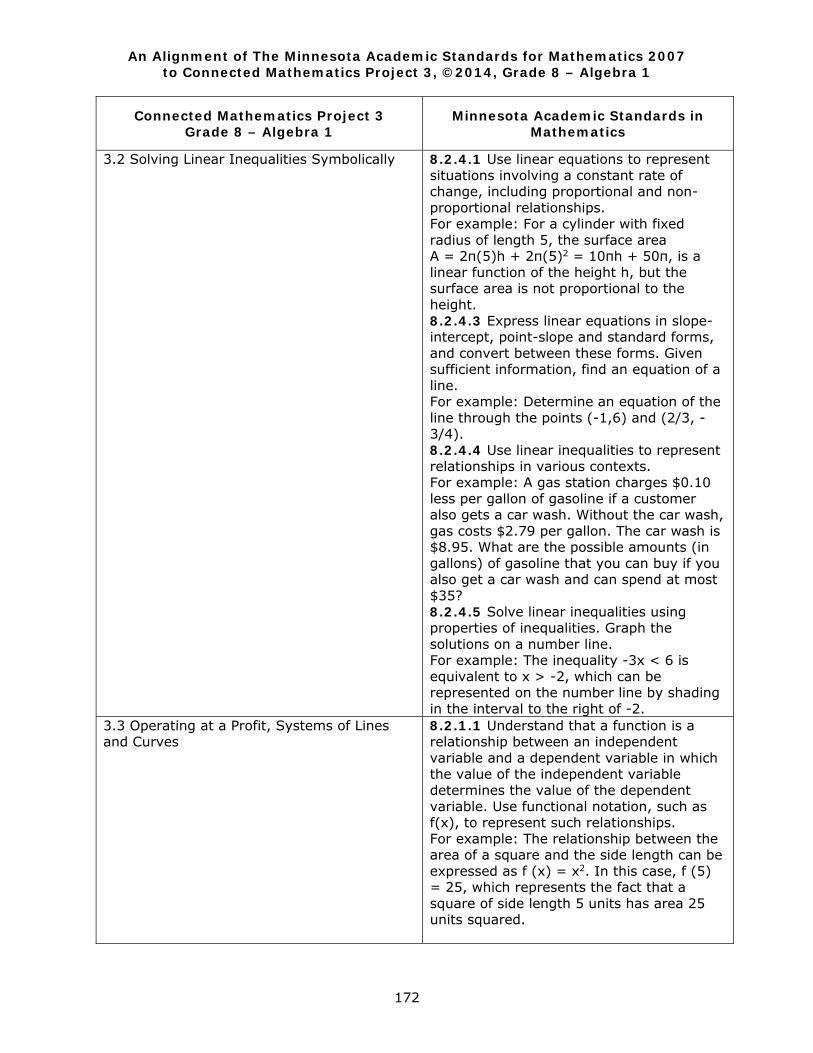
An Alignment of The Minnesota Academic Standards for Mathematics 2007 to Connected Mathematics Project 3, ©2014, Grade 8 – Algebra 1
172
Connected Mathematics Project 3 Grade 8 – Algebra 1
Minnesota Academic Standards in Mathematics
3.2 Solving Linear Inequalities Symbolically
8.2.4.1 Use linear equations to represent situations involving a constant rate of change, including proportional and non-proportional relationships. For example: For a cylinder with fixed radius of length 5, the surface area A = 2π(5)h + 2π(5)2 = 10πh + 50π, is a linear function of the height h, but the surface area is not proportional to the height. 8.2.4.3 Express linear equations in slope-intercept, point-slope and standard forms, and convert between these forms. Given sufficient information, find an equation of a line. For example: Determine an equation of the line through the points (-1,6) and (2/3, - 3/4). 8.2.4.4 Use linear inequalities to represent relationships in various contexts. For example: A gas station charges $0.10 less per gallon of gasoline if a customer also gets a car wash. Without the car wash, gas costs $2.79 per gallon. The car wash is $8.95. What are the possible amounts (in gallons) of gasoline that you can buy if you also get a car wash and can spend at most $35? 8.2.4.5 Solve linear inequalities using properties of inequalities. Graph the solutions on a number line. For example: The inequality -3x < 6 is equivalent to x > -2, which can be represented on the number line by shading in the interval to the right of -2.
3.3 Operating at a Profit, Systems of Lines and Curves
8.2.1.1 Understand that a function is a relationship between an independent variable and a dependent variable in which the value of the independent variable determines the value of the dependent variable. Use functional notation, such as f(x), to represent such relationships. For example: The relationship between the area of a square and the side length can be expressed as f (x) = x2. In this case, f (5) = 25, which represents the fact that a square of side length 5 units has area 25 units squared.
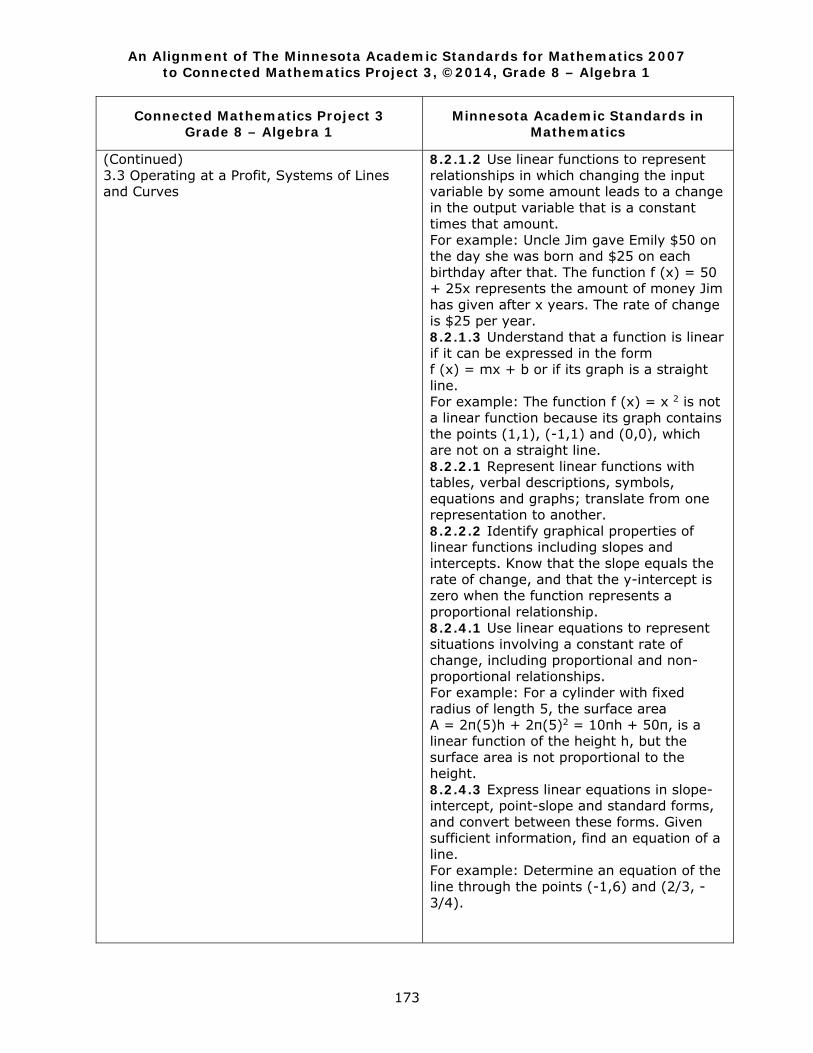
An Alignment of The Minnesota Academic Standards for Mathematics 2007 to Connected Mathematics Project 3, ©2014, Grade 8 – Algebra 1
173
Connected Mathematics Project 3 Grade 8 – Algebra 1
Minnesota Academic Standards in Mathematics
(Continued) 3.3 Operating at a Profit, Systems of Lines and Curves
8.2.1.2 Use linear functions to represent relationships in which changing the input variable by some amount leads to a change in the output variable that is a constant times that amount. For example: Uncle Jim gave Emily $50 on the day she was born and $25 on each birthday after that. The function f (x) = 50 + 25x represents the amount of money Jim has given after x years. The rate of change is $25 per year. 8.2.1.3 Understand that a function is linear if it can be expressed in the form f (x) = mx + b or if its graph is a straight line. For example: The function f (x) = x 2 is not a linear function because its graph contains the points (1,1), (-1,1) and (0,0), which are not on a straight line. 8.2.2.1 Represent linear functions with tables, verbal descriptions, symbols, equations and graphs; translate from one representation to another. 8.2.2.2 Identify graphical properties of linear functions including slopes and intercepts. Know that the slope equals the rate of change, and that the y-intercept is zero when the function represents a proportional relationship. 8.2.4.1 Use linear equations to represent situations involving a constant rate of change, including proportional and non-proportional relationships. For example: For a cylinder with fixed radius of length 5, the surface area A = 2π(5)h + 2π(5)2 = 10πh + 50π, is a linear function of the height h, but the surface area is not proportional to the height. 8.2.4.3 Express linear equations in slope-intercept, point-slope and standard forms, and convert between these forms. Given sufficient information, find an equation of a line. For example: Determine an equation of the line through the points (-1,6) and (2/3, - 3/4).
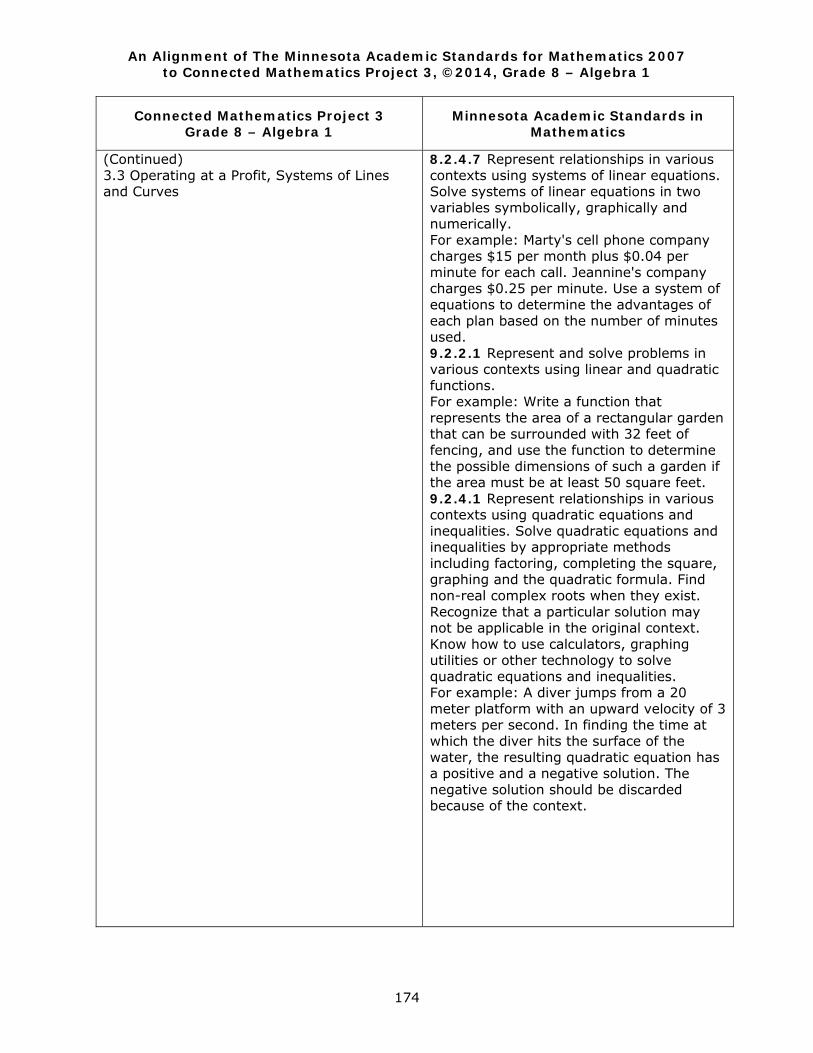
An Alignment of The Minnesota Academic Standards for Mathematics 2007 to Connected Mathematics Project 3, ©2014, Grade 8 – Algebra 1
174
Connected Mathematics Project 3 Grade 8 – Algebra 1
Minnesota Academic Standards in Mathematics
(Continued) 3.3 Operating at a Profit, Systems of Lines and Curves
8.2.4.7 Represent relationships in various contexts using systems of linear equations. Solve systems of linear equations in two variables symbolically, graphically and numerically. For example: Marty's cell phone company charges $15 per month plus $0.04 per minute for each call. Jeannine's company charges $0.25 per minute. Use a system of equations to determine the advantages of each plan based on the number of minutes used. 9.2.2.1 Represent and solve problems in various contexts using linear and quadratic functions. For example: Write a function that represents the area of a rectangular garden that can be surrounded with 32 feet of fencing, and use the function to determine the possible dimensions of such a garden if the area must be at least 50 square feet. 9.2.4.1 Represent relationships in various contexts using quadratic equations and inequalities. Solve quadratic equations and inequalities by appropriate methods including factoring, completing the square, graphing and the quadratic formula. Find non-real complex roots when they exist. Recognize that a particular solution may not be applicable in the original context. Know how to use calculators, graphing utilities or other technology to solve quadratic equations and inequalities. For example: A diver jumps from a 20 meter platform with an upward velocity of 3 meters per second. In finding the time at which the diver hits the surface of the water, the resulting quadratic equation has a positive and a negative solution. The negative solution should be discarded because of the context.

An Alignment of The Minnesota Academic Standards for Mathematics 2007 to Connected Mathematics Project 3, ©2014, Grade 8 – Algebra 1
175
Connected Mathematics Project 3 Grade 8 – Algebra 1
Minnesota Academic Standards in Mathematics
ACE Homework
8.2.1.1 Understand that a function is a relationship between an independent variable and a dependent variable in which the value of the independent variable determines the value of the dependent variable. Use functional notation, such as f(x), to represent such relationships. For example: The relationship between the area of a square and the side length can be expressed as f (x) = x2. In this case, f (5) = 25, which represents the fact that a square of side length 5 units has area 25 units squared. 8.2.1.2 Use linear functions to represent relationships in which changing the input variable by some amount leads to a change in the output variable that is a constant times that amount. For example: Uncle Jim gave Emily $50 on the day she was born and $25 on each birthday after that. The function f (x) = 50 + 25x represents the amount of money Jim has given after x years. The rate of change is $25 per year. 8.2.1.3 Understand that a function is linear if it can be expressed in the form f (x) = mx + b or if its graph is a straight line. For example: The function f (x) = x 2 is not a linear function because its graph contains the points (1,1), (-1,1) and (0,0), which are not on a straight line. 8.2.2.1 Represent linear functions with tables, verbal descriptions, symbols, equations and graphs; translate from one representation to another. 8.2.2.2 Identify graphical properties of linear functions including slopes and intercepts. Know that the slope equals the rate of change, and that the y-intercept is zero when the function represents a proportional relationship.
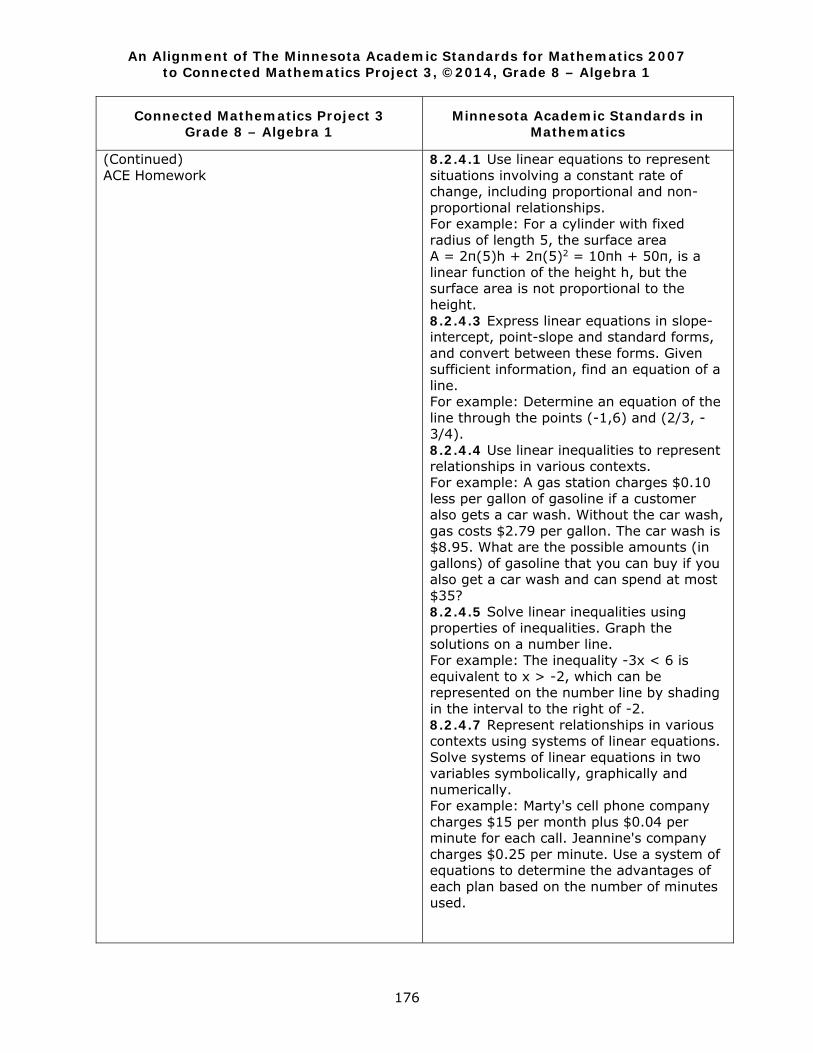
An Alignment of The Minnesota Academic Standards for Mathematics 2007 to Connected Mathematics Project 3, ©2014, Grade 8 – Algebra 1
176
Connected Mathematics Project 3 Grade 8 – Algebra 1
Minnesota Academic Standards in Mathematics
(Continued) ACE Homework
8.2.4.1 Use linear equations to represent situations involving a constant rate of change, including proportional and non-proportional relationships. For example: For a cylinder with fixed radius of length 5, the surface area A = 2π(5)h + 2π(5)2 = 10πh + 50π, is a linear function of the height h, but the surface area is not proportional to the height. 8.2.4.3 Express linear equations in slope-intercept, point-slope and standard forms, and convert between these forms. Given sufficient information, find an equation of a line. For example: Determine an equation of the line through the points (-1,6) and (2/3, - 3/4). 8.2.4.4 Use linear inequalities to represent relationships in various contexts. For example: A gas station charges $0.10 less per gallon of gasoline if a customer also gets a car wash. Without the car wash, gas costs $2.79 per gallon. The car wash is $8.95. What are the possible amounts (in gallons) of gasoline that you can buy if you also get a car wash and can spend at most $35? 8.2.4.5 Solve linear inequalities using properties of inequalities. Graph the solutions on a number line. For example: The inequality -3x < 6 is equivalent to x > -2, which can be represented on the number line by shading in the interval to the right of -2. 8.2.4.7 Represent relationships in various contexts using systems of linear equations. Solve systems of linear equations in two variables symbolically, graphically and numerically. For example: Marty's cell phone company charges $15 per month plus $0.04 per minute for each call. Jeannine's company charges $0.25 per minute. Use a system of equations to determine the advantages of each plan based on the number of minutes used.
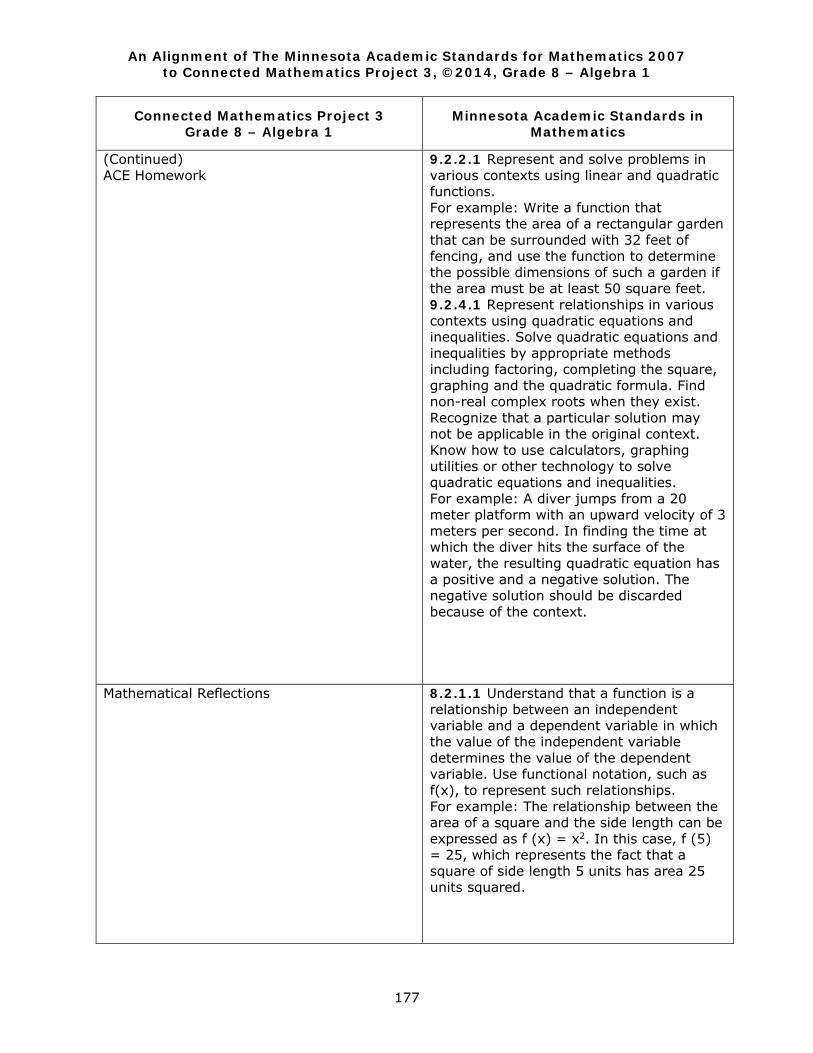
An Alignment of The Minnesota Academic Standards for Mathematics 2007 to Connected Mathematics Project 3, ©2014, Grade 8 – Algebra 1
177
Connected Mathematics Project 3 Grade 8 – Algebra 1
Minnesota Academic Standards in Mathematics
(Continued) ACE Homework
9.2.2.1 Represent and solve problems in various contexts using linear and quadratic functions. For example: Write a function that represents the area of a rectangular garden that can be surrounded with 32 feet of fencing, and use the function to determine the possible dimensions of such a garden if the area must be at least 50 square feet. 9.2.4.1 Represent relationships in various contexts using quadratic equations and inequalities. Solve quadratic equations and inequalities by appropriate methods including factoring, completing the square, graphing and the quadratic formula. Find non-real complex roots when they exist. Recognize that a particular solution may not be applicable in the original context. Know how to use calculators, graphing utilities or other technology to solve quadratic equations and inequalities. For example: A diver jumps from a 20 meter platform with an upward velocity of 3 meters per second. In finding the time at which the diver hits the surface of the water, the resulting quadratic equation has a positive and a negative solution. The negative solution should be discarded because of the context.
Mathematical Reflections
8.2.1.1 Understand that a function is a relationship between an independent variable and a dependent variable in which the value of the independent variable determines the value of the dependent variable. Use functional notation, such as f(x), to represent such relationships. For example: The relationship between the area of a square and the side length can be expressed as f (x) = x2. In this case, f (5) = 25, which represents the fact that a square of side length 5 units has area 25 units squared.
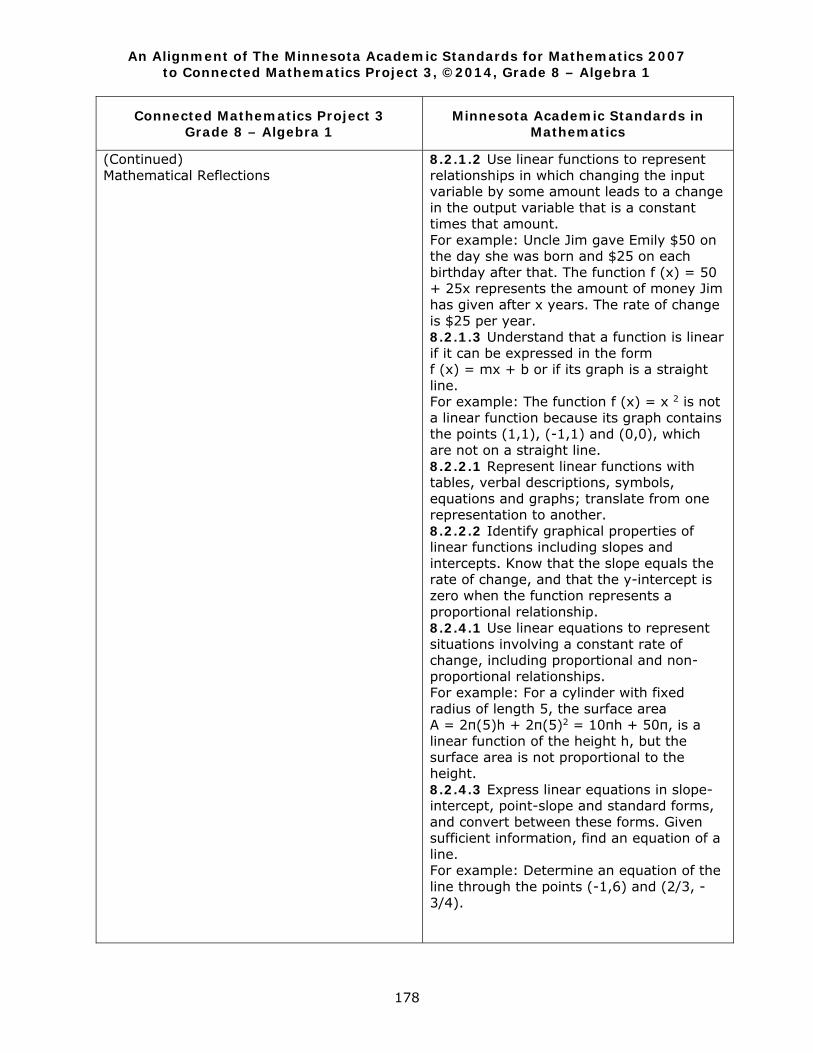
An Alignment of The Minnesota Academic Standards for Mathematics 2007 to Connected Mathematics Project 3, ©2014, Grade 8 – Algebra 1
178
Connected Mathematics Project 3 Grade 8 – Algebra 1
Minnesota Academic Standards in Mathematics
(Continued) Mathematical Reflections
8.2.1.2 Use linear functions to represent relationships in which changing the input variable by some amount leads to a change in the output variable that is a constant times that amount. For example: Uncle Jim gave Emily $50 on the day she was born and $25 on each birthday after that. The function f (x) = 50 + 25x represents the amount of money Jim has given after x years. The rate of change is $25 per year. 8.2.1.3 Understand that a function is linear if it can be expressed in the form f (x) = mx + b or if its graph is a straight line. For example: The function f (x) = x 2 is not a linear function because its graph contains the points (1,1), (-1,1) and (0,0), which are not on a straight line. 8.2.2.1 Represent linear functions with tables, verbal descriptions, symbols, equations and graphs; translate from one representation to another. 8.2.2.2 Identify graphical properties of linear functions including slopes and intercepts. Know that the slope equals the rate of change, and that the y-intercept is zero when the function represents a proportional relationship. 8.2.4.1 Use linear equations to represent situations involving a constant rate of change, including proportional and non-proportional relationships. For example: For a cylinder with fixed radius of length 5, the surface area A = 2π(5)h + 2π(5)2 = 10πh + 50π, is a linear function of the height h, but the surface area is not proportional to the height. 8.2.4.3 Express linear equations in slope-intercept, point-slope and standard forms, and convert between these forms. Given sufficient information, find an equation of a line. For example: Determine an equation of the line through the points (-1,6) and (2/3, - 3/4).
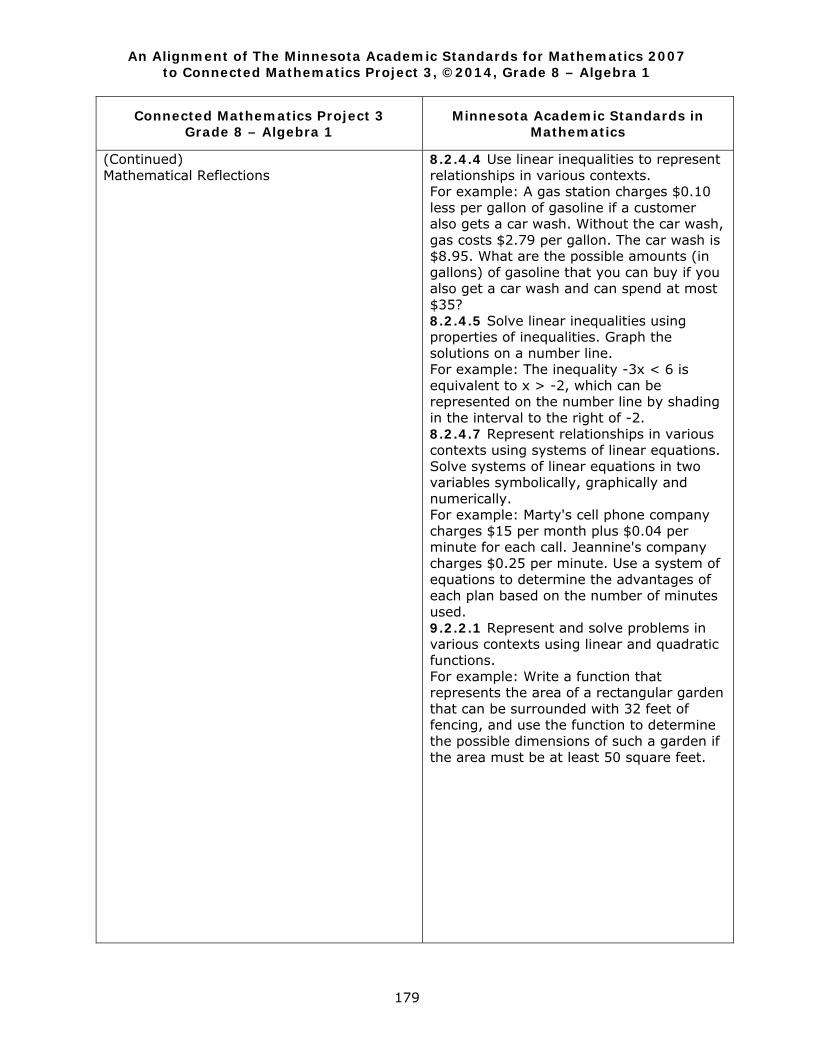
An Alignment of The Minnesota Academic Standards for Mathematics 2007 to Connected Mathematics Project 3, ©2014, Grade 8 – Algebra 1
179
Connected Mathematics Project 3 Grade 8 – Algebra 1
Minnesota Academic Standards in Mathematics
(Continued) Mathematical Reflections
8.2.4.4 Use linear inequalities to represent relationships in various contexts. For example: A gas station charges $0.10 less per gallon of gasoline if a customer also gets a car wash. Without the car wash, gas costs $2.79 per gallon. The car wash is $8.95. What are the possible amounts (in gallons) of gasoline that you can buy if you also get a car wash and can spend at most $35? 8.2.4.5 Solve linear inequalities using properties of inequalities. Graph the solutions on a number line. For example: The inequality -3x < 6 is equivalent to x > -2, which can be represented on the number line by shading in the interval to the right of -2. 8.2.4.7 Represent relationships in various contexts using systems of linear equations. Solve systems of linear equations in two variables symbolically, graphically and numerically. For example: Marty's cell phone company charges $15 per month plus $0.04 per minute for each call. Jeannine's company charges $0.25 per minute. Use a system of equations to determine the advantages of each plan based on the number of minutes used. 9.2.2.1 Represent and solve problems in various contexts using linear and quadratic functions. For example: Write a function that represents the area of a rectangular garden that can be surrounded with 32 feet of fencing, and use the function to determine the possible dimensions of such a garden if the area must be at least 50 square feet.
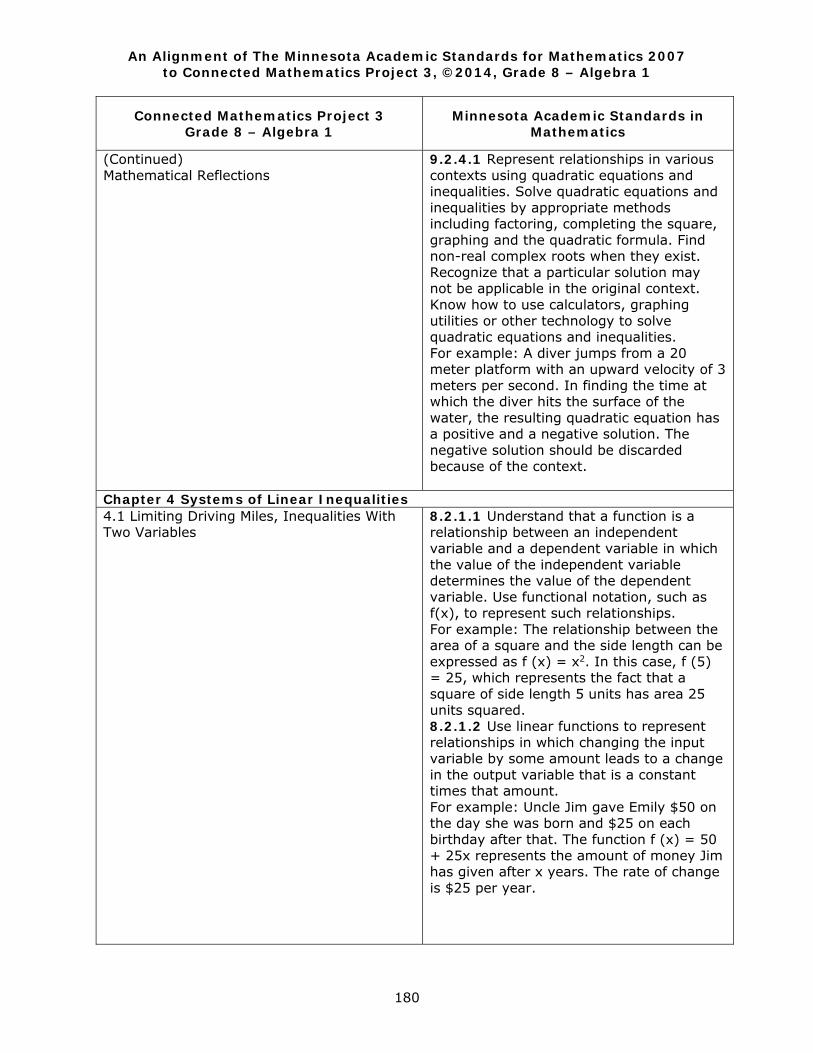
An Alignment of The Minnesota Academic Standards for Mathematics 2007 to Connected Mathematics Project 3, ©2014, Grade 8 – Algebra 1
180
Connected Mathematics Project 3 Grade 8 – Algebra 1
Minnesota Academic Standards in Mathematics
(Continued) Mathematical Reflections
9.2.4.1 Represent relationships in various contexts using quadratic equations and inequalities. Solve quadratic equations and inequalities by appropriate methods including factoring, completing the square, graphing and the quadratic formula. Find non-real complex roots when they exist. Recognize that a particular solution may not be applicable in the original context. Know how to use calculators, graphing utilities or other technology to solve quadratic equations and inequalities. For example: A diver jumps from a 20 meter platform with an upward velocity of 3 meters per second. In finding the time at which the diver hits the surface of the water, the resulting quadratic equation has a positive and a negative solution. The negative solution should be discarded because of the context.
Chapter 4 Systems of Linear Inequalities 4.1 Limiting Driving Miles, Inequalities With Two Variables
8.2.1.1 Understand that a function is a relationship between an independent variable and a dependent variable in which the value of the independent variable determines the value of the dependent variable. Use functional notation, such as f(x), to represent such relationships. For example: The relationship between the area of a square and the side length can be expressed as f (x) = x2. In this case, f (5) = 25, which represents the fact that a square of side length 5 units has area 25 units squared. 8.2.1.2 Use linear functions to represent relationships in which changing the input variable by some amount leads to a change in the output variable that is a constant times that amount. For example: Uncle Jim gave Emily $50 on the day she was born and $25 on each birthday after that. The function f (x) = 50 + 25x represents the amount of money Jim has given after x years. The rate of change is $25 per year.
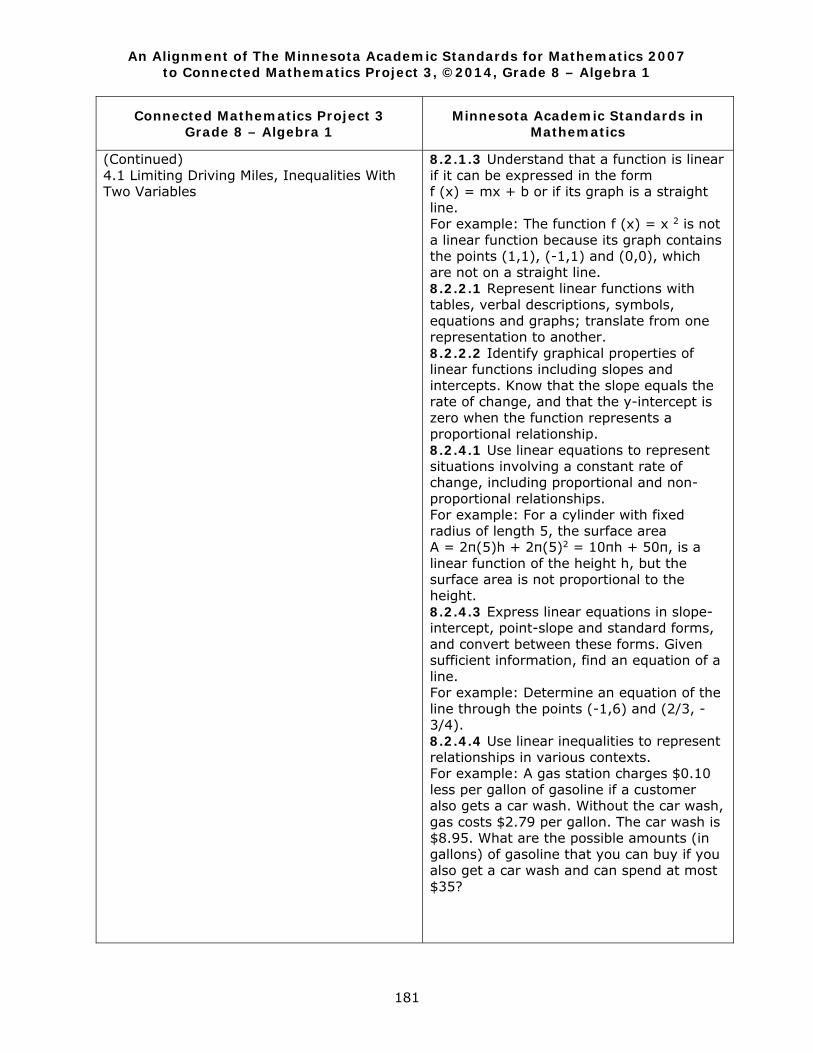
An Alignment of The Minnesota Academic Standards for Mathematics 2007 to Connected Mathematics Project 3, ©2014, Grade 8 – Algebra 1
181
Connected Mathematics Project 3 Grade 8 – Algebra 1
Minnesota Academic Standards in Mathematics
(Continued) 4.1 Limiting Driving Miles, Inequalities With Two Variables
8.2.1.3 Understand that a function is linear if it can be expressed in the form f (x) = mx + b or if its graph is a straight line. For example: The function f (x) = x 2 is not a linear function because its graph contains the points (1,1), (-1,1) and (0,0), which are not on a straight line. 8.2.2.1 Represent linear functions with tables, verbal descriptions, symbols, equations and graphs; translate from one representation to another. 8.2.2.2 Identify graphical properties of linear functions including slopes and intercepts. Know that the slope equals the rate of change, and that the y-intercept is zero when the function represents a proportional relationship. 8.2.4.1 Use linear equations to represent situations involving a constant rate of change, including proportional and non-proportional relationships. For example: For a cylinder with fixed radius of length 5, the surface area A = 2π(5)h + 2π(5)2 = 10πh + 50π, is a linear function of the height h, but the surface area is not proportional to the height. 8.2.4.3 Express linear equations in slope-intercept, point-slope and standard forms, and convert between these forms. Given sufficient information, find an equation of a line. For example: Determine an equation of the line through the points (-1,6) and (2/3, - 3/4). 8.2.4.4 Use linear inequalities to represent relationships in various contexts. For example: A gas station charges $0.10 less per gallon of gasoline if a customer also gets a car wash. Without the car wash, gas costs $2.79 per gallon. The car wash is $8.95. What are the possible amounts (in gallons) of gasoline that you can buy if you also get a car wash and can spend at most $35?
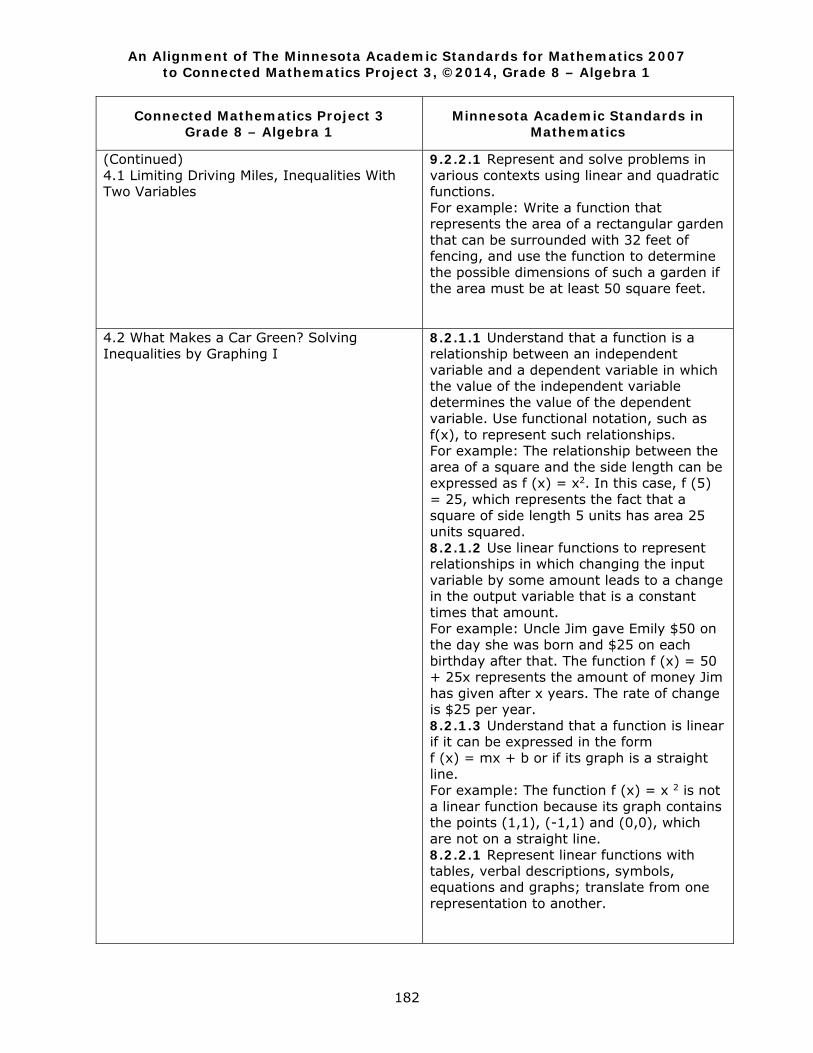
An Alignment of The Minnesota Academic Standards for Mathematics 2007 to Connected Mathematics Project 3, ©2014, Grade 8 – Algebra 1
182
Connected Mathematics Project 3 Grade 8 – Algebra 1
Minnesota Academic Standards in Mathematics
(Continued) 4.1 Limiting Driving Miles, Inequalities With Two Variables
9.2.2.1 Represent and solve problems in various contexts using linear and quadratic functions. For example: Write a function that represents the area of a rectangular garden that can be surrounded with 32 feet of fencing, and use the function to determine the possible dimensions of such a garden if the area must be at least 50 square feet.
4.2 What Makes a Car Green? Solving Inequalities by Graphing I
8.2.1.1 Understand that a function is a relationship between an independent variable and a dependent variable in which the value of the independent variable determines the value of the dependent variable. Use functional notation, such as f(x), to represent such relationships. For example: The relationship between the area of a square and the side length can be expressed as f (x) = x2. In this case, f (5) = 25, which represents the fact that a square of side length 5 units has area 25 units squared. 8.2.1.2 Use linear functions to represent relationships in which changing the input variable by some amount leads to a change in the output variable that is a constant times that amount. For example: Uncle Jim gave Emily $50 on the day she was born and $25 on each birthday after that. The function f (x) = 50 + 25x represents the amount of money Jim has given after x years. The rate of change is $25 per year. 8.2.1.3 Understand that a function is linear if it can be expressed in the form f (x) = mx + b or if its graph is a straight line. For example: The function f (x) = x 2 is not a linear function because its graph contains the points (1,1), (-1,1) and (0,0), which are not on a straight line. 8.2.2.1 Represent linear functions with tables, verbal descriptions, symbols, equations and graphs; translate from one representation to another.
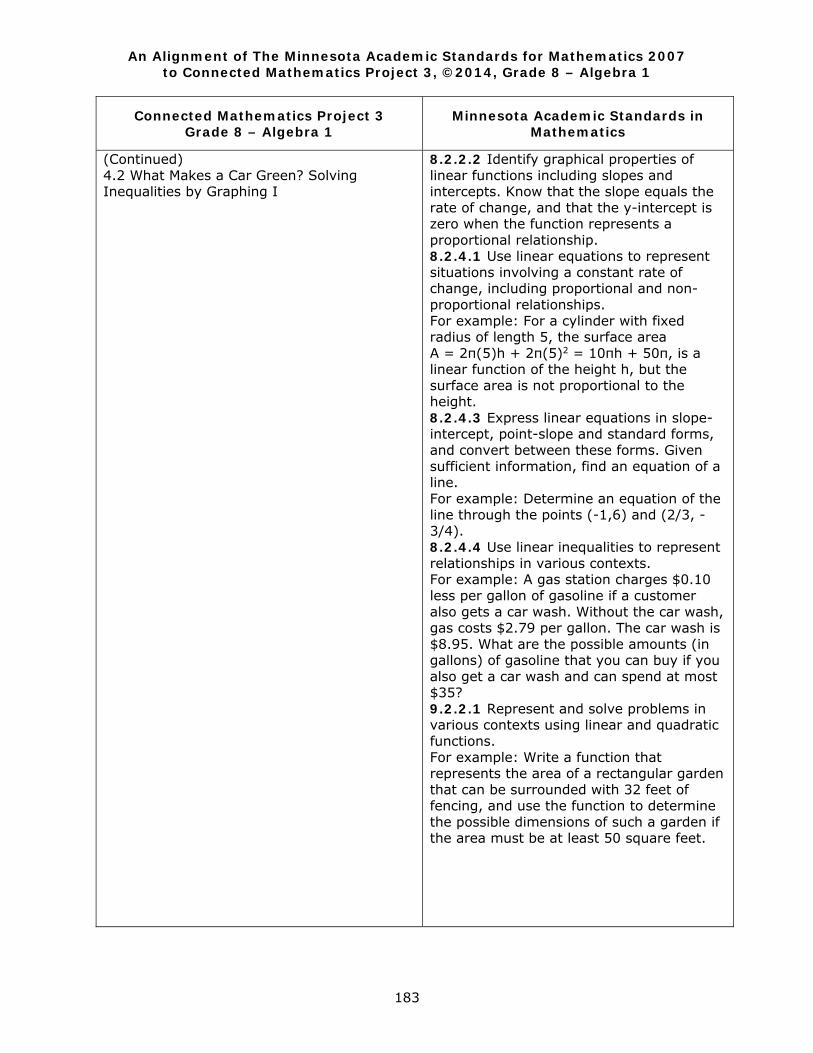
An Alignment of The Minnesota Academic Standards for Mathematics 2007 to Connected Mathematics Project 3, ©2014, Grade 8 – Algebra 1
183
Connected Mathematics Project 3 Grade 8 – Algebra 1
Minnesota Academic Standards in Mathematics
(Continued) 4.2 What Makes a Car Green? Solving Inequalities by Graphing I
8.2.2.2 Identify graphical properties of linear functions including slopes and intercepts. Know that the slope equals the rate of change, and that the y-intercept is zero when the function represents a proportional relationship. 8.2.4.1 Use linear equations to represent situations involving a constant rate of change, including proportional and non-proportional relationships. For example: For a cylinder with fixed radius of length 5, the surface area A = 2π(5)h + 2π(5)2 = 10πh + 50π, is a linear function of the height h, but the surface area is not proportional to the height. 8.2.4.3 Express linear equations in slope-intercept, point-slope and standard forms, and convert between these forms. Given sufficient information, find an equation of a line. For example: Determine an equation of the line through the points (-1,6) and (2/3, - 3/4). 8.2.4.4 Use linear inequalities to represent relationships in various contexts. For example: A gas station charges $0.10 less per gallon of gasoline if a customer also gets a car wash. Without the car wash, gas costs $2.79 per gallon. The car wash is $8.95. What are the possible amounts (in gallons) of gasoline that you can buy if you also get a car wash and can spend at most $35? 9.2.2.1 Represent and solve problems in various contexts using linear and quadratic functions. For example: Write a function that represents the area of a rectangular garden that can be surrounded with 32 feet of fencing, and use the function to determine the possible dimensions of such a garden if the area must be at least 50 square feet.
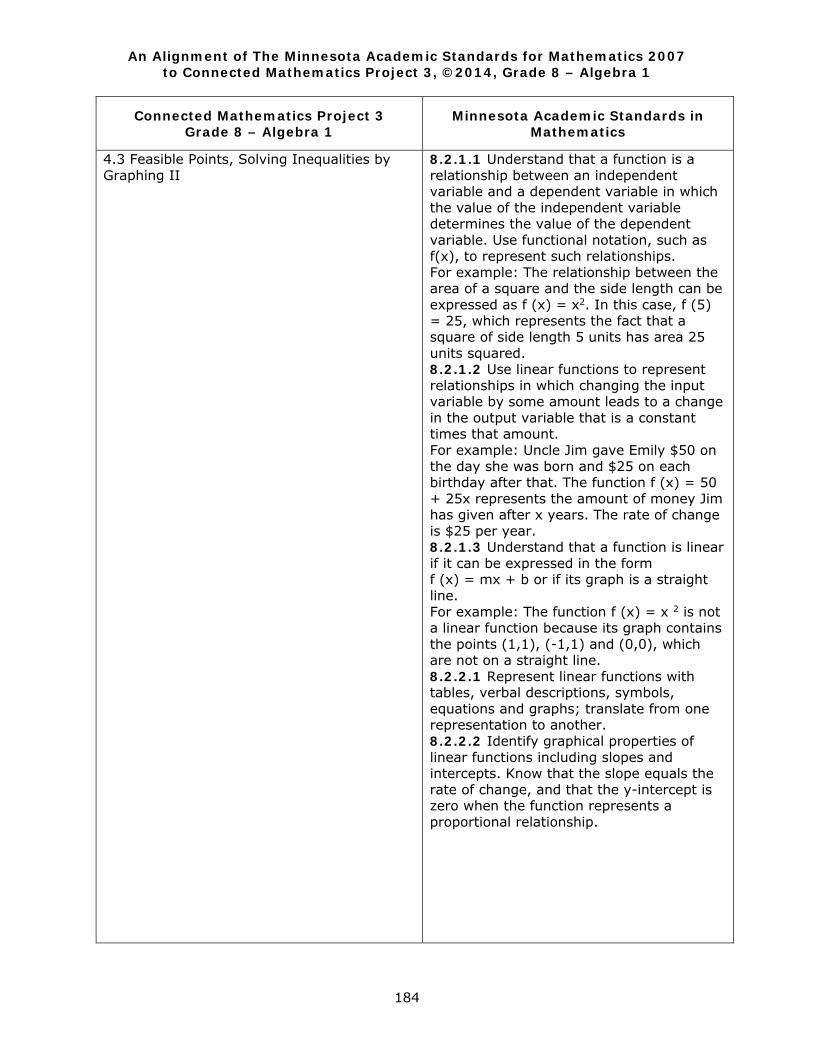
An Alignment of The Minnesota Academic Standards for Mathematics 2007 to Connected Mathematics Project 3, ©2014, Grade 8 – Algebra 1
184
Connected Mathematics Project 3 Grade 8 – Algebra 1
Minnesota Academic Standards in Mathematics
4.3 Feasible Points, Solving Inequalities by Graphing II
8.2.1.1 Understand that a function is a relationship between an independent variable and a dependent variable in which the value of the independent variable determines the value of the dependent variable. Use functional notation, such as f(x), to represent such relationships. For example: The relationship between the area of a square and the side length can be expressed as f (x) = x2. In this case, f (5) = 25, which represents the fact that a square of side length 5 units has area 25 units squared. 8.2.1.2 Use linear functions to represent relationships in which changing the input variable by some amount leads to a change in the output variable that is a constant times that amount. For example: Uncle Jim gave Emily $50 on the day she was born and $25 on each birthday after that. The function f (x) = 50 + 25x represents the amount of money Jim has given after x years. The rate of change is $25 per year. 8.2.1.3 Understand that a function is linear if it can be expressed in the form f (x) = mx + b or if its graph is a straight line. For example: The function f (x) = x 2 is not a linear function because its graph contains the points (1,1), (-1,1) and (0,0), which are not on a straight line. 8.2.2.1 Represent linear functions with tables, verbal descriptions, symbols, equations and graphs; translate from one representation to another. 8.2.2.2 Identify graphical properties of linear functions including slopes and intercepts. Know that the slope equals the rate of change, and that the y-intercept is zero when the function represents a proportional relationship.
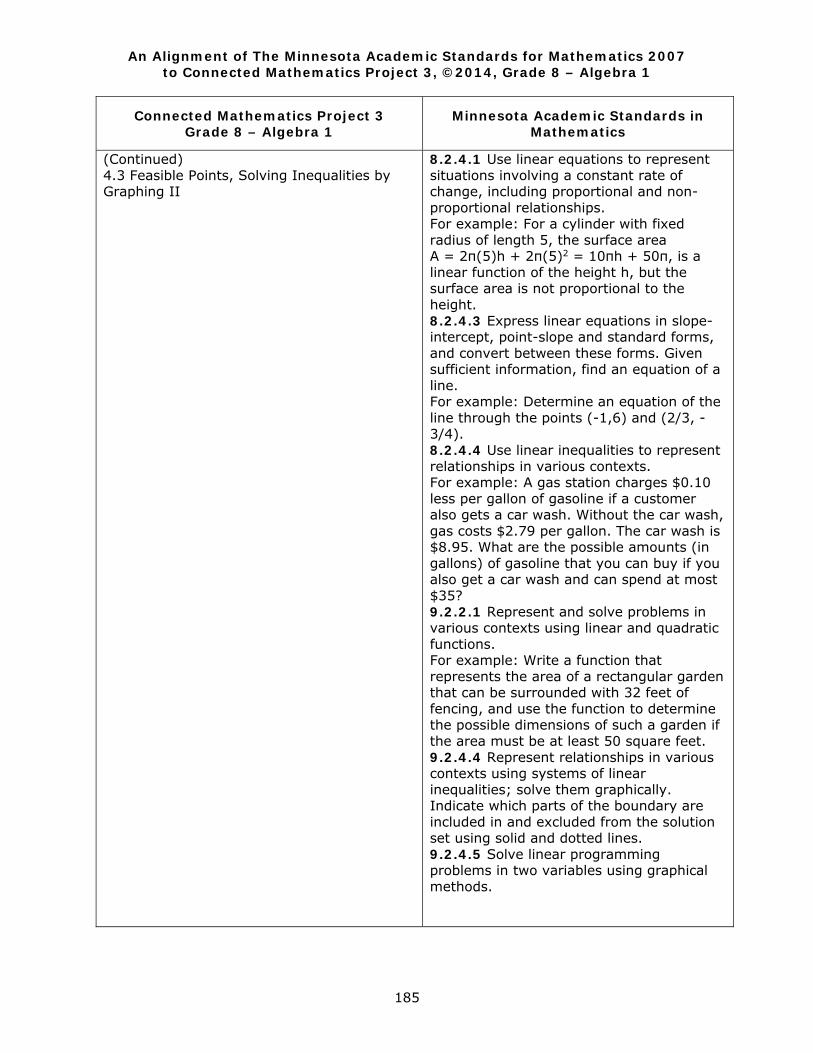
An Alignment of The Minnesota Academic Standards for Mathematics 2007 to Connected Mathematics Project 3, ©2014, Grade 8 – Algebra 1
185
Connected Mathematics Project 3 Grade 8 – Algebra 1
Minnesota Academic Standards in Mathematics
(Continued) 4.3 Feasible Points, Solving Inequalities by Graphing II
8.2.4.1 Use linear equations to represent situations involving a constant rate of change, including proportional and non-proportional relationships. For example: For a cylinder with fixed radius of length 5, the surface area A = 2π(5)h + 2π(5)2 = 10πh + 50π, is a linear function of the height h, but the surface area is not proportional to the height. 8.2.4.3 Express linear equations in slope-intercept, point-slope and standard forms, and convert between these forms. Given sufficient information, find an equation of a line. For example: Determine an equation of the line through the points (-1,6) and (2/3, - 3/4). 8.2.4.4 Use linear inequalities to represent relationships in various contexts. For example: A gas station charges $0.10 less per gallon of gasoline if a customer also gets a car wash. Without the car wash, gas costs $2.79 per gallon. The car wash is $8.95. What are the possible amounts (in gallons) of gasoline that you can buy if you also get a car wash and can spend at most $35? 9.2.2.1 Represent and solve problems in various contexts using linear and quadratic functions. For example: Write a function that represents the area of a rectangular garden that can be surrounded with 32 feet of fencing, and use the function to determine the possible dimensions of such a garden if the area must be at least 50 square feet. 9.2.4.4 Represent relationships in various contexts using systems of linear inequalities; solve them graphically. Indicate which parts of the boundary are included in and excluded from the solution set using solid and dotted lines. 9.2.4.5 Solve linear programming problems in two variables using graphical methods.

An Alignment of The Minnesota Academic Standards for Mathematics 2007 to Connected Mathematics Project 3, ©2014, Grade 8 – Algebra 1
186
Connected Mathematics Project 3 Grade 8 – Algebra 1
Minnesota Academic Standards in Mathematics
4.4 Miles of Emissions, Systems of Linear Inequalities
8.2.1.1 Understand that a function is a relationship between an independent variable and a dependent variable in which the value of the independent variable determines the value of the dependent variable. Use functional notation, such as f(x), to represent such relationships. For example: The relationship between the area of a square and the side length can be expressed as f (x) = x2. In this case, f (5) = 25, which represents the fact that a square of side length 5 units has area 25 units squared. 8.2.1.2 Use linear functions to represent relationships in which changing the input variable by some amount leads to a change in the output variable that is a constant times that amount. For example: Uncle Jim gave Emily $50 on the day she was born and $25 on each birthday after that. The function f (x) = 50 + 25x represents the amount of money Jim has given after x years. The rate of change is $25 per year. 8.2.1.3 Understand that a function is linear if it can be expressed in the form f (x) = mx + b or if its graph is a straight line. For example: The function f (x) = x 2 is not a linear function because its graph contains the points (1,1), (-1,1) and (0,0), which are not on a straight line. 8.2.2.1 Represent linear functions with tables, verbal descriptions, symbols, equations and graphs; translate from one representation to another. 8.2.2.2 Identify graphical properties of linear functions including slopes and intercepts. Know that the slope equals the rate of change, and that the y-intercept is zero when the function represents a proportional relationship.
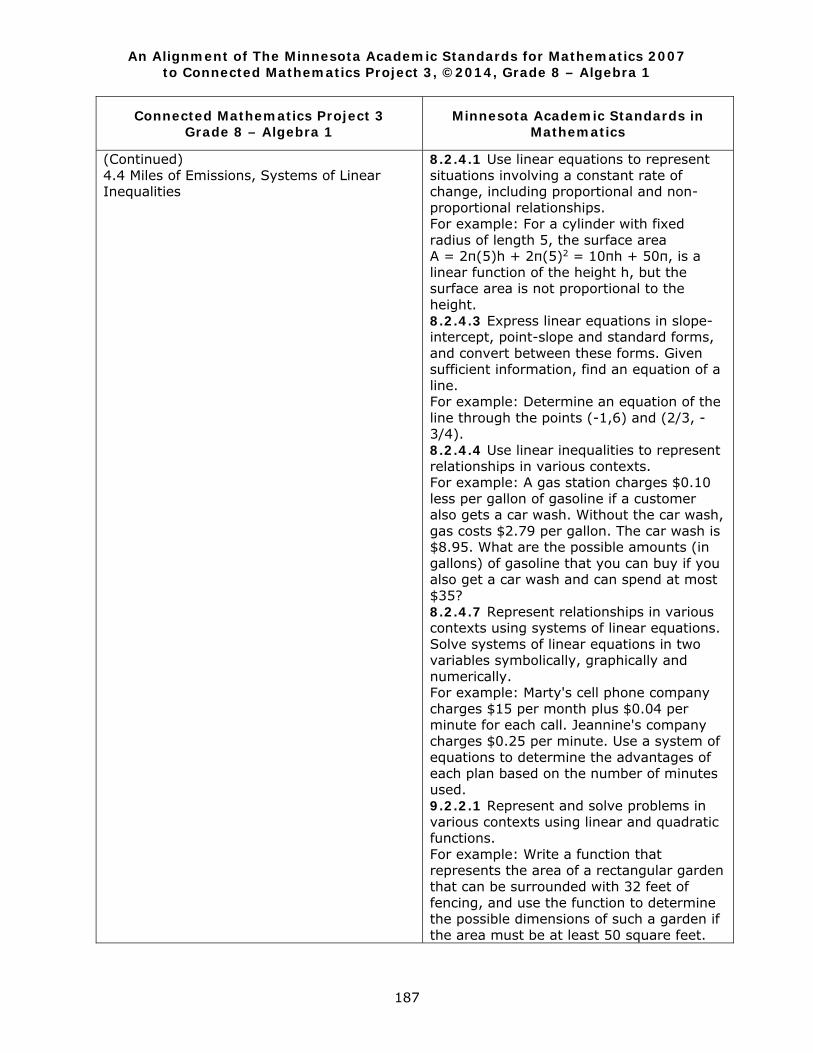
An Alignment of The Minnesota Academic Standards for Mathematics 2007 to Connected Mathematics Project 3, ©2014, Grade 8 – Algebra 1
187
Connected Mathematics Project 3 Grade 8 – Algebra 1
Minnesota Academic Standards in Mathematics
(Continued) 4.4 Miles of Emissions, Systems of Linear Inequalities
8.2.4.1 Use linear equations to represent situations involving a constant rate of change, including proportional and non-proportional relationships. For example: For a cylinder with fixed radius of length 5, the surface area A = 2π(5)h + 2π(5)2 = 10πh + 50π, is a linear function of the height h, but the surface area is not proportional to the height. 8.2.4.3 Express linear equations in slope-intercept, point-slope and standard forms, and convert between these forms. Given sufficient information, find an equation of a line. For example: Determine an equation of the line through the points (-1,6) and (2/3, - 3/4). 8.2.4.4 Use linear inequalities to represent relationships in various contexts. For example: A gas station charges $0.10 less per gallon of gasoline if a customer also gets a car wash. Without the car wash, gas costs $2.79 per gallon. The car wash is $8.95. What are the possible amounts (in gallons) of gasoline that you can buy if you also get a car wash and can spend at most $35? 8.2.4.7 Represent relationships in various contexts using systems of linear equations. Solve systems of linear equations in two variables symbolically, graphically and numerically. For example: Marty's cell phone company charges $15 per month plus $0.04 per minute for each call. Jeannine's company charges $0.25 per minute. Use a system of equations to determine the advantages of each plan based on the number of minutes used. 9.2.2.1 Represent and solve problems in various contexts using linear and quadratic functions. For example: Write a function that represents the area of a rectangular garden that can be surrounded with 32 feet of fencing, and use the function to determine the possible dimensions of such a garden if the area must be at least 50 square feet.
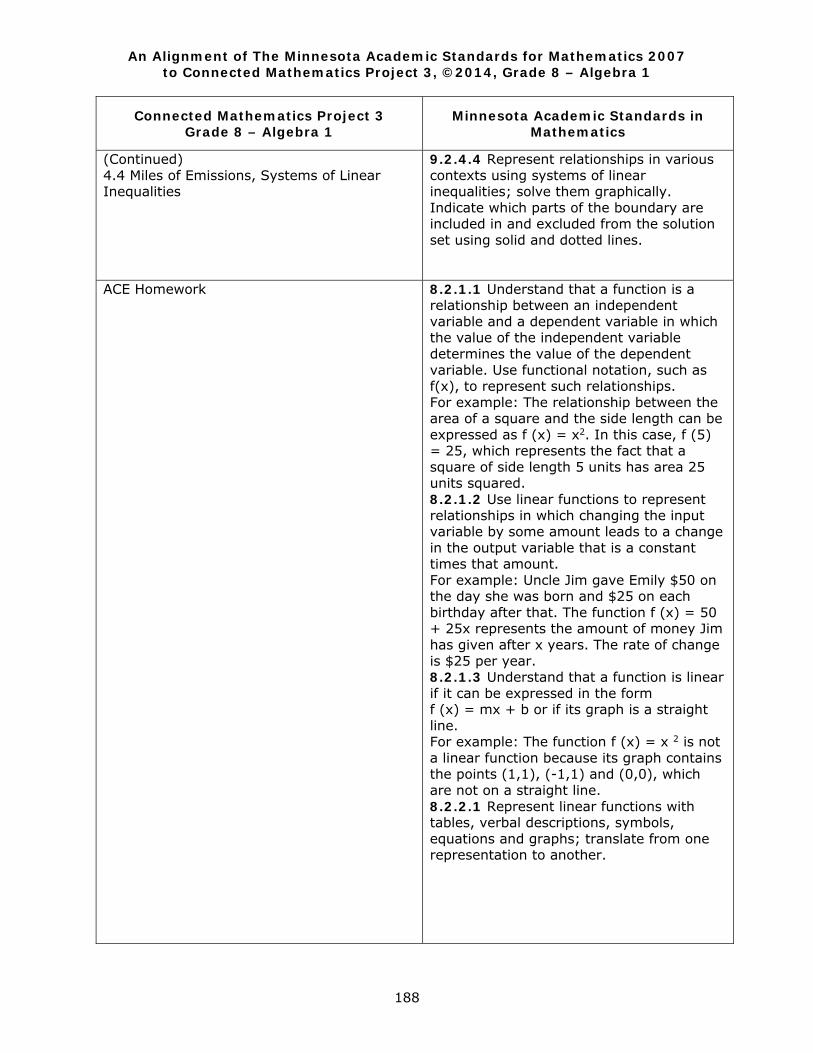
An Alignment of The Minnesota Academic Standards for Mathematics 2007 to Connected Mathematics Project 3, ©2014, Grade 8 – Algebra 1
188
Connected Mathematics Project 3 Grade 8 – Algebra 1
Minnesota Academic Standards in Mathematics
(Continued) 4.4 Miles of Emissions, Systems of Linear Inequalities
9.2.4.4 Represent relationships in various contexts using systems of linear inequalities; solve them graphically. Indicate which parts of the boundary are included in and excluded from the solution set using solid and dotted lines.
ACE Homework
8.2.1.1 Understand that a function is a relationship between an independent variable and a dependent variable in which the value of the independent variable determines the value of the dependent variable. Use functional notation, such as f(x), to represent such relationships. For example: The relationship between the area of a square and the side length can be expressed as f (x) = x2. In this case, f (5) = 25, which represents the fact that a square of side length 5 units has area 25 units squared. 8.2.1.2 Use linear functions to represent relationships in which changing the input variable by some amount leads to a change in the output variable that is a constant times that amount. For example: Uncle Jim gave Emily $50 on the day she was born and $25 on each birthday after that. The function f (x) = 50 + 25x represents the amount of money Jim has given after x years. The rate of change is $25 per year. 8.2.1.3 Understand that a function is linear if it can be expressed in the form f (x) = mx + b or if its graph is a straight line. For example: The function f (x) = x 2 is not a linear function because its graph contains the points (1,1), (-1,1) and (0,0), which are not on a straight line. 8.2.2.1 Represent linear functions with tables, verbal descriptions, symbols, equations and graphs; translate from one representation to another.
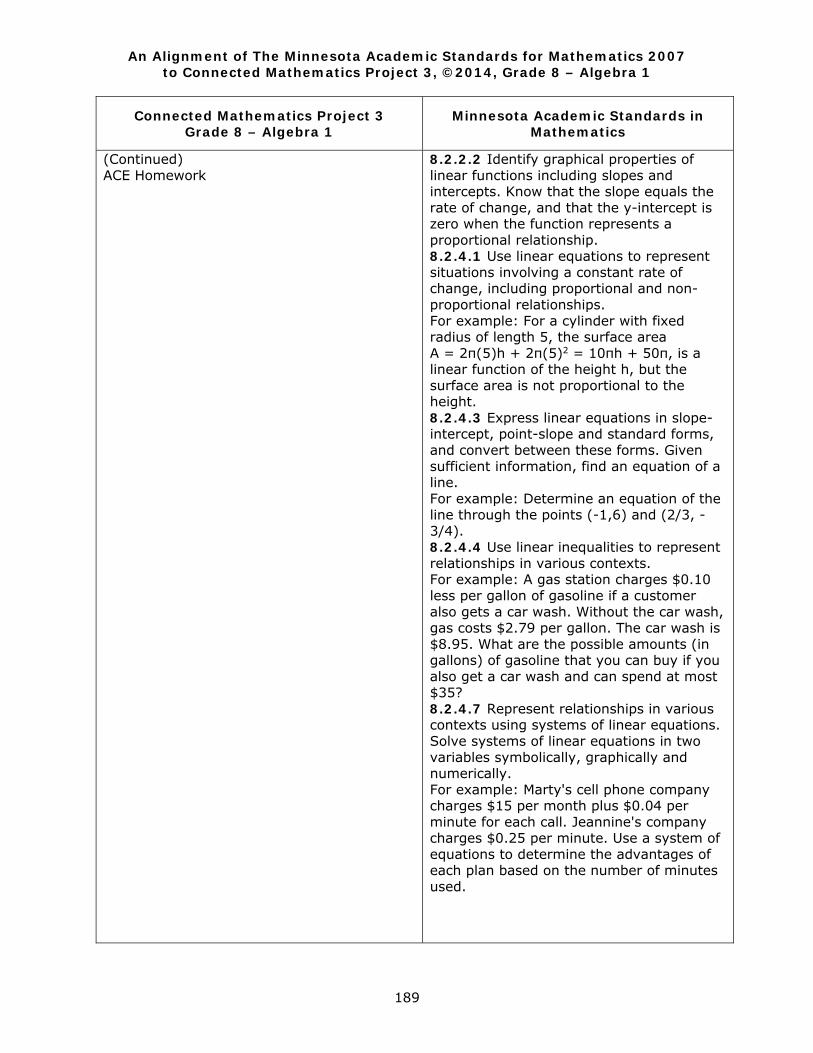
An Alignment of The Minnesota Academic Standards for Mathematics 2007 to Connected Mathematics Project 3, ©2014, Grade 8 – Algebra 1
189
Connected Mathematics Project 3 Grade 8 – Algebra 1
Minnesota Academic Standards in Mathematics
(Continued) ACE Homework
8.2.2.2 Identify graphical properties of linear functions including slopes and intercepts. Know that the slope equals the rate of change, and that the y-intercept is zero when the function represents a proportional relationship. 8.2.4.1 Use linear equations to represent situations involving a constant rate of change, including proportional and non-proportional relationships. For example: For a cylinder with fixed radius of length 5, the surface area A = 2π(5)h + 2π(5)2 = 10πh + 50π, is a linear function of the height h, but the surface area is not proportional to the height. 8.2.4.3 Express linear equations in slope-intercept, point-slope and standard forms, and convert between these forms. Given sufficient information, find an equation of a line. For example: Determine an equation of the line through the points (-1,6) and (2/3, - 3/4). 8.2.4.4 Use linear inequalities to represent relationships in various contexts. For example: A gas station charges $0.10 less per gallon of gasoline if a customer also gets a car wash. Without the car wash, gas costs $2.79 per gallon. The car wash is $8.95. What are the possible amounts (in gallons) of gasoline that you can buy if you also get a car wash and can spend at most $35? 8.2.4.7 Represent relationships in various contexts using systems of linear equations. Solve systems of linear equations in two variables symbolically, graphically and numerically. For example: Marty's cell phone company charges $15 per month plus $0.04 per minute for each call. Jeannine's company charges $0.25 per minute. Use a system of equations to determine the advantages of each plan based on the number of minutes used.
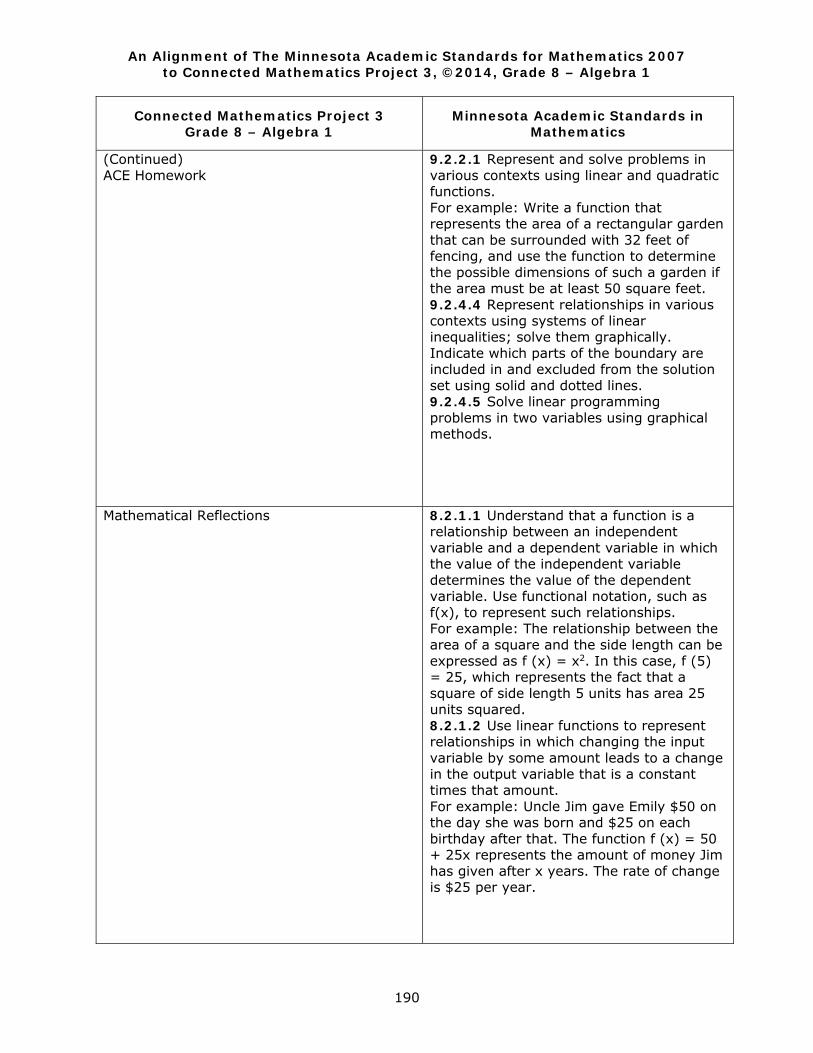
An Alignment of The Minnesota Academic Standards for Mathematics 2007 to Connected Mathematics Project 3, ©2014, Grade 8 – Algebra 1
190
Connected Mathematics Project 3 Grade 8 – Algebra 1
Minnesota Academic Standards in Mathematics
(Continued) ACE Homework
9.2.2.1 Represent and solve problems in various contexts using linear and quadratic functions. For example: Write a function that represents the area of a rectangular garden that can be surrounded with 32 feet of fencing, and use the function to determine the possible dimensions of such a garden if the area must be at least 50 square feet. 9.2.4.4 Represent relationships in various contexts using systems of linear inequalities; solve them graphically. Indicate which parts of the boundary are included in and excluded from the solution set using solid and dotted lines. 9.2.4.5 Solve linear programming problems in two variables using graphical methods.
Mathematical Reflections
8.2.1.1 Understand that a function is a relationship between an independent variable and a dependent variable in which the value of the independent variable determines the value of the dependent variable. Use functional notation, such as f(x), to represent such relationships. For example: The relationship between the area of a square and the side length can be expressed as f (x) = x2. In this case, f (5) = 25, which represents the fact that a square of side length 5 units has area 25 units squared. 8.2.1.2 Use linear functions to represent relationships in which changing the input variable by some amount leads to a change in the output variable that is a constant times that amount. For example: Uncle Jim gave Emily $50 on the day she was born and $25 on each birthday after that. The function f (x) = 50 + 25x represents the amount of money Jim has given after x years. The rate of change is $25 per year.
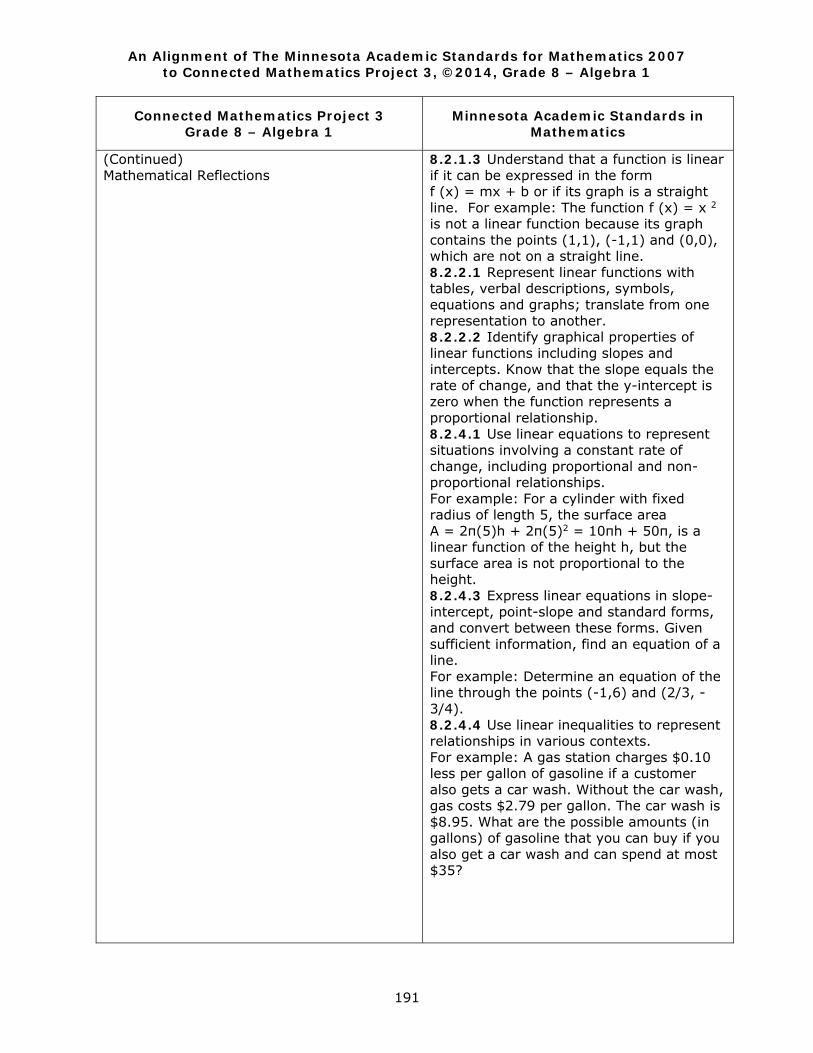
An Alignment of The Minnesota Academic Standards for Mathematics 2007 to Connected Mathematics Project 3, ©2014, Grade 8 – Algebra 1
191
Connected Mathematics Project 3 Grade 8 – Algebra 1
Minnesota Academic Standards in Mathematics
(Continued) Mathematical Reflections
8.2.1.3 Understand that a function is linear if it can be expressed in the form f (x) = mx + b or if its graph is a straight line. For example: The function f (x) = x 2 is not a linear function because its graph contains the points (1,1), (-1,1) and (0,0), which are not on a straight line. 8.2.2.1 Represent linear functions with tables, verbal descriptions, symbols, equations and graphs; translate from one representation to another. 8.2.2.2 Identify graphical properties of linear functions including slopes and intercepts. Know that the slope equals the rate of change, and that the y-intercept is zero when the function represents a proportional relationship. 8.2.4.1 Use linear equations to represent situations involving a constant rate of change, including proportional and non-proportional relationships. For example: For a cylinder with fixed radius of length 5, the surface area A = 2π(5)h + 2π(5)2 = 10πh + 50π, is a linear function of the height h, but the surface area is not proportional to the height. 8.2.4.3 Express linear equations in slope-intercept, point-slope and standard forms, and convert between these forms. Given sufficient information, find an equation of a line. For example: Determine an equation of the line through the points (-1,6) and (2/3, - 3/4). 8.2.4.4 Use linear inequalities to represent relationships in various contexts. For example: A gas station charges $0.10 less per gallon of gasoline if a customer also gets a car wash. Without the car wash, gas costs $2.79 per gallon. The car wash is $8.95. What are the possible amounts (in gallons) of gasoline that you can buy if you also get a car wash and can spend at most $35?
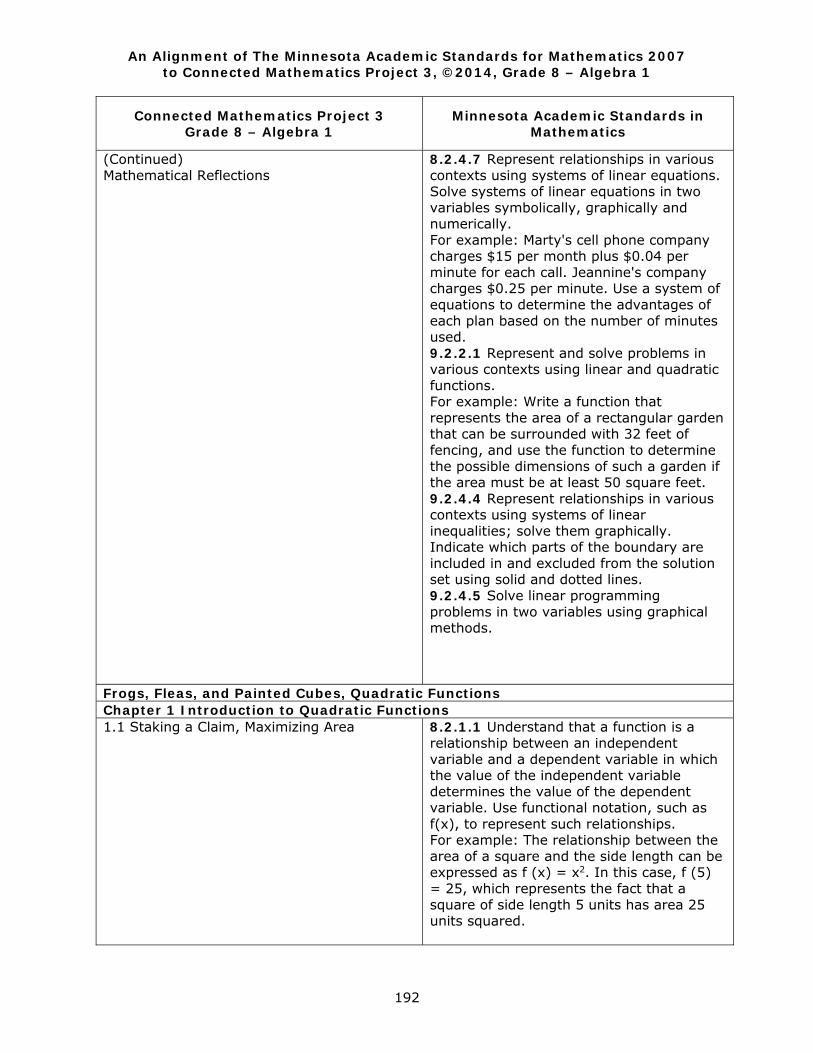
An Alignment of The Minnesota Academic Standards for Mathematics 2007 to Connected Mathematics Project 3, ©2014, Grade 8 – Algebra 1
192
Connected Mathematics Project 3 Grade 8 – Algebra 1
Minnesota Academic Standards in Mathematics
(Continued) Mathematical Reflections
8.2.4.7 Represent relationships in various contexts using systems of linear equations. Solve systems of linear equations in two variables symbolically, graphically and numerically. For example: Marty's cell phone company charges $15 per month plus $0.04 per minute for each call. Jeannine's company charges $0.25 per minute. Use a system of equations to determine the advantages of each plan based on the number of minutes used. 9.2.2.1 Represent and solve problems in various contexts using linear and quadratic functions. For example: Write a function that represents the area of a rectangular garden that can be surrounded with 32 feet of fencing, and use the function to determine the possible dimensions of such a garden if the area must be at least 50 square feet. 9.2.4.4 Represent relationships in various contexts using systems of linear inequalities; solve them graphically. Indicate which parts of the boundary are included in and excluded from the solution set using solid and dotted lines. 9.2.4.5 Solve linear programming problems in two variables using graphical methods.
Frogs, Fleas, and Painted Cubes, Quadratic Functions Chapter 1 Introduction to Quadratic Functions 1.1 Staking a Claim, Maximizing Area
8.2.1.1 Understand that a function is a relationship between an independent variable and a dependent variable in which the value of the independent variable determines the value of the dependent variable. Use functional notation, such as f(x), to represent such relationships. For example: The relationship between the area of a square and the side length can be expressed as f (x) = x2. In this case, f (5) = 25, which represents the fact that a square of side length 5 units has area 25 units squared.
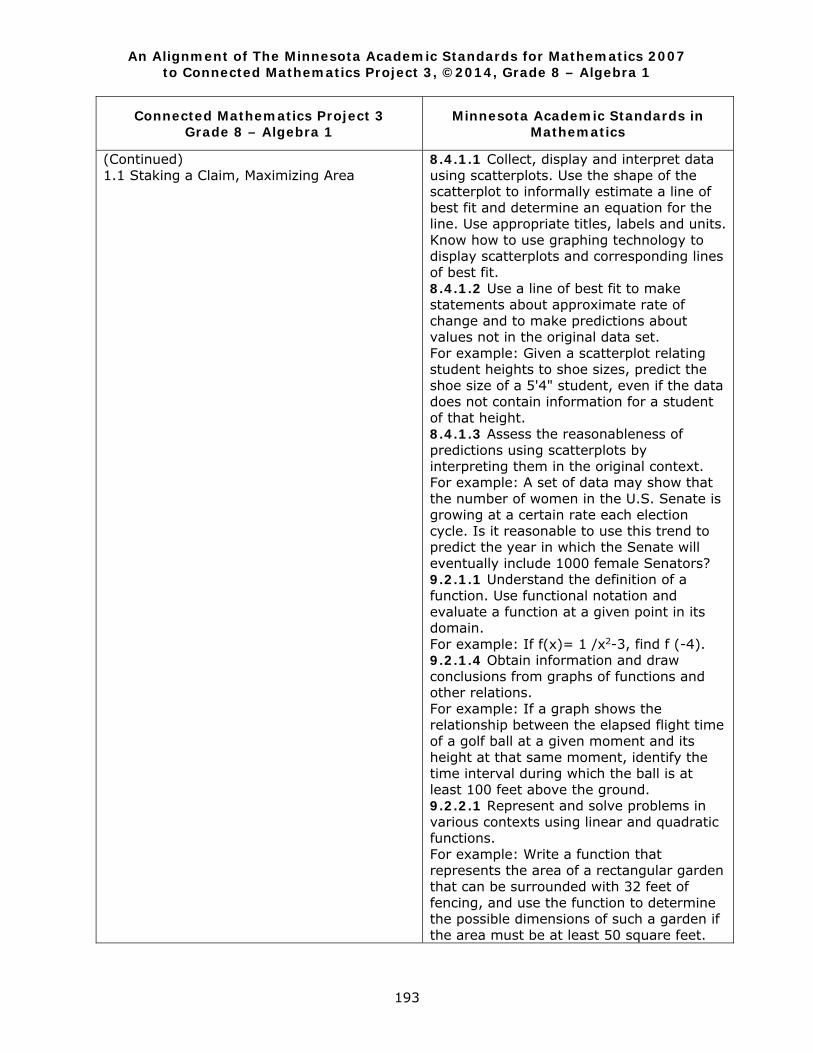
An Alignment of The Minnesota Academic Standards for Mathematics 2007 to Connected Mathematics Project 3, ©2014, Grade 8 – Algebra 1
193
Connected Mathematics Project 3 Grade 8 – Algebra 1
Minnesota Academic Standards in Mathematics
(Continued) 1.1 Staking a Claim, Maximizing Area
8.4.1.1 Collect, display and interpret data using scatterplots. Use the shape of the scatterplot to informally estimate a line of best fit and determine an equation for the line. Use appropriate titles, labels and units. Know how to use graphing technology to display scatterplots and corresponding lines of best fit. 8.4.1.2 Use a line of best fit to make statements about approximate rate of change and to make predictions about values not in the original data set. For example: Given a scatterplot relating student heights to shoe sizes, predict the shoe size of a 5'4" student, even if the data does not contain information for a student of that height. 8.4.1.3 Assess the reasonableness of predictions using scatterplots by interpreting them in the original context. For example: A set of data may show that the number of women in the U.S. Senate is growing at a certain rate each election cycle. Is it reasonable to use this trend to predict the year in which the Senate will eventually include 1000 female Senators? 9.2.1.1 Understand the definition of a function. Use functional notation and evaluate a function at a given point in its domain. For example: If f(x)= 1 /x2-3, find f (-4). 9.2.1.4 Obtain information and draw conclusions from graphs of functions and other relations. For example: If a graph shows the relationship between the elapsed flight time of a golf ball at a given moment and its height at that same moment, identify the time interval during which the ball is at least 100 feet above the ground. 9.2.2.1 Represent and solve problems in various contexts using linear and quadratic functions. For example: Write a function that represents the area of a rectangular garden that can be surrounded with 32 feet of fencing, and use the function to determine the possible dimensions of such a garden if the area must be at least 50 square feet.
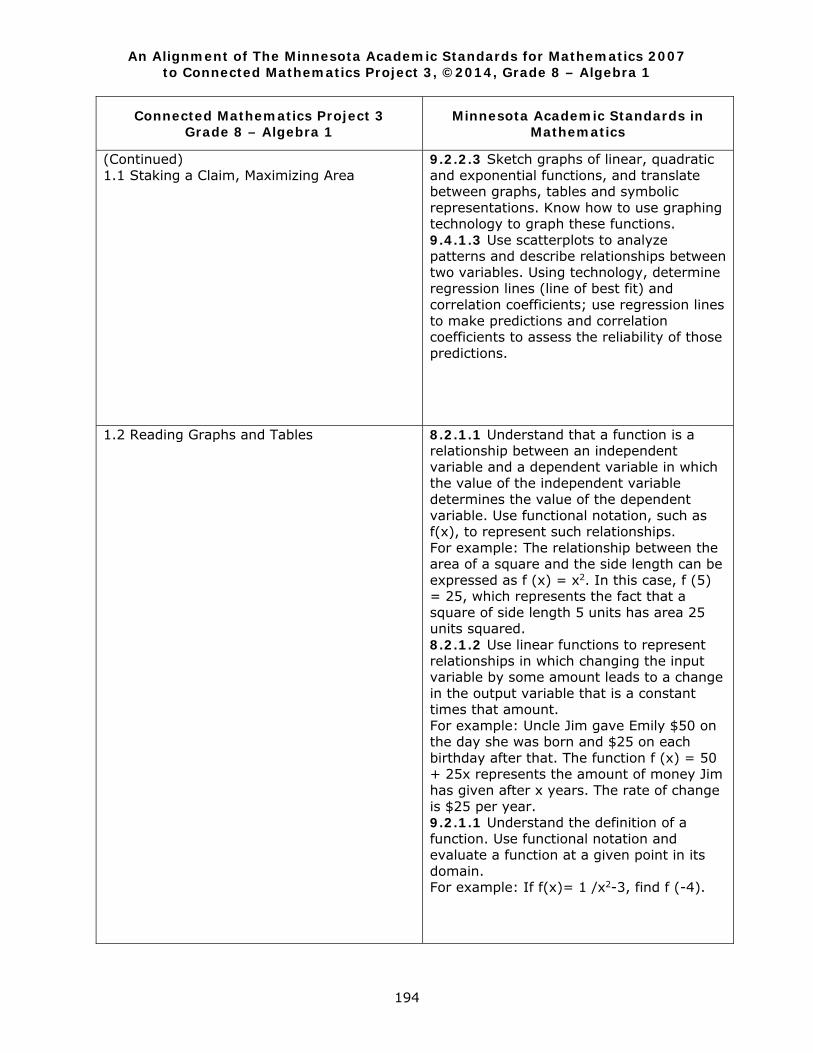
An Alignment of The Minnesota Academic Standards for Mathematics 2007 to Connected Mathematics Project 3, ©2014, Grade 8 – Algebra 1
194
Connected Mathematics Project 3 Grade 8 – Algebra 1
Minnesota Academic Standards in Mathematics
(Continued) 1.1 Staking a Claim, Maximizing Area
9.2.2.3 Sketch graphs of linear, quadratic and exponential functions, and translate between graphs, tables and symbolic representations. Know how to use graphing technology to graph these functions. 9.4.1.3 Use scatterplots to analyze patterns and describe relationships between two variables. Using technology, determine regression lines (line of best fit) and correlation coefficients; use regression lines to make predictions and correlation coefficients to assess the reliability of those predictions.
1.2 Reading Graphs and Tables
8.2.1.1 Understand that a function is a relationship between an independent variable and a dependent variable in which the value of the independent variable determines the value of the dependent variable. Use functional notation, such as f(x), to represent such relationships. For example: The relationship between the area of a square and the side length can be expressed as f (x) = x2. In this case, f (5) = 25, which represents the fact that a square of side length 5 units has area 25 units squared. 8.2.1.2 Use linear functions to represent relationships in which changing the input variable by some amount leads to a change in the output variable that is a constant times that amount. For example: Uncle Jim gave Emily $50 on the day she was born and $25 on each birthday after that. The function f (x) = 50 + 25x represents the amount of money Jim has given after x years. The rate of change is $25 per year. 9.2.1.1 Understand the definition of a function. Use functional notation and evaluate a function at a given point in its domain. For example: If f(x)= 1 /x2-3, find f (-4).
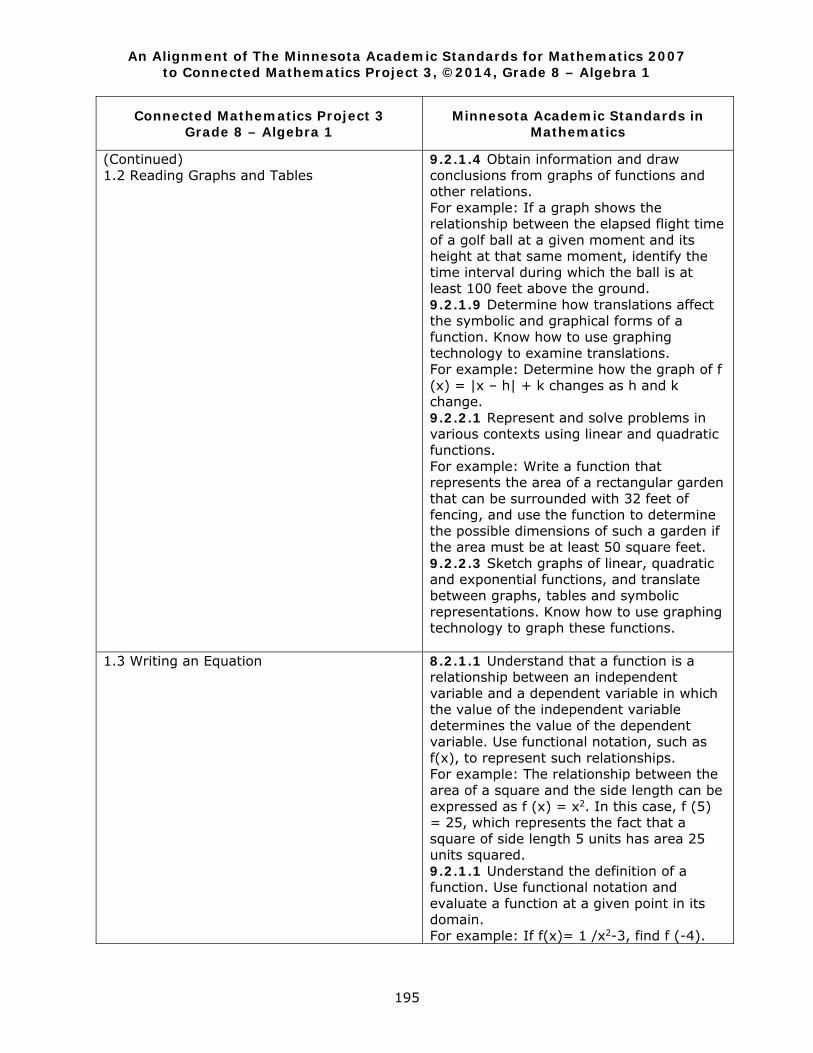
An Alignment of The Minnesota Academic Standards for Mathematics 2007 to Connected Mathematics Project 3, ©2014, Grade 8 – Algebra 1
195
Connected Mathematics Project 3 Grade 8 – Algebra 1
Minnesota Academic Standards in Mathematics
(Continued) 1.2 Reading Graphs and Tables
9.2.1.4 Obtain information and draw conclusions from graphs of functions and other relations. For example: If a graph shows the relationship between the elapsed flight time of a golf ball at a given moment and its height at that same moment, identify the time interval during which the ball is at least 100 feet above the ground. 9.2.1.9 Determine how translations affect the symbolic and graphical forms of a function. Know how to use graphing technology to examine translations. For example: Determine how the graph of f (x) = |x – h| + k changes as h and k change. 9.2.2.1 Represent and solve problems in various contexts using linear and quadratic functions. For example: Write a function that represents the area of a rectangular garden that can be surrounded with 32 feet of fencing, and use the function to determine the possible dimensions of such a garden if the area must be at least 50 square feet. 9.2.2.3 Sketch graphs of linear, quadratic and exponential functions, and translate between graphs, tables and symbolic representations. Know how to use graphing technology to graph these functions.
1.3 Writing an Equation
8.2.1.1 Understand that a function is a relationship between an independent variable and a dependent variable in which the value of the independent variable determines the value of the dependent variable. Use functional notation, such as f(x), to represent such relationships. For example: The relationship between the area of a square and the side length can be expressed as f (x) = x2. In this case, f (5) = 25, which represents the fact that a square of side length 5 units has area 25 units squared. 9.2.1.1 Understand the definition of a function. Use functional notation and evaluate a function at a given point in its domain. For example: If f(x)= 1 /x2-3, find f (-4).
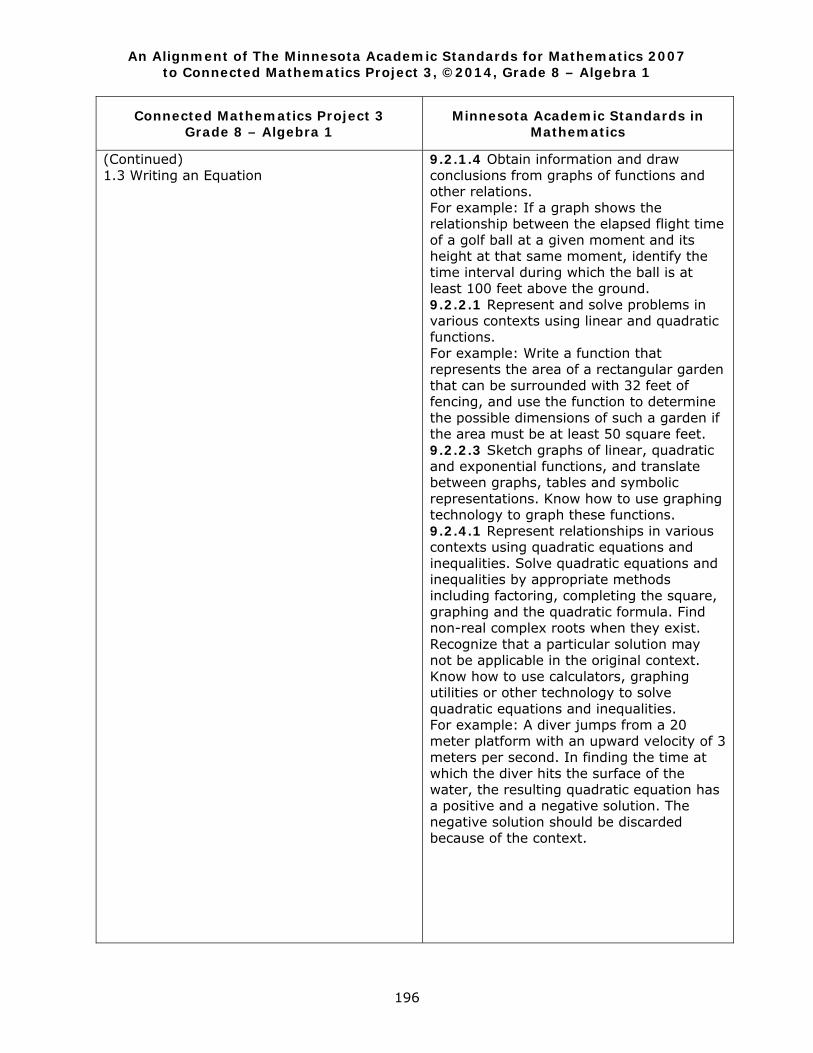
An Alignment of The Minnesota Academic Standards for Mathematics 2007 to Connected Mathematics Project 3, ©2014, Grade 8 – Algebra 1
196
Connected Mathematics Project 3 Grade 8 – Algebra 1
Minnesota Academic Standards in Mathematics
(Continued) 1.3 Writing an Equation
9.2.1.4 Obtain information and draw conclusions from graphs of functions and other relations. For example: If a graph shows the relationship between the elapsed flight time of a golf ball at a given moment and its height at that same moment, identify the time interval during which the ball is at least 100 feet above the ground. 9.2.2.1 Represent and solve problems in various contexts using linear and quadratic functions. For example: Write a function that represents the area of a rectangular garden that can be surrounded with 32 feet of fencing, and use the function to determine the possible dimensions of such a garden if the area must be at least 50 square feet. 9.2.2.3 Sketch graphs of linear, quadratic and exponential functions, and translate between graphs, tables and symbolic representations. Know how to use graphing technology to graph these functions. 9.2.4.1 Represent relationships in various contexts using quadratic equations and inequalities. Solve quadratic equations and inequalities by appropriate methods including factoring, completing the square, graphing and the quadratic formula. Find non-real complex roots when they exist. Recognize that a particular solution may not be applicable in the original context. Know how to use calculators, graphing utilities or other technology to solve quadratic equations and inequalities. For example: A diver jumps from a 20 meter platform with an upward velocity of 3 meters per second. In finding the time at which the diver hits the surface of the water, the resulting quadratic equation has a positive and a negative solution. The negative solution should be discarded because of the context.
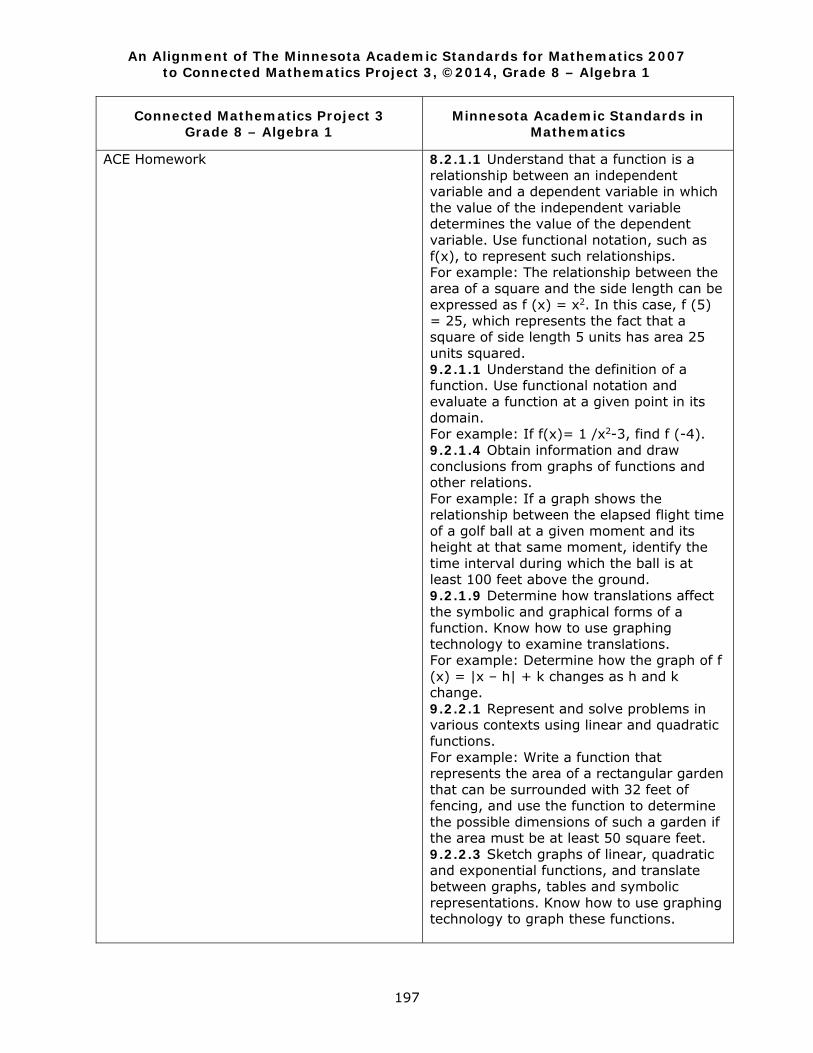
An Alignment of The Minnesota Academic Standards for Mathematics 2007 to Connected Mathematics Project 3, ©2014, Grade 8 – Algebra 1
197
Connected Mathematics Project 3 Grade 8 – Algebra 1
Minnesota Academic Standards in Mathematics
ACE Homework
8.2.1.1 Understand that a function is a relationship between an independent variable and a dependent variable in which the value of the independent variable determines the value of the dependent variable. Use functional notation, such as f(x), to represent such relationships. For example: The relationship between the area of a square and the side length can be expressed as f (x) = x2. In this case, f (5) = 25, which represents the fact that a square of side length 5 units has area 25 units squared. 9.2.1.1 Understand the definition of a function. Use functional notation and evaluate a function at a given point in its domain. For example: If f(x)= 1 /x2-3, find f (-4). 9.2.1.4 Obtain information and draw conclusions from graphs of functions and other relations. For example: If a graph shows the relationship between the elapsed flight time of a golf ball at a given moment and its height at that same moment, identify the time interval during which the ball is at least 100 feet above the ground. 9.2.1.9 Determine how translations affect the symbolic and graphical forms of a function. Know how to use graphing technology to examine translations. For example: Determine how the graph of f (x) = |x – h| + k changes as h and k change. 9.2.2.1 Represent and solve problems in various contexts using linear and quadratic functions. For example: Write a function that represents the area of a rectangular garden that can be surrounded with 32 feet of fencing, and use the function to determine the possible dimensions of such a garden if the area must be at least 50 square feet. 9.2.2.3 Sketch graphs of linear, quadratic and exponential functions, and translate between graphs, tables and symbolic representations. Know how to use graphing technology to graph these functions.
An Alignment of The Minnesota Academic Standards for Mathematics 2007 to Connected Mathematics Project 3, ©2014, Grade 8 – Algebra 1
198
Connected Mathematics Project 3 Grade 8 – Algebra 1
Minnesota Academic Standards in Mathematics
(Continued) ACE Homework
9.2.4.1 Represent relationships in various contexts using quadratic equations and inequalities. Solve quadratic equations and inequalities by appropriate methods including factoring, completing the square, graphing and the quadratic formula. Find non-real complex roots when they exist. Recognize that a particular solution may not be applicable in the original context. Know how to use calculators, graphing utilities or other technology to solve quadratic equations and inequalities. For example: A diver jumps from a 20 meter platform with an upward velocity of 3 meters per second. In finding the time at which the diver hits the surface of the water, the resulting quadratic equation has a positive and a negative solution. The negative solution should be discarded because of the context.
Mathematical Reflections
8.2.1.1 Understand that a function is a relationship between an independent variable and a dependent variable in which the value of the independent variable determines the value of the dependent variable. Use functional notation, such as f(x), to represent such relationships. For example: The relationship between the area of a square and the side length can be expressed as f (x) = x2. In this case, f (5) = 25, which represents the fact that a square of side length 5 units has area 25 units squared. 9.2.1.1 Understand the definition of a function. Use functional notation and evaluate a function at a given point in its domain. For example: If f(x)= 1 /x2-3, find f (-4). 9.2.1.4 Obtain information and draw conclusions from graphs of functions and other relations. For example: If a graph shows the relationship between the elapsed flight time of a golf ball at a given moment and its height at that same moment, identify the time interval during which the ball is at least 100 feet above the ground.
An Alignment of The Minnesota Academic Standards for Mathematics 2007 to Connected Mathematics Project 3, ©2014, Grade 8 – Algebra 1
199
Connected Mathematics Project 3 Grade 8 – Algebra 1
Minnesota Academic Standards in Mathematics
(Continued) Mathematical Reflections
9.2.1.9 Determine how translations affect the symbolic and graphical forms of a function. Know how to use graphing technology to examine translations. For example: Determine how the graph of f (x) = |x – h| + k changes as h and k change. 9.2.2.1 Represent and solve problems in various contexts using linear and quadratic functions. For example: Write a function that represents the area of a rectangular garden that can be surrounded with 32 feet of fencing, and use the function to determine the possible dimensions of such a garden if the area must be at least 50 square feet. 9.2.2.3 Sketch graphs of linear, quadratic and exponential functions, and translate between graphs, tables and symbolic representations. Know how to use graphing technology to graph these functions. 9.2.4.1 Represent relationships in various contexts using quadratic equations and inequalities. Solve quadratic equations and inequalities by appropriate methods including factoring, completing the square, graphing and the quadratic formula. Find non-real complex roots when they exist. Recognize that a particular solution may not be applicable in the original context. Know how to use calculators, graphing utilities or other technology to solve quadratic equations and inequalities. For example: A diver jumps from a 20 meter platform with an upward velocity of 3 meters per second. In finding the time at which the diver hits the surface of the water, the resulting quadratic equation has a positive and a negative solution. The negative solution should be discarded because of the context.
An Alignment of The Minnesota Academic Standards for Mathematics 2007 to Connected Mathematics Project 3, ©2014, Grade 8 – Algebra 1
200
Connected Mathematics Project 3 Grade 8 – Algebra 1
Minnesota Academic Standards in Mathematics
Chapter 2 Quadratic Expressions 2.1 Trading Land, Representing Areas of Rectangles
8.2.1.1 Understand that a function is a relationship between an independent variable and a dependent variable in which the value of the independent variable determines the value of the dependent variable. Use functional notation, such as f(x), to represent such relationships. For example: The relationship between the area of a square and the side length can be expressed as f (x) = x2. In this case, f (5) = 25, which represents the fact that a square of side length 5 units has area 25 units squared. 9.2.1.4 Obtain information and draw conclusions from graphs of functions and other relations. For example: If a graph shows the relationship between the elapsed flight time of a golf ball at a given moment and its height at that same moment, identify the time interval during which the ball is at least 100 feet above the ground. 9.2.2.1 Represent and solve problems in various contexts using linear and quadratic functions. For example: Write a function that represents the area of a rectangular garden that can be surrounded with 32 feet of fencing, and use the function to determine the possible dimensions of such a garden if the area must be at least 50 square feet. 9.2.2.3 Sketch graphs of linear, quadratic and exponential functions, and translate between graphs, tables and symbolic representations. Know how to use graphing technology to graph these functions.
An Alignment of The Minnesota Academic Standards for Mathematics 2007 to Connected Mathematics Project 3, ©2014, Grade 8 – Algebra 1
201
Connected Mathematics Project 3 Grade 8 – Algebra 1
Minnesota Academic Standards in Mathematics
(Continued) 2.1 Trading Land, Representing Areas of Rectangles
9.2.4.1 Represent relationships in various contexts using quadratic equations and inequalities. Solve quadratic equations and inequalities by appropriate methods including factoring, completing the square, graphing and the quadratic formula. Find non-real complex roots when they exist. Recognize that a particular solution may not be applicable in the original context. Know how to use calculators, graphing utilities or other technology to solve quadratic equations and inequalities. For example: A diver jumps from a 20 meter platform with an upward velocity of 3 meters per second. In finding the time at which the diver hits the surface of the water, the resulting quadratic equation has a positive and a negative solution. The negative solution should be discarded because of the context.
2.2 Changing Dimensions, The Distributive Property
8.2.1.1 Understand that a function is a relationship between an independent variable and a dependent variable in which the value of the independent variable determines the value of the dependent variable. Use functional notation, such as f(x), to represent such relationships. For example: The relationship between the area of a square and the side length can be expressed as f (x) = x2. In this case, f (5) = 25, which represents the fact that a square of side length 5 units has area 25 units squared. 8.2.3.2 Justify steps in generating equivalent expressions by identifying the properties used, including the properties of algebra. Properties include the associative, commutative and distributive laws, and the order of operations, including grouping symbols. 9.2.3.7 Justify steps in generating equivalent expressions by identifying the properties used. Use substitution to check the equality of expressions for some particular values of the variables; recognize that checking with substitution does not guarantee equality of expressions for all values of the variables.
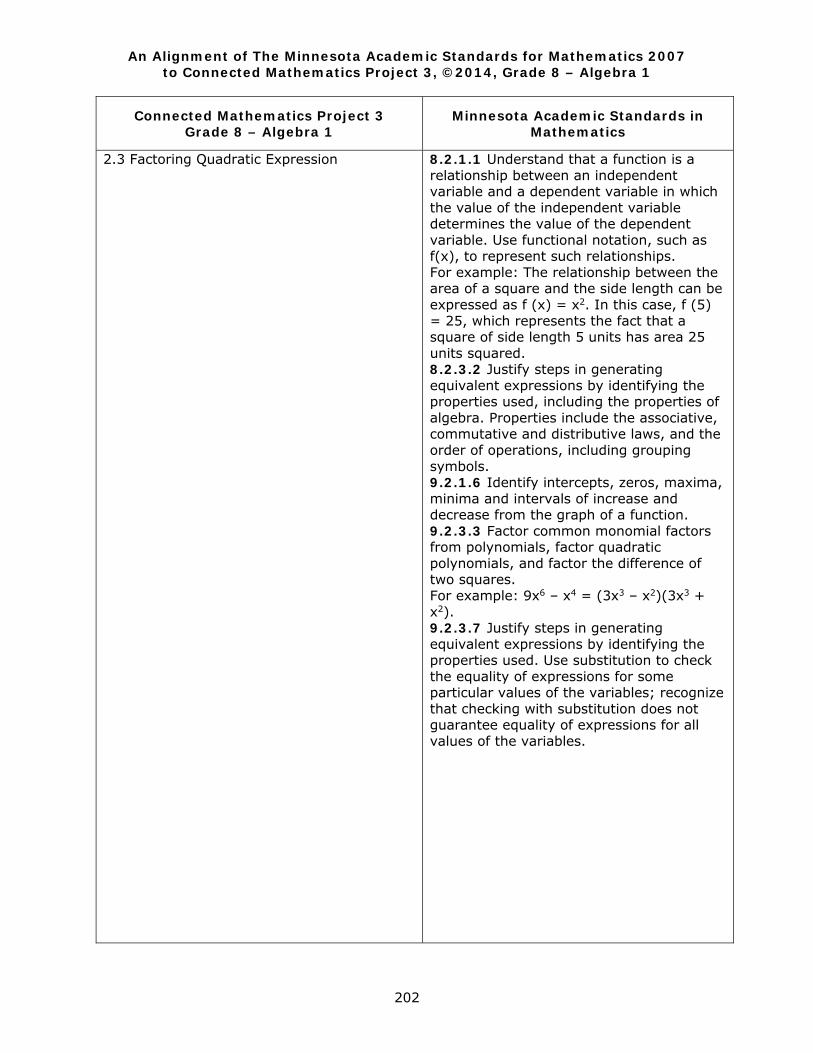
An Alignment of The Minnesota Academic Standards for Mathematics 2007 to Connected Mathematics Project 3, ©2014, Grade 8 – Algebra 1
202
Connected Mathematics Project 3 Grade 8 – Algebra 1
Minnesota Academic Standards in Mathematics
2.3 Factoring Quadratic Expression 8.2.1.1 Understand that a function is a relationship between an independent variable and a dependent variable in which the value of the independent variable determines the value of the dependent variable. Use functional notation, such as f(x), to represent such relationships. For example: The relationship between the area of a square and the side length can be expressed as f (x) = x2. In this case, f (5) = 25, which represents the fact that a square of side length 5 units has area 25 units squared. 8.2.3.2 Justify steps in generating equivalent expressions by identifying the properties used, including the properties of algebra. Properties include the associative, commutative and distributive laws, and the order of operations, including grouping symbols. 9.2.1.6 Identify intercepts, zeros, maxima, minima and intervals of increase and decrease from the graph of a function. 9.2.3.3 Factor common monomial factors from polynomials, factor quadratic polynomials, and factor the difference of two squares. For example: 9x6 – x4 = (3x3 – x2)(3x3 + x2). 9.2.3.7 Justify steps in generating equivalent expressions by identifying the properties used. Use substitution to check the equality of expressions for some particular values of the variables; recognize that checking with substitution does not guarantee equality of expressions for all values of the variables.
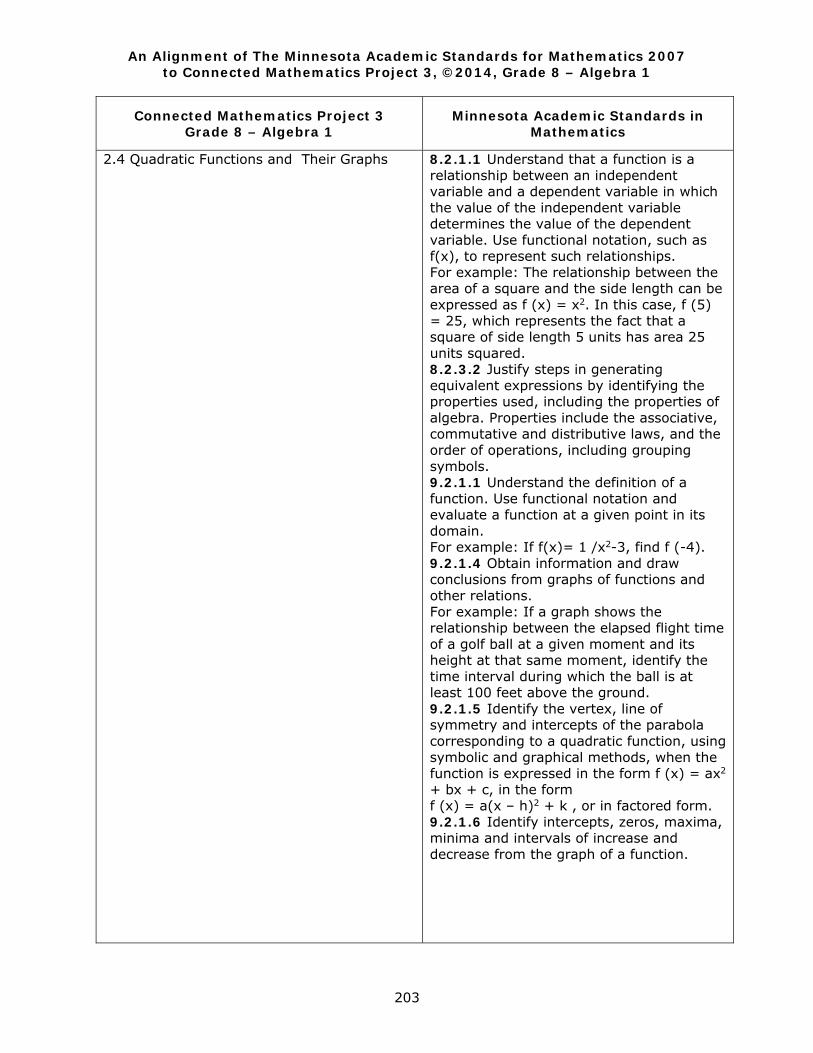
An Alignment of The Minnesota Academic Standards for Mathematics 2007 to Connected Mathematics Project 3, ©2014, Grade 8 – Algebra 1
203
Connected Mathematics Project 3 Grade 8 – Algebra 1
Minnesota Academic Standards in Mathematics
2.4 Quadratic Functions and Their Graphs
8.2.1.1 Understand that a function is a relationship between an independent variable and a dependent variable in which the value of the independent variable determines the value of the dependent variable. Use functional notation, such as f(x), to represent such relationships. For example: The relationship between the area of a square and the side length can be expressed as f (x) = x2. In this case, f (5) = 25, which represents the fact that a square of side length 5 units has area 25 units squared. 8.2.3.2 Justify steps in generating equivalent expressions by identifying the properties used, including the properties of algebra. Properties include the associative, commutative and distributive laws, and the order of operations, including grouping symbols. 9.2.1.1 Understand the definition of a function. Use functional notation and evaluate a function at a given point in its domain. For example: If f(x)= 1 /x2-3, find f (-4). 9.2.1.4 Obtain information and draw conclusions from graphs of functions and other relations. For example: If a graph shows the relationship between the elapsed flight time of a golf ball at a given moment and its height at that same moment, identify the time interval during which the ball is at least 100 feet above the ground. 9.2.1.5 Identify the vertex, line of symmetry and intercepts of the parabola corresponding to a quadratic function, using symbolic and graphical methods, when the function is expressed in the form f (x) = ax2 + bx + c, in the form f (x) = a(x – h)2 + k , or in factored form. 9.2.1.6 Identify intercepts, zeros, maxima, minima and intervals of increase and decrease from the graph of a function.
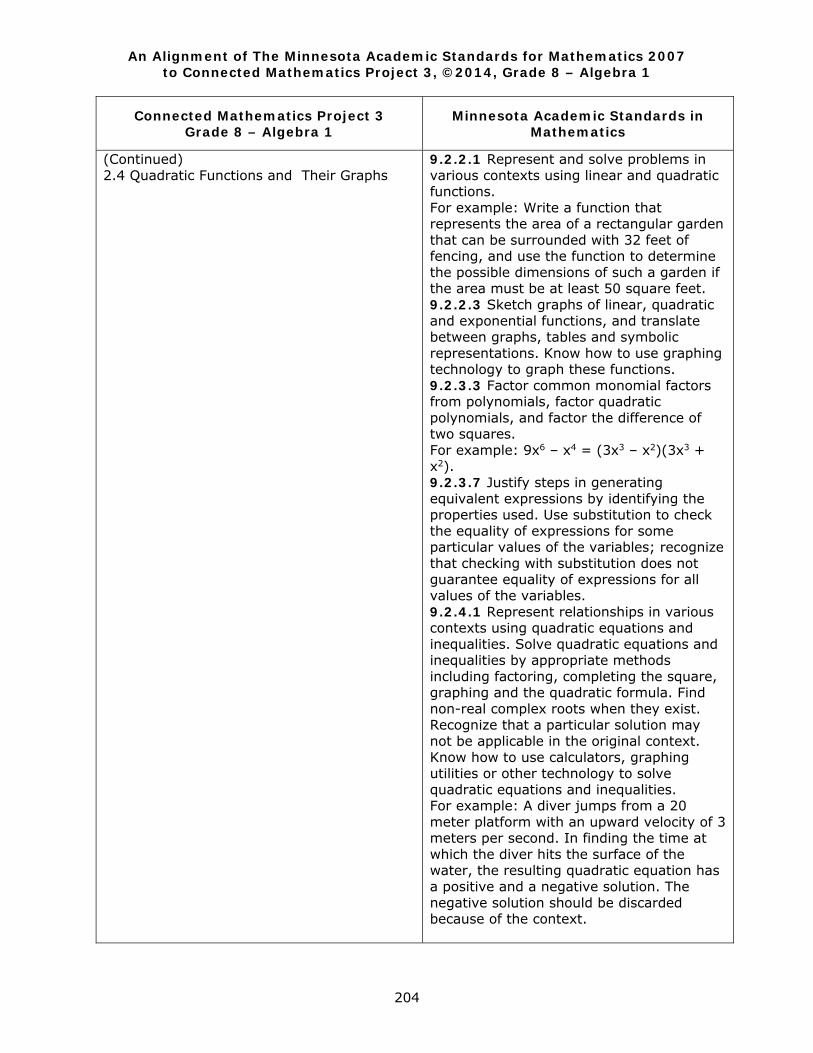
An Alignment of The Minnesota Academic Standards for Mathematics 2007 to Connected Mathematics Project 3, ©2014, Grade 8 – Algebra 1
204
Connected Mathematics Project 3 Grade 8 – Algebra 1
Minnesota Academic Standards in Mathematics
(Continued) 2.4 Quadratic Functions and Their Graphs
9.2.2.1 Represent and solve problems in various contexts using linear and quadratic functions. For example: Write a function that represents the area of a rectangular garden that can be surrounded with 32 feet of fencing, and use the function to determine the possible dimensions of such a garden if the area must be at least 50 square feet. 9.2.2.3 Sketch graphs of linear, quadratic and exponential functions, and translate between graphs, tables and symbolic representations. Know how to use graphing technology to graph these functions. 9.2.3.3 Factor common monomial factors from polynomials, factor quadratic polynomials, and factor the difference of two squares. For example: 9x6 – x4 = (3x3 – x2)(3x3 + x2). 9.2.3.7 Justify steps in generating equivalent expressions by identifying the properties used. Use substitution to check the equality of expressions for some particular values of the variables; recognize that checking with substitution does not guarantee equality of expressions for all values of the variables. 9.2.4.1 Represent relationships in various contexts using quadratic equations and inequalities. Solve quadratic equations and inequalities by appropriate methods including factoring, completing the square, graphing and the quadratic formula. Find non-real complex roots when they exist. Recognize that a particular solution may not be applicable in the original context. Know how to use calculators, graphing utilities or other technology to solve quadratic equations and inequalities. For example: A diver jumps from a 20 meter platform with an upward velocity of 3 meters per second. In finding the time at which the diver hits the surface of the water, the resulting quadratic equation has a positive and a negative solution. The negative solution should be discarded because of the context.
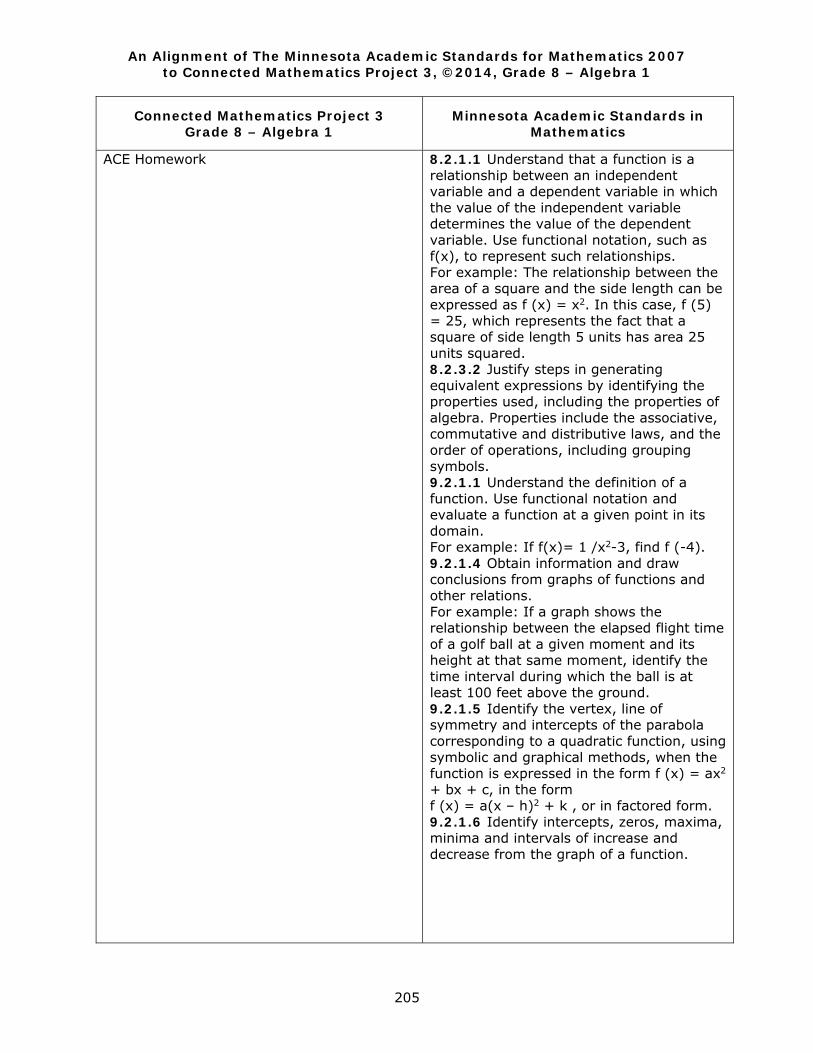
An Alignment of The Minnesota Academic Standards for Mathematics 2007 to Connected Mathematics Project 3, ©2014, Grade 8 – Algebra 1
205
Connected Mathematics Project 3 Grade 8 – Algebra 1
Minnesota Academic Standards in Mathematics
ACE Homework
8.2.1.1 Understand that a function is a relationship between an independent variable and a dependent variable in which the value of the independent variable determines the value of the dependent variable. Use functional notation, such as f(x), to represent such relationships. For example: The relationship between the area of a square and the side length can be expressed as f (x) = x2. In this case, f (5) = 25, which represents the fact that a square of side length 5 units has area 25 units squared. 8.2.3.2 Justify steps in generating equivalent expressions by identifying the properties used, including the properties of algebra. Properties include the associative, commutative and distributive laws, and the order of operations, including grouping symbols. 9.2.1.1 Understand the definition of a function. Use functional notation and evaluate a function at a given point in its domain. For example: If f(x)= 1 /x2-3, find f (-4). 9.2.1.4 Obtain information and draw conclusions from graphs of functions and other relations. For example: If a graph shows the relationship between the elapsed flight time of a golf ball at a given moment and its height at that same moment, identify the time interval during which the ball is at least 100 feet above the ground. 9.2.1.5 Identify the vertex, line of symmetry and intercepts of the parabola corresponding to a quadratic function, using symbolic and graphical methods, when the function is expressed in the form f (x) = ax2 + bx + c, in the form f (x) = a(x – h)2 + k , or in factored form. 9.2.1.6 Identify intercepts, zeros, maxima, minima and intervals of increase and decrease from the graph of a function.
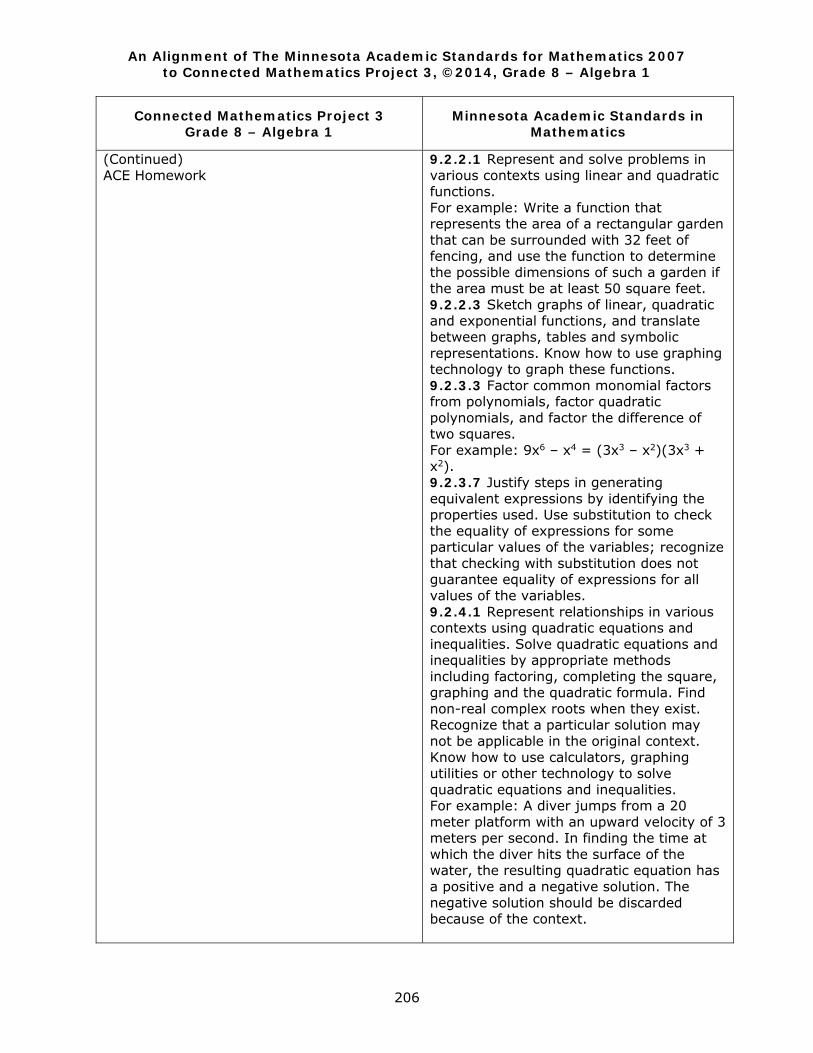
An Alignment of The Minnesota Academic Standards for Mathematics 2007 to Connected Mathematics Project 3, ©2014, Grade 8 – Algebra 1
206
Connected Mathematics Project 3 Grade 8 – Algebra 1
Minnesota Academic Standards in Mathematics
(Continued) ACE Homework
9.2.2.1 Represent and solve problems in various contexts using linear and quadratic functions. For example: Write a function that represents the area of a rectangular garden that can be surrounded with 32 feet of fencing, and use the function to determine the possible dimensions of such a garden if the area must be at least 50 square feet. 9.2.2.3 Sketch graphs of linear, quadratic and exponential functions, and translate between graphs, tables and symbolic representations. Know how to use graphing technology to graph these functions. 9.2.3.3 Factor common monomial factors from polynomials, factor quadratic polynomials, and factor the difference of two squares. For example: 9x6 – x4 = (3x3 – x2)(3x3 + x2). 9.2.3.7 Justify steps in generating equivalent expressions by identifying the properties used. Use substitution to check the equality of expressions for some particular values of the variables; recognize that checking with substitution does not guarantee equality of expressions for all values of the variables. 9.2.4.1 Represent relationships in various contexts using quadratic equations and inequalities. Solve quadratic equations and inequalities by appropriate methods including factoring, completing the square, graphing and the quadratic formula. Find non-real complex roots when they exist. Recognize that a particular solution may not be applicable in the original context. Know how to use calculators, graphing utilities or other technology to solve quadratic equations and inequalities. For example: A diver jumps from a 20 meter platform with an upward velocity of 3 meters per second. In finding the time at which the diver hits the surface of the water, the resulting quadratic equation has a positive and a negative solution. The negative solution should be discarded because of the context.
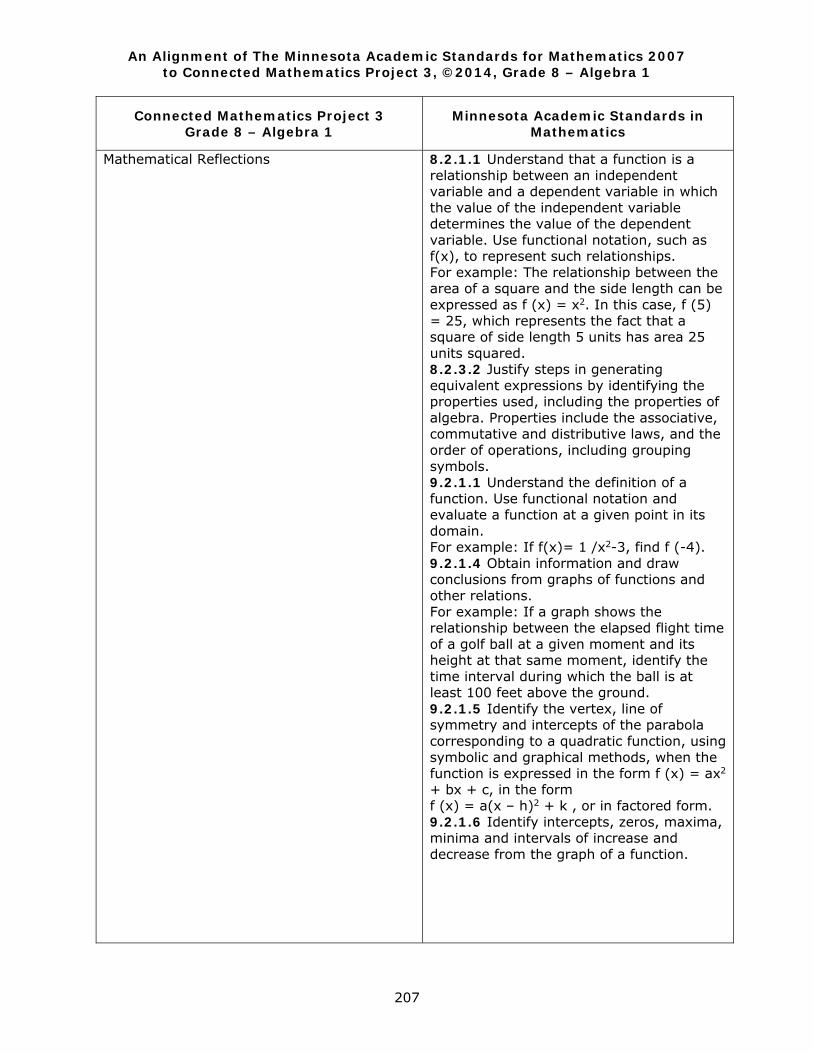
An Alignment of The Minnesota Academic Standards for Mathematics 2007 to Connected Mathematics Project 3, ©2014, Grade 8 – Algebra 1
207
Connected Mathematics Project 3 Grade 8 – Algebra 1
Minnesota Academic Standards in Mathematics
Mathematical Reflections
8.2.1.1 Understand that a function is a relationship between an independent variable and a dependent variable in which the value of the independent variable determines the value of the dependent variable. Use functional notation, such as f(x), to represent such relationships. For example: The relationship between the area of a square and the side length can be expressed as f (x) = x2. In this case, f (5) = 25, which represents the fact that a square of side length 5 units has area 25 units squared. 8.2.3.2 Justify steps in generating equivalent expressions by identifying the properties used, including the properties of algebra. Properties include the associative, commutative and distributive laws, and the order of operations, including grouping symbols. 9.2.1.1 Understand the definition of a function. Use functional notation and evaluate a function at a given point in its domain. For example: If f(x)= 1 /x2-3, find f (-4). 9.2.1.4 Obtain information and draw conclusions from graphs of functions and other relations. For example: If a graph shows the relationship between the elapsed flight time of a golf ball at a given moment and its height at that same moment, identify the time interval during which the ball is at least 100 feet above the ground. 9.2.1.5 Identify the vertex, line of symmetry and intercepts of the parabola corresponding to a quadratic function, using symbolic and graphical methods, when the function is expressed in the form f (x) = ax2 + bx + c, in the form f (x) = a(x – h)2 + k , or in factored form. 9.2.1.6 Identify intercepts, zeros, maxima, minima and intervals of increase and decrease from the graph of a function.
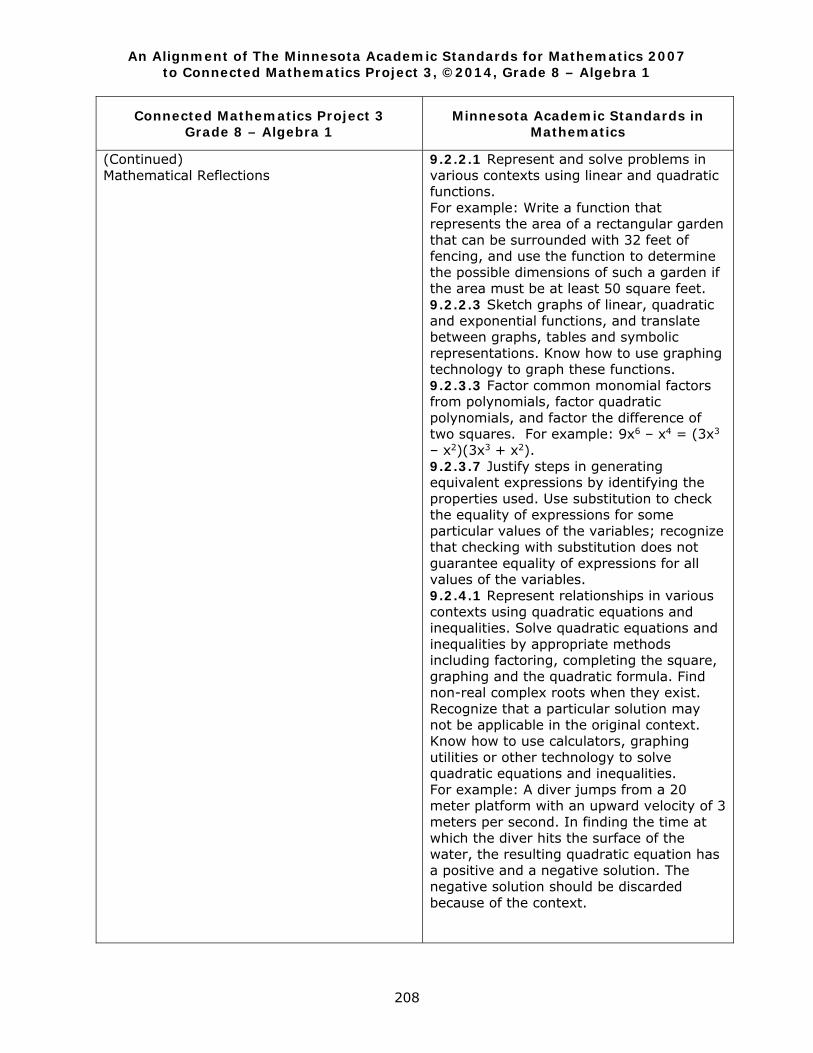
An Alignment of The Minnesota Academic Standards for Mathematics 2007 to Connected Mathematics Project 3, ©2014, Grade 8 – Algebra 1
208
Connected Mathematics Project 3 Grade 8 – Algebra 1
Minnesota Academic Standards in Mathematics
(Continued) Mathematical Reflections
9.2.2.1 Represent and solve problems in various contexts using linear and quadratic functions. For example: Write a function that represents the area of a rectangular garden that can be surrounded with 32 feet of fencing, and use the function to determine the possible dimensions of such a garden if the area must be at least 50 square feet. 9.2.2.3 Sketch graphs of linear, quadratic and exponential functions, and translate between graphs, tables and symbolic representations. Know how to use graphing technology to graph these functions. 9.2.3.3 Factor common monomial factors from polynomials, factor quadratic polynomials, and factor the difference of two squares. For example: 9x6 – x4 = (3x3 – x2)(3x3 + x2). 9.2.3.7 Justify steps in generating equivalent expressions by identifying the properties used. Use substitution to check the equality of expressions for some particular values of the variables; recognize that checking with substitution does not guarantee equality of expressions for all values of the variables. 9.2.4.1 Represent relationships in various contexts using quadratic equations and inequalities. Solve quadratic equations and inequalities by appropriate methods including factoring, completing the square, graphing and the quadratic formula. Find non-real complex roots when they exist. Recognize that a particular solution may not be applicable in the original context. Know how to use calculators, graphing utilities or other technology to solve quadratic equations and inequalities. For example: A diver jumps from a 20 meter platform with an upward velocity of 3 meters per second. In finding the time at which the diver hits the surface of the water, the resulting quadratic equation has a positive and a negative solution. The negative solution should be discarded because of the context.
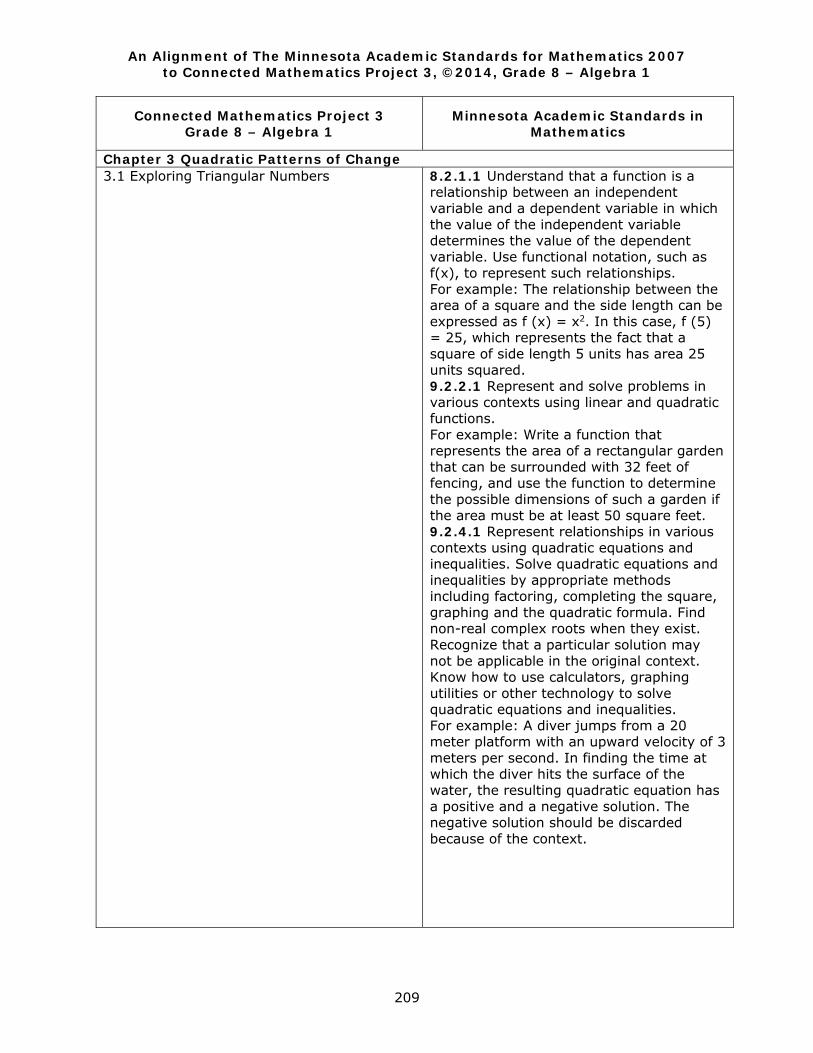
An Alignment of The Minnesota Academic Standards for Mathematics 2007 to Connected Mathematics Project 3, ©2014, Grade 8 – Algebra 1
209
Connected Mathematics Project 3 Grade 8 – Algebra 1
Minnesota Academic Standards in Mathematics
Chapter 3 Quadratic Patterns of Change 3.1 Exploring Triangular Numbers 8.2.1.1 Understand that a function is a
relationship between an independent variable and a dependent variable in which the value of the independent variable determines the value of the dependent variable. Use functional notation, such as f(x), to represent such relationships. For example: The relationship between the area of a square and the side length can be expressed as f (x) = x2. In this case, f (5) = 25, which represents the fact that a square of side length 5 units has area 25 units squared. 9.2.2.1 Represent and solve problems in various contexts using linear and quadratic functions. For example: Write a function that represents the area of a rectangular garden that can be surrounded with 32 feet of fencing, and use the function to determine the possible dimensions of such a garden if the area must be at least 50 square feet. 9.2.4.1 Represent relationships in various contexts using quadratic equations and inequalities. Solve quadratic equations and inequalities by appropriate methods including factoring, completing the square, graphing and the quadratic formula. Find non-real complex roots when they exist. Recognize that a particular solution may not be applicable in the original context. Know how to use calculators, graphing utilities or other technology to solve quadratic equations and inequalities. For example: A diver jumps from a 20 meter platform with an upward velocity of 3 meters per second. In finding the time at which the diver hits the surface of the water, the resulting quadratic equation has a positive and a negative solution. The negative solution should be discarded because of the context.
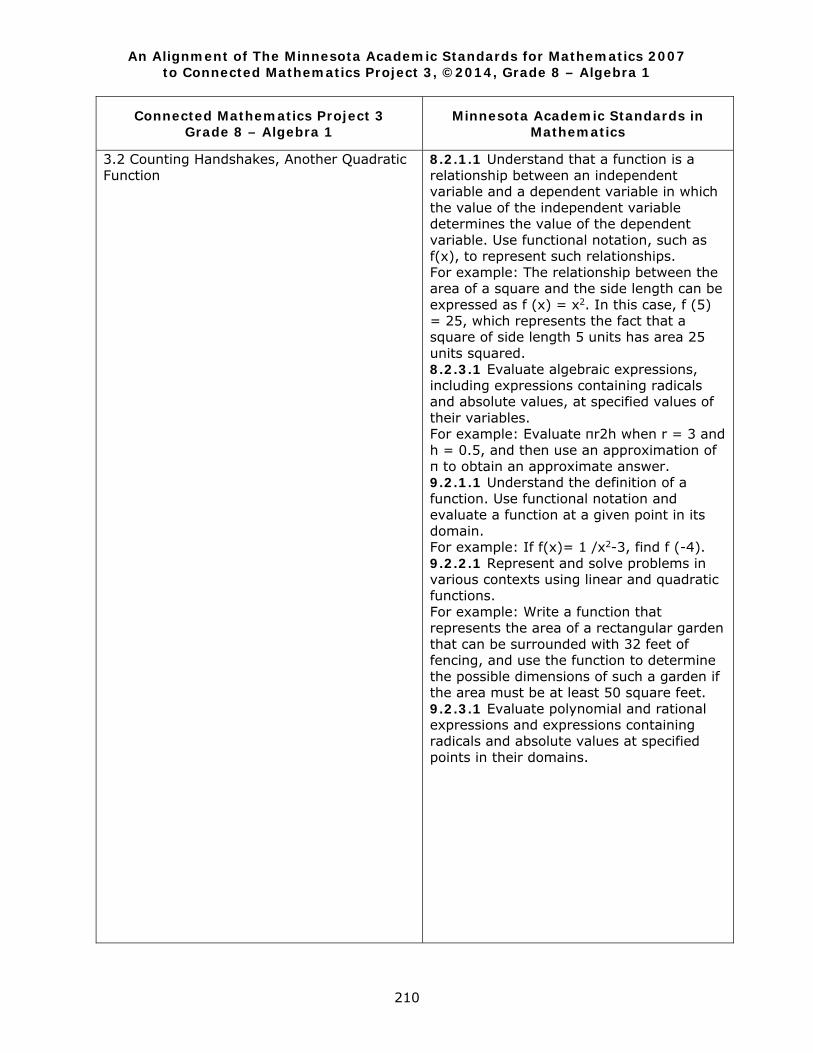
An Alignment of The Minnesota Academic Standards for Mathematics 2007 to Connected Mathematics Project 3, ©2014, Grade 8 – Algebra 1
210
Connected Mathematics Project 3 Grade 8 – Algebra 1
Minnesota Academic Standards in Mathematics
3.2 Counting Handshakes, Another Quadratic Function
8.2.1.1 Understand that a function is a relationship between an independent variable and a dependent variable in which the value of the independent variable determines the value of the dependent variable. Use functional notation, such as f(x), to represent such relationships. For example: The relationship between the area of a square and the side length can be expressed as f (x) = x2. In this case, f (5) = 25, which represents the fact that a square of side length 5 units has area 25 units squared. 8.2.3.1 Evaluate algebraic expressions, including expressions containing radicals and absolute values, at specified values of their variables. For example: Evaluate πr2h when r = 3 and h = 0.5, and then use an approximation of π to obtain an approximate answer. 9.2.1.1 Understand the definition of a function. Use functional notation and evaluate a function at a given point in its domain. For example: If f(x)= 1 /x2-3, find f (-4). 9.2.2.1 Represent and solve problems in various contexts using linear and quadratic functions. For example: Write a function that represents the area of a rectangular garden that can be surrounded with 32 feet of fencing, and use the function to determine the possible dimensions of such a garden if the area must be at least 50 square feet. 9.2.3.1 Evaluate polynomial and rational expressions and expressions containing radicals and absolute values at specified points in their domains.
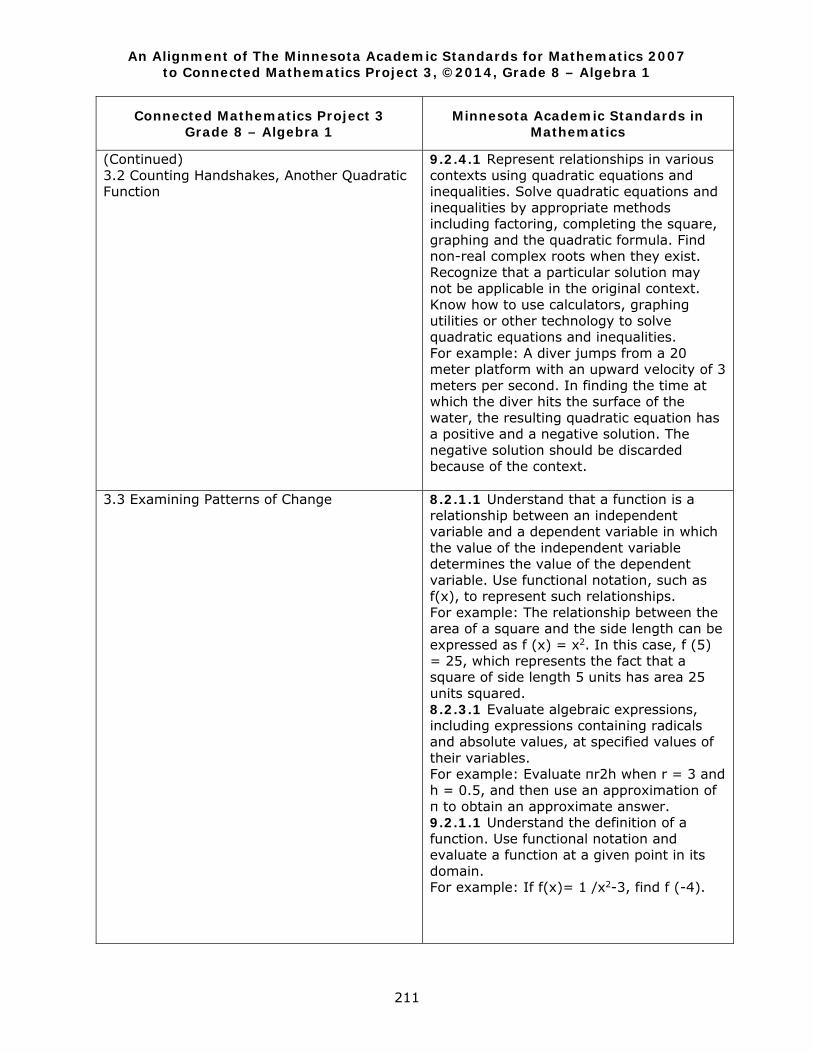
An Alignment of The Minnesota Academic Standards for Mathematics 2007 to Connected Mathematics Project 3, ©2014, Grade 8 – Algebra 1
211
Connected Mathematics Project 3 Grade 8 – Algebra 1
Minnesota Academic Standards in Mathematics
(Continued) 3.2 Counting Handshakes, Another Quadratic Function
9.2.4.1 Represent relationships in various contexts using quadratic equations and inequalities. Solve quadratic equations and inequalities by appropriate methods including factoring, completing the square, graphing and the quadratic formula. Find non-real complex roots when they exist. Recognize that a particular solution may not be applicable in the original context. Know how to use calculators, graphing utilities or other technology to solve quadratic equations and inequalities. For example: A diver jumps from a 20 meter platform with an upward velocity of 3 meters per second. In finding the time at which the diver hits the surface of the water, the resulting quadratic equation has a positive and a negative solution. The negative solution should be discarded because of the context.
3.3 Examining Patterns of Change
8.2.1.1 Understand that a function is a relationship between an independent variable and a dependent variable in which the value of the independent variable determines the value of the dependent variable. Use functional notation, such as f(x), to represent such relationships. For example: The relationship between the area of a square and the side length can be expressed as f (x) = x2. In this case, f (5) = 25, which represents the fact that a square of side length 5 units has area 25 units squared. 8.2.3.1 Evaluate algebraic expressions, including expressions containing radicals and absolute values, at specified values of their variables. For example: Evaluate πr2h when r = 3 and h = 0.5, and then use an approximation of π to obtain an approximate answer. 9.2.1.1 Understand the definition of a function. Use functional notation and evaluate a function at a given point in its domain. For example: If f(x)= 1 /x2-3, find f (-4).
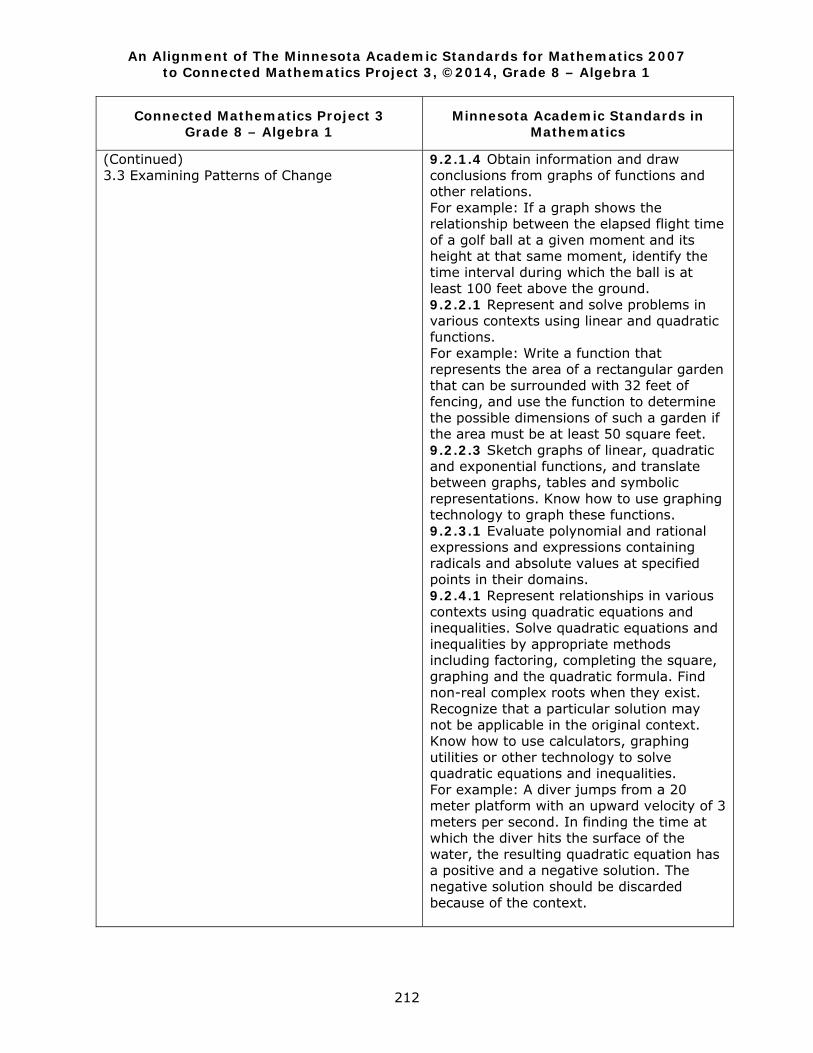
An Alignment of The Minnesota Academic Standards for Mathematics 2007 to Connected Mathematics Project 3, ©2014, Grade 8 – Algebra 1
212
Connected Mathematics Project 3 Grade 8 – Algebra 1
Minnesota Academic Standards in Mathematics
(Continued) 3.3 Examining Patterns of Change
9.2.1.4 Obtain information and draw conclusions from graphs of functions and other relations. For example: If a graph shows the relationship between the elapsed flight time of a golf ball at a given moment and its height at that same moment, identify the time interval during which the ball is at least 100 feet above the ground. 9.2.2.1 Represent and solve problems in various contexts using linear and quadratic functions. For example: Write a function that represents the area of a rectangular garden that can be surrounded with 32 feet of fencing, and use the function to determine the possible dimensions of such a garden if the area must be at least 50 square feet. 9.2.2.3 Sketch graphs of linear, quadratic and exponential functions, and translate between graphs, tables and symbolic representations. Know how to use graphing technology to graph these functions. 9.2.3.1 Evaluate polynomial and rational expressions and expressions containing radicals and absolute values at specified points in their domains. 9.2.4.1 Represent relationships in various contexts using quadratic equations and inequalities. Solve quadratic equations and inequalities by appropriate methods including factoring, completing the square, graphing and the quadratic formula. Find non-real complex roots when they exist. Recognize that a particular solution may not be applicable in the original context. Know how to use calculators, graphing utilities or other technology to solve quadratic equations and inequalities. For example: A diver jumps from a 20 meter platform with an upward velocity of 3 meters per second. In finding the time at which the diver hits the surface of the water, the resulting quadratic equation has a positive and a negative solution. The negative solution should be discarded because of the context.

An Alignment of The Minnesota Academic Standards for Mathematics 2007 to Connected Mathematics Project 3, ©2014, Grade 8 – Algebra 1
213
Connected Mathematics Project 3 Grade 8 – Algebra 1
Minnesota Academic Standards in Mathematics
3.4 Quadratic Functions and Patterns of Change
8.2.1.1 Understand that a function is a relationship between an independent variable and a dependent variable in which the value of the independent variable determines the value of the dependent variable. Use functional notation, such as f(x), to represent such relationships. For example: The relationship between the area of a square and the side length can be expressed as f (x) = x2. In this case, f (5) = 25, which represents the fact that a square of side length 5 units has area 25 units squared. 8.2.1.2 Use linear functions to represent relationships in which changing the input variable by some amount leads to a change in the output variable that is a constant times that amount. For example: Uncle Jim gave Emily $50 on the day she was born and $25 on each birthday after that. The function f (x) = 50 + 25x represents the amount of money Jim has given after x years. The rate of change is $25 per year. 8.2.1.4 Understand that an arithmetic sequence is a linear function that can be expressed in the form f (x) = mx + b, where x = 0, 1, 2, 3. For example: The arithmetic sequence 3, 7, 11, 15, …, can be expressed as f (x) = 4x + 3. 8.2.2.1 Represent linear functions with tables, verbal descriptions, symbols, equations and graphs; translate from one representation to another. 8.2.2.2 Identify graphical properties of linear functions including slopes and intercepts. Know that the slope equals the rate of change, and that the y-intercept is zero when the function represents a proportional relationship. 8.2.2.4 Represent arithmetic sequences using equations, tables, graphs and verbal descriptions, and use them to solve problems. For example: If a girl starts with $100 in savings and adds $10 at the end of each month, she will have 100 + 10x dollars after x months.
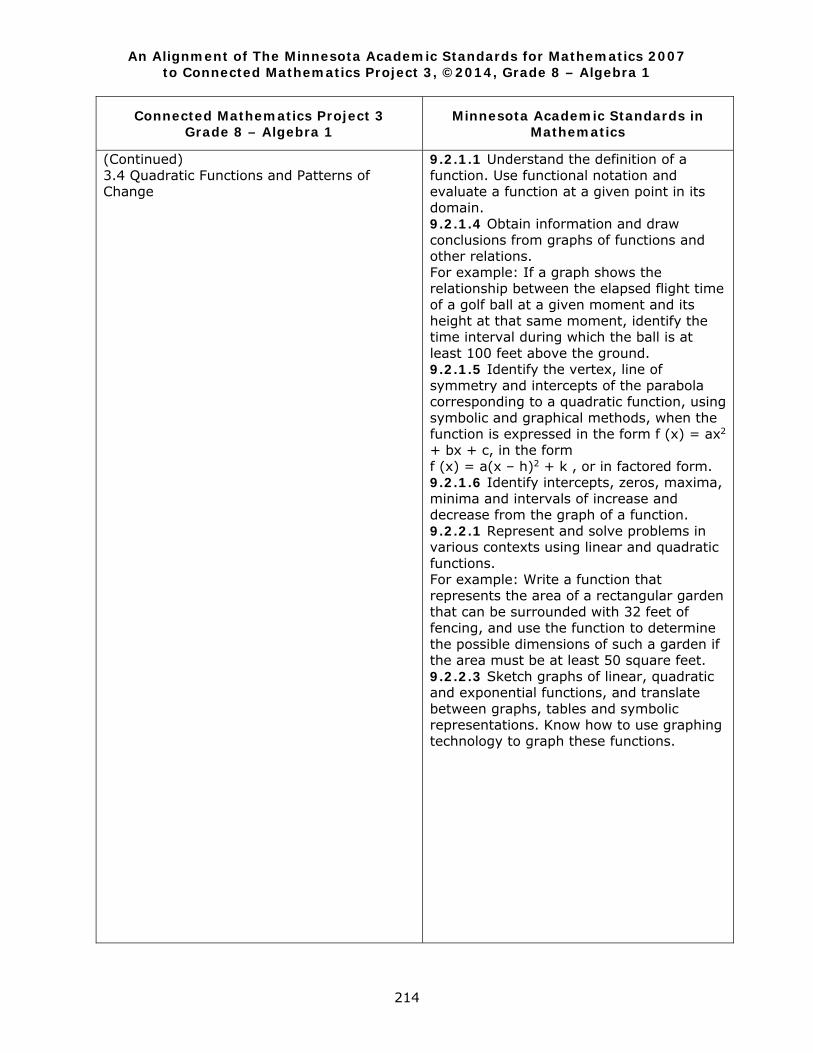
An Alignment of The Minnesota Academic Standards for Mathematics 2007 to Connected Mathematics Project 3, ©2014, Grade 8 – Algebra 1
214
Connected Mathematics Project 3 Grade 8 – Algebra 1
Minnesota Academic Standards in Mathematics
(Continued) 3.4 Quadratic Functions and Patterns of Change
9.2.1.1 Understand the definition of a function. Use functional notation and evaluate a function at a given point in its domain. 9.2.1.4 Obtain information and draw conclusions from graphs of functions and other relations. For example: If a graph shows the relationship between the elapsed flight time of a golf ball at a given moment and its height at that same moment, identify the time interval during which the ball is at least 100 feet above the ground. 9.2.1.5 Identify the vertex, line of symmetry and intercepts of the parabola corresponding to a quadratic function, using symbolic and graphical methods, when the function is expressed in the form f (x) = ax2 + bx + c, in the form f (x) = a(x – h)2 + k , or in factored form. 9.2.1.6 Identify intercepts, zeros, maxima, minima and intervals of increase and decrease from the graph of a function. 9.2.2.1 Represent and solve problems in various contexts using linear and quadratic functions. For example: Write a function that represents the area of a rectangular garden that can be surrounded with 32 feet of fencing, and use the function to determine the possible dimensions of such a garden if the area must be at least 50 square feet. 9.2.2.3 Sketch graphs of linear, quadratic and exponential functions, and translate between graphs, tables and symbolic representations. Know how to use graphing technology to graph these functions.
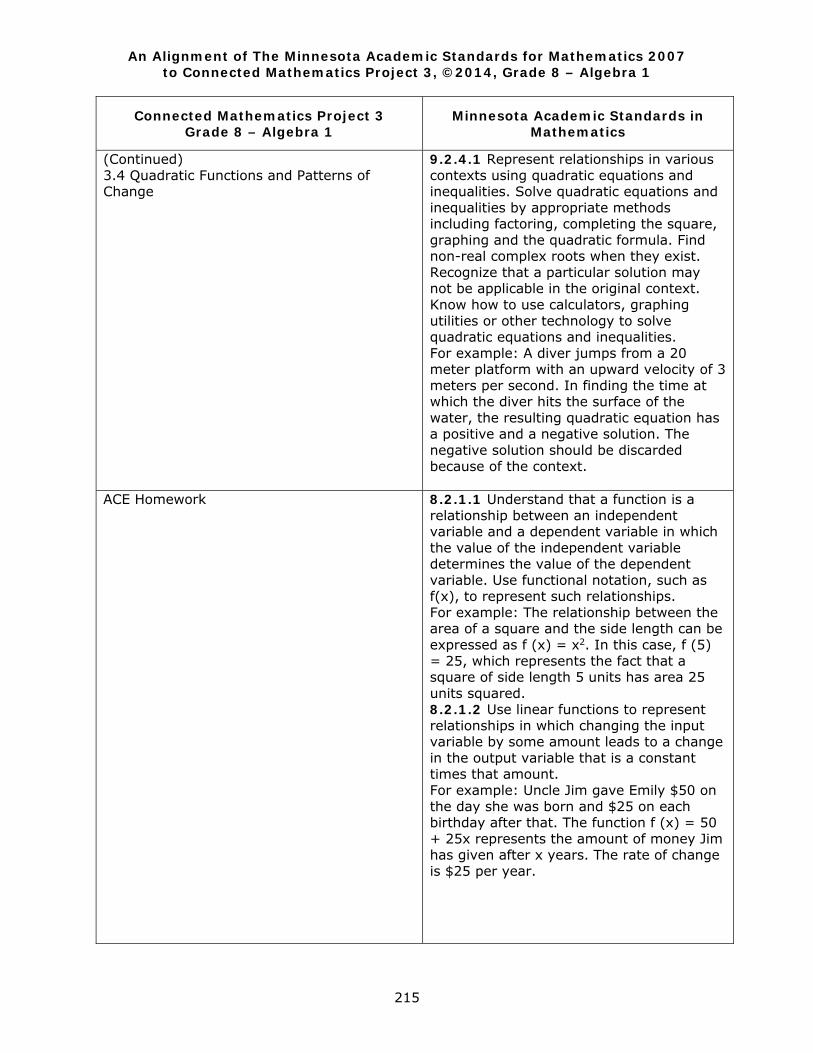
An Alignment of The Minnesota Academic Standards for Mathematics 2007 to Connected Mathematics Project 3, ©2014, Grade 8 – Algebra 1
215
Connected Mathematics Project 3 Grade 8 – Algebra 1
Minnesota Academic Standards in Mathematics
(Continued) 3.4 Quadratic Functions and Patterns of Change
9.2.4.1 Represent relationships in various contexts using quadratic equations and inequalities. Solve quadratic equations and inequalities by appropriate methods including factoring, completing the square, graphing and the quadratic formula. Find non-real complex roots when they exist. Recognize that a particular solution may not be applicable in the original context. Know how to use calculators, graphing utilities or other technology to solve quadratic equations and inequalities. For example: A diver jumps from a 20 meter platform with an upward velocity of 3 meters per second. In finding the time at which the diver hits the surface of the water, the resulting quadratic equation has a positive and a negative solution. The negative solution should be discarded because of the context.
ACE Homework
8.2.1.1 Understand that a function is a relationship between an independent variable and a dependent variable in which the value of the independent variable determines the value of the dependent variable. Use functional notation, such as f(x), to represent such relationships. For example: The relationship between the area of a square and the side length can be expressed as f (x) = x2. In this case, f (5) = 25, which represents the fact that a square of side length 5 units has area 25 units squared. 8.2.1.2 Use linear functions to represent relationships in which changing the input variable by some amount leads to a change in the output variable that is a constant times that amount. For example: Uncle Jim gave Emily $50 on the day she was born and $25 on each birthday after that. The function f (x) = 50 + 25x represents the amount of money Jim has given after x years. The rate of change is $25 per year.
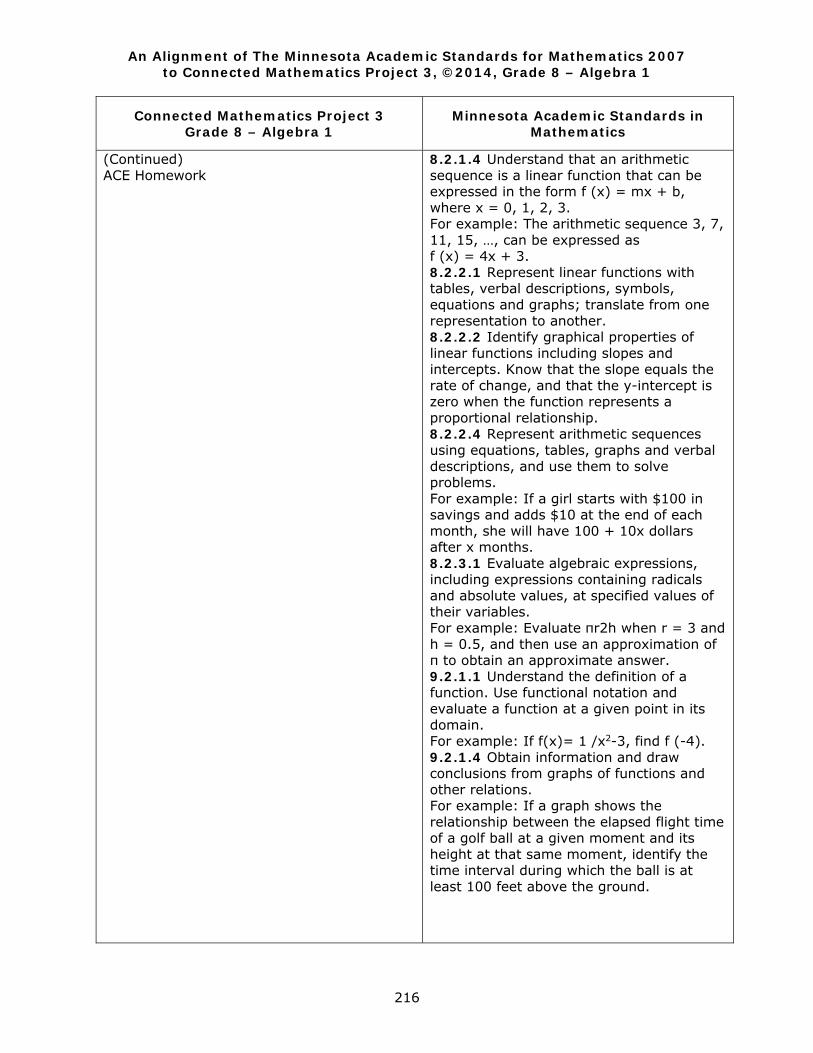
An Alignment of The Minnesota Academic Standards for Mathematics 2007 to Connected Mathematics Project 3, ©2014, Grade 8 – Algebra 1
216
Connected Mathematics Project 3 Grade 8 – Algebra 1
Minnesota Academic Standards in Mathematics
(Continued) ACE Homework
8.2.1.4 Understand that an arithmetic sequence is a linear function that can be expressed in the form f (x) = mx + b, where x = 0, 1, 2, 3. For example: The arithmetic sequence 3, 7, 11, 15, …, can be expressed as f (x) = 4x + 3. 8.2.2.1 Represent linear functions with tables, verbal descriptions, symbols, equations and graphs; translate from one representation to another. 8.2.2.2 Identify graphical properties of linear functions including slopes and intercepts. Know that the slope equals the rate of change, and that the y-intercept is zero when the function represents a proportional relationship. 8.2.2.4 Represent arithmetic sequences using equations, tables, graphs and verbal descriptions, and use them to solve problems. For example: If a girl starts with $100 in savings and adds $10 at the end of each month, she will have 100 + 10x dollars after x months. 8.2.3.1 Evaluate algebraic expressions, including expressions containing radicals and absolute values, at specified values of their variables. For example: Evaluate πr2h when r = 3 and h = 0.5, and then use an approximation of π to obtain an approximate answer. 9.2.1.1 Understand the definition of a function. Use functional notation and evaluate a function at a given point in its domain. For example: If f(x)= 1 /x2-3, find f (-4). 9.2.1.4 Obtain information and draw conclusions from graphs of functions and other relations. For example: If a graph shows the relationship between the elapsed flight time of a golf ball at a given moment and its height at that same moment, identify the time interval during which the ball is at least 100 feet above the ground.
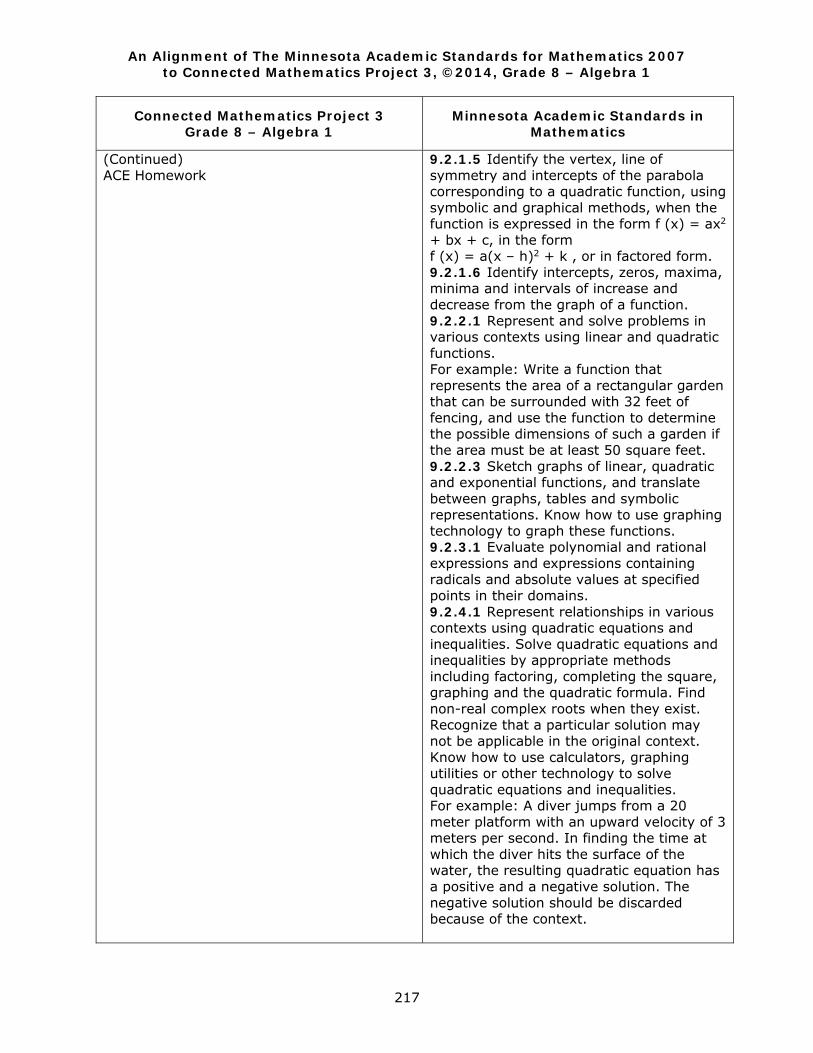
An Alignment of The Minnesota Academic Standards for Mathematics 2007 to Connected Mathematics Project 3, ©2014, Grade 8 – Algebra 1
217
Connected Mathematics Project 3 Grade 8 – Algebra 1
Minnesota Academic Standards in Mathematics
(Continued) ACE Homework
9.2.1.5 Identify the vertex, line of symmetry and intercepts of the parabola corresponding to a quadratic function, using symbolic and graphical methods, when the function is expressed in the form f (x) = ax2 + bx + c, in the form f (x) = a(x – h)2 + k , or in factored form. 9.2.1.6 Identify intercepts, zeros, maxima, minima and intervals of increase and decrease from the graph of a function. 9.2.2.1 Represent and solve problems in various contexts using linear and quadratic functions. For example: Write a function that represents the area of a rectangular garden that can be surrounded with 32 feet of fencing, and use the function to determine the possible dimensions of such a garden if the area must be at least 50 square feet. 9.2.2.3 Sketch graphs of linear, quadratic and exponential functions, and translate between graphs, tables and symbolic representations. Know how to use graphing technology to graph these functions. 9.2.3.1 Evaluate polynomial and rational expressions and expressions containing radicals and absolute values at specified points in their domains. 9.2.4.1 Represent relationships in various contexts using quadratic equations and inequalities. Solve quadratic equations and inequalities by appropriate methods including factoring, completing the square, graphing and the quadratic formula. Find non-real complex roots when they exist. Recognize that a particular solution may not be applicable in the original context. Know how to use calculators, graphing utilities or other technology to solve quadratic equations and inequalities. For example: A diver jumps from a 20 meter platform with an upward velocity of 3 meters per second. In finding the time at which the diver hits the surface of the water, the resulting quadratic equation has a positive and a negative solution. The negative solution should be discarded because of the context.

An Alignment of The Minnesota Academic Standards for Mathematics 2007 to Connected Mathematics Project 3, ©2014, Grade 8 – Algebra 1
218
Connected Mathematics Project 3 Grade 8 – Algebra 1
Minnesota Academic Standards in Mathematics
Mathematical Reflections
8.2.1.1 Understand that a function is a relationship between an independent variable and a dependent variable in which the value of the independent variable determines the value of the dependent variable. Use functional notation, such as f(x), to represent such relationships. For example: The relationship between the area of a square and the side length can be expressed as f (x) = x2. In this case, f (5) = 25, which represents the fact that a square of side length 5 units has area 25 units squared. 8.2.1.2 Use linear functions to represent relationships in which changing the input variable by some amount leads to a change in the output variable that is a constant times that amount. For example: Uncle Jim gave Emily $50 on the day she was born and $25 on each birthday after that. The function f (x) = 50 + 25x represents the amount of money Jim has given after x years. The rate of change is $25 per year. 8.2.1.4 Understand that an arithmetic sequence is a linear function that can be expressed in the form f (x) = mx + b, where x = 0, 1, 2, 3. For example: The arithmetic sequence 3, 7, 11, 15, …, can be expressed as f (x) = 4x + 3. 8.2.2.1 Represent linear functions with tables, verbal descriptions, symbols, equations and graphs; translate from one representation to another. 8.2.2.2 Identify graphical properties of linear functions including slopes and intercepts. Know that the slope equals the rate of change, and that the y-intercept is zero when the function represents a proportional relationship. 8.2.2.4 Represent arithmetic sequences using equations, tables, graphs and verbal descriptions, and use them to solve problems. For example: If a girl starts with $100 in savings and adds $10 at the end of each month, she will have 100 + 10x dollars after x months.
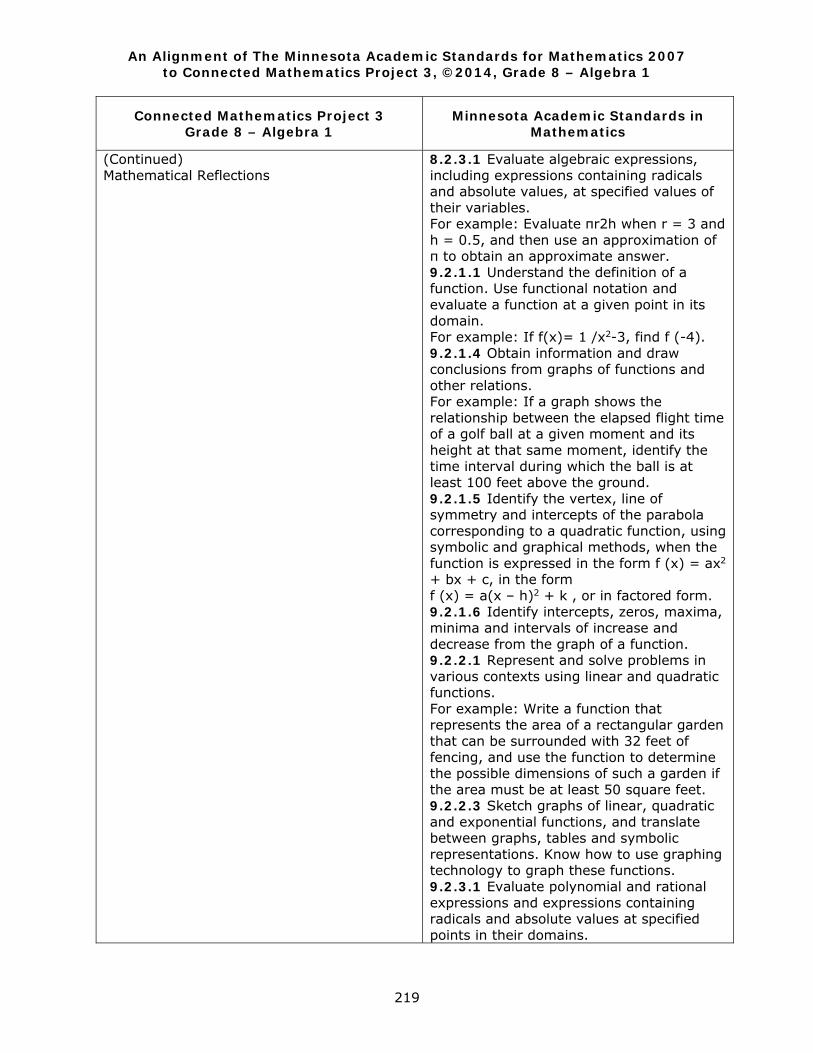
An Alignment of The Minnesota Academic Standards for Mathematics 2007 to Connected Mathematics Project 3, ©2014, Grade 8 – Algebra 1
219
Connected Mathematics Project 3 Grade 8 – Algebra 1
Minnesota Academic Standards in Mathematics
(Continued) Mathematical Reflections
8.2.3.1 Evaluate algebraic expressions, including expressions containing radicals and absolute values, at specified values of their variables. For example: Evaluate πr2h when r = 3 and h = 0.5, and then use an approximation of π to obtain an approximate answer. 9.2.1.1 Understand the definition of a function. Use functional notation and evaluate a function at a given point in its domain. For example: If f(x)= 1 /x2-3, find f (-4). 9.2.1.4 Obtain information and draw conclusions from graphs of functions and other relations. For example: If a graph shows the relationship between the elapsed flight time of a golf ball at a given moment and its height at that same moment, identify the time interval during which the ball is at least 100 feet above the ground. 9.2.1.5 Identify the vertex, line of symmetry and intercepts of the parabola corresponding to a quadratic function, using symbolic and graphical methods, when the function is expressed in the form f (x) = ax2 + bx + c, in the form f (x) = a(x – h)2 + k , or in factored form. 9.2.1.6 Identify intercepts, zeros, maxima, minima and intervals of increase and decrease from the graph of a function. 9.2.2.1 Represent and solve problems in various contexts using linear and quadratic functions. For example: Write a function that represents the area of a rectangular garden that can be surrounded with 32 feet of fencing, and use the function to determine the possible dimensions of such a garden if the area must be at least 50 square feet. 9.2.2.3 Sketch graphs of linear, quadratic and exponential functions, and translate between graphs, tables and symbolic representations. Know how to use graphing technology to graph these functions. 9.2.3.1 Evaluate polynomial and rational expressions and expressions containing radicals and absolute values at specified points in their domains.
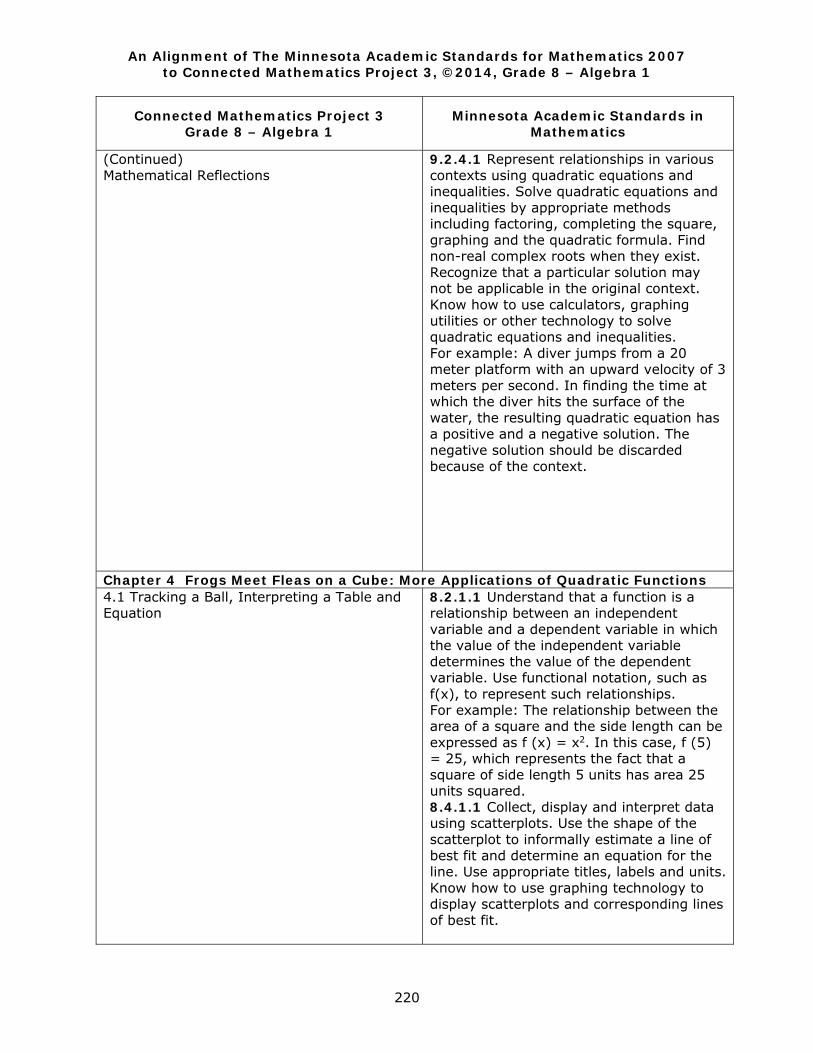
An Alignment of The Minnesota Academic Standards for Mathematics 2007 to Connected Mathematics Project 3, ©2014, Grade 8 – Algebra 1
220
Connected Mathematics Project 3 Grade 8 – Algebra 1
Minnesota Academic Standards in Mathematics
(Continued) Mathematical Reflections
9.2.4.1 Represent relationships in various contexts using quadratic equations and inequalities. Solve quadratic equations and inequalities by appropriate methods including factoring, completing the square, graphing and the quadratic formula. Find non-real complex roots when they exist. Recognize that a particular solution may not be applicable in the original context. Know how to use calculators, graphing utilities or other technology to solve quadratic equations and inequalities. For example: A diver jumps from a 20 meter platform with an upward velocity of 3 meters per second. In finding the time at which the diver hits the surface of the water, the resulting quadratic equation has a positive and a negative solution. The negative solution should be discarded because of the context.
Chapter 4 Frogs Meet Fleas on a Cube: More Applications of Quadratic Functions 4.1 Tracking a Ball, Interpreting a Table and Equation
8.2.1.1 Understand that a function is a relationship between an independent variable and a dependent variable in which the value of the independent variable determines the value of the dependent variable. Use functional notation, such as f(x), to represent such relationships. For example: The relationship between the area of a square and the side length can be expressed as f (x) = x2. In this case, f (5) = 25, which represents the fact that a square of side length 5 units has area 25 units squared. 8.4.1.1 Collect, display and interpret data using scatterplots. Use the shape of the scatterplot to informally estimate a line of best fit and determine an equation for the line. Use appropriate titles, labels and units. Know how to use graphing technology to display scatterplots and corresponding lines of best fit.
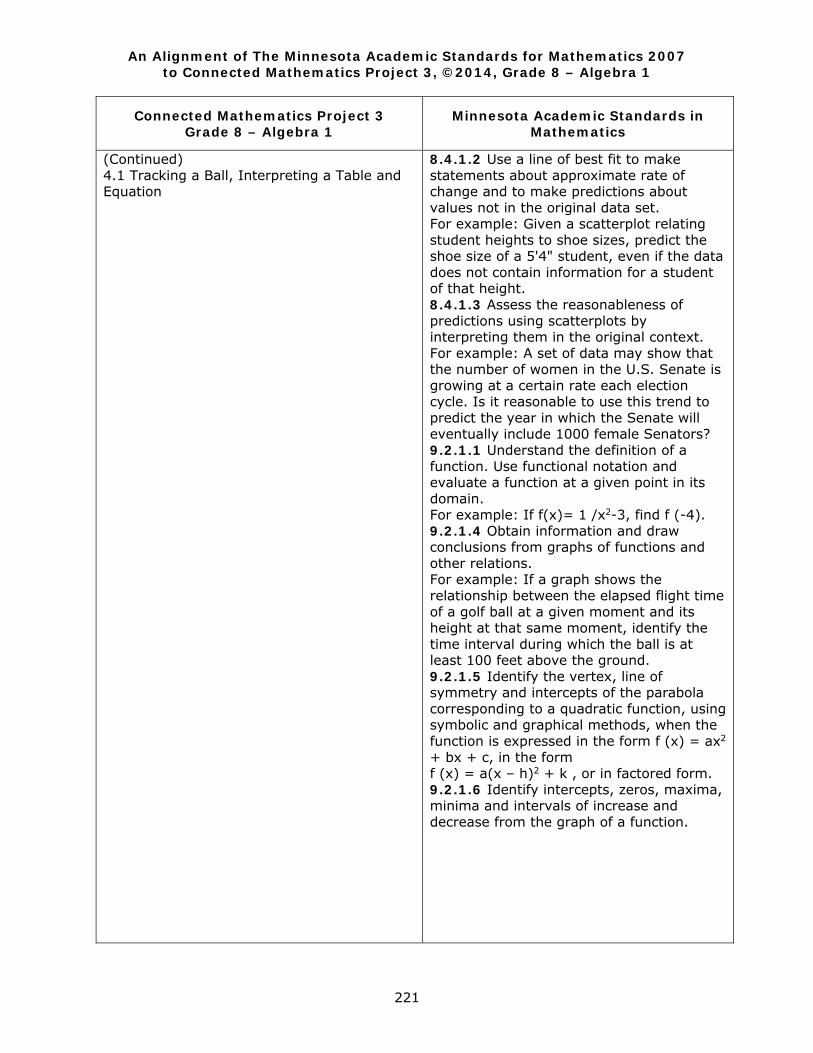
An Alignment of The Minnesota Academic Standards for Mathematics 2007 to Connected Mathematics Project 3, ©2014, Grade 8 – Algebra 1
221
Connected Mathematics Project 3 Grade 8 – Algebra 1
Minnesota Academic Standards in Mathematics
(Continued) 4.1 Tracking a Ball, Interpreting a Table and Equation
8.4.1.2 Use a line of best fit to make statements about approximate rate of change and to make predictions about values not in the original data set. For example: Given a scatterplot relating student heights to shoe sizes, predict the shoe size of a 5'4" student, even if the data does not contain information for a student of that height. 8.4.1.3 Assess the reasonableness of predictions using scatterplots by interpreting them in the original context. For example: A set of data may show that the number of women in the U.S. Senate is growing at a certain rate each election cycle. Is it reasonable to use this trend to predict the year in which the Senate will eventually include 1000 female Senators? 9.2.1.1 Understand the definition of a function. Use functional notation and evaluate a function at a given point in its domain. For example: If f(x)= 1 /x2-3, find f (-4). 9.2.1.4 Obtain information and draw conclusions from graphs of functions and other relations. For example: If a graph shows the relationship between the elapsed flight time of a golf ball at a given moment and its height at that same moment, identify the time interval during which the ball is at least 100 feet above the ground. 9.2.1.5 Identify the vertex, line of symmetry and intercepts of the parabola corresponding to a quadratic function, using symbolic and graphical methods, when the function is expressed in the form f (x) = ax2 + bx + c, in the form f (x) = a(x – h)2 + k , or in factored form. 9.2.1.6 Identify intercepts, zeros, maxima, minima and intervals of increase and decrease from the graph of a function.
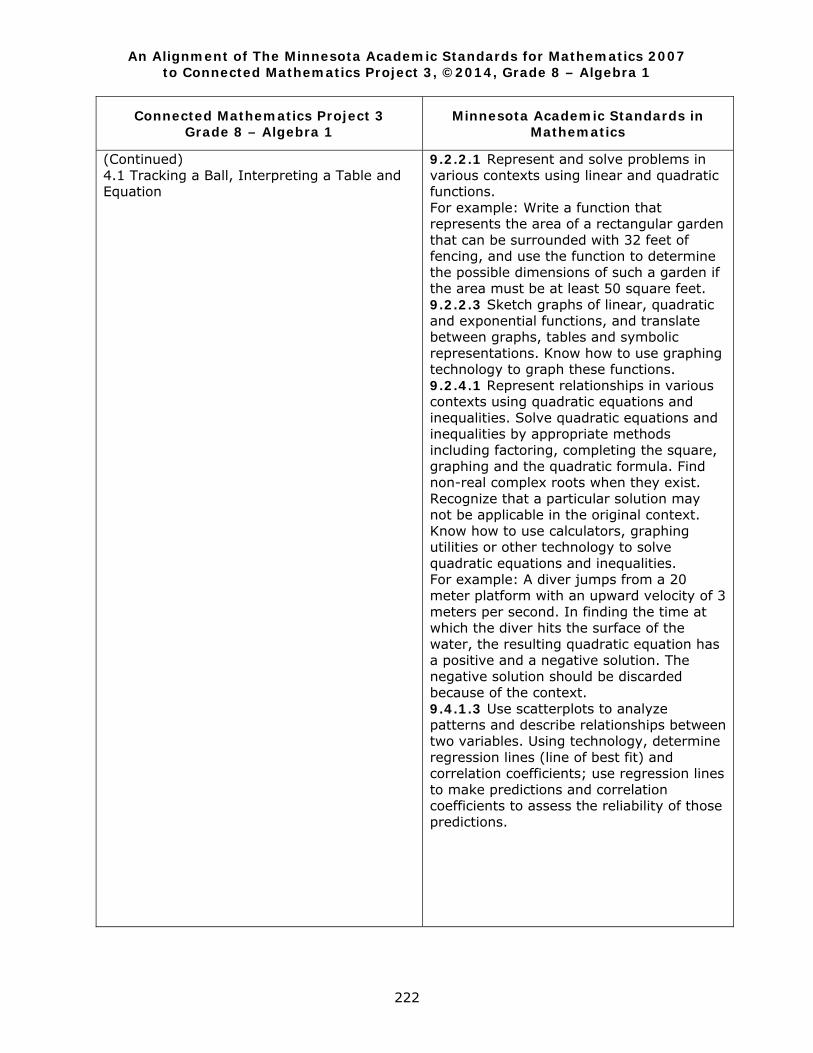
An Alignment of The Minnesota Academic Standards for Mathematics 2007 to Connected Mathematics Project 3, ©2014, Grade 8 – Algebra 1
222
Connected Mathematics Project 3 Grade 8 – Algebra 1
Minnesota Academic Standards in Mathematics
(Continued) 4.1 Tracking a Ball, Interpreting a Table and Equation
9.2.2.1 Represent and solve problems in various contexts using linear and quadratic functions. For example: Write a function that represents the area of a rectangular garden that can be surrounded with 32 feet of fencing, and use the function to determine the possible dimensions of such a garden if the area must be at least 50 square feet. 9.2.2.3 Sketch graphs of linear, quadratic and exponential functions, and translate between graphs, tables and symbolic representations. Know how to use graphing technology to graph these functions. 9.2.4.1 Represent relationships in various contexts using quadratic equations and inequalities. Solve quadratic equations and inequalities by appropriate methods including factoring, completing the square, graphing and the quadratic formula. Find non-real complex roots when they exist. Recognize that a particular solution may not be applicable in the original context. Know how to use calculators, graphing utilities or other technology to solve quadratic equations and inequalities. For example: A diver jumps from a 20 meter platform with an upward velocity of 3 meters per second. In finding the time at which the diver hits the surface of the water, the resulting quadratic equation has a positive and a negative solution. The negative solution should be discarded because of the context. 9.4.1.3 Use scatterplots to analyze patterns and describe relationships between two variables. Using technology, determine regression lines (line of best fit) and correlation coefficients; use regression lines to make predictions and correlation coefficients to assess the reliability of those predictions.
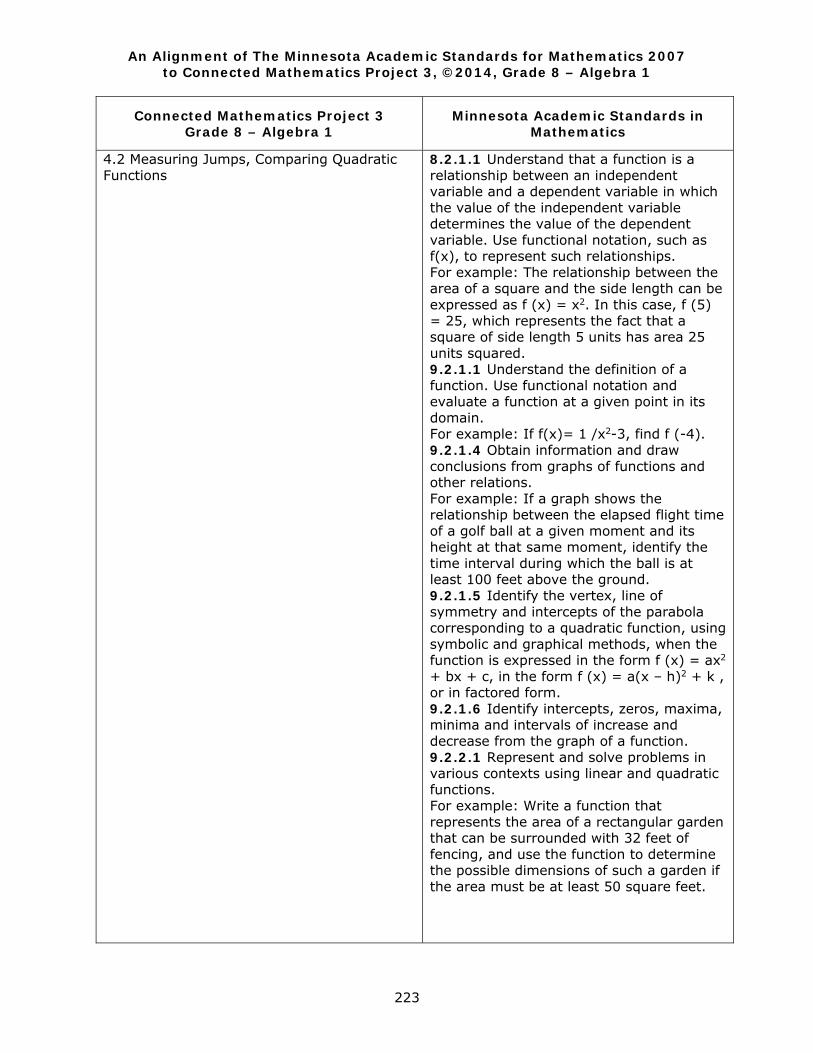
An Alignment of The Minnesota Academic Standards for Mathematics 2007 to Connected Mathematics Project 3, ©2014, Grade 8 – Algebra 1
223
Connected Mathematics Project 3 Grade 8 – Algebra 1
Minnesota Academic Standards in Mathematics
4.2 Measuring Jumps, Comparing Quadratic Functions
8.2.1.1 Understand that a function is a relationship between an independent variable and a dependent variable in which the value of the independent variable determines the value of the dependent variable. Use functional notation, such as f(x), to represent such relationships. For example: The relationship between the area of a square and the side length can be expressed as f (x) = x2. In this case, f (5) = 25, which represents the fact that a square of side length 5 units has area 25 units squared. 9.2.1.1 Understand the definition of a function. Use functional notation and evaluate a function at a given point in its domain. For example: If f(x)= 1 /x2-3, find f (-4). 9.2.1.4 Obtain information and draw conclusions from graphs of functions and other relations. For example: If a graph shows the relationship between the elapsed flight time of a golf ball at a given moment and its height at that same moment, identify the time interval during which the ball is at least 100 feet above the ground. 9.2.1.5 Identify the vertex, line of symmetry and intercepts of the parabola corresponding to a quadratic function, using symbolic and graphical methods, when the function is expressed in the form f (x) = ax2 + bx + c, in the form f (x) = a(x – h)2 + k , or in factored form. 9.2.1.6 Identify intercepts, zeros, maxima, minima and intervals of increase and decrease from the graph of a function. 9.2.2.1 Represent and solve problems in various contexts using linear and quadratic functions. For example: Write a function that represents the area of a rectangular garden that can be surrounded with 32 feet of fencing, and use the function to determine the possible dimensions of such a garden if the area must be at least 50 square feet.
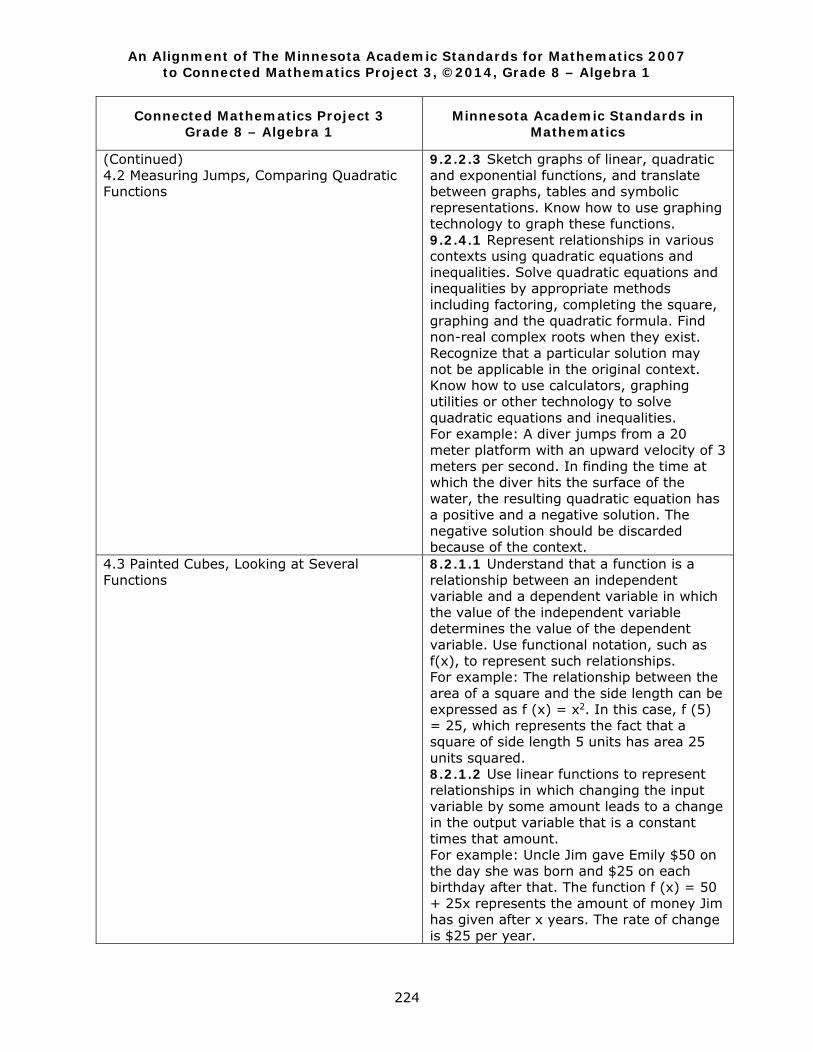
An Alignment of The Minnesota Academic Standards for Mathematics 2007 to Connected Mathematics Project 3, ©2014, Grade 8 – Algebra 1
224
Connected Mathematics Project 3 Grade 8 – Algebra 1
Minnesota Academic Standards in Mathematics
(Continued) 4.2 Measuring Jumps, Comparing Quadratic Functions
9.2.2.3 Sketch graphs of linear, quadratic and exponential functions, and translate between graphs, tables and symbolic representations. Know how to use graphing technology to graph these functions. 9.2.4.1 Represent relationships in various contexts using quadratic equations and inequalities. Solve quadratic equations and inequalities by appropriate methods including factoring, completing the square, graphing and the quadratic formula. Find non-real complex roots when they exist. Recognize that a particular solution may not be applicable in the original context. Know how to use calculators, graphing utilities or other technology to solve quadratic equations and inequalities. For example: A diver jumps from a 20 meter platform with an upward velocity of 3 meters per second. In finding the time at which the diver hits the surface of the water, the resulting quadratic equation has a positive and a negative solution. The negative solution should be discarded because of the context.
4.3 Painted Cubes, Looking at Several Functions
8.2.1.1 Understand that a function is a relationship between an independent variable and a dependent variable in which the value of the independent variable determines the value of the dependent variable. Use functional notation, such as f(x), to represent such relationships. For example: The relationship between the area of a square and the side length can be expressed as f (x) = x2. In this case, f (5) = 25, which represents the fact that a square of side length 5 units has area 25 units squared. 8.2.1.2 Use linear functions to represent relationships in which changing the input variable by some amount leads to a change in the output variable that is a constant times that amount. For example: Uncle Jim gave Emily $50 on the day she was born and $25 on each birthday after that. The function f (x) = 50 + 25x represents the amount of money Jim has given after x years. The rate of change is $25 per year.
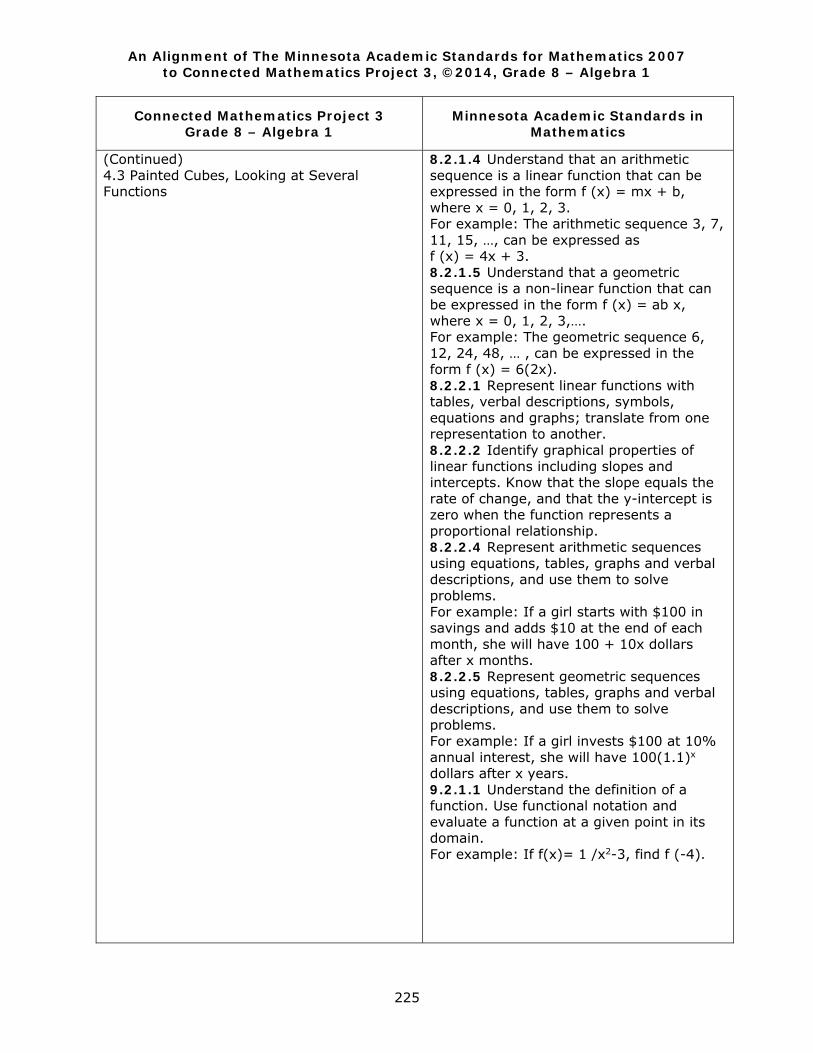
An Alignment of The Minnesota Academic Standards for Mathematics 2007 to Connected Mathematics Project 3, ©2014, Grade 8 – Algebra 1
225
Connected Mathematics Project 3 Grade 8 – Algebra 1
Minnesota Academic Standards in Mathematics
(Continued) 4.3 Painted Cubes, Looking at Several Functions
8.2.1.4 Understand that an arithmetic sequence is a linear function that can be expressed in the form f (x) = mx + b, where x = 0, 1, 2, 3. For example: The arithmetic sequence 3, 7, 11, 15, …, can be expressed as f (x) = 4x + 3. 8.2.1.5 Understand that a geometric sequence is a non-linear function that can be expressed in the form f (x) = ab x, where x = 0, 1, 2, 3,…. For example: The geometric sequence 6, 12, 24, 48, … , can be expressed in the form f (x) = 6(2x). 8.2.2.1 Represent linear functions with tables, verbal descriptions, symbols, equations and graphs; translate from one representation to another. 8.2.2.2 Identify graphical properties of linear functions including slopes and intercepts. Know that the slope equals the rate of change, and that the y-intercept is zero when the function represents a proportional relationship. 8.2.2.4 Represent arithmetic sequences using equations, tables, graphs and verbal descriptions, and use them to solve problems. For example: If a girl starts with $100 in savings and adds $10 at the end of each month, she will have 100 + 10x dollars after x months. 8.2.2.5 Represent geometric sequences using equations, tables, graphs and verbal descriptions, and use them to solve problems. For example: If a girl invests $100 at 10% annual interest, she will have 100(1.1)x
dollars after x years. 9.2.1.1 Understand the definition of a function. Use functional notation and evaluate a function at a given point in its domain. For example: If f(x)= 1 /x2-3, find f (-4).

An Alignment of The Minnesota Academic Standards for Mathematics 2007 to Connected Mathematics Project 3, ©2014, Grade 8 – Algebra 1
226
Connected Mathematics Project 3 Grade 8 – Algebra 1
Minnesota Academic Standards in Mathematics
(Continued) 4.3 Painted Cubes, Looking at Several Functions
9.2.1.4 Obtain information and draw conclusions from graphs of functions and other relations. For example: If a graph shows the relationship between the elapsed flight time of a golf ball at a given moment and its height at that same moment, identify the time interval during which the ball is at least 100 feet above the ground. 9.2.1.8 Make qualitative statements about the rate of change of a function, based on its graph or table of values. For example: The function f (x) = 3x increases for all x, but it increases faster when x > 2 than it does when x < 2. 9.2.2.1 Represent and solve problems in various contexts using linear and quadratic functions. For example: Write a function that represents the area of a rectangular garden that can be surrounded with 32 feet of fencing, and use the function to determine the possible dimensions of such a garden if the area must be at least 50 square feet. 9.2.2.2 Represent and solve problems in various contexts using exponential functions, such as investment growth, depreciation and population growth. 9.2.2.3 Sketch graphs of linear, quadratic and exponential functions, and translate between graphs, tables and symbolic representations. Know how to use graphing technology to graph these functions. 9.2.2.4 Express the terms in a geometric sequence recursively and by giving an explicit (closed form) formula, and express the partial sums of a geometric series recursively. For example: A closed form formula for the terms tn in the geometric sequence 3, 6, 12, 24, ... is tn = 3(2)n-1, where n = 1, 2, 3, ... , and this sequence can be expressed recursively by writing t1 = 3 and tn = 2tn-1, for n ≥ 2. Another example: The partial sums sn of the series 3 + 6 + 12 + 24 + ... can be expressed recursively by writing s1 = 3 and sn = 3 + 2sn-1, for n ≥ 2.
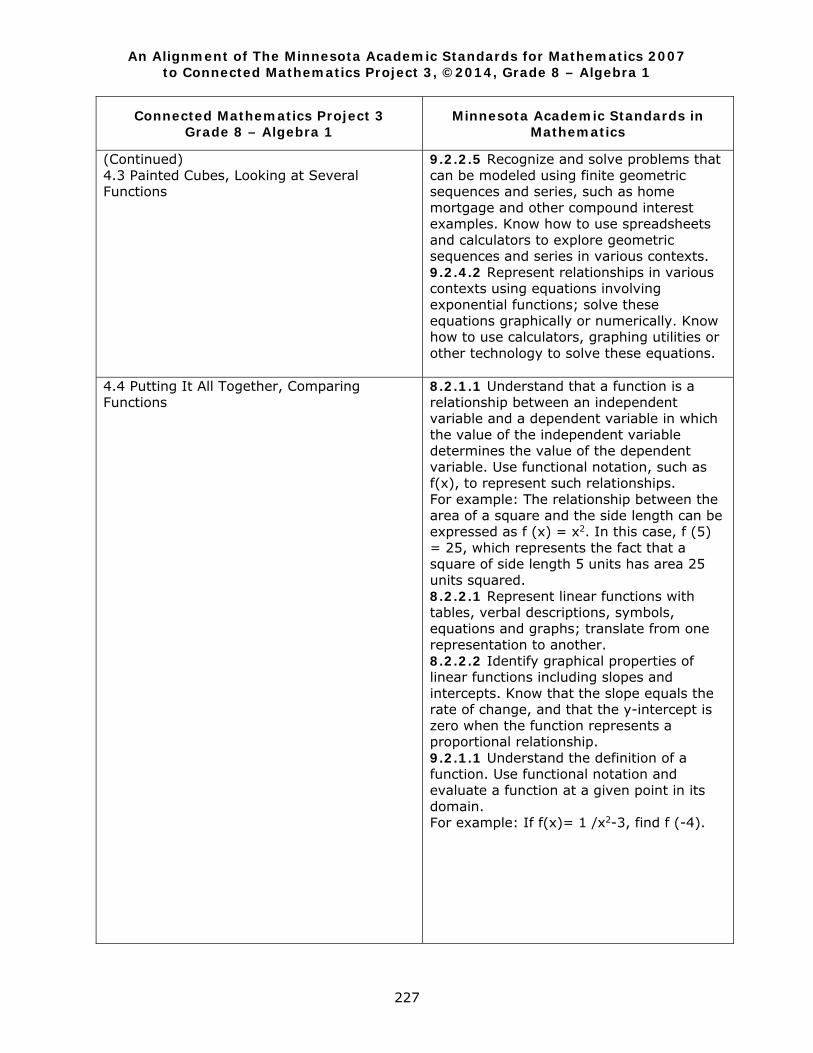
An Alignment of The Minnesota Academic Standards for Mathematics 2007 to Connected Mathematics Project 3, ©2014, Grade 8 – Algebra 1
227
Connected Mathematics Project 3 Grade 8 – Algebra 1
Minnesota Academic Standards in Mathematics
(Continued) 4.3 Painted Cubes, Looking at Several Functions
9.2.2.5 Recognize and solve problems that can be modeled using finite geometric sequences and series, such as home mortgage and other compound interest examples. Know how to use spreadsheets and calculators to explore geometric sequences and series in various contexts. 9.2.4.2 Represent relationships in various contexts using equations involving exponential functions; solve these equations graphically or numerically. Know how to use calculators, graphing utilities or other technology to solve these equations.
4.4 Putting It All Together, Comparing Functions
8.2.1.1 Understand that a function is a relationship between an independent variable and a dependent variable in which the value of the independent variable determines the value of the dependent variable. Use functional notation, such as f(x), to represent such relationships. For example: The relationship between the area of a square and the side length can be expressed as f (x) = x2. In this case, f (5) = 25, which represents the fact that a square of side length 5 units has area 25 units squared. 8.2.2.1 Represent linear functions with tables, verbal descriptions, symbols, equations and graphs; translate from one representation to another. 8.2.2.2 Identify graphical properties of linear functions including slopes and intercepts. Know that the slope equals the rate of change, and that the y-intercept is zero when the function represents a proportional relationship. 9.2.1.1 Understand the definition of a function. Use functional notation and evaluate a function at a given point in its domain. For example: If f(x)= 1 /x2-3, find f (-4).
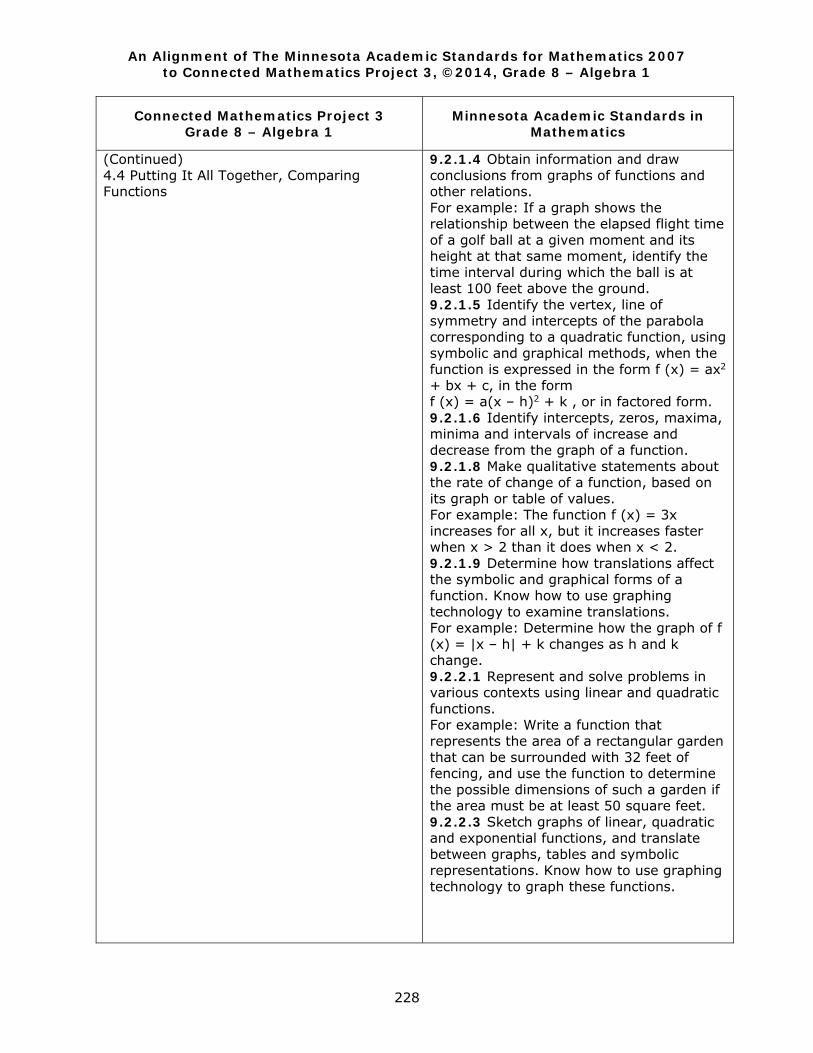
An Alignment of The Minnesota Academic Standards for Mathematics 2007 to Connected Mathematics Project 3, ©2014, Grade 8 – Algebra 1
228
Connected Mathematics Project 3 Grade 8 – Algebra 1
Minnesota Academic Standards in Mathematics
(Continued) 4.4 Putting It All Together, Comparing Functions
9.2.1.4 Obtain information and draw conclusions from graphs of functions and other relations. For example: If a graph shows the relationship between the elapsed flight time of a golf ball at a given moment and its height at that same moment, identify the time interval during which the ball is at least 100 feet above the ground. 9.2.1.5 Identify the vertex, line of symmetry and intercepts of the parabola corresponding to a quadratic function, using symbolic and graphical methods, when the function is expressed in the form f (x) = ax2 + bx + c, in the form f (x) = a(x – h)2 + k , or in factored form. 9.2.1.6 Identify intercepts, zeros, maxima, minima and intervals of increase and decrease from the graph of a function. 9.2.1.8 Make qualitative statements about the rate of change of a function, based on its graph or table of values. For example: The function f (x) = 3x increases for all x, but it increases faster when x > 2 than it does when x < 2. 9.2.1.9 Determine how translations affect the symbolic and graphical forms of a function. Know how to use graphing technology to examine translations. For example: Determine how the graph of f (x) = |x – h| + k changes as h and k change. 9.2.2.1 Represent and solve problems in various contexts using linear and quadratic functions. For example: Write a function that represents the area of a rectangular garden that can be surrounded with 32 feet of fencing, and use the function to determine the possible dimensions of such a garden if the area must be at least 50 square feet. 9.2.2.3 Sketch graphs of linear, quadratic and exponential functions, and translate between graphs, tables and symbolic representations. Know how to use graphing technology to graph these functions.
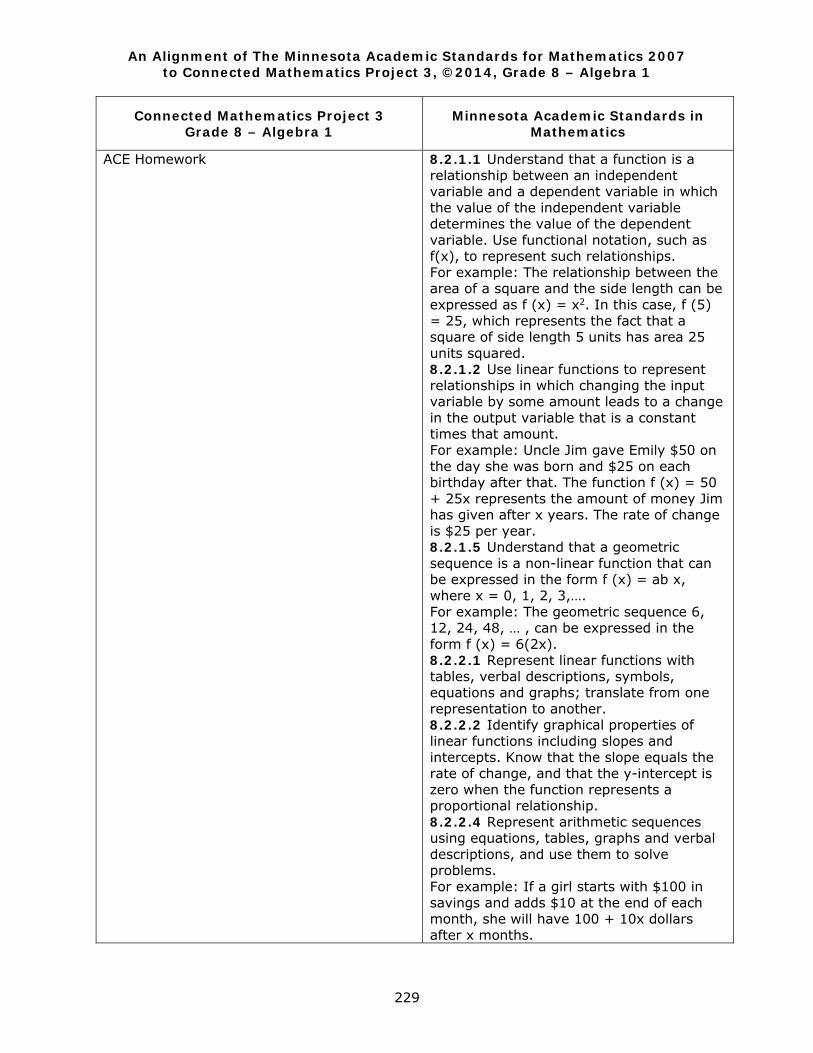
An Alignment of The Minnesota Academic Standards for Mathematics 2007 to Connected Mathematics Project 3, ©2014, Grade 8 – Algebra 1
229
Connected Mathematics Project 3 Grade 8 – Algebra 1
Minnesota Academic Standards in Mathematics
ACE Homework
8.2.1.1 Understand that a function is a relationship between an independent variable and a dependent variable in which the value of the independent variable determines the value of the dependent variable. Use functional notation, such as f(x), to represent such relationships. For example: The relationship between the area of a square and the side length can be expressed as f (x) = x2. In this case, f (5) = 25, which represents the fact that a square of side length 5 units has area 25 units squared. 8.2.1.2 Use linear functions to represent relationships in which changing the input variable by some amount leads to a change in the output variable that is a constant times that amount. For example: Uncle Jim gave Emily $50 on the day she was born and $25 on each birthday after that. The function f (x) = 50 + 25x represents the amount of money Jim has given after x years. The rate of change is $25 per year. 8.2.1.5 Understand that a geometric sequence is a non-linear function that can be expressed in the form f (x) = ab x, where x = 0, 1, 2, 3,…. For example: The geometric sequence 6, 12, 24, 48, … , can be expressed in the form f (x) = 6(2x). 8.2.2.1 Represent linear functions with tables, verbal descriptions, symbols, equations and graphs; translate from one representation to another. 8.2.2.2 Identify graphical properties of linear functions including slopes and intercepts. Know that the slope equals the rate of change, and that the y-intercept is zero when the function represents a proportional relationship. 8.2.2.4 Represent arithmetic sequences using equations, tables, graphs and verbal descriptions, and use them to solve problems. For example: If a girl starts with $100 in savings and adds $10 at the end of each month, she will have 100 + 10x dollars after x months.
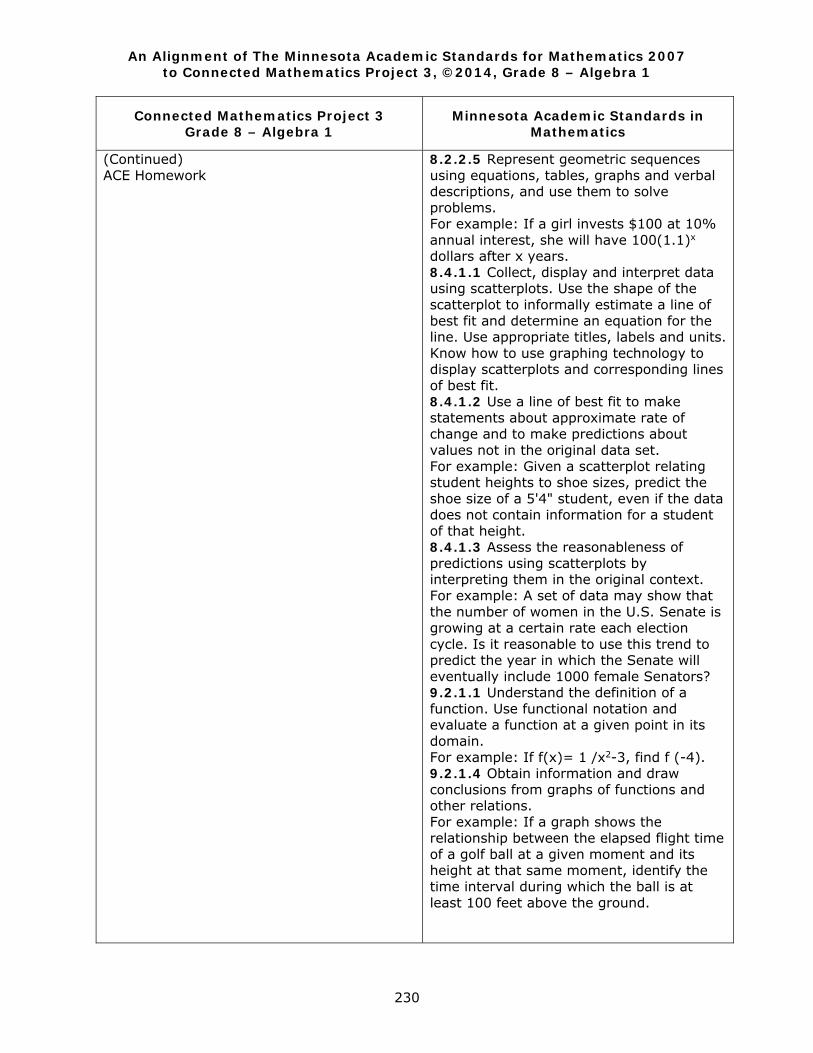
An Alignment of The Minnesota Academic Standards for Mathematics 2007 to Connected Mathematics Project 3, ©2014, Grade 8 – Algebra 1
230
Connected Mathematics Project 3 Grade 8 – Algebra 1
Minnesota Academic Standards in Mathematics
(Continued) ACE Homework
8.2.2.5 Represent geometric sequences using equations, tables, graphs and verbal descriptions, and use them to solve problems. For example: If a girl invests $100 at 10% annual interest, she will have 100(1.1)x
dollars after x years. 8.4.1.1 Collect, display and interpret data using scatterplots. Use the shape of the scatterplot to informally estimate a line of best fit and determine an equation for the line. Use appropriate titles, labels and units. Know how to use graphing technology to display scatterplots and corresponding lines of best fit. 8.4.1.2 Use a line of best fit to make statements about approximate rate of change and to make predictions about values not in the original data set. For example: Given a scatterplot relating student heights to shoe sizes, predict the shoe size of a 5'4" student, even if the data does not contain information for a student of that height. 8.4.1.3 Assess the reasonableness of predictions using scatterplots by interpreting them in the original context. For example: A set of data may show that the number of women in the U.S. Senate is growing at a certain rate each election cycle. Is it reasonable to use this trend to predict the year in which the Senate will eventually include 1000 female Senators? 9.2.1.1 Understand the definition of a function. Use functional notation and evaluate a function at a given point in its domain. For example: If f(x)= 1 /x2-3, find f (-4). 9.2.1.4 Obtain information and draw conclusions from graphs of functions and other relations. For example: If a graph shows the relationship between the elapsed flight time of a golf ball at a given moment and its height at that same moment, identify the time interval during which the ball is at least 100 feet above the ground.
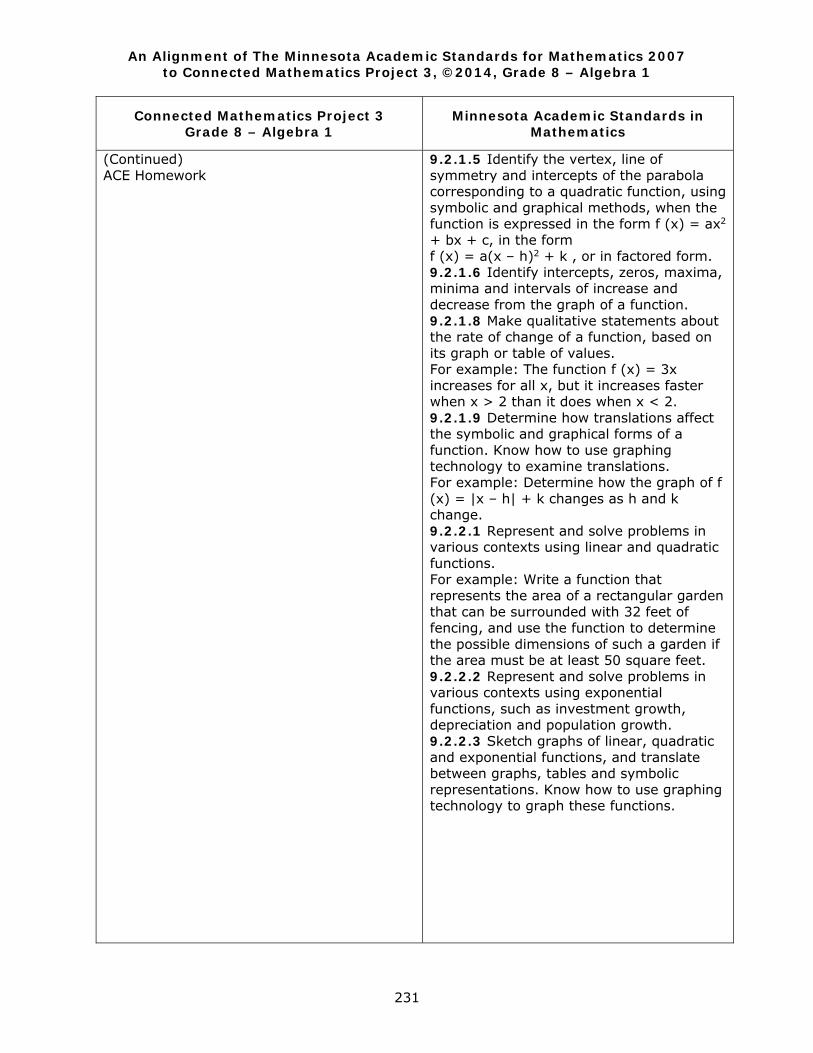
An Alignment of The Minnesota Academic Standards for Mathematics 2007 to Connected Mathematics Project 3, ©2014, Grade 8 – Algebra 1
231
Connected Mathematics Project 3 Grade 8 – Algebra 1
Minnesota Academic Standards in Mathematics
(Continued) ACE Homework
9.2.1.5 Identify the vertex, line of symmetry and intercepts of the parabola corresponding to a quadratic function, using symbolic and graphical methods, when the function is expressed in the form f (x) = ax2 + bx + c, in the form f (x) = a(x – h)2 + k , or in factored form. 9.2.1.6 Identify intercepts, zeros, maxima, minima and intervals of increase and decrease from the graph of a function. 9.2.1.8 Make qualitative statements about the rate of change of a function, based on its graph or table of values. For example: The function f (x) = 3x increases for all x, but it increases faster when x > 2 than it does when x < 2. 9.2.1.9 Determine how translations affect the symbolic and graphical forms of a function. Know how to use graphing technology to examine translations. For example: Determine how the graph of f (x) = |x – h| + k changes as h and k change. 9.2.2.1 Represent and solve problems in various contexts using linear and quadratic functions. For example: Write a function that represents the area of a rectangular garden that can be surrounded with 32 feet of fencing, and use the function to determine the possible dimensions of such a garden if the area must be at least 50 square feet. 9.2.2.2 Represent and solve problems in various contexts using exponential functions, such as investment growth, depreciation and population growth. 9.2.2.3 Sketch graphs of linear, quadratic and exponential functions, and translate between graphs, tables and symbolic representations. Know how to use graphing technology to graph these functions.
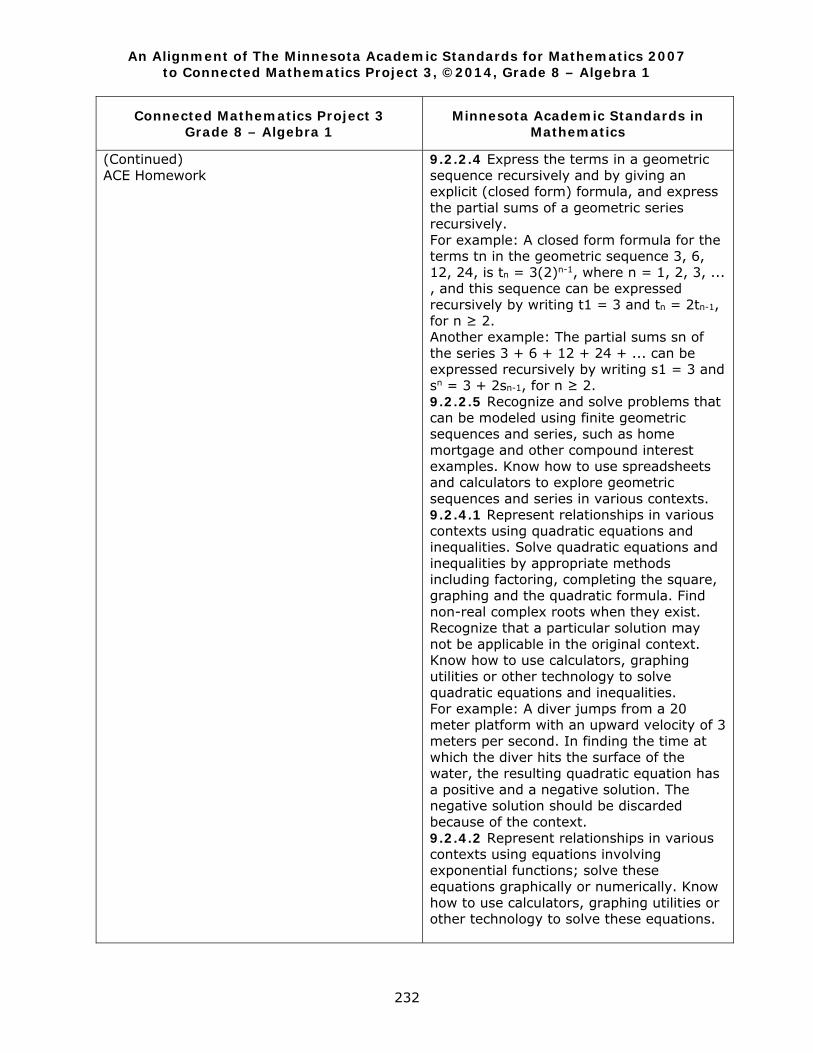
An Alignment of The Minnesota Academic Standards for Mathematics 2007 to Connected Mathematics Project 3, ©2014, Grade 8 – Algebra 1
232
Connected Mathematics Project 3 Grade 8 – Algebra 1
Minnesota Academic Standards in Mathematics
(Continued) ACE Homework
9.2.2.4 Express the terms in a geometric sequence recursively and by giving an explicit (closed form) formula, and express the partial sums of a geometric series recursively. For example: A closed form formula for the terms tn in the geometric sequence 3, 6, 12, 24, is tn = 3(2)n-1, where n = 1, 2, 3, ... , and this sequence can be expressed recursively by writing t1 = 3 and tn = 2tn-1, for n ≥ 2. Another example: The partial sums sn of the series 3 + 6 + 12 + 24 + ... can be expressed recursively by writing s1 = 3 and sn = 3 + 2sn-1, for n ≥ 2. 9.2.2.5 Recognize and solve problems that can be modeled using finite geometric sequences and series, such as home mortgage and other compound interest examples. Know how to use spreadsheets and calculators to explore geometric sequences and series in various contexts. 9.2.4.1 Represent relationships in various contexts using quadratic equations and inequalities. Solve quadratic equations and inequalities by appropriate methods including factoring, completing the square, graphing and the quadratic formula. Find non-real complex roots when they exist. Recognize that a particular solution may not be applicable in the original context. Know how to use calculators, graphing utilities or other technology to solve quadratic equations and inequalities. For example: A diver jumps from a 20 meter platform with an upward velocity of 3 meters per second. In finding the time at which the diver hits the surface of the water, the resulting quadratic equation has a positive and a negative solution. The negative solution should be discarded because of the context. 9.2.4.2 Represent relationships in various contexts using equations involving exponential functions; solve these equations graphically or numerically. Know how to use calculators, graphing utilities or other technology to solve these equations.
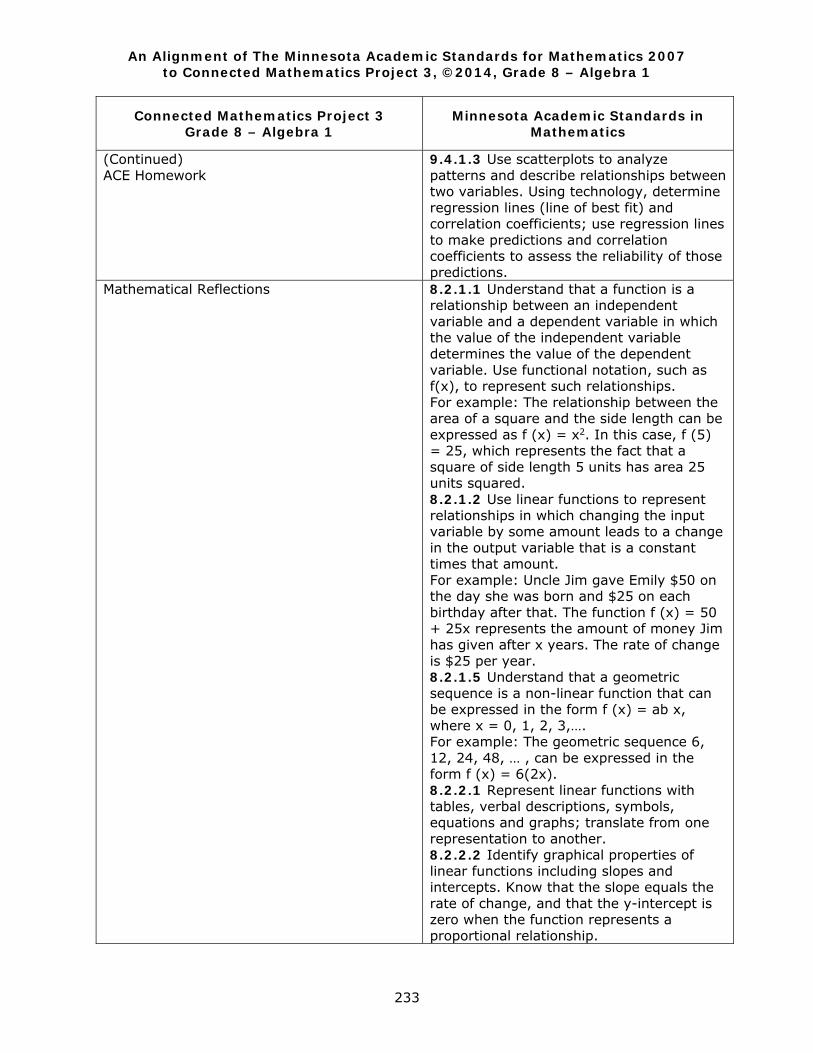
An Alignment of The Minnesota Academic Standards for Mathematics 2007 to Connected Mathematics Project 3, ©2014, Grade 8 – Algebra 1
233
Connected Mathematics Project 3 Grade 8 – Algebra 1
Minnesota Academic Standards in Mathematics
(Continued) ACE Homework
9.4.1.3 Use scatterplots to analyze patterns and describe relationships between two variables. Using technology, determine regression lines (line of best fit) and correlation coefficients; use regression lines to make predictions and correlation coefficients to assess the reliability of those predictions.
Mathematical Reflections
8.2.1.1 Understand that a function is a relationship between an independent variable and a dependent variable in which the value of the independent variable determines the value of the dependent variable. Use functional notation, such as f(x), to represent such relationships. For example: The relationship between the area of a square and the side length can be expressed as f (x) = x2. In this case, f (5) = 25, which represents the fact that a square of side length 5 units has area 25 units squared. 8.2.1.2 Use linear functions to represent relationships in which changing the input variable by some amount leads to a change in the output variable that is a constant times that amount. For example: Uncle Jim gave Emily $50 on the day she was born and $25 on each birthday after that. The function f (x) = 50 + 25x represents the amount of money Jim has given after x years. The rate of change is $25 per year. 8.2.1.5 Understand that a geometric sequence is a non-linear function that can be expressed in the form f (x) = ab x, where x = 0, 1, 2, 3,…. For example: The geometric sequence 6, 12, 24, 48, … , can be expressed in the form f (x) = 6(2x). 8.2.2.1 Represent linear functions with tables, verbal descriptions, symbols, equations and graphs; translate from one representation to another. 8.2.2.2 Identify graphical properties of linear functions including slopes and intercepts. Know that the slope equals the rate of change, and that the y-intercept is zero when the function represents a proportional relationship.
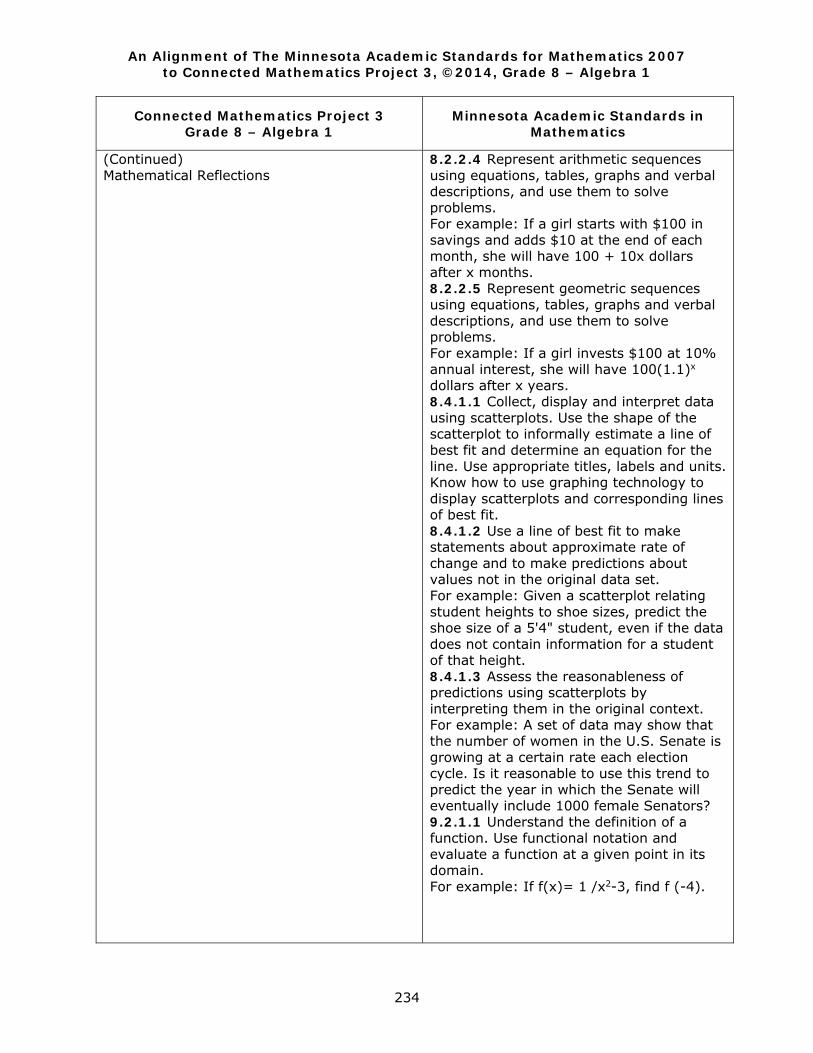
An Alignment of The Minnesota Academic Standards for Mathematics 2007 to Connected Mathematics Project 3, ©2014, Grade 8 – Algebra 1
234
Connected Mathematics Project 3 Grade 8 – Algebra 1
Minnesota Academic Standards in Mathematics
(Continued) Mathematical Reflections
8.2.2.4 Represent arithmetic sequences using equations, tables, graphs and verbal descriptions, and use them to solve problems. For example: If a girl starts with $100 in savings and adds $10 at the end of each month, she will have 100 + 10x dollars after x months. 8.2.2.5 Represent geometric sequences using equations, tables, graphs and verbal descriptions, and use them to solve problems. For example: If a girl invests $100 at 10% annual interest, she will have 100(1.1)x
dollars after x years. 8.4.1.1 Collect, display and interpret data using scatterplots. Use the shape of the scatterplot to informally estimate a line of best fit and determine an equation for the line. Use appropriate titles, labels and units. Know how to use graphing technology to display scatterplots and corresponding lines of best fit. 8.4.1.2 Use a line of best fit to make statements about approximate rate of change and to make predictions about values not in the original data set. For example: Given a scatterplot relating student heights to shoe sizes, predict the shoe size of a 5'4" student, even if the data does not contain information for a student of that height. 8.4.1.3 Assess the reasonableness of predictions using scatterplots by interpreting them in the original context. For example: A set of data may show that the number of women in the U.S. Senate is growing at a certain rate each election cycle. Is it reasonable to use this trend to predict the year in which the Senate will eventually include 1000 female Senators? 9.2.1.1 Understand the definition of a function. Use functional notation and evaluate a function at a given point in its domain. For example: If f(x)= 1 /x2-3, find f (-4).
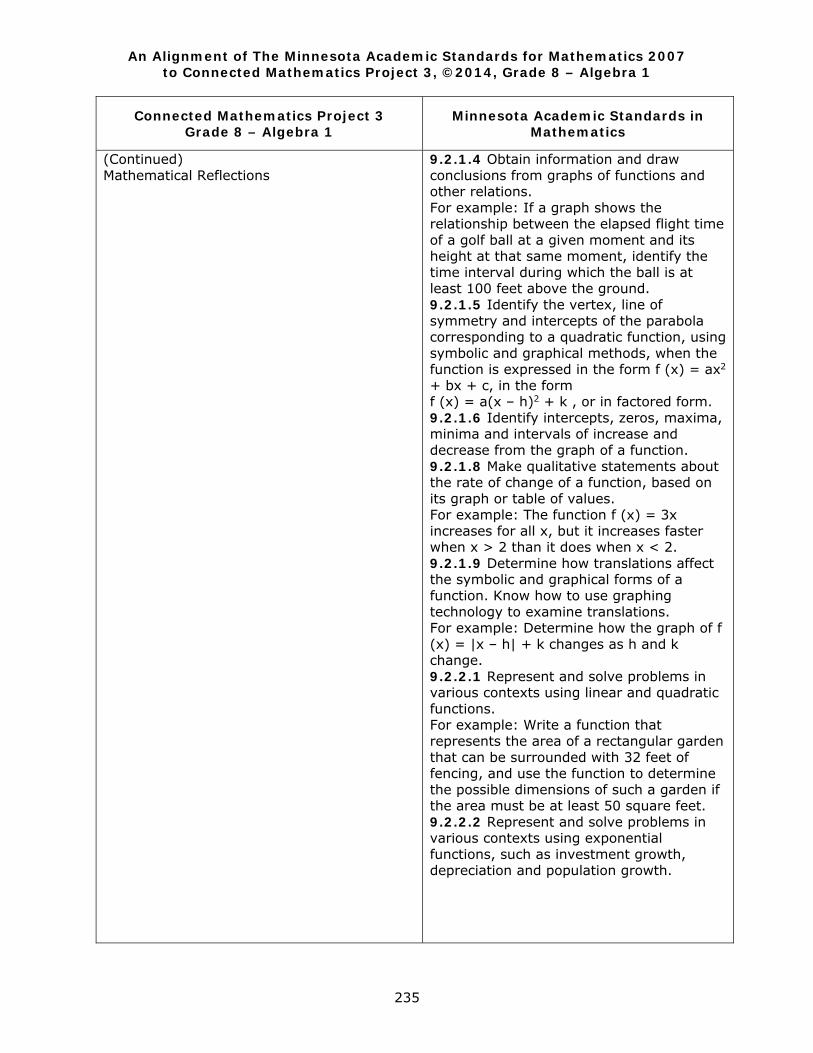
An Alignment of The Minnesota Academic Standards for Mathematics 2007 to Connected Mathematics Project 3, ©2014, Grade 8 – Algebra 1
235
Connected Mathematics Project 3 Grade 8 – Algebra 1
Minnesota Academic Standards in Mathematics
(Continued) Mathematical Reflections
9.2.1.4 Obtain information and draw conclusions from graphs of functions and other relations. For example: If a graph shows the relationship between the elapsed flight time of a golf ball at a given moment and its height at that same moment, identify the time interval during which the ball is at least 100 feet above the ground. 9.2.1.5 Identify the vertex, line of symmetry and intercepts of the parabola corresponding to a quadratic function, using symbolic and graphical methods, when the function is expressed in the form f (x) = ax2 + bx + c, in the form f (x) = a(x – h)2 + k , or in factored form. 9.2.1.6 Identify intercepts, zeros, maxima, minima and intervals of increase and decrease from the graph of a function. 9.2.1.8 Make qualitative statements about the rate of change of a function, based on its graph or table of values. For example: The function f (x) = 3x increases for all x, but it increases faster when x > 2 than it does when x < 2. 9.2.1.9 Determine how translations affect the symbolic and graphical forms of a function. Know how to use graphing technology to examine translations. For example: Determine how the graph of f (x) = |x – h| + k changes as h and k change. 9.2.2.1 Represent and solve problems in various contexts using linear and quadratic functions. For example: Write a function that represents the area of a rectangular garden that can be surrounded with 32 feet of fencing, and use the function to determine the possible dimensions of such a garden if the area must be at least 50 square feet. 9.2.2.2 Represent and solve problems in various contexts using exponential functions, such as investment growth, depreciation and population growth.
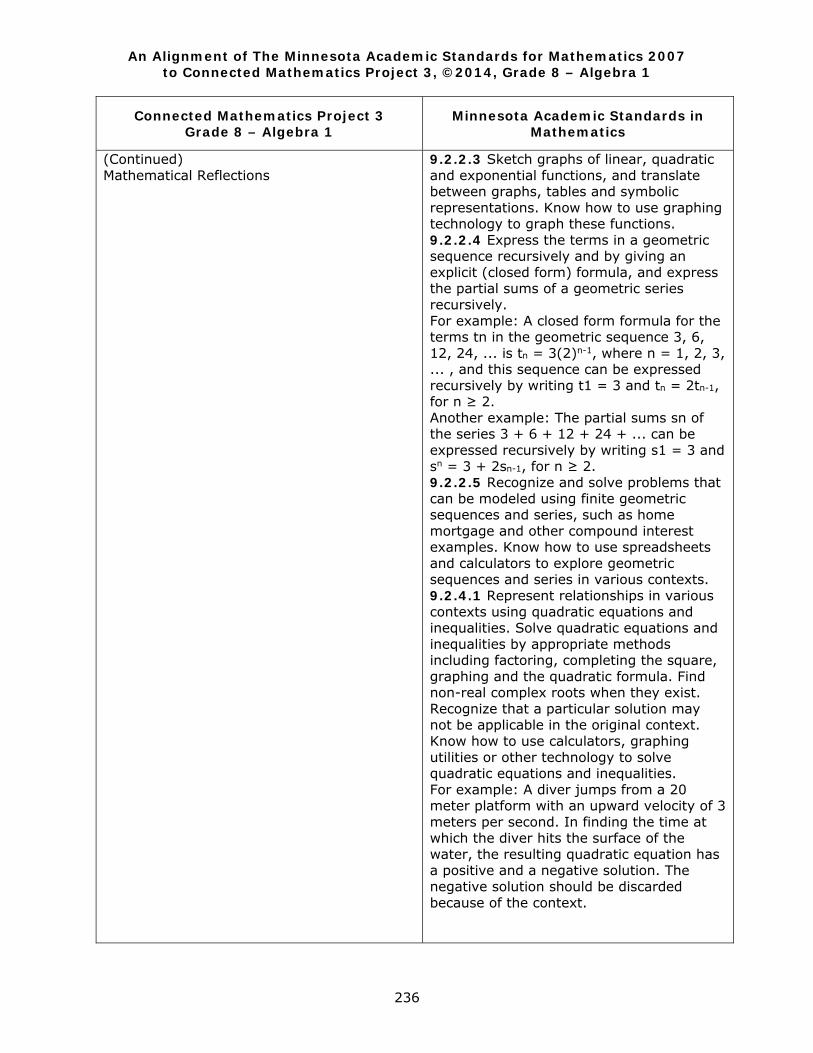
An Alignment of The Minnesota Academic Standards for Mathematics 2007 to Connected Mathematics Project 3, ©2014, Grade 8 – Algebra 1
236
Connected Mathematics Project 3 Grade 8 – Algebra 1
Minnesota Academic Standards in Mathematics
(Continued) Mathematical Reflections
9.2.2.3 Sketch graphs of linear, quadratic and exponential functions, and translate between graphs, tables and symbolic representations. Know how to use graphing technology to graph these functions. 9.2.2.4 Express the terms in a geometric sequence recursively and by giving an explicit (closed form) formula, and express the partial sums of a geometric series recursively. For example: A closed form formula for the terms tn in the geometric sequence 3, 6, 12, 24, ... is tn = 3(2)n-1, where n = 1, 2, 3, ... , and this sequence can be expressed recursively by writing t1 = 3 and tn = 2tn-1, for n ≥ 2. Another example: The partial sums sn of the series 3 + 6 + 12 + 24 + ... can be expressed recursively by writing s1 = 3 and sn = 3 + 2sn-1, for n ≥ 2. 9.2.2.5 Recognize and solve problems that can be modeled using finite geometric sequences and series, such as home mortgage and other compound interest examples. Know how to use spreadsheets and calculators to explore geometric sequences and series in various contexts. 9.2.4.1 Represent relationships in various contexts using quadratic equations and inequalities. Solve quadratic equations and inequalities by appropriate methods including factoring, completing the square, graphing and the quadratic formula. Find non-real complex roots when they exist. Recognize that a particular solution may not be applicable in the original context. Know how to use calculators, graphing utilities or other technology to solve quadratic equations and inequalities. For example: A diver jumps from a 20 meter platform with an upward velocity of 3 meters per second. In finding the time at which the diver hits the surface of the water, the resulting quadratic equation has a positive and a negative solution. The negative solution should be discarded because of the context.
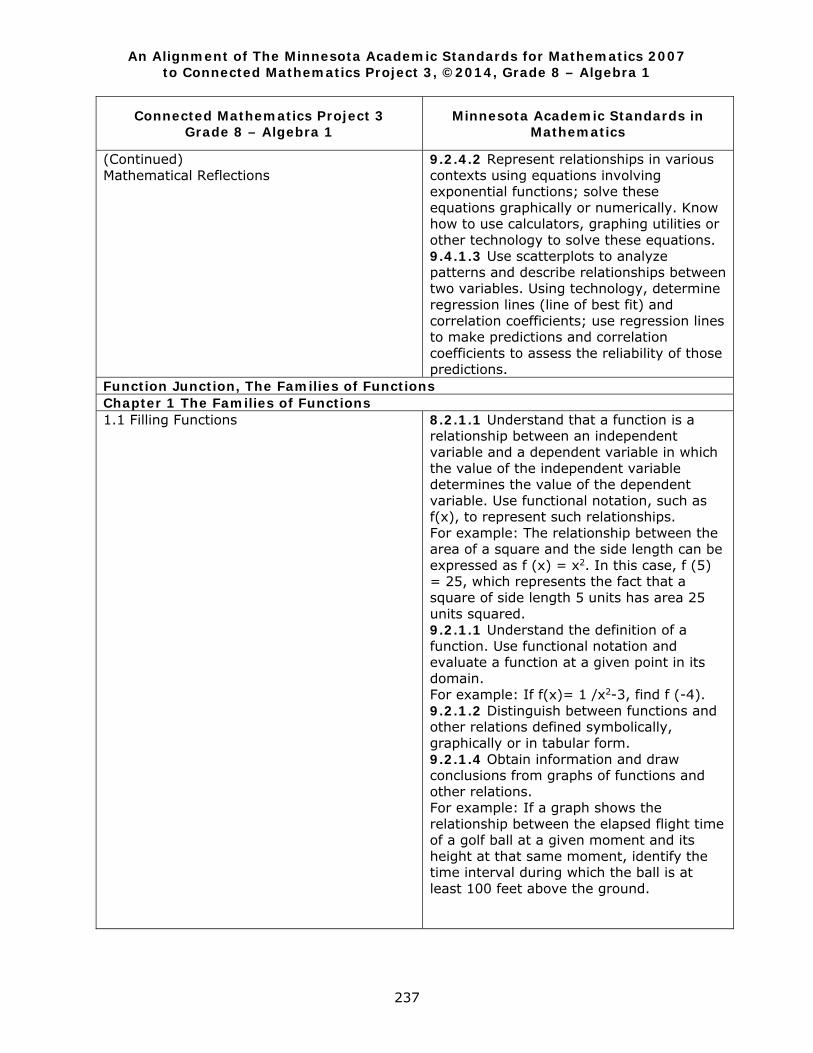
An Alignment of The Minnesota Academic Standards for Mathematics 2007 to Connected Mathematics Project 3, ©2014, Grade 8 – Algebra 1
237
Connected Mathematics Project 3 Grade 8 – Algebra 1
Minnesota Academic Standards in Mathematics
(Continued) Mathematical Reflections
9.2.4.2 Represent relationships in various contexts using equations involving exponential functions; solve these equations graphically or numerically. Know how to use calculators, graphing utilities or other technology to solve these equations. 9.4.1.3 Use scatterplots to analyze patterns and describe relationships between two variables. Using technology, determine regression lines (line of best fit) and correlation coefficients; use regression lines to make predictions and correlation coefficients to assess the reliability of those predictions.
Function Junction, The Families of Functions Chapter 1 The Families of Functions 1.1 Filling Functions 8.2.1.1 Understand that a function is a
relationship between an independent variable and a dependent variable in which the value of the independent variable determines the value of the dependent variable. Use functional notation, such as f(x), to represent such relationships. For example: The relationship between the area of a square and the side length can be expressed as f (x) = x2. In this case, f (5) = 25, which represents the fact that a square of side length 5 units has area 25 units squared. 9.2.1.1 Understand the definition of a function. Use functional notation and evaluate a function at a given point in its domain. For example: If f(x)= 1 /x2-3, find f (-4). 9.2.1.2 Distinguish between functions and other relations defined symbolically, graphically or in tabular form. 9.2.1.4 Obtain information and draw conclusions from graphs of functions and other relations. For example: If a graph shows the relationship between the elapsed flight time of a golf ball at a given moment and its height at that same moment, identify the time interval during which the ball is at least 100 feet above the ground.
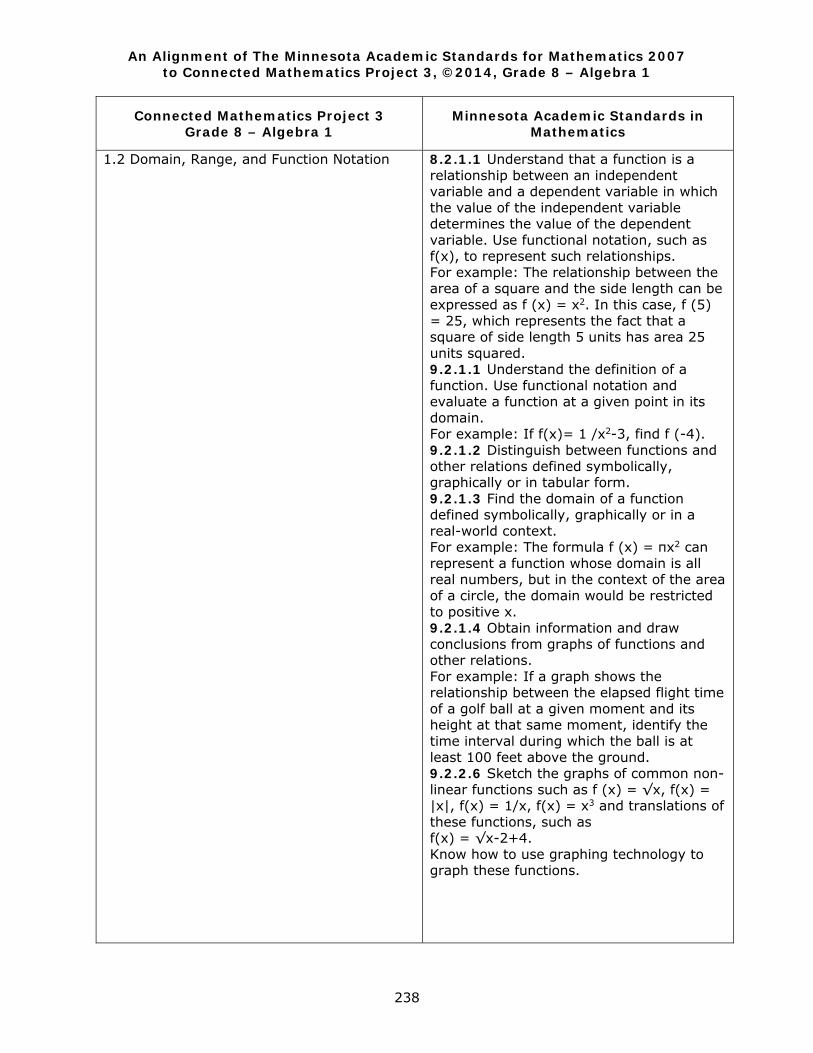
An Alignment of The Minnesota Academic Standards for Mathematics 2007 to Connected Mathematics Project 3, ©2014, Grade 8 – Algebra 1
238
Connected Mathematics Project 3 Grade 8 – Algebra 1
Minnesota Academic Standards in Mathematics
1.2 Domain, Range, and Function Notation 8.2.1.1 Understand that a function is a relationship between an independent variable and a dependent variable in which the value of the independent variable determines the value of the dependent variable. Use functional notation, such as f(x), to represent such relationships. For example: The relationship between the area of a square and the side length can be expressed as f (x) = x2. In this case, f (5) = 25, which represents the fact that a square of side length 5 units has area 25 units squared. 9.2.1.1 Understand the definition of a function. Use functional notation and evaluate a function at a given point in its domain. For example: If f(x)= 1 /x2-3, find f (-4). 9.2.1.2 Distinguish between functions and other relations defined symbolically, graphically or in tabular form. 9.2.1.3 Find the domain of a function defined symbolically, graphically or in a real-world context. For example: The formula f (x) = πx2 can represent a function whose domain is all real numbers, but in the context of the area of a circle, the domain would be restricted to positive x. 9.2.1.4 Obtain information and draw conclusions from graphs of functions and other relations. For example: If a graph shows the relationship between the elapsed flight time of a golf ball at a given moment and its height at that same moment, identify the time interval during which the ball is at least 100 feet above the ground. 9.2.2.6 Sketch the graphs of common non-linear functions such as f (x) = √x, f(x) = |x|, f(x) = 1/x, f(x) = x3 and translations of these functions, such as f(x) = √x-2+4. Know how to use graphing technology to graph these functions.
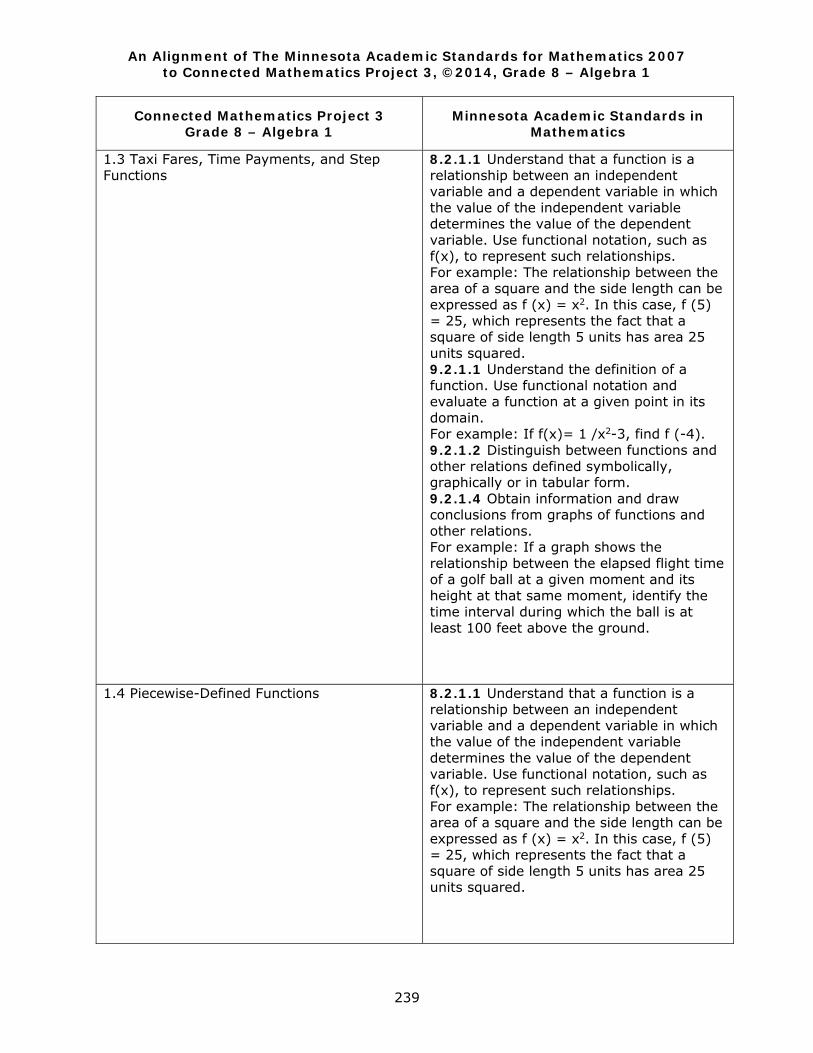
An Alignment of The Minnesota Academic Standards for Mathematics 2007 to Connected Mathematics Project 3, ©2014, Grade 8 – Algebra 1
239
Connected Mathematics Project 3 Grade 8 – Algebra 1
Minnesota Academic Standards in Mathematics
1.3 Taxi Fares, Time Payments, and Step Functions
8.2.1.1 Understand that a function is a relationship between an independent variable and a dependent variable in which the value of the independent variable determines the value of the dependent variable. Use functional notation, such as f(x), to represent such relationships. For example: The relationship between the area of a square and the side length can be expressed as f (x) = x2. In this case, f (5) = 25, which represents the fact that a square of side length 5 units has area 25 units squared. 9.2.1.1 Understand the definition of a function. Use functional notation and evaluate a function at a given point in its domain. For example: If f(x)= 1 /x2-3, find f (-4). 9.2.1.2 Distinguish between functions and other relations defined symbolically, graphically or in tabular form. 9.2.1.4 Obtain information and draw conclusions from graphs of functions and other relations. For example: If a graph shows the relationship between the elapsed flight time of a golf ball at a given moment and its height at that same moment, identify the time interval during which the ball is at least 100 feet above the ground.
1.4 Piecewise-Defined Functions
8.2.1.1 Understand that a function is a relationship between an independent variable and a dependent variable in which the value of the independent variable determines the value of the dependent variable. Use functional notation, such as f(x), to represent such relationships. For example: The relationship between the area of a square and the side length can be expressed as f (x) = x2. In this case, f (5) = 25, which represents the fact that a square of side length 5 units has area 25 units squared.
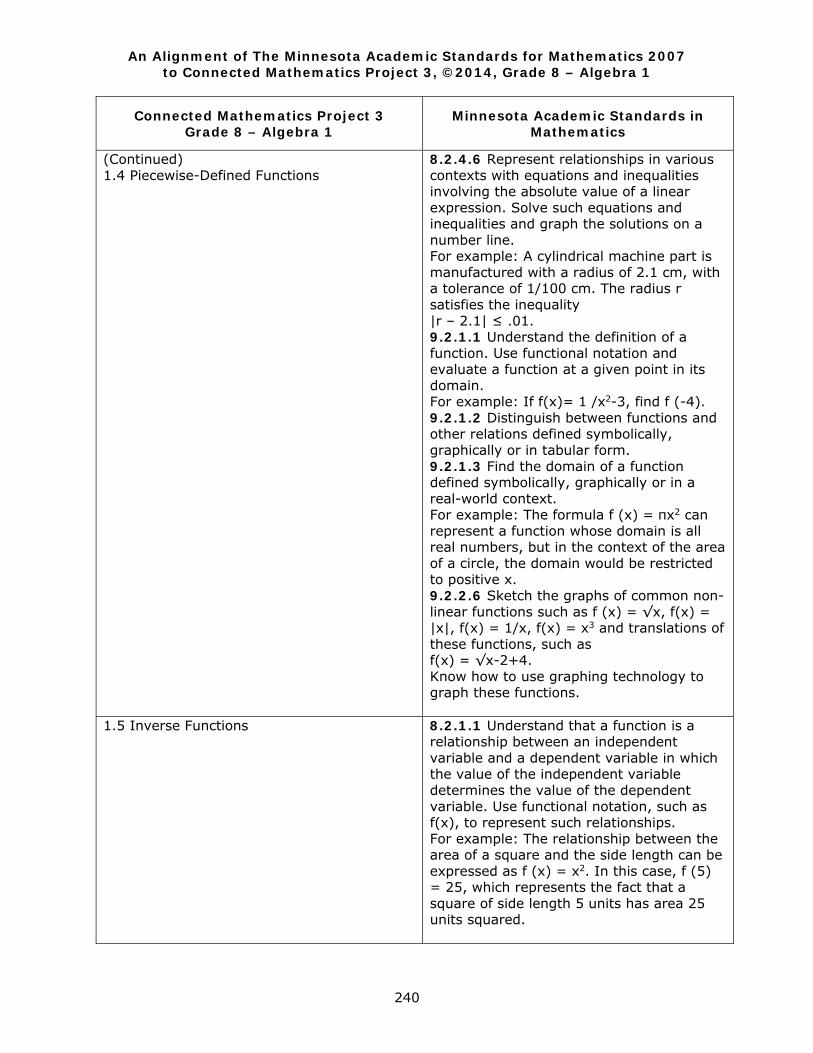
An Alignment of The Minnesota Academic Standards for Mathematics 2007 to Connected Mathematics Project 3, ©2014, Grade 8 – Algebra 1
240
Connected Mathematics Project 3 Grade 8 – Algebra 1
Minnesota Academic Standards in Mathematics
(Continued) 1.4 Piecewise-Defined Functions
8.2.4.6 Represent relationships in various contexts with equations and inequalities involving the absolute value of a linear expression. Solve such equations and inequalities and graph the solutions on a number line. For example: A cylindrical machine part is manufactured with a radius of 2.1 cm, with a tolerance of 1/100 cm. The radius r satisfies the inequality |r – 2.1| ≤ .01. 9.2.1.1 Understand the definition of a function. Use functional notation and evaluate a function at a given point in its domain. For example: If f(x)= 1 /x2-3, find f (-4). 9.2.1.2 Distinguish between functions and other relations defined symbolically, graphically or in tabular form. 9.2.1.3 Find the domain of a function defined symbolically, graphically or in a real-world context. For example: The formula f (x) = πx2 can represent a function whose domain is all real numbers, but in the context of the area of a circle, the domain would be restricted to positive x. 9.2.2.6 Sketch the graphs of common non-linear functions such as f (x) = √x, f(x) = |x|, f(x) = 1/x, f(x) = x3 and translations of these functions, such as f(x) = √x-2+4. Know how to use graphing technology to graph these functions.
1.5 Inverse Functions
8.2.1.1 Understand that a function is a relationship between an independent variable and a dependent variable in which the value of the independent variable determines the value of the dependent variable. Use functional notation, such as f(x), to represent such relationships. For example: The relationship between the area of a square and the side length can be expressed as f (x) = x2. In this case, f (5) = 25, which represents the fact that a square of side length 5 units has area 25 units squared.
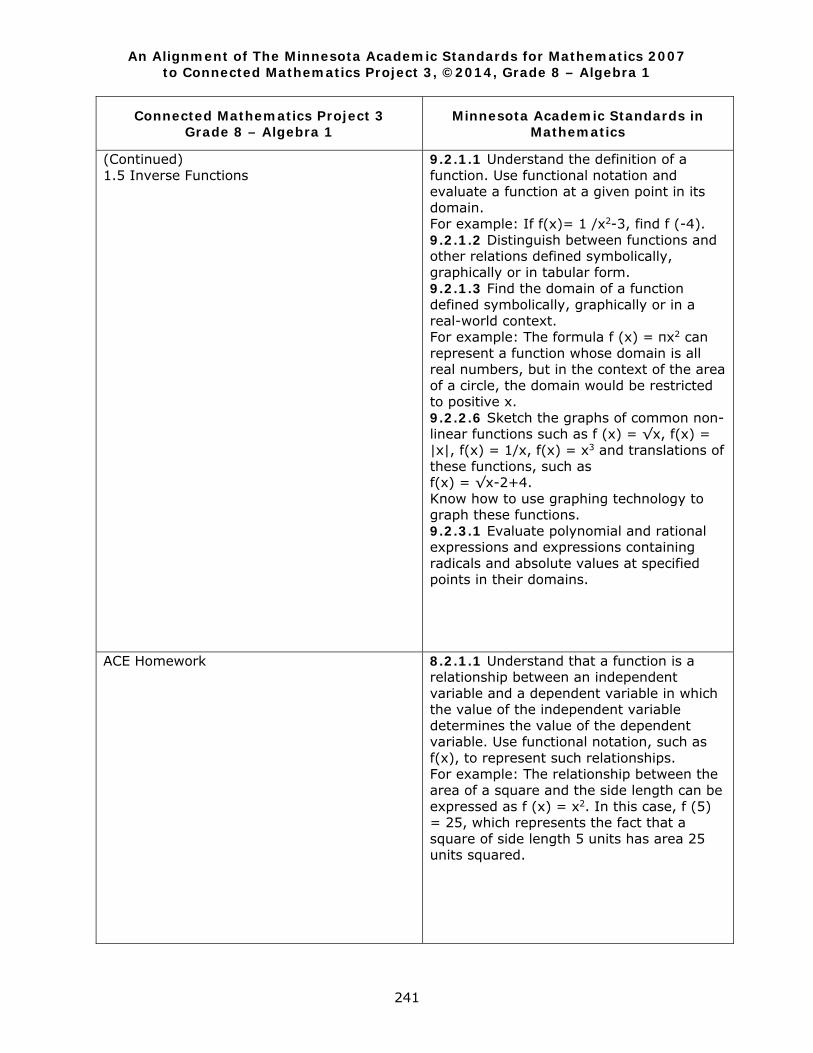
An Alignment of The Minnesota Academic Standards for Mathematics 2007 to Connected Mathematics Project 3, ©2014, Grade 8 – Algebra 1
241
Connected Mathematics Project 3 Grade 8 – Algebra 1
Minnesota Academic Standards in Mathematics
(Continued) 1.5 Inverse Functions
9.2.1.1 Understand the definition of a function. Use functional notation and evaluate a function at a given point in its domain. For example: If f(x)= 1 /x2-3, find f (-4). 9.2.1.2 Distinguish between functions and other relations defined symbolically, graphically or in tabular form. 9.2.1.3 Find the domain of a function defined symbolically, graphically or in a real-world context. For example: The formula f (x) = πx2 can represent a function whose domain is all real numbers, but in the context of the area of a circle, the domain would be restricted to positive x. 9.2.2.6 Sketch the graphs of common non-linear functions such as f (x) = √x, f(x) = |x|, f(x) = 1/x, f(x) = x3 and translations of these functions, such as f(x) = √x-2+4. Know how to use graphing technology to graph these functions. 9.2.3.1 Evaluate polynomial and rational expressions and expressions containing radicals and absolute values at specified points in their domains.
ACE Homework
8.2.1.1 Understand that a function is a relationship between an independent variable and a dependent variable in which the value of the independent variable determines the value of the dependent variable. Use functional notation, such as f(x), to represent such relationships. For example: The relationship between the area of a square and the side length can be expressed as f (x) = x2. In this case, f (5) = 25, which represents the fact that a square of side length 5 units has area 25 units squared.
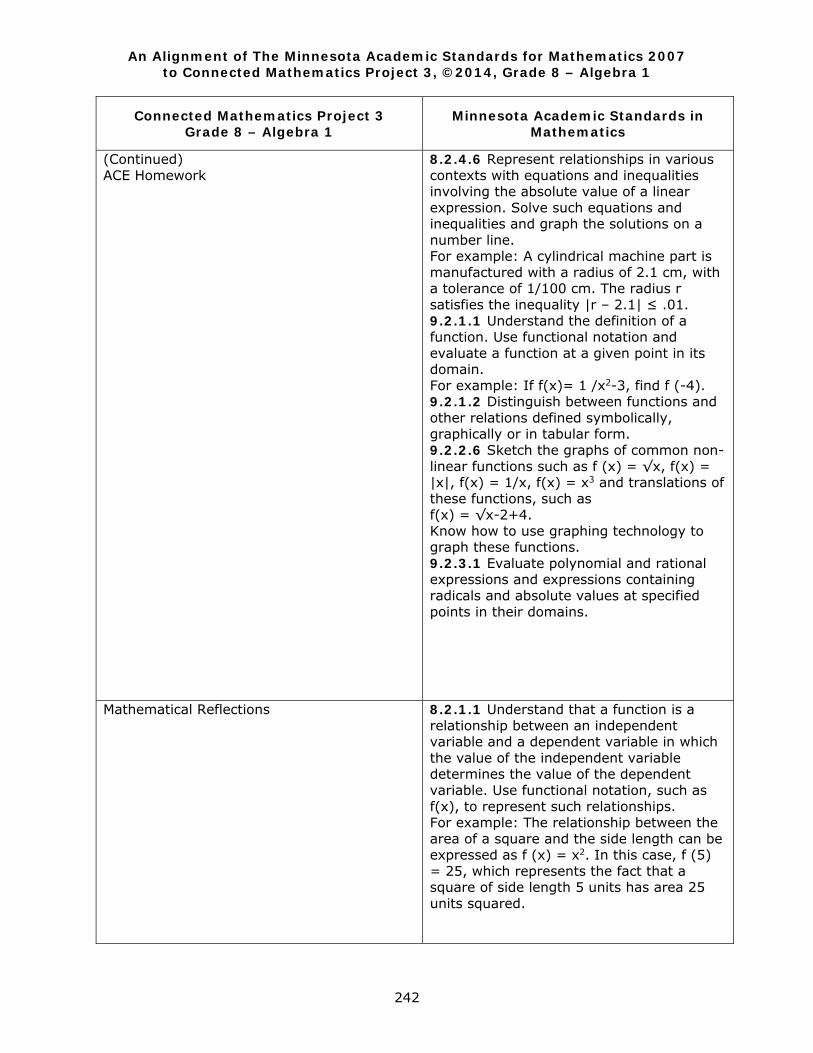
An Alignment of The Minnesota Academic Standards for Mathematics 2007 to Connected Mathematics Project 3, ©2014, Grade 8 – Algebra 1
242
Connected Mathematics Project 3 Grade 8 – Algebra 1
Minnesota Academic Standards in Mathematics
(Continued) ACE Homework
8.2.4.6 Represent relationships in various contexts with equations and inequalities involving the absolute value of a linear expression. Solve such equations and inequalities and graph the solutions on a number line. For example: A cylindrical machine part is manufactured with a radius of 2.1 cm, with a tolerance of 1/100 cm. The radius r satisfies the inequality |r – 2.1| ≤ .01. 9.2.1.1 Understand the definition of a function. Use functional notation and evaluate a function at a given point in its domain. For example: If f(x)= 1 /x2-3, find f (-4). 9.2.1.2 Distinguish between functions and other relations defined symbolically, graphically or in tabular form. 9.2.2.6 Sketch the graphs of common non-linear functions such as f (x) = √x, f(x) = |x|, f(x) = 1/x, f(x) = x3 and translations of these functions, such as f(x) = √x-2+4. Know how to use graphing technology to graph these functions. 9.2.3.1 Evaluate polynomial and rational expressions and expressions containing radicals and absolute values at specified points in their domains.
Mathematical Reflections
8.2.1.1 Understand that a function is a relationship between an independent variable and a dependent variable in which the value of the independent variable determines the value of the dependent variable. Use functional notation, such as f(x), to represent such relationships. For example: The relationship between the area of a square and the side length can be expressed as f (x) = x2. In this case, f (5) = 25, which represents the fact that a square of side length 5 units has area 25 units squared.
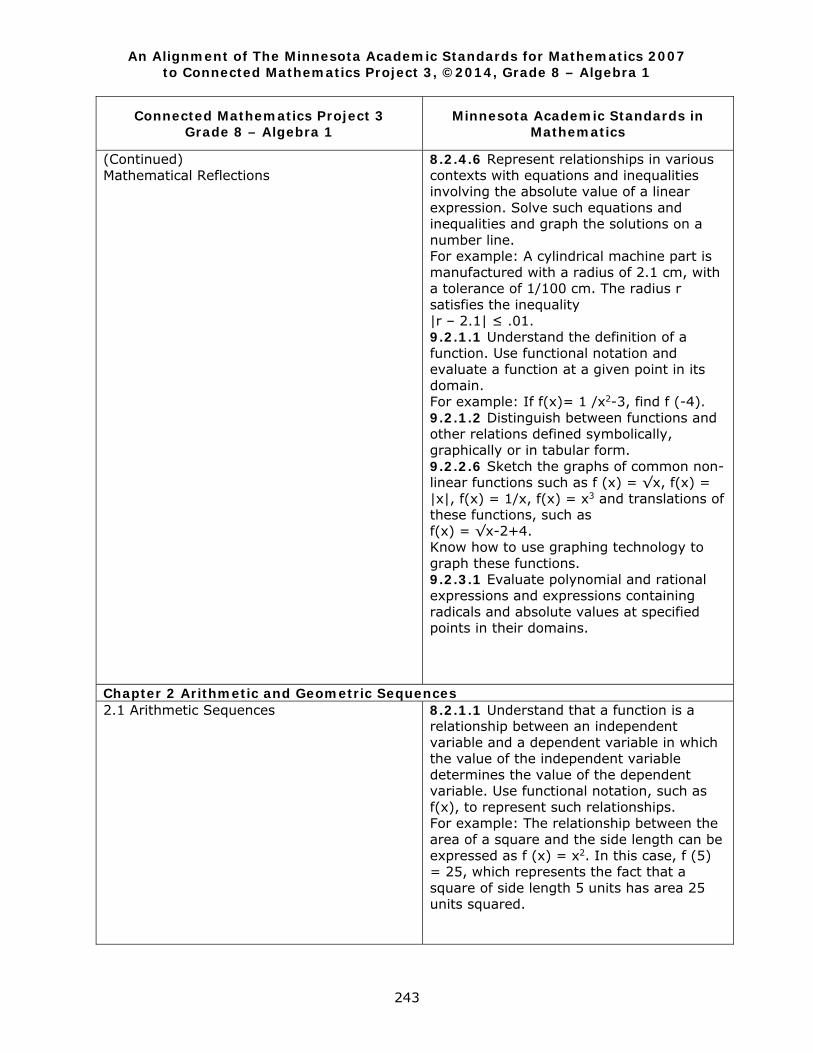
An Alignment of The Minnesota Academic Standards for Mathematics 2007 to Connected Mathematics Project 3, ©2014, Grade 8 – Algebra 1
243
Connected Mathematics Project 3 Grade 8 – Algebra 1
Minnesota Academic Standards in Mathematics
(Continued) Mathematical Reflections
8.2.4.6 Represent relationships in various contexts with equations and inequalities involving the absolute value of a linear expression. Solve such equations and inequalities and graph the solutions on a number line. For example: A cylindrical machine part is manufactured with a radius of 2.1 cm, with a tolerance of 1/100 cm. The radius r satisfies the inequality |r – 2.1| ≤ .01. 9.2.1.1 Understand the definition of a function. Use functional notation and evaluate a function at a given point in its domain. For example: If f(x)= 1 /x2-3, find f (-4). 9.2.1.2 Distinguish between functions and other relations defined symbolically, graphically or in tabular form. 9.2.2.6 Sketch the graphs of common non-linear functions such as f (x) = √x, f(x) = |x|, f(x) = 1/x, f(x) = x3 and translations of these functions, such as f(x) = √x-2+4. Know how to use graphing technology to graph these functions. 9.2.3.1 Evaluate polynomial and rational expressions and expressions containing radicals and absolute values at specified points in their domains.
Chapter 2 Arithmetic and Geometric Sequences 2.1 Arithmetic Sequences
8.2.1.1 Understand that a function is a relationship between an independent variable and a dependent variable in which the value of the independent variable determines the value of the dependent variable. Use functional notation, such as f(x), to represent such relationships. For example: The relationship between the area of a square and the side length can be expressed as f (x) = x2. In this case, f (5) = 25, which represents the fact that a square of side length 5 units has area 25 units squared.
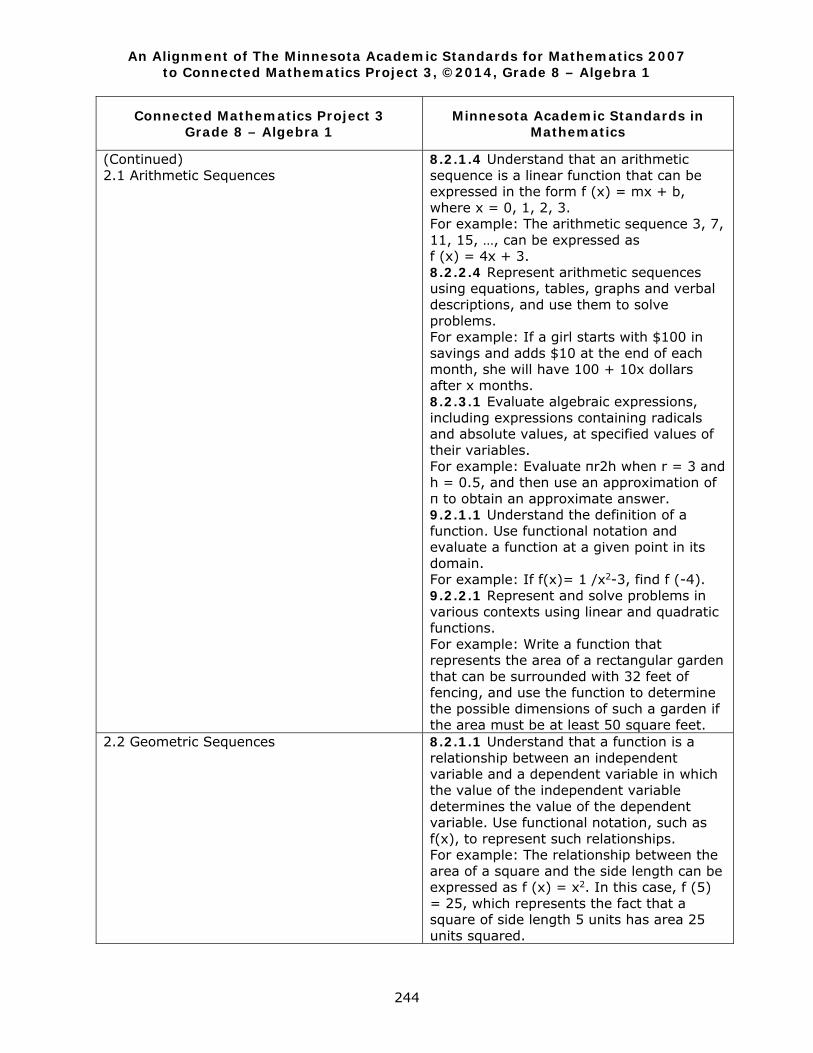
An Alignment of The Minnesota Academic Standards for Mathematics 2007 to Connected Mathematics Project 3, ©2014, Grade 8 – Algebra 1
244
Connected Mathematics Project 3 Grade 8 – Algebra 1
Minnesota Academic Standards in Mathematics
(Continued) 2.1 Arithmetic Sequences
8.2.1.4 Understand that an arithmetic sequence is a linear function that can be expressed in the form f (x) = mx + b, where x = 0, 1, 2, 3. For example: The arithmetic sequence 3, 7, 11, 15, …, can be expressed as f (x) = 4x + 3. 8.2.2.4 Represent arithmetic sequences using equations, tables, graphs and verbal descriptions, and use them to solve problems. For example: If a girl starts with $100 in savings and adds $10 at the end of each month, she will have 100 + 10x dollars after x months. 8.2.3.1 Evaluate algebraic expressions, including expressions containing radicals and absolute values, at specified values of their variables. For example: Evaluate πr2h when r = 3 and h = 0.5, and then use an approximation of π to obtain an approximate answer. 9.2.1.1 Understand the definition of a function. Use functional notation and evaluate a function at a given point in its domain. For example: If f(x)= 1 /x2-3, find f (-4). 9.2.2.1 Represent and solve problems in various contexts using linear and quadratic functions. For example: Write a function that represents the area of a rectangular garden that can be surrounded with 32 feet of fencing, and use the function to determine the possible dimensions of such a garden if the area must be at least 50 square feet.
2.2 Geometric Sequences
8.2.1.1 Understand that a function is a relationship between an independent variable and a dependent variable in which the value of the independent variable determines the value of the dependent variable. Use functional notation, such as f(x), to represent such relationships. For example: The relationship between the area of a square and the side length can be expressed as f (x) = x2. In this case, f (5) = 25, which represents the fact that a square of side length 5 units has area 25 units squared.
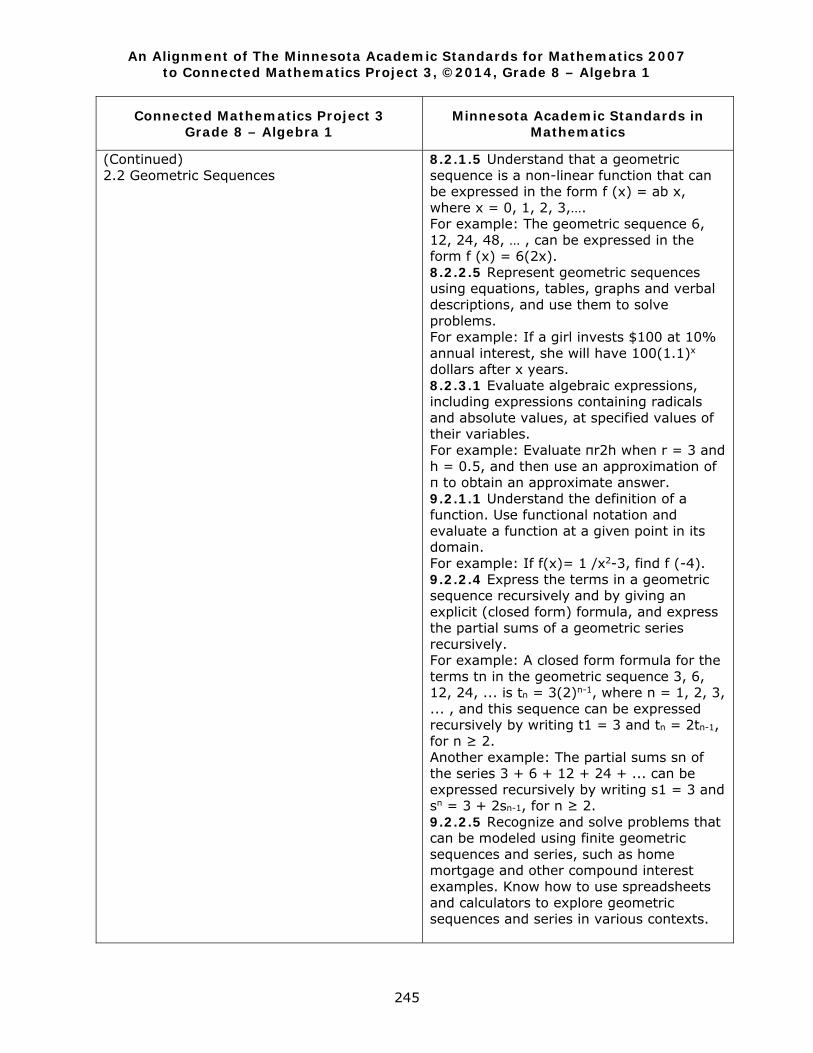
An Alignment of The Minnesota Academic Standards for Mathematics 2007 to Connected Mathematics Project 3, ©2014, Grade 8 – Algebra 1
245
Connected Mathematics Project 3 Grade 8 – Algebra 1
Minnesota Academic Standards in Mathematics
(Continued) 2.2 Geometric Sequences
8.2.1.5 Understand that a geometric sequence is a non-linear function that can be expressed in the form f (x) = ab x, where x = 0, 1, 2, 3,…. For example: The geometric sequence 6, 12, 24, 48, … , can be expressed in the form f (x) = 6(2x). 8.2.2.5 Represent geometric sequences using equations, tables, graphs and verbal descriptions, and use them to solve problems. For example: If a girl invests $100 at 10% annual interest, she will have 100(1.1)x
dollars after x years. 8.2.3.1 Evaluate algebraic expressions, including expressions containing radicals and absolute values, at specified values of their variables. For example: Evaluate πr2h when r = 3 and h = 0.5, and then use an approximation of π to obtain an approximate answer. 9.2.1.1 Understand the definition of a function. Use functional notation and evaluate a function at a given point in its domain. For example: If f(x)= 1 /x2-3, find f (-4). 9.2.2.4 Express the terms in a geometric sequence recursively and by giving an explicit (closed form) formula, and express the partial sums of a geometric series recursively. For example: A closed form formula for the terms tn in the geometric sequence 3, 6, 12, 24, ... is tn = 3(2)n-1, where n = 1, 2, 3, ... , and this sequence can be expressed recursively by writing t1 = 3 and tn = 2tn-1, for n ≥ 2. Another example: The partial sums sn of the series 3 + 6 + 12 + 24 + ... can be expressed recursively by writing s1 = 3 and sn = 3 + 2sn-1, for n ≥ 2. 9.2.2.5 Recognize and solve problems that can be modeled using finite geometric sequences and series, such as home mortgage and other compound interest examples. Know how to use spreadsheets and calculators to explore geometric sequences and series in various contexts.
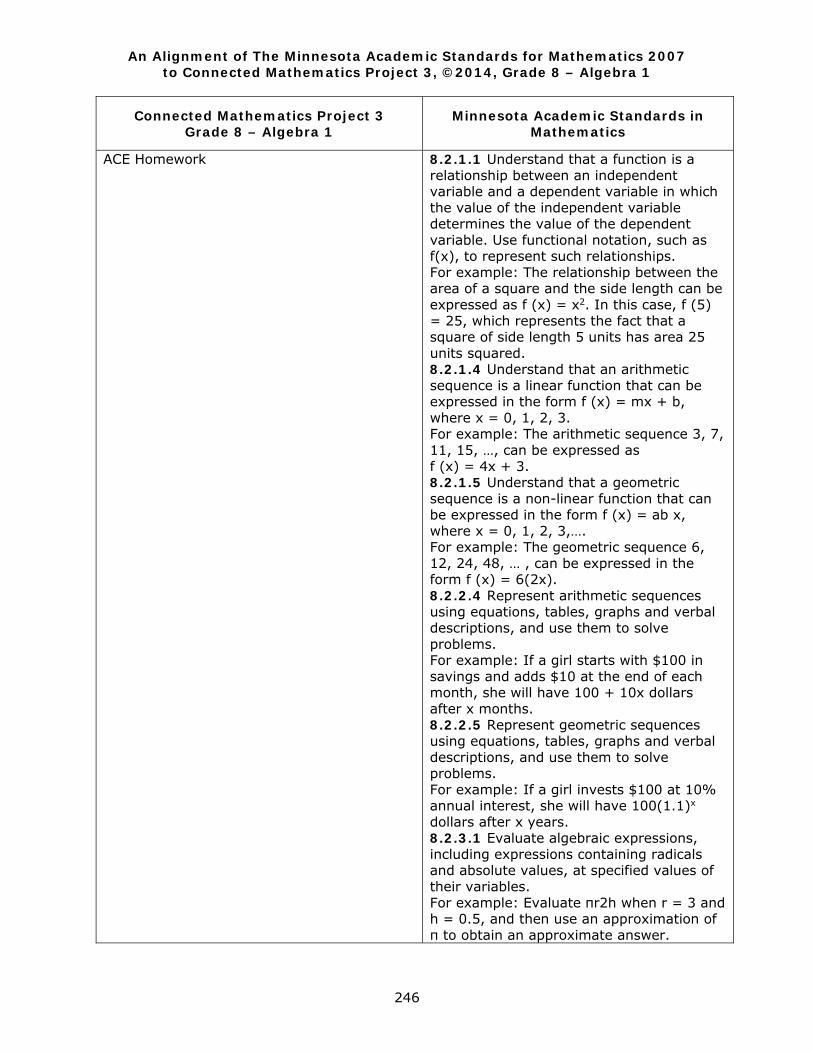
An Alignment of The Minnesota Academic Standards for Mathematics 2007 to Connected Mathematics Project 3, ©2014, Grade 8 – Algebra 1
246
Connected Mathematics Project 3 Grade 8 – Algebra 1
Minnesota Academic Standards in Mathematics
ACE Homework
8.2.1.1 Understand that a function is a relationship between an independent variable and a dependent variable in which the value of the independent variable determines the value of the dependent variable. Use functional notation, such as f(x), to represent such relationships. For example: The relationship between the area of a square and the side length can be expressed as f (x) = x2. In this case, f (5) = 25, which represents the fact that a square of side length 5 units has area 25 units squared. 8.2.1.4 Understand that an arithmetic sequence is a linear function that can be expressed in the form f (x) = mx + b, where x = 0, 1, 2, 3. For example: The arithmetic sequence 3, 7, 11, 15, …, can be expressed as f (x) = 4x + 3. 8.2.1.5 Understand that a geometric sequence is a non-linear function that can be expressed in the form f (x) = ab x, where x = 0, 1, 2, 3,…. For example: The geometric sequence 6, 12, 24, 48, … , can be expressed in the form f (x) = 6(2x). 8.2.2.4 Represent arithmetic sequences using equations, tables, graphs and verbal descriptions, and use them to solve problems. For example: If a girl starts with $100 in savings and adds $10 at the end of each month, she will have 100 + 10x dollars after x months. 8.2.2.5 Represent geometric sequences using equations, tables, graphs and verbal descriptions, and use them to solve problems. For example: If a girl invests $100 at 10% annual interest, she will have 100(1.1)x
dollars after x years. 8.2.3.1 Evaluate algebraic expressions, including expressions containing radicals and absolute values, at specified values of their variables. For example: Evaluate πr2h when r = 3 and h = 0.5, and then use an approximation of π to obtain an approximate answer.
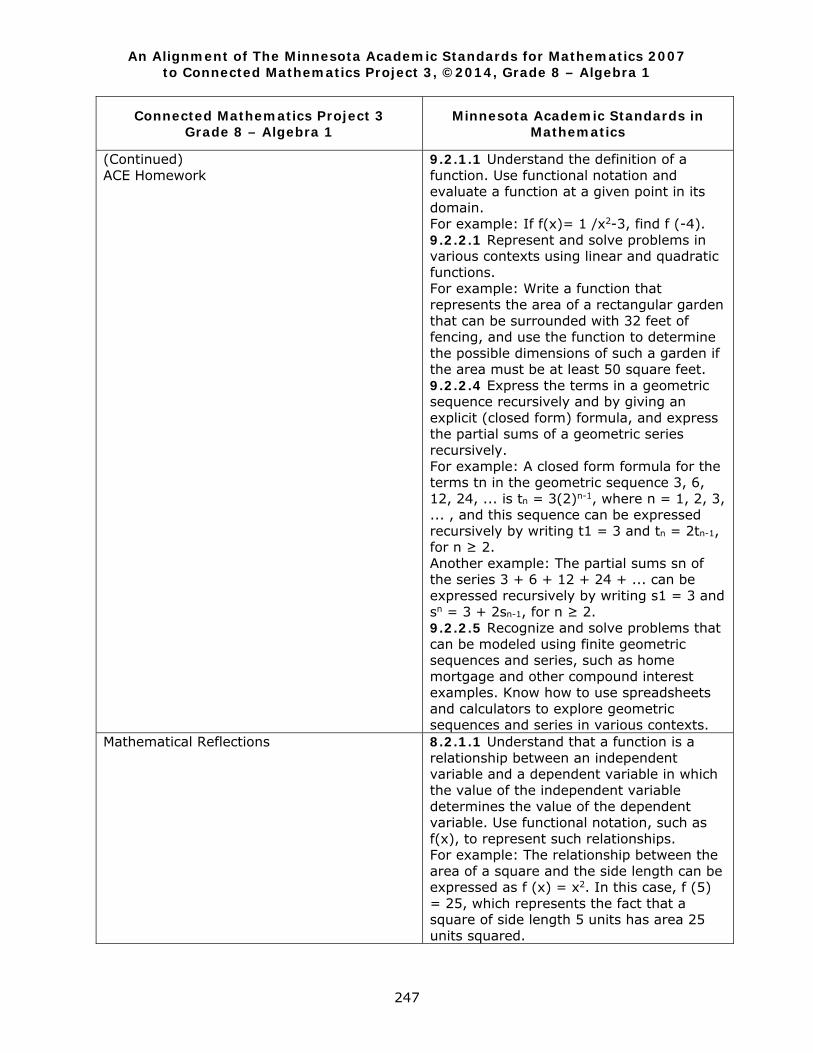
An Alignment of The Minnesota Academic Standards for Mathematics 2007 to Connected Mathematics Project 3, ©2014, Grade 8 – Algebra 1
247
Connected Mathematics Project 3 Grade 8 – Algebra 1
Minnesota Academic Standards in Mathematics
(Continued) ACE Homework
9.2.1.1 Understand the definition of a function. Use functional notation and evaluate a function at a given point in its domain. For example: If f(x)= 1 /x2-3, find f (-4). 9.2.2.1 Represent and solve problems in various contexts using linear and quadratic functions. For example: Write a function that represents the area of a rectangular garden that can be surrounded with 32 feet of fencing, and use the function to determine the possible dimensions of such a garden if the area must be at least 50 square feet. 9.2.2.4 Express the terms in a geometric sequence recursively and by giving an explicit (closed form) formula, and express the partial sums of a geometric series recursively. For example: A closed form formula for the terms tn in the geometric sequence 3, 6, 12, 24, ... is tn = 3(2)n-1, where n = 1, 2, 3, ... , and this sequence can be expressed recursively by writing t1 = 3 and tn = 2tn-1, for n ≥ 2. Another example: The partial sums sn of the series 3 + 6 + 12 + 24 + ... can be expressed recursively by writing s1 = 3 and sn = 3 + 2sn-1, for n ≥ 2. 9.2.2.5 Recognize and solve problems that can be modeled using finite geometric sequences and series, such as home mortgage and other compound interest examples. Know how to use spreadsheets and calculators to explore geometric sequences and series in various contexts.
Mathematical Reflections
8.2.1.1 Understand that a function is a relationship between an independent variable and a dependent variable in which the value of the independent variable determines the value of the dependent variable. Use functional notation, such as f(x), to represent such relationships. For example: The relationship between the area of a square and the side length can be expressed as f (x) = x2. In this case, f (5) = 25, which represents the fact that a square of side length 5 units has area 25 units squared.
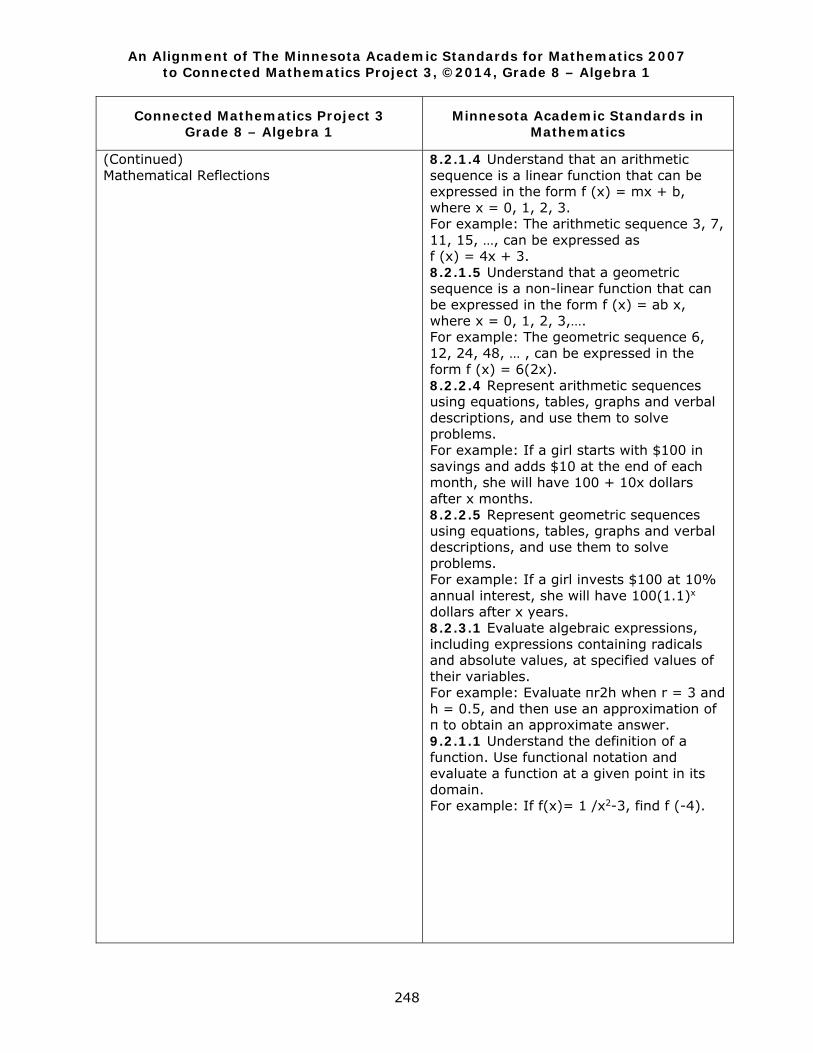
An Alignment of The Minnesota Academic Standards for Mathematics 2007 to Connected Mathematics Project 3, ©2014, Grade 8 – Algebra 1
248
Connected Mathematics Project 3 Grade 8 – Algebra 1
Minnesota Academic Standards in Mathematics
(Continued) Mathematical Reflections
8.2.1.4 Understand that an arithmetic sequence is a linear function that can be expressed in the form f (x) = mx + b, where x = 0, 1, 2, 3. For example: The arithmetic sequence 3, 7, 11, 15, …, can be expressed as f (x) = 4x + 3. 8.2.1.5 Understand that a geometric sequence is a non-linear function that can be expressed in the form f (x) = ab x, where x = 0, 1, 2, 3,…. For example: The geometric sequence 6, 12, 24, 48, … , can be expressed in the form f (x) = 6(2x). 8.2.2.4 Represent arithmetic sequences using equations, tables, graphs and verbal descriptions, and use them to solve problems. For example: If a girl starts with $100 in savings and adds $10 at the end of each month, she will have 100 + 10x dollars after x months. 8.2.2.5 Represent geometric sequences using equations, tables, graphs and verbal descriptions, and use them to solve problems. For example: If a girl invests $100 at 10% annual interest, she will have 100(1.1)x
dollars after x years. 8.2.3.1 Evaluate algebraic expressions, including expressions containing radicals and absolute values, at specified values of their variables. For example: Evaluate πr2h when r = 3 and h = 0.5, and then use an approximation of π to obtain an approximate answer. 9.2.1.1 Understand the definition of a function. Use functional notation and evaluate a function at a given point in its domain. For example: If f(x)= 1 /x2-3, find f (-4).
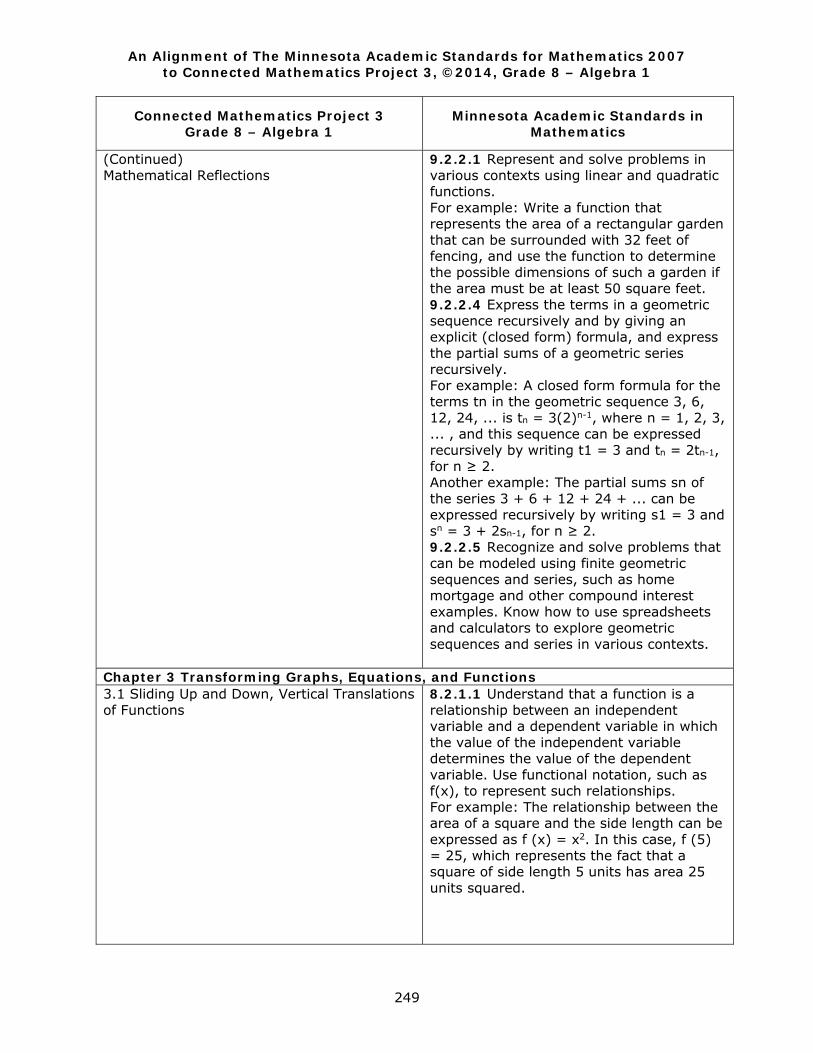
An Alignment of The Minnesota Academic Standards for Mathematics 2007 to Connected Mathematics Project 3, ©2014, Grade 8 – Algebra 1
249
Connected Mathematics Project 3 Grade 8 – Algebra 1
Minnesota Academic Standards in Mathematics
(Continued) Mathematical Reflections
9.2.2.1 Represent and solve problems in various contexts using linear and quadratic functions. For example: Write a function that represents the area of a rectangular garden that can be surrounded with 32 feet of fencing, and use the function to determine the possible dimensions of such a garden if the area must be at least 50 square feet. 9.2.2.4 Express the terms in a geometric sequence recursively and by giving an explicit (closed form) formula, and express the partial sums of a geometric series recursively. For example: A closed form formula for the terms tn in the geometric sequence 3, 6, 12, 24, ... is tn = 3(2)n-1, where n = 1, 2, 3, ... , and this sequence can be expressed recursively by writing t1 = 3 and tn = 2tn-1, for n ≥ 2. Another example: The partial sums sn of the series 3 + 6 + 12 + 24 + ... can be expressed recursively by writing s1 = 3 and sn = 3 + 2sn-1, for n ≥ 2. 9.2.2.5 Recognize and solve problems that can be modeled using finite geometric sequences and series, such as home mortgage and other compound interest examples. Know how to use spreadsheets and calculators to explore geometric sequences and series in various contexts.
Chapter 3 Transforming Graphs, Equations, and Functions 3.1 Sliding Up and Down, Vertical Translations of Functions
8.2.1.1 Understand that a function is a relationship between an independent variable and a dependent variable in which the value of the independent variable determines the value of the dependent variable. Use functional notation, such as f(x), to represent such relationships. For example: The relationship between the area of a square and the side length can be expressed as f (x) = x2. In this case, f (5) = 25, which represents the fact that a square of side length 5 units has area 25 units squared.
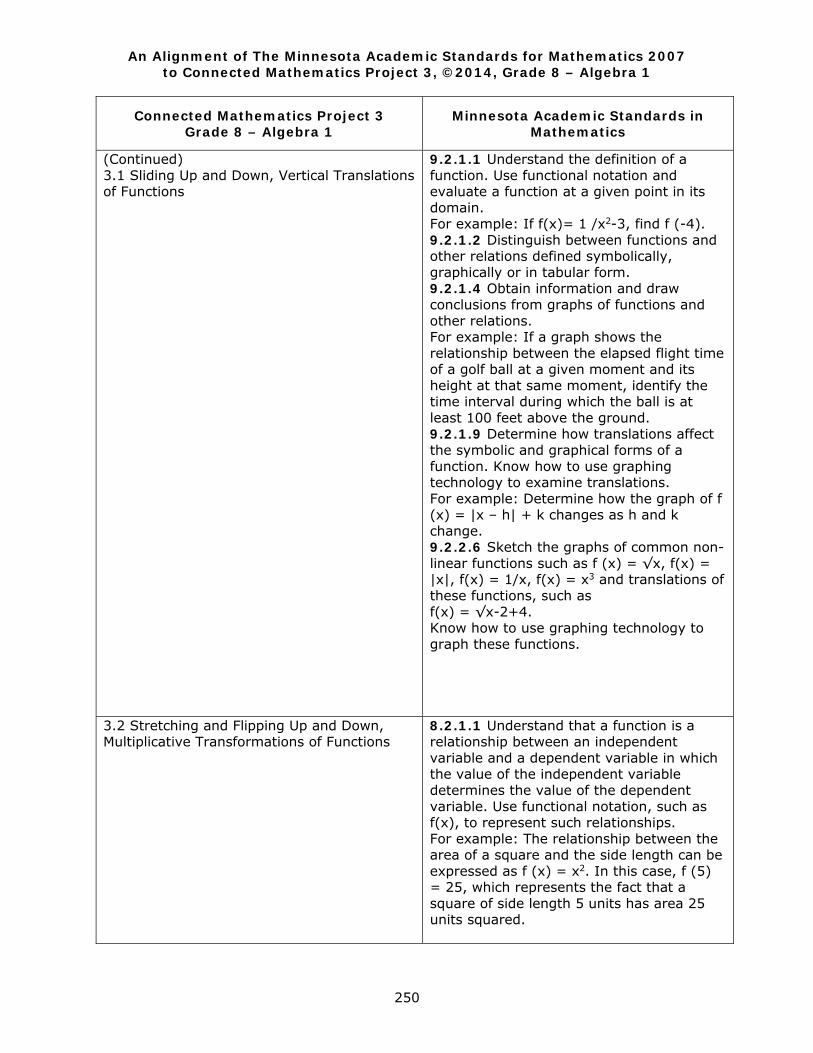
An Alignment of The Minnesota Academic Standards for Mathematics 2007 to Connected Mathematics Project 3, ©2014, Grade 8 – Algebra 1
250
Connected Mathematics Project 3 Grade 8 – Algebra 1
Minnesota Academic Standards in Mathematics
(Continued) 3.1 Sliding Up and Down, Vertical Translations of Functions
9.2.1.1 Understand the definition of a function. Use functional notation and evaluate a function at a given point in its domain. For example: If f(x)= 1 /x2-3, find f (-4). 9.2.1.2 Distinguish between functions and other relations defined symbolically, graphically or in tabular form. 9.2.1.4 Obtain information and draw conclusions from graphs of functions and other relations. For example: If a graph shows the relationship between the elapsed flight time of a golf ball at a given moment and its height at that same moment, identify the time interval during which the ball is at least 100 feet above the ground. 9.2.1.9 Determine how translations affect the symbolic and graphical forms of a function. Know how to use graphing technology to examine translations. For example: Determine how the graph of f (x) = |x – h| + k changes as h and k change. 9.2.2.6 Sketch the graphs of common non-linear functions such as f (x) = √x, f(x) = |x|, f(x) = 1/x, f(x) = x3 and translations of these functions, such as f(x) = √x-2+4. Know how to use graphing technology to graph these functions.
3.2 Stretching and Flipping Up and Down, Multiplicative Transformations of Functions
8.2.1.1 Understand that a function is a relationship between an independent variable and a dependent variable in which the value of the independent variable determines the value of the dependent variable. Use functional notation, such as f(x), to represent such relationships. For example: The relationship between the area of a square and the side length can be expressed as f (x) = x2. In this case, f (5) = 25, which represents the fact that a square of side length 5 units has area 25 units squared.
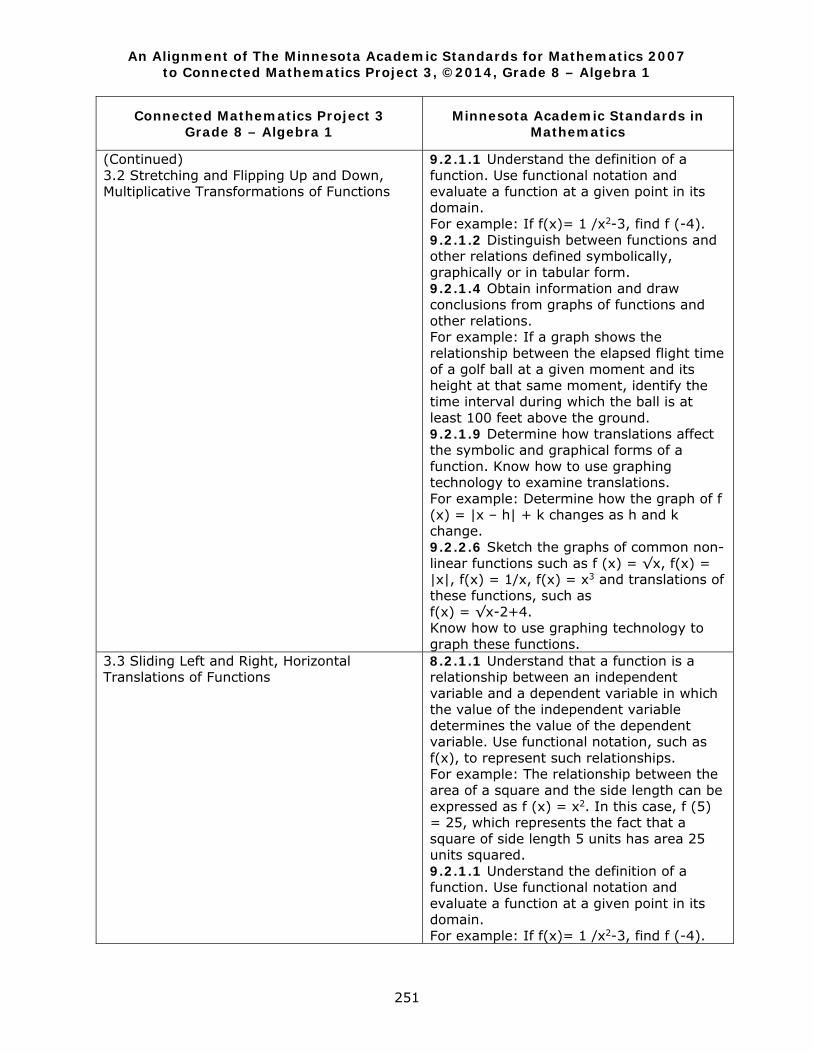
An Alignment of The Minnesota Academic Standards for Mathematics 2007 to Connected Mathematics Project 3, ©2014, Grade 8 – Algebra 1
251
Connected Mathematics Project 3 Grade 8 – Algebra 1
Minnesota Academic Standards in Mathematics
(Continued) 3.2 Stretching and Flipping Up and Down, Multiplicative Transformations of Functions
9.2.1.1 Understand the definition of a function. Use functional notation and evaluate a function at a given point in its domain. For example: If f(x)= 1 /x2-3, find f (-4). 9.2.1.2 Distinguish between functions and other relations defined symbolically, graphically or in tabular form. 9.2.1.4 Obtain information and draw conclusions from graphs of functions and other relations. For example: If a graph shows the relationship between the elapsed flight time of a golf ball at a given moment and its height at that same moment, identify the time interval during which the ball is at least 100 feet above the ground. 9.2.1.9 Determine how translations affect the symbolic and graphical forms of a function. Know how to use graphing technology to examine translations. For example: Determine how the graph of f (x) = |x – h| + k changes as h and k change. 9.2.2.6 Sketch the graphs of common non-linear functions such as f (x) = √x, f(x) = |x|, f(x) = 1/x, f(x) = x3 and translations of these functions, such as f(x) = √x-2+4. Know how to use graphing technology to graph these functions.
3.3 Sliding Left and Right, Horizontal Translations of Functions
8.2.1.1 Understand that a function is a relationship between an independent variable and a dependent variable in which the value of the independent variable determines the value of the dependent variable. Use functional notation, such as f(x), to represent such relationships. For example: The relationship between the area of a square and the side length can be expressed as f (x) = x2. In this case, f (5) = 25, which represents the fact that a square of side length 5 units has area 25 units squared. 9.2.1.1 Understand the definition of a function. Use functional notation and evaluate a function at a given point in its domain. For example: If f(x)= 1 /x2-3, find f (-4).
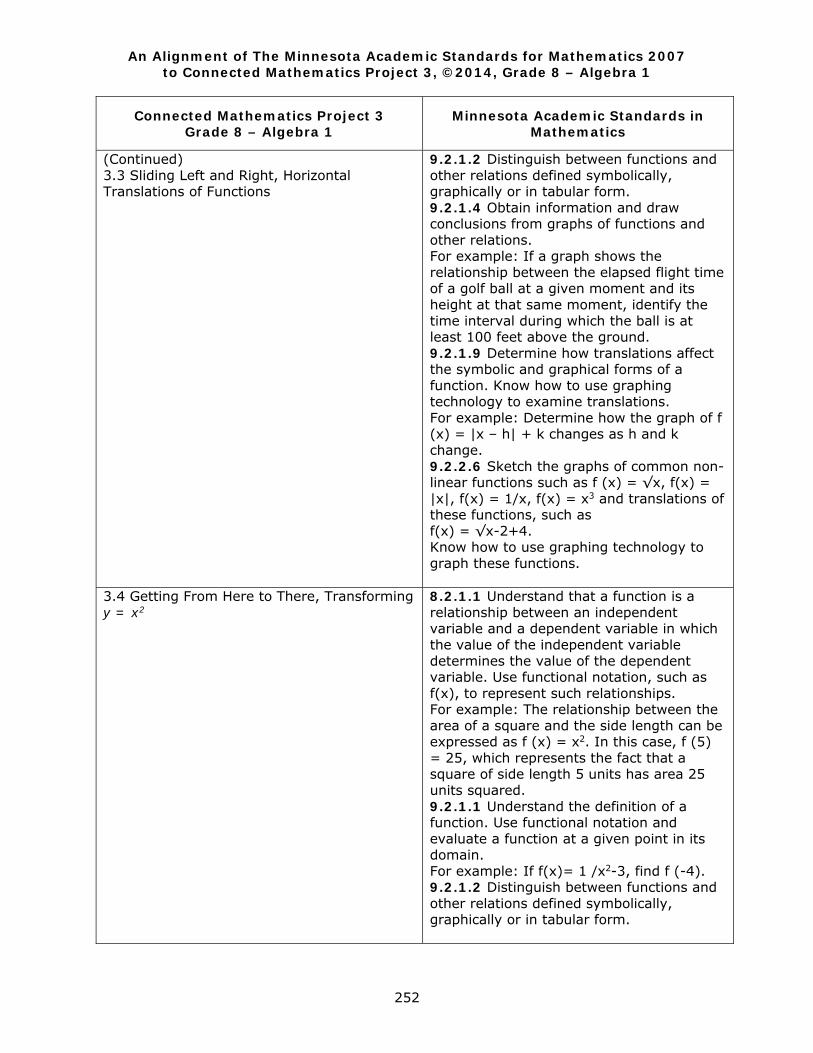
An Alignment of The Minnesota Academic Standards for Mathematics 2007 to Connected Mathematics Project 3, ©2014, Grade 8 – Algebra 1
252
Connected Mathematics Project 3 Grade 8 – Algebra 1
Minnesota Academic Standards in Mathematics
(Continued) 3.3 Sliding Left and Right, Horizontal Translations of Functions
9.2.1.2 Distinguish between functions and other relations defined symbolically, graphically or in tabular form. 9.2.1.4 Obtain information and draw conclusions from graphs of functions and other relations. For example: If a graph shows the relationship between the elapsed flight time of a golf ball at a given moment and its height at that same moment, identify the time interval during which the ball is at least 100 feet above the ground. 9.2.1.9 Determine how translations affect the symbolic and graphical forms of a function. Know how to use graphing technology to examine translations. For example: Determine how the graph of f (x) = |x – h| + k changes as h and k change. 9.2.2.6 Sketch the graphs of common non-linear functions such as f (x) = √x, f(x) = |x|, f(x) = 1/x, f(x) = x3 and translations of these functions, such as f(x) = √x-2+4. Know how to use graphing technology to graph these functions.
3.4 Getting From Here to There, Transforming y = x2
8.2.1.1 Understand that a function is a relationship between an independent variable and a dependent variable in which the value of the independent variable determines the value of the dependent variable. Use functional notation, such as f(x), to represent such relationships. For example: The relationship between the area of a square and the side length can be expressed as f (x) = x2. In this case, f (5) = 25, which represents the fact that a square of side length 5 units has area 25 units squared. 9.2.1.1 Understand the definition of a function. Use functional notation and evaluate a function at a given point in its domain. For example: If f(x)= 1 /x2-3, find f (-4). 9.2.1.2 Distinguish between functions and other relations defined symbolically, graphically or in tabular form.
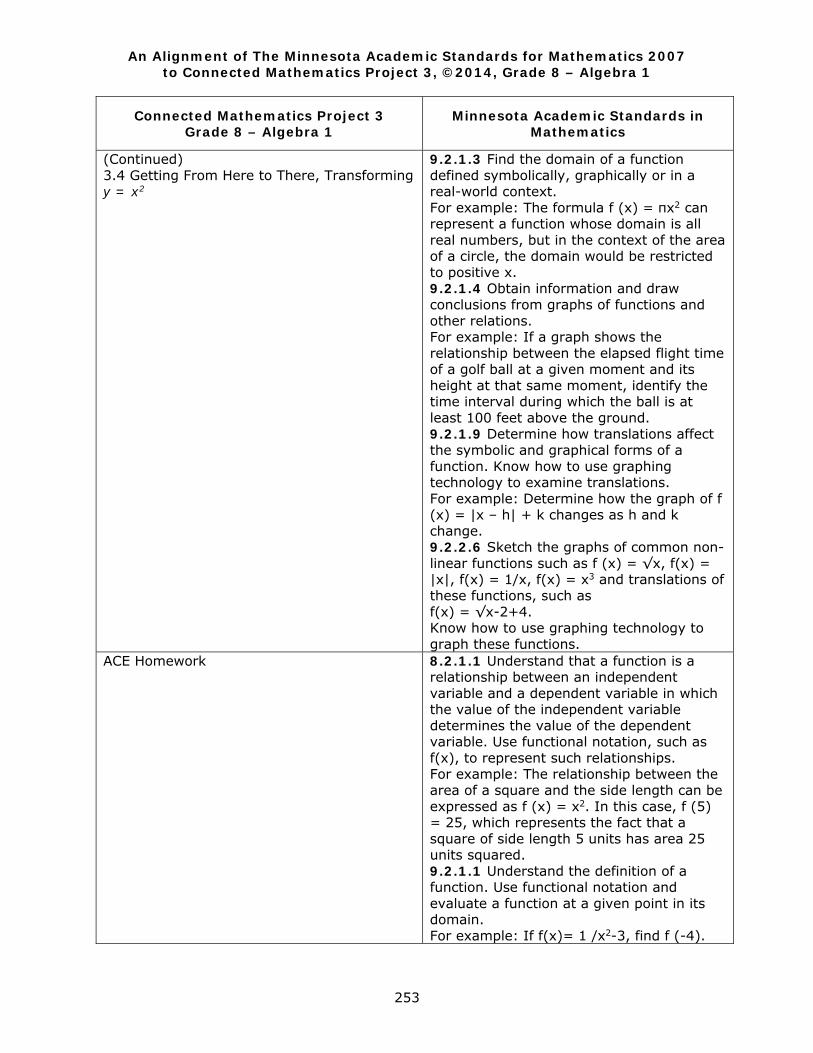
An Alignment of The Minnesota Academic Standards for Mathematics 2007 to Connected Mathematics Project 3, ©2014, Grade 8 – Algebra 1
253
Connected Mathematics Project 3 Grade 8 – Algebra 1
Minnesota Academic Standards in Mathematics
(Continued) 3.4 Getting From Here to There, Transforming y = x2
9.2.1.3 Find the domain of a function defined symbolically, graphically or in a real-world context. For example: The formula f (x) = πx2 can represent a function whose domain is all real numbers, but in the context of the area of a circle, the domain would be restricted to positive x. 9.2.1.4 Obtain information and draw conclusions from graphs of functions and other relations. For example: If a graph shows the relationship between the elapsed flight time of a golf ball at a given moment and its height at that same moment, identify the time interval during which the ball is at least 100 feet above the ground. 9.2.1.9 Determine how translations affect the symbolic and graphical forms of a function. Know how to use graphing technology to examine translations. For example: Determine how the graph of f (x) = |x – h| + k changes as h and k change. 9.2.2.6 Sketch the graphs of common non-linear functions such as f (x) = √x, f(x) = |x|, f(x) = 1/x, f(x) = x3 and translations of these functions, such as f(x) = √x-2+4. Know how to use graphing technology to graph these functions.
ACE Homework
8.2.1.1 Understand that a function is a relationship between an independent variable and a dependent variable in which the value of the independent variable determines the value of the dependent variable. Use functional notation, such as f(x), to represent such relationships. For example: The relationship between the area of a square and the side length can be expressed as f (x) = x2. In this case, f (5) = 25, which represents the fact that a square of side length 5 units has area 25 units squared. 9.2.1.1 Understand the definition of a function. Use functional notation and evaluate a function at a given point in its domain. For example: If f(x)= 1 /x2-3, find f (-4).
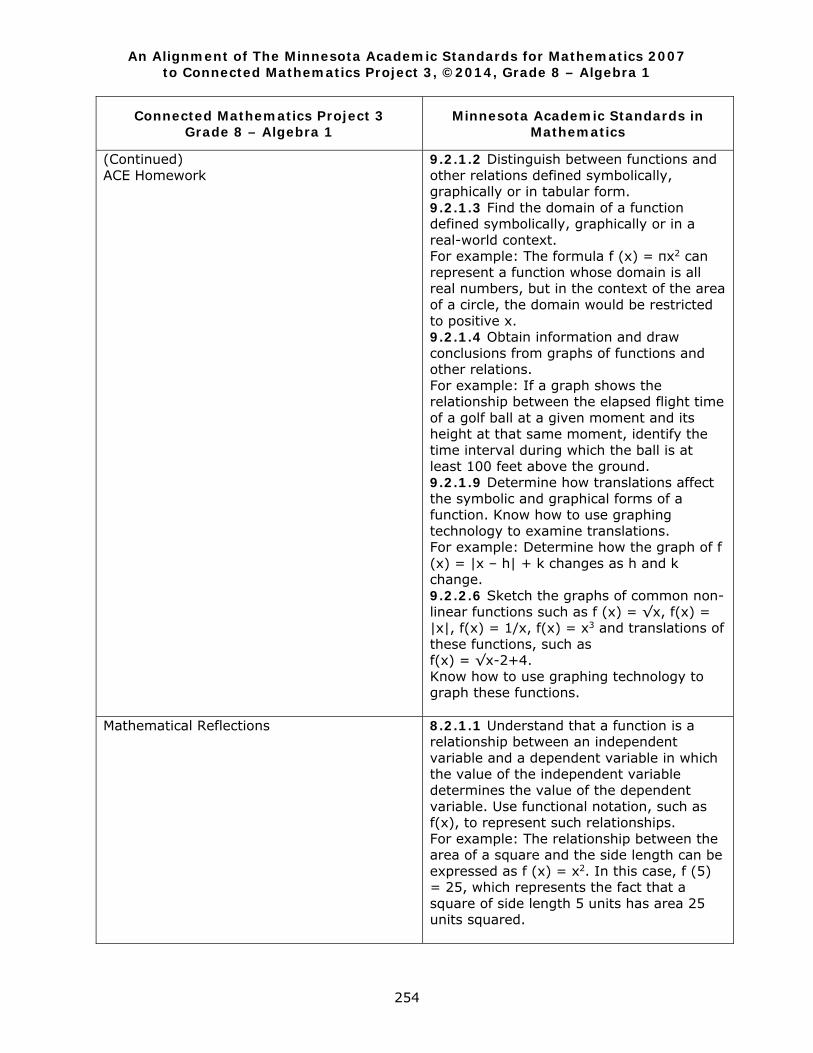
An Alignment of The Minnesota Academic Standards for Mathematics 2007 to Connected Mathematics Project 3, ©2014, Grade 8 – Algebra 1
254
Connected Mathematics Project 3 Grade 8 – Algebra 1
Minnesota Academic Standards in Mathematics
(Continued) ACE Homework
9.2.1.2 Distinguish between functions and other relations defined symbolically, graphically or in tabular form. 9.2.1.3 Find the domain of a function defined symbolically, graphically or in a real-world context. For example: The formula f (x) = πx2 can represent a function whose domain is all real numbers, but in the context of the area of a circle, the domain would be restricted to positive x. 9.2.1.4 Obtain information and draw conclusions from graphs of functions and other relations. For example: If a graph shows the relationship between the elapsed flight time of a golf ball at a given moment and its height at that same moment, identify the time interval during which the ball is at least 100 feet above the ground. 9.2.1.9 Determine how translations affect the symbolic and graphical forms of a function. Know how to use graphing technology to examine translations. For example: Determine how the graph of f (x) = |x – h| + k changes as h and k change. 9.2.2.6 Sketch the graphs of common non-linear functions such as f (x) = √x, f(x) = |x|, f(x) = 1/x, f(x) = x3 and translations of these functions, such as f(x) = √x-2+4. Know how to use graphing technology to graph these functions.
Mathematical Reflections
8.2.1.1 Understand that a function is a relationship between an independent variable and a dependent variable in which the value of the independent variable determines the value of the dependent variable. Use functional notation, such as f(x), to represent such relationships. For example: The relationship between the area of a square and the side length can be expressed as f (x) = x2. In this case, f (5) = 25, which represents the fact that a square of side length 5 units has area 25 units squared.
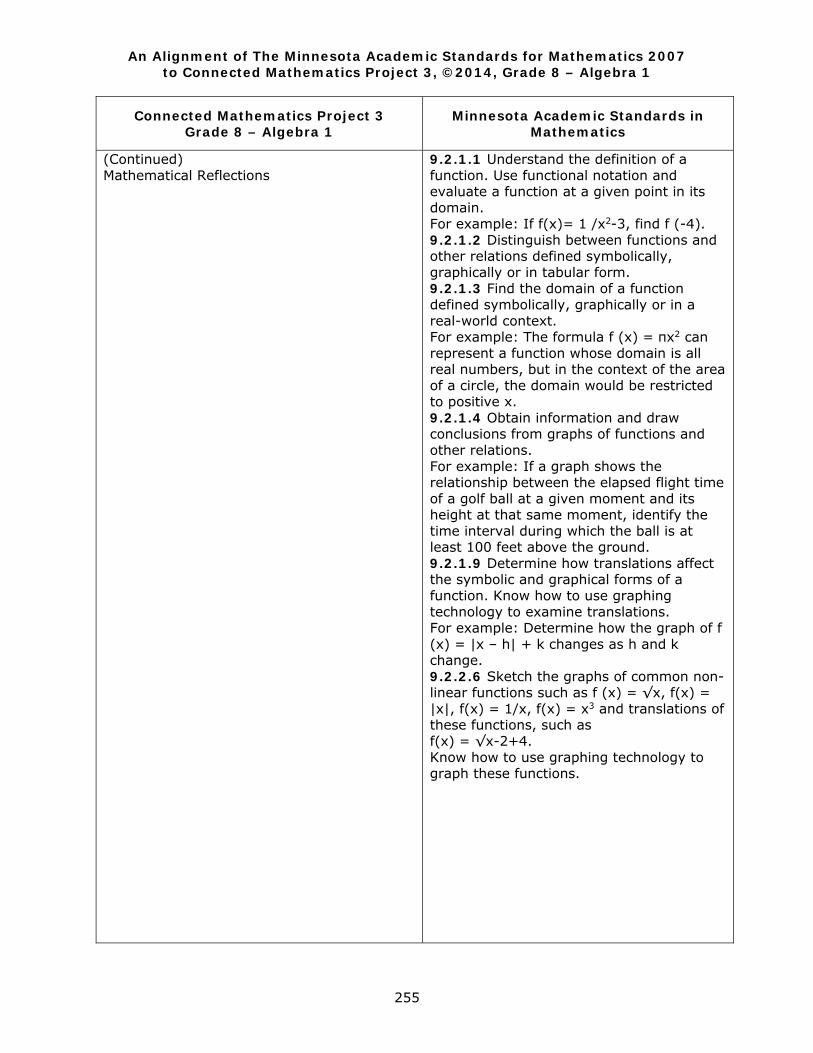
An Alignment of The Minnesota Academic Standards for Mathematics 2007 to Connected Mathematics Project 3, ©2014, Grade 8 – Algebra 1
255
Connected Mathematics Project 3 Grade 8 – Algebra 1
Minnesota Academic Standards in Mathematics
(Continued) Mathematical Reflections
9.2.1.1 Understand the definition of a function. Use functional notation and evaluate a function at a given point in its domain. For example: If f(x)= 1 /x2-3, find f (-4). 9.2.1.2 Distinguish between functions and other relations defined symbolically, graphically or in tabular form. 9.2.1.3 Find the domain of a function defined symbolically, graphically or in a real-world context. For example: The formula f (x) = πx2 can represent a function whose domain is all real numbers, but in the context of the area of a circle, the domain would be restricted to positive x. 9.2.1.4 Obtain information and draw conclusions from graphs of functions and other relations. For example: If a graph shows the relationship between the elapsed flight time of a golf ball at a given moment and its height at that same moment, identify the time interval during which the ball is at least 100 feet above the ground. 9.2.1.9 Determine how translations affect the symbolic and graphical forms of a function. Know how to use graphing technology to examine translations. For example: Determine how the graph of f (x) = |x – h| + k changes as h and k change. 9.2.2.6 Sketch the graphs of common non-linear functions such as f (x) = √x, f(x) = |x|, f(x) = 1/x, f(x) = x3 and translations of these functions, such as f(x) = √x-2+4. Know how to use graphing technology to graph these functions.
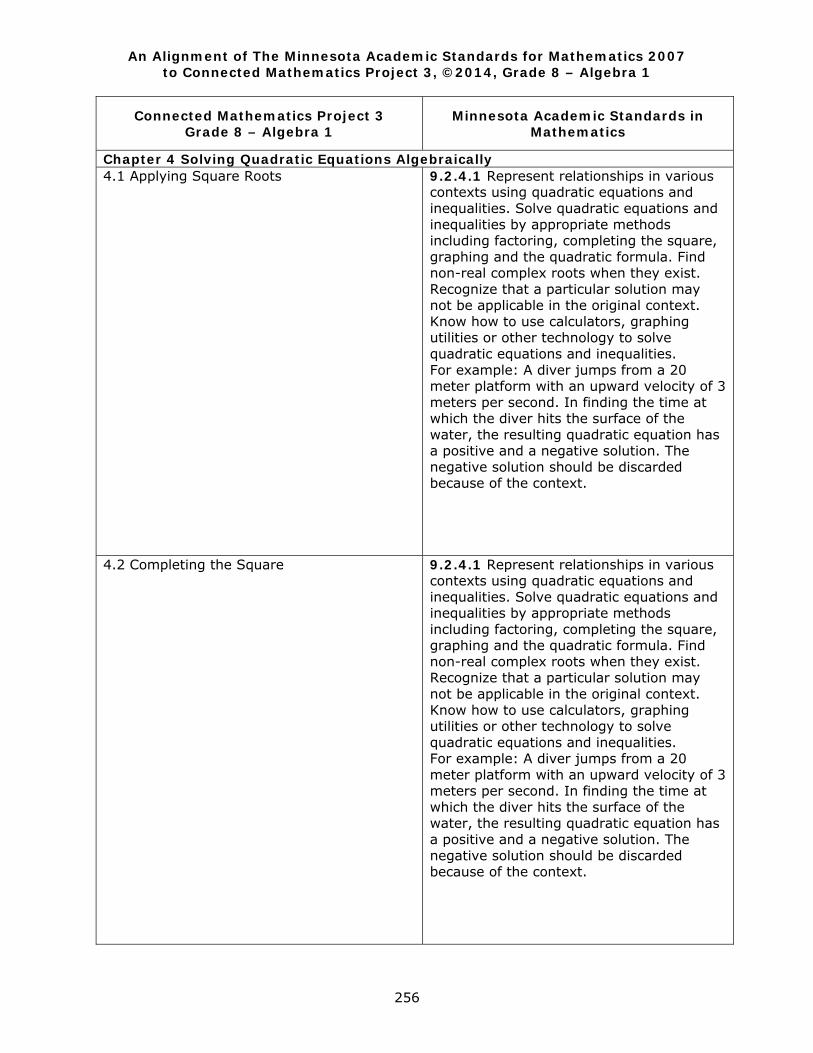
An Alignment of The Minnesota Academic Standards for Mathematics 2007 to Connected Mathematics Project 3, ©2014, Grade 8 – Algebra 1
256
Connected Mathematics Project 3 Grade 8 – Algebra 1
Minnesota Academic Standards in Mathematics
Chapter 4 Solving Quadratic Equations Algebraically 4.1 Applying Square Roots 9.2.4.1 Represent relationships in various
contexts using quadratic equations and inequalities. Solve quadratic equations and inequalities by appropriate methods including factoring, completing the square, graphing and the quadratic formula. Find non-real complex roots when they exist. Recognize that a particular solution may not be applicable in the original context. Know how to use calculators, graphing utilities or other technology to solve quadratic equations and inequalities. For example: A diver jumps from a 20 meter platform with an upward velocity of 3 meters per second. In finding the time at which the diver hits the surface of the water, the resulting quadratic equation has a positive and a negative solution. The negative solution should be discarded because of the context.
4.2 Completing the Square 9.2.4.1 Represent relationships in various contexts using quadratic equations and inequalities. Solve quadratic equations and inequalities by appropriate methods including factoring, completing the square, graphing and the quadratic formula. Find non-real complex roots when they exist. Recognize that a particular solution may not be applicable in the original context. Know how to use calculators, graphing utilities or other technology to solve quadratic equations and inequalities. For example: A diver jumps from a 20 meter platform with an upward velocity of 3 meters per second. In finding the time at which the diver hits the surface of the water, the resulting quadratic equation has a positive and a negative solution. The negative solution should be discarded because of the context.
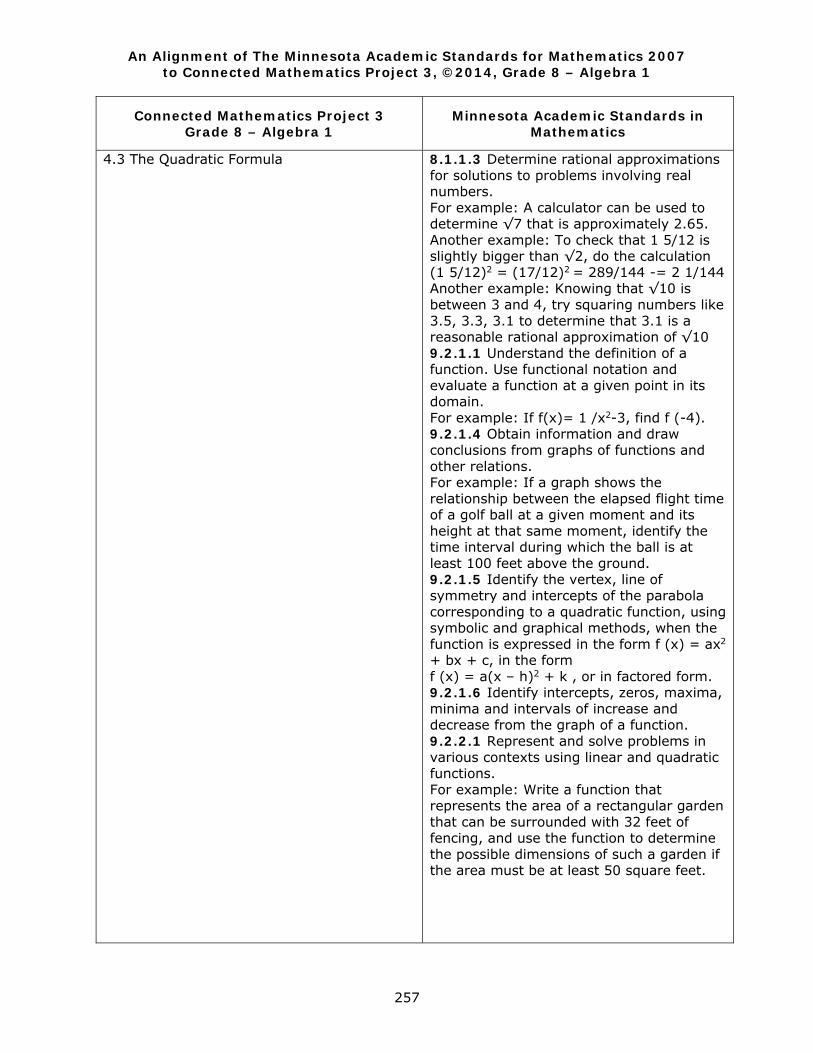
An Alignment of The Minnesota Academic Standards for Mathematics 2007 to Connected Mathematics Project 3, ©2014, Grade 8 – Algebra 1
257
Connected Mathematics Project 3 Grade 8 – Algebra 1
Minnesota Academic Standards in Mathematics
4.3 The Quadratic Formula
8.1.1.3 Determine rational approximations for solutions to problems involving real numbers. For example: A calculator can be used to determine √7 that is approximately 2.65. Another example: To check that 1 5/12 is slightly bigger than √2, do the calculation (1 5/12)2 = (17/12)2 = 289/144 -= 2 1/144 Another example: Knowing that √10 is between 3 and 4, try squaring numbers like 3.5, 3.3, 3.1 to determine that 3.1 is a reasonable rational approximation of √10 9.2.1.1 Understand the definition of a function. Use functional notation and evaluate a function at a given point in its domain. For example: If f(x)= 1 /x2-3, find f (-4). 9.2.1.4 Obtain information and draw conclusions from graphs of functions and other relations. For example: If a graph shows the relationship between the elapsed flight time of a golf ball at a given moment and its height at that same moment, identify the time interval during which the ball is at least 100 feet above the ground. 9.2.1.5 Identify the vertex, line of symmetry and intercepts of the parabola corresponding to a quadratic function, using symbolic and graphical methods, when the function is expressed in the form f (x) = ax2 + bx + c, in the form f (x) = a(x – h)2 + k , or in factored form. 9.2.1.6 Identify intercepts, zeros, maxima, minima and intervals of increase and decrease from the graph of a function. 9.2.2.1 Represent and solve problems in various contexts using linear and quadratic functions. For example: Write a function that represents the area of a rectangular garden that can be surrounded with 32 feet of fencing, and use the function to determine the possible dimensions of such a garden if the area must be at least 50 square feet.
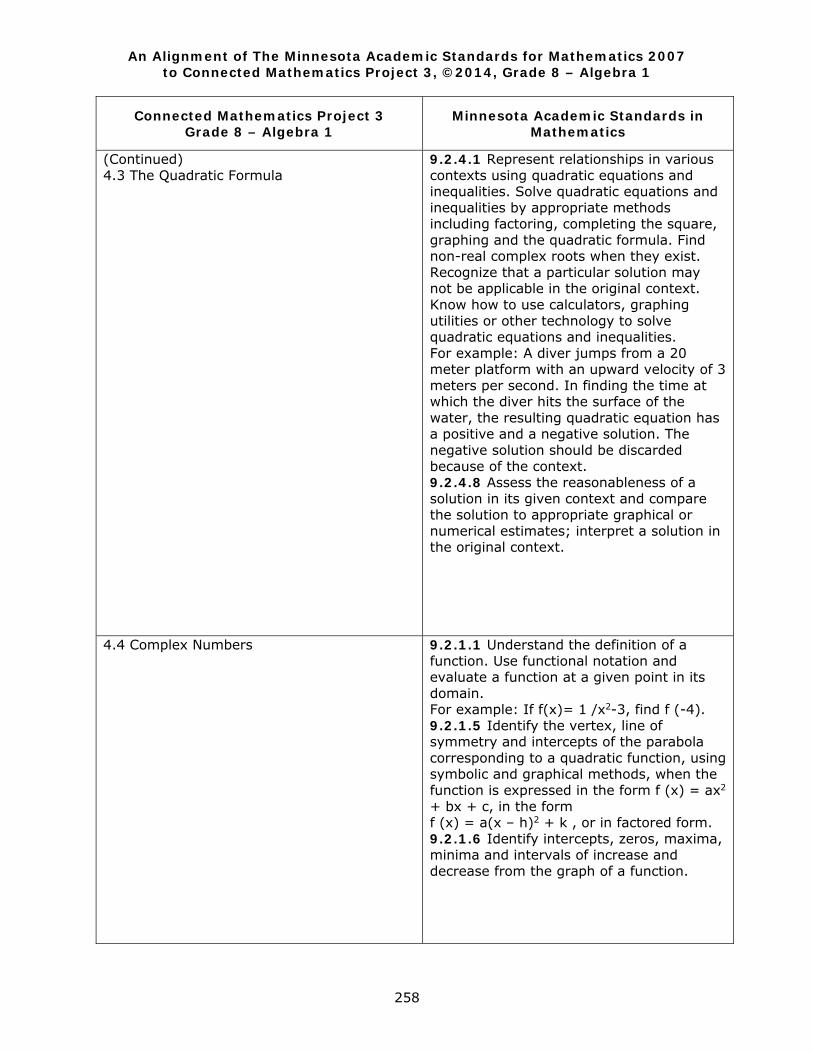
An Alignment of The Minnesota Academic Standards for Mathematics 2007 to Connected Mathematics Project 3, ©2014, Grade 8 – Algebra 1
258
Connected Mathematics Project 3 Grade 8 – Algebra 1
Minnesota Academic Standards in Mathematics
(Continued) 4.3 The Quadratic Formula
9.2.4.1 Represent relationships in various contexts using quadratic equations and inequalities. Solve quadratic equations and inequalities by appropriate methods including factoring, completing the square, graphing and the quadratic formula. Find non-real complex roots when they exist. Recognize that a particular solution may not be applicable in the original context. Know how to use calculators, graphing utilities or other technology to solve quadratic equations and inequalities. For example: A diver jumps from a 20 meter platform with an upward velocity of 3 meters per second. In finding the time at which the diver hits the surface of the water, the resulting quadratic equation has a positive and a negative solution. The negative solution should be discarded because of the context. 9.2.4.8 Assess the reasonableness of a solution in its given context and compare the solution to appropriate graphical or numerical estimates; interpret a solution in the original context.
4.4 Complex Numbers
9.2.1.1 Understand the definition of a function. Use functional notation and evaluate a function at a given point in its domain. For example: If f(x)= 1 /x2-3, find f (-4). 9.2.1.5 Identify the vertex, line of symmetry and intercepts of the parabola corresponding to a quadratic function, using symbolic and graphical methods, when the function is expressed in the form f (x) = ax2 + bx + c, in the form f (x) = a(x – h)2 + k , or in factored form. 9.2.1.6 Identify intercepts, zeros, maxima, minima and intervals of increase and decrease from the graph of a function.
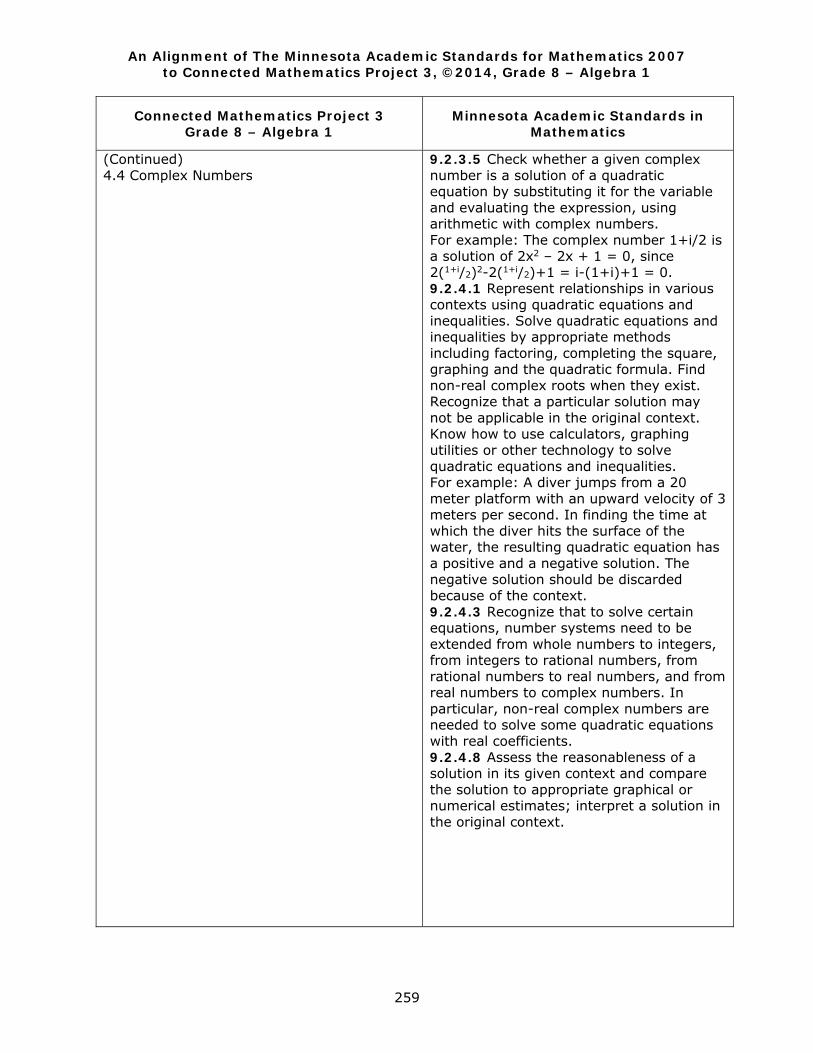
An Alignment of The Minnesota Academic Standards for Mathematics 2007 to Connected Mathematics Project 3, ©2014, Grade 8 – Algebra 1
259
Connected Mathematics Project 3 Grade 8 – Algebra 1
Minnesota Academic Standards in Mathematics
(Continued) 4.4 Complex Numbers
9.2.3.5 Check whether a given complex number is a solution of a quadratic equation by substituting it for the variable and evaluating the expression, using arithmetic with complex numbers. For example: The complex number 1+i/2 is a solution of 2x2 – 2x + 1 = 0, since 2(1+i/2)2-2(1+i/2)+1 = i-(1+i)+1 = 0. 9.2.4.1 Represent relationships in various contexts using quadratic equations and inequalities. Solve quadratic equations and inequalities by appropriate methods including factoring, completing the square, graphing and the quadratic formula. Find non-real complex roots when they exist. Recognize that a particular solution may not be applicable in the original context. Know how to use calculators, graphing utilities or other technology to solve quadratic equations and inequalities. For example: A diver jumps from a 20 meter platform with an upward velocity of 3 meters per second. In finding the time at which the diver hits the surface of the water, the resulting quadratic equation has a positive and a negative solution. The negative solution should be discarded because of the context. 9.2.4.3 Recognize that to solve certain equations, number systems need to be extended from whole numbers to integers, from integers to rational numbers, from rational numbers to real numbers, and from real numbers to complex numbers. In particular, non-real complex numbers are needed to solve some quadratic equations with real coefficients. 9.2.4.8 Assess the reasonableness of a solution in its given context and compare the solution to appropriate graphical or numerical estimates; interpret a solution in the original context.
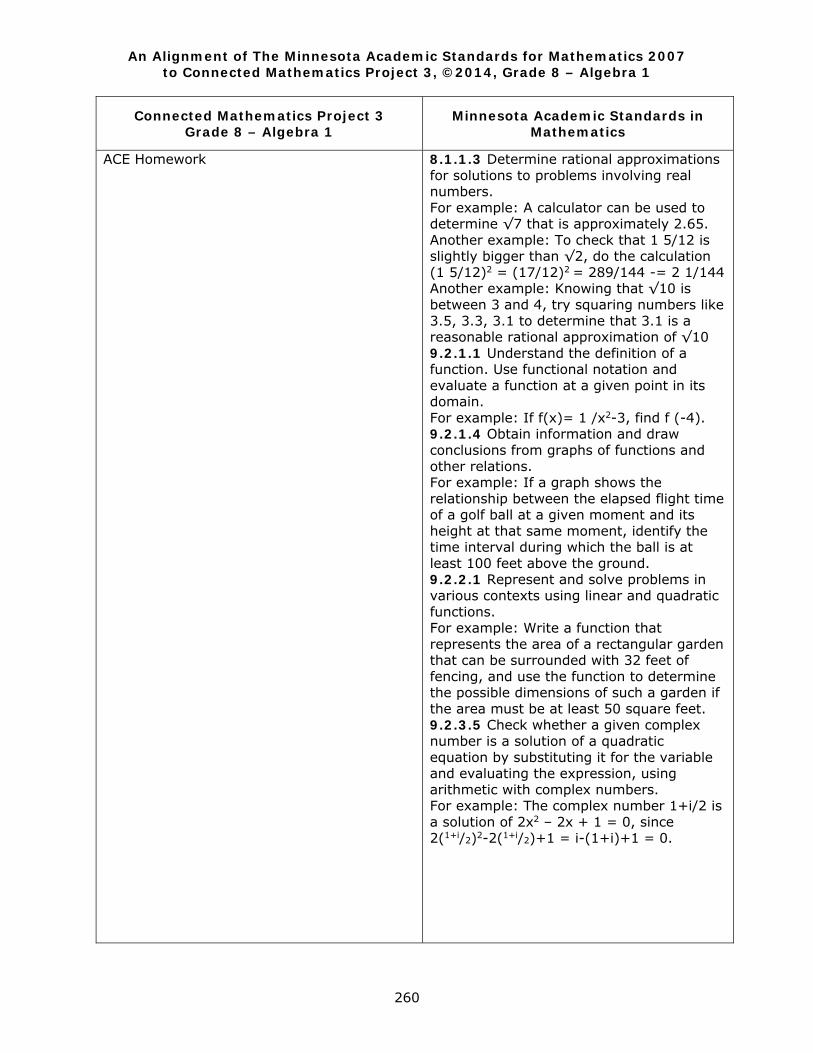
An Alignment of The Minnesota Academic Standards for Mathematics 2007 to Connected Mathematics Project 3, ©2014, Grade 8 – Algebra 1
260
Connected Mathematics Project 3 Grade 8 – Algebra 1
Minnesota Academic Standards in Mathematics
ACE Homework
8.1.1.3 Determine rational approximations for solutions to problems involving real numbers. For example: A calculator can be used to determine √7 that is approximately 2.65. Another example: To check that 1 5/12 is slightly bigger than √2, do the calculation (1 5/12)2 = (17/12)2 = 289/144 -= 2 1/144 Another example: Knowing that √10 is between 3 and 4, try squaring numbers like 3.5, 3.3, 3.1 to determine that 3.1 is a reasonable rational approximation of √10 9.2.1.1 Understand the definition of a function. Use functional notation and evaluate a function at a given point in its domain. For example: If f(x)= 1 /x2-3, find f (-4). 9.2.1.4 Obtain information and draw conclusions from graphs of functions and other relations. For example: If a graph shows the relationship between the elapsed flight time of a golf ball at a given moment and its height at that same moment, identify the time interval during which the ball is at least 100 feet above the ground. 9.2.2.1 Represent and solve problems in various contexts using linear and quadratic functions. For example: Write a function that represents the area of a rectangular garden that can be surrounded with 32 feet of fencing, and use the function to determine the possible dimensions of such a garden if the area must be at least 50 square feet. 9.2.3.5 Check whether a given complex number is a solution of a quadratic equation by substituting it for the variable and evaluating the expression, using arithmetic with complex numbers. For example: The complex number 1+i/2 is a solution of 2x2 – 2x + 1 = 0, since 2(1+i/2)2-2(1+i/2)+1 = i-(1+i)+1 = 0.
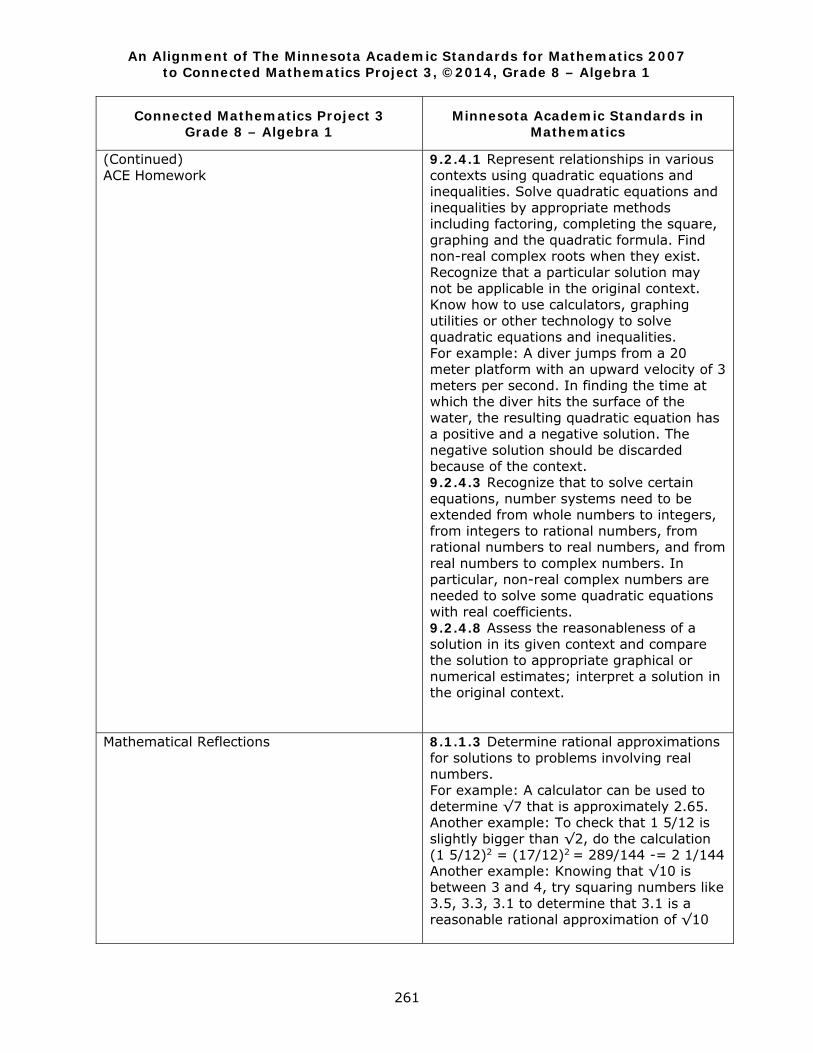
An Alignment of The Minnesota Academic Standards for Mathematics 2007 to Connected Mathematics Project 3, ©2014, Grade 8 – Algebra 1
261
Connected Mathematics Project 3 Grade 8 – Algebra 1
Minnesota Academic Standards in Mathematics
(Continued) ACE Homework
9.2.4.1 Represent relationships in various contexts using quadratic equations and inequalities. Solve quadratic equations and inequalities by appropriate methods including factoring, completing the square, graphing and the quadratic formula. Find non-real complex roots when they exist. Recognize that a particular solution may not be applicable in the original context. Know how to use calculators, graphing utilities or other technology to solve quadratic equations and inequalities. For example: A diver jumps from a 20 meter platform with an upward velocity of 3 meters per second. In finding the time at which the diver hits the surface of the water, the resulting quadratic equation has a positive and a negative solution. The negative solution should be discarded because of the context. 9.2.4.3 Recognize that to solve certain equations, number systems need to be extended from whole numbers to integers, from integers to rational numbers, from rational numbers to real numbers, and from real numbers to complex numbers. In particular, non-real complex numbers are needed to solve some quadratic equations with real coefficients. 9.2.4.8 Assess the reasonableness of a solution in its given context and compare the solution to appropriate graphical or numerical estimates; interpret a solution in the original context.
Mathematical Reflections
8.1.1.3 Determine rational approximations for solutions to problems involving real numbers. For example: A calculator can be used to determine √7 that is approximately 2.65. Another example: To check that 1 5/12 is slightly bigger than √2, do the calculation (1 5/12)2 = (17/12)2 = 289/144 -= 2 1/144 Another example: Knowing that √10 is between 3 and 4, try squaring numbers like 3.5, 3.3, 3.1 to determine that 3.1 is a reasonable rational approximation of √10
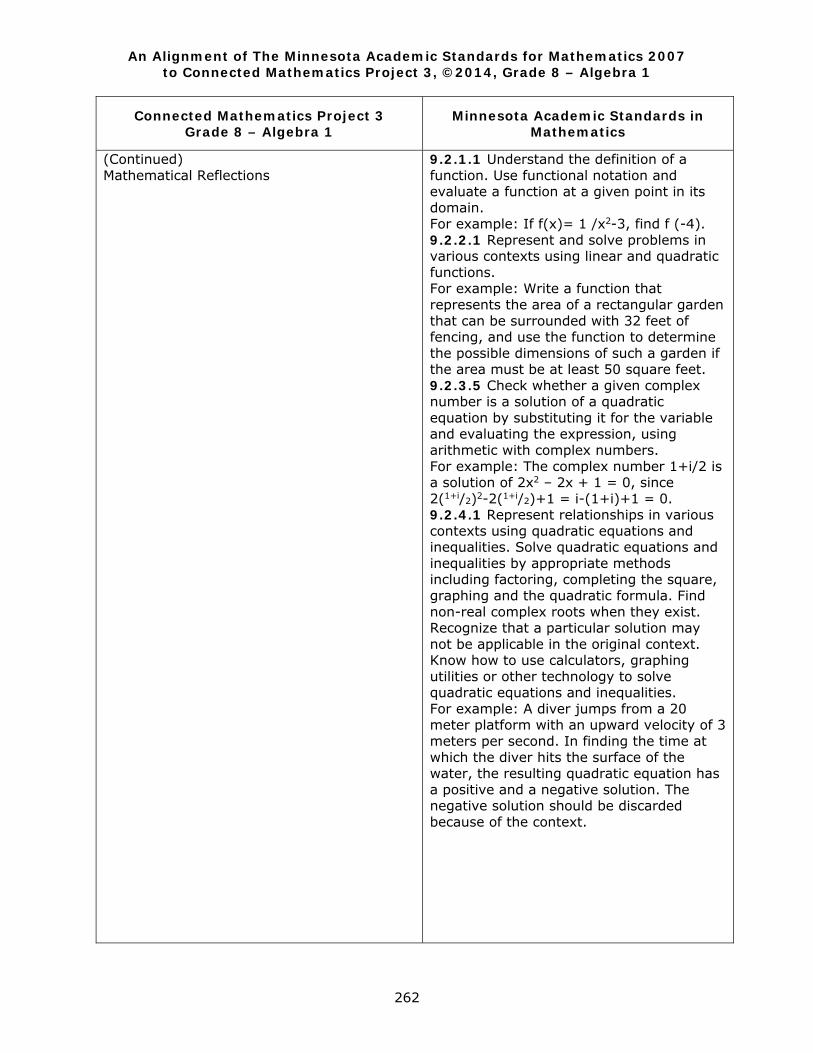
An Alignment of The Minnesota Academic Standards for Mathematics 2007 to Connected Mathematics Project 3, ©2014, Grade 8 – Algebra 1
262
Connected Mathematics Project 3 Grade 8 – Algebra 1
Minnesota Academic Standards in Mathematics
(Continued) Mathematical Reflections
9.2.1.1 Understand the definition of a function. Use functional notation and evaluate a function at a given point in its domain. For example: If f(x)= 1 /x2-3, find f (-4). 9.2.2.1 Represent and solve problems in various contexts using linear and quadratic functions. For example: Write a function that represents the area of a rectangular garden that can be surrounded with 32 feet of fencing, and use the function to determine the possible dimensions of such a garden if the area must be at least 50 square feet. 9.2.3.5 Check whether a given complex number is a solution of a quadratic equation by substituting it for the variable and evaluating the expression, using arithmetic with complex numbers. For example: The complex number 1+i/2 is a solution of 2x2 – 2x + 1 = 0, since 2(1+i/2)2-2(1+i/2)+1 = i-(1+i)+1 = 0. 9.2.4.1 Represent relationships in various contexts using quadratic equations and inequalities. Solve quadratic equations and inequalities by appropriate methods including factoring, completing the square, graphing and the quadratic formula. Find non-real complex roots when they exist. Recognize that a particular solution may not be applicable in the original context. Know how to use calculators, graphing utilities or other technology to solve quadratic equations and inequalities. For example: A diver jumps from a 20 meter platform with an upward velocity of 3 meters per second. In finding the time at which the diver hits the surface of the water, the resulting quadratic equation has a positive and a negative solution. The negative solution should be discarded because of the context.
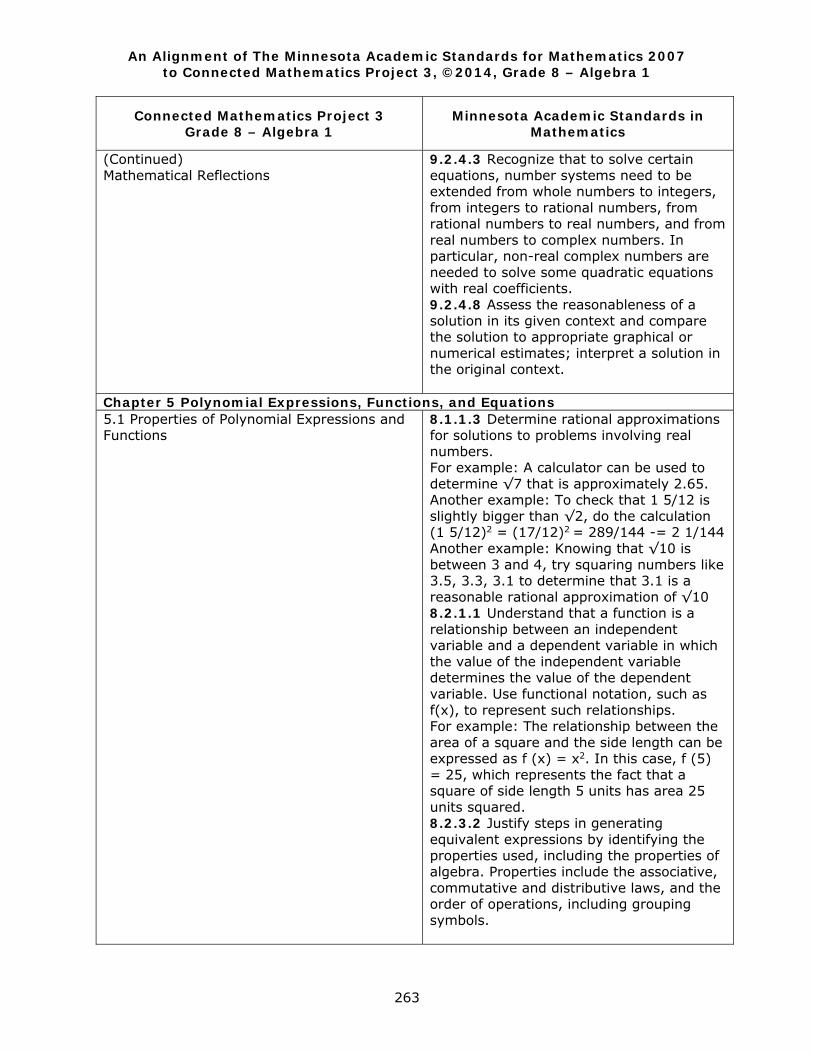
An Alignment of The Minnesota Academic Standards for Mathematics 2007 to Connected Mathematics Project 3, ©2014, Grade 8 – Algebra 1
263
Connected Mathematics Project 3 Grade 8 – Algebra 1
Minnesota Academic Standards in Mathematics
(Continued) Mathematical Reflections
9.2.4.3 Recognize that to solve certain equations, number systems need to be extended from whole numbers to integers, from integers to rational numbers, from rational numbers to real numbers, and from real numbers to complex numbers. In particular, non-real complex numbers are needed to solve some quadratic equations with real coefficients. 9.2.4.8 Assess the reasonableness of a solution in its given context and compare the solution to appropriate graphical or numerical estimates; interpret a solution in the original context.
Chapter 5 Polynomial Expressions, Functions, and Equations 5.1 Properties of Polynomial Expressions and Functions
8.1.1.3 Determine rational approximations for solutions to problems involving real numbers. For example: A calculator can be used to determine √7 that is approximately 2.65. Another example: To check that 1 5/12 is slightly bigger than √2, do the calculation (1 5/12)2 = (17/12)2 = 289/144 -= 2 1/144 Another example: Knowing that √10 is between 3 and 4, try squaring numbers like 3.5, 3.3, 3.1 to determine that 3.1 is a reasonable rational approximation of √10 8.2.1.1 Understand that a function is a relationship between an independent variable and a dependent variable in which the value of the independent variable determines the value of the dependent variable. Use functional notation, such as f(x), to represent such relationships. For example: The relationship between the area of a square and the side length can be expressed as f (x) = x2. In this case, f (5) = 25, which represents the fact that a square of side length 5 units has area 25 units squared. 8.2.3.2 Justify steps in generating equivalent expressions by identifying the properties used, including the properties of algebra. Properties include the associative, commutative and distributive laws, and the order of operations, including grouping symbols.
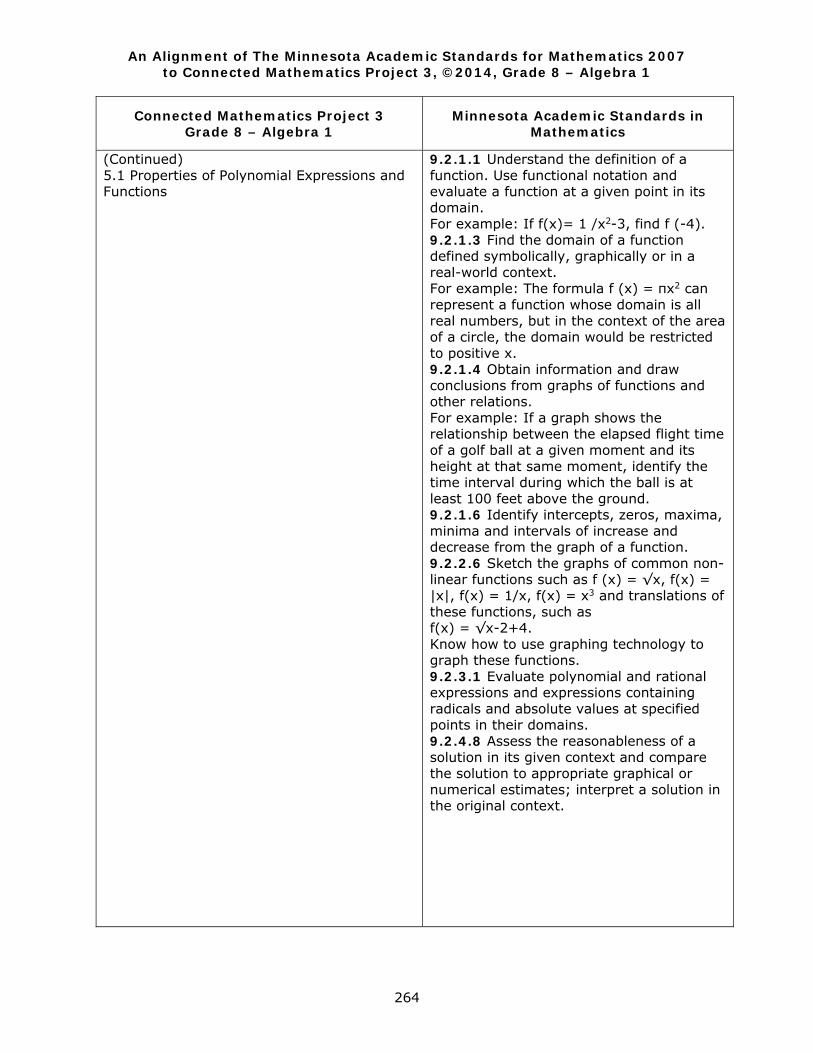
An Alignment of The Minnesota Academic Standards for Mathematics 2007 to Connected Mathematics Project 3, ©2014, Grade 8 – Algebra 1
264
Connected Mathematics Project 3 Grade 8 – Algebra 1
Minnesota Academic Standards in Mathematics
(Continued) 5.1 Properties of Polynomial Expressions and Functions
9.2.1.1 Understand the definition of a function. Use functional notation and evaluate a function at a given point in its domain. For example: If f(x)= 1 /x2-3, find f (-4). 9.2.1.3 Find the domain of a function defined symbolically, graphically or in a real-world context. For example: The formula f (x) = πx2 can represent a function whose domain is all real numbers, but in the context of the area of a circle, the domain would be restricted to positive x. 9.2.1.4 Obtain information and draw conclusions from graphs of functions and other relations. For example: If a graph shows the relationship between the elapsed flight time of a golf ball at a given moment and its height at that same moment, identify the time interval during which the ball is at least 100 feet above the ground. 9.2.1.6 Identify intercepts, zeros, maxima, minima and intervals of increase and decrease from the graph of a function. 9.2.2.6 Sketch the graphs of common non-linear functions such as f (x) = √x, f(x) = |x|, f(x) = 1/x, f(x) = x3 and translations of these functions, such as f(x) = √x-2+4. Know how to use graphing technology to graph these functions. 9.2.3.1 Evaluate polynomial and rational expressions and expressions containing radicals and absolute values at specified points in their domains. 9.2.4.8 Assess the reasonableness of a solution in its given context and compare the solution to appropriate graphical or numerical estimates; interpret a solution in the original context.
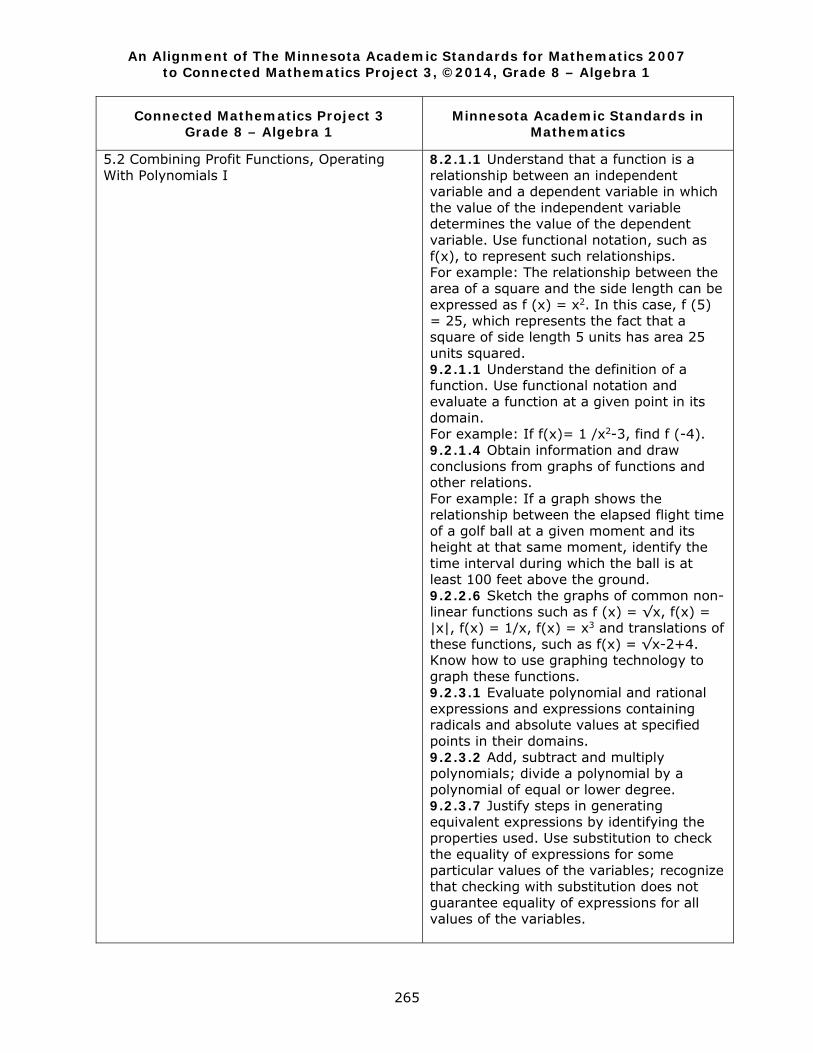
An Alignment of The Minnesota Academic Standards for Mathematics 2007 to Connected Mathematics Project 3, ©2014, Grade 8 – Algebra 1
265
Connected Mathematics Project 3 Grade 8 – Algebra 1
Minnesota Academic Standards in Mathematics
5.2 Combining Profit Functions, Operating With Polynomials I
8.2.1.1 Understand that a function is a relationship between an independent variable and a dependent variable in which the value of the independent variable determines the value of the dependent variable. Use functional notation, such as f(x), to represent such relationships. For example: The relationship between the area of a square and the side length can be expressed as f (x) = x2. In this case, f (5) = 25, which represents the fact that a square of side length 5 units has area 25 units squared. 9.2.1.1 Understand the definition of a function. Use functional notation and evaluate a function at a given point in its domain. For example: If f(x)= 1 /x2-3, find f (-4). 9.2.1.4 Obtain information and draw conclusions from graphs of functions and other relations. For example: If a graph shows the relationship between the elapsed flight time of a golf ball at a given moment and its height at that same moment, identify the time interval during which the ball is at least 100 feet above the ground. 9.2.2.6 Sketch the graphs of common non-linear functions such as f (x) = √x, f(x) = |x|, f(x) = 1/x, f(x) = x3 and translations of these functions, such as f(x) = √x-2+4. Know how to use graphing technology to graph these functions. 9.2.3.1 Evaluate polynomial and rational expressions and expressions containing radicals and absolute values at specified points in their domains. 9.2.3.2 Add, subtract and multiply polynomials; divide a polynomial by a polynomial of equal or lower degree. 9.2.3.7 Justify steps in generating equivalent expressions by identifying the properties used. Use substitution to check the equality of expressions for some particular values of the variables; recognize that checking with substitution does not guarantee equality of expressions for all values of the variables.
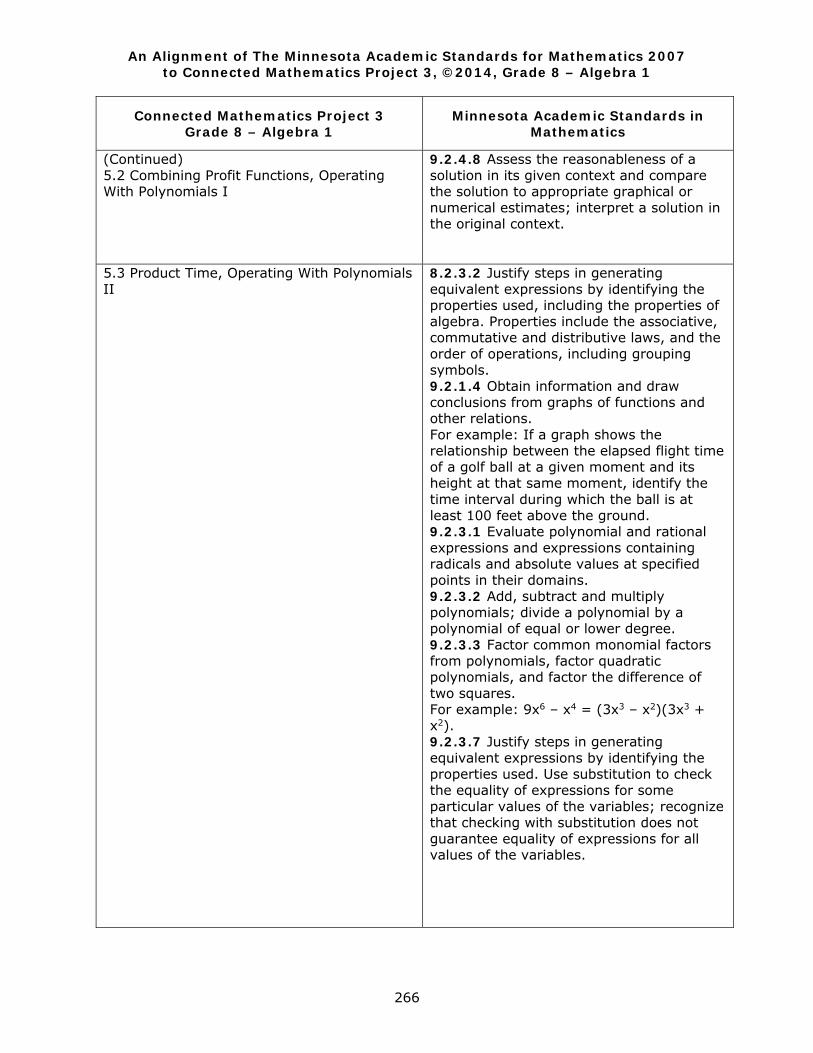
An Alignment of The Minnesota Academic Standards for Mathematics 2007 to Connected Mathematics Project 3, ©2014, Grade 8 – Algebra 1
266
Connected Mathematics Project 3 Grade 8 – Algebra 1
Minnesota Academic Standards in Mathematics
(Continued) 5.2 Combining Profit Functions, Operating With Polynomials I
9.2.4.8 Assess the reasonableness of a solution in its given context and compare the solution to appropriate graphical or numerical estimates; interpret a solution in the original context.
5.3 Product Time, Operating With Polynomials II
8.2.3.2 Justify steps in generating equivalent expressions by identifying the properties used, including the properties of algebra. Properties include the associative, commutative and distributive laws, and the order of operations, including grouping symbols. 9.2.1.4 Obtain information and draw conclusions from graphs of functions and other relations. For example: If a graph shows the relationship between the elapsed flight time of a golf ball at a given moment and its height at that same moment, identify the time interval during which the ball is at least 100 feet above the ground. 9.2.3.1 Evaluate polynomial and rational expressions and expressions containing radicals and absolute values at specified points in their domains. 9.2.3.2 Add, subtract and multiply polynomials; divide a polynomial by a polynomial of equal or lower degree. 9.2.3.3 Factor common monomial factors from polynomials, factor quadratic polynomials, and factor the difference of two squares. For example: 9x6 – x4 = (3x3 – x2)(3x3 + x2). 9.2.3.7 Justify steps in generating equivalent expressions by identifying the properties used. Use substitution to check the equality of expressions for some particular values of the variables; recognize that checking with substitution does not guarantee equality of expressions for all values of the variables.
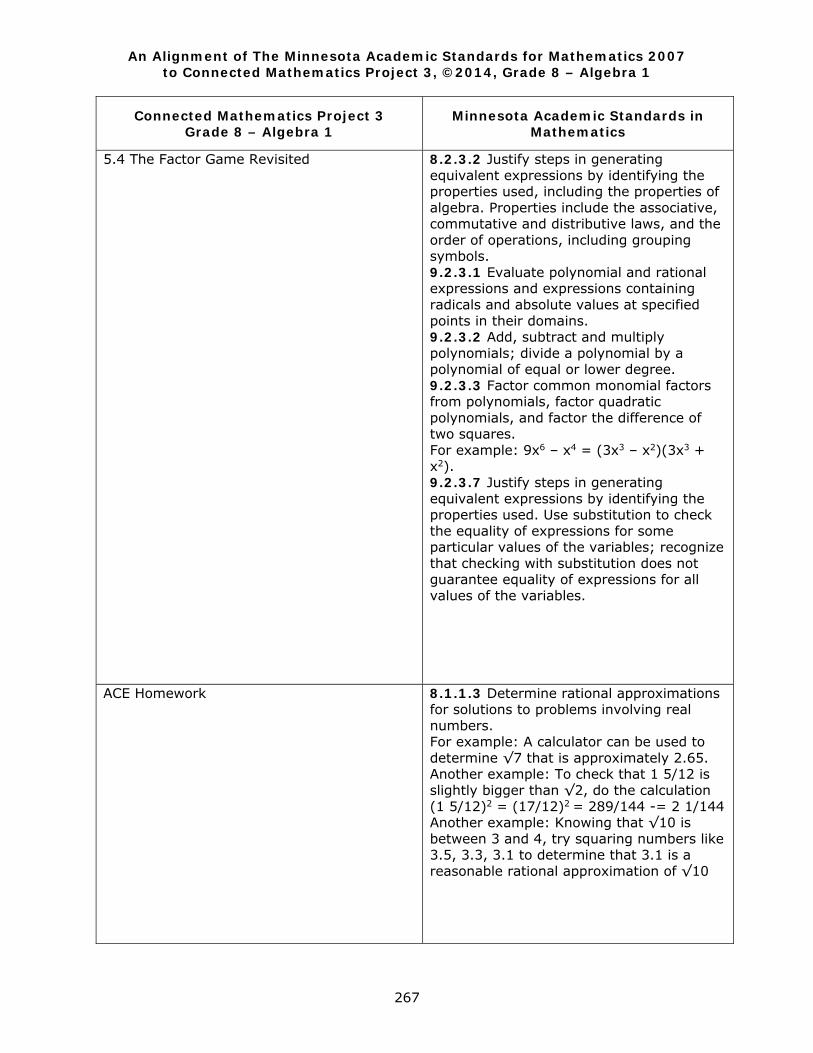
An Alignment of The Minnesota Academic Standards for Mathematics 2007 to Connected Mathematics Project 3, ©2014, Grade 8 – Algebra 1
267
Connected Mathematics Project 3 Grade 8 – Algebra 1
Minnesota Academic Standards in Mathematics
5.4 The Factor Game Revisited 8.2.3.2 Justify steps in generating equivalent expressions by identifying the properties used, including the properties of algebra. Properties include the associative, commutative and distributive laws, and the order of operations, including grouping symbols. 9.2.3.1 Evaluate polynomial and rational expressions and expressions containing radicals and absolute values at specified points in their domains. 9.2.3.2 Add, subtract and multiply polynomials; divide a polynomial by a polynomial of equal or lower degree. 9.2.3.3 Factor common monomial factors from polynomials, factor quadratic polynomials, and factor the difference of two squares. For example: 9x6 – x4 = (3x3 – x2)(3x3 + x2). 9.2.3.7 Justify steps in generating equivalent expressions by identifying the properties used. Use substitution to check the equality of expressions for some particular values of the variables; recognize that checking with substitution does not guarantee equality of expressions for all values of the variables.
ACE Homework
8.1.1.3 Determine rational approximations for solutions to problems involving real numbers. For example: A calculator can be used to determine √7 that is approximately 2.65. Another example: To check that 1 5/12 is slightly bigger than √2, do the calculation (1 5/12)2 = (17/12)2 = 289/144 -= 2 1/144 Another example: Knowing that √10 is between 3 and 4, try squaring numbers like 3.5, 3.3, 3.1 to determine that 3.1 is a reasonable rational approximation of √10
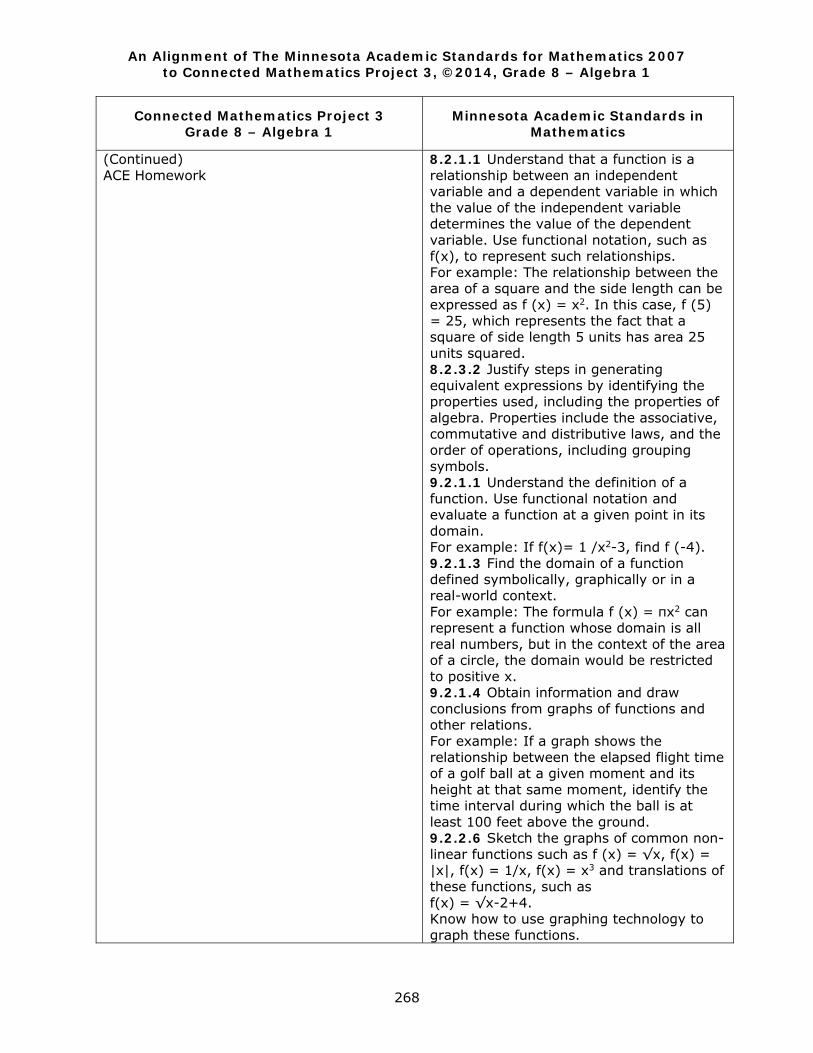
An Alignment of The Minnesota Academic Standards for Mathematics 2007 to Connected Mathematics Project 3, ©2014, Grade 8 – Algebra 1
268
Connected Mathematics Project 3 Grade 8 – Algebra 1
Minnesota Academic Standards in Mathematics
(Continued) ACE Homework
8.2.1.1 Understand that a function is a relationship between an independent variable and a dependent variable in which the value of the independent variable determines the value of the dependent variable. Use functional notation, such as f(x), to represent such relationships. For example: The relationship between the area of a square and the side length can be expressed as f (x) = x2. In this case, f (5) = 25, which represents the fact that a square of side length 5 units has area 25 units squared. 8.2.3.2 Justify steps in generating equivalent expressions by identifying the properties used, including the properties of algebra. Properties include the associative, commutative and distributive laws, and the order of operations, including grouping symbols. 9.2.1.1 Understand the definition of a function. Use functional notation and evaluate a function at a given point in its domain. For example: If f(x)= 1 /x2-3, find f (-4). 9.2.1.3 Find the domain of a function defined symbolically, graphically or in a real-world context. For example: The formula f (x) = πx2 can represent a function whose domain is all real numbers, but in the context of the area of a circle, the domain would be restricted to positive x. 9.2.1.4 Obtain information and draw conclusions from graphs of functions and other relations. For example: If a graph shows the relationship between the elapsed flight time of a golf ball at a given moment and its height at that same moment, identify the time interval during which the ball is at least 100 feet above the ground. 9.2.2.6 Sketch the graphs of common non-linear functions such as f (x) = √x, f(x) = |x|, f(x) = 1/x, f(x) = x3 and translations of these functions, such as f(x) = √x-2+4. Know how to use graphing technology to graph these functions.
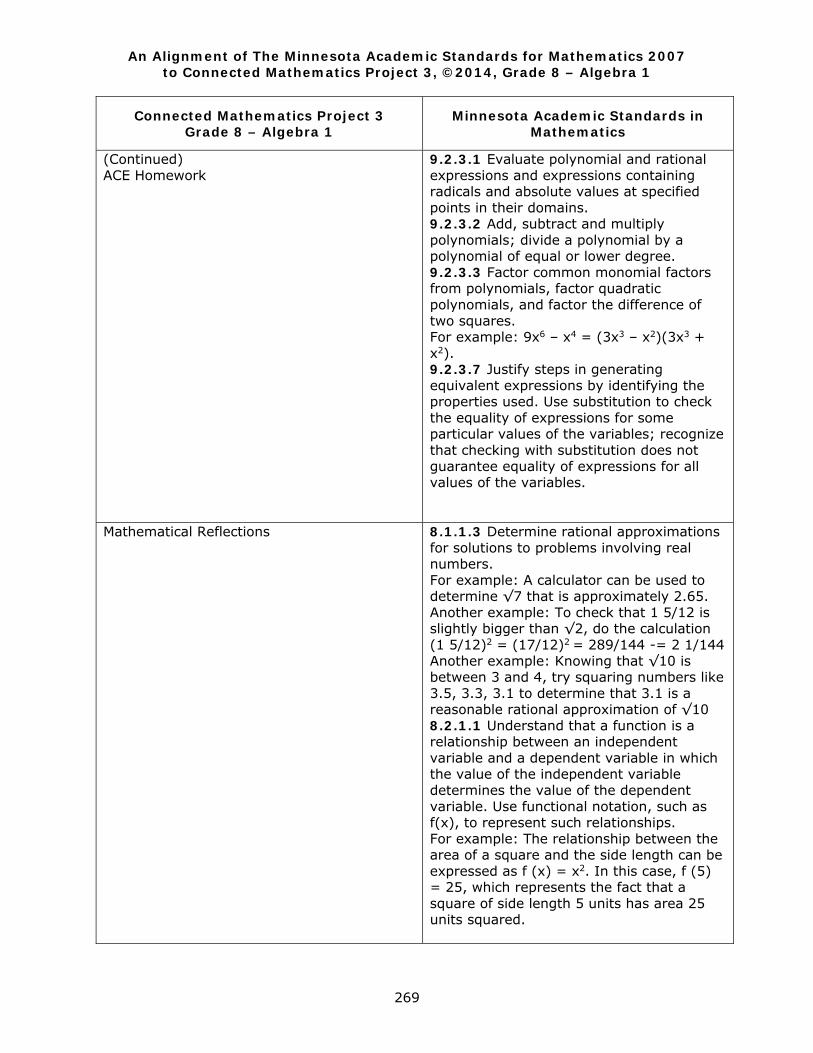
An Alignment of The Minnesota Academic Standards for Mathematics 2007 to Connected Mathematics Project 3, ©2014, Grade 8 – Algebra 1
269
Connected Mathematics Project 3 Grade 8 – Algebra 1
Minnesota Academic Standards in Mathematics
(Continued) ACE Homework
9.2.3.1 Evaluate polynomial and rational expressions and expressions containing radicals and absolute values at specified points in their domains. 9.2.3.2 Add, subtract and multiply polynomials; divide a polynomial by a polynomial of equal or lower degree. 9.2.3.3 Factor common monomial factors from polynomials, factor quadratic polynomials, and factor the difference of two squares. For example: 9x6 – x4 = (3x3 – x2)(3x3 + x2). 9.2.3.7 Justify steps in generating equivalent expressions by identifying the properties used. Use substitution to check the equality of expressions for some particular values of the variables; recognize that checking with substitution does not guarantee equality of expressions for all values of the variables.
Mathematical Reflections
8.1.1.3 Determine rational approximations for solutions to problems involving real numbers. For example: A calculator can be used to determine √7 that is approximately 2.65. Another example: To check that 1 5/12 is slightly bigger than √2, do the calculation (1 5/12)2 = (17/12)2 = 289/144 -= 2 1/144 Another example: Knowing that √10 is between 3 and 4, try squaring numbers like 3.5, 3.3, 3.1 to determine that 3.1 is a reasonable rational approximation of √10 8.2.1.1 Understand that a function is a relationship between an independent variable and a dependent variable in which the value of the independent variable determines the value of the dependent variable. Use functional notation, such as f(x), to represent such relationships. For example: The relationship between the area of a square and the side length can be expressed as f (x) = x2. In this case, f (5) = 25, which represents the fact that a square of side length 5 units has area 25 units squared.
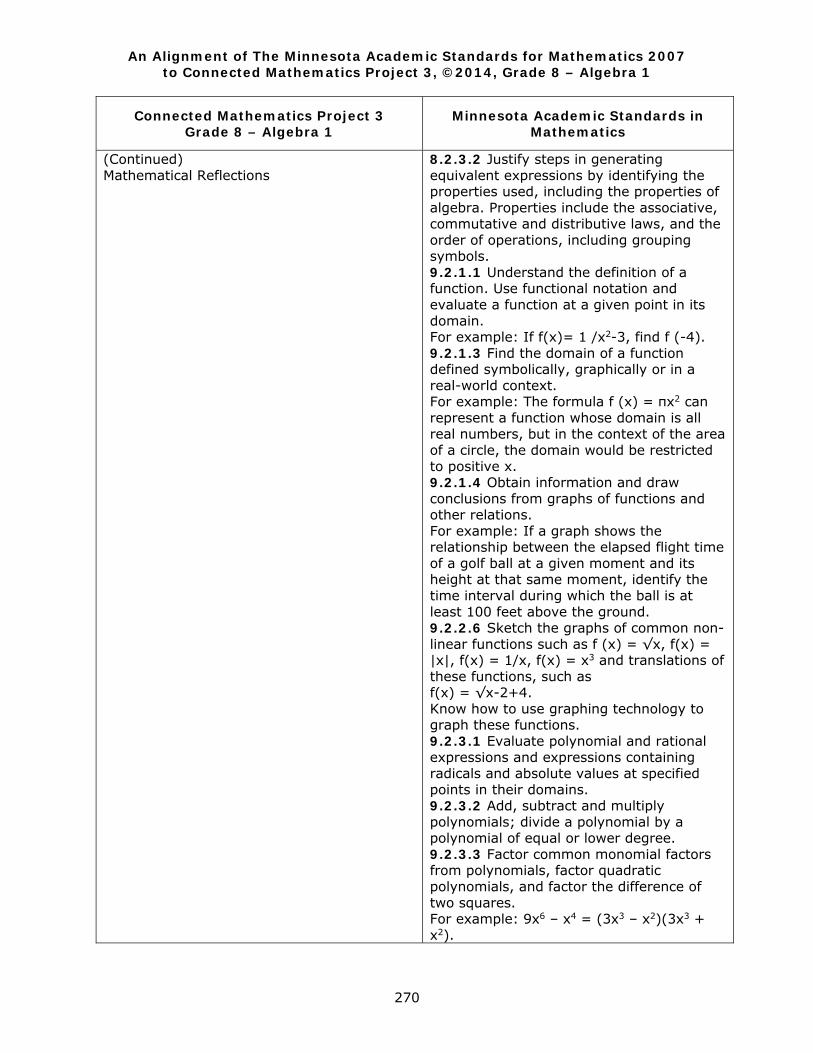
An Alignment of The Minnesota Academic Standards for Mathematics 2007 to Connected Mathematics Project 3, ©2014, Grade 8 – Algebra 1
270
Connected Mathematics Project 3 Grade 8 – Algebra 1
Minnesota Academic Standards in Mathematics
(Continued) Mathematical Reflections
8.2.3.2 Justify steps in generating equivalent expressions by identifying the properties used, including the properties of algebra. Properties include the associative, commutative and distributive laws, and the order of operations, including grouping symbols. 9.2.1.1 Understand the definition of a function. Use functional notation and evaluate a function at a given point in its domain. For example: If f(x)= 1 /x2-3, find f (-4). 9.2.1.3 Find the domain of a function defined symbolically, graphically or in a real-world context. For example: The formula f (x) = πx2 can represent a function whose domain is all real numbers, but in the context of the area of a circle, the domain would be restricted to positive x. 9.2.1.4 Obtain information and draw conclusions from graphs of functions and other relations. For example: If a graph shows the relationship between the elapsed flight time of a golf ball at a given moment and its height at that same moment, identify the time interval during which the ball is at least 100 feet above the ground. 9.2.2.6 Sketch the graphs of common non-linear functions such as f (x) = √x, f(x) = |x|, f(x) = 1/x, f(x) = x3 and translations of these functions, such as f(x) = √x-2+4. Know how to use graphing technology to graph these functions. 9.2.3.1 Evaluate polynomial and rational expressions and expressions containing radicals and absolute values at specified points in their domains. 9.2.3.2 Add, subtract and multiply polynomials; divide a polynomial by a polynomial of equal or lower degree. 9.2.3.3 Factor common monomial factors from polynomials, factor quadratic polynomials, and factor the difference of two squares. For example: 9x6 – x4 = (3x3 – x2)(3x3 + x2).
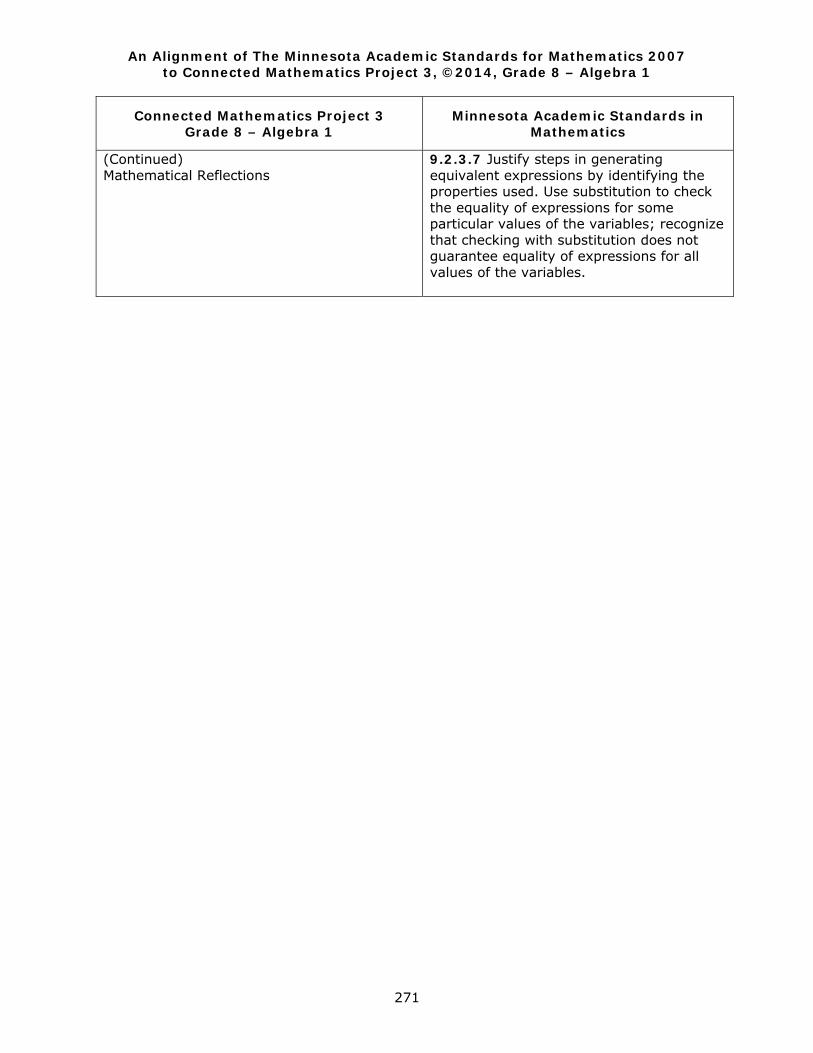
An Alignment of The Minnesota Academic Standards for Mathematics 2007 to Connected Mathematics Project 3, ©2014, Grade 8 – Algebra 1
271
Connected Mathematics Project 3 Grade 8 – Algebra 1
Minnesota Academic Standards in Mathematics
(Continued) Mathematical Reflections
9.2.3.7 Justify steps in generating equivalent expressions by identifying the properties used. Use substitution to check the equality of expressions for some particular values of the variables; recognize that checking with substitution does not guarantee equality of expressions for all values of the variables.