Embed Size (px)
Citation preview


Humanities & Social Sciences Reviews eISSN: 2395-6518, Vol 8, No 4, 2020, pp 984-998
https://doi.org/10.18510/hssr.2020.8495
984 |https://giapjournals.com/hssr/index © Wijaya et al.
IN-STORE BRAND COMMUNICATION: WHEN SHELF-SPACE AND
DISPLAY SEDUCE CONSUMERS Bambang Sukma Wijaya
1*, Muchsin Saggaff Shihab
2, Sheila Ayu Wijaya
3, Dudi Rudianto
4, Annie Sugandi
5
1*,2,3,4,5Researchers at the Faculty of Economics and Social Sciences, Bakrie University, Indonesia.
Email: 1*[email protected], [email protected], [email protected], [email protected], [email protected]
Article History: Received on 16th May 2020, Revised on 12th August 2020, Published on 11th September 2020
Abstract
Purpose of the study: This study aims at analyzing the role of shelf-space and display in stimulating impulse buying.
Further, this study also covers the comparison between all shelf positions (regular-shelf, Chiller, and wings-rack) to get
insights deeper into which one is the most effective in stimulating impulse buying.
Methodology: By highlighting the case of a beverage brand in a hypermarket in Indonesia, the recent study uncovers the
experiences and perceptions of 200 participants through an explanatory survey. The primary data collection has been
done by distributing survey questionnaires to 200 target respondents located in Jakarta. The data collected have been
analysed using SPSS software.
Main Findings: Both shelf-space and display factors are found to have a positive and significant effect on impulse
buying, where the former is found dominant. Various constructs in shelf-space such as the spaciousness-of-shelf,
highness-of-traffic, largeness-of-shelf, easiness in finding the shelf, and in-store display communications such as the
attractiveness-of-color, cleanness-of-display, neatness-of-display arrangement, the blocking-space, and the
attractiveness-of-product arrangement emerge validly. Of the three objects studied, the chiller had the highest
effectiveness compared to the regular-shelf and wings-rack in arousing the impulsivity of consumer purchases. This fact
shows that the appearance of cold drinks seems to have a significant effect on consumers in causing impulse buying,
especially for consumers in tropical countries like Indonesia. The seller or brand owner should consider this finding.
Applications of this study: This study confirms the real, meaningful, and experiential visual power of in-store brand
communications. So the brand can explore creatively and ergonomically as well as maximizing the potentials of visual
communication, especially shelf-space and display in sales spaces as silent sellers.
Novelty/Originality of this study: Few studies still pay attention to the role of in-store brand communications in
encouraging impulse buying, especially in an era where the virtual shopping world is increasingly distracting researchers
and marketers from the spark of communication events in the actual shopping space. This article proves how the
attractiveness of in-store brand communications through shelf-space and in-store displays has a significant impact on
impulse buying.
Keywords: Shelf-space Communication, Display Communication, In-store Branding, Retail Communication, Impulse
Buying, Impulsive Consumer.
INTRODUCTION
In marketing communications, the media plays an important role –regardless of its form, not only in conveying messages
to the consumer audience, but also creating a supportive atmosphere for purchasing decisions. Space in the shop is no
exception. Although online media is currently overgrowing and becoming a channel for many brands in stimulating
purchases (Westergaard, 2018) and attracting millenials (Hall, Towers & Shaw, 2017) as well as online market places
continue racing (Basul, 2019), the offline store and retail still have an allure. In addition to much inappropriate online
media regarding their reputation and behaviour (Wijaya, 2019) so it is risky for brand communication, offline or physical
shopping is considerably more 'comfortable' and 'safe' related to sensorial experiences, interpersonal communication, and
after-sales service (Vroom, 2016). Wei-yu and Zhen in Yu, Sun, and Guo (2019) suggest some concerns regarding
consumer preferences for in-store channels, including price, quality, comfort, accessibility, services provided, and
product variations, while Boardman and Mccormick (2018) suggest convenience and enjoyment as consumer
preferences for physical store channel, and convenience, selection, adventure/ exploration and idea shopping for the e-
commerce shopping channel.
This is a challenge for companies in selling and communicating their brands through shopping spaces, especially in retail
stores, which currently still exist in Indonesia. One company that consistently implements in-store brand communication
to increase sales is PT Amerta Indah Otsuka (AIO), particularly on its branded product, Pocari Sweat (PS). Achieving
the Top Brand Award 2020 by Frontier Consulting Group of Research Institute and Marketing Magazine with TBI (Top
Brand Index) 66,2% (Frontier, 2020), this to show that AIO is a concern to maintain its performance. The awarding was
based on three parameters; top of mind share, top of market share, and top of commitment share. Those tops of shares
are indicating that PS has already succeeded in gaining customer loyalty.
Regarding in-store communication, Bell and Ternus (2017) argue that the spectacular growth of shelf-space makes
merchandising as a critical element; it acts as the "silent seller" of the products in the stores. Merchandising is essential

Humanities & Social Sciences Reviews eISSN: 2395-6518, Vol 8, No 4, 2020, pp 984-998
https://doi.org/10.18510/hssr.2020.8495
985 |https://giapjournals.com/hssr/index © Wijaya et al.
due to its influence on product sales, especially in the mass commodity market, where self-service is the rule, and the
store becomes the main decision-making centre in the selection of the products. Furthermore, Johnen & Schnittka (2020)
see the proliferation of promotion activities nowadays has created a complicated situation. For some consumers, they felt
boring about the promotion promises, coupons, and other media, which weakening the buying intention. Johnen &
Schnittka (2020) suggest that retailers provide the point of purchase (POP), which is ideal for communicating its
products to customers. The examples of POP are by displaying the products, arranged the products neatly on the shelves,
keep the cleanliness, and give the product placement sign to make the customers quickly find the products.
Giving a brand more space on the shelf increases its visibility and the probabilities of being purchased (Hübner and
Schaal, 2017). According to Khare, Sadachar & Manchiraju (2019), perceived product availability can be a stimulus to a
purchase decision. That is why impulse purchases are more influenced by retail displays than are pre-planned purchases
(Akram et al., 2017) and eye-catching display/ spectacle can significantly influence sales (Parsad, Prashar & Sahay,
2017). Impulse purchases occur when a shopper suddenly buys something in a store, because of a sudden urge she
cannot refuse (Solomon, 2016), including encouragement by the in-store stimulus. This condition invites competition
among companies, not only for the introduction of their brands into the retailer's product range but also for better
positioning on the shelves (Yang et al., 2019; Düsterhöft, Hübner & Schaal, 2020). Companies are racing to get the best
positioning on the shelves and a higher value for their brands, along with stronger consumer loyalty. They want to
maximize the sales and profits of their products, and as such, always want more and better shelf-space only for their
products. Thus, displayed inventory has a positive effect on the sales of many retail items (Yang et al., 2019).
As one type of retail store, hypermarkets provide displays, which, if designed attractively, can change the purchase plan.
Therefore, display and shelf-space are crucial for brands. No matter how great the brands with mindshare, market share,
and even high heart-share (Wijaya, 2013), in hypermarkets, they are dealing with impulsive consumers who quickly
change their plans. Kartika, Rofiaty, and Rohman (2017) found that, in their study at a retail store in Indonesia, there is a
significant influence of hedonic shopping value on impulsive buying decisions and impulsive reaction, while
atmospheric outlets affect the impulse reaction and impulsive buying decisions. Hedonic consumers are low on need-
based buying, high on idea shopping, and have high-un-planned purchases. Yudiatantri & Nora (2019) also revealed that
a retailer could create an impulsive purchase by the store atmospheres, while Barros, et al. (2019) 's study showed the
effect of emotions on impulse purchase behaviour is stronger among collectivist consumers than among individualists.
However, those who can implement and set the retail atmospheres are the retailers themselves. Many companies only
have little control over the retail atmospheres because all of the retail atmospheres follow each retailer's policies.
Therefore, the ability of companies who want to involve in hypermarket is obviously by renting the provided shelves and
choosing the appropriate display.
In contrast, hypermarket also plays a vital role in distributing products to the final customers. Thus, observing the shelf-
space and other brand communication tools in hypermarket becomes crucial. This research focused on analysing brand
communication tools in Carrefour Hypermarket (CH) as the most significant contribution to PS sales among other
hypermarkets. This study was conducted in Jakarta, Indonesia, and took 200 respondents who purchase PS under
impulse buying behaviour in CH, to answer the following questions:
RQ1. Is the impulse buying behaviour could be stimulated with shelf-space communications by maximizing the
spaciousness of shelf, the highness of traffic, the largeness of shelf, and the easiness in finding the shelf?
RQ2. Is the impulse buying behaviour could be stimulated with the POP (display) communications through the
attractiveness of colour, the cleanness of display, the neatness of display arrangement, the blocking space of display
arrangement, and the attractiveness of product arrangement?
RQ3. What kind of (PS) shelf is the most influential in the in-store communication: regular shelf, Chiller, or wings-rack?
LITERATURE REVIEW
Shelf-Space Communication
It can be considering shelf-space as a form of advertising in putting products on top of consumer's minds and generally
suggesting product popularity levels (Belch & Belch, 2017; Sevilla & Townsend, 2016; Valenzuela & Raghubir, 2015).
Shelf-space may also affect demand by reducing consumer search costs. According to Flamand, Ghoniem & Maddah,
(2016), giving a product category or a particular brand more space on the shelf increases its visibility and, therefore, the
probabilities of purchasable. From the definitions above, shelf visibility in this research is defined as the degree of shelf
placement to be seen. Furthermore, based on Mothersbaugh, Hawkins, & Kleiser (2019), research generally supports the
idea that more shelf-space and in-store displays increase sales. Shelf-space and display under in-store stimuli divided
into three categories, namely: 1) normal-display, regular shelf-space, 2) expanded display, double the regular shelf-space
allocation, and 3) special-display, regular shelf-space plus special end-of-aisle or within-aisle product arrangement.
Nielsen's research, as cited by Thompson (2017), confirms that "distribution has a near-perfect correlation with sales
volume and there is a lot of pressure for your product to be on the right retailer's shelves across channels while
maximizing presence in the store" (p.1). Not surprising, because shelf facings impact the effects of price and case pack

Humanities & Social Sciences Reviews eISSN: 2395-6518, Vol 8, No 4, 2020, pp 984-998
https://doi.org/10.18510/hssr.2020.8495
986 |https://giapjournals.com/hssr/index © Wijaya et al.
quantity on market share (Kwak, et al., 2020). Therefore, retailers can increase sales by reducing costs through proper
product management on the shelf (Karampatsa et al., 2017). Shelf-space in a retail environment is an important
strategic tool that increases the likelihood of products to be seen and sold (Pizzi & Scarpi, 2016). Optimization of shelf-
space also results in an estimate of elasticity that is greater than the reduction in shelf-space, thereby emphasizing the
application of shelf-space variations as a useful marketing tool (Sevilla & Townsend, 2016; Andrews & Shimp (2017)).
Both retailers and manufacturers must realize that the number of product brands and trade promotions is increasing day
by day. Still, the shelf-space remains the same; thus, products that are not noticed will certainly not be sold (Wastlund,
Shams & Otterbring, 2018). Therefore, retailers can optimize shelf-space allocation across stores to maximize product
visibility to consumers, thereby stimulating impulsive purchases. Nielsen advises suppliers (and also manufacturers) to
continually monitor consumer preferences regarding shelf space in the store (Thompson, 2017). Because manufacturers/
suppliers depend on retailers for shelf-space (Witek-Hajduk & Zaborek, 2020), cooperation and good relations between
suppliers/ manufacturers and retailers are needed (Maelen, Breugelmans & Cleeren, 2017). In addition to increasing the
level of customer satisfaction (Danmei, 2016), the integration of marketing activities and supply chain processes both
within and throughout the company also increase market share (Zhao, et al., 2020).
It is also essential to pay attention to the shelf-space layout. Usually, each rack is partitioned into adjacent rack segments
that have different customer traffic densities. Retailers seek to assign each group of product categories to the shelf, to
determine the total rack space allocated within the given lower/ upper limit (Flamand, et al., 2016). Previous research
shows there is a correlation between position and layout of shelf-space with consumer perception. Consumers believe
popular products place on middle shelves, expensive products on top shelves, and promoted products on the extremes of
a display (Valenzuela, Raghubir & Mitakakis, 2013). This vertical placement implies that the product at the top is
considered to have a higher value than the product at the bottom (Valenzuela & Raghubir, 2015). Thus, if customers are
looking for premium products, visual attention is often directed upward (Deng, et al., 2016).
There are on-shelf and off-shelf merchandising space (Andrews & Shimp, 2017). On-shelf is the regular shelf-space,
while off-shelf-space is in a gondola or an end-of-aisle display. In this research, the terminology applied by PS Key
Account Management has slightly different from Andrews & Shimp (2017). They divide shelf-space terminology in CH
into two categories: 1) regular display; regular shelf-space --for example, regular shelf and chiller, 2) extra-display;
additional shelf-space (it is more visible and accessible) --for instance, wings-rack, gondola shelf, and cashier shelf. PS
occupies three types of shelf-space in CH, which is a regular shelf, Chiller, and wings-rack. Each shelf position has its
characteristics and benefits to stimulate impulse buying. The regular shelf is located in the drinks category, especially in
the isotonic drinks category. CH provides 50% of the total regular shelf-space of isotonic drinks to PS. PS displayed the
whole complete product range on a regular shelf and occupied a larger shelf than the standard given size by CH. Usually,
people who want to stock up PS can take the product from a regular shelf because it is offering full sizes and product
bundling or in a box package.
Figure 1: Regular Shelf of PS in CH
Source: research doc.
The second type of shelf is the Chiller. This type of shelf is displaying the product for those who are looking for cool
drinks. PS is placed together with other drinks brands inside the Chiller.

Humanities & Social Sciences Reviews eISSN: 2395-6518, Vol 8, No 4, 2020, pp 984-998
https://doi.org/10.18510/hssr.2020.8495
987 |https://giapjournals.com/hssr/index © Wijaya et al.
Figure 2: PS inside the Chiller in CH
Source: research doc.
Last, the wings-rack is the extra display, which is hanging on the regular shelf next to the cash register. PS is available in
1 wings-rack position in each CH. Wings-rack is especially only offering PS and only providing the bottle 500ml.
Figure 3: PS Wings-rack in CH
Source: research doc.
PS Key Account Management uses merchandise concepts to describe shelf-space management. Merchandising,
according to them, is all activities at the new account outlet to make the best possible display of moving the product
faster. Besides, merchandising is also defined as all activities related to the structuring of products and accessories at the
outlet. It influences consumers to buy products, creates impulse buying, and the easiness of finding the products, as well
as provides a lot of alternative products to be chosen by consumers. Merchandising also helps in getting a good position,
minimizes out of stock, increases brand share, increases sales, and, finally, increases new store profit.
The empirical study by Drèze et al. (in Gidlöf et al., 2017) concluded that shelf-space management in the consumer
goods industry shows there are several non-price factors that influence the demand for a displayed product item. They
include the thing as 1) the item's shelf-location within a display, 2) shelf facing area is showy, 3) aesthetic elements of its
array such as size and colour coordination, related to display orientations of its packaging.
Meanwhile, regarding the effect of in-store marketing on both attention and choice, the best way to sell products at that
vital point-of-purchase interface is to be sure that the product is in the consumer's face (Chandon et al. in Kumar, Anand
& Song, 2017). If the products placed at the top of the shelf, it increases the percentage of people who see the products
20%. It also maximizes (the likelihood of) consumers by the same amount to choose the brand. They also found that
products are more seeable and buyable when they are in the middle of a shelf placement and when the number of facing
the product increased. The statistic rely on the real evaluation of human shoppers making purchase decisions while the

Humanities & Social Sciences Reviews eISSN: 2395-6518, Vol 8, No 4, 2020, pp 984-998
https://doi.org/10.18510/hssr.2020.8495
988 |https://giapjournals.com/hssr/index © Wijaya et al.
location of their eyes is trackable. If the product is bright and visible, people will see it, but people also make inferences
about a brand relative to where it places on the shelf. In other words, shelf placement can have an impact on the way
customers perceive a brand. They also found that shelf placement can attract new customers to a brand. If a company is
targeting young people or educated people with an open mind who do not buy just based on brand or based on price,
shelf placement will increase the effectiveness of this 'visual equity.' Spending some of the marketing money at the point
in the store where people decide will help increase brand awareness and visibility and perhaps even brand image. The
point-of-purchase is not just a distribution tool; it is a communication tool. The finding indicates that companies are
going to get a better return on marketing investment when they try to make their brand more visible.
POP (Display) Communication
POP (Point-of-Purchase) is the display that allows a retailer to remind customers and stimulate impulse purchases. Not
always being supplied by retailers, sometimes the displays are provided by manufacturers. POP promotion consists of in-
store displays designed to lift sales. The display may remind customers, stimulate impulse behaviour, and facilitate self-
service (Akram et al., 2017). According to Andrews & Shimp (2017), POP materials influence consumers in three
general ways, that are by 1) informing (POP's most basic communications function. Signs, posters, displays, in-store
advertisements, and other POP materials alert consumers to specific items and provide potentially useful information), 2)
reminding (this role serves to complement the job already performed by advertising before the consumer enters a store),
and 3) encouraging (effective POP materials influence product and brand choices at the point of purchase and encourage
impulse buying).
Attractive store displays are an essential determinant of impulse buying among consumers (Ali and Hasnu, 2013). There
is a significant relationship between attractive store displays and impulse buying. It shows that visuals of product
displays develop impressions at the first sight-pushing shopper to buy that product. In other words, attractive store
displays create an image in the minds of shoppers, thus making them buy that product emotionally. Moreover, these
displays make the shopping environment exciting for shoppers to purchase things with pleasant experiences.
Meanwhile, Bhatt, Sarkar & Sarkar (2020) revealed attractive store stimuli predict affective and sensory store brand
experiences, whereas the facilitating store stimuli moderate the effects of attractive store stimuli on affective and sensory
store brand experiences. Meanwhile, the affective and sensory store brand experiences predict store satisfaction.
Attractive stimuli –were those cues that attracted attention, exciting the participant, and eliciting approach behaviours.
The specific signals in this category were lighting, sound, space, colour, layout, product display features, and design
features. However, on the company's perspective, only colour, product display features, and design features that could be
applied. The others are from the retailer's policies.
Impulse Buying Behaviour
Sharma et al. in Aragoncillo and Orus (2018) define impulse buying as a sudden, attractive, and hedonic purchasing
behavior in which the speed of impulsive buying decisions precludes thoughtful and deliberate judgment of alternatives
or future implications. The impulse buying is a spontaneous desire to act, accompanied by urgency. It is a state of
psychological disequilibrium in which a person can feel temporarily out of control, the onset of conflict and struggle that
is resolved by immediate action, minimal objective evaluation exists –emotional considerations dominate, and lack of
regard for consequences. Meanwhile, Rook in Kartika et al. (2017) identifies some characteristics of impulse buying,
namely: a) spontaneity, since the impulse buying is unexpected; it arises spontaneously and urges the consumer to buy
now, b) power, compulsive, and intensity, where psychological motivation stimulates the needs to act quickly,
compulsive, and intense, c) desire and stimulation since the motivation to buy can be a source of personal happiness and
under several levels each consumer. The sudden compulsive to buy is usually attached to consumer emotion, for
example, desirable, arousal, or wild.
Impulse purchases arise when consumers buy products they had not planned on buying before entering a store (Akram
et al., 2017). There are three kinds of impulse shopping: 1) completely un-planned (before coming into contact with a
retailer, a consumer has no intention of purchasing a goods or service category), 2) partially un-planned (before coming
into contact with a retailer, a consumer has decided to buy in a product category but has not chosen a brand), 3) un-
planned substitution (a consumer intends to buy a specific brand of goods or service but changes his or her mind about
the brand after coming into contact with a retailer). Retail displays are influencing more impulse purchases than pre-
planned purchases (Akram et al., 2017) so that consumers may make un-planned or impulse purchases. Large
percentages of consumers do not look at ads before shopping, do not prepare shopping lists one in stores, and make
wholly un-planned purchases. Hence, it can be assumed that:
H1. The shelf-space (indicated by the spaciousness of the shelf, the highness of traffic, the largeness of shelf, and the
easiness to find the shelf) significantly and positively drive the impulse buying behaviour (of PS in the CH)
H2. The display (indicated by the attractiveness of colour, the cleanness of display, the neatness of display arrangement,
the blocking space of display arrangement, and the attractiveness of product arrangement) significantly and positively
urge the impulse buying behaviour (of PS in the CH)

Humanities & Social Sciences Reviews eISSN: 2395-6518, Vol 8, No 4, 2020, pp 984-998
https://doi.org/10.18510/hssr.2020.8495
989 |https://giapjournals.com/hssr/index © Wijaya et al.
METHODOLOGY
Sampling and data collection
Self-administered questionnaire is employed in the study for its various benefits such as efficiency, and low-cost. To
collect the data, the questionnaire were distributed to the target respondents who met the researchers’ criteria. A total of
200 respondents were obtained. According to Roscoe in Bougie & Sekaran (2019), sample sizes larger than 30 and less
than 500 are appropriate for most research. Further, there is a sample size formula from Tabachnick and Fidel in
Malhotra (2018): n > 50 +8m, where n = amount of sample, and m = a number of the independent variable. Thus, by
using the formula, while the independent variable is 2 (n > 50 + (8x2)), this research needs more than 66 respondents.
Hence 200 respondents regarded as a sufficient number to be the sample.
Using the Indonesian language (since all respondents are Indonesians), the statements in the questionnaire are
constructed to identify the shelf-space, display, and shelf position abilities, as well as respondents' characteristics. Due to
this research aims at revealing the effects on impulse buying so that the questions opened with 2 (two) screening
questions. The first is, "Have you ever bought PS in CH Jakarta?"
If the respondents filled "Yes," they could continue to the next questions, if not, they should stop filling the
questionnaire. This research will be valid if the respondents have the experience of buying PS in CH Jakarta. The second
screening question is, "Did you plan to buy PS before you go to CH Jakarta?"
If the respondents filled "No," they could continue to the next questions, if they filled "Yes," they should stop filling the
questionnaire. This research will be valid and per the research objective if the respondents are those who buy
impulsively. There was one respondent who answers "No" for the first question, and 17 respondents were answering
"Yes" for the second question. In total, 18 questionnaires were not proper to continue, which not passed the screening
questions. Further, before respondents filled the next questionnaires, they were being shown the shelf's pictures (regular-
shelf, Chiller, and wings-rack) as the explanation of shelf type in purpose to limit any misunderstanding.
Measurement
The questionnaire is composed based on five-point Likert scale, which is ranged from strongly disagree (1), to strongly
agree (5) in the questionnaire. The following table shows the details of operationalizing the concept of variables
describing indicators or constructs measured, and the units of measurement.
Table 1: Operationalizing Variables
Variable Variable Concept Indicator/
Construct
Unit of
Measure
Questionnaire
Codes
Shelf-Space
(X1)
Giving a product category or a
particular brand more space on the
shelf increases its visibility and,
therefore, the probabilities of it
being purchased (Flamand et al.,
2016)
More space
available
Available in a
variety of shelves
X.1.1
High traffic
areas
Shelves located in
high traffic areas
X.1.2
Large shelf
Shelves are large
X.1.3
Easiness to find
a product in the
shelves
Easy to find a
product in the
shelves
X.1.4
Display
(X2)
Attractive stimuli – were those
cues that attracted attention,
exciting the participant, and
eliciting approach behaviours
(Bhatt, Sarkar & Sarkar, 2020;
Ali and Hasnu, 2013; Noor, 2020)
Catchy colour The display shows
an eye-catching
color
X.2.1
Clean display The display looks
Clean
X.2.2
Blocking space
The display is
arranged in a
blocking space
X.2.3
Neat product
arrangement
The display is
arranged neatly
X.2.4
Attractive
product
arrangement
The display has an
attractive product
arrangement
X.2.5

Humanities & Social Sciences Reviews eISSN: 2395-6518, Vol 8, No 4, 2020, pp 984-998
https://doi.org/10.18510/hssr.2020.8495
990 |https://giapjournals.com/hssr/index © Wijaya et al.
Impulse
Buying
(Y1)
As a sudden, compelling, and
hedonic purchase behaviour
(Sharma et al. in Aragoncillo and
Orus, 2018), Rook in Kartika et al.
(2017) identifies some
characteristics of impulse buying,
namely spontaneity, power,
compulsive, and intensity, as well
as desire and stimulation
Spontaneously I buy
spontaneously
Y.1.1
Without thinking I buy without
thinking
Y.1.2
Just do it
"Just do it"
describes the way I
buy things
Y.1.3
I see it, I buy it
" I see it, I buy it"
describes the way I
buy things
Y.1.4
The emotion
attached to the
product
I buy things by
what I feel at the
moment
Y.1.5
Source: Research doc.
Reliability and Validity
Reliability refers to the extent to which a scale produces consistent results if making repeated measurements (Malhotra,
2018). This research will use the coefficient alpha or Cronbach's alpha. Cronbach's alpha is the average of all possible
split-half coefficients resulting from different ways of splitting the scale items; good results are between 0.6 and 1.0. An
essential property of coefficient alpha is that the value tends to increase with an increase in the number of scale items.
Prior to distributing the questionnaire to the total respondents, validity and reliability tests were employed using
statistical tools It was found that the Cronbach’s Alpha of shelf-space variable was 0.340, lower than 0.6. This is due to
some items in this variable had lower values less than 0.3494.
After deleting three questions, the shelf-space variable becomes reliable and the items in the questionnaire is valid, as
shown in Table 2 and Table 3. Three such issues are 1) X.1.2 "I easily find PS in line with my eye-level," 2) X.1.3 "PS
shelves locate in line with my eye-level," and 3) X. 14 "PS shelves locate in reachable areas even they are not in line
with my eye-level."
Table 2: Shelf-Space Reliability Statistics after Deleting 3 Questions
Cronbach's Alpha N of Items
.616 4
Source: Research doc.
Table 3: Shelf-Space's Construct-Total Statistics after Deleting 3 Questions
Scale Mean if
Item Deleted
Scale Variance if
Item Deleted
Corrected Item-
Total Correlation
Cronbach's Alpha
if Item Deleted
X.1.1 11.4375 2.060 .424 .545
X.1.5 10.8750 3.145 .402 .563
X.1.6 11.0938 2.475 .417 .529
X.1.7 10.7500 2.839 .407 .542
Source: Research doc.
Table 2 show that the Cronbach's alpha of shelf-space variable is 0.616 ˃ 0.6. Table 3 shows that all of the items in the
questionnaire are found valid; (see column Corrected item-total Correlation in Table 3; each item is ˃ 0.3494.
Meanwhile, the display and impulse buying variables have no problem with the validity and reliability tests or have
already passed the validity and reliability tests Cronbach's alpha of display variable is 0.673, while Cronbach's alpha of
impulse buying is 0.742).
FINDINGS AND DISCUSSIONS
Descriptive Analysis
Based on Table 4, for the first character, female respondents are 64% (128 respondents), and male respondents are 36%
(72 respondents). In this research, the female is dominating the respondents' characteristics; this could be due to the habit
of females to shop for the family, household, and personal needs. It is natural for females where they buy more than
males. It is in line with Skoloda (2009) that women control 85% of all consumer purchases. It is also in line with Saleem
(2012) that a female dominates people who hang out in the virtual world.

Humanities & Social Sciences Reviews eISSN: 2395-6518, Vol 8, No 4, 2020, pp 984-998
https://doi.org/10.18510/hssr.2020.8495
991 |https://giapjournals.com/hssr/index © Wijaya et al.
Table 4: Description of respondents
Description
Sex
(%)
Ag
e (%)
Ed
u. L
evel
(%)
Freq
. of
pu
rcha
se
(%)
Freq
. of
visit (%
)
Size
pu
rcha
sed
(%)
So
urce o
f
aw
aren
ess
(%)
Pro
du
ct
Kn
ow
ledg
e
(%)
Gender
Male 36.0
Female 64.0
Age
15-24 63.5
25-34 28.5
> 35 8.0
Education level
Senior High School 56.5
Diploma 4.0
Bachelor degree 37.0
Master/Doctoral 2.5
Frequency of Purchase PS per Visit to CH
1 bottle 58.0
2-3 bottles 34.5
4-6 bottles 5.0
> 6 bottles 2.5
Frequency of Visit to Carrefour
1 week 14.0
2 weeks 23.5
1 month 45.0
2 months 17.5
Size Most Frequently Purchased
Can 330ml 21.5
Bottle 350ml 32.0
Bottle 500ml 40.5
Bottle 900ml 2.0
Bottle 2L 4.0
Sachet 15gr 0.0
Source of Product Awareness
Friend(s) 11.9
Television 42.0
Billboard 8.4
Print media 10.3
Online media 5.9
Stores (hypermarket) 21.5
Product benefit Knowledge
Isotonic drink for all activities 79.5
Isotonic drink for sick people 1.0
Drinks for sport activity 7.0
General drinks for thirsty 12.5
Source: Research doc.
For the second character, the table demonstrates that 63.5% of respondents aged 15–24 years, 28.5% of respondents aged
25–34 years, and 8% of respondents aged ≥ 35 years. The questionnaires were mostly distributed online, where the
significant respondents' segment from the internet is young people. This finding is consistent with Geromel (2012) that
young people are spending disproportional time online. Geromel (2012) argued that people aged 15–24 spent their
33.1% total time online, while people aged 25–34 spent their 29.5% whole time online.
The third character is the education level. The table shows that 56.5% of the respondents' education level is Senior High
School, 4% of the respondents' education level is Diploma, 37% of the respondents' education level is Bachelor's Degree,
and 2.5% of the respondents' education level is Master/Doctoral Degree. The highest number of respondents' education
level is Senior High School. This fact is reasonable that most young people are still studying at University. Furthermore,

Humanities & Social Sciences Reviews eISSN: 2395-6518, Vol 8, No 4, 2020, pp 984-998
https://doi.org/10.18510/hssr.2020.8495
992 |https://giapjournals.com/hssr/index © Wijaya et al.
the second-highest number of respondents' education level is in the Bachelor's Degree. This insight is in line with
Saleem (2012) that the education level of people who hang out in the virtual world is dominated by some college and
then a college degree.
In the fourth character, the study indicates 58% of respondents bought one bottle PS when they visited CH, 34.5% of
respondents bought 2 -3 bottles, 10% of respondents bought 4 – 6 bottles, and 2.5% of respondents bought > 6 bottles.
This phenomenon is reasonable because, under impulse buying behaviour, people tended to satisfy their needs at that
time and did not intend to stock the product at home. There are 10% of respondents who bought 4–6 bottles. The cause
could be by a promotion event where PS offers product bundling packaging with four and six bottles.
The fifth character is the frequency of visits to CH. The table denotes that 14% of respondents usually visit CH every
week, 23.5% of respondents typically visit CH every two weeks, 45% of respondents generally visit CH every month,
and 17.5% of respondents usually visit CH every two months. The trend has shown that respondents visit CH monthly
for their household shopping, especially for family and personal needs.
Sixth, the table points out 21.5% of respondents frequently bought 330ml can packaging, 32% of respondents frequently
bought 350ml bottle, 40.5% of respondents frequently bought 500ml bottle, 2% of respondents frequently bought 900ml
bottle, 4% of respondents frequently bought 2Litre, and no respondent who frequently bought 15gr sachet. The highest
number of often purchase size is 500ml bottle, second is a 350ml bottle, and then 330ml can. The majority of
respondents choose the 500ml bottle because it is enough to satisfy their needs; also, the price is more competitive than
350ml bottle or 330ml can. People will be more advantaged with the bigger size from price value, but probably people
will not convenient carrying the bigger size, so the most frequently purchased is 500ml. Moreover, the bottle 500ml also
placed in the wings-rack, so its probability to choose higher than another size. No respondent was picking 15gr sachet.
Under impulse buying behaviour, people tend to satisfy their needs at the moment, so they want to drink PS at that time
after they bought it, then they have to mix it at home.
Meanwhile, for the seventh character, respondents were allowed to fill more than one answer. The result is, 11.9% of
respondents know PS from their friends, 42% of respondents know PS from television, 8.4% of respondents know PS
from the billboard, 10.3% of respondents know PS from print media (newspaper and magazine), 5.9% of respondents
know PS from online media (internet, Facebook, Twitter, and blog), and 21.5% of respondents know PS from stores
which sell PS (modern market and traditional market). The highest number of sources of product awareness is television.
It is reasonable that in Indonesia, TV has the most influential source of information. While a family gathers at home,
mostly they turn on the television as an entertainment or just to fulfil the voice emptiness. So, the most significant
probability of spreading product awareness information is from TV. It corresponds to Nielsen research about Indonesian
advertising expenditure during 2018-2019 in Wuryasti (2019) article that television is still being the media that has the
most significant portion of advertising expenditure, which is about 83%. The second source of product awareness is from
stores. It is reasonable that when people go to CH, they will have a probability to see PS on the shelves. It is in line with
Bell & Ternus (2017) that shelf-space makes merchandising as a critical element, it acts as the "silent seller" of the
products in the stores, especially in markets like the mass commodity, where shelf-space is the rule. The store
atmosphere becomes the main decision-making trigger in the selection of the products.
Last, this study uncovers 79.5% of respondents agreed that PS benefit is to replenish body liquid for all activities, and
1% of respondents answered that PS benefit is to replace body liquid for sick people. Meanwhile, 7% of respondents
answered that PS benefit is to replenish body liquid for sport, and 12.5% of respondents answered that PS benefit is as a
standard drinks brand to relieve thirstily. The major of respondents replied that the PS benefit is to replenish body liquid
for all activities. This finding indicates that the respondents have learned the information about product benefits from the
PS Promotion Team and Advertising Division. The next significant respondents answered that PS benefit is as a standard
drink brand to relieve thirstily. According to the second answer, it indicates that the respondents who are highly buying
under impulsive behaviour because they did not know the real product benefit, and they just buy the product for
relieving thirsty.
Shelf-Space, Display and Impulse Buying
On the other hand, this study reveals 54.5% of respondents agreed that PS is available in a variety of shelves and 6.5% of
respondents answered strongly agree. It indicates that they were acknowledging that PS is available on various shelves.
In other words, this is in line with Flamand et al. (2016) that giving a product category or a particular brand more space
on the shelf increases its visibility and, therefore, the probabilities of purchasing. Meanwhile, there is 13.5% of
respondents who answered disagree, and 2.5% of respondents who responded strongly disagree. The rest 23% of
respondents have a neutral answer. This study also points out 61.5% of respondents agreed that PS shelves locate in high
traffic areas, and 13% of respondents answered strongly agree. This insight indicates that they decided that PS shelves
find in high traffic areas. Meanwhile, there is only 6% of respondents who answered disagree, and only 0.5% of
respondents who responded strongly disagree. The rest 19% of respondents have a neutral answer.

Humanities & Social Sciences Reviews eISSN: 2395-6518, Vol 8, No 4, 2020, pp 984-998
https://doi.org/10.18510/hssr.2020.8495
993 |https://giapjournals.com/hssr/index © Wijaya et al.
Table 5: Description of responses
No. Construct
Strongly
disagree
(%)
Disagree
(%)
Neutral
(%)
Agree
(%)
Strongly
disagree
(%)
Shelf-space
1. More space available 2.5 13.5 23.0 54.5 6.5
2. High traffic area 0.5 6.0 19.0 61.5 13.0
3. Large size 1.0 10.0 24.0 58.0 7.0
4. Easiness to find product in the selves 0.5 6.5 11.5 69.5 12.0
Display
5. Catchy colour 1.0 7.5 23.0 59.5 9.0
6. Clean display 0.0 0.3 16.0 66.0 16.0
7. Blocking space 0.0 0.5 23.5 58.5 13.0
8. Neat product arrangement 0.0 0.5 14.5 65.0 15.5
9. Attractive product arrangement 1.0 5.5 31.5 46 16
Impulse buying
10 Spontaneously 1.0 3.5 15.0 62 18.5
11. Without thinking 1.0 14.5 22.5 51.0 11.0
12. “Just do it” way 0.5 8.0 24.5 55.5 11.5
13. "I see, I buy it" way 2.0 8.5 18.5 56.5 14.5
14. The emotion attached 1.0 2.5 16.0 68.0 12.5
Source: Research doc.
Another finding, as shown in Table 5, 58% of respondents agreed that PS have large shelves, and 7% of respondents
answered strongly agree. Meanwhile, there is 10% of respondents who answered disagree, and only 1% of respondents
who responded strongly disagree. The rest 24% of respondents have a neutral answer. The table also sounds that 69.5%
of respondents agreed that PS, which provided on the shelves, is easy to find, and 12% of respondents answered strongly
agree. It indicates their experience in finding products quickly on store shelves. Flamand et al. (2016) 's research also
concluded that giving a product category or a particular brand more space on the shelf increases its visibility and,
therefore, the probabilities of purchasing.
Similarly, there are 59.5% of respondents agreed that PS display shows an eye-catching color, and 9% of respondents
answered strongly agree. It indicates that they decided that PS has a popular color. According to some respondent's
comments, while filling the questionnaires, they admitted that PS has an identical blue color, which makes the products
visible. In other words, PS that has a catchy color is attractive. Besides, 66% of respondents agreed that PS has a clean
display, and 16% of respondents answered strongly agree. It shows that PS has succeeded in building perceptions of the
cleanliness of product display areas through excellent display communication.
Other data revealed in Table 5 are 58.5% of respondents agreed that PS is in a blocking space, and 13% of respondents
answered strongly agree. While 65% of respondents agreed that PS has a neat product arrangement, and 15.5% of
respondents responded strongly agree. Furthermore, 46% of respondents also agreed that PS has an attractive product
arrangement, and 16% of respondents answered strongly agree. Unfortunately, there are still 31.5% of respondents who
cannot decide whether PS product arrangement in CH is attractive enough or not. This fact could be that respondents
have experience seeing other product arrangements that are more attractive than PS display.
Regarding impulsive behavior, the table denotes that 62% of respondents agreed that they buy PS spontaneously, and
18.5% of respondents answered strongly agree. It is consistent with the answers of 51% of respondents who decided that
they buy PS without thinking, and 11% of respondents responded strongly agree. Meanwhile, 55.5% of respondents
agreed that "Just Do It" describes the way they buy PS, and 11.5% of respondents answered strongly agree. On the other
hand, 56.5% of respondents agreed that "I See It, I Buy It" describes the way they buy PS, and 14.5% of respondents
responded strongly agree. Likewise, 68% of respondents agreed that they buy PS according to what they feel at that
moment, and 12.5% of respondents answered strongly agree. This phenomenon points out the role of feelings and mood
while at the point of purchase of the product. Excellent visual communication can build a more comfortable atmosphere
for prospective buyers. Ali and Hasnu's study (2013) also provides an overview of how the construct "I buy things
according to how I feel at the moment" is the most crucial statement in measuring the impulse buying tendency of
consumers. This result shows consumers' attitude towards impulse buying is mostly occurring due to the emotions they
attach with products while shopping.
Are consumers really seduced impulsively by shelf-space communication?
The shelf-space variable has a positive effect and significance to stimulate impulse buying for PS products (H1
accepted). It is relying on the T-Test in Table 6, with the significance value is 0.000. This acceptance of the hypothesis
means that more space available, shelves located in high traffic areas, shelves have the larger sizes, and the easiness to
Humanities & Social Sciences Reviews eISSN: 2395-6518, Vol 8, No 4, 2020, pp 984-998
https://doi.org/10.18510/hssr.2020.8495
994 |https://giapjournals.com/hssr/index © Wijaya et al.
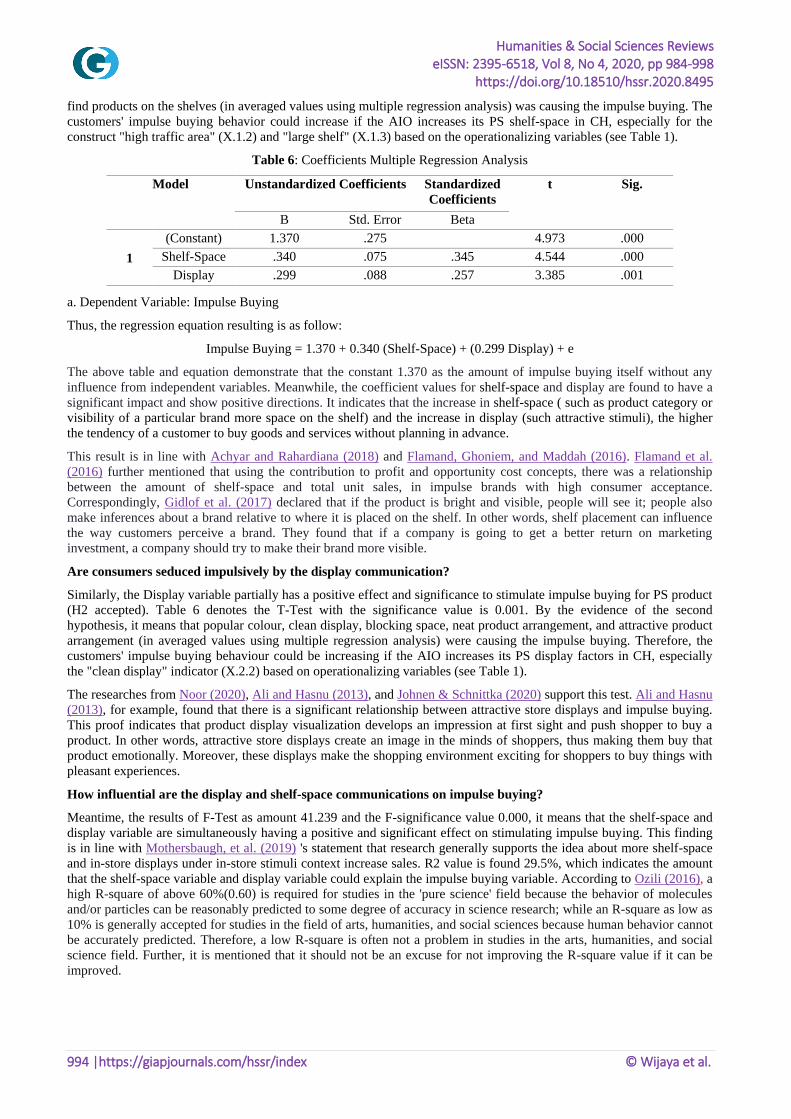
find products on the shelves (in averaged values using multiple regression analysis) was causing the impulse buying. The
customers' impulse buying behavior could increase if the AIO increases its PS shelf-space in CH, especially for the
construct "high traffic area" (X.1.2) and "large shelf" (X.1.3) based on the operationalizing variables (see Table 1).
Table 6: Coefficients Multiple Regression Analysis
Model Unstandardized Coefficients Standardized
Coefficients
t Sig.
B Std. Error Beta
1
(Constant) 1.370 .275 4.973 .000
Shelf-Space .340 .075 .345 4.544 .000
Display .299 .088 .257 3.385 .001
a. Dependent Variable: Impulse Buying
Thus, the regression equation resulting is as follow:
Impulse Buying = 1.370 + 0.340 (Shelf-Space) + (0.299 Display) + e
The above table and equation demonstrate that the constant 1.370 as the amount of impulse buying itself without any
influence from independent variables. Meanwhile, the coefficient values for shelf-space and display are found to have a
significant impact and show positive directions. It indicates that the increase in shelf-space ( such as product category or
visibility of a particular brand more space on the shelf) and the increase in display (such attractive stimuli), the higher
the tendency of a customer to buy goods and services without planning in advance.
This result is in line with Achyar and Rahardiana (2018) and Flamand, Ghoniem, and Maddah (2016). Flamand et al.
(2016) further mentioned that using the contribution to profit and opportunity cost concepts, there was a relationship
between the amount of shelf-space and total unit sales, in impulse brands with high consumer acceptance.
Correspondingly, Gidlof et al. (2017) declared that if the product is bright and visible, people will see it; people also
make inferences about a brand relative to where it is placed on the shelf. In other words, shelf placement can influence
the way customers perceive a brand. They found that if a company is going to get a better return on marketing
investment, a company should try to make their brand more visible.
Are consumers seduced impulsively by the display communication?
Similarly, the Display variable partially has a positive effect and significance to stimulate impulse buying for PS product
(H2 accepted). Table 6 denotes the T-Test with the significance value is 0.001. By the evidence of the second
hypothesis, it means that popular colour, clean display, blocking space, neat product arrangement, and attractive product
arrangement (in averaged values using multiple regression analysis) were causing the impulse buying. Therefore, the
customers' impulse buying behaviour could be increasing if the AIO increases its PS display factors in CH, especially
the "clean display" indicator (X.2.2) based on operationalizing variables (see Table 1).
The researches from Noor (2020), Ali and Hasnu (2013), and Johnen & Schnittka (2020) support this test. Ali and Hasnu
(2013), for example, found that there is a significant relationship between attractive store displays and impulse buying.
This proof indicates that product display visualization develops an impression at first sight and push shopper to buy a
product. In other words, attractive store displays create an image in the minds of shoppers, thus making them buy that
product emotionally. Moreover, these displays make the shopping environment exciting for shoppers to buy things with
pleasant experiences.
How influential are the display and shelf-space communications on impulse buying?
Meantime, the results of F-Test as amount 41.239 and the F-significance value 0.000, it means that the shelf-space and
display variable are simultaneously having a positive and significant effect on stimulating impulse buying. This finding
is in line with Mothersbaugh, et al. (2019) 's statement that research generally supports the idea about more shelf-space
and in-store displays under in-store stimuli context increase sales. R2 value is found 29.5%, which indicates the amount
that the shelf-space variable and display variable could explain the impulse buying variable. According to Ozili (2016), a
high R-square of above 60%(0.60) is required for studies in the 'pure science' field because the behavior of molecules
and/or particles can be reasonably predicted to some degree of accuracy in science research; while an R-square as low as
10% is generally accepted for studies in the field of arts, humanities, and social sciences because human behavior cannot
be accurately predicted. Therefore, a low R-square is often not a problem in studies in the arts, humanities, and social
science field. Further, it is mentioned that it should not be an excuse for not improving the R-square value if it can be
improved.

Humanities & Social Sciences Reviews eISSN: 2395-6518, Vol 8, No 4, 2020, pp 984-998
https://doi.org/10.18510/hssr.2020.8495
995 |https://giapjournals.com/hssr/index © Wijaya et al.
Table 7: Model Summary R2
Model R R Square Adjusted R
Square
Std. Error
of the
Estimate
1 .543a .295 .288 .47836
a. Predictors: (Constant), Display, Shelf-Space
Thus, to our points, other factors may be the potentials to improve impulse buying besides in-store brand
communications through shelf-space and display include discounts and offers, the influence of friends and relatives,
emotional stability, time availability, and money availability (Bhasin, 2019). While the study conducted by Seinauskiene
et al. (2016) found the cognitive and affective facets of impulse buying, are more related to materialism, subjective
wellbeing, and the compulsive buying tendencies. Other influence variables from the results of Thumer et al. (2020) 's
study which concluded that the presence of peers when shopping increases the impetus to buy, and this is greater when
the cohesiveness of peer groups is high and when they are vulnerable to social influence. Other studies, such as Zafar et
al. (2019) revealed that social media celebrities' posts have a significant impact on impulse buying. Pornpitakpan, Yuan
and Han (2017) proposed how salespersons' retail service quality and consumers' mood have a significant effect
on impulse buying.
Which shelf position is the best: regular shelf, Chiller, or wings-rack?
Responding RQ3, the paired T-Test results of the mean-value comparison show that the regular shelf mean-value is
3.3650, Chiller mean-value is 3.8300, and the Wings-rack mean-value is 2.9550 (see Table 8).
Table 8: Paired Samples Statistics
Mean N Std. Deviation
Std. Error
Mean
Pair 1 RegularShelf 3.3650 200 .97804 .06916
Chiller 3.8300 200 .90287 .06384
Pair 2 RegularShelf 3.3650 200 .97804 .06916
WingsRack 2.9550 200 .97351 .06884
Pair 3 Chiller 3.8300 200 .90287 .06384
WingsRack 2.9550 200 .97351 .06884
Accordingly, Chiller mean-value ˃ Regular Shelf mean-value ˃ Wings-rack mean-value. It indicates that Chiller, which
could make the products inside getting cold, is being most liked by the customers. It is common ways that people who
have already been doing activities, in this research context is shopping, will feel thirsty, and they have a significant
tendency to relieve dry with cold drinks. Notably, Indonesia is a tropical country. Studies show that isotonic beverages
may be more effective at retaining fluids and maintaining hydration status by up to 10% compared to distilled water
(Siow, Tan and Henry, 2017). Moreover, in cold conditions, the substances of isotonic drinks could easily and quickly be
absorbed by the digestive system. With the results of this test, the brand can stimulate consumers' impulse buying
through in-store display and shelf-space communications, especially in the chiller area in hypermarkets.
CONCLUSION
This study proves that in-store communications through shelf-space and display applications can increase consumers'
impulse buying when shopping at a hypermarket. The spaciousness of shelves, highness of traffic, and largeness of
shelves seem to be the main attraction for store visitors or consumers who want to shop at a store. Further factors are the
easiness in finding the shelf, the attractiveness of colour, the cleanness of display, the neatness of display arrangement,
the blocking space of display arrangement, and the attractiveness of product arrangement. Especially for beverage
products, it is undeniable that the chiller area is a favourite of visitors and can stimulate impulse buying behaviour.
Several previous studies support the results of this research; hence they contribute to the development of the concept of
in-store brand communications both verbally and visually.
LIMITATIONS AND FUTURE STUDY
More research on shelf-space and display from the company's view is needed, and it is due to lack of supporting research
about this, especially in developing countries like Indonesia. It will be better if there is experimental research, to study
shelf-space and display communications more profound. It will also be better to research shelf-space using planogram
science, which could explain the shelf-space in detail. For example, analyse how is the practical arrangement of the
products under the tier of a shelf, bay, or element of a shelf, shelving strategy, and decide the share of shelves. Besides,
further research could also discuss the shelf-space and display on stimulating impulse buying on a broader research area.
For example, in other beverage industries, FMCG industry, or different types of products, other types of in-store brand
communication tools, and other types of the modern market such as minimarkets and supermarkets.
Humanities & Social Sciences Reviews eISSN: 2395-6518, Vol 8, No 4, 2020, pp 984-998
https://doi.org/10.18510/hssr.2020.8495
996 |https://giapjournals.com/hssr/index © Wijaya et al.
ACKNOWLEDGMENT
This research received no funding from any institution. The authors would like to express sincere appreciation to
Carrefour Kuningan Jakarta and PT Amerta Indah Otsuka, which have facilitated the authors in distributing the
questionnaire to their consumers.
AUTHORS CONTRIBUTION
The first and second authors contributes to writing introduction, literature review, methodology, findings and discussion/
analysis, and revisions (as well as rewriting) based on reviewers' suggestions. The third author provides data collection
and data analysis. The fourth and fifth authors contribute to the reviewing and re-checking of the results of data analysis.
The authors jointly funded all costs in this study.
REFERENCES
1. Achyar, A. & Rahardiana, A. (2018). Analisis Pengaruh Visual Merchandising Pada Perilaku Impulse Buying:
Studi Merek H&M. Emerging Market: Business and Management Studies Journal, 6(1), 43-57.
https://doi.org/10.33555/ijembm.v6i1.105
2. Akram, U., Hui, P., Khan, M. K., Hashim, M. & Saduzai, S. K. (2017). Impulsive buying: a qualitative
investigation of the phenomenon. In Xu, J., Hajiyev, A. Nickel, S. & Gen, M. (eds), Proceeding of the Tenth
International Conference on Management Science and Engineering Management. Advances in Intelligent
System and Computing, 502. Springer. https://doi.org/10.1007/978-981-10-1837-4_112
3. Ali, A. & Hasnu, S. A. F. (2013). An Analysis of In-Store Shopping Environment on Consumers' Impulse
Buying: Evidence from Pakistan. International Conference on Management, Business Ethics, and Economics.
https://www.researchgate.net/publication/279460873
4. Andrews, J. G. & Shimp, T. A. (2017). Advertising, Promotion, and other aspects of Integrated Marketing
Communications, 10th edition. Cengage Learning.
5. Aragoncillo, L. and Orus, C. (2018). Impulse buying behaviour: an online-offline comparative and the impact
of social media. Spanish Journal of Marketing, 22(1), 42-62. https://doi.org/10.1108/SJME-03-2018-007
6. Barros, L.B.L., Petroll, M.d.L.M., Damacena, C. and Knoppe, M. (2019). Store atmosphere and impulse: a
cross-cultural study. International Journal of Retail & Distribution Management, 47(8), 817-
835. https://doi.org/10.1108/IJRDM-09-2018-0209
7. Basul, A. (2019, October 4). New analysis shows online marketplaces set to exceed $7 trillion by 2024. UKTN.
https://www.uktech.news/news/new-analysis-shows-online-marketplaces-set-to-exceed-%247-trillion-by-2024-
20190929
8. Belch, G. E. & Belch, M. A. (2017). Advertising and Promotion: An Integrated Marketing Communications
Perspective. !1th Edition. McGraw Hill.
9. Bell, J. & Ternus, K. (2017). Silent Selling: Best Practices and Effective Strategies in Visual
Merchandising, 5th Edition. Fairchild Books.
10. Bhasin, H. (2019, January 24). What Is Impulse Buying? What are the Factors Influencing Impulse Buying.
Marketing 91. https://www.marketing91.com/impulse-buying/
11. Bhatt, G., Sarkar, A. and Sarkar, J. G. (2020). Attractive and facilitating store atmospheric stimuli: Validating
the scales. International Journal of Retail & Distribution Management, 48(4), 363-
379. https://doi.org/10.1108/IJRDM-07-2018-0142
12. Boardman, R. & Mccormick, H. (2018). Shopping channel preference and usage motivations: Exploring
differences amongst a 50-year age span. Journal of Fashion Marketing and Management 22(2), 270-
284. https://doi.org/10.1108/JFMM-04-2017-0036
13. Bougie, R. & Sekaran, U. (2019). Research Methods for Business: A Skill Building Approach, 8th Edition. John
Wiley & Sons.
14. Danmei, H. (2016). Integration of Supply Chain Management and Marketing: A Case Study of a Swedish
Fashion Retailer. Thesis. University of Gothenburg.
15. Deng, X., Kahn, B. E., Unnava, H. R., and Lee, H. (2016). A "wide" variety: Effects of horizontal versus
vertical display on assortment processing, perceived variety, and choice. Journal of Marketing Research. 53(5),
682-698. https://doi.org/10.1509/jmr.13.0151
16. Düsterhöft, T., Hübner, A. & Schaal, K. (2020). A practical approach to the shelf-space allocation and
replenishment problem with heterogeneously sized shelves. European Journal of Operational Research,
282(1), 252-266. https://doi.org/10.1016/j.ejor.2019.09.012
17. Flamand, T., Ghoniem, A. and Maddah, B. (2016). Promoting impulse buying by allocating retail shelf space to
grouped product categories. Journal of the Operational Research Society, 67(7), 953-969.
https://doi.org/10.1057/jors.2015.120
18. Frontier (2020). Top Brand Index Fase I 2020, Kategori isotonic. Top Brand Awar. https://www.topbrand-
award.com/top-brand-index/

Humanities & Social Sciences Reviews eISSN: 2395-6518, Vol 8, No 4, 2020, pp 984-998
https://doi.org/10.18510/hssr.2020.8495
997 |https://giapjournals.com/hssr/index © Wijaya et al.
19. Geromel, R. (2012). Brazil e-commerce 101 or The Basics About e-business in Brazil. Forbes.
http://www.forbes.com/sites/ricardogeromel/2012/06/11/brazil-e-commerce-101-or-the-basics-about-e-
business-in-brazil/
20. Gidlöf, K., Anikin, A., Lingonblad, M. & A Wallin, A. (2017). Looking is buying. How visual attention and
choice are affected by consumer preferences and properties of the supermarket shelf. Appetite, 116, 29-38.
https://doi.org/10.1016/j.appet.2017.04.020
21. Hall, A., Towers, N. and Shaw, D. R. (2017). Understanding how Millennial shoppers decide what to buy:
Digitally connected unseen journeys. International Journal of Retail & Distribution Management, 45(5), 498-
517. https://doi.org/10.1108/IJRDM-11-2016-0206
22. Hübner, A. & Schaal, K. (2017). A shelf-space optimization model when demand is stochastic and space-
elastic. Omega, 68, 139-154. https://doi.org/10.1016/j.omega.2016.07.001
23. Johnen, M. & Schnittka, O. (2020). Changing consumers' minds at the point of sale: price discounts vs. in-store
advertising. Marketing Letters, 31, 49–71 (2020). https://doi.org/10.1007/s11002-020-09512-0
24. Karampatsa, M., Grigoroudis, E. & Matsatsinis, N. F. (2017). Retail Category Management: A Review on
Assortment and Shelf-Space Planning Models. In Grigoroudis, E. & Doumpos, M. (eds), Operational Research
in Business and Economics. Springer Proceedings in Business and Economics. Springer.
https://doi.org/10.1007/978-3-319-33003-7_3
25. Kartika, T. G. M., Rofiaty & Rohman, F. (2017). Pengaruh Hedonic Shopping Value dan Atmosfer Gerai
Terhadap Keputusan Pembelian Impulsif dengan Mediasi Reaksi Impulsif. Jurnal Bisnis dan Manajemen, 4(2),
188-196. https://doi.org/10.26905/jbm.v4i2.1700
26. Khare, A., Sadachar, A. & Manchiraju, S. (2020). Investigating the Role of Knowledge, Materialism, Product
Availability, and Involvement in Predicting the Organic Clothing Purchase Behavior of Consumers in the
Indian Market. Journal of International Consumer Marketing, 32(3), 228-242.
https://doi.org/10.1080/08961530.2019.1695239
27. Kumar, V., Anand, A. & Song, H. (2017). Future of retailer profitability: An organizing framework. Journal of
Retailing, 93(1), 96-119. https://doi.org/10.1016/j.jretai.2016.11.003
28. Kwak, H., Zhang, Y., Puzakova, M. & Moriguchi, T. (2020). Going it alone or together: the role of space
between products on consumer perceptions of price promotions. International Journal of Advertising.
https://doi.org/10.1080/02650487.2020.1753443
29. Maelen, S. V., Breugelmans, E. & Cleeren, K. (2017). The Clash of the Titans: On Retailer and Manufacturer
Vulnerability in Conflict Delistings. Journal of Marketing, 81, 118–135. https://doi.org/10.1509/jm.15.0282
30. Malhotra, N. K. (2018). Marketing Research: An Applied Orientation, 7th Edition. Pearson Education.
31. Nielsen (2019, April 30). Advertising Expenditure Grow 4 Percent in the Early Quarter of 2019. Nielsen.com.
https://www.nielsen.com/id/en/insights/article/2019/advertising-expenditures-grow-4percent-inthe-early-
quarter-of2019-article/
32. Mothersbaugh, D., Hawkins, D. & Kleiser, S. B. (2019). Consumer Behavior: Building Marketing Strategy, 14th
Edition. McGraw-Hill
33. Noor, Z. Z. (2020). The Effect of Price Discount and In-Store Display on Impulse Buying. Sosiohumaniora,
22(2), 133-139. https://doi.org/10.24198/sosiohumaniora.v22i2.26720
34. Ozili, P. K. (2016, September 7). Re: What is the acceptable r-squared value? Research Gate.
https://www.researchgate.net/post/what_is_the_acceptable_rsquared_value/57cfcb0d3d7f4be2fb47f515/citation
/download
35. Parsad, C., Prashar, S. & Sahay, V. (2017). Impact of Impulsive Personality Traits and Store Environment on
Impulse Buying Behavior. Journal of Business and Management, 23(1/2), 1-24.
36. Pizzi, G. and Scarpi, D. (2016). The effect of shelf layout on satisfaction and perceived assortment size: An
empirical assessment. Journal of Retailing and Consumer Services, 28, 67-77.
https://doi.org/10.1016/j.jretconser.2015.08.012
37. Pornpitakpan, C., Yuan, Y. & Han, J. H. (2017). The effect of salespersons' retail service quality and
consumers' mood on impulse buying. Australasian Marketing Journal, 25(1), 2-11.
https://doi.org/10.1016/j.ausmj.2016.12.003
38. Saleem, M. (2012). Who Hangs Out Where? Harvard Business Review, 90, July – August 2012.
39. Seinauskiene, B., Mascinskiene, J., Petrike, I. & Rutelione, A. (2016). Materialism as the Mediator of the
Association between Subjective Well-being and Impulsive Buying Tendency. Inzinerine Ekonomika-
Engineering Economics, 27(5), 594–606. https://doi.org/10.5755/j01.ee.27.5.13830
40. Sevilla, J. & Townsend, C. (2016). The Space-to-Product Ratio Effect: How Interstitial Space Influences
Product Aesthetic Appeal, Store Perceptions, and Product Preference. Journal of Marketing Research,
53(5), 665-681. https://doi.org/10.1509/jmr.13.0601
41. Siow, P. C., Tan, W. S., & Henry, C. J. (2017). Impact of Isotonic Beverage on the Hydration Status of Healthy
Chinese Adults in Air-Conditioned Environment. Nutrients, 9(3), 242. https://doi.org/10.3390/nu9030242
42. Skoloda, K. M. (2009). Too Busy to Shop: Marketing to Multi-Minding Women. Greenwood Publishing Group
43. Solomon, M. R. (2016). Consumer Behavior: Buying, Having, and Being, 12th Edition. Pearson Education.

Humanities & Social Sciences Reviews eISSN: 2395-6518, Vol 8, No 4, 2020, pp 984-998
https://doi.org/10.18510/hssr.2020.8495
998 |https://giapjournals.com/hssr/index © Wijaya et al.
44. Thompson, J. (2017, August 10). Nielsen and GreatVines Agree on Shelf Space Management Strategies.
GreatVines. https://www.greatvines.com/3-tier-system/nielsen-and-greatvines-agree-on-shelf-space-
management-strategies
45. Thürmer, J.L., Bieleke, M., Wieber, F. and Gollwitzer, P. M. (2020). If-then plans help regulate automatic peer
influence on impulse buying. European Journal of Marketing, 54(9), 2079-2105. https://doi.org/10.1108/EJM-
05-2018-0341
46. Valenzuela, A., Raghubir, P., and Mitakakis, C. (2013). Shelf space schemas: Myth or reality? Journal of
Business Research. 66(7), 881-888 . https://doi.org/10.1016/j.jbusres.2011.12.006
47. Valenzuela, A. and Raghubir, P. (2015). Are consumers aware of top-bottom but not of left-right inferences?
Implications for shelf space positions. Journal of Experimental Psychology: Applied. 21(3), 224-241.
https://doi.org/10.1037/xap0000055
48. Vroom, M. (2016, October 25). Six reasons why people will keep shopping in physical stores. Medium.
https://medium.com/tablet-assisted-sales-mania/six-reasons-why-people-will-keep-shopping-in-physical-stores-
ac62230432cd
49. Wästlund, E., Shams, P., and Otterbring, T. (2018). Unsold is unseen … or is it? Examining the role of
peripheral vision in the consumer choice process using eye-tracking methodology. Appetite, 120, 49-56.
https://doi.org/10.1016/j.appet.2017.08.024
50. Westergaard, N. (2018). Brand Now: How to Stand Out in A Crowded, Distracted World. Amacom.
51. Wijaya, B. S. (2013). How 'Deep' is Your Brand? The Hierarchical Effects Model of Emotional Branding.
Journal Communication Spectrum: Capturing New Perspectives in Communication, 3(2), 158-169.
52. Wijaya, B. S. (2019). Dancing with the Impropriety of Media: How Indonesian Consumers Think and Behave
towards the Unethical and Illogical Online News. Jurnal Komunikasi: Malaysian Journal of Communication,
35(1), 187-205. https://doi.org/10.17576/JKMJC-2019-3501-13
53. Witek-Hajduk, M. K., & Zaborek, P. (2020). Cooperation and Competition in Manufacturer-Key Retailer
Relationships: A Business Model Perspective. E&M Economics and Management, 23(1), 167–183.
https://doi.org/10.15240/tul/001/2020-1-012
54. Wuryasti, F. (2019, September 19). Iklan Digital Menyumbang Porsi 6% dari Total Belanja Iklan.
Media Indonesia. https://mediaindonesia.com/read/detail/260461-iklan-digital-menyumbang-porsi-6-dari-total-
belanja-iklan
55. Yang, L., Cheng, B., Deng, N. , Zhou, Z. and Weixin Huang, W. (2019). The Influence of Supermarket Spatial
Layout on Shopping Behavior and Product Sales. Intelligent & Informed, 1, 301-310.
56. Yudiatantri, A. & Nora, L. (2019). The Effect of Store Atmosphere and Packaging Design toward Impulsive
Buying with Shopping Lifestyle As a Moderating Variable at Carrefour in Jakarta. KnE Social Sciences, 3(26),
474-491. https://doi.org/10.18502/kss.v3i26.5395
57. Yu, Y., Sun, L. & Guo, X. (2019). Dual-channel decision in a shopping complex when considering consumer
channel preference. Journal of the Operational Research Society.
https://doi.org/10.1080/01605682.2019.1621221
58. Zafar, A. U., Qiu, J., Li, Y., Wang, J. & Shahzad, M. (2019). The impact of social media celebrities' posts and
contextual interactions on impulse buying in social commerce. Computers in Human Behavior, In Press.
https://doi.org/10.1016/j.chb.2019.106178
59. Zhao, J., Zhou, YW., Cao, ZH. & Min, J. (2020). The shelf space and pricing strategies for a retailer-dominated
supply chain with consignment based revenue sharing contracts. European Journal of Operational Research,
280(3), 926-939. https://doi.org/10.1016/j.ejor.2019.07.074