Embed Size (px)
Citation preview
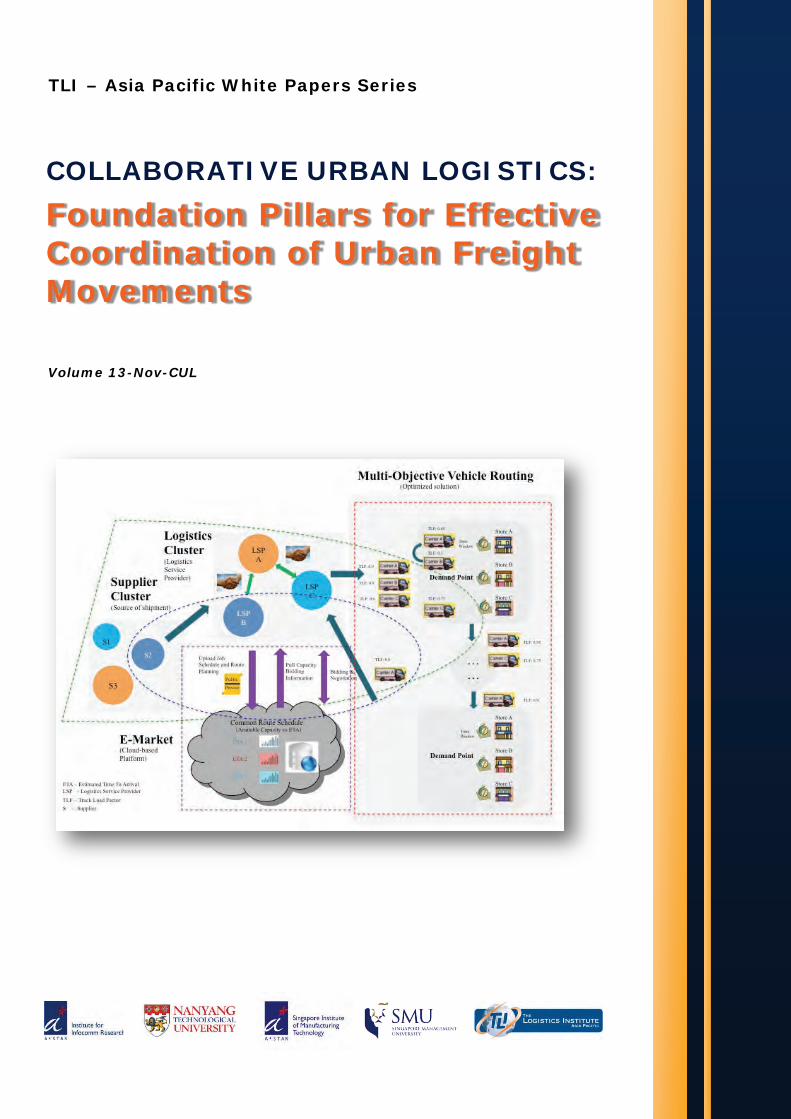
COLLABORATIVE URBAN LOGISTICS:
TLI – Asia Pacific White Papers Series
Volume 13-Nov-CUL
Foundation Pillars for Effective Coordination of Urban Freight Movements
TLI – Asia Pacific Whitepaper Series:
Collaborative Urban Logistics: Foundation Pillars for Effective Coordination of Urban Freight Movements
| 2 |
CONTRIBUTING ORGANISATIONS:
Disclaimer, Limitation of Liability and Terms of Use
NUS and contributors own the copyright to the information contained in this report, we are licensed by the copyright owner to reproduce the information or we are authorised to reproduce it.
Please note that you are not authorised to distribute, copy, reproduce or display this report, any other pages within this report or any section thereof, in any form or manner, for commercial gain or otherwise, and you may only use the information for your own internal purposes. You are forbidden from collecting information from this report and incorporating it into your own database, products or documents. If you undertake any of these prohibited activities we put you on notice that you are breaching our and our licensors' intellectual property rights in the report and we reserve the right to take action against you to uphold our rights, which may involve pursuing injunctive proceedings.
The information contained in this report has been compiled from sources believed to be reliable but no warranty, expressed or implied, is given that the information is complete or accurate nor that it is fit for a particular purpose. All such warranties are expressly disclaimed and excluded.
To the full extent permissible by law, NUS shall have no liability for any damage or loss (including, without limitation, financial loss, loss of profits, loss of business or any indirect or consequential loss), however it arises, resulting from the use of or inability to use this report or any material appearing on it or from any action or decision taken or not taken as a result of using the report or any such material.
PRESENTED AT
The Last Mile – The Next Stage of Research
11 NOVEMBER 2013
SINGAPORE
COLLABORATIVE URBAN LOGISTICS:
FOUNDATION PILLARS FOR EFFECTIVE COORDINATION OF URBAN FREIGHT MOVEMENTS

TLI – Asia Pacific Whitepaper Series:
Collaborative Urban Logistics: Foundation Pillars for Effective Coordination of Urban Freight Movements
| 3 |
CONTENTS
1. EXECUTIVE SUMMARY ............................................................................................................................ 5
2. INTRODUCTION ....................................................................................................................................... 7 2.1 Last Mile Logistics in Singapore ....................................................................................................... 7 2.2 Stakeholder Challenges .................................................................................................................... 8 2.3 The Synchronized Last Mile ............................................................................................................. 9
3. DATA HARMONIZATION & ANALYTICS ................................................................................................. 17 3.1 Introduction ................................................................................................................................... 17 3.2 Key Dimensions for Data Harmonization & Analytics .................................................................... 18 3.3 Stakeholder Interaction and Data Exchange .................................................................................. 19 3.4 Recent Initiatives in Data Harmonization & Analytics ................................................................... 20 3.4.1 Data Harmonization ................................................................................................................... 20 3.4.2 Data Visualization....................................................................................................................... 22 3.4.3 Data Analytics ............................................................................................................................ 24 3.5 Key Takeaways ............................................................................................................................... 25
4. SYNCHRONIZATION & MULTI-OBJECTIVE PLANNING .......................................................................... 26 4.1 Introduction ................................................................................................................................... 26 4.2 Key Dimensions for Synchronizing the Last Mile ........................................................................... 28 4.3 Stakeholder Interaction and Data Exchange .................................................................................. 28 4.4 Recent Studies in Synchronizing the Last Mile .............................................................................. 30 4.4.1 Multi-Objective Optimization .................................................................................................... 30 4.4.2 Service level and contract performance analysis ...................................................................... 32 4.4.3 Simulation of interaction with the urban freight system .......................................................... 34 4.5 Key Takeaways ............................................................................................................................... 35
5. ECO-FRIENDLY COLLABORATIVE DELIVERY .......................................................................................... 37 5.1 Introduction ................................................................................................................................... 37 5.2 Key Dimensions for Eco-Friendly Vehicle Routing ......................................................................... 38 5.3 Stakeholder Interaction and Data Exchange .................................................................................. 38 5.4 Recent Initiatives in Eco-Friendly Vehicle Routing......................................................................... 39 5.4.1 Green Vehicle Routing Problem ................................................................................................. 40 5.4.2 Pollution Vehicle Routing ........................................................................................................... 41 5.4.3 Vehicle Routing in Reverse Logistics .......................................................................................... 42 5.5 Key Takeaways ............................................................................................................................... 44
TLI – Asia Pacific Whitepaper Series:
Collaborative Urban Logistics: Foundation Pillars for Effective Coordination of Urban Freight Movements
| 4 |
6. MULTI-PARTY COORDINATION ............................................................................................................. 45 6.1 Introduction ................................................................................................................................... 45 6.2 Key Dimensions for Multi-Party Coordination ............................................................................... 45 6.3 Stakeholder Interaction and Data Exchange .................................................................................. 46 6.3.1 Auction ....................................................................................................................................... 47 6.3.2 Collaboration .............................................................................................................................. 51 6.4 Recent Initiatives in Multi-Party Coordination .............................................................................. 55 6.5 Key Takeaways ............................................................................................................................... 56
TLI – Asia Pacific Whitepaper Series:
Collaborative Urban Logistics: Foundation Pillars for Effective Coordination of Urban Freight Movements
| 5 |
1. EXECUTIVE SUMMARY
It is common practice for actors in last mile logistics to pursue their individual strategies to improve cost efficiency and service level in transport operations by optimizing travel time and load capacity usage. Unfortunately, these efforts may result in lose-lose situations, where short-term efficiencies of individual companies are achieved at the expense of the long-term sustainability of the freight transport system. Increasing fleet size and average speeds of vehicles are few factors that may contribute to improved individual company efficiency. Such moves appear sensible at first thought, however, when everyone starts to follow these moves, the outcome will be an increase in road congestion and associated delays, fuel consumption and pollution.
In recognition of the risk of such situations, several academic institutions (in alphabetical order), namely the Institute for Infocomm Research, Nanyang Technological University, Singapore Institute of Manufacturing Technology, Singapore Management University and The Logistics Institute Asia Pacific, initiated a joint collaboration to address these challenges. Our research is based on collaboration across selected industry partners that will collectively improve the efficiency and cost effectiveness by leveraging on economies of scale.
We firmly believe that sharing of information is critical to promote sustainable improvements in the efficiency and cost effectiveness in every level of the value chain, in any organization. Our concept of the Synchronized Last Mile encourages clustering of customers, suppliers, and service providers to interact and collaborate in an equal and fair environment through an electronic marketplace.
Our proposed framework integrates four inter-dependent initiatives:
1. Data Harmonization & Analytics,
2. Synchronization & Multi-Objective Planning,
3. Eco-Friendly Collaborative Delivery, and
4. Multi-Party Coordination.
These initiatives are to be led by different institutions with a team of experienced researchers in the area. The expectation is usable e-marketplace as an effective decision support tool in last-mile logistics.
In this white paper, we present four foundation pillars for effective coordination of urban freight movement which serves as groundwork for our initiatives. Our research efforts in Collaborative Urban Logistics will be built on these ‘Foundation Pillars’ that act as a frame of reference to draw from and to compare future work to.
TLI – Asia Pacific Whitepaper Series:
Collaborative Urban Logistics: Foundation Pillars for Effective Coordination of Urban Freight Movements
| 6 |
For each initiative, we identify its key dimensions by adapting a method developed by Quak (2011)1 that identifies basic dimensions for last-mile logistics initiatives, structures the last-mile logistics field and identifies critical success factors and barriers for successful last-mile logistics initiatives. This methodology is simple yet comprehensive in highlighting the importance of each dimension, and the relationship between these dimensions. Each of the initiatives is framed on five key dimensions: main objectives, main players, reason for players’ involvement, geographical planning options and logistics characteristics.
We believe these initiatives will be of immense benefit to the industry and the environment alike. As such, we welcome your participation in our initiatives by providing us with information and validation. This will support our objective of translating research and information sharing efforts into successful collaborative initiatives in urban logistics. Your support is vital in creating a sustainable urban freight system that is more cost effective and efficient, and fairly benefits all stakeholders.
1 H J Quak, "Urban Freight Transport: The Challenge of Sustainability," in City Distribution and Urban Freight Transport: Multiple Perspectives(Cheltenham, UK: Edward Elgar Publishing, 2011).
TLI – Asia Pacific Whitepaper Series:
Collaborative Urban Logistics: Foundation Pillars for Effective Coordination of Urban Freight Movements
| 7 |
2. INTRODUCTION
2.1 Last Mile Logistics In Singapore
Coordination of the “Last Mile” (or Last Kilometer” or “First Mile” in the case of collections and/or returns) is a little addressed but common logistics collection/distribution problem in built-up (urban) environments, particularly in the ASEAN region. Along with rapid growth and densification, these cities need to facilitate highly concentrated last-mile logistics activities due to, amongst others, a high density of retail business.
Singapore as a (small closely knit) city-state is unique and has generally handled the synchronized last mile effectively but as the city-state urbanizes at a faster rate (as is common in fast growing cities in Asia) across limited space several auxiliary influencing factors need to be considered, that include: population (demand) density and intensity; higher demands and expectations as e-commerce gains traction; environmental solutions as sustainability ranks higher in public and corporate consciousness; and productivity as costs escalate and service levels become more acute.
Loss of capacity and efficiency becomes highest across the supply chain at the nearest to the aggregated or single demand point (or origin, in B2B). This last leg may face significant fulfillment constraints, higher social, environmental and economic costs, making it the most expensive and polluting parts of the chain; in addition, the last mile introduces an increased complexity in maintaining the supply chain’s designed-in economies of scale and expected service levels. Economic costs alone are estimated to amount to between 13% and 75% of the total logistics costs, depending on industry.
Last Mile challenges may be attributed to several dynamically interacting but poorly understood causes, not least of which is that the demand points (or source points, in B2B or reverse supply chains) are often located in highly access-restricted areas away from larger distribution centers, spread in demand or supply clusters. In addition, logistics in the last mile and the last subject to regulated access (e.g. time windows), congestion, fleet/load use limits, and dynamic interaction amongst many competing interests and services, policies and interventions, all challenging the coordination of activities between stakeholders.
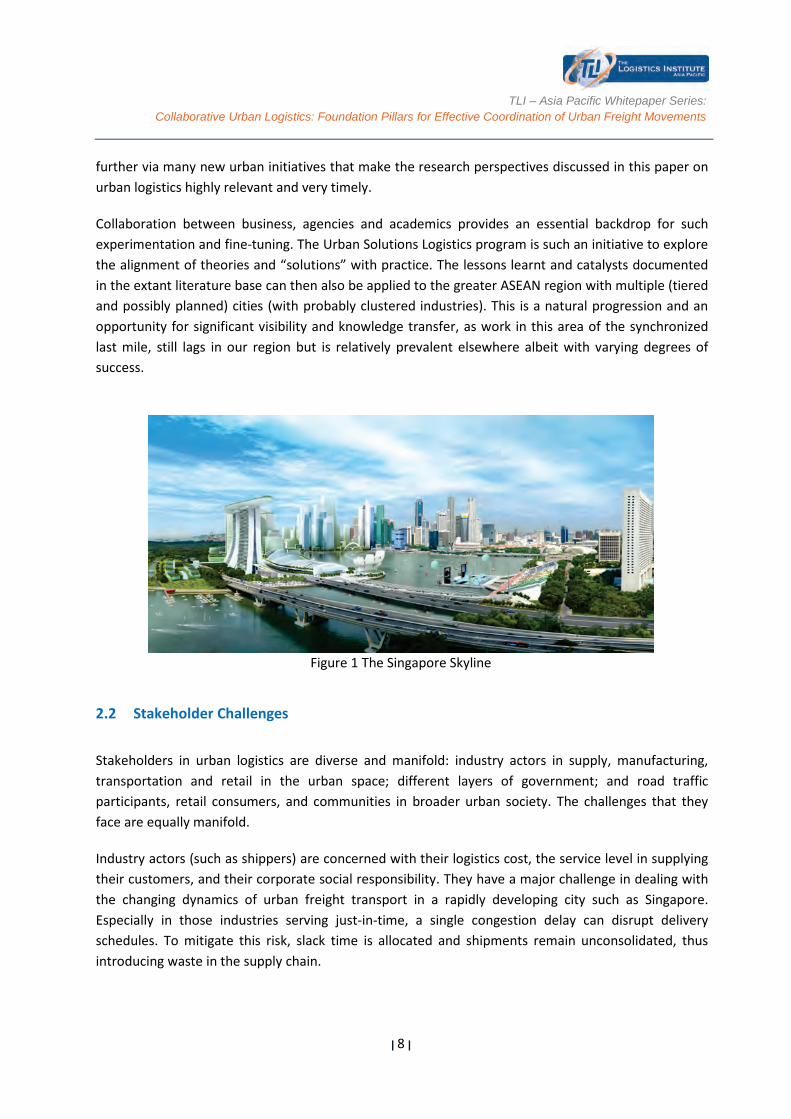
Urban logistics is an emerging field of investigation looking into the management and optimizations of urban freight transport and distribution systems. All of this and time, itself, now becomes a competitive advantage and hence, companies need to seriously revisit the existing basis of their collaborative arrangements, resource allocation, delivery modes, patterns and asset utilization and ownership – through collaborative urban logistics. Singapore provides a living laboratory for experimentation with innovative synchronized last mile urban concepts and paradigms that could be readily translated into business practice with selected pioneering companies. Figure 1 shows the Singapore skyline depicting a rich vibrancy with planned urban infrastructure which is segmenting
TLI – Asia Pacific Whitepaper Series:
Collaborative Urban Logistics: Foundation Pillars for Effective Coordination of Urban Freight Movements
| 8 |
further via many new urban initiatives that make the research perspectives discussed in this paper on urban logistics highly relevant and very timely.
Collaboration between business, agencies and academics provides an essential backdrop for such experimentation and fine-tuning. The Urban Solutions Logistics program is such an initiative to explore the alignment of theories and “solutions” with practice. The lessons learnt and catalysts documented in the extant literature base can then also be applied to the greater ASEAN region with multiple (tiered and possibly planned) cities (with probably clustered industries). This is a natural progression and an opportunity for significant visibility and knowledge transfer, as work in this area of the synchronized last mile, still lags in our region but is relatively prevalent elsewhere albeit with varying degrees of success.
Figure 1 The Singapore Skyline
2.2 Stakeholder Challenges
Stakeholders in urban logistics are diverse and manifold: industry actors in supply, manufacturing, transportation and retail in the urban space; different layers of government; and road traffic participants, retail consumers, and communities in broader urban society. The challenges that they face are equally manifold.
Industry actors (such as shippers) are concerned with their logistics cost, the service level in supplying their customers, and their corporate social responsibility. They have a major challenge in dealing with the changing dynamics of urban freight transport in a rapidly developing city such as Singapore. Especially in those industries serving just-in-time, a single congestion delay can disrupt delivery schedules. To mitigate this risk, slack time is allocated and shipments remain unconsolidated, thus introducing waste in the supply chain.
TLI – Asia Pacific Whitepaper Series:
Collaborative Urban Logistics: Foundation Pillars for Effective Coordination of Urban Freight Movements
| 9 |
At the same time Logistics Service Providers (LSPs) compete for cost leadership under a shortage in supply of skilled drivers. The increasing availability of data provides a big opportunity to make operational improvements to drive efficiencies up; but at the same time, brings challenges of how to harmonize this mass of data into a single source of truth and use it to effectively perform dynamic analytics for real-time decision support.
Many producers, retailers and LSPs consider their supply chain management capacity as one of their competitive advantages, thus posing extra limits for the coordination of multiple parties (agents) for overall system efficiency and cost effectiveness. At the same time, businesses in dense urban areas want to optimize commercial traffic servicing retailers and other business users to increase quality of city life, and relieve pressure on parking and loading/unloading areas in city centers.
Urban society at large is affected by last mile logistics due to road congestions, air quality, noise and environmental pollution. Governments have a role to play in developing time managed solutions to improve this situation to rationalize urban freight movements, especially of heavy goods commercial delivery vehicles thus reducing congestion. A major challenge in developing such solutions, however, is to address the implicit and explicit complexity of last mile logistics system in terms of its dynamic interactions with developing urban social and economic context.
2.3 The Synchronized Last Mile
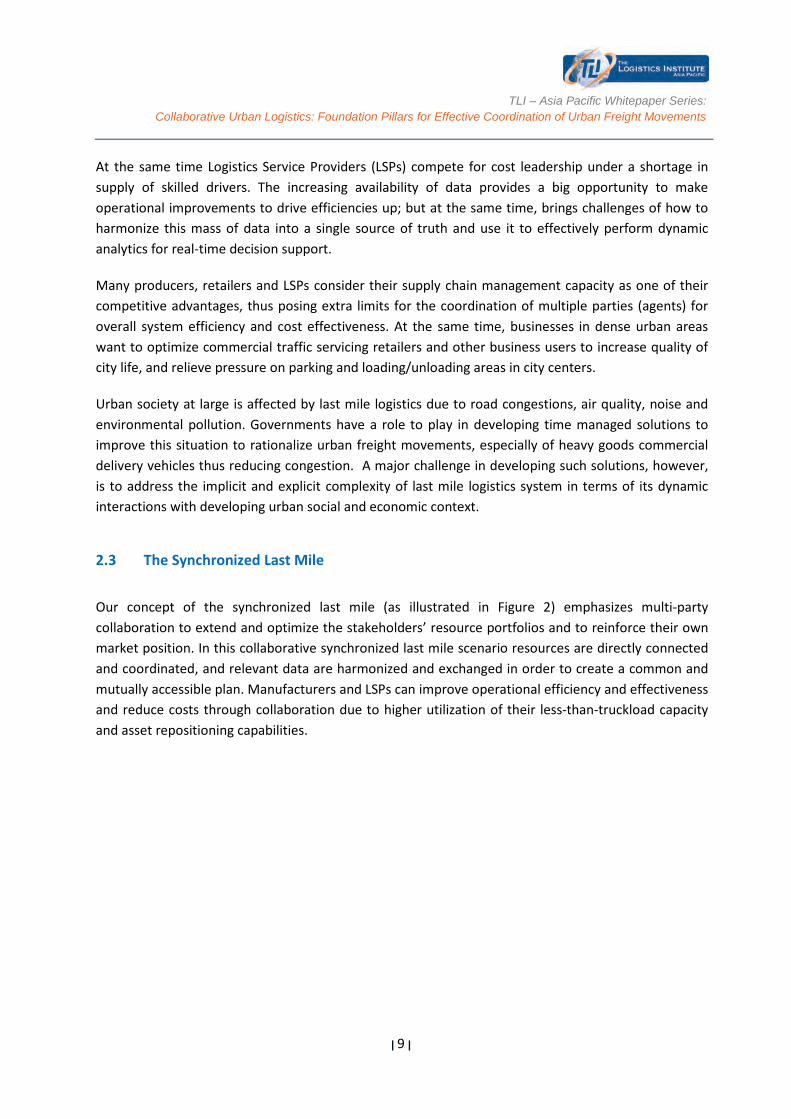
Our concept of the synchronized last mile (as illustrated in Figure 2) emphasizes multi-party collaboration to extend and optimize the stakeholders’ resource portfolios and to reinforce their own market position. In this collaborative synchronized last mile scenario resources are directly connected and coordinated, and relevant data are harmonized and exchanged in order to create a common and mutually accessible plan. Manufacturers and LSPs can improve operational efficiency and effectiveness and reduce costs through collaboration due to higher utilization of their less-than-truckload capacity and asset repositioning capabilities.
TLI – Asia Pacific Whitepaper Series:
Collaborative Urban Logistics: Foundation Pillars for Effective Coordination of Urban Freight Movements
| 10 |
Figure 2 Collaborative Urban Logistics Concept
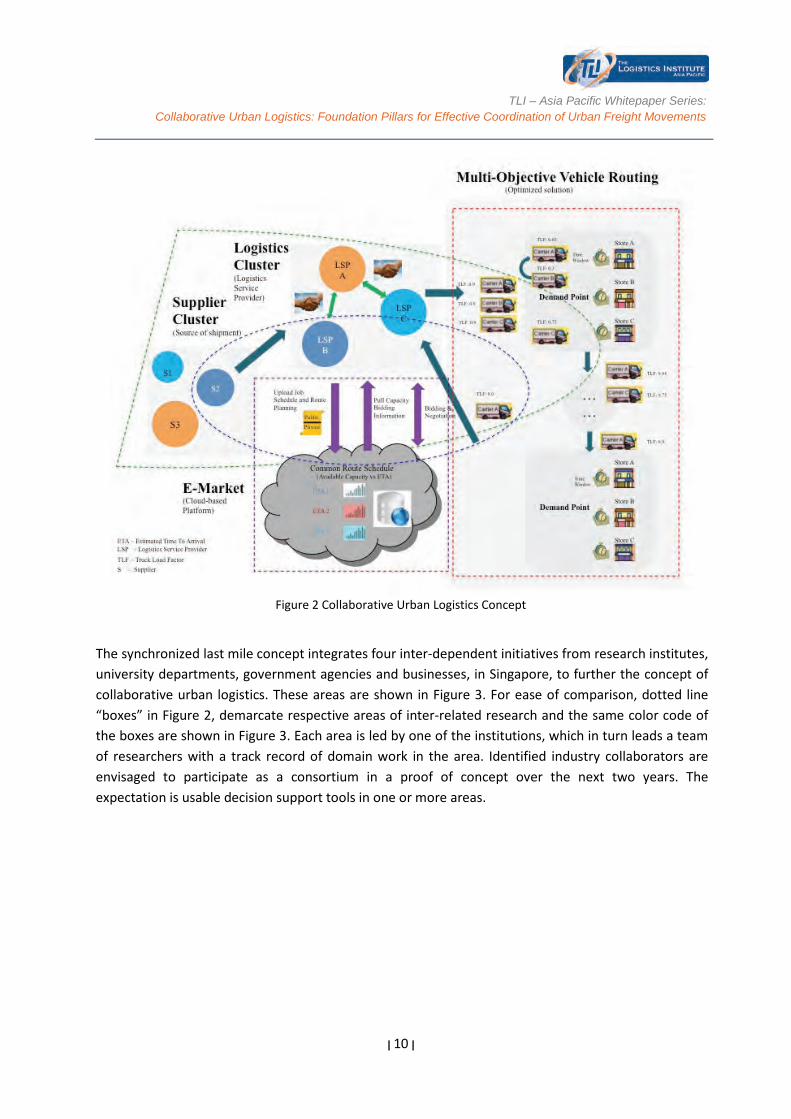
The synchronized last mile concept integrates four inter-dependent initiatives from research institutes, university departments, government agencies and businesses, in Singapore, to further the concept of collaborative urban logistics. These areas are shown in Figure 3. For ease of comparison, dotted line “boxes” in Figure 2, demarcate respective areas of inter-related research and the same color code of the boxes are shown in Figure 3. Each area is led by one of the institutions, which in turn leads a team of researchers with a track record of domain work in the area. Identified industry collaborators are envisaged to participate as a consortium in a proof of concept over the next two years. The expectation is usable decision support tools in one or more areas.
TLI – Asia Pacific Whitepaper Series:
Collaborative Urban Logistics: Foundation Pillars for Effective Coordination of Urban Freight Movements
| 11 |
Figure 3 Four initiatives in Collaborative Urban Logistics
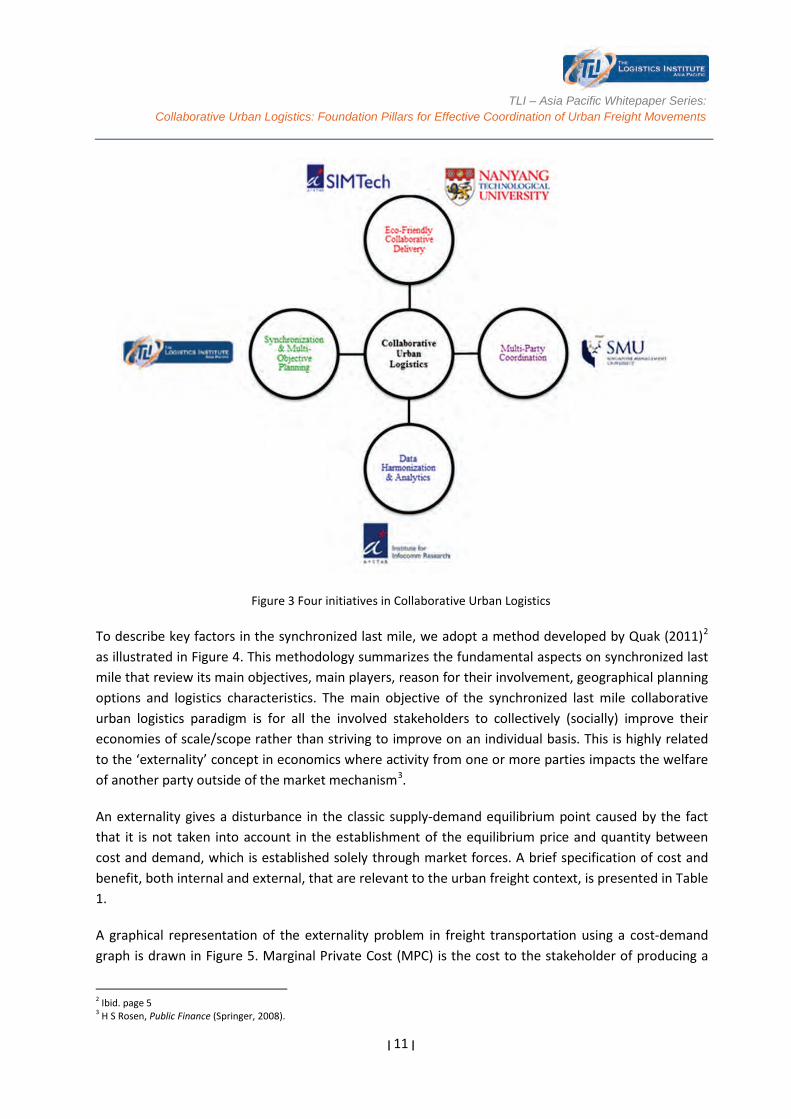
To describe key factors in the synchronized last mile, we adopt a method developed by Quak (2011)2 as illustrated in Figure 4. This methodology summarizes the fundamental aspects on synchronized last mile that review its main objectives, main players, reason for their involvement, geographical planning options and logistics characteristics. The main objective of the synchronized last mile collaborative urban logistics paradigm is for all the involved stakeholders to collectively (socially) improve their economies of scale/scope rather than striving to improve on an individual basis. This is highly related to the ‘externality’ concept in economics where activity from one or more parties impacts the welfare of another party outside of the market mechanism3.
An externality gives a disturbance in the classic supply-demand equilibrium point caused by the fact that it is not taken into account in the establishment of the equilibrium price and quantity between cost and demand, which is established solely through market forces. A brief specification of cost and benefit, both internal and external, that are relevant to the urban freight context, is presented in Table 1.
A graphical representation of the externality problem in freight transportation using a cost-demand graph is drawn in Figure 5. Marginal Private Cost (MPC) is the cost to the stakeholder of producing a
2 Ibid. page 5 3 H S Rosen, Public Finance (Springer, 2008).
TLI – Asia Pacific Whitepaper Series:
Collaborative Urban Logistics: Foundation Pillars for Effective Coordination of Urban Freight Movements
| 12 |
given good or service. Each stakeholder is trying to minimize its MPC by improving its individual efficiency which unfortunately may result in negative externalities such as congestion, reduction of travel speed and increment of pollutants emitted. This may create industry (social) inefficiency (deadweight loss) that shifts the MPC to Marginal Industry Cost (MIC) which is the sum of MPC and negative externality cost.
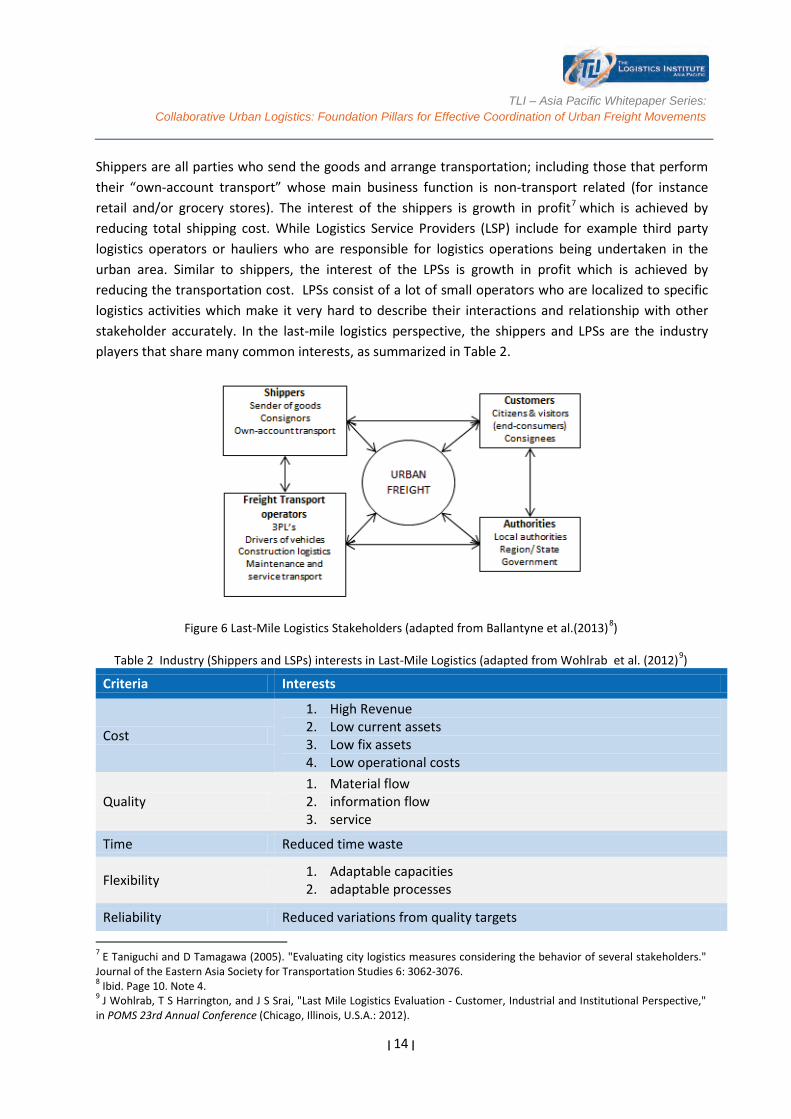
Other than the complexity caused by the externality problem, another major challenge in achieving synchronized last mile collaborative urban logistics is the coordination between stakeholders. Last-mile logistics involves many stakeholders with diverse interests that may lead to potential conflicts between key stakeholders. The high number of stakeholders, public and private, big and small, adds to the complexity of last-mile logistics4. The stakeholders can be categorized into two groups; those that directly influence the system and ones that have an interest but do not directly influence the system. In line with the above, ‘actors’ denote the former and ‘stakeholders’ denote the latter. It follows that all actors are stakeholders, but not all stakeholders are actors. We categorize these actors into four main groups: the shippers, the logistics service providers (LSP), the customers, and the authorities, as illustrated in Figure 6.
Figure 4 Collaborative Urban Logistics – Key Dimensions (adapted from Quak(2011)5)
4 E F Ballantyne, M Lindholm, and A Whiteing, "A Comparative Study of Urban Freight Transport Planning: Addressing Stakeholder Needs," Journal of Transport Geography 32, no. 0 (2013); Quak; E Taniguchi and D Tamagawa, "Evaluating City Logistics Measures Considering the Behavior of Several Stakeholders," Journal of the Eastern Asia Society for Transportation Studies 6, no. (2005). 5 Ibid. page 5

TLI – Asia Pacific Whitepaper Series:
Collaborative Urban Logistics: Foundation Pillars for Effective Coordination of Urban Freight Movements
| 13 |
Figure 5 The externality problem in Freight Transportation
Table 1 General last mile logistics cost and benefit specification, adapted from Ranaiefar and Regan(2011)6
Cost Description E/I V/F M/NM
Vehicle ownership Vehicle expenses not proportional to distance I F M
Vehicle operation User expenses proportional to distance I V M
Vehicle coordination Expenses for planning and managing vehicle fleets
I F M
Operating subsidies Vehicle expense not paid by user E V M
Reliability risk Cost associated with likelihood of delay E V M
Congestion Increased delay, costs, stress E V NM
Benefit Description E/I V/F M/NM
Income As provided to firms and their employees I V M
Reputation In terms of reliability, also social responsibility I F NM
Access to goods Reliable access to a variety of goods E V NM
Supply Chain Effectiveness Last mile reliability benefits entire chains I F M
E = external cost; I = internal cost; F = fixed cost; V = variable cost; M = market cost; NM = nonmarket cost
6 F Ranaiefar and A Regan, "Freight-Transportation Externalities," Logistics Operations and Management: Concepts and Models (2011).
TLI – Asia Pacific Whitepaper Series:
Collaborative Urban Logistics: Foundation Pillars for Effective Coordination of Urban Freight Movements
| 14 |
Shippers are all parties who send the goods and arrange transportation; including those that perform their “own-account transport” whose main business function is non-transport related (for instance retail and/or grocery stores). The interest of the shippers is growth in profit7 which is achieved by reducing total shipping cost. While Logistics Service Providers (LSP) include for example third party logistics operators or hauliers who are responsible for logistics operations being undertaken in the urban area. Similar to shippers, the interest of the LPSs is growth in profit which is achieved by reducing the transportation cost. LPSs consist of a lot of small operators who are localized to specific logistics activities which make it very hard to describe their interactions and relationship with other stakeholder accurately. In the last-mile logistics perspective, the shippers and LPSs are the industry players that share many common interests, as summarized in Table 2.
Figure 6 Last-Mile Logistics Stakeholders (adapted from Ballantyne et al.(2013)8) Table 2 Industry (Shippers and LSPs) interests in Last-Mile Logistics (adapted from Wohlrab et al. (2012)9)
Criteria Interests
Cost
1. High Revenue 2. Low current assets 3. Low fix assets 4. Low operational costs
Quality 1. Material flow 2. information flow 3. service
Time Reduced time waste
Flexibility 1. Adaptable capacities 2. adaptable processes
Reliability Reduced variations from quality targets
7 E Taniguchi and D Tamagawa (2005). "Evaluating city logistics measures considering the behavior of several stakeholders." Journal of the Eastern Asia Society for Transportation Studies 6: 3062-3076. 8 Ibid. Page 10. Note 4. 9 J Wohlrab, T S Harrington, and J S Srai, "Last Mile Logistics Evaluation - Customer, Industrial and Institutional Perspective," in POMS 23rd Annual Conference (Chicago, Illinois, U.S.A.: 2012).
TLI – Asia Pacific Whitepaper Series:
Collaborative Urban Logistics: Foundation Pillars for Effective Coordination of Urban Freight Movements
| 15 |
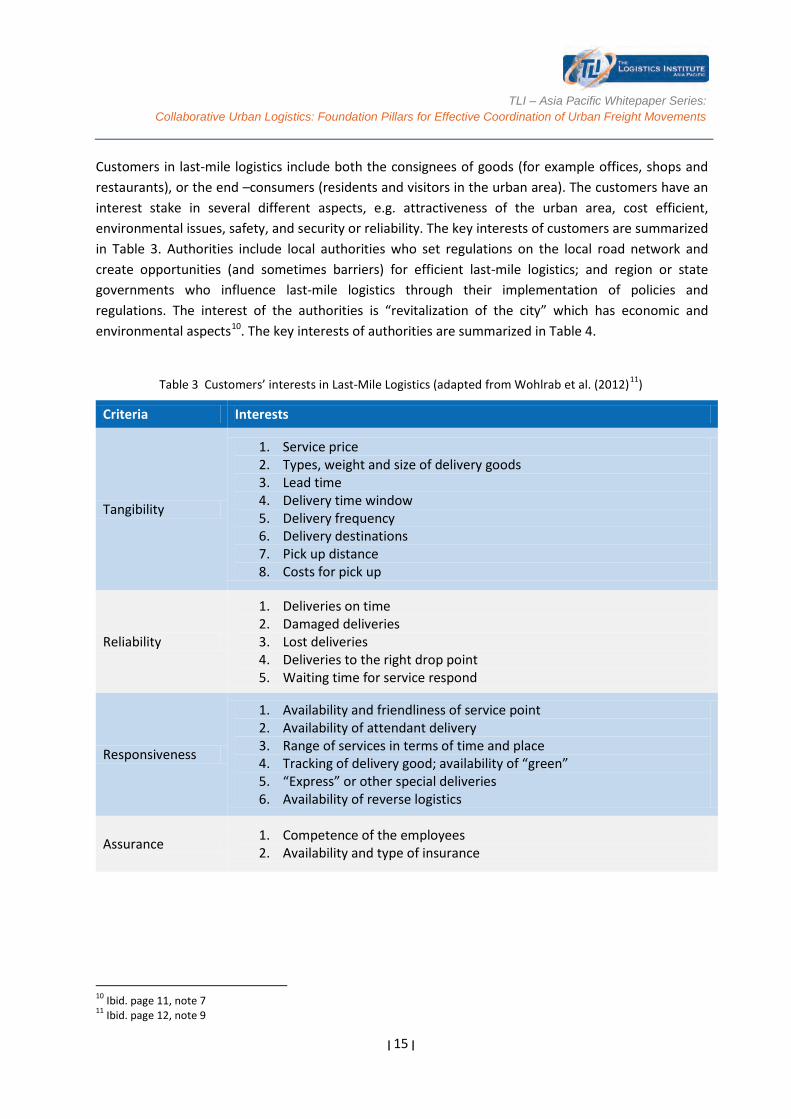
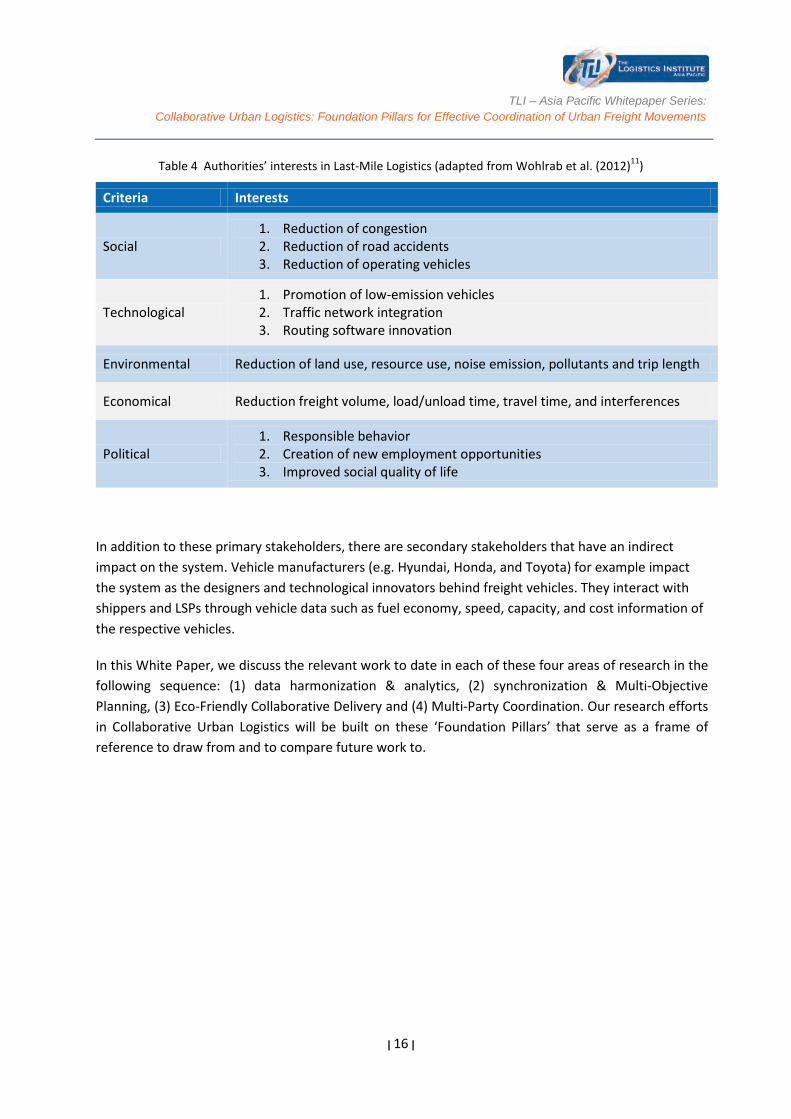
Customers in last-mile logistics include both the consignees of goods (for example offices, shops and restaurants), or the end –consumers (residents and visitors in the urban area). The customers have an interest stake in several different aspects, e.g. attractiveness of the urban area, cost efficient, environmental issues, safety, and security or reliability. The key interests of customers are summarized in Table 3. Authorities include local authorities who set regulations on the local road network and create opportunities (and sometimes barriers) for efficient last-mile logistics; and region or state governments who influence last-mile logistics through their implementation of policies and regulations. The interest of the authorities is “revitalization of the city” which has economic and environmental aspects10. The key interests of authorities are summarized in Table 4.
Table 3 Customers’ interests in Last-Mile Logistics (adapted from Wohlrab et al. (2012)11)
Criteria Interests
Tangibility
1. Service price 2. Types, weight and size of delivery goods 3. Lead time 4. Delivery time window 5. Delivery frequency 6. Delivery destinations 7. Pick up distance 8. Costs for pick up
Reliability
1. Deliveries on time 2. Damaged deliveries 3. Lost deliveries 4. Deliveries to the right drop point 5. Waiting time for service respond
Responsiveness
1. Availability and friendliness of service point 2. Availability of attendant delivery 3. Range of services in terms of time and place 4. Tracking of delivery good; availability of “green” 5. “Express” or other special deliveries 6. Availability of reverse logistics
Assurance 1. Competence of the employees 2. Availability and type of insurance
10 Ibid. page 11, note 7 11 Ibid. page 12, note 9
TLI – Asia Pacific Whitepaper Series:
Collaborative Urban Logistics: Foundation Pillars for Effective Coordination of Urban Freight Movements
| 16 |
Table 4 Authorities’ interests in Last-Mile Logistics (adapted from Wohlrab et al. (2012)11)
Criteria Interests
Social 1. Reduction of congestion 2. Reduction of road accidents 3. Reduction of operating vehicles
Technological 1. Promotion of low-emission vehicles 2. Traffic network integration 3. Routing software innovation
Environmental Reduction of land use, resource use, noise emission, pollutants and trip length
Economical Reduction freight volume, load/unload time, travel time, and interferences
Political 1. Responsible behavior 2. Creation of new employment opportunities 3. Improved social quality of life
In addition to these primary stakeholders, there are secondary stakeholders that have an indirect impact on the system. Vehicle manufacturers (e.g. Hyundai, Honda, and Toyota) for example impact the system as the designers and technological innovators behind freight vehicles. They interact with shippers and LSPs through vehicle data such as fuel economy, speed, capacity, and cost information of the respective vehicles.
In this White Paper, we discuss the relevant work to date in each of these four areas of research in the following sequence: (1) data harmonization & analytics, (2) synchronization & Multi-Objective Planning, (3) Eco-Friendly Collaborative Delivery and (4) Multi-Party Coordination. Our research efforts in Collaborative Urban Logistics will be built on these ‘Foundation Pillars’ that serve as a frame of reference to draw from and to compare future work to.
TLI – Asia Pacific Whitepaper Series:
Collaborative Urban Logistics: Foundation Pillars for Effective Coordination of Urban Freight Movements
| 17 |
3. DATA HARMONIZATION & ANALYTICS
3.1 Introduction
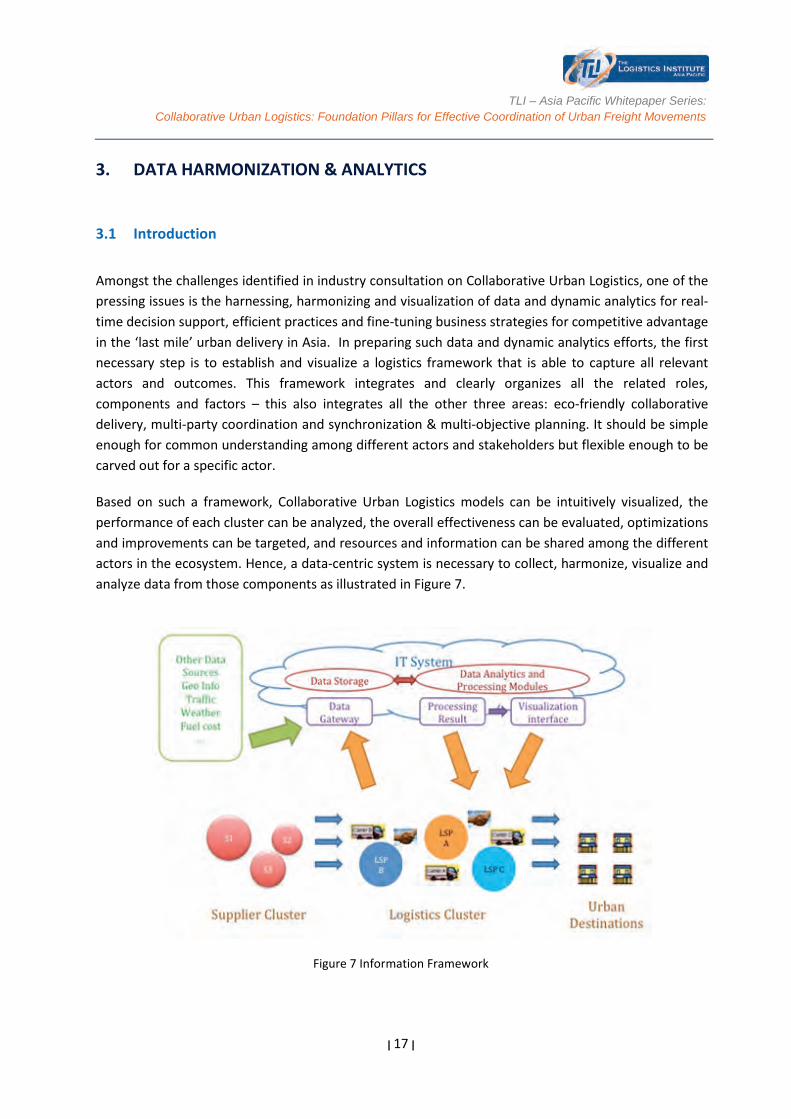
Amongst the challenges identified in industry consultation on Collaborative Urban Logistics, one of the pressing issues is the harnessing, harmonizing and visualization of data and dynamic analytics for real-time decision support, efficient practices and fine-tuning business strategies for competitive advantage in the ‘last mile’ urban delivery in Asia. In preparing such data and dynamic analytics efforts, the first necessary step is to establish and visualize a logistics framework that is able to capture all relevant actors and outcomes. This framework integrates and clearly organizes all the related roles, components and factors – this also integrates all the other three areas: eco-friendly collaborative delivery, multi-party coordination and synchronization & multi-objective planning. It should be simple enough for common understanding among different actors and stakeholders but flexible enough to be carved out for a specific actor.
Based on such a framework, Collaborative Urban Logistics models can be intuitively visualized, the performance of each cluster can be analyzed, the overall effectiveness can be evaluated, optimizations and improvements can be targeted, and resources and information can be shared among the different actors in the ecosystem. Hence, a data-centric system is necessary to collect, harmonize, visualize and analyze data from those components as illustrated in Figure 7.
Figure 7 Information Framework
TLI – Asia Pacific Whitepaper Series:
Collaborative Urban Logistics: Foundation Pillars for Effective Coordination of Urban Freight Movements
| 18 |
In the development of a simple and holistic framework, we focus on three main tasks:
1. Data Harmonization. Last-mile logistics involve many stakeholders with heterogeneous data formats in large volumes, collected in complex data sets. The aim for data harmonization is to provide a unified view of different data sources and a format that able to disambiguate and align disparate data and information.
2. Data and System Visualization. Using this unified data, visualization with different sets of information about the last-mile logistics networks are provided for each stakeholder. This allows the stakeholders to visualize the network information on a live geographical map to optimize the supply chain flow for all the logistics actors involved (e.g. LSPs).
3. Data Analytics. Finally, the ability to exploit real-time information for dynamic supply and demand coordination, management and synchronization is provided using data analytics. Application of efficient data mining techniques on historical data which consider the dynamic real-time data from different aspects, and holistically come out with prediction and analysis models is provided to the stakeholders allowing them predictive capabilities and decision support for last-mile logistics.
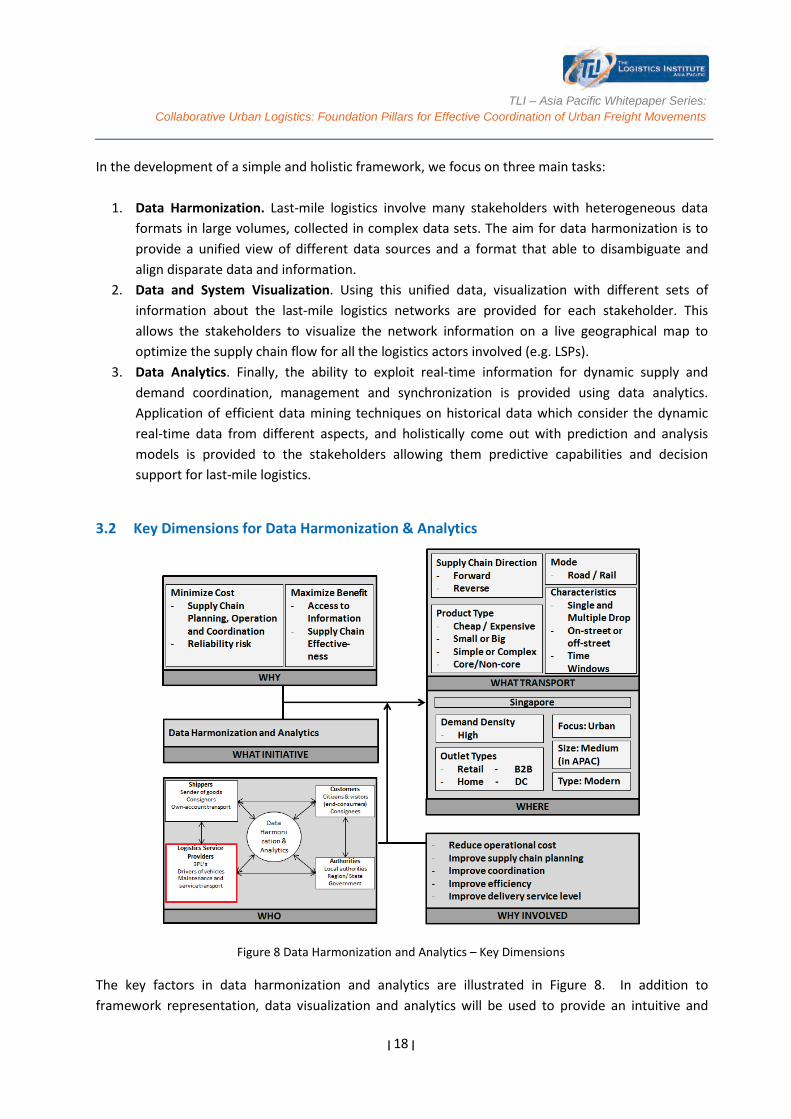
3.2 Key Dimensions for Data Harmonization & Analytics
Figure 8 Data Harmonization and Analytics – Key Dimensions
The key factors in data harmonization and analytics are illustrated in Figure 8. In addition to framework representation, data visualization and analytics will be used to provide an intuitive and
TLI – Asia Pacific Whitepaper Series:
Collaborative Urban Logistics: Foundation Pillars for Effective Coordination of Urban Freight Movements
| 19 |
clear representation of last-mile logistics networks to develop stakeholders’ understanding of the problems they face in meeting their objectives in the last mile. This also helps to encourage stakeholders to participate in collaborative initiatives. In addition, the ability to display computerized maps to uncover relationships between components and dynamically consider real-time aspects, e.g., changing season, traffic conditions, etc. to provide holistic prediction and analysis models will increase last-mile logistics scalability and visibility and eliminate latency and risk for stakeholders. It will also improve information accessibility and hence improve the effectiveness of the supply chain as a whole. Data harmonization and analytics provides valuable information and insights for logistics actors such as Logistics Services Providers (LSPs), shippers, customers and policy makers (authorities).The collaborating LSPs play a major role in shaping the framework based on their data input to harmonize different format of data in systematic manner and provide sematic understanding of comprehensive datasets.
3.3 Stakeholder Interaction and Data Exchange
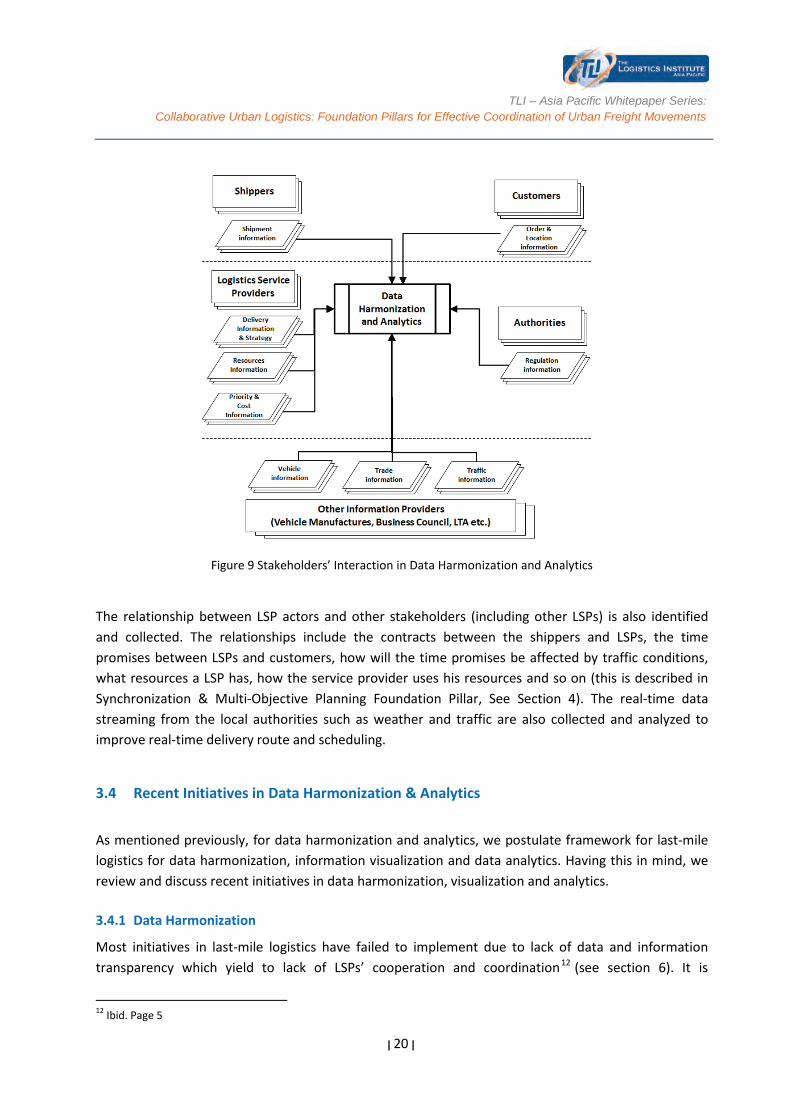
In this holistic framework, collaborating LSP actors from different industries, countries, etc., may exchange data and information regarding factors affecting the delivery such as delivery locations, customer locations, customer demands, available resources, priority requirement, and cost changes; or their delivery strategies such as task scheduling, vehicle routing etc. in real time as illustrated in Figure 9. The data may come from different data sources and systems with different data formats. The framework also collects and integrates static database data including historical purchase orders, existing route deliveries and schedules for analytics purposes.
TLI – Asia Pacific Whitepaper Series:
Collaborative Urban Logistics: Foundation Pillars for Effective Coordination of Urban Freight Movements
| 20 |
Figure 9 Stakeholders’ Interaction in Data Harmonization and Analytics
The relationship between LSP actors and other stakeholders (including other LSPs) is also identified and collected. The relationships include the contracts between the shippers and LSPs, the time promises between LSPs and customers, how will the time promises be affected by traffic conditions, what resources a LSP has, how the service provider uses his resources and so on (this is described in Synchronization & Multi-Objective Planning Foundation Pillar, See Section 4). The real-time data streaming from the local authorities such as weather and traffic are also collected and analyzed to improve real-time delivery route and scheduling.
3.4 Recent Initiatives in Data Harmonization & Analytics
As mentioned previously, for data harmonization and analytics, we postulate framework for last-mile logistics for data harmonization, information visualization and data analytics. Having this in mind, we review and discuss recent initiatives in data harmonization, visualization and analytics.
3.4.1 Data Harmonization
Most initiatives in last-mile logistics have failed to implement due to lack of data and information transparency which yield to lack of LSPs’ cooperation and coordination12 (see section 6). It is
12 Ibid. Page 5
TLI – Asia Pacific Whitepaper Series:
Collaborative Urban Logistics: Foundation Pillars for Effective Coordination of Urban Freight Movements
| 21 |
mentioned that the key to synchronize logistics is information integration and sharing through a transparent framework that comprehensively describes all the components in last-mile logistics and their relationships13.
One way to comprehensively describe the components and their relationships in a framework is by using logistic (domain) ontology to generate the framework conceptual model. Ontology is a common vocabulary to share information in a domain14. It includes a formal explicit description of concepts in a domain of discourse (classes), properties of each concept describing various features and attributes of the concepts (slots), and restrictions on slots (facets or constraints). Classes are the focus of the ontology which describes concepts in the domain. A class may have subclasses that represent a more specific concept than the superclass. Slots describe properties of classes. Facets contain restriction or constraints describing the value type, allowed values, the number of the values (cardinality) and other features.
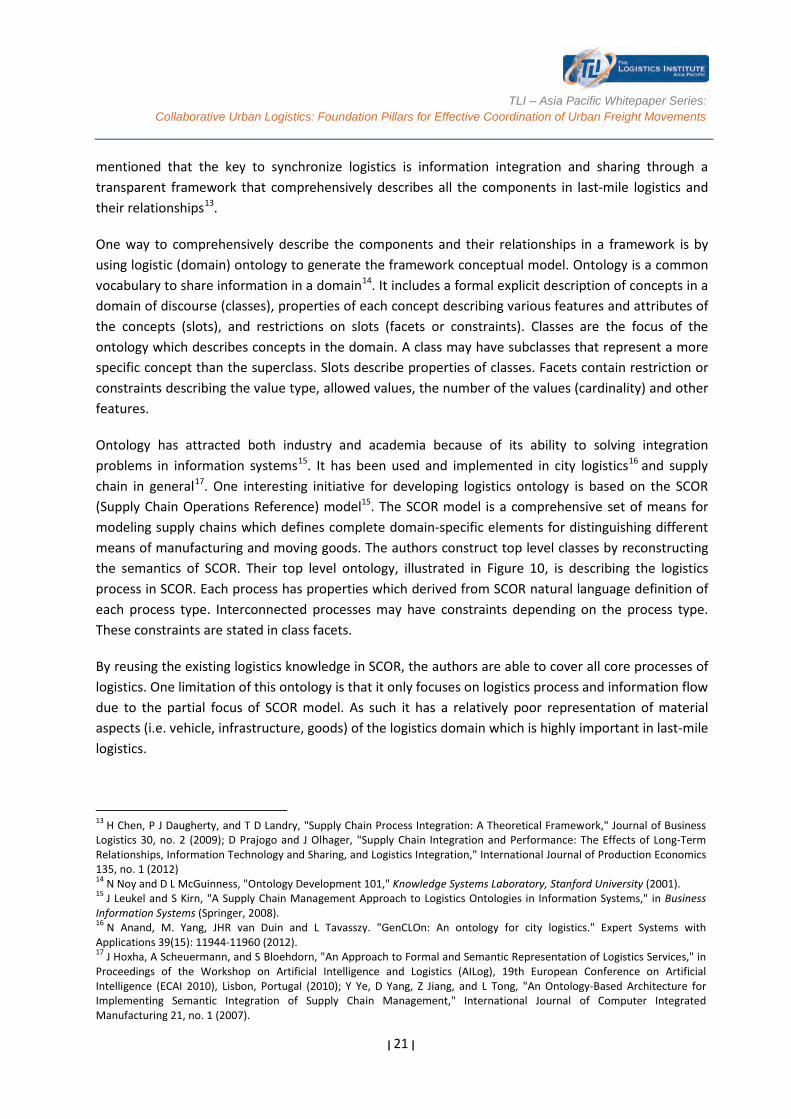
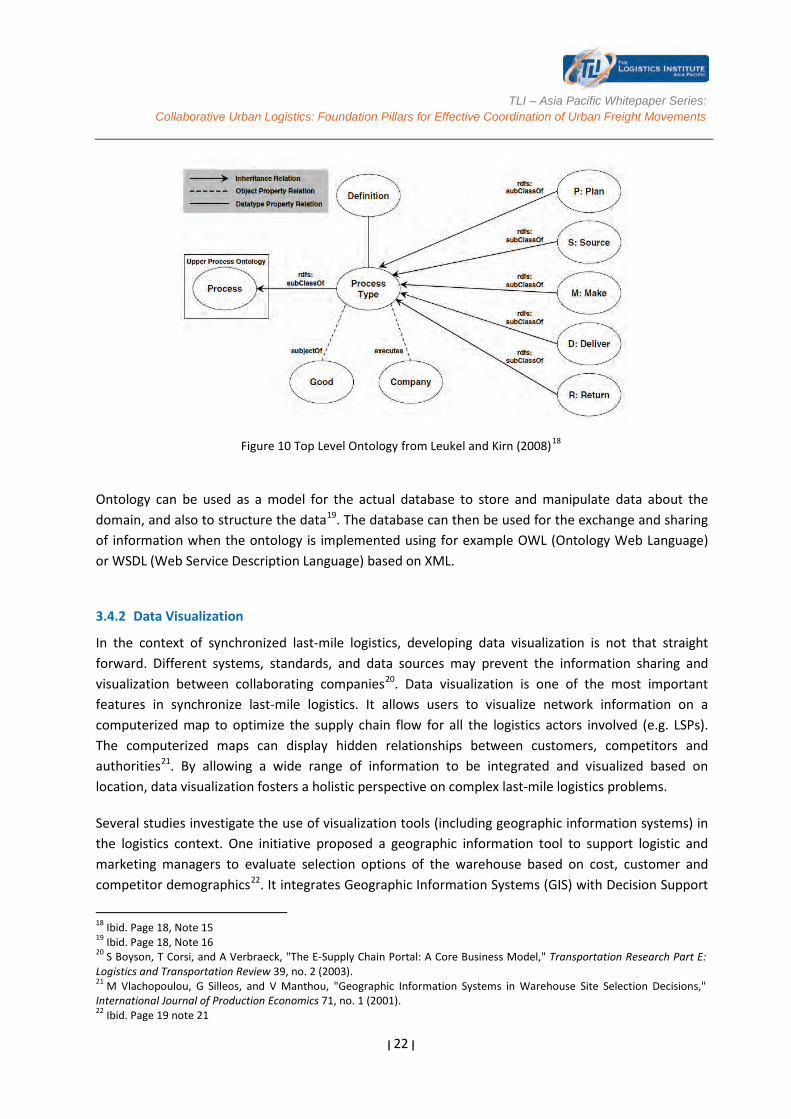
Ontology has attracted both industry and academia because of its ability to solving integration problems in information systems15. It has been used and implemented in city logistics16 and supply chain in general17. One interesting initiative for developing logistics ontology is based on the SCOR (Supply Chain Operations Reference) model15. The SCOR model is a comprehensive set of means for modeling supply chains which defines complete domain-specific elements for distinguishing different means of manufacturing and moving goods. The authors construct top level classes by reconstructing the semantics of SCOR. Their top level ontology, illustrated in Figure 10, is describing the logistics process in SCOR. Each process has properties which derived from SCOR natural language definition of each process type. Interconnected processes may have constraints depending on the process type. These constraints are stated in class facets.
By reusing the existing logistics knowledge in SCOR, the authors are able to cover all core processes of logistics. One limitation of this ontology is that it only focuses on logistics process and information flow due to the partial focus of SCOR model. As such it has a relatively poor representation of material aspects (i.e. vehicle, infrastructure, goods) of the logistics domain which is highly important in last-mile logistics.
13 H Chen, P J Daugherty, and T D Landry, "Supply Chain Process Integration: A Theoretical Framework," Journal of Business Logistics 30, no. 2 (2009); D Prajogo and J Olhager, "Supply Chain Integration and Performance: The Effects of Long-Term Relationships, Information Technology and Sharing, and Logistics Integration," International Journal of Production Economics 135, no. 1 (2012) 14 N Noy and D L McGuinness, "Ontology Development 101," Knowledge Systems Laboratory, Stanford University (2001). 15 J Leukel and S Kirn, "A Supply Chain Management Approach to Logistics Ontologies in Information Systems," in Business Information Systems (Springer, 2008). 16 N Anand, M. Yang, JHR van Duin and L Tavasszy. "GenCLOn: An ontology for city logistics." Expert Systems with Applications 39(15): 11944-11960 (2012). 17 J Hoxha, A Scheuermann, and S Bloehdorn, "An Approach to Formal and Semantic Representation of Logistics Services," in Proceedings of the Workshop on Artificial Intelligence and Logistics (AILog), 19th European Conference on Artificial Intelligence (ECAI 2010), Lisbon, Portugal (2010); Y Ye, D Yang, Z Jiang, and L Tong, "An Ontology-Based Architecture for Implementing Semantic Integration of Supply Chain Management," International Journal of Computer Integrated Manufacturing 21, no. 1 (2007).
TLI – Asia Pacific Whitepaper Series:
Collaborative Urban Logistics: Foundation Pillars for Effective Coordination of Urban Freight Movements
| 22 |
Figure 10 Top Level Ontology from Leukel and Kirn (2008)18
Ontology can be used as a model for the actual database to store and manipulate data about the domain, and also to structure the data19. The database can then be used for the exchange and sharing of information when the ontology is implemented using for example OWL (Ontology Web Language) or WSDL (Web Service Description Language) based on XML.
3.4.2 Data Visualization
In the context of synchronized last-mile logistics, developing data visualization is not that straight forward. Different systems, standards, and data sources may prevent the information sharing and visualization between collaborating companies20. Data visualization is one of the most important features in synchronize last-mile logistics. It allows users to visualize network information on a computerized map to optimize the supply chain flow for all the logistics actors involved (e.g. LSPs). The computerized maps can display hidden relationships between customers, competitors and authorities21. By allowing a wide range of information to be integrated and visualized based on location, data visualization fosters a holistic perspective on complex last-mile logistics problems.
Several studies investigate the use of visualization tools (including geographic information systems) in the logistics context. One initiative proposed a geographic information tool to support logistic and marketing managers to evaluate selection options of the warehouse based on cost, customer and competitor demographics22. It integrates Geographic Information Systems (GIS) with Decision Support
18 Ibid. Page 18, Note 15 19 Ibid. Page 18, Note 16 20 S Boyson, T Corsi, and A Verbraeck, "The E-Supply Chain Portal: A Core Business Model," Transportation Research Part E: Logistics and Transportation Review 39, no. 2 (2003). 21 M Vlachopoulou, G Silleos, and V Manthou, "Geographic Information Systems in Warehouse Site Selection Decisions," International Journal of Production Economics 71, no. 1 (2001). 22 Ibid. Page 19 note 21
TLI – Asia Pacific Whitepaper Series:
Collaborative Urban Logistics: Foundation Pillars for Effective Coordination of Urban Freight Movements
| 23 |
Systems (DSS). The tool provides location analysis based on the users’ criteria and visualize the warehouse spatially.
A different visualization tool is proposed to illustrate the flow of goods and materials through the supply chain on a transaction by transaction basis as a part of their supply chain integration portal for US Department of Defense23. The tool includes both a map as well as a log of the specific transaction. They claimed that this visualization tool helps to effectively identify the bottleneck and structural problems in the supply chain. In supply chain consulting, Hewlett-Packard recently introduced the Geographic Analytics (GA) tool in its analysis toolbox24. GA is able to provide insight for improving for example site location optimization, network flow optimization and supply chain risk management.
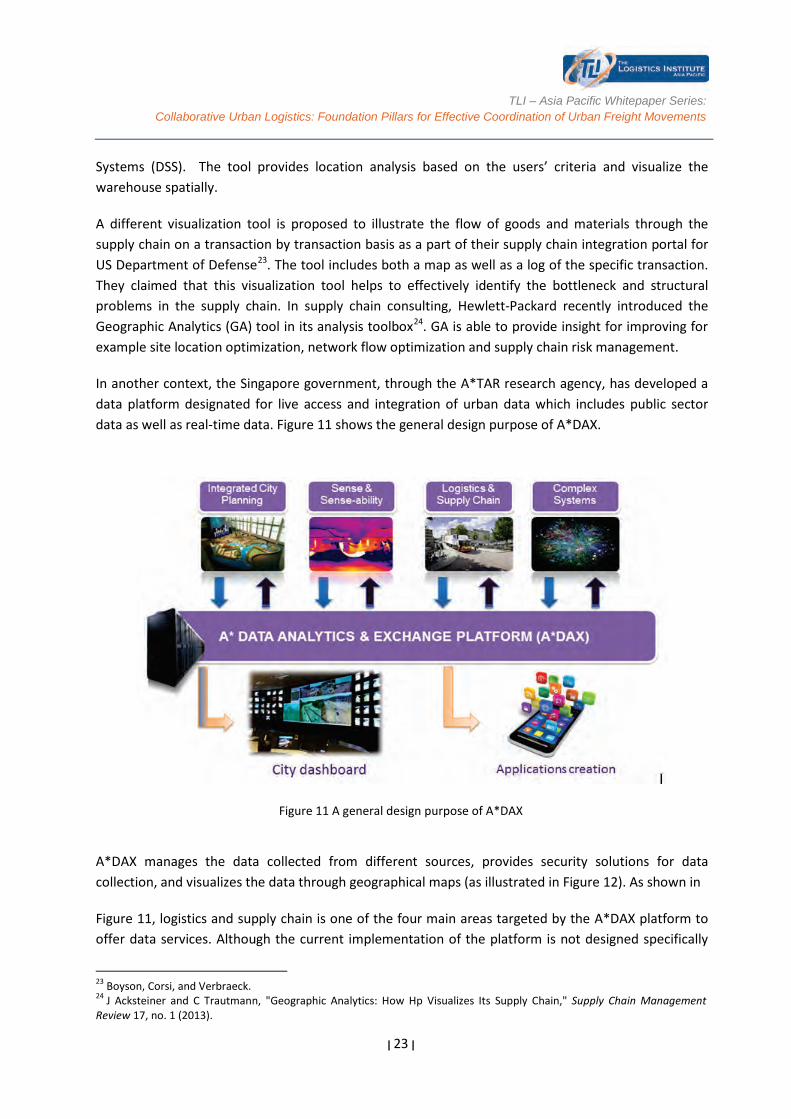
In another context, the Singapore government, through the A*TAR research agency, has developed a data platform designated for live access and integration of urban data which includes public sector data as well as real-time data. Figure 11 shows the general design purpose of A*DAX.
Figure 11 A general design purpose of A*DAX
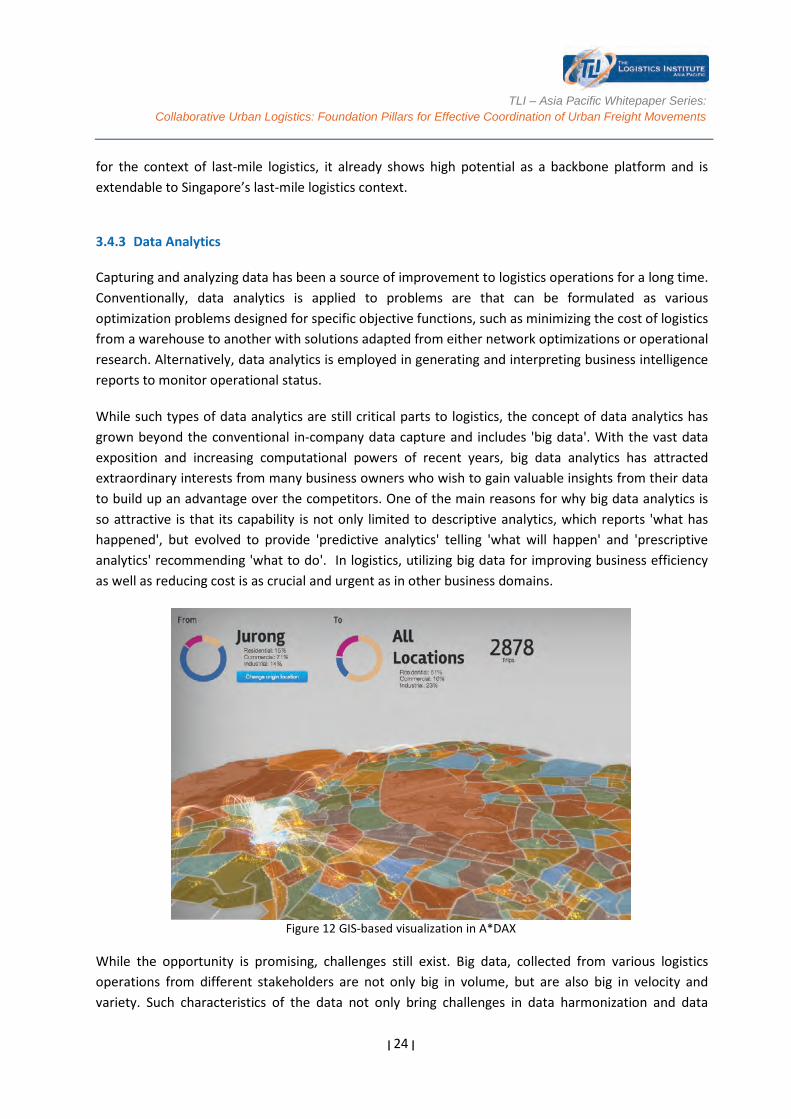
A*DAX manages the data collected from different sources, provides security solutions for data collection, and visualizes the data through geographical maps (as illustrated in Figure 12). As shown in
Figure 11, logistics and supply chain is one of the four main areas targeted by the A*DAX platform to offer data services. Although the current implementation of the platform is not designed specifically
23 Boyson, Corsi, and Verbraeck. 24 J Acksteiner and C Trautmann, "Geographic Analytics: How Hp Visualizes Its Supply Chain," Supply Chain Management Review 17, no. 1 (2013).
TLI – Asia Pacific Whitepaper Series:
Collaborative Urban Logistics: Foundation Pillars for Effective Coordination of Urban Freight Movements
| 24 |
for the context of last-mile logistics, it already shows high potential as a backbone platform and is extendable to Singapore’s last-mile logistics context.
3.4.3 Data Analytics
Capturing and analyzing data has been a source of improvement to logistics operations for a long time. Conventionally, data analytics is applied to problems are that can be formulated as various optimization problems designed for specific objective functions, such as minimizing the cost of logistics from a warehouse to another with solutions adapted from either network optimizations or operational research. Alternatively, data analytics is employed in generating and interpreting business intelligence reports to monitor operational status.
While such types of data analytics are still critical parts to logistics, the concept of data analytics has grown beyond the conventional in-company data capture and includes 'big data'. With the vast data exposition and increasing computational powers of recent years, big data analytics has attracted extraordinary interests from many business owners who wish to gain valuable insights from their data to build up an advantage over the competitors. One of the main reasons for why big data analytics is so attractive is that its capability is not only limited to descriptive analytics, which reports 'what has happened', but evolved to provide 'predictive analytics' telling 'what will happen' and 'prescriptive analytics' recommending 'what to do'. In logistics, utilizing big data for improving business efficiency as well as reducing cost is as crucial and urgent as in other business domains.
Figure 12 GIS-based visualization in A*DAX
While the opportunity is promising, challenges still exist. Big data, collected from various logistics operations from different stakeholders are not only big in volume, but are also big in velocity and variety. Such characteristics of the data not only bring challenges in data harmonization and data

TLI – Asia Pacific Whitepaper Series:
Collaborative Urban Logistics: Foundation Pillars for Effective Coordination of Urban Freight Movements
| 25 |
management, but also bring challenges in how to analyze them. Over the years, technologies and systems for managing and analyzing big data have been developed which make analytics tasks that were previously considered to now to be carried out rapidly and cheaply. Among other systems, Hadoop (http://hadoop.apache.org/), Hbase (http://hbase.apache.org/) and Cassandra (http://cassandra.apache.org/) derived from Google's BigTable 25 and MapReduce 26 systems have gained great popularity in commercial companies due to their capability and stability. While the above systems process data in batch mode, there are other systems that support real time query of the data, such as the Storm (http://storm-project.net) and Shark (http://shark.cs.berkeley.edu ). In addition, there are systems that support large scale machine learning such as Mahout (http://mahout.apache.org/) and Spark (http://spark.incubator.apache.org/).
The wide availability of platforms and tools for big data provides great support for various data analytics tasks in last mile logistics as well as building up specific analytics platform.
3.5 Key Takeaways
We have discussed our proposed data harmonization and analytics framework and existing initiatives related to the proposed framework. Data harmonization and analytics is a critical feature in synchronize last-mile logistics which not only provide the common platform for the stakeholders to interact and exchange information, but also provide data visualization and analytics to provide important and sometime hidden insight for better understanding of the last-mile logistics. It is also serves as a foundation for a deeper analysis such as future demand predictions and real-time dynamic interaction.
On the way to develop a simple and holistic data harmonization and analytics framework for last-mile logistics, we summarize the challenges as follows:
• How to develop last-mile logistics ontologies for Asia Pacific context that integrate large, heterogeneous, and complex data from different stakeholders?
• How to apply ontology models to develop a secure and flexible extension to the A*DAX platform and use this to provide “geographical situational analysis” as a prelude to deeper analysis, insights and generating key performance criteria?
• How to efficiently (i.e. achieving real time or near real time performance) utilize advanced data analytics techniques and existing tools to gain insight from ‘big data’ in the last-mile logistics context?
25 F Chang, J Dean, S Ghemawat, W C Hsieh, D A Wallach, M Burrows, T Chandra, A Fikes and R E Gruber. "Bigtable: A Distributed Storage System for Structured Data," ACM Transactions on Computer Systems (TOCS) 26, no. 2 (2008). 26 J Dean and S Ghemawat, "Mapreduce: Simplified Data Processing on Large Clusters," Communications of the ACM 51, no. 1 (2008).
TLI – Asia Pacific Whitepaper Series:
Collaborative Urban Logistics: Foundation Pillars for Effective Coordination of Urban Freight Movements
| 26 |
4. SYNCHRONIZATION & MULTI-OBJECTIVE PLANNING
4.1 Introduction
The proposed initiative in last-mile synchronization and multi-objective planning aims to support Logistics Service Providers (LSPs) that are responsible for deliveries in the urban environment. The section of the supply chain addressed in these activities is the allocation of resources to the ‘last leg’ of the supply chain, i.e. the segment starting at a pickup point where the item(s) to deliver are assumed to be available, typically a distribution center (either single company or consolidation center), and ending at the end customer for the delivery.
An LSP, if of a sufficiently large size in terms of fleet size (either owned or leased) will have to schedule resources (drivers, vehicles) in time, and allocate the pool of demand to these resource schedules. This high-level resource scheduling and demand allocation takes place before the detailed schedule of individual pickups and drops to vehicles, which is the scope of the Vehicle Routing Problem, discussed in the next section. For multiple smaller LSPs, such allocation can also be done, but this would be a coordinated activity as part of their participation in a coordination scheme, such as a consolidation center or a community based information sharing platform.
On the receiving end, larger customers that these LSPs serve, such as shopping mall and supermarket retailers, can have specific requirements on the level of the service that is provided to them. These are sometimes stipulated in contracts. Alternatively, groups of smaller retailers (if operating within one and the same shopping mall, for example) can have shared logistics service agreements with one or more LSPs, either directly or mediated (for example through the shippers that provide them or through third parties that arrange consolidated deliveries).
There is increasing pressure on both vendors and LSPs to play a role on increasing urban city life quality by incorporating impacts on other stakeholders in the urban environment in their decision making. These additional environmental, social and economic objectives introduce a resource scheduling problem to the LSP that is different from ‘traditional’ resource scheduling and optimization with a single objective to reduce operational costs. A multi-objective resource scheduling and optimization for truckload delivery in the last mile considers several potentially competing objectives, such as to improve the service quality and to reduce both operational costs and environmental impact costs, under the constraints of maintaining the delivery time and personalized quality services that are expected by customers.
In the multi-objective resource scheduling model, the uncertainties in both supply-side and demand-side should be considered. When we discuss last-mile transportation resource scheduling, many uncertainties play a role, such as upstream delivery delays, performance risks, interest rate fluctuations, exchange rate changes, and so on; in the internal processes, uncertainties can be in the form of forecast inaccuracy, inventory, capacity, information system, intellectual property, labor-
TLI – Asia Pacific Whitepaper Series:
Collaborative Urban Logistics: Foundation Pillars for Effective Coordination of Urban Freight Movements
| 27 |
employer relationship; on the demand side, the LSP can encounter uncertainties of receivables and demand uncertainty. Most literature focuses only on demand-side uncertainty, which is related to fluctuations in the demand for products, as opposed to the supply-side uncertainty, which deals with uncertain conditions that affect the production and transportation processes of the supply chain. A consequence of the problem focus on the last leg of the supply chain is that the accumulated supply-side risk upstream can be significant.
An important element of the multi-objective optimization is the expectations and information sharing between vendors and LSPs, which can be formalized in signed service contracts. Logistics contracts have three functions; proof of what was agreed upon in case of conflict, acting as a function of managing individuals or entities (internal or external) and as an interpretation tool to decipher aspects of the agreement that are not obvious27. These contracts between stakeholders in the last mile are known to vary in nature and content from customer to customer and product to product. However, the more similar these contracts are for a given stakeholder group, the lower the barriers of entry become for the groups’ participation in collaborative multi-objective optimization.
Multi-objective optimization provides optimized solutions for the problem described in the mathematical objectives and constraints. To address the complexity of the urban freight system in which these solutions are utilized, the Synchronization & Multi Objective Planning solutions also address the sensitivities to dynamic elements in the urban freight delivery system. This is a complex system, influenced by economy, population, environment and other sectors28. A better understanding of these dynamics, in part specific to the Singaporean environment, will help improve the last mile logistics for suppliers logistics service providers, shippers, and urban consumers, by allowing decision makers to remove incongruences between changing stakeholder goals on the one hand, and the objectives used in optimization models on the other.
27 T Roxenhall and P Ghauri, "Use of the Written Contract in Long-Lasting Business Relationships," Industrial Marketing Management 33, no. 3 (2004). 28 K W Ogden, Urban Goods Movement : A Guide to Policy and Planning, vol. 753336 (Aldershot, Hants, England: : Ashgate, 1992).
TLI – Asia Pacific Whitepaper Series:
Collaborative Urban Logistics: Foundation Pillars for Effective Coordination of Urban Freight Movements
| 28 |
4.2 Key Dimensions for Synchronizing the Last Mile
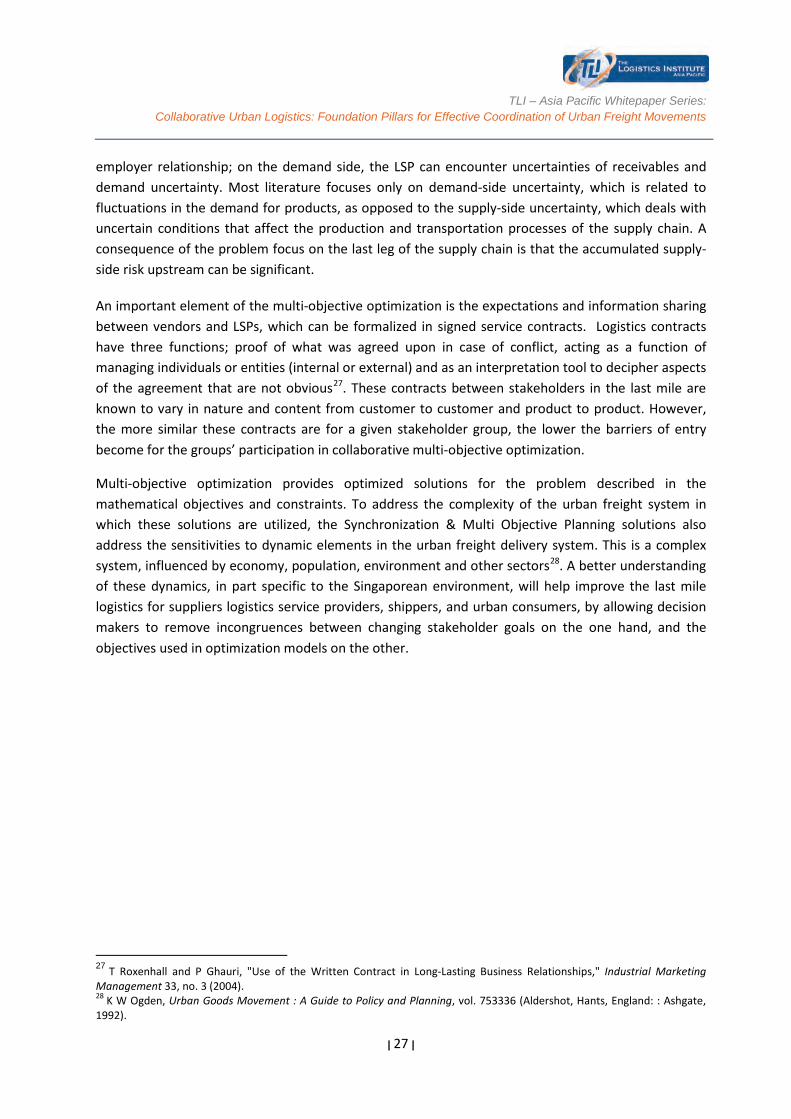
Figure 13 Synchronizing the Last Mile – Dimension Framework
The key factors in synchronizing the last mile is illustrated Figure 13. The synchronized last mile helps the stakeholders to minimize total cost of vehicle (ownership, operation and coordination). It also reduces negative externalities in congestion due to uncoordinated LSPs. The main actors in synchronized last mile are LSPs and customers where they interact based on a contract with tight Service Level Agreement (SLA).
4.3 Stakeholder Interaction and Data Exchange
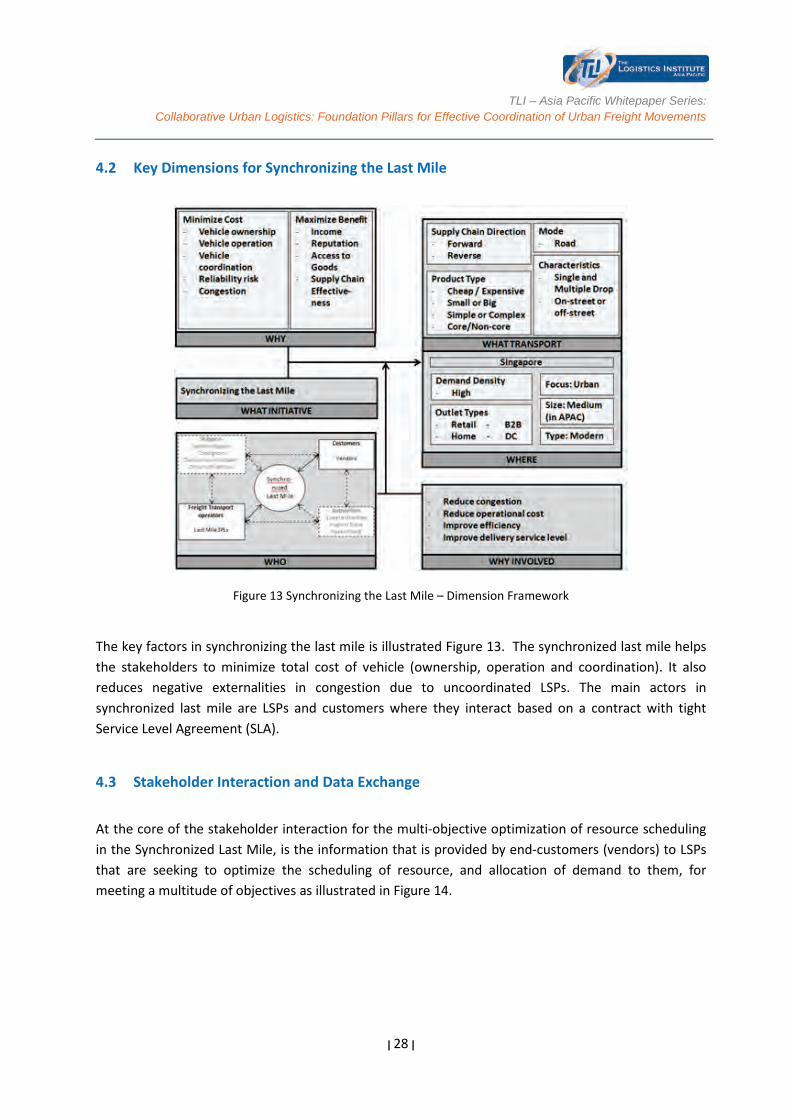
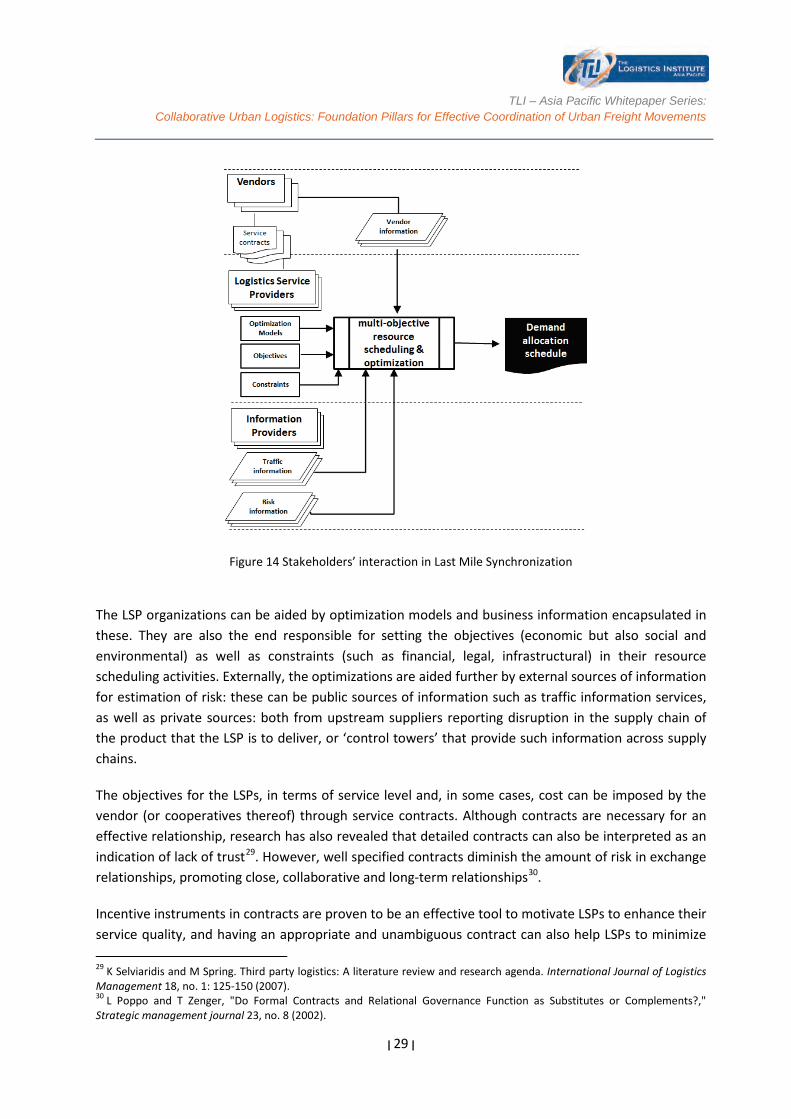
At the core of the stakeholder interaction for the multi-objective optimization of resource scheduling in the Synchronized Last Mile, is the information that is provided by end-customers (vendors) to LSPs that are seeking to optimize the scheduling of resource, and allocation of demand to them, for meeting a multitude of objectives as illustrated in Figure 14.
TLI – Asia Pacific Whitepaper Series:
Collaborative Urban Logistics: Foundation Pillars for Effective Coordination of Urban Freight Movements
| 29 |
Figure 14 Stakeholders’ interaction in Last Mile Synchronization
The LSP organizations can be aided by optimization models and business information encapsulated in these. They are also the end responsible for setting the objectives (economic but also social and environmental) as well as constraints (such as financial, legal, infrastructural) in their resource scheduling activities. Externally, the optimizations are aided further by external sources of information for estimation of risk: these can be public sources of information such as traffic information services, as well as private sources: both from upstream suppliers reporting disruption in the supply chain of the product that the LSP is to deliver, or ‘control towers’ that provide such information across supply chains.
The objectives for the LSPs, in terms of service level and, in some cases, cost can be imposed by the vendor (or cooperatives thereof) through service contracts. Although contracts are necessary for an effective relationship, research has also revealed that detailed contracts can also be interpreted as an indication of lack of trust29. However, well specified contracts diminish the amount of risk in exchange relationships, promoting close, collaborative and long-term relationships30.
Incentive instruments in contracts are proven to be an effective tool to motivate LSPs to enhance their service quality, and having an appropriate and unambiguous contract can also help LSPs to minimize 29 K Selviaridis and M Spring. Third party logistics: A literature review and research agenda. International Journal of Logistics Management 18, no. 1: 125-150 (2007). 30 L Poppo and T Zenger, "Do Formal Contracts and Relational Governance Function as Substitutes or Complements?," Strategic management journal 23, no. 8 (2002).
TLI – Asia Pacific Whitepaper Series:
Collaborative Urban Logistics: Foundation Pillars for Effective Coordination of Urban Freight Movements
| 30 |
risk and increase profit 31. Information sharing between customer and LSPs helps to enhance collaboration and coordination. However, it is also risky to share business secrets (like demand or cost) due to conflicts of interest and the possibility of information leakage32 .
In addition to the arrangements between vendors and LSPs, constraints and objectives to the multi-objective optimization problem are influenced by public authorities: governments can impose time access restrictions and additional environmental measures that an LSP, when delivering goods in urban areas, will have to cope with33.
4.4 Recent Studies in Synchronizing the Last Mile
In this section we discuss recent literature in the three main areas that we focus on in our project: multi-objective optimization, service level and contract management analysis and interaction with the urban freight system.
4.4.1 Multi-Objective Optimization
Multi-objective resource scheduling problems play a key role in many applications. Whenever a set of resources needs to be matched to a set of uncertain demands, the multiple goals are to find the most profitable or least costly allocation of the resources, at the least time to deliver the resources to the customers and to minimize the supply chain risk under disruptions. Recent examples of applications of multi-objective resource scheduling stem from a wide range of areas, including traffic networks34 and wireless video sensor networks35.
Multi-objective resource scheduling for last-mile logistics has not been widely covered in research. A model proposed for peak-hour urban freight movements with limited data availability36. A case study in the city of Seville of Spain shows the efficiency of the model. A multi-objective robust stochastic programming model for disaster relief logistics under uncertainty is presented37. In this model, not only demands but also supplies and the cost of procurement and transportation are considered as the
31 T Jin and P Wang, "Planning Performance Based Contracts Considering Reliability and Uncertain System Usage," Journal of the Operational Research Society 63, no. 10 (2012). 32 N Berente, B Vandenbosch, and B Aubert. Information flows and business process integration. Business Process Management Journal 15, no. 1: 119-141 (2009). 33 H J Quak, H J Hans and M René BM de Koster. Delivering goods in urban areas: How to deal with urban policy restrictions and the environment. Transportation Science 43, no. 2: 211-227 (2009). 34 Y J Gong, J Zhang, H Chung, W Chen, Z H Zhan, Y Li, and Y Shi. An efficient resource allocation scheme using particle swarm optimization, Evolutionary Computation, IEEE Transactions on 16(6): 801-816 (2012), Harks, Tobias and Konstantin Miller.The worst-case efficiency of cost sharing methods in resource allocation games. Operations research 59, no. 6: 1491-1503 (2011). 35 Z He and D Wu.Resource allocation and performance analysis of wireless video sensors. IEEE Transactions on Circuits and Systems for Video Technology 16, no. 5: 590-599 (2006). 36 J Muñuzuri, P Cortés, L Onieva, and J Guadix. Modelling peak-hour urban freight movements with limited data availability. Computers & Industrial Engineering 59, no. 1: 34-44 (2010). 37 A Bozorgi-Amiri, M S Jabalameli, and S M J Mirzapour Al-e-Hashem. A multi-objective robust stochastic programming model for disaster relief logistics under uncertainty. OR Spectrum: 1-29 (2011).
TLI – Asia Pacific Whitepaper Series:
Collaborative Urban Logistics: Foundation Pillars for Effective Coordination of Urban Freight Movements
| 31 |
uncertain parameters. Another research gave a method to cope with policy restrictions and the environment when delivering goods in urban areas38.
There are, on the other hand, many papers modeling supply chain management as multi-objective optimization problem: multi-criteria decision making models for supplier evaluation and selection39; multi-objective robust optimization model for multi-product multi-site aggregate production planning in a supply chain under uncertainty36; and a multi-objective optimization approach to plan the production, distribution and capacity of global supply chains in the process industry40.
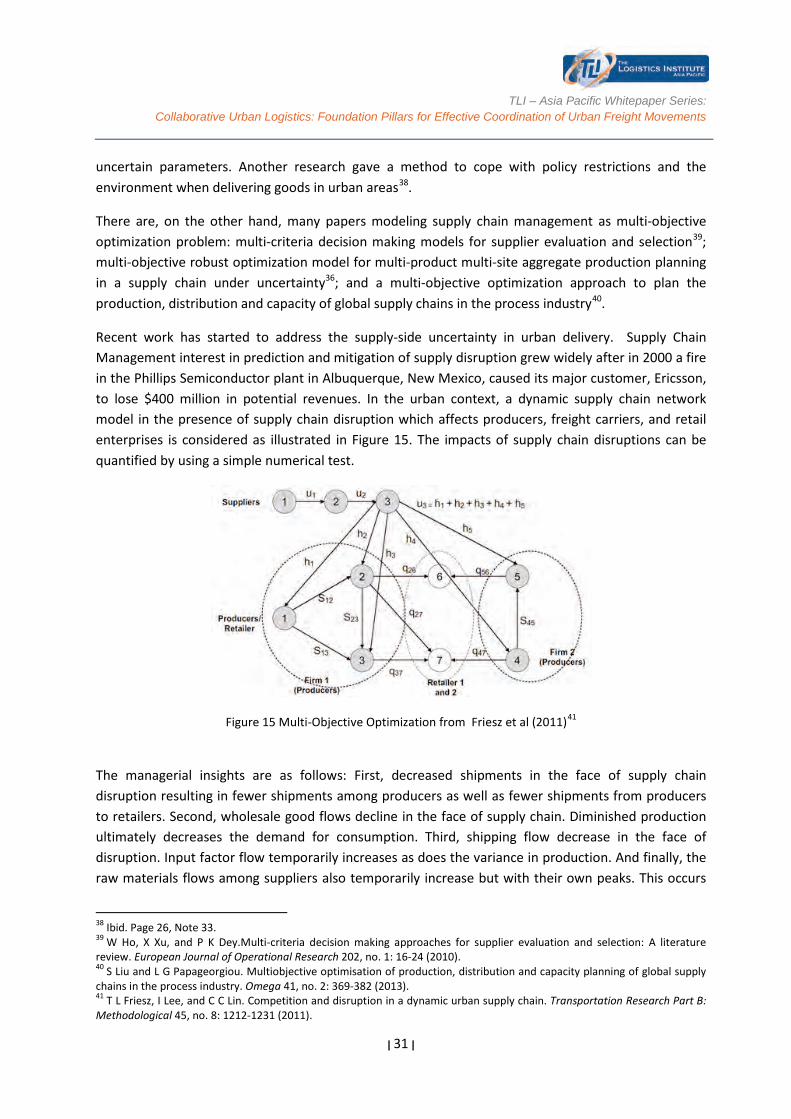
Recent work has started to address the supply-side uncertainty in urban delivery. Supply Chain Management interest in prediction and mitigation of supply disruption grew widely after in 2000 a fire in the Phillips Semiconductor plant in Albuquerque, New Mexico, caused its major customer, Ericsson, to lose $400 million in potential revenues. In the urban context, a dynamic supply chain network model in the presence of supply chain disruption which affects producers, freight carriers, and retail enterprises is considered as illustrated in Figure 15. The impacts of supply chain disruptions can be quantified by using a simple numerical test.
Figure 15 Multi-Objective Optimization from Friesz et al (2011)41
The managerial insights are as follows: First, decreased shipments in the face of supply chain disruption resulting in fewer shipments among producers as well as fewer shipments from producers to retailers. Second, wholesale good flows decline in the face of supply chain. Diminished production ultimately decreases the demand for consumption. Third, shipping flow decrease in the face of disruption. Input factor flow temporarily increases as does the variance in production. And finally, the raw materials flows among suppliers also temporarily increase but with their own peaks. This occurs
38 Ibid. Page 26, Note 33. 39 W Ho, X Xu, and P K Dey.Multi-criteria decision making approaches for supplier evaluation and selection: A literature review. European Journal of Operational Research 202, no. 1: 16-24 (2010). 40 S Liu and L G Papageorgiou. Multiobjective optimisation of production, distribution and capacity planning of global supply chains in the process industry. Omega 41, no. 2: 369-382 (2013). 41 T L Friesz, I Lee, and C C Lin. Competition and disruption in a dynamic urban supply chain. Transportation Research Part B: Methodological 45, no. 8: 1212-1231 (2011).
TLI – Asia Pacific Whitepaper Series:
Collaborative Urban Logistics: Foundation Pillars for Effective Coordination of Urban Freight Movements
| 32 |
because suppliers are sensitive to the variance of raw material flows. In order to minimize supply costs, a high value of risk aversion factor required the suppliers to narrow the variance of raw material flows. This resulted in a gradually change in the raw material flows.
4.4.2 Service level and contract performance analysis
There are no examples of specific service contracts between vendors and logistics service providers in last mile delivery available in the research literature; on the other hand, extensive literature exists in the field of supply chain and coordination contracts. For last mile logistics services these contracts can contain clauses on
• Compensation (cost)
• Amount / frequency of transport services to be delivered
• Service level i.e. % of shipments to be completed within boundaries of o Quality o Quantity o Time windows
• Order fulfillment lead time (time between order dispatch and delivery)
For designing an appropriate contract in the supply chain for cost alone, the problem can be framed as the so-called newsvendor problem, Cachon et al (2003)42 in which a vendor places orders well before the selling period; demand for each time period is unknown. Depending on the contractual agreement between both parties, a retailer will have a different behavior in placing orders. The problem now is which contractual model to devise so that the retailer is incentivized to make decisions that are beneficial to both members. In a review of applications of different contracts to this problem the conclusion is unambiguous: all these contracts, by themselves, fail to coordinate the supply chain in experimental setups43. This result is for cost incentive contracts alone which do not grasp additional requirements that can be included in the multi-objective optimization such as service level with time windows and fuel usage.
It is due to this shortcoming that further effort is needed, and integrating effective supply chain practice with effective information sharing is critical for improving the supply chain. Supply chain partners can improve their alliance through information sharing by enhancing initiatives such as vendor managed inventory, continuous replenishment programs and collaborative forecasting. In such a contract, the specific information required for successful last-mile delivery from stakeholders involved can be included as well. Zhou et.al. (2007)44 identified nine characteristics of information -
42 G P Cachon. Supply chain coordination with contracts. Handbooks in operations research and management science 11: 227-339 (2003). 43 E Elahi, N Lamba, and C Ramaswamy. How can we improve the performance of supply chain contracts? An experimental study. International Journal of Production Economics 142, no. 1: 146-157 (2013). 44 H Zhou and WC Benton Jr. Supply chain practice and information sharing. Journal of Operations Management 25, no. 6: 1348-1365 (2007).
TLI – Asia Pacific Whitepaper Series:
Collaborative Urban Logistics: Foundation Pillars for Effective Coordination of Urban Freight Movements
| 33 |
accuracy, availability, timeliness, internal and external connectivity, completeness, relevance, accessibility and frequently of update. To design an effective service contract, it is necessary to identify the useful information as well as quality of information to facilitate the appropriate incentive mechanism.
The demand for information sharing and the additional objectives to meet in terms of service level, cost and environmental outputs, makes the retailer – last mile LSP contracts specifically fit to applications of performance-based contracts (PBC). In this set-up, the customer selects an appropriate performance measure based on the system properties and the ultimate objective. The customer also defines an effective metric to measure the specified performance during the contract period. The customer offers a compensation model which determines the payment to the supplier during the lifetime of the contract. The supplier or LSP, as the other actor in the contract, will then decide some conditions (such as availability of information on inventory level, time windows etc.) to deliver the performance required.
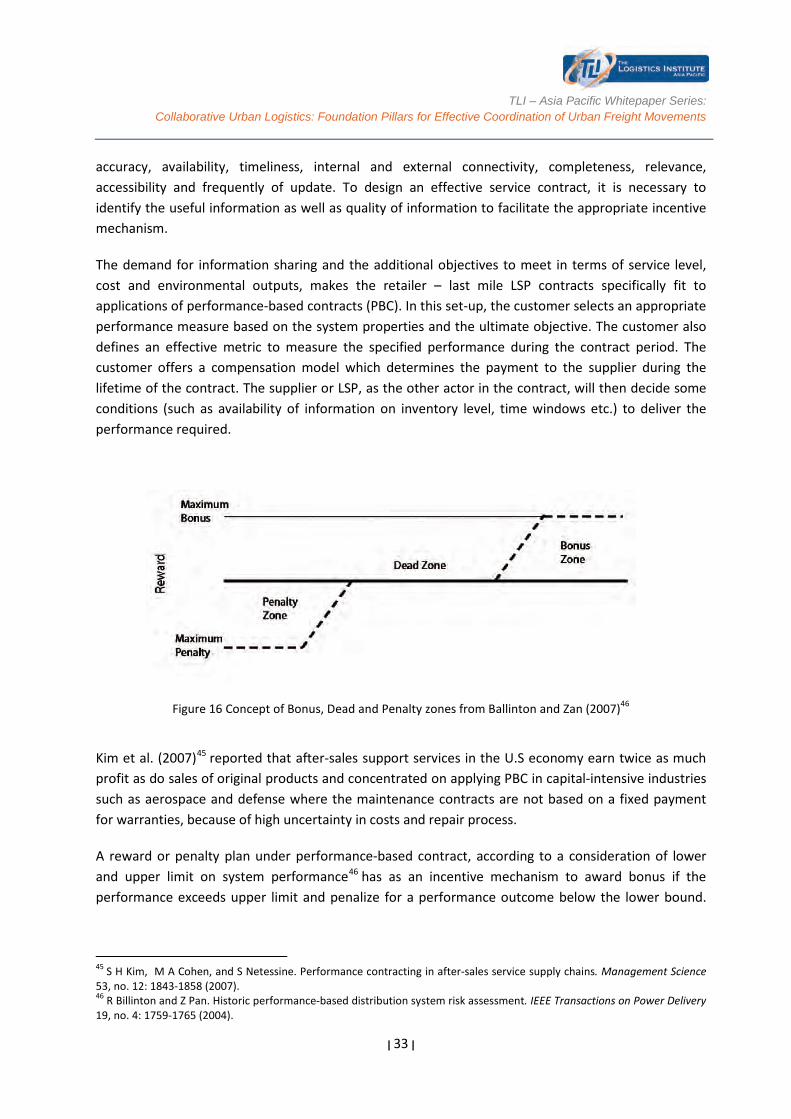
Figure 16 Concept of Bonus, Dead and Penalty zones from Ballinton and Zan (2007)46
Kim et al. (2007)45 reported that after-sales support services in the U.S economy earn twice as much profit as do sales of original products and concentrated on applying PBC in capital-intensive industries such as aerospace and defense where the maintenance contracts are not based on a fixed payment for warranties, because of high uncertainty in costs and repair process.
A reward or penalty plan under performance-based contract, according to a consideration of lower and upper limit on system performance46 has as an incentive mechanism to award bonus if the performance exceeds upper limit and penalize for a performance outcome below the lower bound.
45 S H Kim, M A Cohen, and S Netessine. Performance contracting in after-sales service supply chains. Management Science 53, no. 12: 1843-1858 (2007). 46 R Billinton and Z Pan. Historic performance-based distribution system risk assessment. IEEE Transactions on Power Delivery 19, no. 4: 1759-1765 (2004).
TLI – Asia Pacific Whitepaper Series:
Collaborative Urban Logistics: Foundation Pillars for Effective Coordination of Urban Freight Movements
| 34 |
Three zones are defined as per outcome performance: the penalty, bonus and dead zone as illustrated in Figure 16.
Another form of incentivizing for coordination among the members of supply chain is revenue-sharing among partners, where the final seller gets a percentage of the revenue of the supplier 47 . Alternatively, monetary incentives can be given directly for the provision of information: this requires for the value of information to be quantified48.
4.4.3 Simulation of interaction with the urban freight system
Optimized resource allocation solutions can be generated from multi-objective optimization only based on a limited set of objectives, constraints and parameters. In real-life application, the solutions will dynamically interact with the (evolving) urban freight system. This has implications for both the sensitivity of the solutions coming out of the optimization models. Through better understanding of the dynamics of the urban freight system, the objectives of the overall system can be brought in line with the objectives of the optimization models as well as the service contracts.
Furthermore, understanding of system level interaction (dynamics) is also essential to the success of the Collaborative Urban Logistics initiatives in general, particularly to address the complexities specific to Singapore. The system dynamics approach addresses system-level problems and considers the nonlinear interactions among the already complex related sub-systems in Singapore.
A system dynamics model allows for the many factors that contribute to traffic congestion to be identified and simulated taking into account the impact of the causal loops in a temporal sense. This is particularly valuable in practice, as the stakeholders of the last mile have to be active participants in understanding and managing congestion better. Such models allow for the interactional relationship among the various variables to be analyzed quickly and visually to reinforce “what-if” scenario analysis.
The urban freight system is complex and modeling it is not a straightforward exercise. An appropriate model would include not just transportation but also, social, political, and economic subsystems along with the interactions, causal loops, and feedback mechanisms that occur between them. The domain of the political subsystem includes the transportation related policies, such as, the traffic congestion pricing policy, the revenue distribution mechanism obtained from the congestion pricing scheme and the interventions (such as subsidies) that counter social exclusion arising from the implementation of the transportation policies 49.
47 G P Cachon and M A Lariviere. Supply chain coordination with revenue-sharing contracts: Strengths and limitations. Management science 51, no. 1: 30-44 (2005). 48 H L Lee, K C So, and C S Tang. The value of information sharing in a two-level supply chain. Management science 46, no. 5: 626-643 (2000). 49 S Liu, K P Triantis, and S Sarangi. A framework for evaluating the dynamic impacts of a congestion pricing policy for a transportation socioeconomic system. Transportation Research Part A: Policy and Practice 44, no. 8: 596-608 (2010).
TLI – Asia Pacific Whitepaper Series:
Collaborative Urban Logistics: Foundation Pillars for Effective Coordination of Urban Freight Movements
| 35 |
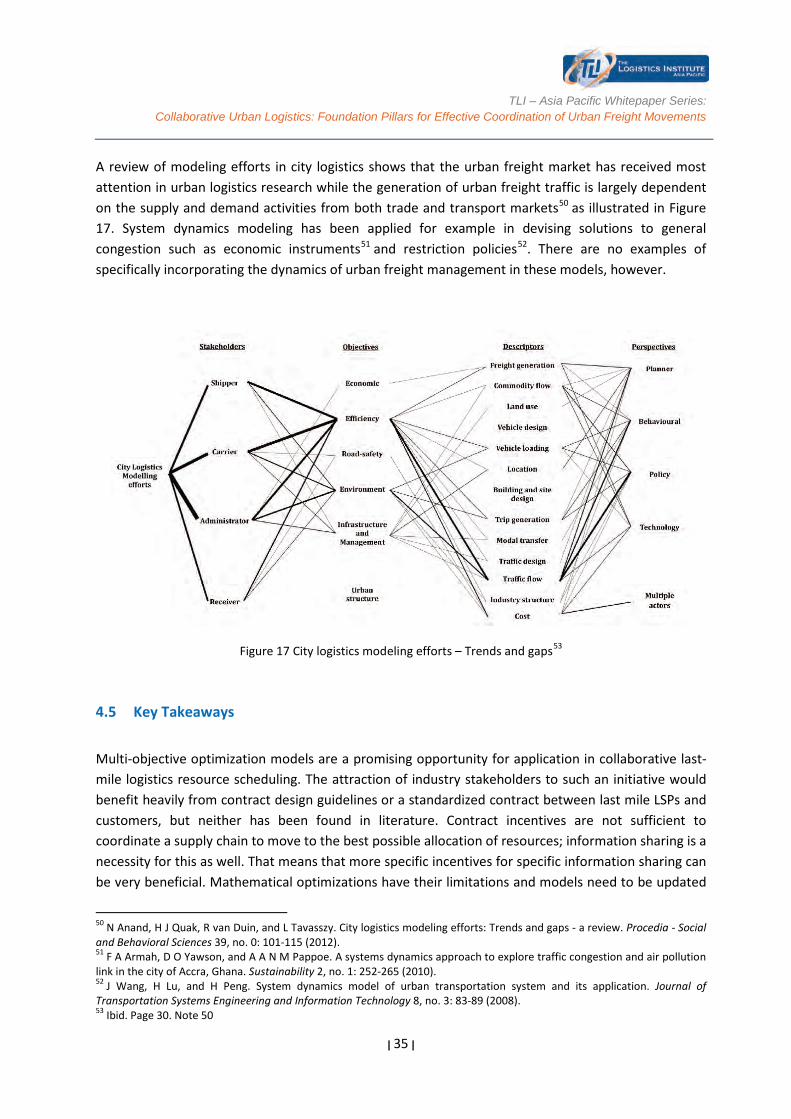
A review of modeling efforts in city logistics shows that the urban freight market has received most attention in urban logistics research while the generation of urban freight traffic is largely dependent on the supply and demand activities from both trade and transport markets50 as illustrated in Figure 17. System dynamics modeling has been applied for example in devising solutions to general congestion such as economic instruments51 and restriction policies52. There are no examples of specifically incorporating the dynamics of urban freight management in these models, however.
Figure 17 City logistics modeling efforts – Trends and gaps53
4.5 Key Takeaways
Multi-objective optimization models are a promising opportunity for application in collaborative last-mile logistics resource scheduling. The attraction of industry stakeholders to such an initiative would benefit heavily from contract design guidelines or a standardized contract between last mile LSPs and customers, but neither has been found in literature. Contract incentives are not sufficient to coordinate a supply chain to move to the best possible allocation of resources; information sharing is a necessity for this as well. That means that more specific incentives for specific information sharing can be very beneficial. Mathematical optimizations have their limitations and models need to be updated
50 N Anand, H J Quak, R van Duin, and L Tavasszy. City logistics modeling efforts: Trends and gaps - a review. Procedia - Social and Behavioral Sciences 39, no. 0: 101-115 (2012). 51 F A Armah, D O Yawson, and A A N M Pappoe. A systems dynamics approach to explore traffic congestion and air pollution link in the city of Accra, Ghana. Sustainability 2, no. 1: 252-265 (2010). 52 J Wang, H Lu, and H Peng. System dynamics model of urban transportation system and its application. Journal of Transportation Systems Engineering and Information Technology 8, no. 3: 83-89 (2008). 53 Ibid. Page 30. Note 50

TLI – Asia Pacific Whitepaper Series:
Collaborative Urban Logistics: Foundation Pillars for Effective Coordination of Urban Freight Movements
| 36 |
as the urban freight system evolves; a thorough understanding of this system and its inherent dynamics through simulation modeling effort in system dynamics will help a great deal in ensuring the sustainability of resource allocation initiatives in urban logistics. The key challenges and problem statements to industry are summarized as follows:
• How may LSPs adopt multi-objective planning mechanisms to improve efficiency in urban freight delivery?
• How may suppliers, end customers and LSPs have better visibility of delivery performance of the transport service contracts?
• How can system dynamics simulation models allow for a deeper understanding and lead to more robust strategies for managing the inherent trade-offs to last mile synchronization in a structured manner?
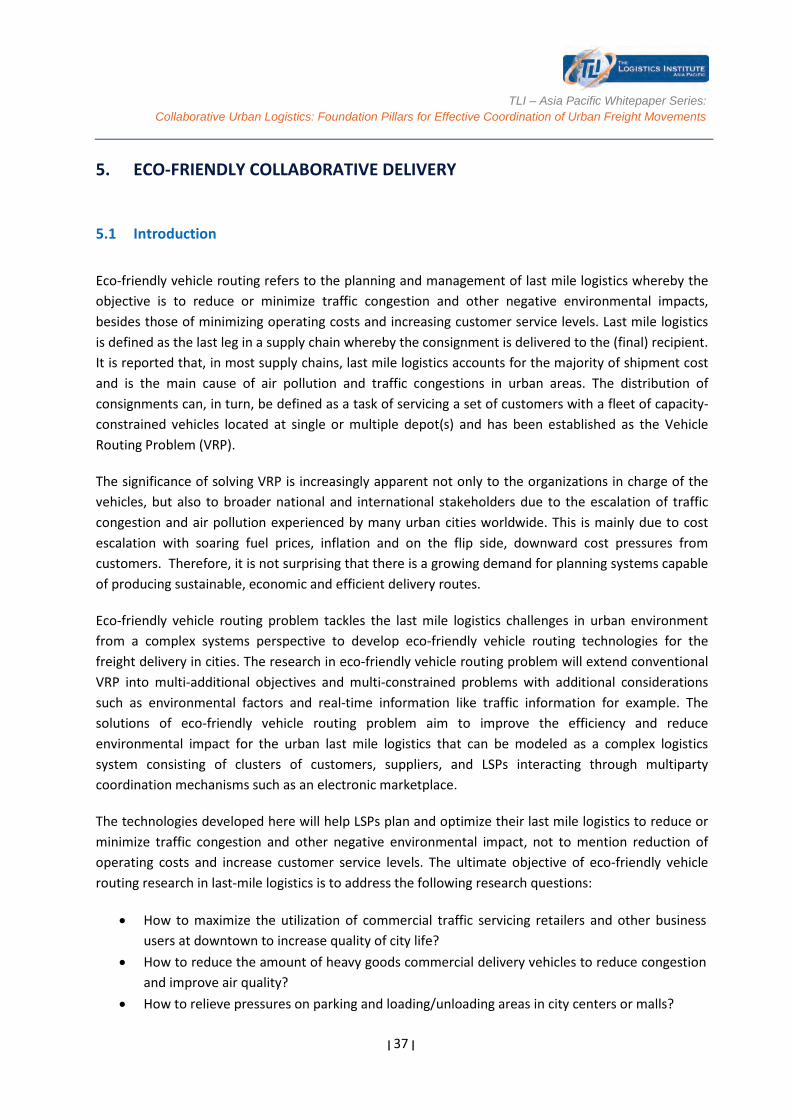
TLI – Asia Pacific Whitepaper Series:
Collaborative Urban Logistics: Foundation Pillars for Effective Coordination of Urban Freight Movements
| 37 |
5. ECO-FRIENDLY COLLABORATIVE DELIVERY
5.1 Introduction
Eco-friendly vehicle routing refers to the planning and management of last mile logistics whereby the objective is to reduce or minimize traffic congestion and other negative environmental impacts, besides those of minimizing operating costs and increasing customer service levels. Last mile logistics is defined as the last leg in a supply chain whereby the consignment is delivered to the (final) recipient. It is reported that, in most supply chains, last mile logistics accounts for the majority of shipment cost and is the main cause of air pollution and traffic congestions in urban areas. The distribution of consignments can, in turn, be defined as a task of servicing a set of customers with a fleet of capacity-constrained vehicles located at single or multiple depot(s) and has been established as the Vehicle Routing Problem (VRP).
The significance of solving VRP is increasingly apparent not only to the organizations in charge of the vehicles, but also to broader national and international stakeholders due to the escalation of traffic congestion and air pollution experienced by many urban cities worldwide. This is mainly due to cost escalation with soaring fuel prices, inflation and on the flip side, downward cost pressures from customers. Therefore, it is not surprising that there is a growing demand for planning systems capable of producing sustainable, economic and efficient delivery routes.
Eco-friendly vehicle routing problem tackles the last mile logistics challenges in urban environment from a complex systems perspective to develop eco-friendly vehicle routing technologies for the freight delivery in cities. The research in eco-friendly vehicle routing problem will extend conventional VRP into multi-additional objectives and multi-constrained problems with additional considerations such as environmental factors and real-time information like traffic information for example. The solutions of eco-friendly vehicle routing problem aim to improve the efficiency and reduce environmental impact for the urban last mile logistics that can be modeled as a complex logistics system consisting of clusters of customers, suppliers, and LSPs interacting through multiparty coordination mechanisms such as an electronic marketplace.
The technologies developed here will help LSPs plan and optimize their last mile logistics to reduce or minimize traffic congestion and other negative environmental impact, not to mention reduction of operating costs and increase customer service levels. The ultimate objective of eco-friendly vehicle routing research in last-mile logistics is to address the following research questions:
• How to maximize the utilization of commercial traffic servicing retailers and other business users at downtown to increase quality of city life?
• How to reduce the amount of heavy goods commercial delivery vehicles to reduce congestion and improve air quality?
• How to relieve pressures on parking and loading/unloading areas in city centers or malls?
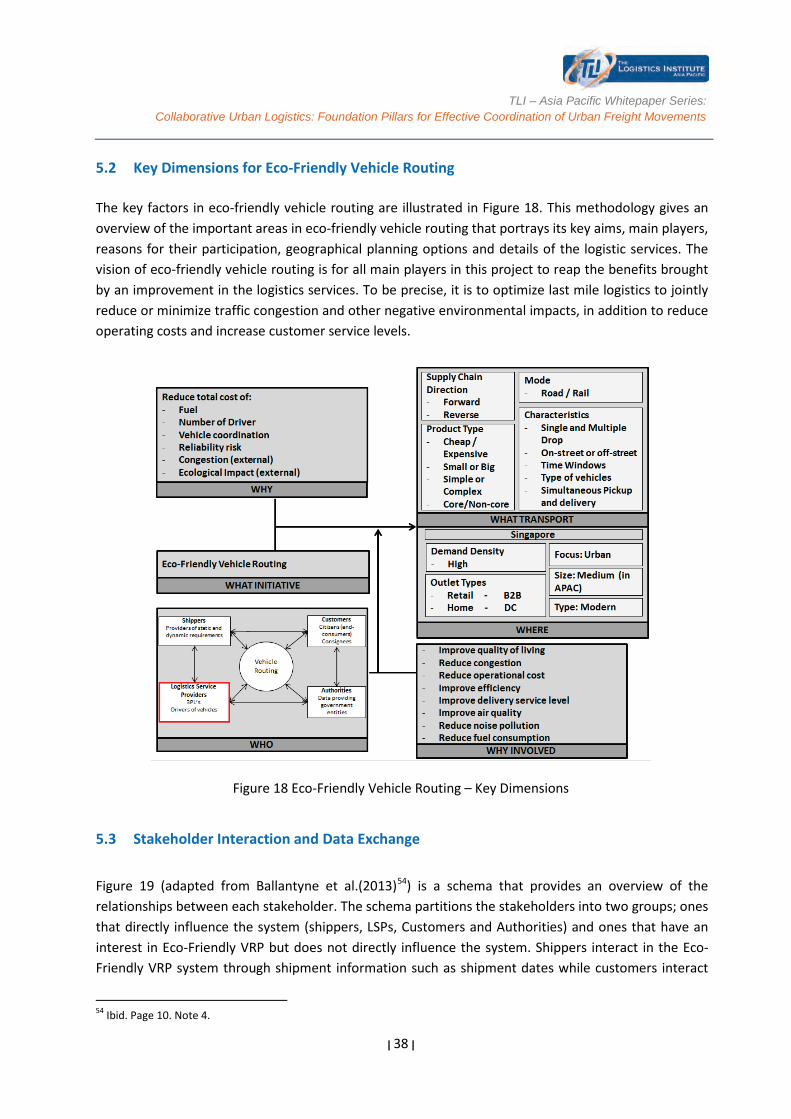
TLI – Asia Pacific Whitepaper Series:
Collaborative Urban Logistics: Foundation Pillars for Effective Coordination of Urban Freight Movements
| 38 |
5.2 Key Dimensions for Eco-Friendly Vehicle Routing
The key factors in eco-friendly vehicle routing are illustrated in Figure 18. This methodology gives an overview of the important areas in eco-friendly vehicle routing that portrays its key aims, main players, reasons for their participation, geographical planning options and details of the logistic services. The vision of eco-friendly vehicle routing is for all main players in this project to reap the benefits brought by an improvement in the logistics services. To be precise, it is to optimize last mile logistics to jointly reduce or minimize traffic congestion and other negative environmental impacts, in addition to reduce operating costs and increase customer service levels.
Figure 18 Eco-Friendly Vehicle Routing – Key Dimensions
5.3 Stakeholder Interaction and Data Exchange
Figure 19 (adapted from Ballantyne et al.(2013)54) is a schema that provides an overview of the relationships between each stakeholder. The schema partitions the stakeholders into two groups; ones that directly influence the system (shippers, LSPs, Customers and Authorities) and ones that have an interest in Eco-Friendly VRP but does not directly influence the system. Shippers interact in the Eco-Friendly VRP system through shipment information such as shipment dates while customers interact
54 Ibid. Page 10. Note 4.
TLI – Asia Pacific Whitepaper Series:
Collaborative Urban Logistics: Foundation Pillars for Effective Coordination of Urban Freight Movements
| 39 |
through demand and order information. The LSPs interact with the system through delivery information. Lastly, the Authorities interact with the system through regulation and traffic information.
Apart from the actors, there are stakeholders who indirectly interact with the system via shippers, LSPs, customers and authorities using other information data such as fuel economy, speed, capacity, cost information of the respective vehicles, map and traffic data, and trade data.
Figure 19 Eco-Friendly Vehicle Routing – Stakeholder interaction
5.4 Recent Initiatives in Eco-Friendly Vehicle Routing
Eco-friendly logistics focuses not only on economic benefits, but also on environmental impacts and sustainable growth of logistics services. The review of eco-friendly vehicle routing problem is not limited to static VRP where all information is known before hand, but also dynamic VRP where information is uncertain due to dynamic changes in environment such as traffic conditions that can be illustrated as Figure 20. The recent initiatives can be grouped into green vehicle routing problem, pollution vehicle routing problem and vehicle routing in reverse logistics. Green vehicle routing problem contains transportation, energy consumption and more as its research areas, most of them
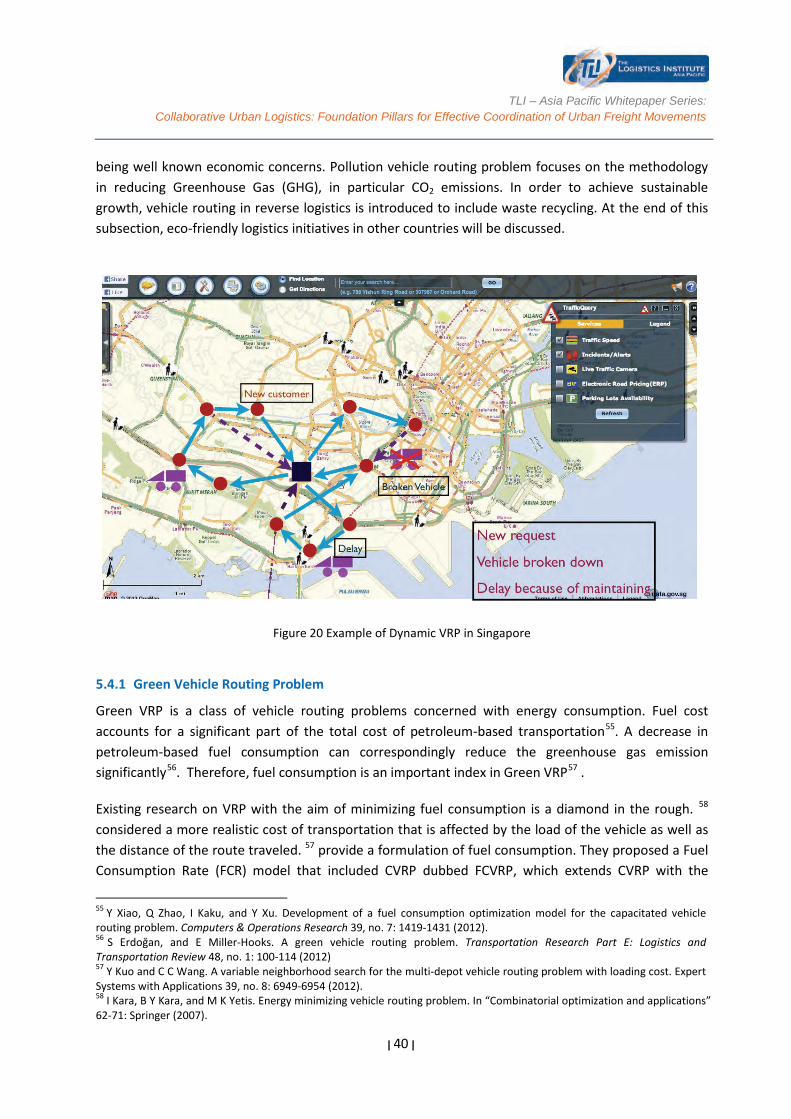
TLI – Asia Pacific Whitepaper Series:
Collaborative Urban Logistics: Foundation Pillars for Effective Coordination of Urban Freight Movements
| 40 |
being well known economic concerns. Pollution vehicle routing problem focuses on the methodology in reducing Greenhouse Gas (GHG), in particular CO2 emissions. In order to achieve sustainable growth, vehicle routing in reverse logistics is introduced to include waste recycling. At the end of this subsection, eco-friendly logistics initiatives in other countries will be discussed.
Figure 20 Example of Dynamic VRP in Singapore
5.4.1 Green Vehicle Routing Problem
Green VRP is a class of vehicle routing problems concerned with energy consumption. Fuel cost accounts for a significant part of the total cost of petroleum-based transportation55. A decrease in petroleum-based fuel consumption can correspondingly reduce the greenhouse gas emission significantly56. Therefore, fuel consumption is an important index in Green VRP57 .
Existing research on VRP with the aim of minimizing fuel consumption is a diamond in the rough. 58 considered a more realistic cost of transportation that is affected by the load of the vehicle as well as the distance of the route traveled. 57 provide a formulation of fuel consumption. They proposed a Fuel Consumption Rate (FCR) model that included CVRP dubbed FCVRP, which extends CVRP with the
55 Y Xiao, Q Zhao, I Kaku, and Y Xu. Development of a fuel consumption optimization model for the capacitated vehicle routing problem. Computers & Operations Research 39, no. 7: 1419-1431 (2012). 56 S Erdoğan, and E Miller-Hooks. A green vehicle routing problem. Transportation Research Part E: Logistics and Transportation Review 48, no. 1: 100-114 (2012) 57 Y Kuo and C C Wang. A variable neighborhood search for the multi-depot vehicle routing problem with loading cost. Expert Systems with Applications 39, no. 8: 6949-6954 (2012). 58 I Kara, B Y Kara, and M K Yetis. Energy minimizing vehicle routing problem. In “Combinatorial optimization and applications” 62-71: Springer (2007).
TLI – Asia Pacific Whitepaper Series:
Collaborative Urban Logistics: Foundation Pillars for Effective Coordination of Urban Freight Movements
| 41 |
objective of minimizing fuel consumption. Besides transportation distance and loading weight which are addressed in the papers above, 59 added transportation speed to the fuel consumption calculation model in time-dependent VRPs. Other VRP-related studies that aim to minimize total fuel consumption include Apayadin and Gonullu (2008)60, Marasš (2008)61, Sambracos et al. (2004)62 and Tavares et al. (2008)63. There is another branch in Green VRP that deals with the recharging or refueling of the vehicles, particularly, the alternative-fuel powered vehicle (AFV). As of now, there are only 2 research papers in the literature that address refueling or recharging problems. Erdogan and Miller- Hooks (2012)64 were the first to consider the possibility of recharging or refueling a vehicle on a route in VRP. They denoted this problem as Green VRP where AFVs are allowed to refuel on the tour to extend the distance it can travel. With the objective of minimizing the total distance, the model seeks to eliminate the risk of running out of fuel. In their model, they considered service times for each customer and posed a maximum duration restriction on each route. An extended Green VRP with time windows is introduced in 65.
5.4.2 Pollution Vehicle Routing
Through an extension of traditional VRP objectives of minimizing economic costs to consider relevant social and environmental impact, a reduction of CO2 emissions is achievable66. Traditional VRP aims to minimize total distance to reduce environmental pollutant emissions. The disadvantage of this approach is relationship between distance and the amount of pollution is not well-known. In Pronello and André (2007)67, it is suggested that reliable models to measure the pollution generated by vehicle routes need to take into account more factors, such as the traveling time when the engine is cold. Only with these models can the environmental benefits in VRP be quantified. In 2007, Sbihi and Eglese (2007)68 considered a TDVRP in the context of traffic congestion. Maden et al. (2009)69 also presented a TDVRP with congestion and reported about a 7% reduction of CO2 emissions. However, the objective of their VRP model remains to be the minimization of the total travel time rather than the reduction of emissions. Palmer (2007)70 developed an integrated routing and carbon dioxide emissions model and
59 Ibid. note 59 60 O Apaydin, and M T Gonullu. Emission control with route optimization in solid waste collection process: A case study. Sadhana 33, no. 2: 71-82 (2008) 61 V Marasš. Determining optimal transport routes of inland waterway container ships. Transportation Research Record: Journal of the Transportation Research Board 2062, no. 1: 50-58 (2008) 62 E Sambracos, J A Paravantis, C D Tarantilis, and C T Kiranoudis. Dispatching of small containers via coastal freight liners: The case of the aegean sea. European Journal of Operational Research 152, no. 2: 365-381 (2004) 63 G Tavares, Z Zsigraiova, V Semiao, and M da Graça Carvalho. A case study of fuel savings through optimisation of msw transportation routes. Management of Environmental Quality: An International Journal 19, no. 4: 444-454 (2008) 64 S Erdoğan, and E Miller-Hooks. A green vehicle routing problem. Transportation Research Part E: Logistics and Transportation Review 48, no. 1: 100-114 (2012). 65 F Schultmann, M Zumkeller, and O Rentz. Modeling reverse logistic tasks within closed-loop supply chains: An example from the automotive industry. European Journal of Operational Research 171, no. 3: 1033-1050 (2006). 66 T Bektaş and G Laporte. The pollution-routing problem. Transportation Research Part B: Methodological 45, no. 8: 1232-1250 (2011) 67 C Pronello and M André. Pollutant emissions estimation in road transport models. Report INRETS-LTE (2007). 68 A Sbihi and R W Eglese. Combinatorial optimization and green logistics. 4OR 5, no. 2: 99-116 (2007). 69 W Maden, R Eglese, and D Black. Vehicle routing and scheduling with time-varying data: A case study. Journal of the Operational Research Society 61, no. 3: 515-522 (2009). 70 A Palmer. The development of an integrated routing and carbon dioxide emissions model for goods vehicles. Ph.D., Cranfield University (2007).
TLI – Asia Pacific Whitepaper Series:
Collaborative Urban Logistics: Foundation Pillars for Effective Coordination of Urban Freight Movements
| 42 |
calculated the amount of CO2 emitted on the journey as well as the traveling time and distance. The results showed that about 5% reduction of CO2 emissions could be achieved. Bauer et al. (2009)71 explicitly focused on minimizing greenhouse gas emissions in a model of intermodal freight transport, showing the potential of inter- modal freight transport for reducing greenhouse emissions. Fagerholt et al. (2009)72 tried to reduce the fuel consumption and fuel emissions by optimizing speed in a shipping scenario. Some studies sought to formulate a comprehensive objective function which measures economic costs and environmental costs so as to meet economic objectives and green criterions simultaneously. Ubeda et al. (2011)73 conducted a case study where the objective is the minimization of both distance and pollutant emissions. The results revealed that backhauling is more effective in controlling emissions. It is the first model to incorporate minimization of GHG emissions in the model of Vehicle Routing Problem with Backhauls. Bektaş and Laporte (2011)74 proposed a Pollution Routing Problem (PRP) with or without time windows and developed a comprehensive objective function that integrates minimization of the cost of carbon emissions along with the operational costs of drivers and fuel consumption. Demir et al. (2012)75 proposed an extended Adaptive Large Neighborhood Search (ANLS) for PRP in order to enhance the computation efficiency for medium or large scale PRP. Faulin et al. (2011) 76 presented a CVRP with environmental criteria and considered more complex environmental impact. Apart from the measurement of traditional economic costs and environmental costs that are caused by polluting emissions, the environmental costs derived from noise, congestion and wear and tear on infrastructure were also considered.
5.4.3 Vehicle Routing in Reverse Logistics
VRP in Reverse Logistics (VRPRL) focuses on the distribution aspects of reverse logistics. Most VRPRL studies deal with transporting waste or end-of-life goods to one or more than one depot for further reprocessing. To facilitate the review of existing research of VRPRL, the problem is subdivided into four categories: Selective Pickups with Pricing, Waste Collection, End-of-life Goods Collection, and Simultaneous Distribution and Collection.
71 J Bauer, T Bektaş, and TG Crainic. Minimizing greenhouse gas emissions in intermodal freight transport: An application to rail service design. Journal of the Operational Research Society 61, no. 3: 530-542 (2009). 72 K Fagerholt, G Laporte, and I Norstad. Reducing fuel emissions by optimizing speed on shipping routes. Journal of the Operational Research Society 61, no. 3: 523-529 (2009). 73 S Ubeda, F J Arcelus, and J Faulin. Green logistics at eroski: A case study. International Journal of Production Economics 131, no. 1: 44-51 (2011). 74 T Bektaş and G Laporte. The pollution-routing problem. Transportation Research Part B: Methodological 45, no. 8: 1232-1250 (2011). 75 Demir, Emrah, Tolga Bektaş, and Gilbert Laporte. An adaptive large neighborhood search heuristic for the pollution-routing problem. European Journal of Operational Research (2012). 76 Faulin, Javier, Angel Juan, Fernando Lera, and Scott Grasman. Solving the capacitated vehicle routing problem with environmental criteria based on real estimations in road transportation: A case study. Procedia-Social and Behavioral Sciences 20: 323-334 (2011).

TLI – Asia Pacific Whitepaper Series:
Collaborative Urban Logistics: Foundation Pillars for Effective Coordination of Urban Freight Movements
| 43 |
Selective Pickups with Pricing Studies on this problem in the literature are limited. Privé et al. (2005)77 analyzed a vehicle-routing problem with the delivery of soft drinks to convenience stores and the pickup of empty bottles and aluminum cans. Gribkovskaia et al. (2008)78 examined a very similar problem but each customer was allowed to be visited twice. Aras et al. (2011)79 presented a selective multi-depot vehicle routing problem with pricing, in which the visit to each customer was selective, dependent on whether the visit was profitable and whether the remaining vehicle space could load all the recyclable products of that customer. Split collection was not allowed in this model. Waste Collection Waste management is a key process in protecting the environment and resource conservation. The transportation of waste materials is clearly part of the Green Logistics agenda80. Multi-depot VRP and Location Routing Problem for designing a waste recycling network were discussed in Mar-Ortiz et al. (2010)81 and Ramos and Oliveira (2010)82 respectively. End-of-life Goods Collection Schultmann et al. (2006)83 investigated the reverse logistics of components of end-of-life vehicles in Germany. Tabu search is used to minimise the total distance in visiting up to 1,202 dismantlers scattered throughout Germany. le Blanc et al. (2006)84 also presented a case study concerning the optimization of logistics network for collecting containers that are used to deliver end-of-life materials from dismantlers in the Netherlands. Krikke et al. (2008)85 considered the Inventory Routing Problem in the collection of materials that are disassembled from end-of-life vehicles. Kim et al. (2009)86 studied the backward flow of logistics for recycling end-of-life consumer electronic goods in South Korea. Kim et al. (2011)87 extended a similar problem to a Multi-depot VRP. As shown above, some of the studies in this category considered the scenarios of multiple depots. Other constraints, such as
77 J Privé, J Renaud, F Boctor, and G Laporte. Solving a vehicle-routing problem arising in soft-drink distribution. Journal of the Operational Research Society 57, no. 9: 1045-1052 (2005). 78 I Gribkovskaia, G Laporte, and A Shyshou. The single vehicle routing problem with deliveries and selective pickups. Computers & Operations Research 35, no. 9: 2908-2924 (2008). 79 N Aras, D Aksen, and M Tuğrul Tekin. Selective multi-depot vehicle routing problem with pricing. Transportation Research Part C: Emerging Technologies 19, no. 5: 866-884 (2011). 80 A Sbihi, and R W Eglese. Combinatorial optimization and green logistics. 4OR 5, no. 2: 99-116 (2007). 81 J Mar-Ortiz, B Adenso-Diaz, and J Luis González-Velarde. Design of a recovery network for waste collection: The case of Galicia, Spain. Journal of the Operational Research Society 62, no. 8: 1471-1484 (2010) 82 T R P Ramos and R C Oliveira. Delimitation of service areas in reverse logistics networks with multiple depots. Journal of the Operational Research Society 62, no. 7: 1198-1210 (2010). 83 F Schultmann, M Zumkeller, and O Rentz. Modeling reverse logistic tasks within closed-loop supply chains: An example from the automotive industry. European Journal of Operational Research 171, no. 3: 1033-1050 (2006). 84 I le Blanc, M van Krieken, H Krikke, and H Fleuren. Vehicle routing concepts in the closed-loop container network of arn—a case study. OR Spectrum 28, no. 1: 53-71 (2006). 85 H Krikke, I le Blanc, M van Krieken, and H Fleuren. Low-frequency collection of materials disassembled from end-of-life vehicles: On the value of on-line monitoring in optimizing route planning. International Journal of Production Economics 111, no. 2: 209-228 (2008). 86 H Kim, J Yang, and K D Lee. Vehicle routing in reverse logistics for recycling end-of-life consumer electronic goods in South Korea. Transportation Research Part D: Transport and Environment 14, no. 5: 291-299 (2009). 87 H Kim, J Yang, and K D Lee. Reverse logistics using a multi-depot vrp approach for recycling end-of-life consumer electronic products in South Korea. International Journal of Sustainable Transportation 5, no. 5: 289-318 (2011).
TLI – Asia Pacific Whitepaper Series:
Collaborative Urban Logistics: Foundation Pillars for Effective Coordination of Urban Freight Movements
| 44 |
time window settings, pickup and delivery, split visits, site-dependent visits, and periodic visits, are not addressed in the literature that deals with this problem. Simultaneous Distribution and Collection Studies concerning this problem use a VRP with Simultaneous Delivery and Pickup model to formulate the distribution process of reverse logistics. Dell’Amico et al. (2006) 88 defined a 0–1 linear programming model and studied the application of the branch-and-price technique in solving this problem. Alonso et al. (2007)89 examined a real-world problem of blood distribution and collection of blood containers where penalty costs was generated for containers that were not picked up. In addition to the above, stochastic demand and periodic visits were considered in the proposed model. Other studies include Catay (2010)90, and Tasan and Gen (2012)91.
5.5 Key Takeaways
Over the past decades, industry practices and academic research on eco-friendly initiatives or sustainability have been driven by increasing stringent national and international environmental requirements as well as industry recognition. Eco-friendly vehicle routing is moving toward becoming an inevitable issue in logistics. In the near future, LSPs will need to pay a keen attention in dealing with environmental issues in their logistics.
In practice, Eco-Friendly VRP might have received less attention than conventional VRP. However, the significance of solving Eco-Friendly VRP is increasingly apparent. The newly proposed approach is in response to the strong demand and environmental challenges for last mile logistics. Our technological innovations in planning and scheduling, dynamic vehicle routing and estimation of the carbon footprint will create a novel technology for Eco-Friendly VRP for last mile logistics in an urban environment. Moreover, the novel algorithms for Eco-Friendly VRP that considers environmental impacts and collaboration through E-Market will bring conventional VRP research to a whole new level of complexity as new dimensions are added. The main challenges for industry are as follows:
• How to increase the truck load factor by Collaboration through an electronic marketplace?
• How to achieve environment-friendly logistics with an Eco-friendly Vehicle Routing approach?
• How to combine Optimal Vehicle Routing strategies with Optimal Dynamic Vehicle Routings to reduce both transportation cost and congestion?
88 M Dell’Amico, G Righini, and M Salani. A branch-and-price approach to the vehicle routing problem with simultaneous distribution and collection. Transportation Science 40, no. 2: 235-247 (2006). 89 F Alonso, M J Alvarez, and J E Beasley. A tabu search algorithm for the periodic vehicle routing problem with multiple vehicle trips and accessibility restrictions. Journal of the Operational Research Society 59, no. 7: 963-976 (2007). 90 B Çatay. A new saving-based ant algorithm for the vehicle routing problem with simultaneous pickup and delivery. Expert Systems with Applications 37, no. 10: 6809-6817 (2010). 91 A S Tasan and M Gen. A genetic algorithm based approach to vehicle routing problem with simultaneous pick-up and deliveries. Computers & Industrial Engineering 62, no. 3: 755-761 (2012).
TLI – Asia Pacific Whitepaper Series:
Collaborative Urban Logistics: Foundation Pillars for Effective Coordination of Urban Freight Movements
| 45 |
6. MULTI-PARTY COORDINATION
6.1 Introduction
In a logistics market, shippers seek to transport their freights with the minimum possible cost, whereas carriers seek to transport the freights to earn the maximum possible profit. To enable deliveries to be coordinated across multiple stakeholders with varying interests, we propose the use of market mechanisms. The purpose of a mechanism is to fairly allocate tasks, cost or benefit to all participants.
In general, there are two classes of problems existing in mechanism design: non-cooperative and cooperative problems. In a non-cooperative problem parties compete with each other to utilize some common resources. They directly interact with the owners of resources, not their opponents. On the other hand, in a cooperative problem parties try to collaborate with each other to gain benefit from the resource allocation. They can work directly with each other to form a solution. In the following, we review literature on auction and collaboration, which respectively represent the non-cooperative and cooperative mechanisms.
6.2 Key Dimensions for Multi-Party Coordination
The key factors in multi-party coordination are illustrated in Figure 21. The main objective of introducing market mechanisms is to reduce inefficiency and unproductiveness from fragmented and uncoordinated deliveries in the city which results in low utilization of trucks, excessive truck movements, higher system-wide cost and negative environmental impact. This is done either via competitive or collaborative mechanisms operating within the e-market, described as follows.
In an auction mechanism for a logistics market, shippers could submit ad-hoc delivery demands and their budget to get these demands served. In a reverse auction, LSPs could submit spare capacities of their truck fleet and the cost of utilizing these spare capacities. The auctioneer will apply an algorithm to determine the winner for each item and the corresponding payment (or cost). The auction can be single-sided (carriers bid to serve) or double-sided (carriers bid to serve and shippers bid to be served)92.
Whereas in a collaboration mechanism, the shipper submits its freight requests to several LSPs and negotiates terms with them. These requests consist of multiple lanes to be serviced. In contrast, a LSP collects the freight requests from several shippers and offers prices based on its existing lane network and the lanes it anticipates getting by the time of service. The shipper procures the transportation service from the LSP that offers the lowest price for the freight request. A key aspect that affects the carriers operational cost is asset repositioning. Asset repositioning (or deadheading) is empty truck
92 J H R van Duin, L A Tavasszy, and E Taniguchi. Real time simulation of auctioning and re-scheduling processes in hybrid freight markets. Transportation Research Part B: Methodological 41, no. 9: 1050-1066 (2007).
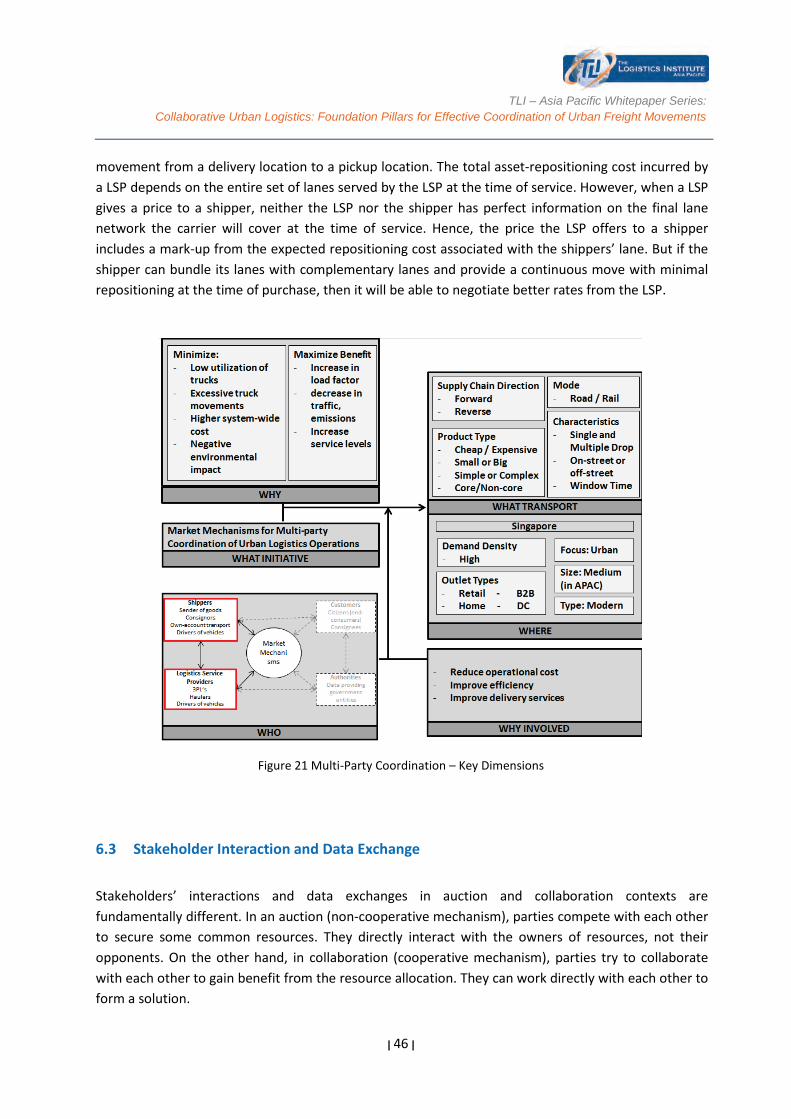
TLI – Asia Pacific Whitepaper Series:
Collaborative Urban Logistics: Foundation Pillars for Effective Coordination of Urban Freight Movements
| 46 |
movement from a delivery location to a pickup location. The total asset-repositioning cost incurred by a LSP depends on the entire set of lanes served by the LSP at the time of service. However, when a LSP gives a price to a shipper, neither the LSP nor the shipper has perfect information on the final lane network the carrier will cover at the time of service. Hence, the price the LSP offers to a shipper includes a mark-up from the expected repositioning cost associated with the shippers’ lane. But if the shipper can bundle its lanes with complementary lanes and provide a continuous move with minimal repositioning at the time of purchase, then it will be able to negotiate better rates from the LSP.
Figure 21 Multi-Party Coordination – Key Dimensions
6.3 Stakeholder Interaction and Data Exchange
Stakeholders’ interactions and data exchanges in auction and collaboration contexts are fundamentally different. In an auction (non-cooperative mechanism), parties compete with each other to secure some common resources. They directly interact with the owners of resources, not their opponents. On the other hand, in collaboration (cooperative mechanism), parties try to collaborate with each other to gain benefit from the resource allocation. They can work directly with each other to form a solution.
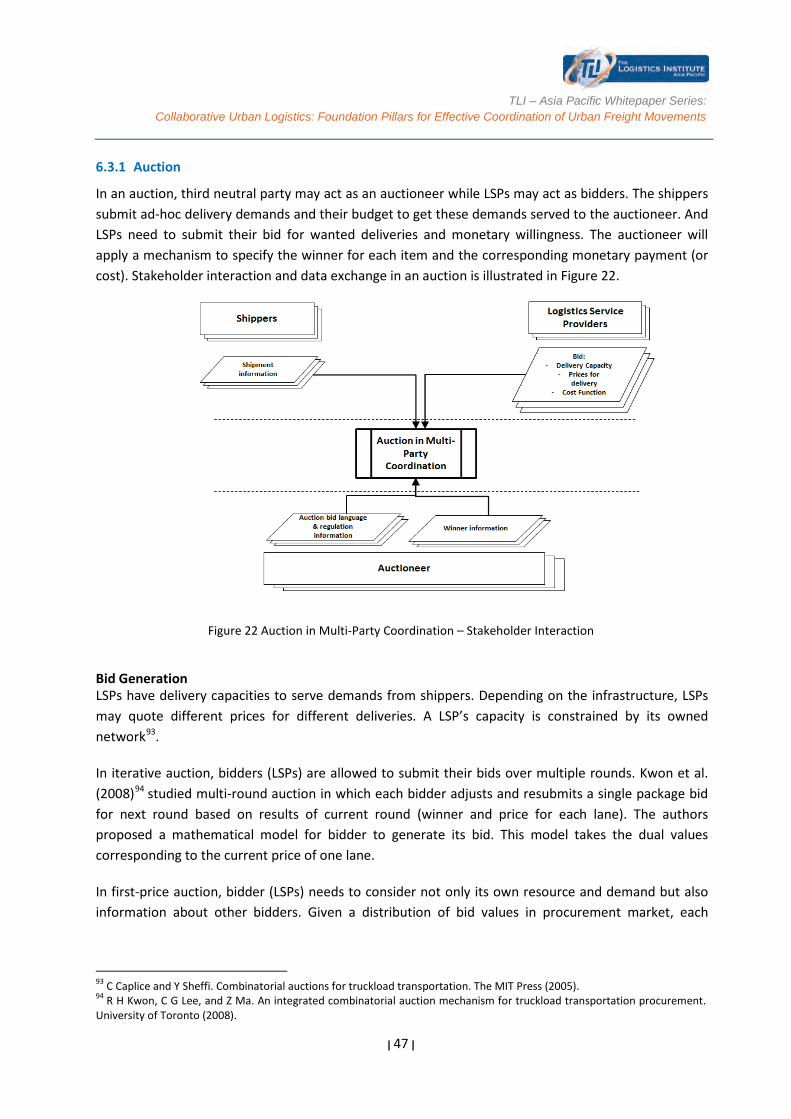
TLI – Asia Pacific Whitepaper Series:
Collaborative Urban Logistics: Foundation Pillars for Effective Coordination of Urban Freight Movements
| 47 |
6.3.1 Auction
In an auction, third neutral party may act as an auctioneer while LSPs may act as bidders. The shippers submit ad-hoc delivery demands and their budget to get these demands served to the auctioneer. And LSPs need to submit their bid for wanted deliveries and monetary willingness. The auctioneer will apply a mechanism to specify the winner for each item and the corresponding monetary payment (or cost). Stakeholder interaction and data exchange in an auction is illustrated in Figure 22.
Figure 22 Auction in Multi-Party Coordination – Stakeholder Interaction
Bid Generation LSPs have delivery capacities to serve demands from shippers. Depending on the infrastructure, LSPs may quote different prices for different deliveries. A LSP’s capacity is constrained by its owned network93.
In iterative auction, bidders (LSPs) are allowed to submit their bids over multiple rounds. Kwon et al. (2008)94 studied multi-round auction in which each bidder adjusts and resubmits a single package bid for next round based on results of current round (winner and price for each lane). The authors proposed a mathematical model for bidder to generate its bid. This model takes the dual values corresponding to the current price of one lane.
In first-price auction, bidder (LSPs) needs to consider not only its own resource and demand but also information about other bidders. Given a distribution of bid values in procurement market, each
93 C Caplice and Y Sheffi. Combinatorial auctions for truckload transportation. The MIT Press (2005). 94 R H Kwon, C G Lee, and Z Ma. An integrated combinatorial auction mechanism for truckload transportation procurement. University of Toronto (2008).
TLI – Asia Pacific Whitepaper Series:
Collaborative Urban Logistics: Foundation Pillars for Effective Coordination of Urban Freight Movements
| 48 |
bidder can derive the winning probability for each of its bid95. Ergun et al. (2007)96 studied a simplified scenario in which distribution of bid values was uniform and independent auctions are carried for different lanes. In this scenario, the authors propose a search algorithm to find the optimal bid for each carrier. In Triki et al. (2013)97, a more complicated model was presented, in which bid values followed normal distribution and multi-lanes were considered in a combinatorial auction. The problem possesses NP-Hard characteristic, hence the authors proposed different heuristic approaches to solve it.
Instead of submitting individual bids, in structural transportation cost, LSPs (bidders) can choose to reveal its cost function to the auctioneer98. Chen et al. (2009)99 proposed an implicit bidding approach, in which each bidder submit its bid generator function to the auctioneer. The auctioneer will choose the winner by evaluating the given functions from bidders. This centralized approach reduced iterative auction into a single optimization problem. This function bidding is useful not only in scheduling but also in pricing stages. Beil et al. (2007)100 used knowledge of bidding generation functions of bidders to compute VCG premium payment (incentive for carrier to commit its service) for each carrier. In spite of its computational advantage, cost function bidding could be not preferable with existence of trust and privacy concern, especially when a procurement company does not want its cost structure publicized101.
Winner Determination Solving the winner determination problem in logistics auction is equivalent to solving a scheduling problem to minimize the transportation cost. In many cases, this is a combinatorial optimization problem 102 because the auctioneer has to consider combinations of lanes instead of separate individual lanes. Combining different service providers to fulfill transportation demand can be modeled as set partition problems103 or lane covering problems104.
Commonly, researchers model scheduling problems with mixed integer programs (MIPs) with constraints on delivery time, capacity, network structure and objective functions minimizing transportation cost. MIPs are useful to provide globally optimal solutions which are preferred by administrators. In some full-truck-load cases, linear relaxation can provide feasible solution for the MIP
95 C Triki, S Oprea, P Beraldi, and T G Crainic. The stochastic bid generation problem in combinatorial transportation auctions. European Journal of Operational Research (2013). 96 O Ergun, G Kuyzu, and M Savelsbergh. Bid price optimization for simultaneous truckload transportation procurement auctions. Georgia Institute of Technology (2007). 97 Ibid. note 95 98 D R Beil, A Cohn, and A Sinha. Simplified bidding and solution methodology for truckload procurement and other vcg combinatorial auctions. Ross School of Business, University of Michigan (2007). 99 R L Y Chen, S AhmadBeygi, A Cohn, D R Beil, and A Sinha. Solving truckload procurement auctions over an exponential number of bundles. Transportation Science 43, no. 4: 493-510 (2009). 100 Ibid. Note 98 101 Ibid. Note 99 102 Ibid. Page 43, Note 93 103 A C Regan and J Song. Combinatorial auctions for transportation service procurement: The carrier perspective. University of California Transportation Center (2003). 104 R Agarwal and O Ergun. Network design and allocation mechanisms for carrier alliances in liner shipping. Operations Research 58, no. 6: 1726-1742 (2010).
TLI – Asia Pacific Whitepaper Series:
Collaborative Urban Logistics: Foundation Pillars for Effective Coordination of Urban Freight Movements
| 49 |
model105, which had a scheduling problem solved in polynomial time. In general cases, several efficient methods for procurement scheduling can be found in . Therein, the authors studied liner shipping problem. The techniques, however, can be applied to relevant class of problems. To get the initial solution, the authors proposed a greedy algorithm to incrementally construct sub-solutions for separate scheduling components. The number of variables in MIPs grows exponentially with the number of carriers and demands, which make solving each iteration of branch-and-cut or simplex method, become bulky. Agarwal and Ergun (2010)106 suggested using column-generation-based and Benders-based algorithms in lane combination problems. Column-generation-based algorithm solved restricted problems with a select set of columns (variables), which had much smaller size than original problem. Benders-based algorithm, which is sometimes known as row generation-based algorithm, solves two stages optimization problem. The first stage is to solve a master problem to add constraints into sub-problems. The second stage is to find scheduling solution for each sub-problem.
Distributors and e-commercial companies like Amazon or eBay rely much on contracted transport lines to maintain their regular good delivery. To optimize the cost, they can hold auctions for carriers to bid on contracts. Usually, these procurement auctions are held every one to two year. Caplice and Sheffi (2005)107 characterized this as combinatorial reverse procurement auction in which carriers bid to provide services. In contract auction, auctioneer (which is the shipper) needs to estimate their future demand to procure service of carriers. This demand is commonly uncertain which makes decision process become stochastic problem. Ma et al. (2010) 108 studied this uncertainty in winner determination stage of auctioneer. He proposed a two-stage stochastic mathematical program to solve the problem. To improve the scalability of model, he proposed an efficient deterministic model to generate solution for the first stage of the program. Furthermore, he considered heuristic solutions produced by different relaxations of the two-stage program. In the worse situation, when shipper does not have a complete distribution of its demand, auctioneer has to consider worst case scenario analysis which can be done by solving a robust optimization problem. Such robust problem in transportation auction was raised by Remli and Rekik (2013)109. The authors proposed a two-stage mathematical program with the objective to minimize cost of worst case demand. The authors showed a method to linearizing the max-min function of robust problem. Using constraint generation method, the authors showed that the problem could be solved efficiently in real time. Incentive Compatibility A mechanism is called to have incentive compatibility property if all the players truthfully reveal any private information asked for by the mechanism. In logistic auctions, to achieve inventive compatibility, the second price (also known as Vickrey) auction is used. This mechanism was
105 O Ozener and O Ergun. Allocating costs in a collaborative transportation procurement network. Transportation Science 42, no. 2: 146-165 (2008). 106 Ibid. Note 104 107 Ibid. page 43, note 93 108 Z Ma, R H. Kwon, and C G Lee. A stochastic programming winner determination model for truckload procurement under shipment uncertainty. Transportation Research Part E: Logistics and Transportation Review 46, no. 1: 49-60 (2010). 109 N Remli and M Rekik. A robust winner determination problem for combinatorial transportation auctions under uncertain shipment volumes. Transportation Research Part C: Emerging Technologies 35: 204-217 (2013).
TLI – Asia Pacific Whitepaper Series:
Collaborative Urban Logistics: Foundation Pillars for Effective Coordination of Urban Freight Movements
| 50 |
incorporated in different logistics market platforms110, Teo et al. (2008)111 in which carriers bid separately in different lanes. The winner with the lowest cost in each lane got the payment of the second lowest bid. This second price scheme is also applied in sequential auction for dynamic procurement market. In dynamic market, the demand is not known a priori. Carriers bid for demand whenever it is submitted into the market. The auction, therefore, is not finalized in a single decision but iterative decisions. Figliozzi (2006) 112 proposed a second price mechanism for this type of sequential auction. Because of the property of second price auction class, his mechanism was inherently incentive compatible.
One of earliest papers studying incentive compatibility when incorporating multi-unit auction into the complex structure of the logistics market is Chen et al (2005)113. In this work, a Vickrey mechanism was proposed and shown to be efficient in a complex supply network. The mechanism specified multiple winners instead of single one in classical methods. Furthermore, it incorporates transportation cost and reservation price function into the auction, which made it more effective.
In logistics market, a third party can play a role of a coordinator to match shippers’ demands with LSPs’ capacities. In auction context, this third party coordinator can be also auctioneer to determine winners in both sides. Such auction—with the name ”double auction”—was shown in McAfee (1992)114 to be more complicated than single side auction. The situation is more complicated in the logistics domain when there are complicated scheduling optimization problems associated with all components. Huang and Xu (2013)115 proposed multi-unit trade reduction mechanism and VCG mechanism in logistics double auction, which possess incentive compatibility, allocation efficiency and budget balance. The VCG mechanism in Huang Nd Xu (2013)115 can be considered as a variant of Vickrey mechanism in Chen et al. (2005)116. The multi-unit trade reduction mechanisms cleared the market by partitioning it into individual auction for each lane and solve it separately. It was shown that each of these mechanisms worked effective in specific domain. To handle their pros and cons, the authors proposed a random mechanism combining both mechanisms. The proposed random mechanism’s effectiveness was shown by experiments with real data.
110 S Agrali, B Tan, and F Karaesmen. Modeling and analysis of an auction-based logistics market. European Journal of Operational Research 191, no. 1: 272-294 (2008). 111 J S E Teo, E Taniguchi, and A G Qureshi. Evaluation of distance-based and cordon-based urban freight road pricing in e-commerce environment with multiagent model. Transportation Research Record: Journal of the Transportation Research Board 2269: 127-134 (2008). 112 M A Figliozzi. Analysis and evaluation of incentive compatible dynamic mechanisms for carrier collaboration. Transportation Research Record: Journal of the Transportation Research Board (2006). 113 Ibid. page 43, note 99 114 R P McAfee. A dominant strategy double auction. Journal of Economic Theory 56, no. 2: 434-450 (1992). 115 G Q Huang, and S X Xu. Truthful multi-unit transportation procurement auctions for logistics e-marketplaces. Transportation Research Part B: Methodological 47: 127-148 (2013). 116 R R Chen, R O Roundy, R Q Zhang, and G Janakiraman. Efficient auction mechanisms for supply chain procurement. Management Science 51, no. 3: 467-482 (2005).
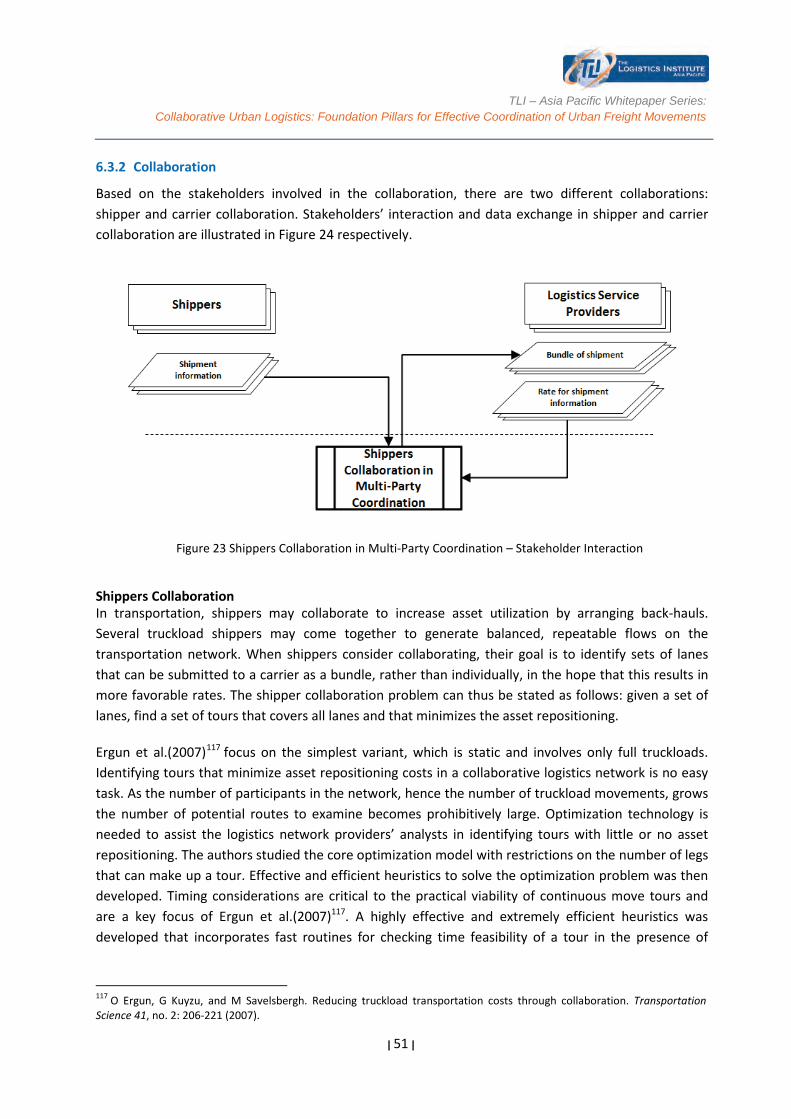
TLI – Asia Pacific Whitepaper Series:
Collaborative Urban Logistics: Foundation Pillars for Effective Coordination of Urban Freight Movements
| 51 |
6.3.2 Collaboration
Based on the stakeholders involved in the collaboration, there are two different collaborations: shipper and carrier collaboration. Stakeholders’ interaction and data exchange in shipper and carrier collaboration are illustrated in Figure 24 respectively.
Figure 23 Shippers Collaboration in Multi-Party Coordination – Stakeholder Interaction Shippers Collaboration In transportation, shippers may collaborate to increase asset utilization by arranging back-hauls. Several truckload shippers may come together to generate balanced, repeatable flows on the transportation network. When shippers consider collaborating, their goal is to identify sets of lanes that can be submitted to a carrier as a bundle, rather than individually, in the hope that this results in more favorable rates. The shipper collaboration problem can thus be stated as follows: given a set of lanes, find a set of tours that covers all lanes and that minimizes the asset repositioning.
Ergun et al.(2007)117 focus on the simplest variant, which is static and involves only full truckloads. Identifying tours that minimize asset repositioning costs in a collaborative logistics network is no easy task. As the number of participants in the network, hence the number of truckload movements, grows the number of potential routes to examine becomes prohibitively large. Optimization technology is needed to assist the logistics network providers’ analysts in identifying tours with little or no asset repositioning. The authors studied the core optimization model with restrictions on the number of legs that can make up a tour. Effective and efficient heuristics to solve the optimization problem was then developed. Timing considerations are critical to the practical viability of continuous move tours and are a key focus of Ergun et al.(2007)117. A highly effective and extremely efficient heuristics was developed that incorporates fast routines for checking time feasibility of a tour in the presence of
117 O Ergun, G Kuyzu, and M Savelsbergh. Reducing truckload transportation costs through collaboration. Transportation Science 41, no. 2: 206-221 (2007).
TLI – Asia Pacific Whitepaper Series:
Collaborative Urban Logistics: Foundation Pillars for Effective Coordination of Urban Freight Movements
| 52 |
dispatch time windows and for minimizing the duration of a tour by appropriately selecting a starting location and departure time.
Ozener and Ergun (2008)118 then investigated the question of allocation of the total cost of these routes among the members of the collaboration. According to the CEO of Nistevo Network, Kevin Lynch: ”The key to understanding collaborative logistics lies in recognizing how costs are distributed in a logistics network.” In the paper, the authors attempted to design cost-allocation mechanisms that are stable, encourage the expansion of the collaboration, and guarantee that each shipper pays no more than the cost allocated before the expansion. Several desirable cost-allocation properties are identified, but no method can ensure allocations with all these properties. As a result, the authors designed several algorithms that generate allocations with worst case bounds on the relaxed properties. In Lozano et al (2013)119, a mathematical programming model is proposed to measure the benefits of merging the transportation demands of different companies. The proposed collaboration scheme leads to a game that always has the monotonicity and superadditivity properties. This means that this type of collaboration provides incentives for the companies to form large coalitions. For the allocation of the cost savings due to the collaboration, several cost-savings allocation methods have been considered. Two of them, LC and minmax, seem particularly suited to this application due to their relative simplicity and their seeking fairness. These two methods provide cost savings allocations that remove all incentives for any partner or subset of partners to opt-out of the collaboration.
In contrast to the large-scale shippers, shippers which make occasional and less-than-truckload shipments may collaborate with other shippers by consolidating their freight to share a single line-haul, and possibly pay a price close to the truckload price. In Yilmaz and Savasaneril (2012)120, a shipper collaboration problem is studied where shippers with small-volume shipments consolidate their freight to obtain savings through economies of scale. Shippers may arrive to the market randomly with spot cargo. at different locations (or, ports) and the carriers may pick up the loads from these locations. Consolidation of the shipments would potentially increase the asset utilization. However, the shippers may have different delivery time-windows, which brings a restriction on the dispatch time of the vehicles. To address this problem, the cost minimization problem of a shipper coalition with uncertain shipment requests and late delivery sensitivities was first studied. A continuous time Markov chain model was then constructed. Under the assumption of multiple shipper classes arriving at multiple dispatch locations, the optimal resource allocation policy of the coalition is determined. Carriers Collaboration Independent carriers, who wish to improve their own profitability, may choose to integrate some portion of their transportation networks in order to make better use of their capacity by delivering more, or more profitable, loads. It is reasonable to assume that carriers forming an alliance are
118 O O Ozener and O Ergun. Allocating costs in a collaborative transportation procurement network. Transportation Science 42, no. 2: 146-165 (2008). 119 S Lozano, P Moreno, B Adenso-Díaz, and E Algaba. Cooperative game theory approach to allocating benefits of horizontal cooperation. European Journal of Operational Research 229, no. 2: 444-452 (2013). 120 O Yilmaz and S Savasaneril. Collaboration among small shippers in a transportation market. European Journal of Operational Research 218, no. 2: 408-415 (2012).
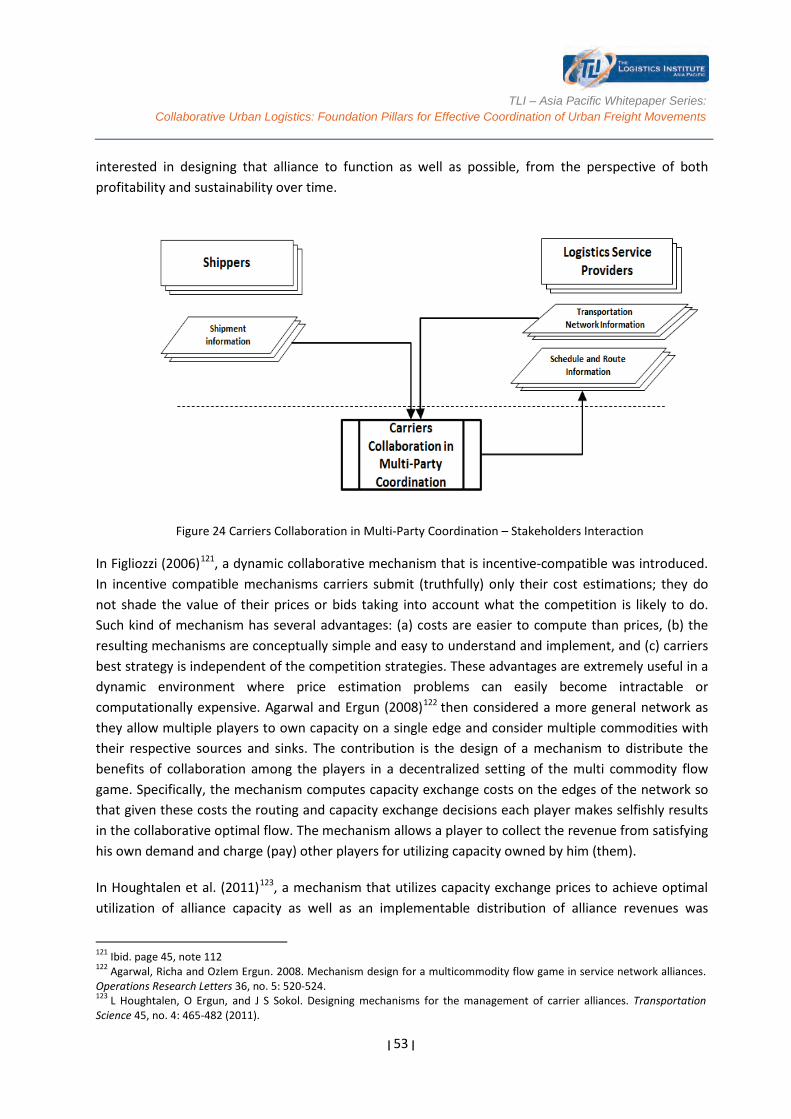
TLI – Asia Pacific Whitepaper Series:
Collaborative Urban Logistics: Foundation Pillars for Effective Coordination of Urban Freight Movements
| 53 |
interested in designing that alliance to function as well as possible, from the perspective of both profitability and sustainability over time.
Figure 24 Carriers Collaboration in Multi-Party Coordination – Stakeholders Interaction
In Figliozzi (2006)121, a dynamic collaborative mechanism that is incentive-compatible was introduced. In incentive compatible mechanisms carriers submit (truthfully) only their cost estimations; they do not shade the value of their prices or bids taking into account what the competition is likely to do. Such kind of mechanism has several advantages: (a) costs are easier to compute than prices, (b) the resulting mechanisms are conceptually simple and easy to understand and implement, and (c) carriers best strategy is independent of the competition strategies. These advantages are extremely useful in a dynamic environment where price estimation problems can easily become intractable or computationally expensive. Agarwal and Ergun (2008)122 then considered a more general network as they allow multiple players to own capacity on a single edge and consider multiple commodities with their respective sources and sinks. The contribution is the design of a mechanism to distribute the benefits of collaboration among the players in a decentralized setting of the multi commodity flow game. Specifically, the mechanism computes capacity exchange costs on the edges of the network so that given these costs the routing and capacity exchange decisions each player makes selfishly results in the collaborative optimal flow. The mechanism allows a player to collect the revenue from satisfying his own demand and charge (pay) other players for utilizing capacity owned by him (them).
In Houghtalen et al. (2011)123, a mechanism that utilizes capacity exchange prices to achieve optimal utilization of alliance capacity as well as an implementable distribution of alliance revenues was
121 Ibid. page 45, note 112 122 Agarwal, Richa and Ozlem Ergun. 2008. Mechanism design for a multicommodity flow game in service network alliances. Operations Research Letters 36, no. 5: 520-524. 123 L Houghtalen, O Ergun, and J S Sokol. Designing mechanisms for the management of carrier alliances. Transportation Science 45, no. 4: 465-482 (2011).
TLI – Asia Pacific Whitepaper Series:
Collaborative Urban Logistics: Foundation Pillars for Effective Coordination of Urban Freight Movements
| 54 |
proposed. The proposed limited control behavior (LCB) model is promising with regard to theoretical properties of the allocations obtained. The LCB model guarantees centralized feasibility, and using this model, it is always possible to obtain a core allocation. The robustness of the allocation mechanism in practice was analyzed by implementing the mechanism in a simulated alliance setting in which variability in alliance composition, demand volume, and demand distribution were all explored. Variations of the LCB model intended to increase alliance stability were also tested. Overall, the results suggest that the LCB model is superior to alternate models studied when implementing the allocation mechanism in practice.
Less-than-truckload carriers Less-than-truckload (LTL) carriers, which operate on thin margins, have significant negative impacts due to empty trips, idled capacity on lots, and rising energy costs. One promising innovation is the concept of LTL carrier-carrier collaboration, which provides opportunities for LTL carriers to exploit synergies in operations (such as excess capacity), reduce costs associated with fleet operation, decrease lead times, increase asset utilization (power units), and enhance overall service levels. Based on a survey of freight carriers in Hernandez (2011)124, it is found out that carriers show propensity for collaboration. Variables related to collaboration were found to be significant in the mixed logic model developed in their study.
Krajewska et al. (2008)125 adopted the formalism of cooperative games to share the profits of the collaboration and showed the advantage of such collaboration in terms of incremental profit. Similarly, Liu et al. (2010)126 formulated the LTL collaboration game based on the cooperative game theory and discussed the well-known profit allocation concepts including Proportional Allocation, Shapley value and Nucleolus. They then proposed a new allocation method named Weighted Relative Savings Model (WRSM) which is in the core and minimizes the maximum difference between weighted relative savings among the participants. Using a centralized planning framework127 can usually generate a higher profit to the alliance than a decentralized approach128, Dai and Chen (2012)127 addressed the issue of fairly allocating the total profit among carriers by proposing three profit allocation mechanisms. The novelty and contribution of these mechanisms can be found in three aspects: (1) Through the combination with the core concept, the mechanisms can provide a stable allocation. (2) The third mechanism uses a different way to evaluate the contribution of each carrier, which takes account of the contribution of each carrier in both offering requests and serving requests. (3) The three mechanisms provide carriers with more options in choosing their profit allocation mechanism in collaboration.
124 S H Hernande. Modeling of collaborative less-than-truckload carrier freight networks, Purdue University (2011). 125 M A Krajewska, H Kopfer, G Laporte, S Ropke, and G Zaccour. Horizontal cooperation among freight carriers: Request allocation and profit sharing. The Journal of the Operational Research Society 59, no. 11: 1483–-1491 (2008). 126 P Liu, Y Wu, and N Xu. Allocating collaborative profit in less-than-truckload carrier alliance. Journal of Service Science & Management 3: 143-149 (2010). 127 B Dai and H Chen. Profit allocation mechanisms for carrier collaboration in pickup and delivery service. Computers & Industrial Engineering 62, no. 2: 633-643 (2012). 128 S Berger and C Bierwirth. Solutions to the request reassignment problem in collaborative carrier networks. Transportation Research Part E: Logistics and Transportation Review 46, no. 5: 627-638 (2010).
TLI – Asia Pacific Whitepaper Series:
Collaborative Urban Logistics: Foundation Pillars for Effective Coordination of Urban Freight Movements
| 55 |
In Hernandez (2011)124, a dynamic LTL carrier-carrier collaboration problem among a group of small- to medium-sized LTL carriers was studied. It is dynamic in the sense that the demand has time windows for load pickup/delivery, the collaborative capacities are time-dependent, and the actual holding costs encountered by a load depend on the number of intervals it is held at a transfer location. Practices such as cross docking in turn synergistically aid the collaboration paradigm by reducing system delays through improved delivery times. Most recently, collaborative transportation planning (CTP) in Wang and Kopfer (2013)129 for a set of independent carriers exchanging less-than-truckload transportation requests is considered. The realistic restriction that all collaborating partners have only limited capacities in their fleets is included in the consideration. To keep their autonomy, coalition members keep their sensitive information including customer payments and cost structures unexposed during CTP. A new decentralized request exchange mechanism for CTP is proposed while only vehicle routes are considered for exchange.
6.4 Recent Initiatives in Multi-Party Coordination
Different simulation platforms were implemented to understand auctions in logistics market.
Implementing auctions in logistics spot market increases competition among service providers, consequently benefitting suppliers by the lower service cost. Simultaneously auction implementation can change segmentation in the market, i.e. redirect portion of dynamic jobs from local carriers to in-transit carriers. Agrali et al. (2008)130 proposed a queue model to quantify the effect of auctions in logistics market. This model facilitated both analytic and computational analysis of multi-component market platform (local/in-transit carriers, static/dynamic demand).
Van Duin et al (2007)131 implemented a simulated auction platform for spot market along with contract market to understand behavior of freight bidder. The purpose of spot market is to match ad-hoc demand with available capacities. After serving long term contract demands, carriers having vacant capacities are encouraged to submit these capacities to spot market. On the other hand, suppliers suffering shortage of delivery can submit their demands into spot market. In the framework, an auction is dynamically dependent on a coming demand and there is time window associated with each demand. To simulate carrier bidders, three parameters are varied: price-time accuracy, responsiveness toward the auction, and cost-time-function. The experimental results verified hypotheses of key factors of winning an auction: high responsiveness, time accuracy and static income of carriers.
129 X Wang and H Kopfer. Collaborative transportation planning of less-than-truckload freight. OR Spectrum (2013). 130 S Agrali, B Tan, and F Karaesmen. Modeling and analysis of an auction-based logistics market. European Journal of Operational Research 191, no. 1: 272-294 (2008). 131 Ibid. page 41, note 92
TLI – Asia Pacific Whitepaper Series:
Collaborative Urban Logistics: Foundation Pillars for Effective Coordination of Urban Freight Movements
| 56 |
In another work, Teo et al. (2008) 132 used simulation of logistic market to evaluate different government policies. They developed a multi-agent platform including carriers, shippers, and the government. Demands from shippers were accumulated into a centralized market. Different carriers computed their service cost for these demands by using VRPTW with insertion heuristics. Then carriers submit their bid vector containing service cost for each order. Finally, job assignments in the market are determined by the second-price rule. This second-price auction guarantees revelation of truthful price, which enhance the effectiveness of logistics auction. On the other hand, administrator (or government) tried to reduce transportation burden by imposing road price policies. Particularly, the authors considered cordon-pricing and distance-pricing policies. While cordon-pricing policy helps to reduce traffic of central area, distance-pricing policy reduces the overall city traffic. For each policy, actions were adjusted by observing traffic status. In the paper, pollution level NOx was used as an indicator for action adjustment. Simulated experiments suggested applying distance-pricing policy because it was able to bring more benefit than cordon-pricing.
6.5 Key Takeaways
We have reviewed multi-party coordination mechanisms using auction and negotiation (collaboration) for last-mile logistics markets. Auctions and negotiations are mechanisms that have been used widely in the context of transportation and procurement which serve to match demand and supply of resources effectively, based on user preference and utilities. Using auctions and negotiations, last-mile logistics stakeholders (especially shippers and LSPs) will able to seek win-win arrangements that utilize the available resources (e.g.: fleet of vehicles) for more optimal delivery plan to the city center.
To develop such multi-party coordination mechanisms, we summarize the challenges and define the problems statements as follows:
• What are operational market mechanisms that enable multi stakeholders to collaborate across a software platform to bid and negotiate on spare capacities, delivery jobs, timings of deliveries and load consolidation?
• What cost and revenue sharing models are suitable for last-mile logistics and how can we implement them efficiently?
• How to promote and maintain fairness and transparency within the mechanisms such that it is a win-win situation for all stakeholders?
132 Ibid. page 45, note 111


The Logistics Institute – Asia Pacific National University of Singapore 21 Heng Mui Keng Terrace, #04-01, Singapore 119613
Tel: (65) 6516 4842 · Fax: (65) 6775 3391 Email: [email protected] · URL: www.tliap.nus.edu.sg
A Collaboration Between