Embed Size (px)
Citation preview

Tjalling C. Koopmans Research Institute

Tjalling C. Koopmans Research Institute
Utrecht School of Economics
Utrecht University Kriekenpitplein 21-22 3584 EC Utrecht The Netherlands telephone +31 30 253 9800 fax +31 30 253 7373 website www.koopmansinstitute.uu.nl The Tjalling C. Koopmans Institute is the research institute and research school of Utrecht School of Economics. It was founded in 2003, and named after Professor Tjalling C. Koopmans, Dutch-born Nobel Prize laureate in economics of 1975. In the discussion papers series the Koopmans Institute publishes results of ongoing research for early dissemination of research results, and to enhance discussion with colleagues. Please send any comments and suggestions on the Koopmans institute, or this series to [email protected] çåíïÉêé=îççêÄä~ÇW=tofh=ríêÉÅÜí
How to reach the authors
Please direct all correspondence to the first author.
Marcel van den Berg Charles van Marrewijk Utrecht University Utrecht School of Economics Kriekenpitplein 21-22 3584 TC Utrecht The Netherlands. E-mail: [email protected] [email protected]
This paper can be downloaded at: http:// www.uu.nl/rebo/economie/discussionpapers

Utrecht School of Economics Tjalling C. Koopmans Research Institute Discussion Paper Series 13-12
Imports and productivity: the impact of
geography and factor intensity
Marcel van den Berg Charles van Marrewijk
Utrecht School of Economics Utrecht University
September 2013
Abstract Using micro-data for Dutch firms, we argue that the productivity spillovers from
importing technology intensive products from Taiwan differ from importing unskilled-labor intensive products from Switzerland. We show that both the geographic component (what country is the import from) and the intensity component (what type of good is imported) is crucial for measuring and understanding these spillovers. We show that increasing distance and decreasing levels of development of the origin economy negatively affect the diffusion of efficiency gains embodied in imported goods. Similarly, these gains are larger for technology intensive goods and smaller for unskilled-labor intensive goods. This implies that the geographic-intensity markets are unique and cannot be lumped together. In addition, a diversified import portfolio (the extensive dimension) is always positively associated with firm-level productivity.
Keywords: Firm heterogeneity, imports, productivity, geography, factor in- tensity JEL classification: D22, F14, F23 Acknowledgements This study is funded by the Ministry of Economic Affairs and the Ministry of Foreign Affairs of the Netherlands. We are grateful to Statistics Netherlands for providing us with the data underlying the analysis. We thank Marjolijn Jaarsma for her invaluable support in our comprehension of the various data sets. We also thank Peter van Bergeijk, Saara Tamminen, Emre Akgündüz, Fabienne Fortanier, René Bongard, Oscar Lemmers, Martin Luppes, Selwyn Moons, Bastiaan Rooijakkers and participants at the 2012 annual conference of the European Trade Study Group in Leuven, Belgium and the workshop 'Micro-evidence on labour market implications of globalization and agglomeration' of the CPB Netherlands Bureau for Economic Policy Analysis in The Hague, The Netherlands for valuable feedback and comments. Any remaining errors are our own.
1 Introduction
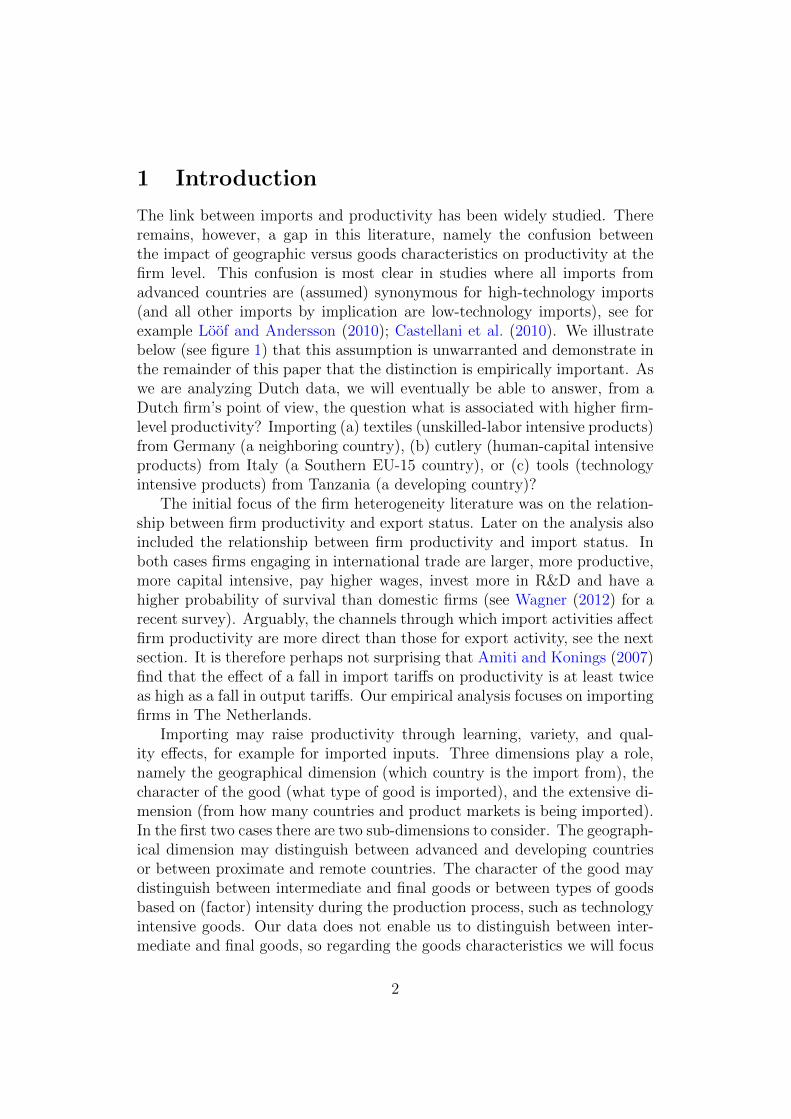
The link between imports and productivity has been widely studied. Thereremains, however, a gap in this literature, namely the confusion betweenthe impact of geographic versus goods characteristics on productivity at thefirm level. This confusion is most clear in studies where all imports fromadvanced countries are (assumed) synonymous for high-technology imports(and all other imports by implication are low-technology imports), see forexample Loof and Andersson (2010); Castellani et al. (2010). We illustratebelow (see figure 1) that this assumption is unwarranted and demonstrate inthe remainder of this paper that the distinction is empirically important. Aswe are analyzing Dutch data, we will eventually be able to answer, from aDutch firm’s point of view, the question what is associated with higher firm-level productivity? Importing (a) textiles (unskilled-labor intensive products)from Germany (a neighboring country), (b) cutlery (human-capital intensiveproducts) from Italy (a Southern EU-15 country), or (c) tools (technologyintensive products) from Tanzania (a developing country)?
The initial focus of the firm heterogeneity literature was on the relation-ship between firm productivity and export status. Later on the analysis alsoincluded the relationship between firm productivity and import status. Inboth cases firms engaging in international trade are larger, more productive,more capital intensive, pay higher wages, invest more in R&D and have ahigher probability of survival than domestic firms (see Wagner (2012) for arecent survey). Arguably, the channels through which import activities affectfirm productivity are more direct than those for export activity, see the nextsection. It is therefore perhaps not surprising that Amiti and Konings (2007)find that the effect of a fall in import tariffs on productivity is at least twiceas high as a fall in output tariffs. Our empirical analysis focuses on importingfirms in The Netherlands.
Importing may raise productivity through learning, variety, and qual-ity effects, for example for imported inputs. Three dimensions play a role,namely the geographical dimension (which country is the import from), thecharacter of the good (what type of good is imported), and the extensive di-mension (from how many countries and product markets is being imported).In the first two cases there are two sub-dimensions to consider. The geograph-ical dimension may distinguish between advanced and developing countriesor between proximate and remote countries. The character of the good maydistinguish between intermediate and final goods or between types of goodsbased on (factor) intensity during the production process, such as technologyintensive goods. Our data does not enable us to distinguish between inter-mediate and final goods, so regarding the goods characteristics we will focus
2
attention on an intensity classification that identifies five different types ofgoods, namely primary, natural-resource intensive, unskilled-labor intensive,technology intensive, and human-capital intensive products. The extensivedimension of imports is relevant to consider, since the fixed cost of foreign(import) market entry may be market specific, which would imply that pro-ductivity needs to increase in the degree of diversity of the import portfolio.
Figure 1: Relationship between technology intensive imports and advancedcountry imports at the firm level (the Netherlands, 2002-2008, n=35,966)
Notes: The share of imports from advanced economies is calculated as the share of importsfrom neighboring countries, Northern EU-15, Southern EU-15, non-EU Northwestern Eu-rope, advanced Asia, Australia & New Zealand and North America (see figure 5) in totalimports of firms for which the full decomposition in terms of country of origin and factorintensity is known.
To illustrate that geography and intensity are really two different dimen-sions at the firm level, the scatter plot in figure 1 depicts technology intensiveimports on the one hand and imports from advanced countries on the otherhand for individual firms. If these two dimensions were more or less synony-mous, as some of the literature assumes, there should be a strong positiveassociation. In contrast, some firms import a lot from advanced countries,
3

but these are not technology intensive products, while other firms import alot of technology intensive products, but not from advanced countries. Theobjective of the paper, and our contribution to the literature, is thereforefourfold, namely to study the relationship between firm productivity and (i)the geographic dimension of imported goods (both advanced-developing andproximate-remote), (ii) the intensity dimension of imported goods, (iii) thegeographic-intensity interaction and (iv) the degree of diversification of theimport portfolio. Our results regarding the geographic-intensity interactionwill determine, in particular, how harmful it is not to distinguish clearlybetween these two dimensions. An indication of this was already providedat the macroeconomic level by Coe et al. (1997) when they argued that de-veloping countries can benefit from knowledge spillovers by importing fromadvanced countries through the interaction with machinery and equipmentimports.
The remainder of the paper is organized as follows. Section 2 gives abrief overview of the empirical literature on the relationship between importstatus and firm performance regarding country of origin and factor intensityas explanatory factors. Section 3 discusses the Dutch data from the period2002-2008 used in the empirical analysis. Section 4 gives an overview of theproductivity characteristics of importers versus non-traders, exporters, andtwo-way traders. Section 5 analyzes firm productivity and the geographicdimensions of imports. Section 6 does the same regarding factor intensity.Section 7 analyzes firm productivity and geographic-intensity interaction.Section 8 concludes.
2 Firm heterogeneity and imports
The literature distinguishes several mechanisms through which importing andfirm-level productivity could be causally related. Firms can raise productiv-ity by importing R&D intensive intermediate inputs from the technologicalfrontier. Coe and Helpman (1995) and Coe et al. (1997) show empiricallythat productivity gains from R&D are indeed not only considerable in thesource country, but that the benefits are also reaped by importing economies,both advanced and developing. Loof and Andersson (2010) argue that globalspecialization plays a key role in enhancing firm productivity, since importingenables firms to utilize inputs from the technological frontier. Acharya andKeller (2009) present evidence on this matter suggesting that importing isan important vehicle for technology transfers between countries. Moreover,importing might offer firms the possibility to purchase intermediate inputsat lower cost. The wider variety of intermediate inputs that becomes avail-
4

able through importing, amongst which higher quality inputs, can increasefirm-level productivity. In addition to this, importing firms may benefit fromspill-over effects and increase productivity by learning from foreign suppliers(Coe et al., 1997). This combination of learning and variety effects is alsoreferred to as the complementarity aspect of importing. Finally, importingfinal goods increases competition on domestic markets, which forces domesticproducers, regardless of their trading status, to operate more efficiently andthus become more productive (Amiti and Konings, 2007).
A considerable amount of firm level evidence suggests that firms import-ing inputs are more productive than firms that source inputs solely domes-tically.1 However, the empirical evidence regarding the impact of countryof origin and factor intensity of imports on firm performance is much morescarce. Loof and Andersson (2010) present evidence indicating that produc-tivity increases in the share of imports from G7 countries. They concludethat imports are an important channel for technological learning and knowl-edge transfers, by assuming, rather crudely, that G7-imports are on averagemore R&D and knowledge intensive and of better quality than imports fromother countries. Serti and Tomasi (2009) and Castellani et al. (2010), em-ploying a panel data set of Italian firms, investigate empirically whether theeffect of trading on firm performance is related to geographic patterns oftrade. Their findings indicate that imports from advanced economies are as-sociated with a higher productivity premium than imports from developingeconomies. Their suggested explanation for this is that imports from high-income countries are presumably of higher quality and are more technologyintensive than imports from lower income countries. These imports there-fore require the presence of a certain amount of absorptive capacity whichthey associate with the existence of a productivity premium. The empiricalevidence presented by Bas and Strauss-Kahn (2010) regarding French firmsalso suggest that the positive association between productivity and importsis stronger for imports from advanced economies. Silva et al. (2012) presentempirical evidence regarding Portuguese firms, showing that geographicaland sectoral diversification, for both imports and exports, is positively cor-related with productivity. Furthermore, their findings indicate that tradingwith nearby and familiar economies is associated with a smaller productivitypremium than trading in more ’difficult’ markets.
A few general conclusions can be taken from the preceding discussion.A well-known stylized fact is that importers tend to be more productiveand perform better in general than non-traders. The empirical evidence
1Among others see Bernard et al. (2007); Muuls and Pisu (2009); Vogel and Wagner(2010); Hagemejer and Kolasa (2011).
5

regarding the impact of import characteristics in terms of geographical originand factor intensity on firm performance is still rather scarce. However, thelimited amount of evidence available on this matter indicates that importsfrom advanced countries or technologically advanced imports are associatedwith larger productivity premia.
3 Data
For the empirical analysis we merge data from three main Dutch data sources:(i) the General Business Register (GBR), (ii) the Baseline Database and (iii)the International Trade Database, all provided by Statistics Netherlands intoa panel data set covering the years 2002 to 2008.2 The data from the threedifferent sources are merged using a unique identification number which isassigned by Statistics Netherlands to each individual firm in the GeneralBusiness Register. The merging procedure is graphically depicted in figure2.3
The GBR is, in principle, exhaustive in the sense that it contains infor-mation about every firm in the Netherlands, including a set of basic firmcharacteristics such as the number of employees in fulltime equivalents, thesector in which the firm operates according to the internationally standard-ized ISIC Rev. 3.1 sector classification4 and some general address informa-tion. We take from a separate but related database information concerningthe ultimate controlling institution of the firm, indicating whether the ulti-mate controlling owner of the Dutch firm is located abroad.
2We confine ourselves to discussing some key characteristics of each data source in thispaper. For the details regarding the merging procedure see Van den Berg (2013).
3We focus the analysis in this paper on firms in manufacturing sectors and wholesale& retail trading sectors. This implies that typical service sectors are excluded. We choosefinancial intermediation as the cut-off point for service sectors, which corresponds to ISICRev. 3.1 section J, division 65. Manufacturing sectors correspond in the analysis to ISICRev. 3.1 sections A through I, excluding G. Wholesale & retail traders correspond toISIC Rev. 3.1 section G and service sectors, defined as sections J to Q, are excluded fromthe analysis. The OECD and Eurostat recommend to define manufacturing as sections Athrough F and to include section G to Q in services. However, in terms of goods trade thisdivision is less sensible, since a considerable part of goods trade takes place in trade andtransport sectors it is therefore more appropriate to separate these sections from typical(financial and public) service sectors.
4The ISIC Rev. 3.1 sector classification equals the SBI’93 2 digit classification employedby Statistics Netherlands
6

Figure 2: Graphical representation of the merging steps towards a paneldata set
General BusinessRegister (GBR)
• firm characteristics• 3,973k observations• 1,040k firms
BaselineDatabase
• productivity data• 1,496k observations• 555k firms
InternationalTrade Database
• trade data• 738k observations• 243k firms
paneldata set
• period 2002-2008• 1,191k observations• 446k firms
-6 6
merge on firm ID
Data related to productivity measurement come from Baseline. Thisdatabase contains a wealth of financial information collected from both cor-porate tax declarations and income tax declarations of entrepreneurs. Cor-porate tax declarations are registered on Value Added Tax (VAT) numbers,which need to be connected to the business identification numbers used byStatistics Netherlands. This match is only allowed when the connection isabsolutely certain. Since firm structures tend to get more complex withincreasing firm size, the success rate of the matching procedure decreasesaccordingly. Moreover, the Baseline data cover income tax statements ofentrepreneurs only since 2006, the years 2002-2005 contain only data fromcorporate tax declarations. This implies that the annual number of observa-tions in the panel increases considerably from 2006 onwards and the averagefirm size in the panel drops once income tax information is included. Theinformation taken from the Baseline database is modified to fit the widelyused KLEMS-framework, and contains information about gross output, valueadded and the value of capital, labor and intermediate inputs.5 The data re-garding input used and output produced are deflated using separate sectorlevel price indices for gross output, value added, labor, capital and interme-diate inputs. We employ the data from tax declarations to calculate severaldifferent measures of productivity. Labor productivity (LP) is computed in
5The KLEMS-framework is an analytical framework in which data regarding inputand output at the level of individual firms and industries are employed for growth andproductivity analysis. One of the strengths of the KLEMS-framework is the internationalharmonization of the key concepts and methodologies
7

two ways, as value added and gross output per employee deflated using asector specific price index. We estimate total factor productivity (TFP) byemploying the procedure proposed by Levinsohn and Petrin (2003).6
Trade data were taken from the International Trade database and in-cludes information on all imports and exports of goods by Dutch firms.7
Extra-EU trade is recorded by the Customs Authority. These data alwaysinclude product information at the 8-digit Combined Nomenclature (CN)level and specification of origin and destination country. Intra-EU importsand exports are recorded by the Dutch Tax Authority. Firms with intra-EUimport and/or export values larger than a total of 900,000 euro (thresholdin 2009) are required to specify their trade transactions at the 8-digit levelaccording to the CN and specify the origin and destination of trade throughan additional questionnaire from Statistics Netherlands. Below this thresh-old firms only need to report the total import and export value of intra-EUtrade. The trade data available at the firm level cover more than 80% ofannual aggregate trade in terms of value in the Netherlands.8 Finally, wealso include import and export values according to the factor intensity of thegoods traded, following Van Marrewijk (2002) and distinguishing between(i) primary products, (ii) natural resource intensive products, (iii) unskilledlabor intensive products, (iv) high-tech products and (v) human capital in-tensive products. The merging procedure results in an unbalanced paneldata set containing a total of 1.2 million observations of 446,000 manufac-turing and wholesale & retail trading firms spanning a period of seven years(2002-2008).9
4 Main productivity characteristics
Before we turn to the main research question of this paper, investigatinghow the characteristics of imports in terms of geographic origin and factorintensity affect firm-level productivity, we start by establishing whether im-porters outperform non-traders in terms of productivity, before turning to
6See Van den Berg (2013) for details regarding the estimation procedure.7The trade data also include intra-firm trade, which cannot be distinguished from inter-
firm trade. Note also that apart from the import value we do not have information as towhether it concerns imports of capital goods, intermediate inputs or final goods.
8The trade data are recorded on VAT-numbers. Connection to the firm identificationkey used by Statistics Netherlands leads to a merging loss of about 20% of annual tradevalues.
9This is after eliminating micro firms (less than one fulltime equivalent) and implausibleobservations with zero or negative output or exports exceeding gross output. See Van denBerg (2013) for details.
8

an empirical investigation of productivity differences within the subset ofimporters.
Figure 3: Firm-level productivity distribution by trade status (the Nether-lands, 2002-2008)
Notes: Following Melitz and Trefler (2012), the horizontal axis represents firm-level log oftotal factor productivity (TFP) scaled by subtracting the annual median productivity ofthe firm’s 2-digit sector. The vertical axis represents the density of firms at that particularproductivity level, weighted by firm size in terms of employment.
The complete distribution of firm-level total factor productivity by tradestatus, for manufacturing firms and wholesale & retail trading firms pooled,is depicted in figure 3.10 The figure illustrates that the productivity dis-tribution of non-traders is located left of the distributions of trading firms,followed by the productivity distributions of exporters, importers and two-way traders in that order from left to right. One way to consider the fulldistribution is to perform a series of Kolmogorov-Smirnov tests comparingthe productivity distributions of non-traders, sole exporters, sole importersand two-way traders with each other.11 The results of the two-sided testsfor both total factor productivity and labor productivity are significant inall cases, indicating that the productivity distributions of the four groups
10From this point onwards, the top and bottom 1% of the observations along the relevantproductivity distribution are excluded, in order to eliminate implausible observations dueto measurement errors, which we are unable to further investigate due to confidentialityconsiderations.
11See Girma et al. (2004) for a discussion of the Kolmogorov-Smirnov test.
9

of firms do indeed differ. This holds for both manufacturing sectors andwholesale & retail trading sectors.
The next step in the empirical analysis consists of estimating the traderpremia, that is, the productivity difference between non-traders and tradersthat can be attributed to the differing trade status. In order to do so, weestimate the following empirical model:
ln(prodit) = α + β1importerit + β2exporterit + β3twowaytraderit
+β4firmsizeit + β5foreigncontrolledit
+β6yeart + β7sectorit + β8regioni + eit
(1)
We estimate a pooled OLS-regression model employing the panel data con-cerning Dutch firms over the years 2002 to 2008.12 In this model the sub-script i identifies individual firms and t indexes the year. The dependentvariable to be estimated (ln(prodit)) is either the natural log of total factorproductivity, denoted by lnTFPit, or the natural log of labor productiv-ity, denoted by lnLPit. Dummy variables regarding trade status, with non-trading firms as the reference group, are defined by importerit, exporterit andtwowaytraderit.
13 We also include a series of control variables based on thepreceding discussion; firm size in terms of employment in fulltime equivalents(firmsizeit), a dummy variable indicating whether the firm is controlled bya company located abroad foreigncontrolledit) and a full set of year (yeart),2-digit sector (sectorit) and region (regioni) dummy variables.14 The regiondummies identify the twelve Dutch provinces.15
Figure 4 shows the estimation results of the baseline model using TFPand LP as productivity measures. The ranking of sole exporters and sole
12In some studies in this strand of empirical literature firm fixed effects models areestimated next to pooled OLS-models. However, the trade status of individual firms isgenerally relatively stable. The panel consists of approximately 446,000 unique firms ofwhich about 47,000 switch import status during the observed period, corresponding to lessthan 11 percent of the population. This implies that the individual firm-specific interceptwould capture the better part of the effect of trade status on firm-level productivity forthose firms where the trade status does not change during the observed period. This impliesthat the estimated coefficient only reflects the effect of trade status on productivity forthose firms where the trade status changed during the observed time period, leading tobiased estimates of the trade premia.
13A firm is considered being an exporter resp. importer in a particular year if it reportsan export resp. import value larger than zero in that year.
14The dummy variable indicating whether a firm is ultimately controlled by a foreigncompany is not derived from the underlying ownership structure, it indicates whether thecontrolling institution is effectively located abroad.
15The Dutch provinces align with the second level of regional aggregation of the Nomen-clature of Units for Territorial Statistics (NUTS2) developed by the European Union.
10

importers is reversed compared to the productivity distributions depicted infigure 3, after controlling for additional firm characteristics. The trade premiaare of considerable magnitude and statistically significant. Only importingfirms are an estimated 12 percent more productive in terms of TFP and22.8 percent in terms of labor productivity.16 Splitting the panel in typicalmanufacturing and wholesale & retail trading sectors (see table 8 in theappendix) shows that the differences between both main sectors in termsof trade premia are limited. Wholesale & retail traders show the highestproductivity premium for both TFP and labor productivity of 14.5 resp.25.4 percent, followed by manufacturers; 8 resp. 18.1 percent. In addition,we find a consistent productivity ordering for each subset, with non-tradersbeing the least productive, followed by sole importers, sole exporters and two-way traders, in that order. The difference between the estimated coefficientsof the distinguished trade statuses is statistically significant in the modelsincluding all firms and the separate subsets by main sector. This holds forfor both total factor productivity and labor productivity. The coefficients ofthe control variables show the expected results.
Figure 4: Firm trade type and productivity, estimated coefficients (theNetherlands, 2002-2008)
Note: All estimated trade premia are significant at the 0.1% level
5 Does geographic origin of imports matter?
Now we turn to the key part of the analysis; do the characteristics of importsaffect firm-level productivity? We confine the analysis in this and the next
16Trade premia are calculated as 100(exp(β)− 1).
11

sections to the subset of observations for which the complete breakdown ofimports along the relevant dimensions is available. That is, we established insection 4 that importers are on average more productive than non-traders. Inthe following sections we focus on productivity differences within the subsetof importers, conditional on being more productive on average than non-traders.17
To keep the analysis manageable we aggregate the import data by ori-gin country into 13 mutually exclusive and exhaustive regions which are in-spired by the geographical aggregation of countries by the World Bank; (1)neighboring countries, (2) Northern EU-15, (3) Southern EU-15, (4) non-EU Northwestern Europe, (5) the rest of the EU, (6) the rest of Europe, (7)Middle East & North Africa, (8) sub-Sahara Africa, (9) developing Asia, (10)advanced Asia, (11) Australia & New Zealand, (12) North America and (13)Latin America & the Caribbean (see figure 5).18
Figure 5: Regional aggregation of origin countries
Table 1 shows for each of the identified regions the average productivityof firms that exclusively import from that region in a particular year. The ta-ble illustrates that firms exclusively importing from the EU-15 in general areon average considerably more productive than firms importing from regionsfurther away. A distinct pattern does not emerge from the productivity dis-
17From this section onwards we only discuss empirical results using TFP as measureproductivity, since the findings for labor productivity do not deviate to a noteworthyextent. The results using labor productivity as measure of productivity are available fromthe authors on request.
18The geographic regions are described in detail in table 9 in the appendix.
12

tribution of the remaining regions, albeit that firms importing from advancedregions such as non-EU northwestern Europe, advanced Asia and Australia& New Zealand are at the top end.
Table 1: Productivity (TFP) by geographical import market
regional market no. of obs. mean regional market no. of obs. mean
neighboring countries 2,768 21,857 Latin America and the Caribbean 616 12,910Northern EU-15 199 21,091 rest of EU 890 12,787Southern EU-15 364 20,564 rest of Europe 423 12,496non-EU Northwestern Europe 1,927 15,050 sub-Sahara Africa 464 11,991Australia and New Zealand 309 13,692 developing Asia 6,180 10,892advanced Asia 1,726 13,629 Middle East and North Africa 1,749 10,735North America 6,542 12,974
non-trading 9,723total 24,157
Note: The calculations of the mean firm-level productivity by origin of imports are based on firms that import goods in aparticular year exclusively from one single region.
Figure 6: TFP and # of geographic import markets (left scale), # of im-porters and # of geographic import markets (right scale)
Figure 6 shows that more than half of the firms (observations) for whichthe complete geographical composition of imports is available sources inputsfrom more than one region. The number of observations monotonically de-creases in the number of geographical import markets from 17% of the firmsimporting goods from two regions to 0.1% of the firms sourcing inputs fromall (13) regions. Figure 6 also shows that productivity increases in the num-ber of geographical markets the firm imports from. Mean productivity peaksat importing from the maximum of 13 geographical markets simultaneously.
13

Particularly importing from a second, and to a lesser extent a third, geo-graphical market seems to be associated with a considerable productivitypremium. The productivity pattern emerging from Figure 6 points in thedirection of the existence of fixed costs associated with importing from anadditional geographical market. That is, not only import starters incur afixed cost associated with the import start, but firms incur a fixed cost foreach additional geographical market as well. However, the fixed cost of an im-port start still seem to be higher than the fixed cost of adding a geographicalmarket to the import portfolio, considering the fact that mean productivityof non-traders is well below that of single market importers (see table 1).
The level of concentration of imports is generally high; 93% of the firmsimports more than half of their goods exclusively from one region. This de-creases to a still considerable 59% of the firms sourcing more than 95% of theirimported goods from a single region. Moreover, concentration of imports ismore persistent for regions far away than for regions nearby. In other words,firms importing goods from nearby are more likely to increase the numberof regions they source goods from than firms importing from regions furtheraway, indicating that distance is an important factor in the degree of concen-tration of imports. This suggests the existence of a stepping stone strategyregarding imports, where the firm starts importing from a country nearbyand gradually expands its import activities to more distant markets in termsof both physical and cultural distance. This strategy regarding export mar-ket entry is well-documented, particularly regarding SMEs (see Creusen andLejour (2011)). This observation is consistent with the hypothesis that fixedcosts of importing from regions at great distance are higher than those ofsourcing imported goods nearby.
We include the import shares of each of the regions of origin separatelyin the baseline regression model. Along with the import shares we include ameasure of geographical dispersion of imports, namely the log of the numberof regions from which a firm imports, as an explanatory variable. This bringsus to the following to model to be estimated:
ln(prodit) = α +13∑g=1
βgimportsharegit + β14dispersionit
+β15twowaytraderit + β16firmsizeit + β17foreigncontrolledit
+β18yeart + β19sectorit + β20regioni + eit
(2)
Each variable is defined in the same way as in equation 1.19 In addition to
19Note that the analysis only contains firms that import by definition, implying thatnon-traders and sole exporters do not need to be accounted for.
14

subscripts i and t identifying firms resp. years, subscript g identifies geo-graphic regions running from 1 to 13. We choose North America, account-ing for the most observations, to serve as the reference group consistentlythroughout the analysis. The variable dispersionit is the log of the numberof regional markets the firm imports from.
Figure 7: Estimated coefficients by geographic import market (Table 2,column 2)
Note: ∗ p < 0.05, ∗∗ p < 0.01, ∗∗∗ p < 0.001
The results of these regressions are presented in table 2. The impact ofthe region of origin of imports on firm-level productivity could hypotheticallygo both ways; the importing firm can benefit from high quality imports fromthe technological frontier from advanced regions, located relatively nearby forDutch firms, and thereby increase productivity. But the fixed and variablecosts of importing are higher for imports from regions far away or from regionswhich pose more difficulties for Dutch importers due to various barriers totrade. This would imply that a higher level of productivity is needed toovercome those costs.
The regression results point in the direction of both mechanisms playinga role. The results indicate that higher import shares from regions nearbyimpact positively upon firm-level productivity (table 2, column 1). The esti-mated premia for imports from advanced regions nearby, neighboring coun-tries, Northern and Southern EU-15 and non-EU Northwestern Europe aresignificantly positively correlated with firm-level productivity, relative to thereference region, which is North America. The differences between the pre-mia estimated are considerable, with the premium of imports from Northern
15

EU-15 being almost three times larger than the premium on imports fromnon-EU Northwestern Europe. In terms of distance, geographically, economi-cally, culturally and linguistically, these regions contain the group of countriesclosest to the Netherlands. The import share from advanced regions furtheraway (Australia & New Zealand, the rest of the EU and advanced Asia) re-turns relatively small or insignificant productivity premia relative to NorthAmerica, as does the import share from the rest of Europe and Latin America& the Caribbean. The import share from typical developing regions, such assub-Saharan Africa, developing Asia and the Middle East & North Africa,has a significantly negative impact on productivity.
Furthermore, a consistent picture emerges regarding the relationship be-tween the degree of dispersion of imports and firm-level productivity; produc-tivity increases in the number of regional import markets on which the firmsources its inputs (column 2).20 This finding seems in accordance with thetheoretical argument stating that fixed costs of importing are market specific,and each additional market added to the import portfolio implies incurringthese fixed cost again. Controlling for the degree of geographical dispersiondoes not impact heavily upon the estimated premia for the separate regions.
The control variables included in the regressions are all significant andconsistently show the hypothesized sign. The separate regressions for man-ufacturing and wholesale & retail trading sectors show that the estimatedcoefficients for import shares within the EU and Northwestern Europe arelarger for wholesale & retail traders. For imports from further away, the pro-ductivity premia for trading firms seem to decrease faster in physical distancethan for manufacturing firms. Analogously, the productivity premium asso-ciated with a diversified import portfolio in geographical terms is higher forwholesale & retail trading than for manufacturing firms. This taken togetherit seems that the pattern of productivity premia by geographic origin is morepronounced for firms in wholesale & retail trading than for manufacturingfirms.
20We also experimented with a Herfindahl-like measure of geographical concentration ofimports. The findings corroborated the findings using the number of geographical marketsas a measure of dispersion and are thus not reported separately for space considerations.
16

Table 2: Import origin, degree of dispersion and total factor productivity(pooled OLS, 2002-2008)
manufacturing wholesale andall firms sectors retail trading
(1) (2) (3) (4) (5) (6)
import shares by geographic region
neighboring countries 0.361∗∗∗ 0.337∗∗∗ 0.278∗∗∗ 0.255∗∗∗ 0.372∗∗∗ 0.346∗∗∗
(26.48) (24.61) (12.19) (11.12) (21.83) (20.30)
Northern EU15 0.390∗∗∗ 0.300∗∗∗ 0.270∗∗∗ 0.208∗∗∗ 0.406∗∗∗ 0.300∗∗∗
(19.93) (14.92) (7.13) (5.34) (17.48) (12.57)
Southern EU15 0.283∗∗∗ 0.208∗∗∗ 0.161∗∗∗ 0.0913∗ 0.294∗∗∗ 0.213∗∗∗
(14.63) (10.50) (3.79) (2.07) (13.15) (9.30)
non-EU Northwestern Europe 0.133∗∗∗ 0.140∗∗∗ 0.0976∗∗∗ 0.103∗∗∗ 0.150∗∗∗ 0.155∗∗∗
(7.04) (7.43) (3.81) (4.03) (5.62) (5.82)
Australia and New Zealand 0.0576 0.0501 0.0785 0.0700 0.0396 0.0342(1.31) (1.13) (1.29) (1.15) (0.66) (0.57)
rest of EU 0.0538∗ 0.0361 -0.0369 -0.0507 0.102∗∗ 0.0819∗
(2.02) (1.36) (-0.91) (-1.24) (2.95) (2.38)
advanced Asia 0.0489∗ 0.0259 0.0387 0.0271 0.0551∗ 0.0249(2.42) (1.28) (1.28) (0.90) (2.10) (0.95)
North America reference reference reference reference reference reference
Latin America and the Caribbean 0.00625 -0.00660 0.0785 0.0614 -0.00886 -0.0186(0.19) (-0.20) (1.54) (1.21) (-0.21) (-0.45)
rest of Europe -0.0361 -0.0443 0.0424 0.0347 -0.0899 -0.0985(-0.94) (-1.16) (0.81) (0.67) (-1.67) (-1.84)
Sub-Sahara Africa -0.0911∗ -0.0983∗ 0.113∗ 0.103 -0.166∗∗ -0.170∗∗
(-2.18) (-2.36) (2.00) (1.82) (-3.12) (-3.21)
developing Asia -0.139∗∗∗ -0.148∗∗∗ -0.0813∗∗∗ -0.0898∗∗∗ -0.150∗∗∗ -0.158∗∗∗
(-9.42) (-10.03) (-3.39) (-3.74) (-8.11) (-8.56)
Middle East and North Africa -0.173∗∗∗ -0.175∗∗∗ -0.0863∗ -0.0877∗ -0.201∗∗∗ -0.202∗∗∗
(-7.59) (-7.68) (-2.25) (-2.29) (-7.16) (-7.22)
degree of geographical dispersion of imports
number of regional markets (log) 0.102∗∗∗ 0.0684∗∗∗ 0.123∗∗∗
(16.65) (6.39) (16.46)
control variables
non-exporter reference reference reference reference reference reference
exporter 0.208∗∗∗ 0.170∗∗∗ 0.161∗∗∗ 0.136∗∗∗ 0.231∗∗∗ 0.186∗∗∗
(22.37) (17.61) (10.21) (8.23) (20.38) (15.81)
domestically controlled reference reference reference reference reference reference
foreign controlled 0.164∗∗∗ 0.160∗∗∗ 0.0698∗∗∗ 0.0534∗∗ 0.230∗∗∗ 0.240∗∗∗
(14.20) (13.84) (3.78) (2.87) (15.70) (16.36)
firm size (fte, log) 0.197∗∗∗ 0.180∗∗∗ 0.184∗∗∗ 0.174∗∗∗ 0.206∗∗∗ 0.185∗∗∗
(63.21) (55.07) (36.05) (32.50) (52.60) (44.96)
No. of observations 52,397 52,397 15,519 15,519 36,878 36,878R2 0.266 0.269 0.277 0.279 0.262 0.266
Notes: All regressions include a full set of year, sector and region dummies.∗ p < 0.05, ∗∗ p < 0.01, ∗∗∗ p < 0.001
17

Summing up, the empirical results presented in this section show that ageographically diversified import portfolio is positively associated with firm-level productivity. Furthermore, productivity premia associated with importsby geographic origin seem to decrease in distance and increase in the levelof development of the origin economy. It seems plausible that these findingsare related to the theoretical argument stating that fixed cost of importingare market specific, and each additional market added to the import port-folio implies incurring these fixed cost again. However, productivity hingespositively on concentration of imports within the EU-15. A possible expla-nation for this phenomenon could be that firms highly focused on importsfrom nearby countries are an integrated element of a value chain, enablingthem to incur efficiency gains particularly by being focused in terms of theirimport portfolio. Furthermore, a partial explanation for the lack of empiricalsupport for the hypothesis that the fixed and variable costs of importing arehigher for imports from regions far away or from ’difficult’ regions, could beprovided by the nature of the products being imported from those regions.Imports from developing countries contain a relatively high fraction of fi-nal goods on average (possibly predestined for re-exporting), compared toimports from advanced countries (nearby) which contain a larger fraction ofintermediate inputs.21 This is in line with Miroudot et al. (2009) showing thatthe bulk of intermediate goods trade takes place between advanced countries.In addition, Miroudot et al. (2009) show that trade between advanced anddeveloping regions is characterized to a larger extent by final goods trade. Itmakes sense intuitively to expect that the potential for incurring productivityand efficiency gains is larger for intermediate goods imports than for importsof final goods or goods predestined for re-exporting. Unfortunately, it is nei-ther possible at this point to separate between intermediate and final goodsimports nor to identify the fraction of imports predestined for re-exporting.However, decomposing imports in terms of the factor intensity embodied inthe goods being imported might shed further light on this issue.
6 Does the factor intensity of imports mat-
ter?
Next to the geographic origin of imports we have information regarding thefactor intensity of the imported goods, following the product classification
21Illustrative in this respect are back-of-the-envelope calculations indicating that about60% of Dutch imports from China are destined for re-exporting, while this fraction isestimated to be about 30% for imports from Belgium and Germany.
18

developed by the International Trade Center into five types of product, seeVan Marrewijk (2002).
i Primary products, such as meat, dairy, cereals, fruit, coffee, sand, miner-als, oil, natural gas, iron ore, and copper ore.
ii Natural-resource intensive products, such as leather, cork, wood, lime,precious stones, pig iron, copper, aluminum, and lead.
iii Unskilled-labor intensive products, such as various textiles, clothing, glass,pottery, ships, furniture, footwear, and office supplies.
iv Technology intensive products, such as various chemicals, medicaments,plastics, engines, generators, machines, tools, pumps, telecommunicationsand photo equipment, optical equipment, and aircraft.
v Human-capital intensive products, such as synthetic colors, pigments,perfumes, cosmetics, rubber and tires, tubes, various types of steel andiron, cutlery, televisions, radio’s, cars, watches, and jewelry.
We follow the same procedure as in section 5. Table 3 presents the meanproductivity of firms that exclusively import products from one of the fivedistinguished product types. The table shows that mean productivity is high-est for firms exclusively importing primary products and high-tech products.Unskilled labor intensive imports are associated with the lowest levels of pro-ductivity, although productivity of these firms is still higher on average thanthat of non-traders.
Table 3: Productivity (TFP) by intensity import market
intensity market no. of obs. mean
primary products 2,751 17,671high-tech products 5,305 16,287natural resource intensive 759 14,378human capital intensive 5,589 13,717unskilled labor intensive 4,382 11,692non-trading 9,723
total 18,786
Note: The calculations of the mean firm-level produc-tivity by factor intensity of imports are based on firmsthat exclusively import goods in a particular year fromone product group.
Analogous to the number of geographical markets a firm imports fromfirm-level productivity increases in the number of international product mar-kets the firm sources its inputs from (figure 8). Almost 60 percent of the
19

firms imports goods exclusively from one class of products. This decreasesrapidly to just under two percent of the firms importing from all five prod-uct groups. Firm-level productivity increases monotonically in the numberof product markets, with TFP being almost twice as high for firms import-ing from all five product groups compared to firms importing from a singleproduct group.
The level of concentration of imports is even higher for imports by fac-tor intensity compared to imports by geographical origin; 98 percent of thefirms sources more than half of its inputs from one product group, which de-creases to 75 percent of the firms importing more than 95 percent of its totalimports from a single product group. This is an intuitively straightforwardobservation, since the core business of the firm will most likely be the maindeterminant of the factor intensity of imports.
Figure 8: TFP and # of intensity import markets (left scale), # of importersand # of intensity import markets (right scale)
The import shares of the types of goods with different factor intensitiesare included separately in the baseline regression model along with a measureof the degree of dispersion of imports, which is defined as the (log of the)number of product markets on which the firm sources its inputs. Analogousto the procedure presented in section 5 we estimate the following modelwith import shares of each of the product groups by factor intensity as theexplanatory variables of interest:
ln(prodit) = α +5∑
f=1
βf importsharefit + β6dispersionit
+β7twowaytraderit + β8firmsizeit + β9foreigncontrolledit
+β10yeart + β11sectorit + β12regioni + eit
(3)
20

Where subscript f identifies each of the five product classes, distinguishedby their factor intensity and running from 1 to 5.
In terms of import shares, importing high-tech products and primaryproducts shows to be most beneficiary to firm-level productivity (figure 9).This makes sense intuitively, with the discussion of the mechanisms throughwhich importing can raise productivity in mind (see section 2), especially withrespect to technology intensive products. Following that same line of reason-ing it is intuitively straightforward that importing mainly unskilled-laborintensive products impacts negatively upon firm-level productivity, whichholds for both manufacturing and trading sectors.
Figure 9: Estimated coefficients by intensity import market (Table 4, col-umn 2)
Note: ∗ p < 0.05, ∗∗ p < 0.01, ∗∗∗ p < 0.001
Note that the significantly positive association between productivity andprimary and high-tech products is mainly on account of wholesale & retailtrading sectors, for which the pattern of estimated premia is more pronouncedagain (table 4). Natural-resource intensive goods return an insignificant coef-ficient relative to the reference group, which contains human capital intensiveimports. Manufacturing sectors show a considerable number of insignificantcoefficients, which is due to the relatively low number of observations, par-ticularly for specific product groups. Furthermore, firm-level productivity is
21
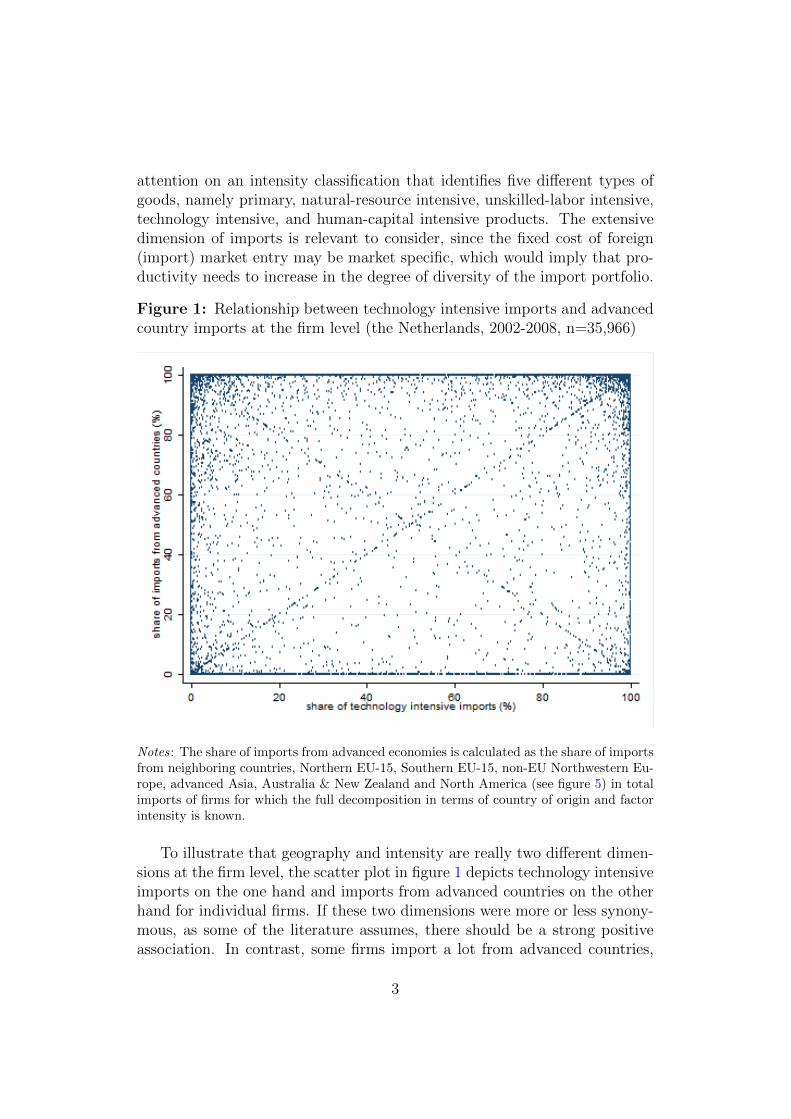
positively associated with the number of international product markets onwhich the firm is active. Again, all control variables included are significantand return the expected sign.
Table 4: Factor intensity of imports and total factor productivity (pooledOLS, 2002-2008)
manufacturing wholesale andall firms sectors retail trading
(1) (2) (3) (4) (5) (6)
import shares by factor intensity
high-tech products 0.105∗∗∗ 0.106∗∗∗ 0.00537 0.00662 0.140∗∗∗ 0.140∗∗∗
(7.24) (7.31) (0.25) (0.30) (7.50) (7.55)
primary products 0.0965∗∗∗ 0.104∗∗∗ 0.0522 0.0496 0.109∗∗∗ 0.121∗∗∗
(5.12) (5.50) (1.47) (1.40) (4.93) (5.42)
natural resource intensive 0.00175 -0.00884 0.0805 0.0723 -0.0242 -0.0371(0.06) (-0.32) (1.91) (1.71) (-0.68) (-1.04)
human capital intensive reference reference reference reference reference reference
unskilled labor intensive -0.136∗∗∗ -0.137∗∗∗ -0.0894∗∗ -0.0924∗∗ -0.135∗∗∗ -0.134∗∗∗
(-8.32) (-8.35) (-3.01) (-3.11) (-6.89) (-6.84)
degree of dispersion of imports by factor intensity
number of product markets (log) 0.0546∗∗∗ 0.0428∗ 0.0659∗∗∗
(5.17) (2.40) (5.13)
control variables
non-exporter reference reference reference reference reference reference
exporter 0.297∗∗∗ 0.288∗∗∗ 0.221∗∗∗ 0.212∗∗∗ 0.322∗∗∗ 0.313∗∗∗
(25.91) (24.75) (11.98) (11.19) (22.75) (21.86)
domestically controlled reference reference reference reference reference reference
foreign controlled 0.256∗∗∗ 0.246∗∗∗ 0.131∗∗∗ 0.120∗∗∗ 0.319∗∗∗ 0.310∗∗∗
(14.97) (14.31) (4.88) (4.45) (14.78) (14.31)
firm size (FTE, log) 0.270∗∗∗ 0.266∗∗∗ 0.221∗∗∗ 0.218∗∗∗ 0.299∗∗∗ 0.294∗∗∗
(66.48) (64.36) (34.77) (33.26) (57.04) (55.37)
No. of observations 31,814 31,814 9,430 9,430 22,384 22,384R2 0.257 0.257 0.281 0.281 0.251 0.252
Notes: All regressions include a full set of year, sector and region dummies.∗ p < 0.05, ∗∗ p < 0.01, ∗∗∗ p < 0.001
7 Interacting the geography and factor inten-
sity of imports
The analysis in the previous sections marks the build up to our ultimategoal; interacting the geographical origin and factor intensity of imports andinvestigate how the two-dimensional characteristics of imports affect firm-
22

level productivity.In order to keep the analysis manageable, we further aggregate the trade
data by geographic origin and factor intensity into 18 two-dimensional product-region combinations, which we will denote geographical intensity markets.The decisions regarding aggregation are based on the level of significanceof the difference between coefficient estimates of the regressions includingimport shares by region and product type. The bilateral p-values, result-ing from a series of t-tests on the equality of estimated coefficients obtainedfrom the regressions presented in tables 2 (column 2) and 4 (column 2), aredepicted in tables 10 and 11 in the appendix. The results indicate thatimporting primary products and high-tech products does not significantlydiffer in terms of its impact on firm-level productivity. These product groupsare thus aggregated into one group for the next step. The same holds forimporting natural resource intensive products and human capital intensiveproducts. Regarding the geographical dimension of imports we reduce thenumber of regions by aggregation from 13 to 6. We pool together importsfrom neighboring countries and Northern EU-15.22 In addition, we also pooltogether other advanced countries (comprising of North America, advancedAsia and Australia & New Zealand) and developing countries (pooled overdeveloping Asia, Middle East & North Africa and sub-Sahara Africa). Fi-nally, imports from the rest of the EU (outside the EU-15), the rest of Europeand Latin America & the Caribbean are taken together, forming a group wedenote transition countries & South America. This procedure leaves us with6×3 = 18 mutually exclusive and exhaustive geographical intensity markets,comprising of 6 regions and 3 product groups.
Table 5 shows that the mean productivity of firms exclusively importingfrom the EU-15 is the highest, irrespective of the product type. In addition,productivity is consistently higher for firms exclusively importing from North-ern EU-15 compared to Southern EU-15, followed by non-EU NorthwesternEurope. Importing primary and high-tech products from advanced countriesoutside Europe is also associated with relatively high levels of productivity.Importing from developing countries is consistently associated with produc-tivity levels at the lower end of the distribution. Within sourcing regions,importing primary and high-tech product is consistently associated with thehighest productivity levels, followed by natural resource & human capital in-tensive products. Exclusively importing unskilled labor intensive products isconsistently associated with the lowest levels of productivity irrespective of
22Even though the t-test on the equality of the coefficients of these regions is justsignificant at the 5%-level, we feel that the degree of European integration within thesetwo regions and the degree of comparability and mutual dependency of the economiesallows us to pool these two regions together.
23

the sourcing region. Unskilled labor intensive imports from developing coun-tries is associated with the lowest level of firm-level productivity, althoughthe mean productivity of firms in this group is still (slightly) higher comparedto non-traders.
Table 5: Productivity (TFP) by geographical intensity market
no. of no. ofgeographical intensity market obs. mean geographical intensity market obs. mean
primary & high-tech products unskilled labor intensiveNorthern EU-15 (incl. neighboring countries) 804 23,066 Northern EU-15 (incl. neighboring countries) 226 19,656Southern EU-15 104 20,896 Southern EU-15 54 16,240non-EU Northwestern Europe 605 16,041 non-EU Northwestern Europe 182 12,420other advanced countries 2,364 14,177 other advanced countries 684 10,637transition countries and South America 542 13,113 transition countries and South America 339 10,918developing countries 1,618 12,497 developing countries 2,138 9,811
natural resource and human capital intensiveNorthern EU-15 (incl. neighboring countries) 699 20,814Southern EU-15 68 19,779non-EU Northwestern Europe 540 13,399other advanced countries 2,234 11,794transition countries and South America 393 13,172developing countries 1,482 10,594
non-trading 9,723total 15,076
Note: The calculations of the mean firm-level productivity by geographical intensity market are based on firms that import goods in a particular year exclusively fromone single region.
None of the firms in the panel sources inputs from all 18 geographicalintensity markets; the largest number of markets on which a firm is active is17. Productivity increases monotonously in the number of markets on whichthe firm sources its inputs. Comparable to the picture emerging from fig-ure 6 it seems that adding a second, third and fourth geographical intensitymarket to the import portfolio is particularly associated with a productiv-ity threshold, which points in the direction of the existence of fixed costsassociated with importing from an additional geographical intensity market.The degree of concentration of imports in geographical intensity markets ishigh with 96 percent of the firms sourcing the majority of its imports on asingle market. This decreases to a still considerable 63 percent of the firmsimporting more than 95 percent of its total import value exclusively from asingle two-dimensional market.
Analogous to the proceedings in the previous sections we include theimport shares of each of the 18 geographical intensity markets in the baselineregression model, in addition to the log of the number of two-dimensionalimport markets on which the firm is active, as a measure of import dispersion.
24

This leads to the following regression model to be estimated:
ln(prodit) = +18∑h=1
βhimportsharehit + β19dispersionit
+β20twowaytraderit + β21firmsizeit + β22foreigncontrolledit
+β23yeart + β24sectorit + β25regioni + eit
(4)
Subscript h identifies each of the geographical intensity markets running from1 to 18. Each variable is defined in the same way as in equation 2. Wechoose to exclude the most prominent geographical intensity market to serveas the reference group, which is primary & high-tech imports from advancedcountries outside Europe.
The result of these regressions is presented in table 6, the significance ofthe bilateral differences between estimated productivity premia is presentedin table 7. In order to gain an understanding of the importance of includingthe interaction between geographic origin and factor intensity of imports wealso present the regressions with both dimensions separately without inter-action term. Comparing the results from the three separate regressions wesee that controlling for both dimension simultaneously is important, sincethe estimated premia for both dimensions separately show to be additive normultiplicative. The geographic-intensity markets are largely unique and can-not be lumped together: no less than 119 out of 144 possible combinations(or 83 per cent of all combinations) are statistically significantly different atthe 10 per cent level, while 116 (or 81 per cent) are statistically significantlydifferent at the 5 per cent level.
Importing from the EU-15 in general is most positively associated withproductivity at the firm-level, with Northern EU-15 returning consistentlylarger coefficients than Southern EU-15. Relative to the reference group thecoefficient for all three product groups are significantly positive, with the im-pact of primary & high-tech product being the largest, before, in that order,natural resource intensive & human capital intensive imports and unskilledlabor intensive imports. Compared to the reference group, imports fromall three product groups from non-EU Northwestern Europe show a small,significant and positive productivity premium. The same holds for importsfrom transition countries & South America, except for unskilled labor inten-sive imports. The dispersion within imports from other advanced countries isconsiderable. With human capital & natural resource intensive imports rep-resenting the reference group we find high-tech and primary products return-ing a significant positive productivity premium and unskilled labor intensiveimports a significant negative premium. Finally, the estimated coefficients
25

are negative and significant for human capital & natural resource intensiveand unskilled labor intensive imports from developing regions.
The results thus indicate that the productivity premium of importing gen-erally increases in the import share of nearby and advanced regions. Withinregions, productivity decreases in the share of unskilled labor intensive im-ports, although in relative terms, importing goods from this group from thenearby regions still correlates relatively positively with productivity. In addi-tion, the measure of dispersion of imports shows that productivity increasesin the number of geographical intensity markets on which the firm is ac-tive. Finally, the control variables perform well in the sense that they are allsignificant and show the expected sign.
The separate regressions for manufacturing and wholesale & retail trad-ing sectors (table 12 in the appendix) show that the results regarding the fullsample are mainly driven by wholesale & retail trading sectors, which we thusdo not discuss separately. The separate regressions for manufacturing sec-tors yield relatively many insignificant coefficients, which is due to the smallnumbers of observations underlying some of the distinguished geographicalintensity markets. Relative to the reference group, importing from NorthernEU-15 shows significant productivity premia for all three product groups.In addition, importing all but human capital & natural resource intensiveimports from non-EU Northwestern Europe and human capital & naturalresource intensive products from Southern EU-15 and transition countries &South America is associated with a productivity premium. Unskilled laborintensive imports from developing countries yield a negative productivity pre-mium. Finally, productivity significantly increases in the number of importmarkets on which the manufacturing firms is active.
26

Table 6: Import origin, factor intensity, degree of dispersion and total factorproductivity (pooled OLS, 2002-2008)
(1) (2) (3) (4) (5) (6)
import shares by geographic import market
Northern EU-15 (incl. neighboring countries) 0.418∗∗∗ 0.394∗∗∗
Southern EU-15 0.351∗∗∗ 0.290∗∗∗
non-EU Northwestern Europe 0.128∗∗∗ 0.130∗∗∗
transition countries & South America 0.0212 0.00858
other advanced countries reference reference
developing countries -0.143∗∗∗ -0.143∗∗∗
import shares by intensity market
high-tech & primary products 0.104∗∗∗ 0.107∗∗∗
human capital and natural resource intensive reference reference
unskilled labor intensive -0.125∗∗∗ -0.127∗∗∗
import shares by geographic intensity market
Northern EU15 incl. neighboring countries
high-tech & primary products 0.510∗∗∗ 0.489∗∗∗
human capital & natural resource intensive 0.473∗∗∗ 0.459∗∗∗
unskilled labor intensive 0.407∗∗∗ 0.384∗∗∗
Southern EU15
high-tech & primary products 0.452∗∗∗ 0.414∗∗∗
human capital & natural resource intensive 0.453∗∗∗ 0.406∗∗∗
unskilled labor intensive 0.295∗∗∗ 0.264∗∗∗
non-EU Northwestern Europe
high-tech & primary products 0.230∗∗∗ 0.237∗∗∗
human capital & natural resource intensive 0.140∗∗∗ 0.144∗∗∗
unskilled labor intensive 0.141∗ 0.146∗∗
transition countries & South America
high-tech & primary products 0.117∗∗ 0.110∗∗
human capital & natural resource intensive 0.119∗∗ 0.114∗∗
unskilled labor intensive -0.0492 -0.0561
other advanced countries
high-tech & primary products 0.153∗∗∗ 0.154∗∗∗
human capital & natural resource intensive reference reference
unskilled labor intensive -0.139∗∗∗ -0.147∗∗∗
developing countries
high-tech & primary products 0.0170 0.0140
human capital & natural resource intensive -0.128∗∗∗ -0.136∗∗∗
unskilled labor intensive -0.151∗∗∗ -0.153∗∗∗
degree of dispersion of imports
number of geographic markets (log) 0.102∗∗∗
number of intensity markets (log) 0.0635∗∗∗
number of geographic intensity markets (log) 0.0688∗∗∗
control variables
non-exporter reference reference reference reference reference reference
exporter 0.204∗∗∗ 0.287∗∗∗ 0.193∗∗∗ 0.183∗∗∗ 0.280∗∗∗ 0.175∗∗∗
domestically controlled reference reference reference reference reference reference
foreign controlled 0.223∗∗∗ 0.286∗∗∗ 0.219∗∗∗ 0.217∗∗∗ 0.276∗∗∗ 0.207∗∗∗
firm size (FTE, log) 0.227∗∗∗ 0.274∗∗∗ 0.225∗∗∗ 0.219∗∗∗ 0.271∗∗∗ 0.218∗∗∗
No. of observations 29,878 29,878 29,878 29,878 29,878 29,878R2 0.269 0.246 0.273 0.270 0.246 0.274
Notes: All regressions include a full set of year, sector and region dummies.∗ p < 0.05, ∗∗ p < 0.01, ∗∗∗ p < 0.001
27

Table 7: Overview of bilateral significance of geographic-intensity produc-tivity premia (table 6, column 6)
A A A B B B C C C D D D E E E F F F1 2 3 1 2 3 1 2 3 1 2 3 1 2 3 1 2 3
A 1 -A 2 0.18 -A 3 0.00 0.02 -B 1 0.04 0.23 0.50 -B 2 0.06 0.27 0.67 0.89 -B 3 0.00 0.00 0.04 0.01 0.03 -C 1 0.00 0.00 0.00 0.00 0.00 0.65 -C 2 0.00 0.00 0.00 0.00 0.00 0.05 0.03 -C 3 0.00 0.00 0.00 0.00 0.00 0.11 0.13 0.97 -D 1 0.00 0.00 0.00 0.00 0.00 0.01 0.00 0.46 0.56 -D 2 0.00 0.00 0.00 0.00 0.00 0.02 0.01 0.55 0.62 0.94 -D 3 0.00 0.00 0.00 0.00 0.00 0.00 0.00 0.00 0.00 0.00 0.00 -E 1 0.00 0.00 0.00 0.00 0.00 0.04 0.01 0.78 0.89 0.24 0.34 0.00 -E 2 0.00 0.00 0.00 0.00 0.00 0.00 0.00 0.00 0.01 0.00 0.01 0.23 0.00 -E 3 0.00 0.00 0.00 0.00 0.00 0.00 0.00 0.00 0.00 0.00 0.00 0.09 0.00 0.00 -F 1 0.00 0.00 0.00 0.00 0.00 0.00 0.00 0.00 0.02 0.02 0.02 0.14 0.00 0.59 0.00 -F 2 0.00 0.00 0.00 0.00 0.00 0.00 0.00 0.00 0.00 0.00 0.00 0.10 0.00 0.00 0.76 0.00 -F 3 0.00 0.00 0.00 0.00 0.00 0.00 0.00 0.00 0.00 0.00 0.00 0.04 0.00 0.00 0.87 0.00 0.53 -
GeographyA Northern EU-15 D Transition countries & South AmericaB Southern EU-15 E Other advanced countriesC Non-EU Northwestern Europe F Developing countries
Intensity1 High-technology intensive and primary products2 Human-capital intensive and natural resource intensive products3 Unskilled-labor intensive products
Note: Values represent bilateral p-values obtained from regressions of firm-level productivity on import shares by geographic intensitymarket with varying baseline regions. Shading indicates significantly different at 10%.
The empirical evidence presented in this section shows that the use ofthe country of origin of imports as a proxy for the factor intensity of theimported goods is too general, since both the origin of imports, in terms ofproximity and the level of development, and the factor intensity turn outto be associated with firm-level productivity, but not necessarily follow thesame patterns. This shows that the relationship between importing and pro-ductivity is shaped simultaneously by all the dimensions of imports identifiedin section 1, that is, distance, the level of development of the source countryand the type of product imported. As Keller (2004) argues, there is no suchthing as a global pool of technology, since geography still turns out to play animportant role in the diffusion of technologies, for which importing is provento be a relevant vehicle. The empirical findings align with this argument.Illustrative for this is that high-tech imports from nearby EU-15 have a sig-nificantly more beneficial effect on productivity than do high-tech importsfrom advanced countries outside Europe like the U.S. or Japan. Miroudotet al. (2009) present empirical evidence showing that trade flows of intermedi-ate inputs are more sensitive to trade costs associated with e.g. distance thanis trade in final goods. This aligns with our findings showing that the pro-
28

ductivity premium of importing is negatively correlated with distance, andprovides preliminary evidence for the hypothesis that unskilled labor inten-sive imports and imports from developing regions contain a relatively largefraction of final goods, as opposed to imports from nearby economies whichcontain a larger fraction of intermediate inputs providing a more generoussource for productivity gains.
8 Conclusion and discussion
Combining three comprehensive data sets covering Dutch firms over the years2002-2008 we investigate the relationship between imports and firm-level pro-ductivity. We start by confirming that the productivity ranking by tradestatus of Dutch firms in increasing order of productivity is: non-traders,importers, exporters, and two-way traders, which is in line with the find-ings of earlier research regarding other advanced countries. Our analysissubsequently clearly distinguishes between the geographic dimension of theimports (where are the imports from), the goods dimension of the imports(what is imported), and the extensive dimension of the imports (from howmany countries and product markets is being imported).
First, our empirical evidence shows that the use of the country of ori-gin of imports as a proxy for the factor intensity, as is frequently done inthe literature, is too general, since both the origin of imports and the factorintensity of imported goods turn out to be associated with firm-level pro-ductivity. The analysis shows that distance and the level of development ofthe origin economy are factors affecting the diffusion of efficiency gains em-bodied in imported goods, indicating that geography still plays an importantrole in this process. Illustrative for this finding is that technology intensiveimports from nearby EU-15 countries are significantly more positively associ-ated with firm-level productivity than are technology intensive imports fromadvanced countries outside Europe, like the U.S. or Japan. The observedpremia patterns are comparable for manufacturing and wholesale & retailtrading sectors, but are generally more pronounced in trading sectors.
Second, our findings show that productivity generally decreases in theshare of unskilled-labor intensive imports and rises in the share of technologyintensive and primary products. We also show that the geographic-intensitymarkets are largely unique and cannot be lumped together. We are now ableto answer the question raised in the introduction to this paper whether, froma productivity point of view, it is better to import (a) textiles from Germany,(b) cutlery from Italy, or (c) tools from Tanzania? The point estimates intable 6, column 6, provide the following order in terms of rising productivity:
29

c - a - b, but note that the difference between a and b is not statisticallysignificant (see table 7).
Third, we show that dispersion, that is a diversified import portfolio interms of the number of geographical intensity markets on which the firmis active, is positively associated with firm-level productivity. Our findingsprovide support for the theoretical argument that the fixed cost of importingare market-specific. Adding a new market, either in geographical terms orin terms of product type, to the import portfolio implies incurring this fixedcost again. Note that productivity depends positively on imports withinthe EU-15, irrespective of the type of product being imported. A possibleexplanation for this phenomenon is that firms highly focused on imports fromnearby countries are an integrated element of a value chain, enabling themto incur efficiency gains.
The empirical evidence presented in this paper thus does not favor thehypothesis that the fixed and variable costs of importing are higher for im-ports from regions far away or from ’difficult’ regions. The nature of theproducts being imported from these regions could provide an explanationfor this, namely that imports from developing countries tend to contain alarger fraction of final goods, compared to imports from advanced countrieswhich contain a larger fraction of intermediate inputs. The potential forincurring productivity and efficiency gains is thought to be larger for inter-mediate goods imports than for imports of final goods or goods predestinedfor re-exporting. This suggests that unskilled labor intensive imports containa relatively large fraction of final goods. In addition, existing empirical evi-dence, suggesting that trade flows of intermediate inputs are more sensitiveto trade costs associated with e.g. distance than is trade in final goods, couldexplain the pattern of productivity premia observed in our analysis.
Some suggested avenues for further research follow naturally from thepreceding discussion and mainly include deeper investigation of the impactof the characteristics of imports on firm-level productivity by accounting foradditional dimensions of imports along the lines of capital goods, interme-diate goods and final goods. The product classification in terms of broadeconomic categories (BEC) provided by the United Nations could provide auseful starting point to this purpose. In addition, the role of goods importsdestined for re-exporting in the relationship between imports and produc-tivity is not yet well understood. Finally, the direction of causality betweenimporting and productivity also needs to be analyzed more closely alongthe different dimensions (geography, intensity, and dispersion). That is, self-selection into importing and potential productivity gains emanating fromlearning-by-importing could crucially hinge on the underlying characteristicsof the imported goods.
30

A Appendix
Table 8: Productivity premia of Dutch firms (pooled OLS, 2002-2008)
total factor productivity labor productivitywholesale and wholesale and
all firms manufacturing retail trade all firms manufacturing retail trade
trade dummies
non-trader reference reference reference reference reference reference
only imports 0.113∗∗∗ 0.077∗∗∗ 0.135∗∗∗ 0.205∗∗∗ 0.166∗∗∗ 0.226∗∗∗
(40.95) (18.72) (37.04) (65.74) (35.99) (55.22)
only exports 0.175∗∗∗ 0.135∗∗∗ 0.213∗∗∗ 0.273∗∗∗ 0.228∗∗∗ 0.317∗∗∗
(33.33) (18.80) (28.46) (46.46) (28.55) (37.74)
two-way trader 0.330∗∗∗ 0.230∗∗∗ 0.372∗∗∗ 0.470∗∗∗ 0.346∗∗∗ 0.514∗∗∗
(105.10) (49.54) (89.35) (134.48) (66.87) (110.96)
control variables
domestically controlled reference reference reference reference reference reference
foreign controlled 0.271∗∗∗ 0.153∗∗∗ 0.327∗∗∗ 0.235∗∗∗ 0.155∗∗∗ 0.247∗∗∗
(31.43) (11.31) (29.91) (25.33) (10.36) (21.08)
firm size (fte, log) 0.274∗∗∗ 0.252∗∗∗ 0.313∗∗∗ 0.128∗∗∗ 0.091∗∗∗ 0.189∗∗∗
(332.63) (245.74) (223.96) (137.80) (79.51) (119.78)
No. of observations 1,035,534 589,782 445,752 1,080,245 614,041 466,204adj. R2 0.190 0.211 0.176 0.105 0.111 0.108
Notes: All regressions include year, sector and region fixed effects. t statistics in parentheses. ∗ p < 0.05, ∗∗ p < 0.01, ∗∗∗
p < 0.001
Table 9: Regional aggregation of origin countries (description)
region remarks
neighboring countries Germany and BelgiumNorthern EU15 Luxembourg, United Kingdom, Ireland, Denmark, Finland, Sweden, AustriaSouthern EU15 France, Greece, Italy, Portugal and Spainnon-EU Northwestern Europe Norway, Switzerland and Iceland,rest of EU EU27 except EU15rest of Europe includes Russia and non-EU Central and Eastern EuropeMiddle East and North Africa includes Turkey and IsraelSub-Sahara Africa includes South Africaadvanced Asia∗ Japan, South Korea, Singapore, Hong Kong, Taiwan, Brunei Darussalam and Macaodeveloping Asia∗ Asia and Pacific except advanced AsiaAustralia and New Zealand except PacificNorth America includes United States and CanadaLatin America and the Caribbean includes Brazil and Mexico
∗The advanced Asian countries are identified by GDP per capita levels of at least $ 25,000 (2008 PPP-values in constant 2005$).
31

Table 10: Matrix of bilateral significance of estimated productivity premiaby region (table 2, column 2)
neigh. North. South. non-EU Aus. adv. Northcount. EU-15 EU-15 N-W Eur. & NZl Asia Am.
neighboring countries -Northern EU-15 0.044 -Southern EU-15 0.000 0.000 -non-EU Northwestern Europe 0.000 0.000 0.003 -Australia and New Zealand 0.000 0.000 0.001 0.049 -advanced Asia 0.000 0.000 0.000 0.000 0.601 -North America 0.000 0.000 0.000 0.000 0.257 0.199 -Latin America and the Caribbean 0.000 0.000 0.000 0.000 0.289 0.367 0.844rest of EU 0.000 0.000 0.000 0.000 0.777 0.733 0.174rest of Europe 0.000 0.000 0.000 0.000 0.095 0.085 0.247sub-Sahara Africa 0.000 0.000 0.000 0.000 0.012 0.005 0.018developing Asia 0.000 0.000 0.000 0.000 0.000 0.000 0.000Middle East and North Africa 0.000 0.000 0.000 0.000 0.000 0.000 0.000
rest rest Lat. Am. of sub-Sah. dev. M-Eastof EU Eur. & Car. Afr. Asia & N. Afr.
Latin America and the Caribbean -rest of EU 0.286 -rest of Europe 0.439 0.071 -sub-Sahara Africa 0.077 0.004 0.323 -developing Asia 0.000 0.000 0.007 0.231 -Middle East and North Africa 0.000 0.000 0.002 0.092 0.251 -
Note: Values represent bilateral p-values obtained from regressions of firm-level productivity on import shares by region withvarying baseline regions. The dashed lines identify the aggregation into six regions for the analysis in section 7.
Table 11: Matrix of bilateral significance of estimated productivity premiaby factor intensity (table 4, column 2)
primary high-tech natural resource human capital unskilled laborproducts products intensive intensive intensive
primary products -high-tech products 0.928 -natural resource intensive 0.000 0.000 -human capital intensive 0.000 0.000 0.752 -unskilled labor intensive 0.000 0.000 0.000 0.000 -
Note: Values represent bilateral p-values obtained from regressions of firm-level productivity on import shares byproduct group with varying baseline products. The dashed lines identify the aggregation into three product groupsfor the analysis in section 7.
32

Table 12: Import origin, factor intensity, degree of dispersion and totalfactor productivity (pooled OLS, 2002-2008)
manufacturing wholesale andsectors retail trading
(1) (2) (3) (4) (5) (6)
import shares by geographic import market
Northern EU-15 (incl. neighboring countries) 0.247∗∗∗ 0.419∗∗∗
Southern EU-15 0.103 0.300∗∗∗
non-EU Northwestern Europe 0.0786∗∗ 0.161∗∗∗
transition countries & South America 0.0201 0.00546
other advanced countries reference reference
developing countries -0.0694∗∗ -0.160∗∗∗
import shares by intensity market
high-tech & primary products 0.001 0.142∗∗∗
human capital & natural resource intensive reference reference
unskilled labor intensive -0.100∗∗∗ -0.119∗∗∗
import shares by geographic intensity market
Northern EU-15 incl. neighboring countries
high-tech & primary products 0.244∗∗∗ 0.536∗∗∗
human capital & natural resource intensive 0.317∗∗∗ 0.511∗∗∗
unskilled labor intensive 0.249∗∗∗ 0.403∗∗∗
Southern EU-15
high-tech & primary products 0.127 0.452∗∗∗
human capital & natural resource intensive 0.242∗∗ 0.439∗∗∗
unskilled labor intensive -0.0767 0.291∗∗∗
non-EU Northwestern Europe
high-tech & primary products 0.120∗∗ 0.306∗∗∗
human capital & natural resource intensive 0.0523 0.194∗∗∗
unskilled labor intensive 0.166∗ 0.144∗
transition countries & South America
high-tech & primary products 0.0195 0.147∗∗
human capital & natural resource intensive 0.115∗ 0.102
unskilled labor intensive -0.0543 -0.0386
other advanced countries
high-tech & primary products 0.0441 0.202∗∗∗
human capital & natural resource intensive reference reference
unskilled labor intensive -0.026 -0.187∗∗∗
developing countries
high-tech & primary products 0.000378 0.0179
human capital & natural resource intensive -0.0443 -0.170∗∗∗
unskilled labor intensive -0.132∗∗ -0.133∗∗∗
degree of dispersion of imports
number of geographical markets (log) 0.0626∗∗∗ 0.124∗∗∗
number of intensity markets (log) 0.0503∗ 0.0764∗∗∗
number of geographical intensity markets (log) 0.0362∗ 0.0913∗∗∗
control variables
non-exporter reference reference reference reference reference reference
exporter 0.148∗∗∗ 0.206∗∗∗ 0.149∗∗∗ 0.201∗∗∗ 0.304∗∗∗ 0.189∗∗∗
domestically controlled reference reference reference reference reference reference
foreign controlled 0.126∗∗∗ 0.147∗∗∗ 0.129∗∗∗ 0.271∗∗∗ 0.342∗∗∗ 0.254∗∗∗
firm size (FTE, log) 0.202∗∗∗ 0.223∗∗∗ 0.203∗∗∗ 0.233∗∗∗ 0.299∗∗∗ 0.230∗∗∗
No. of observations 8,869 8,869 8,869 21,009 21,009 21,009R2 0.284 0.275 0.286 0.266 0.239 0.272
Notes: All regressions include a full set of year, sector and region dummies.∗ p < 0.05, ∗∗ p < 0.01, ∗∗∗ p < 0.001
33

References
Acharya, R. C., and W. Keller. 2009. Technology transfer through imports.Canadian Journal of Economics 42 (4): 1411–1448.
Amiti, M., and J. Konings. 2007. Trade liberalization, intermediate inputs,and productivity: Evidence from indonesia. The American Economic Re-view 97 (5): 1611–1638.
Bas, M., and V. Strauss-Kahn. 2010. Does importing more inputs raise ex-ports? firm level evidence from france, MPRA Paper No. 27315, Universityof Munich.
Bernard, A. B., J. B. Jensen, S. J. Redding, and P. K. Schott. 2007. Firmsin international trade. The Journal of Economic Perspectives 21 (3): 105–130.
Castellani, D., F. Serti, and C. Tomasi. 2010. Firms in international trade:ImportersS and exportersS heterogeneity in italian manufacturing indus-try. The World Economy 33 (3): 424–457.
Coe, D. T., and E. Helpman. 1995. International r&d spillovers. EuropeanEconomic Review 39 (5): 859–887.
Coe, D. T., E. Helpman, and A. Hoffmaister. 1997. North-south r&dspillovers. The Economic Journal 107 (440): 134–149.
Creusen, H., and A. Lejour. 2011. Uncertainty and the export decisions ofdutch firms, CPB Discussion Paper No. 183, CPB Netherlands Bureau forEconomic Policy Analyis.
Girma, S., H. Gorg, and E. Strobl. 2004. Exports, international investment,and plant performance: evidence from a non-parametric test. EconomicsLetters 83 (3): 317–324.
Hagemejer, J., and M. Kolasa. 2011. Internationalisation and economic per-formance of enterprises: Evidence from polish firm-level data. The WorldEconomy 34 (1): 74–100.
Keller, W. 2004. International technology diffusion. Journal of EconomicLiterature 42 (3): 752–782. http://www.jstor.org/stable/3217250.
Levinsohn, James, and Amil Petrin. 2003. Estimating production functionsusing inputs to control for unobservables. The Review of Economic Studies70 (2): 317–341. http://www.jstor.org/stable/3648636.
34

Loof, H., and M. Andersson. 2010. Imports, productivity and origin markets:The role of knowledge-intensive economies. The World Economy 33 (3):458–481.
Melitz, M. J., and D. Trefler. 2012. Gains from trade when firms matter.Journal of Economic Perspectives 26 (2): 91–118. doi:10.1257/jep.26.2.91.http://www.aeaweb.org/articles.php?doi=10.1257/jep.26.2.91.
Miroudot, S., R. Lanz, and A. Ragoussis. 2009. Trade in intermediate goodsand services, OECD Trade Policy Working Papers No. 93, OECD Publish-ing.
Muuls, M., and M. Pisu. 2009. Imports and exports at the level of the firm:Evidence from belgium. The World Economy 32 (5): 692–734.
Serti, F., and C. Tomasi. 2009. Self-selection along different export and im-port markets, LEM Papers Series LEM Papers Series No. 18, Laboratoryof Economics and Management.
Silva, A., O. Afonso, and A. P. Africano. 2012. Which manufacturingfirms learn by exporting? The Journal of International Trade & Eco-nomic Development 21 (6): 773–805. doi:10.1080/09638199.2010.534811.http://www.tandfonline.com/doi/abs/10.1080/09638199.2010.534811.
Van den Berg, M. 2013. Imports, productivity and firm size: firm-level evi-dence from the netherlands. mimeo.
Van Marrewijk, C. 2002. International trade & the world economy. OxfordUniversity Press.
Vogel, A., and J. Wagner. 2010. Higher productivity in importing germanmanufacturing firms: self-selection, learning from importing, or both? Re-view of World Economics 145 (4): 641–665.
Wagner, J. 2012. International trade and firm performance: a sur-vey of empirical studies since 2006. Review of World Economics 148:235–267. 10.1007/s10290-011-0116-8. http://dx.doi.org/10.1007/s10290-011-0116-8.
35