Embed Size (px)
Citation preview

© s
hutt
erst
ock
European Economic and Social Committee
Identifying the impact of the circular economy on the Fast-Moving Consumer Goods Industry: opportunities and challenges for businesses, workers and consumers – mobile phones as an example
STUDY
Identifying the impact of the circular economy
on the Fast-Moving Consumer Goods
Industry
Opportunities and challenges for businesses, workers and
consumers – mobile phones as an example
STUDY
The information and views set out in this study are those of the authors and do not
necessarily reflect the official opinion of the European Economic and Social Committee. The
European Economic and Social Committee does not guarantee the accuracy of the data
included in this study.
Neither the European Economic and Social Committee nor any person acting on the
European Economic and Social Committee’s behalf may be held responsible for the use
which may be made of the information contained therein.

General information
STUDY FOR The European Economic and Social Committee
(EESC)
REQUESTING SERVICE Section for the Single Market, Production and
Consumption
STUDY MANAGING SERVICE Relations with Organized Civil Society and Forward
Studies Unit – Information Centre and Studies
DATE 2019
MAIN CONTRACTOR Centre for European Policy Studies
(CEPS)
AUTHORS Vasileios Rizos
Julie Bryhn
Monica Alessi
Alexandra Campmas
Antonella Zarra
CONTACTS Vasileios Rizos ([email protected])
IDENTIFIERS
ISBN doi
STUDY
print QE-03-19-510-EN-C 978-92-830-4565-6 10.2864/08334
PDF QE-03-19-510-EN-N 978-92-830-4572-4 10.2864/775626

3
Abstract
Mobile phones, particularly smartphones, have undergone a period of rapid growth to become virtually
indispensable to today's lifestyle. Yet their production, use and disposal can entail a significant
environmental burden. This study looks at the opportunities and challenges that arise from
implementing circular economy approaches in the mobile phone value chain. A review of the value
chain and different circular approaches is complemented by a scenario analysis that aims to quantify
the potential impacts of certain circular approaches such as recycling, refurbishment and lifetime
extension. The study finds that there is a large untapped potential for recovering materials from both
the annual flow of new mobile phones sold in Europe once they reach the end of their life and the
accumulated stock of unused, so-called hibernating devices in EU households. Achieving high recycling
rates for these devices can offer opportunities to reduce EU dependence on imported materials and make
secondary raw materials available on the EU market. As such, policy action would be required to close
the collection gap for mobile phone devices. Implementing circular approaches in the mobile phone
value chain can furthermore lead to job creation in the refurbishment sector. Extending the lifetime of
mobile phones can also provide CO2 mitigation benefits, particularly from displacing the production of
new devices.

4
Table of Contents
List of abbreviations ................................................................................................................ 6
Executive summary .................................................................................................................. 7
1. Introduction ....................................................................................................................... 9
2. Market, technological trends and value chain ............................................................. 10
2.1 Consumer electronics sector ............................................................................................ 10
2.2 Mobile phone market and technological trends ............................................................. 11
2.3 Value chain ........................................................................................................................ 14
2.3.1 Extraction of materials, manufacturing of components and assembly ..................... 15
2.3.2 Sales and usage ......................................................................................................... 16
2.3.3 Collection and recycling ........................................................................................... 17
2.3.4 Exiting the circular value chain: hibernation, disposal in general waste and export 18
2.3.5 Lifetime extension through repair, refurbishment and reuse .................................... 19
3. Circular economy approaches and consumer trends .................................................. 21
3.1 Refurbished and second-hand devices ............................................................................ 21
3.2 Leasing ............................................................................................................................... 21
3.3 Repairs ............................................................................................................................... 22
3.4 Recycling and the collection gap ...................................................................................... 23
3.5 Obsolescence and replacement ........................................................................................ 24
3.6 The rebound effect ............................................................................................................ 25
4. Key raw materials in mobile phone appliances and batteries .................................... 26
4.1 Critical raw materials ....................................................................................................... 27
4.2 Conflict Minerals .............................................................................................................. 29
4.3 Other materials ................................................................................................................. 29
5. Scenario development ..................................................................................................... 30
5.1 Methodology ...................................................................................................................... 30
5.2 Scenarios ............................................................................................................................ 31
5.2.1 Mobile phones sold in 2017 ...................................................................................... 32
5.2.2 Hibernating mobile phones ....................................................................................... 33
5.3 Assumptions....................................................................................................................... 34
6. Impacts estimated through scenario analysis ............................................................... 37
6.1 Mobile phones sold in 2017 .............................................................................................. 38
6.1.1 Material recovery ...................................................................................................... 38

5
6.1.2 Emissions .................................................................................................................. 40
6.1.3 Employment .............................................................................................................. 42
6.2 Hibernating mobile phones .............................................................................................. 43
6.3 Limitations ......................................................................................................................... 45
7. Opportunities from creating a circular economy ........................................................ 46
8. Policy messages ............................................................................................................... 49
References ............................................................................................................................... 50
Annexes ................................................................................................................................... 56
Annex 1. Summary of sources .................................................................................................... 56
Annex 2: List of experts interviewed ......................................................................................... 58
Figures and tables
Box 1. Environmental impacts of mining ............................................................................................. 15
Box 2. Barriers to recycling .................................................................................................................. 18
Box 3. Barriers to extending the lifetime of mobile phones ................................................................. 20
Figure 1: Mobile phone ownership in selected EU countries ............................................................... 11
Figure 2: Estimated number of mobile phone units sold in EU28 ........................................................ 12
Figure 3: Mobile phone value chain in a circular economy .................................................................. 14
Figure 4: Estimated composition of a mobile phone ............................................................................ 26
Figure 5: Share of materials of focus in the study by weight per device .............................................. 27
Figure 6: Estimated number of recycled mobile phones in different scenarios .................................... 37
Figure 7: Value of material recovered from mobile phones sold in 2017 ............................................. 38
Figure 8: Devices that can be produced using materials recovered from phones sold in 2017 ............ 39
Figure 9: Average share of emissions for a device with a 21.6 month lifetime .................................... 40
Figure 10: Scenario emissions for a 10-year period.............................................................................. 41
Figure 11: Jobs required in refurbishment ............................................................................................ 42
Figure 12: Value of material recovered from hibernating mobile phones ............................................ 43
Figure 13: Devices that can be produced using materials recovered from hibernating phones ............ 44
Table 1: Scenarios for devices sold in 2017 ......................................................................................... 32
Table 2: Scenarios for hibernating mobile phones ................................................................................ 33
Table 3: Estimated content of key materials ......................................................................................... 35
Table 4: Price of key materials ............................................................................................................. 35
Table 5: Material recovered from different scenarios of phones sold in 2017 ..................................... 38
Table 6: Material recovered from hibernating mobile phones .............................................................. 45
Table 7: Variables and assumptions ...................................................................................................... 56

6
List of abbreviations
€ Euro
3TG tin, tantalum, tungsten and gold
CENELEC Comité Européen de Normalisation Électrotechnique
CO2 carbon dioxide
CO2e carbon dioxide equivalent
Comtrade* United Nations International Trade Statistics Database
CRMs critical raw materials
DRC Democratic Republic of the Congo
ECESP European Circular Economy Stakeholder Platform
EESC European Economic and Social Committee
EU European Union
EUR Euro
EU28 the 28 member states of the European Union
E-waste electronic waste
FMCG fast-moving consumer goods
g gram
IEC International Electrotechnical Commission
ISO International Organization for Standardization
Kg kilogramme
Kt kilotonne
LCA life-cycle assessment
MJ megajoule
Mt metric tonnes
NACE Nomenclature statistique des activités économiques dans la Communauté européenne
NGO non-governmental organisation
PGM platinum group metal
Prodcom Production Communautaire (EU statistical survey)
US United States
USD United States Dollar
WEEE waste electrical and electronic equipment
WTO World Trade Organization
* pseudonym, not abbreviation

7
Executive summary
Mobile phones have now become an intrinsic part of modern life, with more than 90% of adults in many
EU member states owning a device. Smartphones have been increasing their market share compared to
the traditional feature phone, revolutionising the worlds of work, entertainment and communication.
Yet there are also signs that sales of new mobile phones have peaked, with replacement rates driving
demand in Europe.
While our smartphones have become virtually indispensable, their production, use and disposal carry a
significant environmental burden. The extraction and processing of the raw materials required for their
production entail pollution, poor working conditions and adverse effects on health, while both the
production and use phases of phones involve considerable emissions of CO2. Disposal of mobile phones
also contributes to the global environmental challenge of rapidly accumulating e-waste.
Circular economy approaches for mobile phones have emerged and gained traction in recent years, for
example with markets for refurbished and second-hand devices growing in Europe and elsewhere. Such
approaches can have benefits for both the environment and consumers. However, the devices
‘hibernating’ in people’s homes are a significant barrier to implementing circular economy approaches
in the mobile phone value chain. For various reasons, such as wanting to keep devices as back-ups, not
knowing where and how to dispose of them and concerns about data privacy, many people choose to
keep hold of their unused phones. As such, innumerable devices, both functional and defunct, are simply
accumulating in Europe’s households. Arguably, this provides a stock of untapped potential for circular
economy approaches, namely recycling.
This study was commissioned by the European Economic and Social Committee (EESC) in order to
look into the opportunities and challenges from implementing circular economy approaches to the Fast-
Moving Consumer Goods (FMCG) industry. The focus of this study is mobile phones – a key product
in the consumer electronics sector with a varied price range and lifetime duration. Mobile phones have
been selected due to their ubiquity in today’s society and their associated environmental impacts.
The context of the mobile phone market, its trends and the specifics of the value chain, is described
first, followed by an analysis of various circular economy approaches and consumer behaviour. The
study then homes in on the material composition of devices and identifies six key materials for further
investigation.
Through a quantitative scenario analysis, the study provides quantitative estimates of potential circular
opportunities. Particular focus is placed the processes of recycling, refurbishment and lifetime
extension, while estimates are provided for material recovery, employment and emissions.
Some key messages from the study are presented below.
According to current estimates, only between 12% and 15% of mobile phones are properly recycled
in Europe. The annual flow of new devices entering European markets could be tapped into to
recover valuable resources and retain their value in the EU economy. In particular, we estimate that

8
in the upper bound scenario, where cobalt and copper are recovered at a 65% recycling rate,
recovered materials could amount to 123% (cobalt) and 11% (copper) of EU imports in 2017.
There is a stock of unused, so-called ‘hibernating’ devices in EU households. This study estimates
that this stock currently amounts to almost 700 million devices in Europe. In a hypothetical scenario
where all these devices are collected and recycled, approximately 14,920 tonnes of gold, silver,
copper, palladium, cobalt and lithium with a value of over €1 billion could be recovered, which
would make significant amounts of secondary material available in the EU.
Policy action is therefore needed to increase the collection of devices that have reached their end-
of-life. Such action could take the form of targeted campaigns to inform consumers about the
location of collection points, the need to recycle old devices and the resulting benefits for both the
economy and the environment. Allaying consumers’ concerns about the data stored in their old
devices is also important in this regard.
Further possible opportunities arising from implementing circularity approaches in the mobile
phone value chain include job creation in the refurbishment sector. This study estimates that in a
scenario were 20% of devices sold in 2017 were to be refurbished, approximately 29,000 jobs would
be required for this process. Under a more ambitious scenario assuming a refurbishment rate of
30%, 43,600 jobs would be required.
Various challenges for reuse and refurbishment businesses stem from EU legislation. These include
the regulatory complexity of requirements in both EU waste and product regulation, uncertainty
regarding the definition of the “preparation for use” process in the WEEE Directive and lack of
clarity regarding the CE marking requirements for the refurbishment of products that come from
outside the EU.
The study also provides estimates of the CO2 mitigation benefits from extending the life of mobile
phones. During a 10-year period, between 20 and 30 million tonnes CO2e could be saved by
extending the total life of each device by one and two years, respectively. These emission savings
would largely come about through the displaced production of new devices.

9
1. Introduction
In recent decades, consumer electronics have transformed entertainment experiences (via tablets,
wireless earphones etc.), communication (smart phones, etc.) and home-office activities (laptops,
printers etc.) (Statista, 2017; Ellen MacArthur Foundation, 2018). More recently and within a relatively
short period of time, the increased connectivity of devices through internet technologies along with the
proliferation of cloud computing have enabled the rapid access and sharing of information and data.
New forms of entertainment such as streaming and online gaming have also become popular (Ellen
MacArthur Foundation, 2018; Lee et al., 2017).
With the growing combination of mobile phone1 technology with computing features and wireless
connectivity, smartphones have emerged over the past 10 years as the dominant type of mobile device.
During this period, they have not only overtaken traditional mobile phones in sales but owing to their
multi-functionality, have also started to replace other electronics such as digital cameras, calculators,
voice recorders, MP3 players and GPS navigation devices (Watson et al., 2017; Lee et al., 2017; Gabriël
et al., 2017). Looking to the future, it is expected that in the developed world the penetration of
smartphones will further increase to more than 90%, and that by 2023 already, five million devices
could be sold every day (Lee et al., 2017).
While consumer electronics and specifically mobile phones have undergone a period of rapid
progression, their production and use carry a significant environmental burden. Furthermore, according
to Baldé et al. (2017), in 2016 the generation of e-waste from the disposal of electronic devices reached
44.7 million metric tonnes (Mt) worldwide, of which 435 kilotonne (kt) were mobile phones. Without
adequate collection and management systems, such quantities of e-waste can cause environmental and
human health problems, as well as deplete valuable resources. The latter is relevant for smartphones
since even though they are relatively insignificant in terms of weight compared to other electronic
products, each device can contain more than 70 different elements, of which some combine high
economic importance with a supply risk (Baldé et al., 2017; Wilson et al., 2017; Burton, 2017). For
several of these elements, such risks are particularly high for Europe, which is dependent on the import
of raw materials (European Commission, 2017a).
This study has been commissioned by the European Economic and Social Committee (EESC) in order
to support the work of the European Circular Economy Stakeholder Platform (ECESP)2 by improving
understanding of the opportunities and challenges from implementing circular economy approaches in
the Fast-Moving Consumer Goods (FMCG) industry. It focuses on mobile phones, a key product in the
consumer electronics sector that can be included in the FMCG category. Mobile phones have been
chosen due to their widespread use and associated environmental impacts.
1 The terms ‘mobile phones’ and ‘smartphones’ are both used in this study, which covers the traditional mobile phones and smartphones that
dominate current sales of phones. ‘Mobile phones’, ‘phones’ or devices’ are used to refer to both the categories of traditional mobile phones
and smartphones, while ‘smartphones’ will be used to refer to smartphones exclusively. 2 The ECESP is a joint initiative by the European Commission and the EESC which brings together stakeholders active in the broad field of
the circular economy in Europe, for more info see: https://circulareconomy.europa.eu/platform/en/.

10
Specifically, the study looks into three circular approaches: recycling, refurbishment and extending the
life of mobile phones. For the analysis, different ex ante scenarios with varying levels of ambition have
been applied to two categories of mobile phones: those that are sold in the EU in 2017 and devices that
have reached their end-of-life and accumulate in people’s homes. Information and data have been
collected by the research team through a literature review and interviews with experts from different
stakeholder categories, in particular experts representing mobile phone manufacturers, recyclers,
research centres, workers’ federations and environmental NGOs (see Annex 2). Drawing on the results
of the analysis, the study offers policy messages on the potential for circular economy business models
in the mobile phone value chain.
The study is structured in nine sections. Section 2 explores trends related to the mobile phone market
and technological developments. It also presents the different steps of the mobile phone value chain in
a circular economy. Section 3 is devoted to consumer trends and behaviour related to circular economy
approaches, while section 4 presents the key materials contained in mobile phones. Section 5 presents
the different scenarios used in the study followed by a presentation of the impacts estimated through
the scenario analysis (section 6). Section 7 presents the opportunities from implementing circularity
approaches in the mobile phone value chain. The conclusions and recommendations for policy action
of this study are provided in section 8.
2. Market, technological trends and value chain
2.1 Consumer electronics sector
Mobile phones are often included in the consumer electronics market segment, which covers a wide
range of other products such as televisions, tablets, disposable digital cameras, headphones, audio
devices and more (see, for instance, Statista, 2017; Ellen MacArthur Foundation, 2018). In 2017, the
consumer electronics sector as a whole represented 1.32%3 of final household expenditure in Europe,
with the manufacturing part of that sector achieving a turnover of over €60 billion.4 Slightly over 1.1
million people were employed in the manufacture of computer, electronic and optical products in the
EU in 2015, the lowest employment number recorded for the sector in recent years.5 Specifically, the
manufacture of telecommunications equipment has almost disappeared from Europe, for example
Germany saw a decrease of 30% in employment in the communication equipment manufacturing
industry (European Commission, 2015).
3 Note that in the Eurostat classification, mobile phones are not considered as part of the consumer electronics sector, but rather of the
communication sector. Therefore, in order to include mobile phones as part of the consumer electronics sector, figures are aggregated. For
instance, the share of “telephone and telefax equipment” - a sub-item of the communication sector - of total households’ expenditures is estimated (available at: https://tinyurl.com/y3qkex73) and added to the share of “consumer electronics” of total households’ expenditures (see
Eurostat, 2018a).
4 Similarly, the whole turnover of the consumer electronics sector corresponds to the sum of the turnover of the consumer electronics sector and the communication equipment sector (see Eurostat, 2018b and the statistical classification of Economic Activities in the European
Community: https://tinyurl.com/yygjwhg4).
5 Since 2000. See Eurostat (2018c).

11
Once disposed of, mobile phones enter the e-waste stream. Globally, e-waste is expected to continue to
increase in the coming years, due to electronics’ replacement cycles shortening (Baldé et al., 2017).
Europe, including Russia, is the continent that generates the second highest amount of e-waste, with
16.6kg generated per inhabitant. Nevertheless, Europe also has the highest collection rate of e-waste
globally (35%) (Baldé et al., 2017). Focusing on EU28, 41% of all waste electrical and electronic
equipment (WEEE) was recycled in 2016 (Eurostat, 2019a). The WEEE that is not recycled, however,
can take different routes. Using data from 2012, Huisman et al. (2015) estimated that around 16% was
exported, 33% was recycled in non-compliant conditions, 8% was scavenged for valuable parts and 8%
was discarded as waste.6 For mobile phones, however, the recycling rate is thought to be lower than the
WEEE average. Although there is no current detailed assessment available for the specific product
group across the EU, estimates range between 12% and 15%.7
2.2 Mobile phone market and technological trends
Globally, the mobile phone market has boomed in the past few years, also due to rising demand in
emerging markets. From 2012 to 2015, global smartphone ownership doubled, nearing two billion by
the end of 2015 (Coats & Benton, 2016). At the EU level, in 2013 the number of mobile phone
subscriptions exceeded that of inhabitants (Eurostat, 2016).8 This suggests that a segment of the EU
population has more than one mobile phone, or two sim cards in one device (i.e. two subscriptions).
According to a study by Pew Research Center (2019), mobile phone ownership is high in the different
EU member states surveyed, with above 90% of adults owning a mobile phone. Smartphone ownership
is dominant, but varies from country to country, as can be seen in Figure 1.
Figure 1: Mobile phone ownership in selected EU countries
Source: Authors’ visualisation based on Pew Research Center (2019).
6 Notably, Huisman et al. (2015) estimated that around 35% of e-waste was reported by member states as having been collected and recycled, which is lower than the figure, i.e. 41%, provided by Eurostat (2019a). This indicates that some progress has been made between 2012 and
2016.
7 Estimates come from interviews with experts from Eurometaux (see European Commission, 2016a) and Professor Gara Villalba from the
Autonomous University of Barcelona (see: https://tinyurl.com/y5occluy). 8 Roughly 131 subscriptions per 100 inhabitants.

12
However, there are signs that the market for mobile phones has reached its peak and is becoming
saturated in Europe and beyond, with limits for further growth and sales (IMF, 2018). This is reinforced
by a recent trend of consumers keeping devices for longer. On average in the five most populous EU
countries, first ownership (or use-time) has increased from around 18 months in 2013, to 21.6 months
in 2016 (Kantar Worldpanel, 2017). In a saturated market, replacement rates largely determine sales, in
addition to competition between different producers.
As Figure 2 shows, sales of mobile phones in the EU28 decreased in the period between 2007 and 2017,
falling from just over 300 million units sold in 2007 to 182 million units sold in 2017.9 Notably, the
size of EU-based manufacturing has decreased drastically from around 207 million units in 2007 to only
2.8 million units in 2017.
Figure 2: Estimated number of mobile phone units sold in EU28
Source: Authors’ calculation based on Eurostat Prodcom, 2017.10
While there are signs that the market for new mobile phones has reached its peak, the market for
refurbished smartphones, on the other hand, is seeing growth. This market, which has existed in
developing countries since the 2000s, is becoming increasingly popular in developed countries with the
advent of high-end smartphones. The trend is fuelled by the rapid succession of new models, since
whenever a new model is introduced, previous models become available on the second-hand market
(Watson et al., 2017). According to research by Counterpoint (2018), the global market for refurbished
smartphones grew by 13% in 2017, reaching close to 140 million units, in contrast with the global new
smartphone market that grew by only 3%. According to the global market research company GfK, in
2017, refurbished smartphones already accounted for 10% of the overall sales volume in France
(Dekonink, 2018). This is confirmed by Cailleaud (2019) who reports that out of 20.2 million
smartphones sold in France in 2018, more than 2.14 million were sold through the refurbished market.
In response to the growth of this market, several European companies that produce refurbished high-
9 Sales have been estimated using Prodcom data for the NACE code 26302200 - Telephones for cellular networks or for other wireless
networks, which may include devices other than mobile phones. More details are in section 5.3.
10 Note: data is based on Eurostat Prodcom NACE code 26302200 - Telephones for cellular networks or for other wireless networks, and is computed as follows: sold production by EU enterprises - volume of exports derived from the External Trade statistics + volume of imports
derived from the External Trade statistics.
307 m283 m
261 m246 m
221 m199 m 197 m 201 m 207 m
185 m 182 m
2007 2008 2009 2010 2011 2012 2013 2014 2015 2016 2017
ProductionNet imports

13
end mobile phones have emerged in recent years. Notably, according to experts consulted, refurbished
devices are more likely to compete with the lower-end segment of the market rather than with new
devices of the same brand.
Regarding the design of devices, the current trend is to develop thinner phones that contain reduced
amounts of certain materials. Driven by innovations in material and computational science, the material
content of the phones changes over time (Judl et al., 2018, JRC, 2019). Furthermore, mobile phones are
becoming more powerful and, “consequently, the energy consumption of their parts (e.g. chipsets and
screens) increases” (Judl et al., 2018, p.18).
The majority of producers use embedded batteries in their devices, which allows them to be waterproof
and have a sleeker design. This practice, however, does not allow consumers to easily replace the battery
and may link mobile phone replacement to the duration of the batteries – among other possible reasons.
This has led certain producers to develop professional repair strategies, and to offer repair services as
part of their brand message. As an alternative to the mainstream development of embedded batteries,
an emerging concept is to develop modular mobile phones, which are easier to disassemble and
therefore also easier to repair, repurpose and recycle. Nevertheless, their manufacture may also require
higher material inputs compared to conventional smartphones (Judl et al., 2018). Modular mobile
phones remain a niche market for now. A number of companies such as Google, Fairphone,
Puzzlephone and ZTE have tried to develop and bring such mobile phones to the market with varying
degrees of success (Watson et al., 2017; JRC, 2019). ZTE (Brockwell, 2016) and Puzzlephone have not
taken off yet, while Google discontinued an attempt in 2014, but filed new patents for a modular mobile
phone this year (Boxall, 2019). Fairphone has made it to the market and sold out its modular model
Fairphone 2, but it remains a niche market. Watson et al. (2017) caution that proprietary hardware and
software will limit the circular potential of modular phones.
Moore’s law stipulates that every two to three years the increase in computational power, technology
and breakthroughs in material science will revolutionise the mobile phone market (Judl et al., 2018;
JRC, 2019) whereby new devices are sufficiently different from the earlier generation to make
refurbished or older models less desirable. The stakeholders interviewed, however, had different views
on whether this rule will continue to apply to mobile phones. While some saw a slight slowdown in the
rate of replacement of mobile phones as evidence that replacement rates will decrease and smartphones
will gain longevity, others pointed to the breakthrough and surprising nature of new developments such
as foldable smartphones or other technologies that may simply change the nature of what we consider
a ‘smartphone’ today. Several leading brands plan to release foldable smartphones, which will likely
be chunkier and more material-intensive. Their main advantage is larger bendable screens, which when
open will also serve as tablets (Nield, 2018). Sappin (2018) nevertheless, anticipates that further
technological innovations in the fields of augmented reality (AR), virtual reality (VR) and artificial
intelligence (AI) voice assistants may displace smartphones over the next decade, while using them as
hosts in the first phases of their development. The Joint Research Centre of the European Commission
has reviewed studies on the possibility of major technological disruption through AR, VR, AI and
virtual assistants. Based on the information reported, these new technologies may increase the appeal

14
of larger screens (over 5 inches), which would deliver the most realistic user experience – while also
requiring greater use of material (JRC, 2019).
2.3 Value chain
Currently, the value chain for mobile phones is mostly linear, starting with the mining of raw materials
and finishing with the disposal, export or hibernation of mobile phones. The production cycle is
increasingly subject to resource and environmental constraints but is simultaneously under pressure to
produce newer models and provide competitive prices. In turn, these pressures can lead to negative
environmental impacts and deteriorating working conditions (Judl et al., 2018). Global certification of
production standards (IEC and ISO) can partially mitigate the issues of compliance with environmental
and social standards, but the pressure on resources may require a set of coherent measures with a circular
life-cycle approach to production.
A circular economy approach requires closing the value chain into a loop by reusing, repairing,
refurbishing, reselling and recycling the mobile phones, reducing the mining and waste components of
the value chain as far as possible. The challenge is to redirect mobile phones or their materials back
into the same or new value chains.
The mobile phone value chain in a circular economy can be divided into steps, as depicted and
simplified in Figure 3.
Figure 3: Mobile phone value chain in a circular economy
Source: Authors’ illustration.11 The darker, outer circle (including entry and exit points) refers to the value chain of producing
mobile phones. The inner circle refers to how lifetimes of already produced devices can be extended.
11 Inspired by EEA (2016). The value chain, presented in the form of a circle, starts with the inputs from mining of raw materials, which feed into the manufacture and production of parts. This moves to assembly, then to sales, and then use by consumers. Devices can exit the circle
through export and disposal in regular waste bins or they can remain unused in households. Alternatively, devices can be collected and then
recycled to recover materials and use them as input into the production of new devices or other products, and thus be part of a circular value chain. The internal circle represents circular approaches for phones that have reached the end of their first ownership (or use-time), i.e. devices
can be repaired, refurbished, resold and reused.

15
2.3.1 Extraction of materials, manufacturing of components and assembly
The value chain commences with the mining and extraction of raw materials to provide input into the
manufacturing of mobile phone components. Mining of raw materials, many of which are imported
from countries outside the EU, can have significant environmental, economic and social effects. Such
effects are particularly significant for the 3TG materials – tin, tantalum, tungsten and gold, which are
covered by specific regulation as they can finance armed conflict or be mined using forced labour (Cook
& Jardim, 2017). Box 1 below presents more information about the environmental impacts of mining
materials for electronics and mobile phones.
The next step in the value chain is the manufacturing of mobile phone components and assembly of the
devices. Both of these processes take place mostly outside the EU, and specifically in Asia. China,
South Korea, Malaysia, Singapore, and the Taiwan Province are the main economies involved in this
tech-cycle. In 2017, the export of smartphones accounted for about 5.7% of total Chinese exports, while
in South Korea, which is the main supplier of smartphone components, semiconductor exports
accounted for over 17% of all exports (IMF, 2018). Moreover, in 2018 Samsung opened the world’s
largest mobile phone factory in India (Kotoky & Rai, 2018). Some production still occurs in Europe,
Box 1. Environmental impacts of mining
According to a report by Cook and Jardim (2017), smartphones and other consumer electronics are
among the most resource-intensive products in terms of energy use per weight. As shown in section
6.1.2, based on figures from different sources this study estimates that 81% of the CO2e footprint
of an average mobile phone is emitted from the production phase, which includes the extraction
and processing of raw materials, as well as manufacturing of components and assembly. While the
manufacture of devices is often responsible for most of this share, the extraction and processing of
virgin materials can make a significant contribution. The amount of material used compared to the
energy needed for its extraction is particularly significant for gold, silver, palladium and plastic (Yu
et al., 2010). With a ratio of 34kg of rock needed to be mined to manufacture a single 129g
smartphone (Merchant, 2017), this corresponds to an amount of mining that exceeds the weight of
the material used in a smartphone by 260 times, measured in weight.
Significant environmental impacts from the extraction include CO2e emissions from the extraction
and processing phase, as well as the direct environmental impact of mining and digging the earth
and creation of pollution and waste, which can sometimes be toxic. Copper mining, for example, is
highly energy intensive, can cause air pollution and generate polluted waste. The environmental
impact of mining cobalt, another key material for mobile phone production, is primarily from water
contamination and energy use (De Groot et. al., 2012). Mining cobalt from an ore can use between
140-2100 MJ of energy per kilo of material extracted, while the same range for a kilo of material
extracted from scrap is 20-140 MJ. Similarly, water use can be reduced significantly if cobalt is
recovered from scrap rather than ore (Gislev & Grohol, 2018). Further details on the selected
materials for this study are in section 4.

16
however, with 2.8 million devices being produced in Europe in 2017.12 However, even for European
brands that assemble their devices in Europe, such as Fairphone, the different components are
manufactured in Asia.
At this stage of the value chain (manufacture and assembly) circularity can be improved through
recycling and recovery of resources from collected devices, which reduces the need for virgin materials
in the manufacturing process. Reduced exposure to supply disruptions and price volatility are other
benefits of using recovered secondary materials. Companies increasingly recognise the need for a more
circular approach to the materials they use in production; however, technical and economic challenges
remain in closing the loop for material inputs.
Further circularity improvements can be achieved by designing components and mobile phones in such
a way as to expand their life and/or facilitate their refurbishment and repair. A special body has been
set up in the European CEN/CENELEC standardisation body JTC 10 “Energy-related 738 products –
Material Efficiency Aspects for Eco-design", which is instrumental in drafting key technical
requirements (JRC, 2019). However, given the global nature of the electronics market, standards set by
the International Electrotechnical Commission (IEC) and the International Organization for
Standardization (ISO) are key.
2.3.2 Sales and usage
At the next stage of the value chain (retail and usage), telecom providers (carriers), producers and other
third party providers sell the mobile phones to consumers. As discussed in section 2.2, the sales of
mobile phones in Europe have decreased over the last 10 years, reaching an estimated total of 182
million units sold in 2017. Although the devices themselves are usually produced and assembled outside
Europe, the sale stage is more likely to take place within the EU.13
New mobile phones are often sold with an attached contract from a carrier, thus reducing the upfront
price for the consumer. A trend, which began in the US, is leasing or early upgrade programmes that
allow customers to upgrade to a brand new device each year (Kantar Worldpanel, 2017; TrendNomad,
2018). This practice also exists in Europe but is less widespread. While the practice can ensure proper
handling of discarded devices as they are returned to the carriers, often allowing them to be refurbished
and gain a second lifetime, it may also encourage consumers to replace their devices more often than
they perhaps otherwise would and shorten their first lifetime for this market segment.
Consumers use mobile phones until they decide to upgrade or stop using them, thereby reaching the
end of their first life (or first use).14 There are different routes for the mobile phones that have reached
this stage. Specifically, the lifetime of the devices can be extended through refurbishment and/or reuse
12 Eurostat Prodcom data. Note that the NACE code 26302200 - Telephones for cellular networks or for other wireless networks may include
other devices besides mobile phones.
13 Unless the devices are sold directly by the producers online, or through third party online sales points outside the EU. 14 As explained in more detail in section 3.5, consumers often decide to replace their mobile phones for reasons other than the hardware having
reached its final end of life.

17
(see section 2.3.5), while some devices may also be exported outside the EU, remain unused in
households or be disposed of in general waste bins (see section 2.3.4). As shown in section 2.3.3 below,
devices that have reached their end of life can be collected for recycling and recovery of resources.
2.3.3 Collection and recycling
At the final end of their lifetime, mobile phones can enter a circular value chain through collection and
proper recycling, as depicted in Figure 3. This process involves several steps. The first consists of
collecting the products. Collection is best carried out by providing multiple collection sites that are
easily accessible to consumers. These can be recycling parks, the points of sale of the devices15 but also
specific bins placed in strategic points such as a well-attended supermarket, other high-street and charity
retailers, community centres, schools, etc.
At present there are limited incentives to encourage consumers to return their mobile phone for
recycling. As such, collecting mobile phone devices for recycling once they have reached their final
end of life poses a challenge to realising a circular value chain. However, in line with the requirements
of the WEEE Directive, though it is applicable to all electrical and electronic equipment and does not
include specific requirements for mobile phones, some practices are developing to encourage
consumers to hand in their devices once they no longer use them. These include, among others, offering
discounts for new phones when the old one is returned or providing other forms of financial
compensation. Producers, telecom providers and retailers are increasingly providing credit to purchase
new products to those that hand in their old device, e.g. the trade-in offers by Apple,16 O2 recycle17 and
others. Moreover, lack of knowledge about what to do or where to dispose of an old mobile phone can
also place a barrier to their collection. Another way to encourage collection is to introduce requirements
for any retailer of mobile phones to accept and ensure the proper handling of an old device.18 If
consumers are not aware of the above options or financial benefits offered by retailers, they are more
likely to keep their mobile phones unused in their households (hibernating).
The second step of the process is the sorting and “depollution”19 of devices which consists of removing
the battery from the body of the mobile phone. Depollution is a legal requirement for WEEE recyclers
in Europe, and enables better recovery of materials, e.g. the cobalt contained in the batteries according
to interviewed stakeholders. Both the batteries and the rest of the body, including circuit boards, plastics,
and screens are sent to end-processing facilities for final recycling and recovery of materials, which is
the third key step in the process. While recycling processes vary, the devices are generally shredded
and smelted, and key metals recovered. To recover materials such as cobalt from the batteries, these are
15 Some companies have launched initiatives to promote return of old mobile phones in order to be recycled, see, for instance, Apple (2017)
and Fairphone (2016). 16 See: www.apple.com/benl/trade-in.
17 See: https://www.o2recycle.co.uk/. 18 E.g. in Norway, all retailers of electrical and electronic equipment (EEE) are required by law to receive for recycling any product that they
themselves sell, irrespective of whether the product having been purchased at the same establishment. See: “Forskrift om gjenvinning og
behandling av avfall (avfallsforskriften)”, § 1-4.Plikt til å ta imot EE-avfall, Miljøverndepartementet,
(https://lovdata.no/dokument/SF/forskrift/2004-06-01-930/KAPITTEL_1#KAPITTEL_1). 19 Standards on treatment and depollution have been drafted by CEN/CENELEC (CENELEC, 2015).

18
recycled separately. High recovery rates of some materials are already achieved at certain recycling
plants, though further innovation in recycling processes may improve the recovery of others.
Although there are processes in place for the recycling of mobile phones, there are a number of barriers
in place that limit the opportunities for further developing such approaches. These barriers are
summarised in Box 2 below.
Box 2. Barriers to recycling
A key challenge for the recycling of mobile phones is economic viability. The intrinsic value of a
used mobile phone weighing 90 grams is estimated by the United Nations University to be only €2,
while the average selling price for a used smartphone was €118 in 2017 (Baldé et al., 2017). With
the current recycling practices of shredding and smelting, recovering several materials such as
lithium is often not done without technically and economically efficient processes. The economic
incentive also varies depending on market prices of the materials, which can fluctuate significantly.
Additionally, many mobile phones do not enter the official WEEE procedures and most mobile
phones cannot be traced after their first use. For mobile phones, the situation is worse than for the
larger WEEE sector, as due to the lack of clear post-use value, the recycling rates are lower. Some
manufacturers have furthermore been found to dispose of equipment through illegal and non-licensed
waste collectors, who resell to waste exporters (Huisman et al., 2015).
Reports by the OECD (2012) and Watson et al. (2017) identify a number of barriers that limit the
opportunities to develop a post-first use value chain to close the circular loop: a major barrier is the
disconnect between the source of the devices (mainly Asia as described above) and the location of
the actual lifecycle of the phones, i.e. Europe. This complicates the loop of production, use, recycle
and reuse, as it is difficult to involve the manufactures situated outside the EU in the circular process.
2.3.4 Exiting the circular value chain: hibernation, disposal in general waste and export
There are different routes for mobile phones that have reached their end of life and are not properly
collected and recycled in the EU. First, these devices might be left unused in drawers in EU households
where they ‘hibernate’ (see more details in section 3.4). In this way the devices are considered to exit
the circular value chain, unless at some point their owners decide to take them to a collection point in
order to be recycled.
Export to non-EU countries is a second possible route for these devices. According to estimates from
2013, 70% of mobile phones collected in the developed world for reuse are resold in developing
countries (Benton et al., 2015). While these devices can be given additional lives in these emerging
markets, at some point they will reach the e-waste stage where there is a high risk they will not be
treated according to high quality standards, largely due to the lack of proper waste facilities. The
inappropriate management and treatment of end-of-life devices can cause negative health and
environmental impacts in many developing countries. (Watson et al., 2017; Puckett et al., 2019).

19
Devices can also be exported directly as e-waste. An estimated 16% of the EU’s e-waste is estimated
to be exported (Huisman et al., 2015).
Mobile phones may also be disposed of in the general waste stream and end up in landfills, thereby
causing negative impacts on the environment and a loss of valuable resources. However, while there is
no detailed assessment at the EU level, the amount of devices that are discarded in general waste is
likely to be small. According to a German survey, only 2% of consumers that had ever disposed of a
device had thrown it out as general waste (Bitkom, 2018). In France, 4.7% of respondents reported that
they had thrown their old device in the waste bin (Kreziak et al., 2017). These figures should
nevertheless be taken with caution as they may not represent the general behaviour among all EU
member states.
2.3.5 Lifetime extension through repair, refurbishment and reuse
The potential for additional lives for the devices is illustrated in Figure 3, above, by the innermost,
lighter green circle. Mobile phones can have additional lives through repair, refurbishment, reuse (i.e.
be given away to friends and family) or resold.
The first option for extending the life of a device is repairing20 or replacing its broken parts. As an
example, battery and screen replacement are among the most common reasons for repairs (Benton et
al., 2015). Repairs can be difficult for consumers to do themselves, particularly with the current
tendency to use embedded batteries. Repair companies have been emerging to meet this need, a number
of which are independent, but producers are often wary about cooperating with them due to factors such
as safety, intellectual property rights, competition in the repair market and lack of trust in independent
repairers and related liability issues. Mobile phone producers and electronics retailers now increasingly
require that repair shops are certified to activate product warranties. Producers themselves also offer
repairs, through authorised resellers, designated repair shops or their own retailers.
The second increasingly important path to extending the lifetime of devices is refurbishment for resale
as second-hand products. An increasing number of companies offer such products, while mobile phone
producers are also entering this market through offering certified refurbished mobile phones. Due to
their lower price, refurbished devices can reach a different market segment and attract consumers not
willing to pay the price of new high-end devices. As a third option, mobile phones can gain additional
lives when they are given to friends, family or others.21 Devices can also be resold22 as they are –
without refurbishment. These lifetime-extending practices often take place in a less formal way than
refurbishments and repairs, particularly when devices are reused without entering the formal economy.
20 Currently there are divergent definitions in the literature about the different options for extending the life of products, such as repair and
refurbishment (Gharfalkar et al., 2016). Ijomah et al. (2005, p.476) defines repair as “simply the correction of specified faults in a product’’. Refurbishment, on the other hand, goes further and refers to “the process of restoring components to a functional and/or satisfactory state to
the original specification’’ (Rathore et al., 2011, p.1710).
21 According to a survey of US and German consumers by Gartner (2015), 64% of mobile phones are reused, of which 23% are being given
to other users. 22 According to the survey by Gartner (2015), 41% of used smartphones are sold or traded in privately.

20
Studies have identified a number of factors that hamper the further growth of the available practices for
extending the lifetime of mobile phones; these are summarised in Box 3 below.
Box 3. Barriers to extending the lifetime of mobile phones
The repair service and second-hand/refurbishment markets are affected by EU consumer protection
rules. Specifically, the Consumer Sales Directive sets a two-year minimum legal guarantee for new
products. Although the Directive allows member states the flexibility to deviate from this rule for
second-hand products, Watson et al. (2017) suggest that at least in Sweden, Denmark, Finland and
Norway this flexibility has not been used. Still, it seems that in practice many second-hand businesses
do not apply the minimum guarantee period, and many consumers are unaware of this legal obligation
on sellers. While enforcing this minimum guarantee period could therefore increase consumers’
confidence in second-hand products, concerns have also been raised about the lack of flexibility to
legally offer shorter guarantee periods for such products. Riisgaard et al. (2016) argue that the legal
requirement to provide a two-year guarantee (although it is not always enforced as explained above)
prevents many companies in Denmark from using used spare parts in the repair process since they are
concerned about the effect of these parts on the mobile phone’s overall performance. Added to this,
companies also face difficulties obtaining original spare parts. Addressing the question of how to
maintain consumer protection while encouraging the value retention of used mobile phone
components or other electronic waste components is thus a complex task.
Another issue stems from the rules in EU waste and product legislation, which are often complex or
unclear, thereby posing challenges for reuse and refurbishment businesses that need to comply with
them. One example concerns the lack of a clear definition of the process of “preparation for use” in
the WEEE Directive which results in legal uncertainty for businesses (Watson et al., 2017).
Enforcement of rules is also difficult given that the industry for reusing consumer electronics is very
diverse and involves a range of actors such as small and large traders, but also small refurbishing
companies and charity organisations (Huisman et al., 2015).
A further challenge raised during the interviews carried out for this study relates to the regulatory
requirements for products placed on the EU market. In particular, products that come from outside
the EU need to bear the CE marking that proves that they have been assessed and meet EU safety,
health and environmental protection requirements. For products bearing the CE marking the
manufacturer must draft and sign a Declaration of Conformity declaring that the product meets all
these legal requirements. According to interviewed experts, there is a lack of clarity in these rules
about refurbished products already bearing the CE marking in the new condition even if they come
from outside the EU. It was suggested that for refurbished mobile phones that have undergone only
minor modifications that do not change performance of the product the company should not be subject
to a new declaration of conformity, even if they are imported from non-EU countries.

21
3. Circular economy approaches and consumer trends
The following sections delve further into the impacts of consumer behaviour and preferences and the
potential for further developing circular economy practices such as second-hand and refurbished mobile
phone markets, leasing, repairs and recycling. The section also looks into the main reasons for mobile
phone obsolescence and replacement.
3.1 Refurbished and second-hand devices
A study by Cerulli-Harms et al. (2018) collected evidence from an online consumer survey and a
behavioural experiment to assess consumers’ willingness to engage in circular economy practices,
including purchasing second-hand mobile phones. For mobile phones, which were identified by the
study as ‘fashion’ products, the study reports that in general there is a greater willingness among
consumers to buy second-hand products. Still, in practice the consumer survey found that only a limited
proportion of respondents had ever purchased second-hand mobile phones (8.3%), while in the
behavioural experiment only 20% of participants had a tendency to replace their previous phone with a
second-hand phone rather than a new one. This indicates that there is a gap between the willingness to
buy second-hand products and making this purchasing choice in practice.
The survey furthermore indicates that the overwhelming reason to buy second-hand phones (64.6%) is
their lower price compared to new products. Consumers in financially vulnerable positions are generally
more willing to consider such options “as long as they felt that the price-quality ratio was good, or that
there was a large price difference between refurbished (or second hand) products and new ones”
(Cerulli-Harms et al., p. 54). Second-hand products are thus attractive23 to consumers if they help
balance the desire to change a product with budgetary pressures. Environmental considerations were a
driving motive to buy refurbished and second-hand mobile phones only for a small (19.6%) share of
surveyed consumers.
Regarding the factors preventing consumers from buying second-hand mobile phones, Cerulli-Harms
et al. (2018) find that 58% of surveyed consumers simply prefer to have brand new products. In addition,
refurbished and second-hand products are often perceived as being of lower quality. Lack of trust in
second-hand products was identified as a key reason for not buying such products by 36% of surveyed
consumers. Two other key barriers identified in a study by Van Weelden et al. (2016) using in-depth
interviews with consumers are lack of awareness and understanding of the refurbishment process.
3.2 Leasing
Leasing models provide access to the product and its functions for the consumer, while the company
retains its ownership. Such models are based on the approach of offering products that “are not owned
by the individual but instead, the leasing price includes maintenance and repair, as well as exchange of
the products when it has gone out of fashion, or when the consumer wishes an upgrade. This way, the
23 According to interviewed experts, they can also be attractive for mobile phone manufacturers as they open up a potentially new consumer
base for them.

22
same product may be used by more than one consumer, and materials from old products may be recycled
into new ones” (Cerulli-Harms et al., p. 62).
According to the consumer survey by Cerulli-Harms et al. (2018), there is interest (25%) in engaging
with circular economy practices such as leasing of smartphones,24 even though very few respondents
had done so in the past five years (2.6%). For those who did rent or lease, price was the most important
incentive, especially for consumers who could not afford to buy. However, surveyed consumers also
reported a lack of familiarity with leasing, which may point to a currently untapped market potential,
but also to a general consumer preference for fully owning products. The survey could not find any
evidence that this preference would change in future even if leasing models became more widespread.
Slowing upgrade rates and the resulting decrease in sales are pushing some businesses to create “a
myriad of innovative purchasing/leasing plans to kick-start sales of new phones” (Watson et al., 2017,
p. 20). These practices, nevertheless, may promote faster upgrades rather than circularity, with the aim
to secure customer loyalty. On the other hand, by retaining ownership of the devices, businesses have
an incentive to gain the greatest possible value from the device by recirculation to new users and
collecting components once the device reaches the end of its life. This in turn can provide a further
incentive to optimise design for durability, reparability, upgradability, and suitability for
remanufacturing of the mobile phones (Watson et al., 2017; JRC, 2019; European Parliament, 2017).
3.3 Repairs
Consumers’ attitudes to the repair of mobile phones (through repair services and/or through providing
repair manuals and spare parts) appear to be ambiguous. The study by Cerulli-Harms et al. (2018)
indicates that while many consumers favour repairing, their motivation to repair the product25 can
substantially decrease if the repairing process requires effort on their part or if the repair costs are high.
The survey conducted as part of the study observed that a substantial share of consumers (37%) did not
repair their mobile phone the last time it broke down or became faulty. Another report by Kreziak et al.
(2017) focusing on France finds that only 14% of mobile phone owners in France attempt to have it
repaired when broken.
According to the respondents in the survey by Cerulli-Harms et al. (2018), consumers did not repair
their mobile phone because the process would have been too expensive (40% of respondents), because
they would prefer to buy a new one (33%), because the product could not be repaired (17%) or because
the product was obsolete or out of fashion (28%). A further 6% felt they did not know how or where to
repair their products, or that repairing would entail too much effort (10%). Other factors identified by
the study as barriers to repairing are the limited availability of spare parts and the lack of good repair
services. A study by Watson et al. (2017) confirms that consumers’ repair decisions are driven by cost
and convenience or ease-of-repair rather than by environmental concerns.
24 It is worth noting that smartphones had the highest score among the products covered by the survey. 25 It should be noted that this conclusion from the survey refers to all five products covered by the survey (i.e. smartphones, televisions, vacuum
cleaners, dishwashers, and clothing) and not only smartphones.

23
As economic incentives can be a key driver for consumers to have their phones repaired (Watson et al.,
2017; Libaert 2018), repair needs to be cost-effective compared to replacement in order to present an
attractive alternative to the purchase of a new product. An example of an initiative aimed at incentivising
repair can be found in Graz, Austria, where 50% of repair costs are subsidised, up to a ceiling of €100
per year per family (ADEME, 2018). Some European countries have also attempted to encourage
consumers to repair by lowering the VAT rate. In Sweden, for example, VAT is lowered on the repair
of certain products in combination with tax deduction of repair costs, but ICT products are not covered
(Judl et al., 2018).
To accelerate the shift to a repair mindset concerted efforts are also required to raise awareness on the
one hand, and to promote the reparability of products at the design stage, as is done by the Ecodesign
Directive for energy-related products. At the point of sale, products should be provided with information
as to their reparability, the availability of spare parts, as well as location of repair points.
A number of initiatives such as repair cafes have been set up in different member states, which are still
niche rather than mainstream (Cerulli-Harms et al., 2018). Yet such initiatives also raise issues linked
to the guarantee, safety and reliability of the repair, as mentioned in section 2.3.5. It is interesting to
note that in the Nordic countries there seems to be an increased demand for repaired or second-hand
mobile phones and services from the public sector. The public sector can thus play an important role in
driving demand in the market for such products (Watson et al., 2017).
3.4 Recycling and the collection gap
The rate of recycling of mobile phones appears to be very low. From a consumer behaviour perspective,
a key challenge related to the low recycling of mobile phones is the collection gap, i.e. the phones that
are left at home and never collected, usually referred to as ‘hibernating mobile phones’. Estimates about
the number of hibernating devices for different member states exist, but there is no EU-wide estimation.
Specifically, it has been estimated that almost 124 million devices are hibernating in homes in Germany
(Bitkom, 2018), between 28 and 125 million in the UK (Benton et al., 2015), over 3 million in Belgium
(Recupel, 2019) and 100 million in France (Blandin, 2016).
Reasons for consumers to keep their unused mobile phones hibernating range from emotional
attachment to privacy concerns about the data stored in the phone (Wilson et al., 2017; Watson et al.,
2017). The fact that many of these mobile phones still function also confers them a perceived residual
value, for example in terms of a possible future use such as a backup phone or to potentially later be
given to family or friends. For example, up to half the mobile phones replaced in France are kept for
such potential reuses (Kreziak et al., 2017).
Once the brief period between the first lifetime of the mobile phone and the expiry of its resale value is
over, incentives to dispose of the phones decrease as consumers find that the small devices do not take
up space in their homes and they lack the time to bring them to collection points. Collection points are
often insufficiently available and consumers are not aware of them. Lack of trust and transparency about

24
the recycling process and what happens to the product after it is collected is another key barrier to
recycling from a consumer’s point of view. Furthermore, consumers sometimes lack knowledge about
how to remove the data stored in the device or are concerned that data will be stolen from the mobile
phone (CRM Recovery project, 2014; Cerulli-Harms et al., 2018).
On the other hand, the main factors that may motivate consumers to recycle their mobile phones include
to varying degrees: concerns for the environment, the need to dispose of products that are no longer
used and the possibility of saving or earning money when returning products to a manufacturer. While
concerns for the environment seem to have only a limited effect on consumers’ decisions to buy a
second-hand phone (see section 3.1), they might affect attitudes to recycling in some countries. In
Sweden for example, the study by Cerulli-Harms et al. (2018, p.80) found that “willingness to recycle
was high, especially for products that are dangerous for the environment’’. In the Czech Republic, on
the other hand, key reasons for consumers to recycle are the possibility of achieving financial savings
and the availability of information about recycling. Interestingly, Polák and Drápalová (2012) have
estimated than in the Czech Republic only a very small percentage of mobile phones (between 3 and
6%) is collected for recycling.
3.5 Obsolescence and replacement
At some point a mobile phone can no longer be used because either its hardware or software reaches
obsolescence. With regard to the latter, the length of software support varies for different brands. Many
producers rely on software provided by Google (Android), adapting this to their devices, while they
themselves are producers of the devices only. Apple, however, is both a producer of the hardware and
software for their devices. As such, there are different incentive systems and costs associated with
providing software support across the different devices. Software support is a key component of both
how long people keep their mobile phones, and their resale value. It thus significantly affects both the
first and later potential lifetimes for a device. Smartphones that lack updates and support for the
operating system have a lower resale value, which creates barriers for reuse (Benton et al., 2015).
In recent years, there has been some debate about whether companies producing electronic products,
including mobile phones, implement strategies that involve the design of products that “become
unfashionable or no longer functional after a period that is shorter than the product’s technical
requirements and properties would allow’’ (Montalvo et al., 2016, p. 65). The practice of intentionally
designing products to have a limited number of operations is usually referred as ‘planned
obsolescence’.26 Although demonstrating such practices is difficult, there have been legal cases in
different member states; for example, in Italy the Competition Authority fined both Apple and Samsung
due to unfair commercial practices linked to software updates that had an impact on the performance of
phones and accelerated their replacement (De Franceschi, 2018). In addition to planned obsolescence,
other types of obsolescence have also been described in various studies and policy documents, although
there are no agreed definitions. For instance, indirect obsolescence can occur “because the components
26 Notably, the term that is most used at the EU level to describe this practice is “premature obsolescence’’. According to the European Commission’s (2017b, p. 32) Horizon 2020 Work Programme for 2018–20, premature obsolescence refers to products “designed in a way
that adversely affects their lifetime or prevents upgradability”.

25
required to repair the product are unobtainable or because it cannot be repaired (e.g. batteries welded
into an electronic device)’’, while “style obsolescence occurs because marketing campaigns lead
consumers to perceive existing products as out-of-date’’ (EESC, 2013, p.5).
In the case of mobile phones, replacement very often occurs much before the end of their lifespan. The
experts interviewed for this study indicated that the hardware of a mobile phone lasts for approximately
four years, while the average rate of replacement is currently about two years. Technological progress
and fast rates of innovation appear to be two key determinants of the rate of replacement of phones.
Another important aspect, especially for younger consumers, is fashion and the desire to have the latest
model (Cerulli-Harms et al., 2018). These factors are illustrated in the study by Watson et al. (2017) for
the Nordic countries. Specifically, almost half (47%) of consumers replace their mobile phones because
they want the newest model. A smaller share of consumers (13%), although not marginal, replace their
phones because they want the latest software and finally 40% because the phone no longer functions.
In France, it has been estimated that the majority (88%) of replaced phones were still partly or fully
functional at the point of replacement (Kreziak et al., 2017).
Carriers have been encouraging consumers to upgrade their devices more frequently (often on an annual
basis) (Kantar Worldpanel, 2017), but may not succeed in the absence of significantly disruptive
changes between a model and its close successors. Individual producers may also benefit from
convincing new customers to switch to their brand, and thus increase their market share.
3.6 The rebound effect
While it is generally assumed that the circular economy holds potential to provide important benefits to
the environment, under certain conditions such benefits can be significantly reduced due to what is
known as the rebound effect. This effect occurs when circular economy processes cause increased levels
of production and consumption, thereby mitigating their positive environmental benefits. There may
also be a price effect associated with reused and/or recycled products, which could allow consumers of
these products to purchase more and thus increase output (Zink & Geyer, 2017).
In the case of mobile phones, according to a study by Makov and Font Vivanco (2018) the rebound
effect can occur when reused (second-hand) smartphones do not fully substitute new devices and/or
when there is an additional demand for products and services triggered by the economic savings
achieved through buying a phone in the second-hand market (i.e. re-spending effect). Based on an
environmentally extended input-output analysis and US sales data, the study calculates that between
27-46% of emission savings achieved through reusing smartphones can be offset due to the rebound
effect. Another interesting study by Zink et al. (2014) concluded that repurposing smartphones in order
to be used, for instance, as in-car parking meters might be a more favourable option from an
environmental point of view than refurbishment. The above findings indicate that to avoid drawing
simplistic conclusions the environmental effects of different circular economy options for mobile
phones should be investigated and factored in when designing policies in this field.

26
4. Key raw materials in mobile phone appliances and batteries
Estimates of how many different elements are contained in a mobile phone vary and can reach up to 75
(Burton, 2017). As the market contains numerous models and brands, it is difficult to generalise about
the composition of an average mobile phone. Most contain key metals such as gold, silver, copper and
platinum group metals.
Materials identified as critical
by the European Commission
such as cobalt and indium are
also included in most devices.
Figure 4 shows the estimated
average content of several key
materials in a mobile phone,
with an assumed weight of 164
grams, including both the
appliance and battery. It has
been computed by calculating
the average share of the content
of the different materials based
on a variety of sources (see
annex) and applied to our
estimated average weight of a
mobile phone. It shows that, in
terms of weight, plastics,
aluminium, steel and copper
are dominant. Nevertheless,
many of the materials that
account for a small share of the
weight are important in other
terms – be they economic
value, supply risks or
environmental and social
concerns about their mining.
These figures are based on data for different mobile phone models collected from various sources
including studies and the interviews conducted for this study. It should be noted that the material
composition of mobile phones changes in time, as producers tend to reduce the content of certain
materials due to economic, technological or other reasons. Thus the above estimates should be treated
with caution. Data for many key materials has not been separated out due to lack of sufficient
information collected; these are included in the figure of 57.23 grams named ‘others’.
The intrinsic value of the materials inside a used smartphone is low compared to its price on the
secondary market. However, when collected in sufficient volumes, mobile phones can nevertheless be
Source: Authors’ calculation. See annex 1 for further details.
Figure 4: Estimated composition of a mobile phone

27
a significant source of raw materials and economic value. With 435 kilotons of mobile phones entering
waste streams globally in 2016, the value of embedded raw materials has been estimated to be €9.4
billion (Baldé, 2017). A report by the United States Environmental Protection Agency (US EPA) (NA)
moreover argues that one metric tonne of circuit boards “can contain 40 to 800 times the amount of
gold and 30 to 40 times the amount of copper mined from one metric ton of ore in the United States.”
As such, there can be potential economic and efficiency gains derived from recycling and recovering
the materials.
This study focuses on six key materials, namely gold, silver,
copper, palladium, cobalt and lithium. As Figure 5 shows,
these materials account for a small share of the total weight
of an average mobile phone. Nevertheless, they are important
from an economic, environmental and social perspective.
They were mainly chosen due to their economic importance
in the recycling process, as well as due to criticality of
availability and supply. It should be noted that many other
materials can also qualify these criteria. Examples include
indium and rare earths; however, their recycling is more
challenging (European Commission, 2018a). Further details
on the selected materials are presented in the subsections
below.
4.1 Critical raw materials
The European Commission (2017a) has identified a list of critical raw materials (CRMs) that have a
strategic importance for EU industry and their value chains. The CRMs are both of high economic
importance for the EU and vulnerable to supply disruptions. This can be due to limited or concentrated
reserves, import reliance, lack of substitutability or other reasons making their supply unreliable. China,
from which the EU has substantial imports of CRMs and rare earths, has indicated a willingness to
impose export restrictions on many of these materials. In 2012, 2014, and 2016, the EU took legal action
with complaints to the WTO (European Commission, 2016b; European Commission, 2018b).27
Nevertheless, due to the small quantities used in each mobile phone, high recycling costs and the
difficulty of separating them, the recycling rate of many critical materials is close to zero.28 This means
that few of the CRMs are recovered from the mobile phones that enter the European market.
Out of the six materials covered by this study, two, i.e. cobalt and palladium, are classified by the
European Commission as CRMs, although more are present in an average mobile phone, such as
indium, among others. These two CRMs have been chosen based on feedback collected during the
literature review and interviews with experts, specifically due to the technology for their recovery
27 The different legal actions were for different materials. The latter, in 2016 was resolved through the measures which were subject to the
complaint not renewed for 2017. 28 For more details see interview with Professor Gara Villalba, available at: https://tinyurl.com/y5occluy.
14.5%
Figure 5: Share of materials of focus in the
study by weight per device

28
already being utilised at certain recycling facilities, and thus their potential for recovery does not depend
on future innovation. Nevertheless, it is worth noting that process innovation can lead to higher
recycling efficiency, also for these CRMs.
Cobalt is an important industrial metal and an essential material for most batteries, including the
lithium-ion batteries used in mobile phones (Manhart et al., 2016). It is often a by-product of copper
and nickel mines, but is notably mined also for its own sake (Peiró et al., 2013). Global reserves are
concentrated in the Democratic Republic of Congo (DRC), which accounts for 64% of global
production. The vast majority of EU imports, however, come from Russia, with imports directly from
DRC only accounting for 7% (European Commission, 2018c). Deposits also exist in Finland, which is
responsible for the only primary cobalt supply from inside the EU. Refining, however, takes place also
in other countries in the Union (Alves Dias et al., 2018). Nevertheless, annual EU demand is estimated
to be around nine times greater than internal supply and as such, the EU depends heavily on imports
(European Commission, 2018c). The importance of cobalt is only likely to increase with the realisation
of the European Commission’s initiative to promote European manufacturing of batteries through the
European Battery Alliance (European Commission, 2019).
Beyond the economic importance of cobalt, the extraction of primary materials is associated with both
environmental and social issues. Where the global reserves are concentrated in DRC, mining is largely
unregulated, leading to improper management of mining waste that contaminates water, soil and air.
Moreover, the hazardous conditions under which the artisanal mining take place in DRC have reportedly
led to adverse health effects and may include child labour. Cobalt is not covered by conflict mineral
regulations, however, due to the deposits being situated away from the main conflict zone (Manhart et
al., 2016).
Recovering cobalt from scrap can arguably be cheaper than extracting the primary resource from ores,
which has provided incentive for recycling this material (European Commission, 2018c). Cobalt is
being recovered at certain battery-recycling plants; however, according to the experts interviewed, the
economic viability of its recovery varies due to price fluctuation.
Palladium is a platinum group metal (PGM) used in the car and electronics industries, among others.
Its main use in mobile phones is in electronic components and printed circuit boards (Manhart et al.,
2016). According to the Royal Australian Chemical Institute (2011), palladium is among the rarest
materials, with Russia and South Africa together accounting for most of the world’s production. The
EU is fairly reliant on imports of PGMs, which are difficult if not impossible to substitute for other
materials. Almost half of all EU imports of palladium come from a single source, specifically 46% of
EU imports of the material originate from Russia (European Commission, 2017a). As such, the
criticality of their supply is clear. Moreover, Manhart et al. (2016) note that there are significant
environmental and social issues associated with mining the metal among the two main global producers.
While mining and smelting in Russia has caused significant pollution and released heavy metals and
sulphur dioxide, frequent strikes highlight the difficult working conditions of miners in South Africa.

29
4.2 Conflict Minerals
From 2021, the new EU Conflict Minerals Regulation29 will ensure that imports of tin, tungsten,
tantalum and gold (3TG) meet international responsible sourcing standards and help break the link
between conflict and the illegal exploitation of minerals (European Parliament, 2017). As such, the
benefits of a circular economy model could include reduced dependence on imports of such materials
for the EU. Though it varies between models, an average mobile phone can contain all of the 3TG
minerals.30 Nevertheless, gold has been selected for further analysis in this study due to methods for
recycling and recovery of gold being readily available and applied.
Gold is used in the electronic components and printed circuit boards of mobile phones (Manhart et al.,
2016). As a precious metal with a significant monetary value, it is widely used in anything from
electronics to jewellery and as storage of wealth. However, the metal has been implicated in financing
armed conflicts and as such its supply has become increasingly regulated. In 2010, the United Nations
Security Council recommended that all states enact measures to investigate and combat illegal
exploitation of natural resources from DRC, including gold.31 While in the US this led to mandatory
due-diligence rules specific to the DRC and the region through the Dodd-Frank act, the EU policy
approach will apply more widely to all conflict areas (Manhart et al., 2016). The regions and areas
covered by EU legislation will thus be fluid and can change over time. Beyond being implicated in
conflict, there are also efficiency and resource gains in recovering the material. There can be five times
more gold in a tonne of discarded mobile phones than in a tonne of gold ore (European Commission,
2016a). As such, recycling and recovering gold from products such as mobile phones can significantly
reduce the environmental pressures from mining the raw material.
4.3 Other materials
In addition to the previously mentioned materials, the study focuses on three other materials due to their
economic and potential for circularity.
Silver: as a precious metal, silver has an important economic value. In the production of mobile phones,
its main applications are in solder paste and printed circuit boards. The electrical and electronic industry
is responsible for around a quarter of global demand for the metal. There is no one source country
responsible for the production of silver, unlike for many of the other materials considered in this study.
It is largely mined as a by-product of other ores, and production is distributed among multiple countries.
As such, the potential environmental issues associated with its mining are linked to the mining of the
ores from which it is mined as a by-product. In the case of lead-zinc ores, these issues are primarily
related to contamination of the environment and emissions of heavy metals and other hazardous
substances (Manhart et al., 2016). Europe provides more than a quarter of global silver scrap supply, a
secondary source of the metal. Nevertheless, Europe’s supply and demand balance remains in deficit,
29 Regulation (EU) 2017/821.
30 Based on data on composition collected, see Annex 1 for details. 31 UNFC resolution 1952.

30
as demand for the metal exceeds the volumes supplied from European mines and scrap metal
(O’Connell et al., 2018).
Copper is found in relatively large amounts in mobile phones compared to the other materials of focus
in this study, as seen in Figure 4. It is generally used in mobile phones to make wires, alloys,
electromagnetic shielding, printed circuit boards, speakers and vibration alarms (Manhart et al., 2016)
and in smaller quantities in the batteries. Chile and Peru play a significant global role in copper mining
and trade and are the main exporters of the metal to the EU (Schüler, 2017). Copper mines also exist
within the EU, specifically in Finland, Poland, Portugal, Spain and Sweden, which supply around a fifth
of EU demand for the material. Notably, and unlike many other materials considered in this study, 43%
of demand is supplied from copper recovered from domestic and industrial scrap from within the EU
(European Copper Institute, 2019).
Lithium is necessary for producing lithium-ion batteries, which are used in mobile phones and electric
vehicles (EVs). Lithium is a relatively abundant material, with the majority of deposits found in South
America, while China has the largest reserves in Asia. Smaller deposits have also been found in the EU,
with limited significance in size compared to the global producers (Lebedeva et al., 2016). EU imports
of lithium mainly originate from Chile, while the other important mining countries Australia and China
do not export significant amounts to the EU (Schüler, 2017). Nevertheless, globally, China has a
dominant role in the lithium-ion battery value chain more generally, including the refining and
processing of lithium (Drabik & Rizos, 2018). As with cobalt, European demand for lithium may
increase if a European battery production value chain is established in the EU. Recovery of lithium is
technically feasible with current technologies, but not economically viable (Lebedeva et al., 2016).
Depending on price developments and regulatory incentives, recovery of the material through recycling
could become more viable.
5. Scenario development
A key objective of this study is to provide quantitative estimates about the potential benefits from
implementing circular approaches for mobile phones, i.e. increased collection and recycling rates within
the EU, refurbishment of new phones, and extension of average lifetime. For the analysis, different ex
ante scenarios with different levels of ambition are used.
5.1 Methodology
This study applies a scenario analysis model by observing what might happen in different hypothetical
scenarios, given changes in certain variables. The methodology was applied by CEPS in a study (Drabik
& Rizos, 2018) on electric vehicle batteries and circular economy processes conducted in the context
of the Circular Impacts EU-funded project.32 Based on the results of the scenario analysis, this study
provides estimates about the potential for recovering materials from end-of-life mobile phones,
employment in the refurbishment sector and mitigating CO2 emissions.
32 See: https://circular-impacts.eu/.

31
Data and qualitative information for the different variables and assumptions have been collected
through a literature review, consulting official databases and interviews conducted with experts from
the value chain between January and May 2019. All information collected by the research team has
been validated via triangulation. Triangulation refers to both data (data is collected from multiple
sources and stakeholders) and methods (data is collected via two different data collection methods, i.e.
desk research and interviews). Moreover, in April the team conducted a small consultation of the draft
version of the study with the interviewed experts in order to collect feedback on the results, scenario
assumptions and variables, for validation purposes.
5.2 Scenarios
Scenarios have been developed for two categories of mobile phones: i) phones that are sold in Europe
in a given year using the latest 2017 estimated sales statistics and ii) the stock of mobile phones that are
no longer in use and retained by users at the end of their life (hibernating phones). As such, the scenarios
aim to show results for both the yearly flow of mobile phones as well as the stock of unused mobile
phones. The scenarios are outlined in sections 5.2.1 and 5.2.2, while the variables to inform the various
scenarios are presented further below.
Three different variables have been chosen to define the different scenarios: recycling rate,
refurbishment rate and average lifetime. The aim of the variables selected to define the scenarios is to
reflect different circularity options for mobile phones.
Recycling rate: The first variable observed is recycling rate, which is applied to both the categories of
mobile phones sold in a given year and to the stock of hibernating mobile phones. This variable refers
to the percentage of phones that, when no longer being used by their owner, are given to a collection
point for recycling within the EU and thus reach proper recycling facilities.
Average lifetime: The second variable is expected average lifetime, which is only applied to the
category of mobile phones sold in 2017. This variable refers to the average amount of time a mobile
phone device is being used before the end of its first life, where it either changes owner, is refurbished,
recycled, exported, thrown in general waste, or very likely – left hibernating in a drawer or similar. As
such, the variable only refers to the time a device is used by its first owner. It should be noted that it
does not take into account second, or even additional lifetimes, and as such does not reflect whether a
device is reused by another person, thereby having a longer total lifetime. Notably, the extended lifetime
can sometimes be achieved through replacing components, such as the battery or other parts. Thus,
additional material input and emissions will be associated with the extended lifetime. This has not been
accounted for in the study. However, other estimations taking into account the environmental impact of
substituting parts have been carried out, for example refurbishing a device could add 15 kg of CO2
(TrendNomad, 2018) to the emissions, significantly less than that of producing a new device.

32
Rate of refurbishment: Finally, the third variable is rate of refurbishment, which again is only applied
to the category of new mobile phones sold in 2017, as the age and state of older devices are unknown.
This rate refers to the percentage of mobile phones sold in a given year (2017) that are eventually
refurbished in order to be sold in the second-hand market. – i.e. they are sold or given away by their
owner and upgraded or repaired to be sold as a refurbished device to a new customer.
The specific bounds set for each group of devices (those sold in 2017 and hibernating) are detailed
below. In addition to the variables, a number of assumptions have been applied in the scenario analysis.
These are presented in the following section 5.3. All variables and assumptions used in this study are
also summarised in Table 7 in Annex 1.
5.2.1 Mobile phones sold in 2017
Table 1 below presents the scenarios for the phones sold in 2017.
Table 1: Scenarios for devices sold in 2017
Variables Baseline Lower bound Upper bound
Recycling rate 12% 35% 65%
Average lifetime 21.6 months 33.6 months 45.6 months
Rate of refurbishment 10% 20% 30%
As previously discussed, estimates about the recycling rate of mobile phones across the EU vary
between 12% and 15%.33 For the baseline scenario the lower estimate of 12% was applied.34 For the
more ambitious scenario (upper bound), we have used the WEEE minimum requirements, applicable
from 2019, which include a collection target of 65% for all equipment sold in the preceding three
years.35 The target applies to all WEEE, and as such there is no obligation to specifically collect 65%
of mobile phones. Particularly, as it is a weight requirement, other electronic and electrical goods that
are heavier may receive more attention from the authorities. However, this can nevertheless set a
benchmark for countries to aim for through campaigns, financial incentives and policy measures. The
lower bound is set at 35%, which is slightly less than the average between the baseline and the most
ambitious scenario.
Data from Kantar Worldpanel (2017) shows that the average life-cycle of a smartphone in France,
Germany, Great Britain, Spain and Italy in 2016 was 21.6 months. This means that the average
consumer in these five European countries kept her/his smartphone for 21.6 months before no longer
using the device (e.g. due to upgrading to a new model). As such, the most conservative baseline
33 Notably, estimates for other regions across the globe are even lower; for instance, based on a survey of U.S. and German consumers Gartner
(2015) estimates that only 7% of mobile phones end up in official recycling facilities. 34 This figure comes from Professor Gara Villalba from the Autonomous University of Barcelona and was estimated as part of her work in the
EU-funded project PROSUITE. The project combined technology forecasting with product lifecycle approaches, for more details see:
https://tinyurl.com/y5occluy. 35 The Directive allows member states to choose between this target and 85% of WEEE generated.

33
scenario uses this estimate. It should be noted that while 21.6 months refers to the first lifetime of a
device, it is used to set the baseline average total lifetime. The lower bound is set by adding on one year
to the expected lifetime, to a total of 33.6 months. Given that software support, an important component
for the continued use of a mobile phone, is available for some models for up to around 4 years (Benton
et. al., 2015), this could be a feasible extension of a device’s lifetime. The upper bound was set by
adding another year to the expected first lifetime, thus extending the first lifetime by two years from the
current average, to a total of 45.6 months. While this reaches beyond the limits of common ranges of
software support, it serves as an ambitious estimate for the upper bound. If the change in technological
innovation slows down, as predicted by some interviewed experts (see section 2.2), and software
support is extended, this could be technically possible.
While few estimates of the rate of refurbishment exist in the literature, information for France shows
that refurbished smartphones accounted for 10% of the overall sales volumes in the country in 2017
(Dekonink, 2018).36 This figure has been used to set the rate for the baseline scenario, which has been
increased by 10% for each scenario bound. The lower bound scenario has thus been set at 20%. This is
supported by a behavioural experiment conducted with respondents from various EU countries, which
found that 20% of consumers had a tendency to buy a second-hand mobile phone (including refurbished
devices) as a replacement for their old device (Cerulli-Harms et al., 2018). Increasing the ambition, the
upper bound for the rate of refurbishment has been set at 30%.
5.2.2 Hibernating mobile phones
To take proper account of the opportunities for recycling and recovering materials from the existing
stock of hibernating mobile phones, four different scenarios are used to calculate the potential. Table 2
below presents the scenarios for the hibernating devices.
While notably different from mobile phones sold in a given year, as hibernating mobile phones are an
accumulated stock, the same recycling rates have been applied. This is due to the more theoretical nature
of the calculations, as consumer behaviour has already consigned these devices to hibernation.
Nevertheless, with new incentives, both financial and otherwise, consumers may be more likely to
deliver their hibernating devices for collection and recycling. Additionally, for the hibernating stock of
mobile phones, a ‘max’ scenario is also calculated to gauge the potential if all the devices that are left
hibernating in people’s homes were to be recycled. Although this is an unrealistic scenario, it serves the
purpose of illustrating the amount and value of material that are recoverable from the devices left
hibernating in households across Europe.
Table 2: Scenarios for hibernating mobile phones
Indicator Baseline Lower bound Upper bound Max
Recycling rate 12% 35% 65% 100%
36 This is confirmed by figures reported by Cailleaud (2019), see section 2.2.

34
5.3 Assumptions
In order to perform the scenario analysis, several assumptions have been made that are explained below.
Sales of mobile phones: Sales for 2017 have been estimated based on data retrieved from Eurostat
Prodcom,37 which presents the annual industrial production statistics based on the NACE classification
of economic activities. Mobile phones fall under the NACE 8-digit category “26302200 - Telephones
for cellular networks or for other wireless networks”. It must be stressed that this code may also
comprise other devices with a wireless connection, e.g. voice over IP equipment, walkie-talkies and
satellite phones (Vencovsky et al., 2014). Therefore, the sales values represent a proxy for the mobile
phones market. Total sales were estimated as production, plus imports minus exports. Sales figures were
also estimated for the period 2007-2017 in order to calculate the number of hibernating mobile phones
(see below). Total sales were first estimated for each year during this period. Then, to have a proxy of
total sales over the period 2007-2017, the estimated sales values were aggregated for these years. For
this period, gaps in the data only exist for production. For these cases, production has been set at zero.
Hibernating mobile phones: Currently there is no available estimate or survey about the number of
hibernating mobile phones at the EU level. However, survey data on the number of mobile phones that
are kept unused in households was found for four member states (see section 3.4): France, Germany,
Belgium, and the UK. By dividing the number of hibernating devices in the above-mentioned countries
with the estimated total sales data for the past 11 years in each country expressed in units, the ratio of
hibernating mobile phones to total sales was estimated for each country. In this respect, Prodcom data
on the number of phones sold from 2007 to 2017 has been used, as data for previous years is not
available. The average ratio was calculated from the different ratios of hibernating phones to total sales
calculated for the four countries. This ratio was then multiplied by the total number of phones sold in
the EU in the last eleven years, resulting in a proxy of the number of phones hibernating in the EU.
Using this methodology, the team estimates that nearly 700 million38 devices are hibernating in people’s
homes across EU28. It must be stressed that this approach entails one main limitation: it does not
consider differences in consumer behaviour and preferences across countries.
Composition of mobile phones: Gold, silver, copper, palladium, cobalt and lithium are the six
materials covered by the study and are further elaborated on in section 4. Using different sources, from
studies and interviews with recyclers, an estimation of the average content of each material in mobile
phones has been made. An overview of the assumptions made to the average content of each is in Table
3 below. Further visualisation of composition is also in section 4.
37 See: https://tinyurl.com/y5zymgjx. 38 Specifically, the study estimates that 697,148,659 mobile phone devices, both functional and non-functional, are hibernating in EU28.

35
Table 3: Estimated content of key materials
Composition Gold Silver Copper Palladium Cobalt Lithium
Percentage 0.017% 0.128% 8.676% 0.004% 5.078% 0.565%
Weight (g/device) 0.03 g 0.21 g 14.26 g 0.01 g 8.35 g 0.93 g
Weight (g/tonne) 167 1,278 86,755 45 50,781 5,654
Price of materials: The prices of the materials included in the study have been found using the sources
indicated in Table 4 and converted to EUR per kg. The price for each material used has been calculated
by taking the average between the 52 week high and low. Conversion from USD to EUR has been done
using an exchange rate of 0.8667, which is the average exchange rate between the two currencies
between 13 April 2018 and 13 April 2019, as reported by the European Central Bank (2019).
Table 4: Price of key materials
Material Price Source
Gold 35,980.75 €/kg Bloomberg (2019a)
Silver 443.47 €/kg Bloomberg (2019b)
Copper 5.67 €/kg Bloomberg (2019c)
Cobalt 48.64 €/kg London Metal Exchange (2019)
Lithium 11.09 €/kg Metalary (2019)
Palladium 34,119.64 €/kg Bloomberg (2019d)
Imports of materials: Using data from Comtrade, the amount and value of the selected materials have
been calculated, using the following indicators: cobalt oxides and hydroxides; commercial cobalt oxides
(2822); copper oxides and hydroxides (code: 282550); gold (including gold plated with platinum)
unwrought or in semi-manufactured forms, or in powder form (code: 7108); lithium oxide and
hydroxide (code: 282520); metals palladium, semi-manufactured (code: 711021); silver (including
silver plated with gold or platinum); unwrought or in semi-manufactured forms, or in powder form
(code: 7106). All import data apply to EU28 for 2017. The average exchange rate as reported by the
European Central Bank (2019) for the same year the materials were imported has been applied to
convert from USD to EUR. It should be noted that the Comtrade statistics for cobalt do not include
imports from DRC, which is the main global producer, and could thus be underreported. Nevertheless,
it was decided to use the Comtrade indicator as only 7% of EU imports arrive from this country
(European Commission, 2017a), and in the interest of using the same source of information across
materials.
Average weight: The average weight of a mobile phone has been estimated to be 164 grams. This has
been calculated as an average of different Apple and Samsung models, weighted by their market share
in relation to each other. Due to the dominance of these two brands in the market, and lack of
information about competing models, this estimate excludes the average weight of devices from other

36
brands and the share of these. Another limitation is that we do not differentiate in terms of weight
between older models that are hibernating and new phones that are sold today.
Emissions: Using LCA data from different sources, mainly Apple, Szilágyi (2013) and Ercan et al.
(2016), we have computed the average between these for each phase of the life cycle (i.e. production,
transport, disposal and use). Note that emissions stemming from production, transport and disposal do
not vary over the time. Hence, emissions from use are the only ones varying over the time. Therefore,
assuming that emissions from use are linear over the time, they are estimated according to the different
expected lifetime scenarios. In the end, total emissions for both scenarios correspond to emissions from
production, transport and disposal plus emissions from use, which vary under the considered scenario.
Put differently, total emissions over a considered period have been computed as total static emissions,
plus emissions from use over the same considered period. Where the stage of disposal has not yet been
reached, this is excluded. It is also assumed that extended lifetime of a device displaces new purchases.
We estimate that annual emissions from a device with a lifetime of 21.6 months is 36 kg CO2e,39 while
the annual emissions from a device with a lifetime of 33.6 months to be 25 kg CO2e. The difference
arises because the largest source of emissions, production, is distributed over a longer time period.
Annual emissions from use are assumed to be 5 kg CO2e.
Jobs required for refurbishment: This assumption has been estimated based on data collected through
interview consultations with experts. We assume there to be eight jobs required for refurbishing ten
thousand mobile phone devices. The estimate includes aesthetic and functional evaluation of the
product, disassembly, repair or replacement of parts (e.g. screen), reassembly and packaging.
Material recovery rate: This refers to the percentage of total material that is recovered through the
recycling processes, thus the share of each material that is recoverable. It is based on information
collected during the interviews with recyclers, which indicated that the efficiency of material recovery
varies, depending on the material in question and the applied recycling and recovery processes. For the
materials considered in this study, the research team decided to apply the recovery efficiency rate of
90% meaning that we assume 90% of the material used in any device can be recovered through
recycling. The choice was based on the minimum rate set by the CENELEC standard for the precious
metals, i.e. gold, silver, copper, as well as palladium, which is used by some recyclers. The same
recovery efficiency rates are applied for cobalt and lithium. However, it should be noted that according
to the interviewed experts, recovery rates with existing technologies can be higher, reaching more than
95%. In addition, the material recovery rate for lithium may be somewhat ambitious, as with different
processes it can reach 57% or 94% (Drabik & Rizos, 2018).
39 Carbon dioxide equivalent.

37
6. Impacts estimated through scenario analysis
This section focuses on the potential impacts
of implementing circular economy approaches
in the mobile phone value chain, through a
scenario analysis. In particular, it provides
estimates of the amounts and value of key
materials that can be recovered from end-of-
life devices, the potential emissions savings
arising from extending the lifetime of the
devices and jobs required in the refurbishment
sector.
Through the scenario analysis, it is estimated
that around 182 million mobile phones were
sold in 2017. Of these, 22 million of the
mobile phones sold in 2017 would be recycled
if applying a recycling rate of 12%. In a
scenario with a more ambitious recycling rate
of 65% around 118 million of the mobile
phones would be recycled.
Of the 700 million mobile phones estimated to be hibernating,40 84 million would be recycled with a
12% recycling rate, while an entire 453 million could be recycled if applying a recycling rate of 65%.
The maximum scenario is used to illustrate the potential hibernating in people’s homes if all of these
devices were to be recycled.
These estimates have been used to calculate the potential for material recovery for both hibernating and
mobile phones sold in 2017. The potential emission savings and jobs required for refurbishment are
calculated only for devices sold in 2017. Due to the varying age and state of the different devices that
are hibernating, it would be difficult to calculate the potential for extending their lifetime or refurbishing
them. The following two sub-sections explain the findings of the scenario analysis, for mobile phones
sold in 2017 and for the stock of hibernating devices.
40 Including both functional and non-functional devices, and based on a rate of hibernation to total sales in the period 2007-2017. More
information about the methodology is in section 5.3.
Figure 6: Estimated number of recycled mobile phones in
different scenarios
22 m
84 m64 m
244 m
118 m
453 m
697 m
Mobile phones sold in
2017
Hibernating mobile
phones
Baseline Lower bound Upper bound Max

38
6.1 Mobile phones sold in 2017
6.1.1 Material recovery
The potential of material recovery for devices
sold in 2017 is presented in Table 5. It shows that
there is significant untapped potential for
recovering materials from the annual flow of
new mobile phones that are sold in Europe and
at some point will reach the end of their life.
As shown in Figure 7, if only 12% of mobile
phones sold in a 2017 are recycled, the value of
recovered gold, silver, copper, palladium, cobalt
and lithium would be almost €36 million. If 65%
of these mobile phones are recycled, however,
this increases to over €194 million, almost five
and a half times the value of materials recovered
in the baseline scenario.
As both the Table and Figure show, most of the
direct economic value of the recovered materials
come from gold, cobalt and palladium.
Nevertheless, recovering the other three
materials would also provide an economic
benefit, though their direct monetary value is
smaller. The economic significance, as well as environmental benefit from using secondary materials
recovered from recycling instead of primary mined and refined materials can be significant.
Table 5: Material recovered from different scenarios of phones sold in 2017
Baseline Lower bound Upper bound
Variable Weight
(tonnes)
Value
(mill. EUR)
Weight
(tonnes)
Value
(mill. EUR)
Weight
(tonnes)
Value
(mill. EUR)
Gold 1 €19 2 €57 3 €105
Silver 4 €2 12 €5 22 €10
Copper 280 €2 818 €5 1518 €9
Cobalt 164 €8 479 €23 889 €43
Lithium 18 €0 53 €1 99 €1
Palladium 0 €5 0 €14 1 €27
Total 467 €36 1363 €105 2532 €195
Figure 7: Value of material recovered from mobile phones
sold in 2017
€0 m
€40 m
€80 m
€120 m
€160 m
€200 m
Baseline Lower bound Upper bound
Gold Cobalt PalladiumSilver Copper Lithium

39
Looking at EU imports of the same materials, one can see that the potential for recovering these
materials in an economic and trade context. Copper and cobalt are the two materials with the highest
share of the composition of a device amongst the materials considered in this study. As such, they are
also the ones that are possible to recover in the highest quantity in terms of weight. For example, while
the EU imported over 700 tonnes of cobalt in 2017, between 0.23 and 1.23 times that amount could be
recovered from the cobalt contained in the mobile phones sold in 2017 for the baseline and upper bound
scenarios respectively.41 For copper, in the upper bound scenario where 65% of devices are recycled,
material recovered from mobile phones amounts to around 11% of the EU’s imports of the material in
2017.42 For the other materials considered the share of recoverable material from recycling mobile
phones sold in 2017 is considerably smaller.
The amount of recovered materials would be sufficient to produce around 20 million mobile phone
devices in the lower bound scenario. About 102 million mobile phones could be produced with the
material recovered in the upper bound scenario, where 65% of mobile phones are recycled. It should be
noted, however, that this assumes perfect substitutability of primary and secondary materials recovered
from recycling, which may not be the case. Moreover, this is only the case for the materials considered
in this study, and highly dependent on the material recovery rate.43 Still, this illustrates that between
11% and 59% of mobile phones sold in 2017 could be produced with material recovered from recycled
mobile phones sold in the same year, for the lower and upper bound scenarios respectively.44
41 Import statistics from Comtrade, indicator “Cobalt oxides and hydroxides; commercial cobalt oxides”.
42 Import statistics from Comtrade, indicator “Copper oxides and hydroxides”.
43 Our assumption is 90% for all the materials considered, see section 5.3 for details. 44 This uses the assumptions given in section 5.3 and the variable bounds for the different scenarios given in section 5.2.
* The above figure refers only to the six materials covered by the study. Other materials required for the
production have not been considered in the calculations.
Source: Authors’ calculations. Each mobile phone symbol with full green shade corresponds to 50 million.
devices.
Figure 8: Devices that can be produced using materials recovered from phones sold in 2017*

40
6.1.2 Emissions
The environmental impact over the lifetime of
a mobile phone largely is largely attributable
to the production phase of the device. Based
on different sources (see Annex 1) this study
estimates that 81% of the CO2e emissions are
associated with the production of the device,
while transport and disposal/recycling
account for no more than 5% together. Thus,
extending the total lifetime of a device can be
an important way to decrease the associated
emissions from the mobile phone value chain.
Usage is the second largest source of
emissions, and varies depending on the total
lifetime of a device (as well as the energy
mix). Thus if the lifetime increases, the share
of emissions from use will likely increase. The emissions associated with usage have been estimated to
5 kg CO2e per year, and 9 kg CO2e during a lifetime of 21.6 months. Extending the lifetime of a device
by one year, would therefore lead to an additional 5 kg CO2e emissions associated with its lifetime.
Nevertheless, it should be kept in mind that extended lifetime of one device is likely only to replace the
purchase of a new device, not the lack of using any device at all.
The potential associated emissions from all the mobile phones across the EU that may be sold and used
within a period of 10 years show that significant emission savings can be achieved through longer
lifetimes of devices.45 Specifically, the scenario analysis shows that by extending the total lifetime of
each device from 21.6 months, which is the current average first lifetime of a device, by one year (i.e.
to 33.6 months) about 20 million tonnes CO2e would be saved. Extending the lifetime by one additional
year would provide savings of around 30 million tonnes CO2e during a period of 10 years. This assumes
that in each scenario, consumers would buy a new mobile phone immediately after their device reaches
the end of the average lifetime and keep using the new device for the same period of time, before again
immediately replacing it with a brand new one and continue the same behaviour.
45 Assuming the same LCA emissions apply without any changes through time, including annual use (thus no changes in electricity mix).
Emissions associated with disposal have been excluded for those devices that have not yet reached their end of life within this period of time.
Also assuming that all devices are produced at the beginning of the 10-year period and that there is a constant number of devices being used, as consumers replace each discarded device instantaneously and with a brand new device. A period of 10 years was chosen to showcase the
potential savings over a certain period of time with different lifetime assumptions.
Figure 9: Average share of emissions for a device with a 21.6 month
lifetime

41
Figure 10 depicts the total amount of
emissions associated with the different
lifetimes over a period of 10 years. It is
possible to save 29% of associated
emissions if the average lifetime of a
device is extended by one year, and an
entire 43% if lifetimes are extended by two
years. These emissions savings largely
come about through displaced production
of new devices. The emissions saved
during a 10-year period from extending the
lifetimes by one year (lower bound
scenario) are equivalent to the emissions
from the production, transport and disposal
of more than 364 thousand devices.46
Extending average lifetimes by an
additional year (upper bound scenario)
from the lower bound scenario could save
emissions associated with the production,
transport and disposal of 546 thousand devices.
While not quantified in this study, it should be noted that environmental benefits may also be found in
the potential reduction of extraction of raw materials through mining. This reduction in mined input
material could come about as a result of extended lifetimes of devices, thus reducing the overall quantity
of devices produced, as well as using secondary materials instead of virgin materials as inputs in the
production process.
46 This only refers to average static emissions associated with a device (production, transport and disposal), and not use.
Figure 10: Scenario emissions for a 10-year period

42
6.1.3 Employment
The recycling industry is a relatively capital-intensive industry,
where increased amounts of waste may require investment in
increased capacity rather than additional working hours. The
more labour-intensive part of the process is usually the
collection, distribution and sorting of waste. The final recycling
and recovery of materials, which is the last step in the process,
is more capital intensive.
Mobile phones form a small part of WEEE, not only because
few are recycled, but also because of the relatively small size
and weight of the devices compared to other WEEE. As such,
even if all the hibernating mobile phones accumulated in all
European households are recycled, this amounts to 114,582
tonnes according to our estimates, less than all the WEEE
collected from households in Belgium in 2016 (Eurostat,
2019b). As such, recycling a share of the annual sales of mobile
phones are likely to require limited labour resources.
The refurbishment sector, however, may be more labour
intensive. In order to prepare and sell a refurbished mobile
phone, several different activities are necessary, including:
sorting through devices, testing for faults and issues, actual
refurbishment, cleaning, testing, and finally sales. Therefore, the
scenario analysis focuses on the refurbishment sector in order to
provide estimates on employment creation. It is to be noted that
the analysis focuses on the direct refurbishment process, thus excluding other aspects not directly related
to the refurbishment process. It also excludes jobs associated in producing spare parts, which often takes
place in Asia.
The rate of refurbishment used in the baseline scenario is 10%. Extrapolated for EU28 sales in 2017,
this amounts to just above 18 million devices, whose refurbishment would require just above 14.5
thousand jobs. Should a higher ratio of devices be refurbished, however, this would lead to significantly
more jobs being required. If 20% of devices sold in 2017 were to be refurbished, almost 30 thousand
jobs would be needed. Applying a rate of 30% (upper bound), more than 43.6 thousand jobs would be
required to refurbish the devices. This indicates that while primary production of mobile phones has
largely moved out of Europe, there may be employment opportunities in the EU refurbishment sector,
assuming that these devices are refurbished in Europe.
Note: Each ‘person’ with full green
shade corresponds to 5000 jobs.
Figure 11: Jobs required in refurbishment

43
6.2 Hibernating mobile phones
As shown in Figure 12 and Table 6, the
economic value of materials that can be
recovered from the stock of hibernating
mobile phones is significant due to the large
volumes of devices. The value of all the
gold, silver, copper, cobalt, palladium and
lithium that can be recovered, if all are
recycled, amounts to over €1 billion.
The potential value of recovered materials
varies significantly according to the
different scenarios. Applying a recycling
rate of 12%, as in the baseline scenario, the
value of recovered materials would be over
€138 million. Recycling 65% of these, as in
the upper bound scenario, would lead to the
recovery of materials with a value of over
€746 million. Just as with the scenarios for
devices sold in 2017, the majority of the
value amongst the materials considered in
this study come from the recovered gold,
cobalt and palladium.
Figure 12: Value of material recovered from hibernating mobile phones
€0 m
€200 m
€400 m
€600 m
€800 m
€1.000 m
€1.200 m
Baseline Lower bound Upper bound Max
Gold Cobalt Palladium Silver Copper Lithium

44
As is the case with the devices sold in 2017, cobalt and
copper are the two most important recovered materials
in terms of weight. Only the cobalt recovered from the
baseline scenario amounts to 87% of all cobalt imports
into the EU in 2017. The upper bound scenario where
65% of all devices are recycled would allow recovery
of over 3,400 tonnes of cobalt, equivalent to 4.73
times the amount imported into the EU in 2017.
Between 8% and 42% of EU imports of copper can be
recovered according to the baseline and upper bound
scenarios, respectively. Lesser shares of EU imports
of the other four materials would be recovered, due to
large import volumes and relatively small amounts of
the materials in mobile phones. Notably, while
recovered gold from the upper bound scenario is
equivalent to slightly more than 1% of EU gold
imports in 2017, the recovered material has a value of
over €402 million. The total value of the gold
recovered is thus higher than the total value of the
other materials recovered, largely due to the higher
price of the material. While palladium has a similarly
high price, each device only contains 0.004% of the
material and as such the total value of the material
recovered is less.
The amount of these materials recovered in the lower
bound, upper bound and max scenarios exceeds the
amount required as input of the same materials to
produce an equivalent amount of devices that were
sold in 2017. While under the baseline scenario the
recovered material would be enough to feed into the
production of around 75 million mobile phone
devices, increasing the recycling rate to 35% (lower
bound scenario) would allow recovering enough
material to produce over 200 million new devices.
Under the upper bound scenario, which foresees a
recycling rate of 65%, the recovered material would
be enough to produce over twice the amount of
devices sold in 2017.47 However, it should be noted that recovered materials can have a wide use across
the EU economy and may serve as inputs into other products than those they originate from.
47 These comparisons only serve to illustrate the scale of the opportunities since in practice it is not possible to have perfect substitutability of
primary and secondary materials recovered from recycling.
Figure 13: Devices that can be produced using
materials recovered from hibernating phones*
* The above figure refers only to the six materials
covered by the study. Other materials required for
the production have not been considered in the
calculations.
Source: Authors’ calculations. Each mobile phone
symbol corresponds to 50 million devices.

45
Table 6: Material recovered from hibernating mobile phones
Baseline Lower bound Upper bound Max
Variable Weight
(tonnes)
Value
(mill.)
Weight
(tonnes)
Value
(mill.)
Weight
(tonnes)
Value
(mill.)
Weight
(tonnes)
Value
(mill.)
Gold 2 €74 6 €217 11 €403 17 €619
Silver 16 €7 46 €20 86 €38 132 €58
Copper 1,074 €6 3,131 €18 5,815 €33 8,947 €51
Cobalt 628 €31 1,833 €89 3,404 €166 5,237 €255
Lithium 70 €1 204 €2 379 €4 583 €6
Palladium 1 €19 2 €55 3 €102 5 €158
Total 1,790 €138 5,222 €402 9,698 €746 14,920 €1,148
6.3 Limitations
While the study aims to provide an overview of opportunities for circular economy business models in
the mobile phones value chain, there are several limitations that should be acknowledged. As such, the
results given in this section 6 should be taken with caution and are only meant to provide indications
about the scale of benefits that can potentially be achieved through circular economy approaches.
Data availability has been a key obstacle to the preparation of this study. The mobile phone value chain
is characterised by notable data gaps and limited availability of data in publicly available sources. Thus,
access to full, recent and comparable data challenges the possibility of providing the most accurate
overview of the sector and the potential for circular economy approaches. Where data has not been
attainable, proxies have been used to estimate the missing information. As an example, this has been
done for number of devices sold in EU28 as well as number of hibernating devices in EU28. While
several challenges were encountered in finding appropriate data for this study, among the more
challenging areas were: employment, hibernating devices, refurbished devices and rate of material
recovery. Employment in the circular aspects of the mobile phone value chain has provided a particular
challenge, as data beyond the firm level has not been found. Estimates were collected from the
interviews, literature review, and validated through expert consultation. Additionally, recent estimates
of rates of recycling for mobile phones (average for Europe) were not found so the most recent numbers
were used. Due to the rapid change in the mobile phone market, these may not fully reflect the actual
situation in the market today. Nevertheless, the baselines have been set to be as realistic as possible,
and the lower and upper bounds to reflect the possibilities of certain changes in behaviour.
A further complication for the analysis is the lack of information about the age and characteristics of
hibernating devices, and whether they are still functional, for example. Nevertheless, since they
continue to accumulate their potential for a circular economy approach deserves special attention. To

46
plug the gap in available data, generalised information about the composition of mobile phones has
been applied to this category, even though the composition is likely to vary from these assumptions; for
example, a 10-year-old device will have different materials and content from one that is only a year old.
Other limitations faced in the preparation of this study are the rapid evolution and range of differences
within the mobile phone sector. Products differ between feature phones, modular devices, and
smartphones, with differences between models and brands in each category. This affects their material
composition, LCA emissions, weight, price range, potential for a second life, length of software support,
and more.
The study tried to fill existing knowledge gaps, for example by providing estimates about the resources
that could be recovered from unused mobile phone devices and reintroduced into the EU economy.
However, it does not claim to be exhaustive: several areas need further examination through dedicated
studies and projects, for instance, the effects on other sectors in order to assess the net effects on EU
employment. The potential rebound effects of implementing different circular economy approaches is
another area that requires dedicated research. For example, the possible environmental effects of buying
reused (second-hand) smartphones can be mitigated if there is a re-spending effect. Potential rebound
effects should be investigated and factored in when designing policies in this field.
7. Opportunities from creating a circular economy
Based on the results of the scenario analysis and literature review, several opportunities for circular
economy approaches in the mobile phone value chain can be found, for businesses, employment and
consumers.
For European businesses, opportunities may arise from increased recycling and recovery of materials,
and professional repairs and refurbishment. If repairs are done professionally and locally, this could
increase business activity in Europe, even if individual spare parts are not produced in the EU.
Moreover, professional refurbishment has seen an increase in Europe in recent years, with several
European companies appearing and growing their market share.
Benefits can moreover arise through recycling end-of-life mobile phones even though their weight is
small compared to other electronics. Recovering materials from recycled devices could offer
opportunities for making secondary raw materials available on the EU market and retaining their value
in the EU economy. This would also help reduce the EU’s dependence on imported materials and
increase security of supply of many materials that are key inputs into the production of electronics and
batteries.
Currently, it is estimated that between 12% and 15% of mobile phones are properly recycled in Europe.
This study estimates that collecting and recycling 35% of devices sold in Europe in 2017 (lower bound
scenario) can help recover about 1,360 tonnes of gold, silver, copper, cobalt, lithium and palladium,
with a value of almost €105 million. In a more ambitious upper bound scenario of recycling 65% of

47
these devices, 2,530 tonnes with a value of €195 million could be recovered. This amount of material
would be almost five and a half times more than what is recovered under the baseline scenario.
Looking more closely into some specific materials contained in mobile phones, particular potential
benefits can be identified. Cobalt has been identified by the European Commission as a critical raw
material, since it combines a high economic importance with a supply risk. The study estimates that a
mobile phone recycling rate of 65% could lead to the recovery of around 889 tonnes of cobalt,
equivalent to 123% of EU imports of commercial cobalt oxides in 2017. Copper is among the most
important materials used in mobile phones in terms of weight. Achieving a 65% recycling rate for
mobile phones would help recover 1,518 tonnes of copper, which is equivalent to 11% of EU imports
of this material (copper oxides and hydroxides) in 2017.
In addition to the mobile phones currently sold in Europe, there is a stock of old devices, usually referred
to as ‘hibernating phones’ that remain unused in EU households. So far there has not been any
assessment of the size of this stock at the EU level and this study aimed to address this knowledge gap,
arriving at an estimate of around 700 million hibernating devices across the EU. There is therefore a
large untapped potential for collecting these and recovering their valuable materials. In the lower bound
scenario which assumes that 35% of the devices are collected for recycling, around 5,222 tonnes of
materials with a value of €402 million would be recovered. Under a more ambitious upper bound
scenario assuming a recycling rate of 65%, about 9,700 tonnes with a value of €746 million would be
recovered. Regarding specific materials, 3,400 tonnes of cobalt, equivalent to approximately 4.73 times
the amount of all EU cobalt imports in 2017 (commercial cobalt oxides) and around 5 815 tonnes of
copper equivalent to 42% of EU copper imports in 2017 (copper oxides and hydroxides) would be
recovered. The study also estimates that recycling the full stock of hibernating mobile phones could
help recover about 14,920 tonnes of gold, silver, copper, palladium, cobalt and lithium, with a value of
€1.15 billion. Although this is an unrealistic scenario, it illustrates the benefits that can be achieved
through properly recycling these devices.
While mobile phone manufacturing has largely disappeared from Europe, employment opportunities
may nevertheless arise from circular approaches to the value chain. Particularly, as the interest in
refurbished devices has grown in recent years, European refurbishment businesses have emerged. Based
on the above scenario analysis, 14,562 jobs are found to be required to refurbish only 10% of all devices
sold EU28 in a given year.48 Increasing this to 20% would require 29,123 jobs, while if 30% were to be
refurbished, 43,685 jobs would be needed. These estimates provide an indication about the potential for
employment creation through increased refurbishment of mobile phones. Nevertheless, they do not take
into account the effects on other sectors and thus they should not be regarded as net employment effects.
Notably, while potentially less labour intensive, other circular approaches may also have impacts on
employment. As an example, local repair shops have been emerging in recent years to meet consumer
demand. Employment opportunities may also arise from the recycling of discarded devices. The more
labour intensive part of the process is usually the collection, distribution and sorting of devices, while
48 Assuming the same sales as in 2017.

48
the final recycling and recovery of materials, is more capital intensive. If end-of-life devices are
collected beyond existing capacities, this would in theory require additional labour resources, often at
the local level. However, given that mobile phones are relatively insignificant in terms of weight and
form a small part of WEEE, the labour required for the collection, sorting, depollution, management,
administration, or other indirect jobs associated with the recycling of WEEE may not be significantly
affected by increases in the number of collected devices. Added to this, calculating the labour effect of
collecting and recycling more mobile phones is difficult since devices are often collected together with
other types of WEEE.
Consumers may benefit from circular approaches through increased choices and customer support
amongst others. By improving access to and ease of repairs, for example, consumers will be able to
make informed choices about whether to repair their current device or purchase a new one. This may
be one way of increasing the lifetime of devices, though software support and other factors such as
‘fashion’ may play an important role. Moreover, the growing market for refurbished mobile phones
signals that there is a notable demand for high-end devices at a reduced cost. While leasing of devices
has yet to take off on a large scale, this is another approach that has been gaining attention from
businesses. As such, one of the major benefits from circular approaches to the mobile phone value chain
for consumers may be the additional choices they are given. Nevertheless, as discussed earlier in this
study, these opportunities depend on awareness raising and willingness to engage in circular approaches
from the consumer side.
Under certain conditions circular economy approaches may also provide opportunities for achieving
environmental benefits. The study estimates that extending the lifetime of mobile phones by one year,
from 21.6 months to 33.6 months, can help save 20.3 million tonnes of CO2e over a 10-year period,
equivalent to 29% of the emissions in the baseline scenario. In the more ambitious scenario where the
lifetime of the devices is extended by an additional year, i.e. to 45.6 months, about 30.5 million tonnes
of CO2e would be saved over a 10-year period, or 43% of the emissions associated with the baseline
scenario. This amount of CO2e savings from the upper bound scenario would be equivalent to the
emissions of producing, transporting and disposing of 546 thousand new mobile phones. It should be
noted that these estimates do not take into account any potential rebound effects, or lifetime extension
through replacement of any parts of the devices. Further environmental benefits, although not quantified
in this study, can take the form of reduced extraction of raw materials as well as decreased energy use
from the mining process. Such benefits can also be achieved through recycling and recovery of
resources as the demand for primary materials in the manufacturing process is expected to decrease,
with positive environmental impacts, especially in the countries where the materials are mined.

49
8. Policy messages
Drawing on the empirical findings and the analysis conducted, policy action should be taken in the
following areas:
Collection rates of old unused mobile phone devices are low, which means there is largely
unexploited potential in the EU for recovering valuable materials from these devices. Policy
action at the EU, member state and local level is therefore needed to address this issue. This could
take the form of targeted campaigns to inform consumers about the location of collection points,
the need to recycle old devices and the resulting benefits for both the economy and the environment.
Projects seeking ways to improve collection and implement innovative approaches49 can contribute
to this end. Allaying consumers’ concerns about the data stored in their mobile phones is also
important as this appears to be a key reason for low collection rates.
Although consumers generally show willingness to engage in circular economy practices for
mobile phones, in reality only a few do so. Targeted initiatives at the EU and member state level
to increase awareness of the benefits of repairing and buying second-hand/refurbished mobile phone
devices, for example, can help to close this gap. Increasing knowledge about where to repair devices
and/or about the legal rights of consumers regarding the minimum guarantee period for second-
hand/repaired products can also contribute to this end. Price seems to play a key role in consumers’
choice of such products; thus, some form of economic incentive could boost demand.50
Various challenges for reuse and refurbishment businesses stem from EU legislation. These
include the regulatory complexity of requirements in both EU waste and product regulation and
uncertainty regarding the definition of the “preparation for use” process in the WEEE Directive.
The refurbishment of mobile phones originating from outside the EU may also be hampered by a
lack of clarity regarding the CE marking requirements for these products. Addressing these
challenges can support further growth in the refurbishment and reuse businesses.
49 One such example is the CIRC4Life EU-funded project, which will implement an innovative incentive scheme to encourage recycling and
reuse of electronic devices. The scheme will be based on an internet-based recycling system that will inform consumers about their impacts
on the environment and offer them an economic reward for delivering their unused devices. See more details at: https://www.circ4life.eu/. 50 Some member states have introduced incentives in the form of VAT reductions for the repair of specific product groups.
50
References
ADEME (2018) “Benchmark international du secteur de la reparation”, May 2018.
Alves Dias, P. et al. (2018), “Cobalt: demand-supply balances in the transition to electric mobility”,
Joint Research Centre, EUR 29381 EN (https://tinyurl.com/yxpeb75r).
Apple (2017), “Environmental Responsibility Report | 2017 Progress Report”
(https://images.apple.com/sg/environment/pdf/Apple_Environmental_Responsibility_Report_2
017.pdf).
Baldé, C. P., V. Forti, V. Gray, R. Kuehr and P. Stegmann (2017), “The Global E-waste Monitor
2017”, United Nations University (UNU), International Telecommunication Union (ITU) &
International Solid Waste Association (ISWA) (https://tinyurl.com/ycrpubku).
Benton, D., E. Coats, and J. Hazell (2015), “A circular economy for smart devices: Opportunities in
the US, UK and India”, Green Alliance (https://www.green-
alliance.org.uk/resources/A%20circular%20economy%20for%20smart%20devices.pdf).
Bitkom (2018), “124 Millionen Alt-Handys liegen ungenutzt herum”
(https://www.bitkom.org/Presse/Presseinformation/124-Millionen-Alt-Handys-liegen-
ungenutzt-herum.html).
Blandin, M.-C. (2016), “RAPPORT D´INFORMATION FAIT au nom de la mission d’information
(1) sur l’inventaire et le devenir des materiaux et composants des telephones mobiles”, SÉNAT
SESSION EXTRAORDINAIRE DE 2015-2016, N° 850 (https://tinyurl.com/y5o2lfe8).
Bloomberg (2019a), “GC1:COM: Gold Comex” (https://www.bloomberg.com/quote/GC1:COM).
Bloomberg (2019b), “SI1:COM: Silver Comex” (https://www.bloomberg.com/quote/SI1:COM).
Bloomberg (2019c), “HG1:COM: Copper Comex” (https://www.bloomberg.com/quote/HG1:COM).
Bloomberg (2019d), “XPDUSD:CUR: Palladium spot”
(https://www.bloomberg.com/quote/XPDUSD:CUR).
Boxall, A. (2019) “Google still thinks people are interested in modular smartphones”, Digital Trends,
12 February.
Brockwell, H. (2016) “They were supposed to be the future - so why haven’t modular phones taken
off?”, techradar, 27 December.
Burton, J. (2017), “Ordinary Minerals Give Smartphones Extraordinary Capabilities”, Department of
the Interior, U.S. Geological Survey.
Cailleaud, N. (2019), “La Demande de Mobiles Reconditionnes Toujours en Hausse”, CNews, 7
March (https://www.cnews.fr/vie-numerique/2019-03-07/la-demande-de-mobiles-
reconditionnes-toujours-en-hausse-819329).
CENELEC (2015), “CLC/TS 50625-3-1 - Collection, logistics & treatment requirements for WEEE -
Part 3-1: Specification for de-pollution – General” (https://tinyurl.com/y2wcpukw).

51
Cerulli-Harms, A. et al. (2018), “Behavioural Study on Consumers' Engagement in the Circular
Economy - Final report” (https://tinyurl.com/y98plym5).
Coats, E. and D. Benton (2016), “The end of the upgrade? How O2 is adapting to a more circular
mobile market”, Green Alliance.
Cook, G. and Jardim, E. (2017), “Guide to Greener Electronics”, Greenpeace reports
(https://tinyurl.com/y3blamx6).
Counterpoint (2018), “The Surprising Growth of Used Smartphones”, Press Release, 7 March
(https://www.counterpointresearch.com/surprising-growth-used-smartphones/).
CRM Recovery project (2014), “Pan European Policy Recommendations - Critical Raw Material
Closed Loop Recovery Project’’ (https://tinyurl.com/y479mnlj).
Dekonink, B. (2018), “Smartphones reconditionnes : un marche en pleine acceleration’’, Les Echos
(https://tinyurl.com/y6hj2oab).
De Franceschi (2018), “Planned Obsolescence challenging the Effectiveness of Consumer Law and the
Achievement of a Sustainable Economy - The Apple and Samsung Cases’’, Journal of European
Consumer and Market Law, Vol. 7, pp. 217-221.
De Groot, et. al. (2012), “Mapping resource prices: the past and the future”, Final report for European
Commission -DG Environment (ENV.G.1/FRA/20410/0044) (http://ec.europa.eu/environment/
enveco/resource_efficiency/pdf/report_mapping_resource_prices.pdf).
Drabik, E. and V. Rizos (2018), “Prospects for electric vehicle batteries in a circular economy”, CEPS
Research Report No 2018/05, July 2018 (https://tinyurl.com/y964skjt).
Ellen MacArthur Foundation (2018), “Circular Consumer Electronics: An Initial Exploration”
(http://tinyurl.com/yycsm7ud).
Ercan, M. et al. (2016), “Life Cycle Assessment of a Smartphone”, 4th International Conference on
ICT for Sustainability (ICT4S 2016).
European Central Bank (2019), “US dollar (USD)”,
(https://www.ecb.europa.eu/stats/policy_and_exchange_rates/euro_reference_exchange_rates/h
tml/eurofxref-graph-usd.en.html).
European Commission (2015), “Impact of the structural changes on jobs and industrial relations in the
telecommunications and ICT: Final Report”.
European Commission (2016a), “The efficient functioning of waste markets in the European Union”,
Luxembourg: Publications Office of the European Union.
European Commission (2016b), “EU takes again legal action against export restrictions on Chinese raw
materials”, (http://trade.ec.europa.eu/doclib/press/index.cfm?id=1530).
European Commission (2017a), “Communication on the 2017 list of Critical Raw Materials for the
EU”, COM(2017) 490 final.

52
European Commission (2017b), “Horizon 2020. Work Programme 2018-2020 – 12. Climate action,
environment, resource efficiency and raw materials”, European Commission Decision
C(2017)7124 of 27 October.
European Commission (2018a), “Report on critical raw materials and the circular economy”
(https://publications.europa.eu/en/publication-detail/-/publication/d1be1b43-e18f-11e8-b690-
01aa75ed71a1/language-en/format-PDF/source-80004733).
European Commission (2018b), “General Overview of Active WTO Dispute Settlement Cases
Involving The EU as Complainant or Defendant and of Active Cases Under the Trade Barriers
Regulation”, Ref. Ares(2018)5233926 (http://trade.ec.europa.eu/doclib/docs/2016/february/
tradoc_154243.pdf).
European Commission, (2018c), “Cobalt: supply and demand balances in the transition to electric
mobility” (https://ec.europa.eu/jrc/sites/jrcsh/files/cobalt_infographics_one-pager.pdf).
European Commission (2019), “Report on the Implementation of the Strategic Action Plan on Batteries:
Building a Strategic Battery Value Chain in Europe”, COM(2019) 176 final.
European Copper Institute (2019), “Europe’s Copper Industry” (https://copperalliance.eu/about-
us/europes-copper-industry/).
EESC (European Economic and Social Committee) (2013), “Opinion of the European Economic and
Social Committee and the Committee on Towards more sustainable consumption: industrial
product lifetimes and restoring trust through consumer information’’, CCMI/112.
EEA (European Environment Agency) (2016), “Circular Economy in Europe - Developing the
knowledge base’’, EEA Report No. 2/2016.
European Parliament (2017) “Report on a longer lifetime for products: benefits for consumers and
companies”, (2016/2272(INI)), Committee on the Internal Market and Consumer Protection.
Eurostat (2016), “Mobile communications - subscriptions and penetration”, last updated 27.01.2016.
Eurostat (2018a), “Price level index for household final consumption expenditure (EU-28=100)”, 2017.
Eurostat (2018b), “Annual detailed enterprise statistics for industry (NACE Rev. 2, B-E)”, last updated
22.10.2018.
Eurostat (2018c), “National accounts employment data by industry (up to NACE A*64)”.
Eurostat (2019a), “Record recycling rates and use of recycled materials in the EU”, Newsrelease
39/2019 - 4 March 2019 (https://ec.europa.eu/eurostat/documents/2995521/9629294/8-
04032019-BP-EN.pdf/295c2302-4ed1-45b9-af86-96d1bbb7acb1).
Eurostat (2019b), “Waste electrical and electronic equipment (WEEE) by waste management
operations”, code: env_waselee (http://appsso.eurostat.ec.europa.eu/nui/submit
ViewTableAction.do).
Fairphone (2016), “What to do with your old phones across Europe” (https://tinyurl.com/ycpfxure).

53
Gabriël, M., C. de S. De Lophem and C. Van Bavel (2017), “State of the smart - Consumer usage
patterns of the smartphone”, Global Mobile Consumer Survey, Belgian edition 2017, Deloitte
(https://tinyurl.com/y6o4kkcr).
Gartner (2015), “Gartner Says Worldwide Market for Refurbished Smartphones to Reach 120 Million
Units by 2017” (https://tinyurl.com/y2bteots).
Gharfalkar, M., A. Zulfiqur and G. Hillier (2016), “Clarifying the disagreements on various reuse
options: Repair, recondition, refurbish and remanufacture’’, Waste Management & Research,
Vol. 34, pp. 995-1005.
Huisman, J. et al. (2015), “Countering WEEE Illegal Trade”, Summary Report
(http://www.cwitproject.eu/wp-content/uploads/2015/08/CWIT-Final-Summary1.pdf).
IMF (International Monetary Fund) (2018), “World Economic Outlook April 2018”, World Economic
Outlook: Cyclical Upswing, Structural Change.
Ijomah W.L., G.P. Hammond, S.J. Childe and C.A. McMahon (2005), “A robust description and tool
for remanufacturing: A resource and energy recovery strategy’’. In R. Yamamoto, Y. Furukawa,
H. Koshibu, P. Eagan, H. Griese, Y. Umeda, & K. Aoyama (Eds.), Eco Design 2005. Proceedings
of the Fourth International Symposium on Environmentally Conscious Design and Inverse
Manufacturing, pp. 472-479.
JRC (2019) “Guide for the Assessment of Material Efficiency: application to smartphones – v 2” ,
Joint Research Centre of the European Commission (https://tinyurl.com/yxsl7x4t).
Judl, J., J. Tilkanen, S. Riddlestone and C. Rubbens (2018), “Creating sustainable smartphones:
Scaling up best practice to achieve SDG 12”, Transform Together.
Kantar Worldpanel (2017), “An Incredible Decade for the Smartphone: What’s Next?’’
(https://tinyurl.com/y6c2y7ev).
Kotoky, R.A. and S. Rai (2018), “World’s Largest Mobile Phone Factory Opens in India”, Bloomberg
(https://tinyurl.com/y728xy54).
Kreziak D., I. Prim-Allaz and E. Robinot (2017) “Des tiroirs pleins de telephones remplaces :
consommateurs et objets a obsolescence percue”, ADEME, COOP project research report
Consommateurs et Objets a Obsolescence Programmee.
Lebedeva, N. et al. (2016), “Lithium ion battery value chain and related opportunities for Europe”,
Joint Research Centre (JRC) (https://tinyurl.com/y2fepfg2).
Libaert, T. (2018) “Pour une consommation plus durable - en phase avec les enjeux europeens”.
Lee, P., D. Stewart and C. Calugar-Pop (2017), “Technology, Media and Telecommunications
Predictions 2018”, Deloitte (https://tinyurl.com/y5j2gao5).
London Metal Exchange (2019), “LME COBALT”, (https://www.lme.com/en-GB/Metals/Minor-
metals/Cobalt#tabIndex=2).
Makov T. and D. Font Vivanco (2018) “Does the Circular Economy Grow the Pie? The Case of
Rebound Effects from Smartphone Reuse”, Frontiers in Energy Research, Vol. 6:39.
54
Manhart, A. et al. (2016), “Resource Efficiency in the ICT Sector”, Oeko-Institut e.V.
(https://tinyurl.com/y4mwregm).
Merchant, B. (2017), “Everything That’s Inside Your iPhone”, Vice Motherboard, 15.08.2017
(https://motherboard.vice.com/en_us/article/433wyq/everything-thats-inside-your-iphone).
Metalary (2019), “Lithium Price” (https://www.metalary.com/lithium-price/).
Montalvo, C., D. Peck and E. Rietveld (2016), “A Longer Lifetime for Products: Benefits for
Consumers and Companies”, Study for the IMCO Committee, European Parliament.
Nield, D. (2018), “5 innovations to expect from smartphones in 2019”, New Atlas, 27 November
(https://newatlas.com/5-innovations-2019-smartphones/57404/).
O’Connell, R. et al. (2018), “WORLD SILVER SURVEY 2018”, Thomson Reuters and The Silver
Institute (http://sprott.com/media/1834/the-silver-institute-world-silver-survey-2018.pdf).
OECD (2012), “Case Study on Critical Metals in Mobile Phones”, Final Report.
Peiró, L.T., G.V. Méndez and R.U. Ayres (2013), “Material flow analysis of scarce metals: sources,
functions, end-uses and aspects for future supply”, Environmental Science & Technology, Vol.
47, pp. 2939-2247.
Pew Research Center (2019) “Smartphone Ownership Is Growing Rapidly Around the World, but Not
Always Equally” (https://tinyurl.com/y4vu5wkf).
Polák, M. and L. Drápalová (2012), “Estimation of end of life mobile phones generation: the case
study of the Czech Republic”, Waste Management, Vol. 32, pp. 1583-1591.
Puckett, J, C. Brandt and H. Palmer (2019), “Holes in the Circular Economy: WEEE Leakage from
Europe”, Report for the e-Trash Transparency Project, Basel Action Network.
Rathore, P., S, Kota and A. Chakrabarti (2011), “Sustainability through remanufacturing in India: a
case study on mobile handsets’’, Journal of Cleaner Production, Vol. 19, pp. 1709-1722.
Recupel (2019), “Il reste encore des millions d’EEE inutilisés dans les ménages belges”, PowerPoint
Presentation.
Riisgaard, H., M. Mosgaard, and K.O. Zacho (2016), “Local Circles in a Circular Economy – the
Case of Smartphone Repair in Denmark”, European Journal of Sustainable Development, Vol.
5, pp. 109-124.
Royal Australian Chemical Institute (2011), “Palladium” (https://tinyurl.com/yxdaqaux).
Samsung (2018), “Product Material Information”
(https://images.samsung.com/is/content/samsung/p5/uk/aboutsamsung/2018/2_Product_materia
l_information_20180615.pdf).
Sappin, E. (2018) “Three Tech Innovations Leading The Smartphone To Its Grave”, in Forbes
Council, 22 March (https://www.forbes.com/sites/forbesnycouncil/2018/03/22/three-tech-
innovations-leading-the-smartphone-to-its-grave/#7f72e86a070e).

55
Schüler, D. (2017), “EU’s ore and metal import flows and engagement towards responsible sourcing
in industry supply chains”, GREAT Insights, Vol. 6, Issue 3 (https://ecdpm.org/wp-
content/uploads/GREAT-6-3-July-August-2017-1.pdf).
Statista (2017), “Consumer Electronics Report 2017 – Telephony”, Statista Consumer Market
Outlook – Segment Report (http://tinyurl.com/y6kotd7e).
Szilágyi, A. (2013), “What’s in a Life-Cycle Assessment?”, Fairphone,
(https://www.fairphone.com/en/2013/08/01/whats-in-a-life-cycle-assessment/).
TrendNomad (2018), “Refurbished phone: smarter than the latest model”,
(http://trendnomad.com/refurbished-phone-smarter-than-the-latest-model/).
United States Environmental Protection Agency (NA), “Basic Information about Electronics
Stewardship” (https://www.epa.gov/smm-electronics/basic-information-about-electronics-
stewardship#01).
Van Weelden, E., R. Mugge and C. Bakker (2016), “Paving the way towards circular consumption:
exploring consumer acceptance of refurbished mobile phones in the Dutch market’’, Journal of
Cleaner Production, Vol. 113, pp. 743-754.
Vencovsky, D. et al. (2014), “Study on the Impact of the MoU on Harmonisation of Chargers for
Mobile Telephones and to Assess Possible Future Options”, Final Report (Main Report)
prepared for DG Enterprise and Industry, Ref. Ares(2014)3693533 - 06/11/2014.
Watson, D., A.C. Gylling, N. Tojo, H. Throne-Holst, B. Bauer and L. Milios (2017), “Circular
Business Models in the Mobile Phone Industry”, Nordic Council of Ministers.
Wilson, G.T. et al. (2017), “The hibernating mobile phone: Dead storage as a barrier to efficient
electronic waste recovery”, Waste Management, Vol. 60, pp. 521-533.
Yu, J., E. Williams and M. Ju (2010), “Analysis of material and energy consumption of mobile
phones in China”, Energy Policy, 38, pp. 4135-4141.
Zink, T., F. Maker, R. Geyer, R. Amirtharajah and V. Akella (2014), “Comparative life cycle
assessment of smartphone reuse: repurposing vs. refurbishment’’, The International Journal of
Life Cycle Assessment, Volume 19, pp. 1099-1109.
Zink T. and R. Geyer (2017) “Circular Economy Rebound”, Journal of Industrial Ecology, Vol. 21,
pp. 593-602.
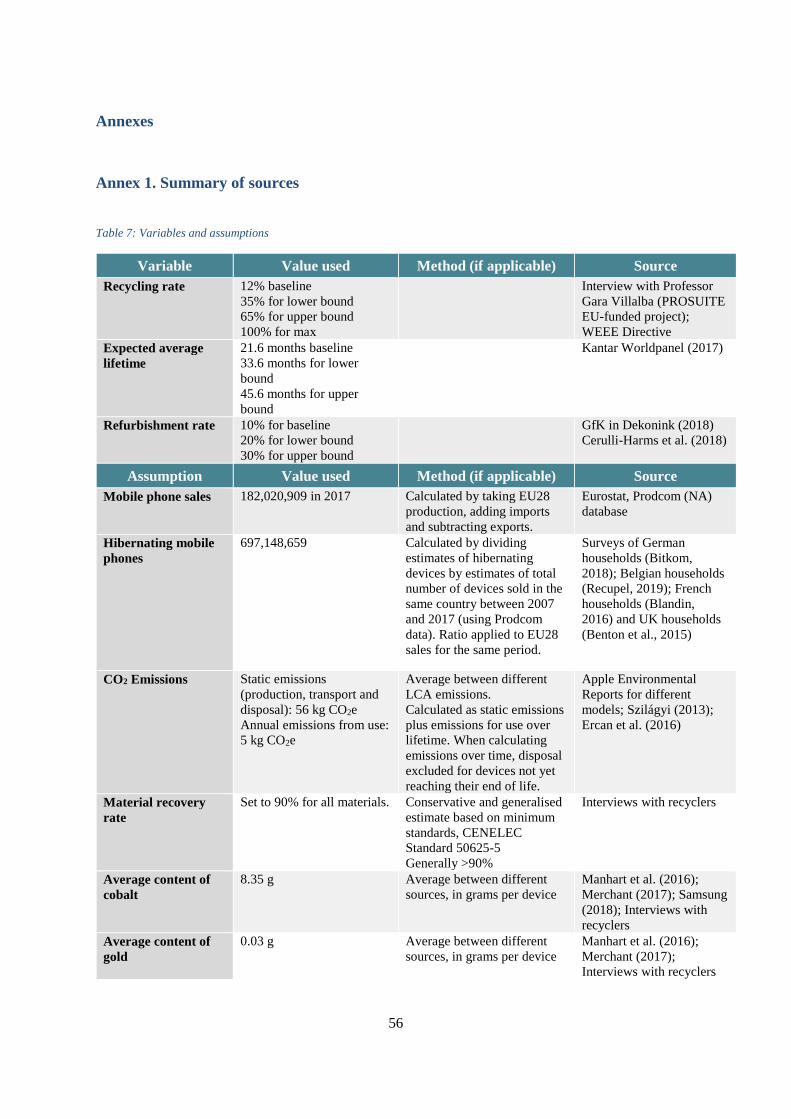
56
Annexes
Annex 1. Summary of sources
Table 7: Variables and assumptions
Variable Value used Method (if applicable) Source
Recycling rate 12% baseline
35% for lower bound
65% for upper bound
100% for max
Interview with Professor
Gara Villalba (PROSUITE
EU-funded project);
WEEE Directive
Expected average
lifetime
21.6 months baseline
33.6 months for lower
bound
45.6 months for upper
bound
Kantar Worldpanel (2017)
Refurbishment rate 10% for baseline
20% for lower bound
30% for upper bound
GfK in Dekonink (2018)
Cerulli-Harms et al. (2018)
Assumption Value used Method (if applicable) Source
Mobile phone sales 182,020,909 in 2017 Calculated by taking EU28
production, adding imports
and subtracting exports.
Eurostat, Prodcom (NA)
database
Hibernating mobile
phones
697,148,659 Calculated by dividing
estimates of hibernating
devices by estimates of total
number of devices sold in the
same country between 2007
and 2017 (using Prodcom
data). Ratio applied to EU28
sales for the same period.
Surveys of German
households (Bitkom,
2018); Belgian households
(Recupel, 2019); French
households (Blandin,
2016) and UK households
(Benton et al., 2015)
CO2 Emissions Static emissions
(production, transport and
disposal): 56 kg CO2e
Annual emissions from use:
5 kg CO2e
Average between different
LCA emissions.
Calculated as static emissions
plus emissions for use over
lifetime. When calculating
emissions over time, disposal
excluded for devices not yet
reaching their end of life.
Apple Environmental
Reports for different
models; Szilágyi (2013);
Ercan et al. (2016)
Material recovery
rate
Set to 90% for all materials. Conservative and generalised
estimate based on minimum
standards, CENELEC
Standard 50625-5
Generally >90%
Interviews with recyclers
Average content of
cobalt
8.35 g Average between different
sources, in grams per device
Manhart et al. (2016);
Merchant (2017); Samsung
(2018); Interviews with
recyclers
Average content of
gold
0.03 g Average between different
sources, in grams per device
Manhart et al. (2016);
Merchant (2017);
Interviews with recyclers

57
Average content of
silver
0.21 g Average between different
sources, in grams per device
Manhart et al. (2016);
Merchant (2017);
Interviews with recyclers
Average content of
copper
14.26 g Average between different
sources, in grams per device
Manhart et al. (2016);
Merchant (2017); Samsung
(2018); Interviews with
recyclers
Average content of
lithium
0.93 g Average between different
sources, in grams per device
Manhart et al. (2016);
Merchant (2017);
Interviews with recyclers
Average content of
other materials
Aluminium: 31.89 g
Plastic: 33.74 g
Indium: 0.01 g
Steel: 14.02 g
Magnesium: 3.26 g
Tin: 0.10 g
Tungsten: 0.30 g
Tantalum: 0.02 g
Others: 57.23 g
Average between different
sources, in grams per device
Manhart et al. (2016);
Merchant (2017);
Interviews with recyclers
Price of cobalt 48.64 €/kg Unit and currency converted London Metal Exchange
(2019)
Price of lithium 11.09 €/kg Unit and currency converted Metalary (2019)
Price of gold 35,980.75 €/kg Unit and currency converted Bloomberg (2019a)
Price of silver 443.47 €/kg Unit and currency converted Bloomberg (2019b)
Price of copper 5.67 €/kg Unit and currency converted Bloomberg (2019d)
Price of palladium 34,119.64 €/kg Unit and currency converted Bloomberg (2019c)
Employment in
refurbishment
8 per 10,000 devices
refurbished
Jobs per devices refurbished Interviews with
refurbishment businesses
Average weight of
mobile phone
164 grams Average of various models,
weighted by market share
Apple.com and Samsung
from techradar.com

58
Annex 2: List of experts interviewed51
Aurubis Andreas Nolte, Integrated Managementsystems, Security&Risk,
Public Recycling Affairs
ECOS Chloé Fayole, Programme & Strategy Director
Ericsson Pernilla Bergmark, Master Researcher - Sustainability
Fairphone Miquel Ballester Salvà, Circular Innovation Lead
Green Alliance Dustin Benton, Policy director
Libby Peake, Senior policy adviser
industriAll Europe Laurent Zibell, Policy Advisor
Joint Research Centre,
European Commission
Felice Alfieri, Scientific Officer,
Mauro Cordella, Scientific Officer
Javier Sanfelix, Scientific Officer
Other Thierry Libaert, Member of the EESC
Nicolas Zibell, ex-CEO, TCL communication
Recupel Claude Detremmerie, Project Manager
Remade Marie-Laetitia Gourdin, Director of Public Affairs
Ludovic Saint Aroman, Director of Communication and
Marketing
Thomas Bruneau de la Salle, Director of Legal Affairs
Stephane Mermillod, Director of Business Development
Responsible Business
Alliance
Daniel Reid, Environmental Program Manager
Samsung Electronics Steven Clayton, Regulatory Affairs Manager
Sandeep Rana, European Sustainability Manager
Umicore Jonas De Schaepmeester, Sustainability and Closed Loop
Manager
Universitat Autònoma
de Barcelona
Laura Talens Peiró, PhD, Beatriu de Pinós post-doc at Sostenipra,
Institut de Ciència i Tecnologia Ambientals (ICTA)
51 Two additional experts were interviewed but remain anonymous. Note that consultations were carried out collectively per organisation.

Rue Belliard/Belliardstraat 991040 Bruxelles/Brussel
BELGIQUE/BELGIË
Published by: “Visits and Publications” UnitEESC-2019-64-EN
www.eesc.europa.eu
© European Union, 2019Reproduction is authorised provided the source is acknowledged.
For any use or reproduction of the cover page photo permission must be sought directly from the copyright holder.
European Economic and Social Committee
ENREG.NO. BE - BXL - 27
PrintQE-03-19-510-EN-C
ISBN 978-92-830-4565-6doi:10.2864/08334
OnlineQE-03-19-510-EN-N
ISBN 978-92-830-4572-4doi:10.2864/775626