Embed Size (px)
Citation preview
Title: Weather Definition, Instruments, and Data Collection
( Meteorology )
Grade Level(s): 6-8
Introduction: Meteorology is the science that deals with the atmosphere and related phenomena.Research areas include weather, weather forecasting, and atmospheric composition. Weather is defined asthe state of the atmosphere at a given time and place, with respect to variables such as temperature, mois-ture, wind velocity, and barometric pressure. There is a wide variety of technological instruments andobserving systems that measure weather. These include anemometers for measuring pressure, barometersfor measuring relative humidity, scintillometers which measure temperature gradients, thermometers whichmeasure temperature, and rain gauges which measure precipitation.
Learner Objectives:
• The student will be able to develop a definition for weather.
• The student will be able use and identify some instruments which are used for recordingweather.
• The student will be able to use weather instruments to keep a daily record of the minimum/maximum temperature, relative humidity, wind speed and direction, barometric pressure, pre-cipitation, and cloud cover.
Sunshine State Standards: Science: SC.H.1.3.5. Math: MA.E.1.3.1. MA.B.4.3.1.
Competency-Based Curriculum: Science: Sci.M/J1 I-3-A ; Math: M/J1 V-2-A, M/J3 II-16-D
Materials:
Overhead projectorInstruments for measuring weather (thermometer, barometer, sling psychrometer, rain gauge,wind meter, and a compass).Weather Data Log
I-B-1
Activity Procedures:
1. Have the students share one fact that they know about weather.
2. Teacher lists these facts on chalkboard. Students should make reference to temperature and thesun, precipitation (snow and rain), humidity, wind, and clouds.
3. From the brainstorm activity, the teacher should guide the students toward a definition ofweather that describes change with time and location, and several things that are changing suchas temperature, precipitation, air pressure, and wind.
4. Students should also describe where weather takes place.
5. The teacher should reinforce the definition by asking several questions:
A. From day to night from winter to summer, how does weather change with time and whattype(s) of change takes place?
B. From Florida to Alaska to the deserts in Arizona, how does weather change with location andwhat type(s) of change(s) takes place?
6. Have the students write down a definition of weather in their notebook. Have them provideseveral examples.
7. After a definition is established, the teacher should discuss the instruments used to measureweather. These include a min./max. thermometer, sling psychrometer, wind meter, somethingfor measuring wind direction, barometer, and rain gauge. The teacher should show the studentshow to use these instruments and how to report the data. Data should be collected duringpassing periods or during lunchtime. Data should be listed on the “Weather Data Log’.
8. Students should take turns working in groups of two or three to collect weather data. Groups canbe decided at the end of the class each day.
Student Assessment:
Allow students to construct a graphic organizer (concept map) of weather terms and add any new termsthat a student did not include.
Activity Extensions:
1. Help students appreciate the role computers play in weather forecasting by explaining how weatherdata are gathered and analyzed. (Technology Integration)
I-B-2
Home Learning Activity:
1. Let students discover how meteorologists predict the weather by having them use a newspaperweather report to compare predicted weather with the actual weather of Miami.
Vocabulary: meteorology, weather, weather forecasting, atmospheric composition, barometricpressure, anemometer, barometer, scintillometer, thermometer, rain gauges
References/Related Links:
http://ww2010.atmos.uiuc.edu/(Gh)/guides/mtr/fcst/home.rxmlhttp://www.aanderaa.no/OceanDataCollect.htmhttp://www.meteo-technology.com/humidity.htmhttp://www.noaa.gov/
I-B-3
Weather Definition
Reading Passage
Weather, is the state of the atmosphere at a particular time and place. The elements of weather includetemperature, humidity, cloudiness, precipitation, wind, and pressure. These elements are organized intovarious weather systems, such as monsoons, areas of high and low pressure, thunderstorms, and tornadoes.All weather systems have well defined cycles and structural features, and are governed by the laws of heatand motion. These conditions are studied in meteorology, the science of weather and weather forecasting.
Weather differs from climate, which is the weather that a particular region experiences over a longperiod of time.Climate includes the averages and variations of all weather elements. Meteorologists havedeveloped several sophisticated instruments that measure multiple physical characteristics of the air simul-taneously and at more than one location. The most important of these are Doppler radar, and weathersatellites.
Weather forecasts provide critical information regarding the weather. It is important that weather fore-casts be as accurate as possible because many people depend upon them.Besides forecasting, data collectionis particularly crucial for oceanographers.
I-B-4
Weather Definition
FCAT Questions
Directions: Read the passage, then answer the questions. Answer multiple choice questions by circlingthe letter of the answer that you select. Write your answer to the “Read, Think, and Explain” question onthe lines provided.
1. Elements of weather do not include which of the following:
A. PrecipitationB. HumidityC. WindD. Solar energy
Answer: D
2. Thermometers measure
A. The amount of moisture in the atmosphereB. The amount of heat in the atmosphereC. The amount of wind in the atmosphereD. The amount of pressure in the atmosphere
Answer: B
3. Weather instruments include all of the following except ?
A. Doppler radarB. HydrometerC. SpirometerD. Sphygmomanometer
Answer: A
I-B-5
4. Explain the difference between weather and climate.
Title: Under the Silver Lining
(Cloud Types)
Grade Level(s): 6-8
Introduction: The presence of clouds in the sky is one type of signal to meteorologists that weatherchanges are imminent. Predicting the weather requires the understanding of the different types of clouds.
Clouds form when solar heating of the earth’s surface warms the air near the ground. This air begins torise and it expands and cools. Water vapor then condenses on small dust particles suspended in the air andthese combine to form clouds. Clouds are also formed when large masses of air collide. In both cases, thetype of cloud created is determined by how fast the air rises. The following types of clouds may form:
Stratus - from air that is forced up slowly
Cumulus - from air that is forced up rapidly and therefore rises higher.
Clouds are also grouped by familial characteristics. The lowest clouds are stratus clouds as they are flatand layered. Stratus clouds are found in also middle altitudes. Cirrus clouds are made of ice crystals and arehigh and wispy. They can be divided into cirrostratus and cirrocumulus clouds. The former are made of acontinuous layer of ice crystals, whereas, the latter is made of this puffs of the ice crystals. Cumulus cloudsare thick, flat, and low regardless of how high the clouds themselves reach. Smaller, lumpy patches ofclouds that form at higher altitudes are altocumulus clouds. Nimbus clouds are clouds that produce pre-cipitation. Thus, a nimbostratus cloud is a stratus cloud with precipitation and a cumulonimbus cloud isa cumulus cloud with precipitation. Clouds, in many cases, foreshadow incoming weather and assist inforecasting.
Learner Objectives:
• The student will be able to identify different types of clouds.
• The student will be able to make a prediction of daily weather changes.
Sunshine State Standards : Math: MA.E.1.3.1. Science: SC.A.1.3.5.
Competency Based Curriculum: Math: M/J-1-V-2-A, M/J-3-VI-2-A; Science: M/J-1-I-2-A
I-B-6
Materials:
Cloud chartVocabulary list
Activity Procedures:
1. Take class outside (if possible) and observe the atmospheric conditions.
2. Discuss cloud types and formations with students prior to content instructions. (Assess priorknowledge).
3. Discuss types of clouds orally with students. Also discuss the weather changes that clouds oftensignal.
4. Have students predict weather changes for the current day.
5. Distribute and discuss the cloud chart and the vocabulary list.
6. Establish data collection methods (graph or chart) and assign assessment activity.
Student Assessment/Home Learning Activity:
Students should monitor weather conditions daily for one week. Data should be graphed or chartedand illustrated. Students should make predictions based on cloud types and formations for each day. Recordboth predictions and the actual outcomes.
Activity Extensions:
Divide the class into cooperative groups and have the students create and produce a weather report.
Home Learning Activity:
Have students create a concept map including sketches of each type of cloud.
Vocabulary: stratus, cumulus, altostratus, cirrus, cirrostratus, cirrocumulus, altocumulus, nimbus,precipitation, cumulonimbus, nimbostratus, altitude
References/Related Links:
http://www.ncdc.noaa.gov/ol/climate/globalwarming.htmlhttp://ww2010.atmos.uiuc.edu/(Gh)/guides/mtr/cld/home.rxmlftp://www.gsfc.nasa.gov/pub/PAO/Releases/2001/01-05.htm
I-B-7
Under the Silver Lining
Reading Passage
Although sportsmen may have better luck on cloudy or windy days, being out in a boat in bad weathercan be very risky. High winds, rough water and thunderstorms can suddenly turn a pleasant outing into afrightening experience. When someone goes out on a boat, they should know the weather forecast, andhave a way to receive warnings and weather advisories while underway. Even with today’s high-tech weatherforecasts and radios, there is no substitute for the time-honored practice of scanning the horizon for changesin the wind, waves, water, and sky that signal developing weather patterns.
Thunderstorms are created when warm, moist air rises, cools and condenses. It swells into mounds ofthick, cumulous clouds that quickly darken into the towering ominous-looking cumulonimbus cloudscharacteristic of thunderstorms. Consider the formation of this thick, dark cloud an unmistakable thun-derstorm warning, and head immediately for a safe anchorage. The transition from a small cloud into aturbulent, electrified storm front can occur in as little as 30 minutes. Strong, gusty winds and heavy rainswith thunder and lightning will soon follow. The sharper, darker and lower the front edge of the cloud, themore severe the storm. The anvil-shaped top of the storm cloud points in the direction that the storm istraveling.
When warm ground air rises and meets colder air, it condenses and forms water droplets. Condensationreleases energy, which charges the atmosphere, and when the dissimilar charge between the negativelycharged surface air and the positively charged highest parts of the cloud gets large enough, an explosion oflightning is created, with up to 30,000,000 volts of electricity.
I-B-8
Under the Silver Lining
FCAT Questions
Directions: Read the passage, then answer all the questions below. Answer multiple choice questionsby circling the letter of the answer that you selected. Write your answer to the “Read, Think, and Explain”question on the lines provided.
1. How do thunderstorms form?
A. Mixing of warm and cool air.B. Warm air rising, cooling and condensing.C. Combination of cumulous and cumulonimbus clouds.D. Moist air rises, warms and condenses.
Answer: B
2. Thunderstorms can occur as soon as how much time?
A. 15 minutesB. 30 minutesC. 15 secondsD. 30 seconds
Answer: B
3. Which one of the following patterns can signal developing rough weather?
A. CloudsB. TemperatureC. HumidityD. Breeze
Answer: A
I-B-9
4. Explain the formation of lightning.
Title: Gone With The Wind
(Meteorology)
Grade Level(s): 6-8
Introduction: The ability to safely navigate a boat depends upon the prevailing winds and currents.Keeping a course maybe be easier on a calm day during a slack tidal current, however, the boat may becomedifficult to maneuver when coping with stiff crosswinds or crosscurrents.
Winds may be classified into four major types: the prevailing winds, the seasonal winds, the localwinds, and the cyclonic and anticyclonic winds. The Beaufort wind scale is used by mariners and meteo-rologists to indicate wind velocity.
Learner Objective(s):
• The student will give an explanation on what causes the wind.
• The student will be able to explain what is weather’s driving force.
Sunshine State Standards: Science: SC.B.1.3.5 SC.B.1.3.6.
Competency-Based Curriculum: Science: Sci.M/J3 IV-2-A
Materials:
PinwheelLamp with incandescent light bulb(approximate time for demonstration should be 15 minutes).
Activity Procedures:
1. The teacher should start with the question “What drives weather?” Ask: “What makes the windblow?” Guide the students toward the sun as the driving force for weather.
2. After recalling that it was the wind that helped their kite fly, ask “What is Wind?” Remind thestudents how hard it can be to hold on to a kite against the force of a strong wind. Stress thateven though air is an invisible gas, it still consists of molecules and their movement, especially athigh speeds, can exert a lot of force.
I-B-10
Activity Procedures (Cont’d):
3. Review that it is the difference in the air pressure that causes air movement.
4. Air is a fluid that tends to move from an area of high pressure to an area of low pressure. Stu-dents should understand that wind is the movement of air from an area of high pressure to anarea of low pressure. Stress that all winds are caused by differences in air pressure.
5. The fact that air pressure differences are caused by the uneven heating of the atmosphere is aconcept that all students must understand.
6. Demonstrate how differences in temperature cause air movement by having the students con-struct a pinwheel and placing it by a light bulb.
7. The light bulb causes heating of the air around the lamp.
8. The pinwheel moves because the air close to it is heated. Ask the students “Why did the pin-wheel move?”
Student Assessment:
Allow students to review each others answers to the questions in the lesson. In a cooperative manner,and using alternative assessment measures, students can serve as peer assessors.
Activity Extensions:
Have students trace the global winds on a map and then use the globe to determine which global windbelt flows over or across Miami. (Geography)
Home Learning Activity:
Have students address the question of how global winds influenced sea travel in the past.
Vocabulary: prevailing winds, local winds, seasonal winds, cyclonic wind, and anticyclonic winds.
References/Related Links:
http://www.ruf.rice.edu/~feegi/weather.html/http://ww2010.atmos.uiuc.edu/(Gh)/guides/mtr/fw/sea/htg.rxmlhttp://www.sspboatsite.com
I-B-11
Gone With The Wind
Reading Passage
Wind is air in motion. It is caused by horizontal variations in air pressure. The greater the differencein air pressure between any two places at the same altitude, the stronger the wind will be. The winddirection is the direction from which the wind is blowing. A north wind blows from the north and a southwind blows from the south. The prevailing wind is the wind direction most often observed during a giventime period. Wind speed is the rate at which the air moves past a stationary point.
Winds and storms made the South Atlantic impossible to sail. All ocean sailors, before 1400, dependedupon highly predictable seasonal winds and currents. These winds , also known as “trade winds,” werenamed such because when they blew, the traders sailed into, or out of, harbors. Trade winds and currentswere the reason for regular long distance travel in the Pacific and Indian Oceans.
A variety of instruments measure the wind. A wind vane measures the wind direction. Most windvanes consists of a long arrow with a tail that moves freely on a vertical shaft. The arrow points into thewind and gives the wind direction. Anemometers measure wind speed. Most anemometers consist of threeor more cups that spin horizontally on a vertical point. The rate at which the cups rotate is related to thespeed of the wind.
I-B-12
Gone With The Wind
FCAT Questions
Directions: Read the passage, then answer the questions. Answer multiple choice questions by circlingthe letter of the answer that you select. Write your answer to the “Read, Think, and Explain” question onthe lines provided.
1. Winds are caused by:
A. Varying rates of gas flowB. AltitudeC. Horizontal variations in air pressureD. Differences in air pressure
Answer: C
2. What does a wind vane measure?
A. Wind directionB. Wind velocityC. Wind speedD. Wind pressure
Answer: A
3. The difference between air and wind is:
a. Directionb. Motionc. Temperatured. Density
Answer: B
I-B-13
4. How do sailors measure wind during oceanic expeditions?
Title: Precipitating Weather
(Meteorology)
Grade Level(s): 6-8
Introduction: There has probably been a small increase in global precipitation over land during thetwentieth century. When speaking of precipitation, cloud droplets are dew which forms on tiny dust andsalt crystals which are blown by the winds. These condensation particles are so minute that they can only beobserved under the electron microscope with a magnification of several thousand times. The most efficientparticles result from the evaporation of water from tiny droplets in the spray from the ocean. Precipitationhas increased over land in high latitudes of the northern hemisphere in conjunction with temperatureincreases. Precipitation has decreased after the 1960’s between the equator and about 35 degrees latitude,from Africa to Indonesia, as temperatures increased.
Learner Objectives:
• Students will be able to demonstrate the formation of clouds.
• Students will be able to differentiate between precipitation, evaporation and condensation.
• Students will be able to understand the phenomenon of global precipitation.
Sunshine State Standards: Science: SC.H.1.3.5, SC.A.1.3.5; Math: MA.B.3.3.1, MA.B.4.3.1.
Competency-Based Curriculum: Science : Sci.M/J1 I-3-A Math: M/J1 III-3-A, M/J3 II-13-C
Materials:
1. 1 liter of water2. Kettle3. Glass bowl with ice4. Pie tin5. Water colors 6. A few sheets of shiny paper
I-B-14
Activity Procedures:
1. Boil 1 liter of water in a pot ( to be used in the second section ).
2. Pass out two sheets of shiny paper, a cup of water and a set of water colors to each student.
3. Have the students dip their brushes into the yellow paint.
4. Have the students make many large yellow drops over one sheet of the shiny paper.
5. Rinse the brushes off and dip the brushes into the blue paint.
6. Make many blue drops between the yellow drops. Be sure that the students do not mix thecolors.
7. With a second sheet of shiny paper covering the desk, have the students lift their paper so that itis perpendicular to the desk and the drops start to run down the paper.
8. The drops should slide down the paper and mix with each other dripping off the bottom of thepaper as large green drops.
9. Ask students a series of questions such as:
A. What happened to the blue and yellow drops when you lifted your paper?
B. What happened to the paper flat on your desk?
C. Is there a new color on your paper?
D. If there is a new color what is that color?
E. How did the new color get there?
F. Were the drops which fell off the bottom of your paper the same size as the blue and yellowdrops?
10. The class should gather around a common work place where they can view the hot pot of boilingwater and the bowl of ice.
11. The teacher should hold the bowl of ice water over the pot of boiling water.
I-B-15
Activity Procedures (Cont’d):
12. Ask : What do you think will happen-to the bowl of ice? To the steam? To the bottom of thebowl?
13. Once the water is boiling, hold the bowl of ice over the steam.
14. Place a pie tin so that the water which drips from the bottom of the bowl will collect in the tin.
15. The class should observe and share what they observe happening. Some questions whichshould help are:
A. What do you see happening on the bottom of the bowl?
B. What do you see happening on the bottom of the pie tin?
C. How does the water get on the bowl?
D. Are the water drops on the side of the bowl the same size? Why?
E. Which drops are falling from the bowl? Why?
F. Which drops look like rain?
G. Which drops look like a cloud?
H. How are the big drops formed?
16. Explain that the small misty drops which have condensed onto the side of the bowl of icerepresents a cloud.The winds in a cloud blow the small drops around so that they collide withone another. During these collisions, some drops will combine with others making larger andlarger drops. When the drops become so large that the winds cannot keep them in the sky, thedrops fall as precipitation. This is similar to the large drops falling from the bottom of the bowl.
Vocabulary: global precipitation, condensation, evaporation
Student Assessment:
Allow the student to answer critical thinking skills questions assigned by the teacher:
A. Identify ten common types of clouds and list which of these produce precipitation
B. Stimulate student thought by asking the following questions:
1. What is rain?
2. How is rain made?
3. What are clouds made of?
I-B-16
Activity Extensions:
1. Allow students to construct a Venn Diagram which compares and contrasts five different typesof precipitation. (Language Arts)
Home Learning Activity:
Have students calculate the amount of rainfall in Miami for the hurricane season in inches and convertthem into metrics (cm.).
References/Related Links:
http://www.ncdc.noaa.gov/ol/climate/globalwarming.htmlhttp://ww2010.atmos.uiuc.edu/(Gh)/guides/mtr/cld/home.rxmlftp://www.gsfc.nasa.gov/pub/PAO/Releases/2001/01-05.htm
I-B-17
Precipitating Weather
Reading Passage
Precipitation is any form of water (either liquid or solid) that falls from the atmosphere and reaches theground, such as rain, snow, or hail. Changes in tropical precipitation patterns have noted a higher fre-quency of the El Niño phenomenon over the past twenty one years. When this event occurs, the world canexpect more months with unusually high, or low, precipitation with droughts more common than floodsover land areas. There has been a 1% increase of precipitation over land during the 20th century.
Snow is made up of transparent ice crystals formed around dust or other small particulates in theatmosphere when water vapor condenses at temperatures below the freezing point. Because of the infinitevariability of weather conditions, every crystal is unique in its precise configuration, and it is the largenumber of reflecting surfaces of the crystal that makes snow appear white.
Hail, another form of precipitation consisting of roughly spherical pellets of ice and snow, is usuallycombined in alternating layers. True hailstones occur only at the beginning of thunderstorms and neverwhen the ground temperature is below freezing. Often several hailstones freeze together into a large,shapeless, heavy mass of ice and snow.
Clouds are visible aggregates of tiny water droplets and/or ice crystals suspended in the atmosphere andcan exist in a variety of shapes and sizes. Some clouds are accompanied by precipitation; rain, snow, hail,sleet, even freezing rain.
I-B-18
Precipitating Weather
FCAT Questions
Directions: Read the passage, then answer the questions. Answer multiple choice questions by circlingthe letter of the answer that you select. Write your answer to the “Read, Think, and Explain” question onthe lines provided.
1. Changes in precipitation over the tropical Pacific are related to:
A. High latitudesB. Temperature increasesC. El NinoD. Global warming
Answer: C
2. Global precipitation over land during the 20th Century has changed by what amount?
A. 10% increaseB. 10% decreaseC. 1% decreaseD. 1% increase
Answer: D
3. Changes in precipitation are consistent with changes observed in:
A. Lake levelsB. Oceanic temperatureC. River currentsD. Cloud types
Answer: D
I-B-19
4. Discuss the differences between precipitation, evaporation, and condensation.
Title: Hurricane Warning
(Longitude, Latitude)
Grade Level(s): 6-8
Introduction: Hurricanes create a sense of wonder in students of any age. Hurricanes are powerfulstorms which measure 200-300 miles in diameter. The winds near the center of a hurricane blow at speedsat 74 miles per hour, or more. The eye of a hurricane measures about 20 miles in diameter. Wall cloudssurround the eye and the strongest winds and heaviest rain occur within these clouds. Hurricanes are areasof low pressure that form over oceans in tropical regions in either the North Atlantic Ocean or easternNorth Pacific Ocean. This interest level allows for an engaging method in which to teach longitude, lati-tude, and graphing. By tracking a fictitious hurricane through the Atlantic Ocean, these skills are addressedin an authentic and meaningful manner.
Learner Objectives:
• The student will be able to track a hurricane on a map using longitude and latitude.
• The student will be able to understand the phenomenon of hurricane formation.
Sunshine State Standards: Math: MA.E.1.3.1. Science: SC.D.1.3.3.
Competency Based Curriculum: Math: M/J-1-V-2-A, M/J-3-VI-2-A; Science: M/J-3-III-4-A
Materials:
Hurricane tracking mapActivity sheet
Activity Procedures:
1. Begin with a discussion on hurricanes emphasizing local history, basic storm information, andvocabulary.
2. Review coordinate graph skills.
I-B-20
Activity Procedures (Cont’d):
3. Discuss longitude and latitude using a hurricane tracking map.
4. Have a brief discussion involving the geography and population of the affected areas.
5. Give students the activity sheet and allow them to chart the hurricane, day by day, following thegiven coordinates.
Student Assessment:
Check student activity sheets for accuracy.
Activity Extensions:
Revisit hurricane path and issue the appropriate watches and warnings as the hurricane approaches thepopulated areas. (Remember that watches and warnings must be posted while people are awake and so thatpeople have sufficient time to evacuate.)
Home Learning Activity:
Create, name, and chart a hurricane as it moves through the Atlantic Ocean.
Vocabulary: hurricane, wall cloud, eye of the hurricane, latitude and longitude
References/Related Links:
http://ww.2010.atmos.uiuc.edu/(Gh)/guides/mtr/fw/sea/htg.rxmlhttp://noaa.gov/http://www.nhc.noaa.gov/
I-B-21
Hurricane Warning
FCAT Activity
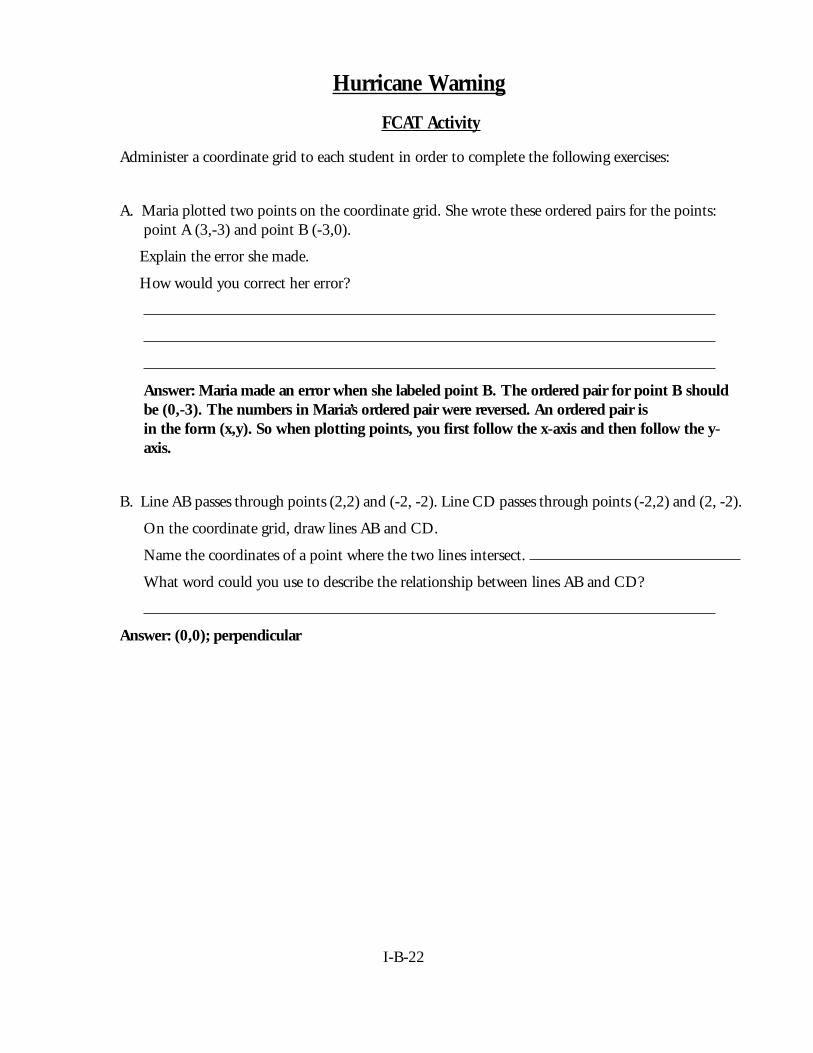
Administer a coordinate grid to each student in order to complete the following exercises:
A. Maria plotted two points on the coordinate grid. She wrote these ordered pairs for the points:point A (3,-3) and point B (-3,0).
Explain the error she made.
How would you correct her error?
Answer: Maria made an error when she labeled point B. The ordered pair for point B shouldbe (0,-3). The numbers in Maria’s ordered pair were reversed. An ordered pair isin the form (x,y). So when plotting points, you first follow the x-axis and then follow the y-axis.
B. Line AB passes through points (2,2) and (-2, -2). Line CD passes through points (-2,2) and (2, -2).
On the coordinate grid, draw lines AB and CD.
Name the coordinates of a point where the two lines intersect.
What word could you use to describe the relationship between lines AB and CD?
Answer: (0,0); perpendicular
I-B-22
HURRICANETRACKING MAP
GOES HERE
I-B-22
Title: Careful, Cyclones Can Blow You Away!
(Meteorology)
Grade(s): 6-8
Introduction: Most people associate twisters with tornadoes, but in fact tropical twisters come fromhurricanes. Hurricanes are what scientists call “strong tropical cyclones”. They are formed when large areasof the ocean become heated, and the air pressure over that area drops. This causes thunderstorms andstrong surface winds. Cyclones develop over tropical or sub-tropical waters (for example, in the Atlantic offthe coast of Africa, or in the Pacific near the equator). As they travel long distances gathering energy fromthe ocean, they are likely to be classified as strong tropical cyclones.
When the winds around a cyclone reach speeds of greater than 74 mph, the cyclone is called a “hurri-cane” ( in the Atlantic and Northeastern Pacific) or a “typhoon” ( in the Pacific). Each year on average, tencyclones develop over the Atlantic Ocean, Caribbean Sea, or Gulf of Mexico. About six of these will strengthento become hurricanes.
Learner Objective(s):
• The student will be able to list the atmospheric elements required for the development of cy-clones.
• The student will be able to chart and graph the path of tropical cyclones using daily wind speeds.
Sunshine State Standards: Math: MA.E.1.3.1. Science: SC.D.1.3.3.
Competency Based Curriculum: Math: M/J-1 - V-2-A; Science: M/J-3 - III-4-A
Materials:
Computer Internet AccessibilityWorld Map (10)Black markers
I-B-24
Activity Procedure(s):
1. Allow students to log onto the following web sites to learn how cyclones are formed and theelements needed to create these:
http://ww2010.atmos.uiuc.edu/(Gh)/guides/mtr/hurr/grow/home.rxml
http://www.discovery.com/stories/science/hurricanes/create.html
2. Allow students to log onto the following web site to learn about cyclonic intensities and howthey are categorized according to wind speed:
http://www.nhc.noaa.gov/aboutsshs.html
3. Allow students to log onto the following web site to explore past cyclones/hurricanes in theAtlantic Ocean:
http://ww2010.atmos.uiuc.edu/(Gh)/guides/mtr/hurr/hurtrack/index.html
4. Allow students to log onto the following web site to track cyclones/hurricanes through the activeseason. The tracking map and cyclonic information can be found at this site:
http://www.nhc.noaa.gov/
5. Encourage students to visit Tropical Storm Tracks via the internet and discover the areas listed tofind current tropical storms. On a world map, assist the students to locate the seven areas wheretropical storms occur and ask them to identify countries that might be affected by the storms ineach of those areas.
6. Allow students to determine, for each area, whether storms there are called typhoons, cyclones, orhurricanes.
7. Provide the students with markers to plot several sets of coordinates assigned to them and askthem to find the locations on the map. This will enhance knowledge of latitude and longitude.
Student Assessment:
Allow student to answer critical thinking skills questions assigned by the teacher.
a. Assuming that you are the mayor of an island in the direct path of a cyclone, how wouldyou decide whether or not to evacuate the residents?
b. Explain why some tropical storms are stronger than others and how are they categorizedaccording to wind speed.
Ask students to share responses from step #6 of the Activity Procedures.
I-B-25
Activity Extension(s):
1. Challenge students to work in small groups to create their own alphabetical list of names thatthey would attach to tropical storms if they were responsible for naming them (Language Arts).
2. Tropical storms cause millions of dollars in damages each year. Invite students to create a bargraph to show the cost of damage over the decades (1920s - present).
The students must research the data via the Internet using previous listed web sites (Math).
3. Encourage students to record weather information given for their area for a week (Science).
Home Learning Activity:
Print copies of the Florida Power Corporation’s Hurricane Kit Checklist and Storm Safety Check andsend a copy home with each student. Have students include a letter explaining specific concerns they haveregarding storms and encourage them to discuss both their concerns they have regarding storms. Ask themto discuss both their concerns and the checklists with their families.
Vocabulary: hurricanes, tropical cyclones, typhoons
References/Related Links:
http://www.nhc.noaa.gov/http://www.weather.gov.hk/informtc/class.htmhttp://www.discovery.com
I-B-26
Careful, Cyclones Can Blow You Away!
Reading Passage
The month of September is the peak month of the Atlantic Hurricane season. Most resident of theUnited States will never experience a tropical storm first hand. However, all will hear, at some time in theirlives, news reports about the destruction caused by one of these violent storms. Just what are cyclones? Howdo they form? Who do they affect? What damage do they cause? Hurricane is, in fact, just one name for thekind of storm scientists refer to as strong tropical cyclone. When the same kind of storm occurs in theeastern Pacific Ocean, it is called a typhoon. In the southwest Pacific Ocean and the Indian Ocean, thestorms are called cyclones.
Tropical cyclones develop when thunderstorms form over ocean water that has reached a temperatureof about 80 degrees Fahrenheit. The conditions required for tropical cyclones, or hurricanes, to developoccur most often in late summer and early fall. An average of nine named tropical storms develop each yearin the Atlantic basin, six of which become hurricanes. Of those, two are likely to become intense hurricanesand cause extensive damage.
Tropical cyclones are classified in accordance with the World Meteorological Organization’s recom-mendation by their maximum sustained wind speeds near the center. The National Hurricane Center(NHC) advisories contain the latest official analysis, forecast and warning information for Atlantic andeastern North Pacific tropical cyclones. To supplement these bulletins, the NHC generates graphical repre-sentations of some of this information. The graphics are designed to be used by emergency managers, themedia, and the public. These displays are visual representations of a portion of the information containedin the advisories.
I-B-27
Careful, Cyclones Can Blow You Away!
FCAT Questions
Directions: Read the passage, then answer all the questions below. Answer multiple-choice questionsby circling the letter of the answer that you select. Write your answer to the “Read, Think, and Explain”question on the lines provided.
1. Tropical storms that occur in the eastern Pacific Ocean are called:
A. CyclonesB. TyphoonsC. HurricanesD. Tempests
Answer: B
2. Strong tropical cyclones are also known as which one of the following?
A. HurricanesB. TyphoonsC. Tropical StormsD. Ocean Surges
Answer: A
3. Cyclones develop most frequently during what season of the year?
A. Early SummerB. Late SpringC. Early FallD. Late Winter
Answer: C
I-B-28
4. Describe specific responsibilities of the National Hurricane Center associated with tropicalcyclones.