Embed Size (px)
Citation preview
1
“Title”
Separation between silicon and aluminum powders
contained within pulverized scraped silicon-based waste
solar cells by flotation method
“Author name”
Sho Harada1, Md. Azhar Uddin1, Yoshiei Kato*1, Takanori Kawanishi2, Yoshiaki Hayashi2
“Author address”
1: Department of Material and Energy Science, Graduate School of Environmental and Life
Science, Okayama University, 1-1 Tsushima-naka, 3-chome, Kita-ku, Okayama 700-8530
Japan
2: Wet Process Division, Toho Kasei Co., LTD, 2-6 Nisshin-cho 1-chome, Fuchu, Tokyo
183-0036, Japan
“Corresponding author”
*Yoshiei Kato, E-mail address: [email protected]
2
Abstract:
There are few study examples on the separation of metals by floating method. In this
study, separation of silicon and aluminum, which are the main components of silicon-based
solar cell module, was carried out by floating method in order to purify silicon from waste
solar cell module. The selection of surfactant, control of electric charge, wettability of the
solid particles, surface tensions and bubble surface area are important for separation of solids
by floating method. Sodium dodecyl sulfate (SDS) can increase the hydrophobicity of
aluminum powder due to the difference of surface potential between silicon and aluminum.
SDS behaves as a collector of aluminum as well as a frothing agent to decrease the bubble
size. At a SDS concentration of 2 g/L and sample dipping time of 10 min and, 80.1 mass% of
aluminum was floated and separated, and the sedimentary silicon reached a purity of 90.7 %
from a mixture of 50 mass% aluminum and 50 mass% silicon. Finally, at a pH value of 7.0,
SDS concentration between 1.0 and 2.5 g/L and air flow rate of 2.5 L/min (STP) were
suitable experimental conditions to purify silicon from a mixture of silicon and aluminum by
flotation separation method.
Key words:
Flotation, Floating separation, Waste solar cell module, Silicon, Sodium dodecyl sulfate
3
“Main text”
1. Introduction
Photovoltaic power is one of the most promising renewable energy due to
sustainability and cleanness. The world capacity of photovoltaic installation has been
dramatically escalated since the 1970s and amounted to 402.5 GW in 2017 [1]. There
are variety kinds of solar cells [2], and the most prevailing crystalline silicon solar cell
modules are said to have a life-span of only 20 to 30 years and estimated to be sharply
scrapped hereafter [3,4]. They contain valuables such as silver, copper, silicon and tin in
addition to lead of hazardous element [5]. The recycling of valuables and proper
disposal of harmful agents are technically desired from a standpoint of sustainability
[6,7].
The WEEE (Waste Electrical and Electronic Equipment) directive on EU
(European Union) was revised in 2012 so as to make recycling and reusing of the waste
solar cell modules compulsory [8] and a guideline on recycling of the waste
photovoltaic facility was announced from the Japanese government in 2016 [3].
According to these policies, many studies on the recycling process of the solar cell
modules have been done by means of Ethylene Vinyl Acetate (EVA) dissolution using
organic solvent [9] and chemical etching with acid or alkali solution [10-15]. However,
4
these approaches are quite difficult to handle a large amount of waste solar cell modules
because of a volume of waste liquid treatment.
The pulverized powder of crystalline solar cells was focused in this study. Toho
Kasei Co., Ltd, reported this powder in the project entitled “Development project for
photovoltaic (PV) recycling technology” [16] carried out under New Energy and
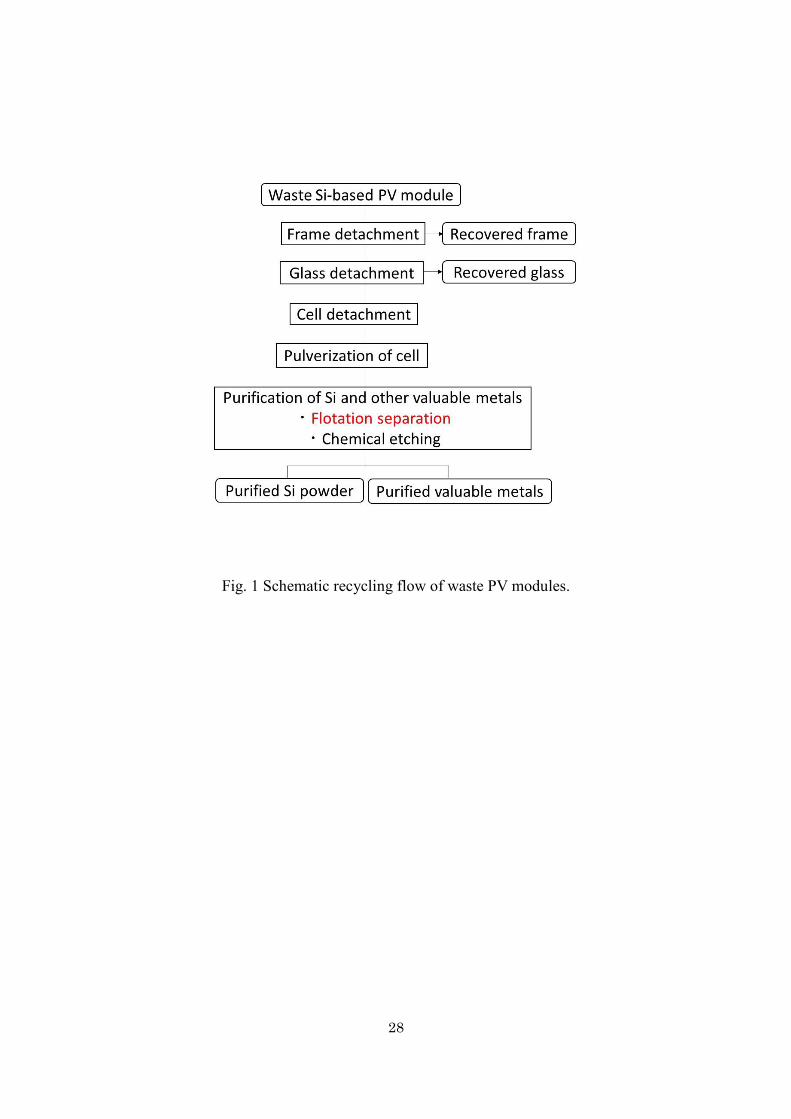
Industrial Technology Development Organization (NEDO) in Japan. Figure 1 shows the
schematic recycling flow of waste photovoltaic modules described in terms of the
project [16]. After separating frame, glass and cells from the module, the cell pieces
were pulverized by a grinding process. About 7 mass % of EVA and about 93 mass % of
inorganic element were involved in the cell powder. The typical chemical composition
of the inorganic element was as follows: silicon of 87.5 mass%, aluminum of 9.5
mass%, silver of 1.2 mass%, copper of 0.5 mass%, tin of 0.8 mass%, lead of 0.3 mass%.
Silicon powder and the other valuable metal products are obtained from purifying
pulverized cells below a given impurity concentration by flotation separation and/or
chemical etching [7]. In other words, a single or multiple flotations is selected and
sequential process of flotation and chemical etching is occasionally required for a
purification target.
As a new approach, we tried floating separation method to collect a high purity of
5
silicon. It has put into practical use for concentrating valuable components in a raw
mineral for a long period [17-21]. Recently, the recycling of waste plastics [22-25],
water treatment [26] and removal of fly ash [27] became the target for the floating
separation.
In this study, the direct separation between silicon and aluminum contained in
large amounts in silicon-based waste solar cell powders was investigated by the
flotation method. It needs use of multiple of flotation reagents as follows: a collector to
adsorb some materials selectively, a frother to control bubble size, a regulator for pH
adjustment etc. The selection of the collector is especially important because it affects
the separation target selectively and changes the surface property, that is, the collector
has polar and non-polar groups in a molecule and the polarity causes the hydrophobicity
of the target surface [28]. There are many researches [29] on the collector. For example,
the recoveries of precious metals from the polishing process of dental alloy [30,31] and
heavy metals from incinerated automobile shredder residuals [32]. However, the
collector affects metal oxide in the former and sulfurization on the metal surface in the
latter and the study of the collector which behaves directly on the metal surface was not
carried out. After selecting the proper collector, the suitable flotation conditions must be
found by changing controllable factors.
6
Thus, the objectives of this study are to select a preferable collector to separate
between silicon and aluminum, and to determine the optimal purification condition of
silicon by examining the effects of floating time, pH, collector concentration, dipping
time of sample in a collector solution before the separation experiment, contact angle of
sample, air flowrate and mass ratio of silicon to aluminum.
2. Experimental
2.1 Sample preparation
The mixture of aluminum (Fujifilm Wako Pure Chemical Corporation) and silicon
(Junsei Chemical Co., Ltd.) were used for the experiment. The purities of aluminum and
silicon were 99.0 and 99.5 %, respectively. The original flake silicon was pulverized by
a grinder mill (Osaka Chemical Co., Ltd, WB-1). Both powders were screened between
100 – 212 μm, pickled with 0.1 M nitrate acid and cleaned with ion-exchanged water.
Sodium dodecyl sulfate (SDS, FUJIFILM Wako Pure Chemical Corporation)
known as an anionic surfactant and dodecyltrimethylammonium bromide (DTAB,
Tokyo Chemical Industry Co., Ltd.) recognized as a cationic surfactant were examined
as a collector so as to compare the flotation ability between them. The purities of SDS
and DTAB were 98.5 and 98.0 %, respectively. Ion-exchanged water was used as a

7
solvent for floating separation method.
2.2 Preparation of sample-contained solution
A given amount of collector was dissolved with 500 mL of ion-exchanged water
and the pH value was adjusted by 0.1 M NaOH and HCl. Total 5.0 g of sample was
mixed with a given mass ratio, dipped in the prepared collector solution of 250 mL and
kept for a given hour in the room temperature. Another 250 mL of collector solution
was used as the compensating liquid during the flotation experiment as shown in the
next section.
2.3 Experimental method of floating separation
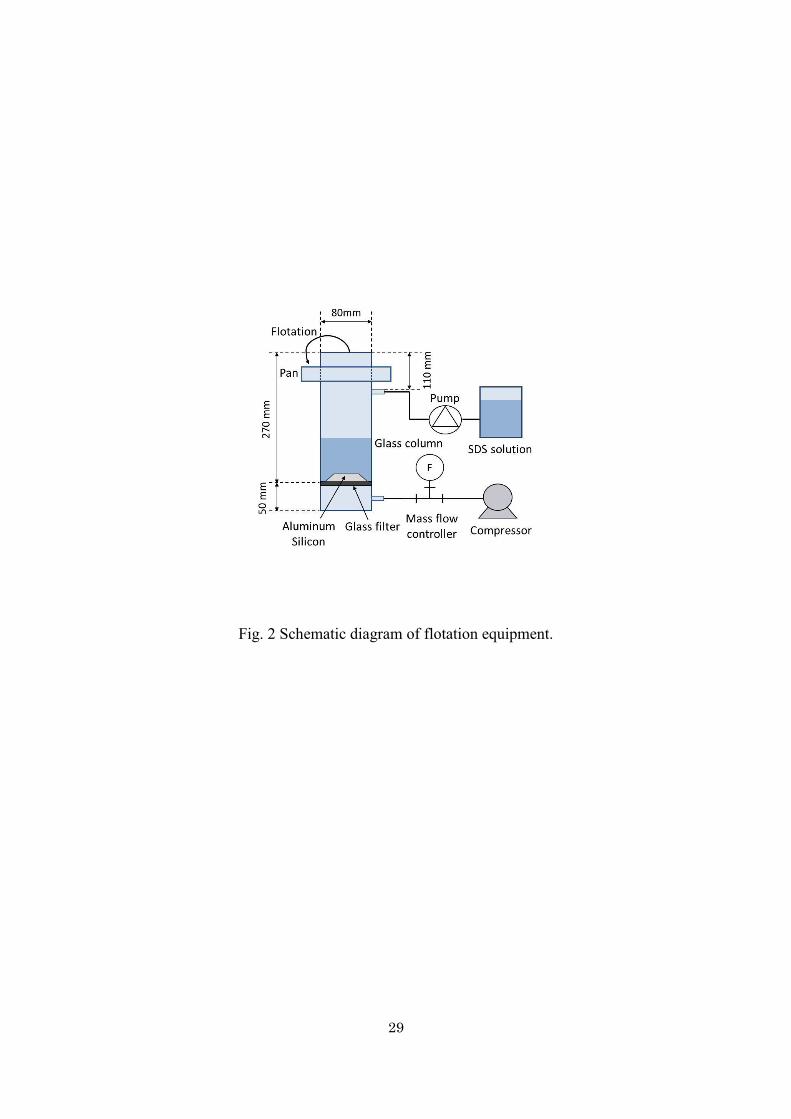
The schematic diagram of an experimental apparatus is shown in Fig. 2 The glass
cylinder of 0.08 m in inner diameter and 0.320 m in height was used as a separation part.
A porous glass filter was set at a lower part.
The suspending solution of 5.0 g sample and 250 mL ion-exchanged solution after
a given time of dipping was put into the vessel and air was blown through the porous
filter. The part of floating substance (Al + Si) adhered to the air bubbles and it was
removed from the system as the froth (air and floating substance). To compensate the
8
froth, another SDS solution was supplied from the upper part of the vessel as shown in
Fig. 2.
After the experiment, the froth and residual were collected respectively, and
washed by ion-exchanged water and dried in the room temperature. Each mass was
measured before and after the aluminum dissolution by HCl solution. The flotation
recovery ratio, Ri,j [%], and purity, Pi,j [%], of i-component (= silicon or aluminum) and
j-part (= float or sediment) in mixed sample was calculated from the following
equations.
Ri,j = 𝑀i,j
𝑀Si,0+𝑀Al,0 (1)
Pi,j = 𝑀i,j
𝑀Si,j+𝑀Al,j (2)
Here, MSi,0 and MAl,0 are the initial mass of silicon and aluminum, respectively, and Mi,j
is the mass of i-component and j-part after separation.
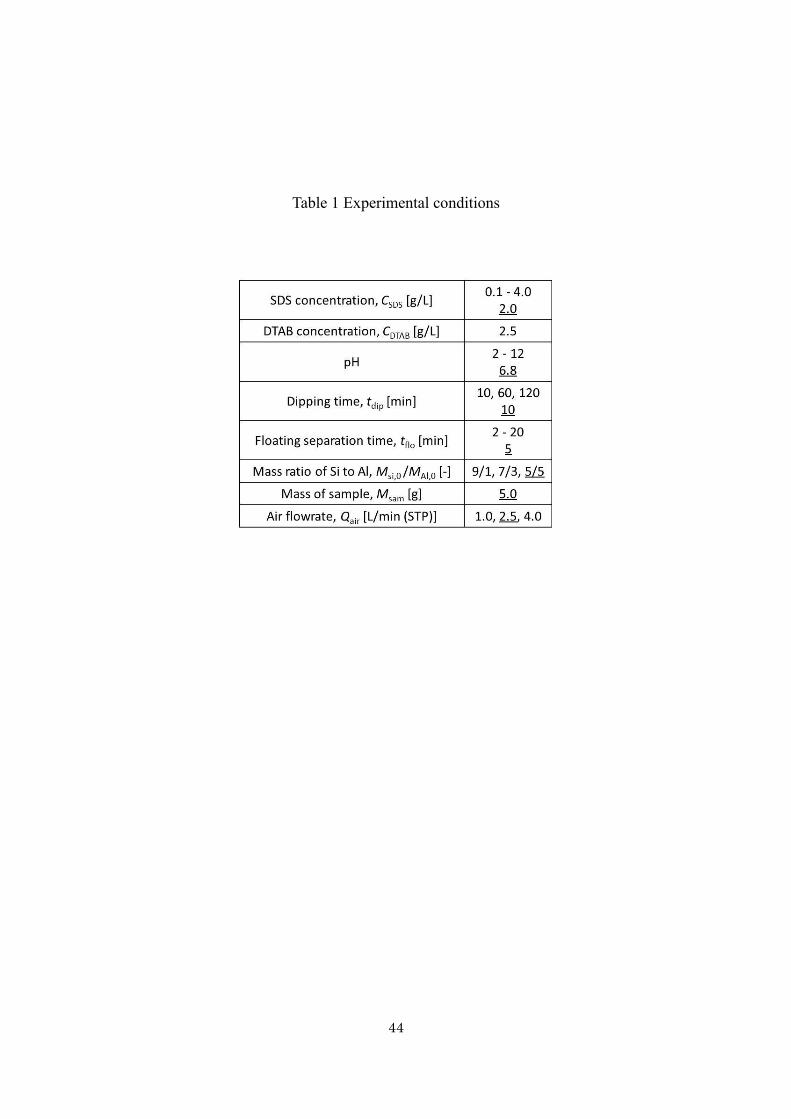
The experimental conditions are shown in Table 1. Concentrations of SDS, CSTB,
and DTAB, CDTAB, were varied to 0.1 – 4.0 and fixed to 2.5 [g/L], respectively, and pH
was between 2 and 12. The sample dipping time, tdip, in collector solution before the
floating separation treatment was changed to 10, 60 and 120 min, whereas the floating
separation time, tflo, 2 – 20 min. The mass ratio of silicon to aluminum, Msi,0/MAl,0, was
varied to 9/1, 7/3 and 5/5 and air flowrate, mass of sample, Qair, 1.0, 2.5 and 4.0 L/min
9
(STP) and mass of sample, Msam, was fixed to 5 g. Here, the underlined figures such as
pH of 6.8, tdip of 10 min, tflo of 5 min, Msi,0/MAl,0 of 5/5, Msam of 5.0 g, and Qair of 2.5
L/min (STP) indicate the standard conditions and they were kept constant except that
the effect of each factor is examined.
2.4 Characterization test
The surface electric charge of sample was evaluated by a device for the
measurement of ζ potential (Malvern Panalytical, Zetasizer Nano ZS). The wettability
of metal piece (1 cm x 1 cm) was used in place of metal powder and studied by a
contact angle measuring device (Kyowa Interface Science Co., Ltd, Drop Master 300).
3. Results and discussion
3.1 Selection of collector
The selected operating collector needs to be used to separate each material by
flotation method. In this study, ionic collectors were chosen to change the surface
properties of metal sample. They lead to an efficient separation with a single agent as
they also take a role as a frothing agent.
When the physical adsorption by electrostatic interaction is used to separate one

10
material from another by flotation method, the ionic collector has to be selected on the
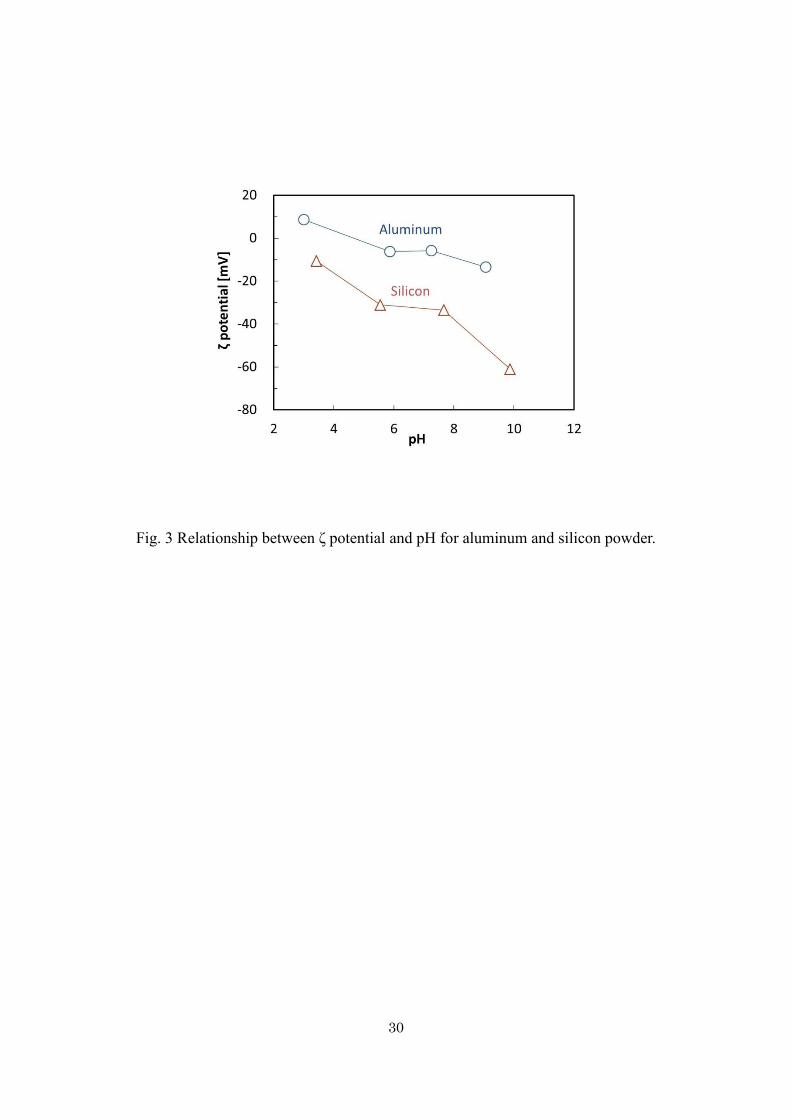
condition that each material has the opposite electric charge [33]. The relationship
between ζ potential and pH for silicon or aluminum powder is shown in Fig. 3. There
was neither DTAB nor SDS in the solution. The ζ potential of silicon powder indicated
the negative value in the total pH range, whereas that of aluminum became positive in
the acid and slightly negative in the neutral and alkaline range. That indicates either a
cationic DTAB or an anionic SDS collector can separate aluminum and silicon.
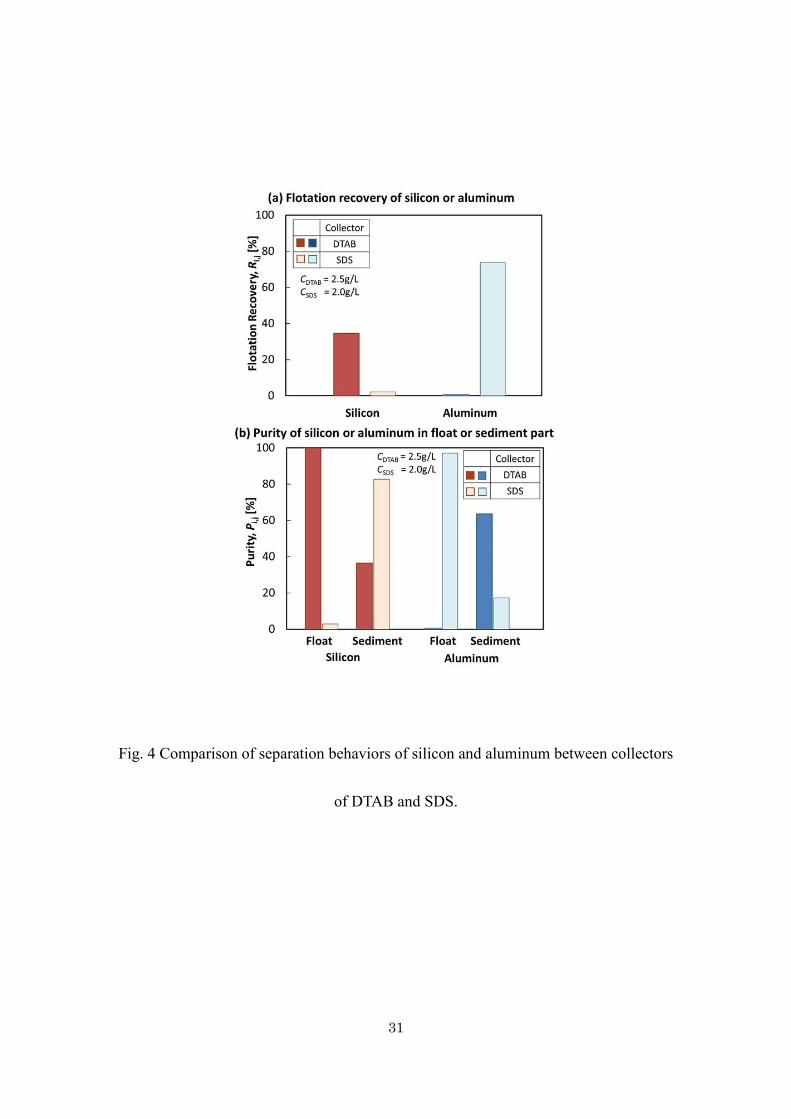
The effect of the collector on the separation of aluminum and silicon was
compared between cationic DTAB and anionic SDS solutions as shown in Fig. 4. DTAB
concentration was 2.5 g/l (8.1 x10⁻³ M) and SDS 2.0 g/L (7.0 x10⁻³ M), that is, both had
similar molar concentration values. In the case of DTAB, silicon floated on the surface
and its purity was 99 % from Fig. 4 (b), but the silicon recovery was only 38 % from
Fig. 4 (a). On the other hand, SDS floated aluminum on the surface and the silicon
recovery ratio and the silicon purity at the non-floating zone reached about 98 and 90 %,
respectively. From these results, the anionic SDS solution was examined further to
maximize the separation recovery and purity of silicon at the non-floating zone.
3.2 Effect of operating factors on floating separation
11
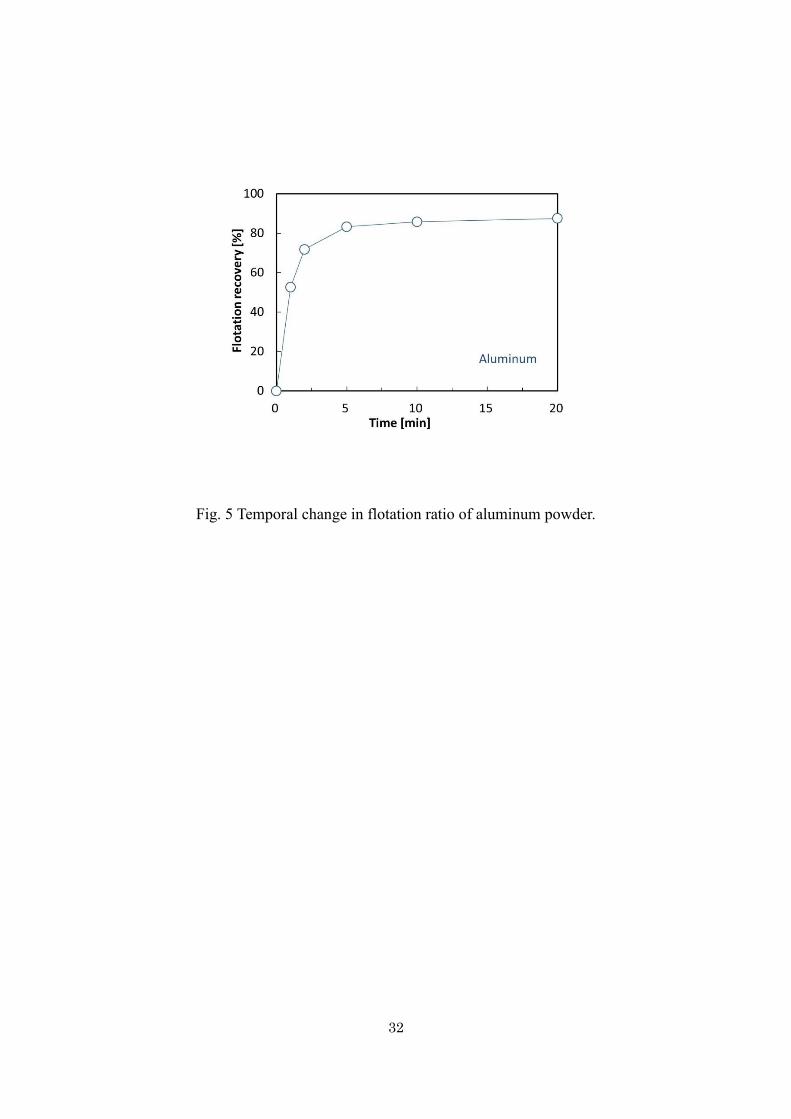
3.2.1 Change in floating ratio with time
The temporal change in flotation ratio of the sample without silicon is shown in
Fig. 5. The flotation recovery ratio became almost constant after 5 min. Thus, each
experiment was carried out for 5 min of floating separation in the latter section.
3.2.2 Effects of pH and surface potential
The surfactant concentration as a collector and surface charge characteristics affect
the separation conditions of different kind of material. As seen in Fig. 3, the pH value
changed the ζ potential of the powder. In this section, the effect of pH on the
separation behavior of the sample was explained under the conditions of SDS
concentration of 1.5 g/L, Si/Al mass ratio of 5/5 and air flowrate of 2.5 L/min (STP).
The relationships between flotation recovery ratio, purities of silicon and aluminum,
and pH value are shown in Fig. 6. Silicon almost remained on the bottom at any pH
ranges as indicated in Fig. 6 (a). An excess of 80 % of aluminum was floated and
recovered until the pH 9 and then decreased with the increasing pH. The hydrophobic
property of aluminum decreases with the increase in pH due to the larger negative
charge on the surface as seen in Fig. 3 and less extraction of SDS on the surface. This
caused the decrease in the flotation recover ratio of aluminum. Thus, the larger
negative charge or dissolution of the aluminum surface is considered to be the reason
12
of lower floating behavior at the high pH value. The subsequent experiment was
carried out in the neutral pH range.
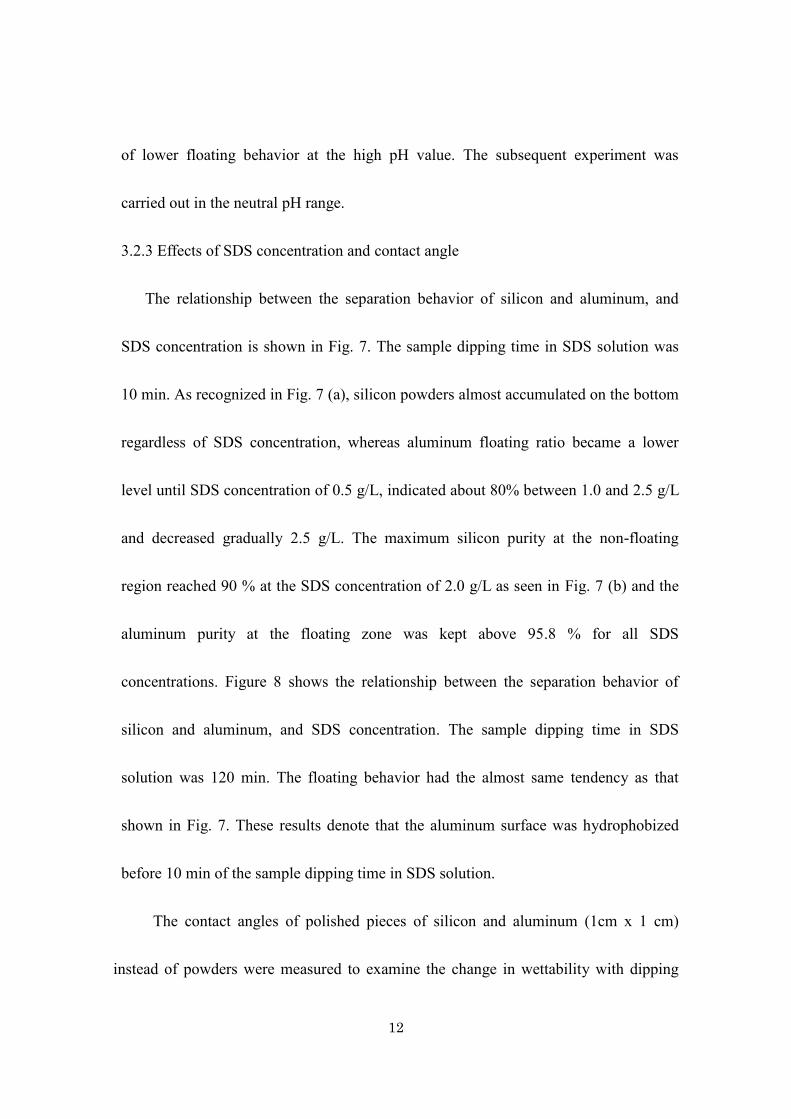
3.2.3 Effects of SDS concentration and contact angle
The relationship between the separation behavior of silicon and aluminum, and
SDS concentration is shown in Fig. 7. The sample dipping time in SDS solution was
10 min. As recognized in Fig. 7 (a), silicon powders almost accumulated on the bottom
regardless of SDS concentration, whereas aluminum floating ratio became a lower
level until SDS concentration of 0.5 g/L, indicated about 80% between 1.0 and 2.5 g/L
and decreased gradually 2.5 g/L. The maximum silicon purity at the non-floating
region reached 90 % at the SDS concentration of 2.0 g/L as seen in Fig. 7 (b) and the
aluminum purity at the floating zone was kept above 95.8 % for all SDS
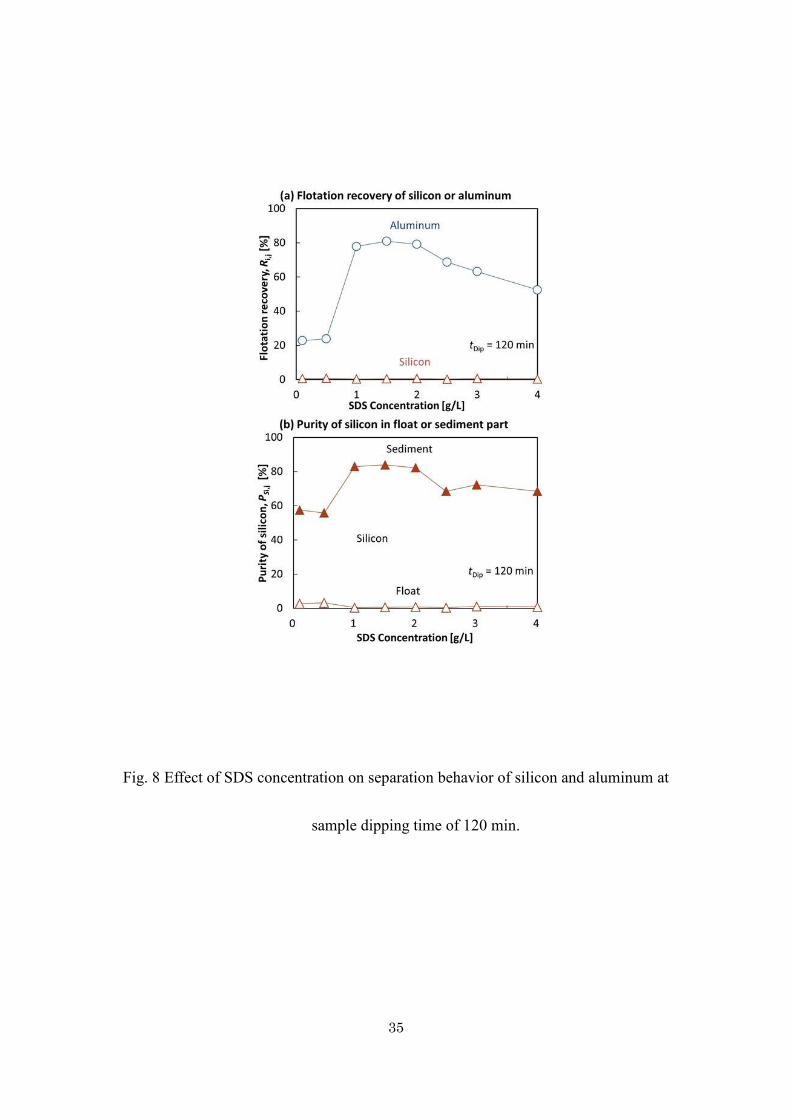
concentrations. Figure 8 shows the relationship between the separation behavior of
silicon and aluminum, and SDS concentration. The sample dipping time in SDS
solution was 120 min. The floating behavior had the almost same tendency as that
shown in Fig. 7. These results denote that the aluminum surface was hydrophobized
before 10 min of the sample dipping time in SDS solution.
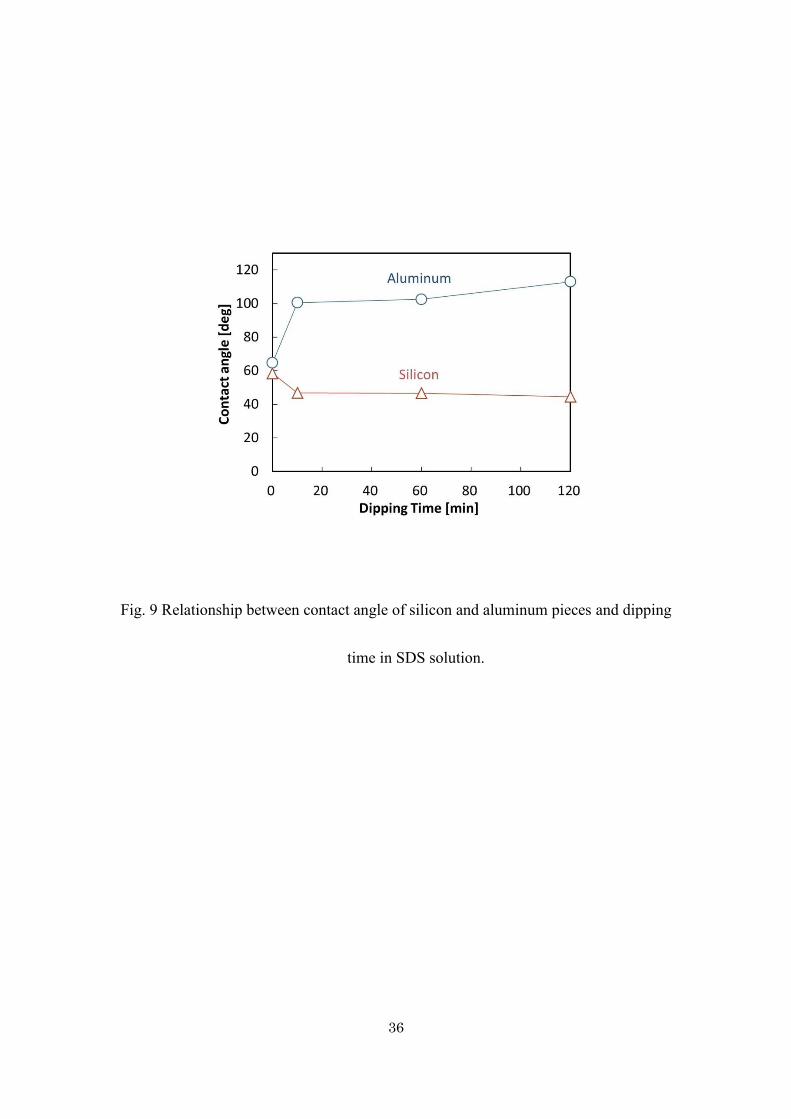
The contact angles of polished pieces of silicon and aluminum (1cm x 1 cm)
instead of powders were measured to examine the change in wettability with dipping
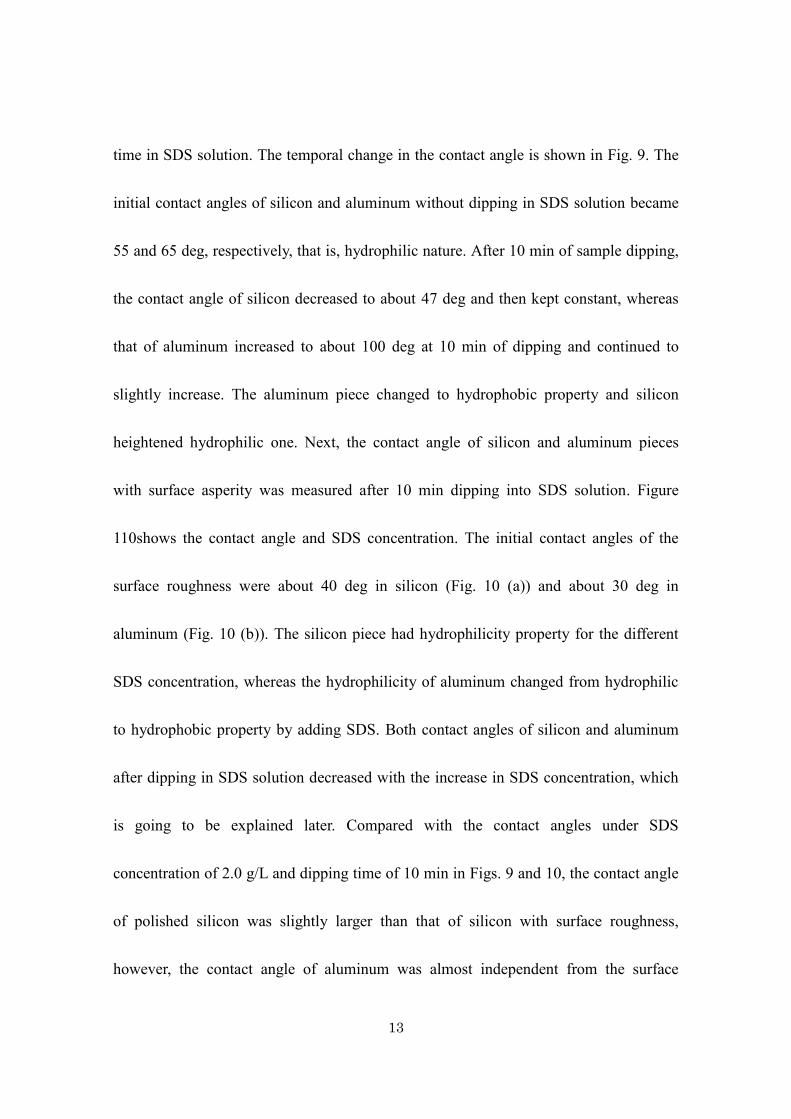
13
time in SDS solution. The temporal change in the contact angle is shown in Fig. 9. The
initial contact angles of silicon and aluminum without dipping in SDS solution became
55 and 65 deg, respectively, that is, hydrophilic nature. After 10 min of sample dipping,
the contact angle of silicon decreased to about 47 deg and then kept constant, whereas
that of aluminum increased to about 100 deg at 10 min of dipping and continued to
slightly increase. The aluminum piece changed to hydrophobic property and silicon
heightened hydrophilic one. Next, the contact angle of silicon and aluminum pieces
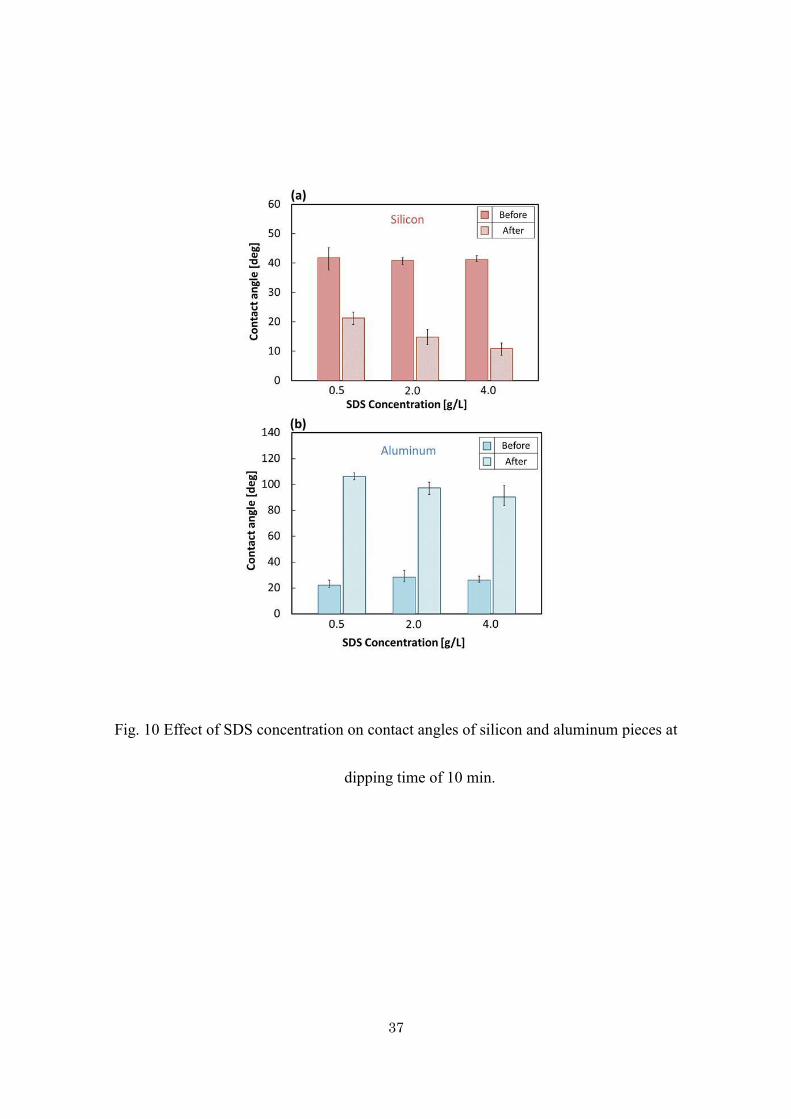
with surface asperity was measured after 10 min dipping into SDS solution. Figure
110shows the contact angle and SDS concentration. The initial contact angles of the
surface roughness were about 40 deg in silicon (Fig. 10 (a)) and about 30 deg in
aluminum (Fig. 10 (b)). The silicon piece had hydrophilicity property for the different
SDS concentration, whereas the hydrophilicity of aluminum changed from hydrophilic
to hydrophobic property by adding SDS. Both contact angles of silicon and aluminum
after dipping in SDS solution decreased with the increase in SDS concentration, which
is going to be explained later. Compared with the contact angles under SDS
concentration of 2.0 g/L and dipping time of 10 min in Figs. 9 and 10, the contact angle
of polished silicon was slightly larger than that of silicon with surface roughness,
however, the contact angle of aluminum was almost independent from the surface

14
roughness.
The relationship between ζ potential of silicon or aluminum powder and SDS
concentration is shown in Fig. 11. Here, the sample dipping time in SDS solution and
pH value were kept to 10 min and 8.0, respectively. The ζ potential of aluminum
decreased to the negative range with the increasing SDS concentration.
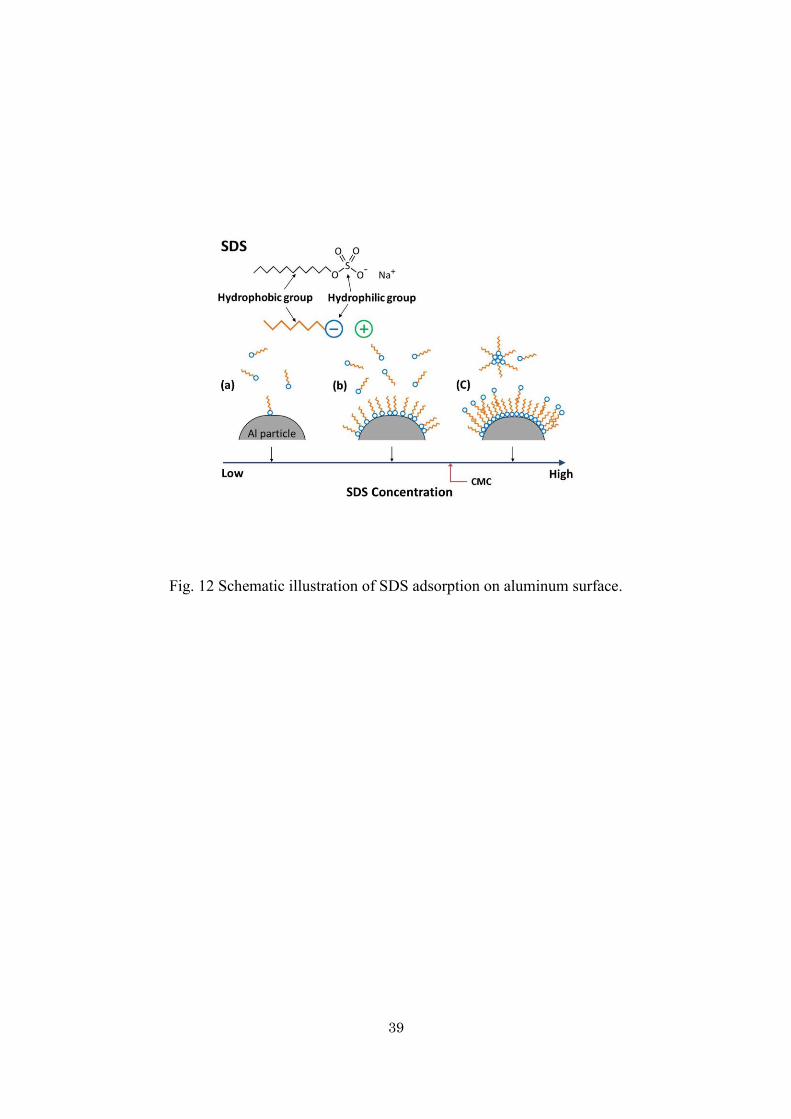
In previous studies on the adsorption of ionic surfactant on the powder [29,34,35],
Somasundaran proposed a reverse orientation model. The low concentration of anionic
surfactant ion adsorbs on the target with positive surface charge electrostatically (a), and
hemimicelle is formed with an increase in the surfactant concentration and the
hydrophilic group with negative charge adsorbs on the target (b). In this case, the target
behaves as a hydrophobic group because the hydrophobic hydrocarbon chain of the
surfactant faces the liquid side. The further increase in anionic surfactant begins to form
patches of surfactant bilayers called admicell whose hydrophilic group faces the liquid
due to the adsorption between hydrocarbon chains by action of mutual hydrophobic
property (c). The admicell generation occurs at the critical micelle concentration (CMC)
of the surfactant [36] and the CMC value of SDS was between 1.7 and 2.3 g/L [37].
Above the CMC, the separation target increases the hydrophilic group and decreases
contact angle. These explanations were schematically shown in Fig. 12. Here, (a), (b)
15
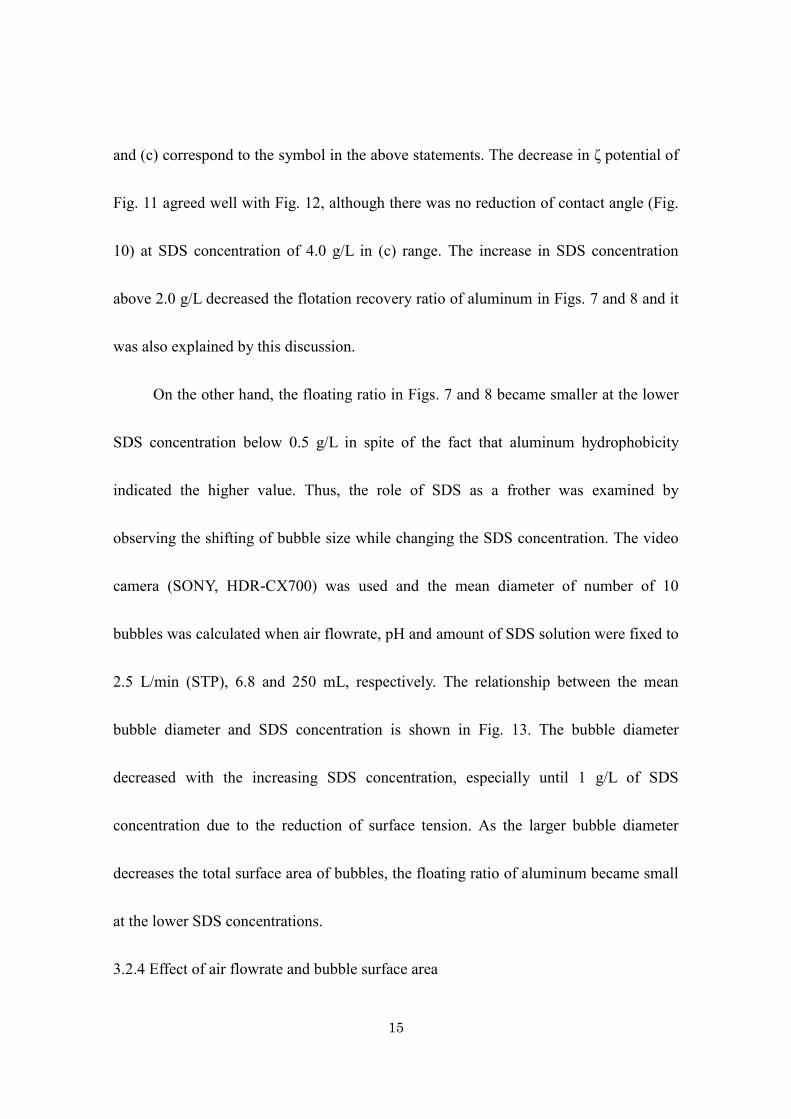
and (c) correspond to the symbol in the above statements. The decrease in ζ potential of
Fig. 11 agreed well with Fig. 12, although there was no reduction of contact angle (Fig.
10) at SDS concentration of 4.0 g/L in (c) range. The increase in SDS concentration
above 2.0 g/L decreased the flotation recovery ratio of aluminum in Figs. 7 and 8 and it
was also explained by this discussion.
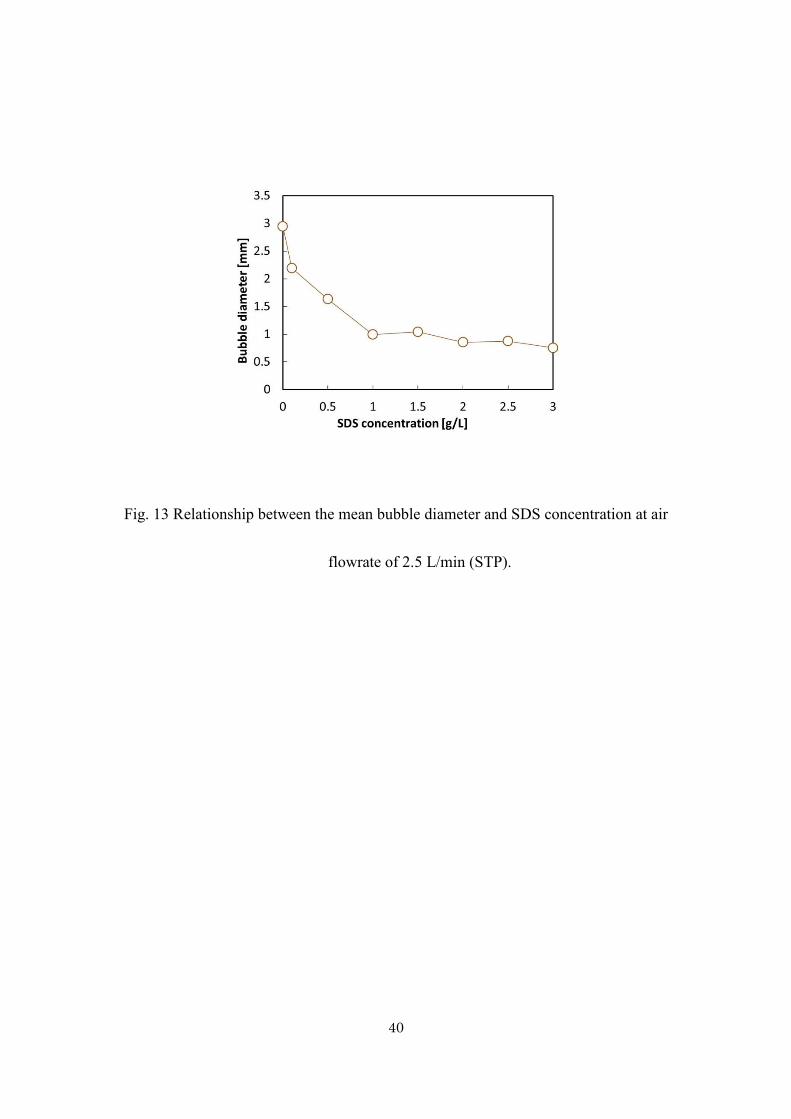
On the other hand, the floating ratio in Figs. 7 and 8 became smaller at the lower
SDS concentration below 0.5 g/L in spite of the fact that aluminum hydrophobicity
indicated the higher value. Thus, the role of SDS as a frother was examined by
observing the shifting of bubble size while changing the SDS concentration. The video
camera (SONY, HDR-CX700) was used and the mean diameter of number of 10
bubbles was calculated when air flowrate, pH and amount of SDS solution were fixed to
2.5 L/min (STP), 6.8 and 250 mL, respectively. The relationship between the mean
bubble diameter and SDS concentration is shown in Fig. 13. The bubble diameter
decreased with the increasing SDS concentration, especially until 1 g/L of SDS
concentration due to the reduction of surface tension. As the larger bubble diameter
decreases the total surface area of bubbles, the floating ratio of aluminum became small
at the lower SDS concentrations.
3.2.4 Effect of air flowrate and bubble surface area

16
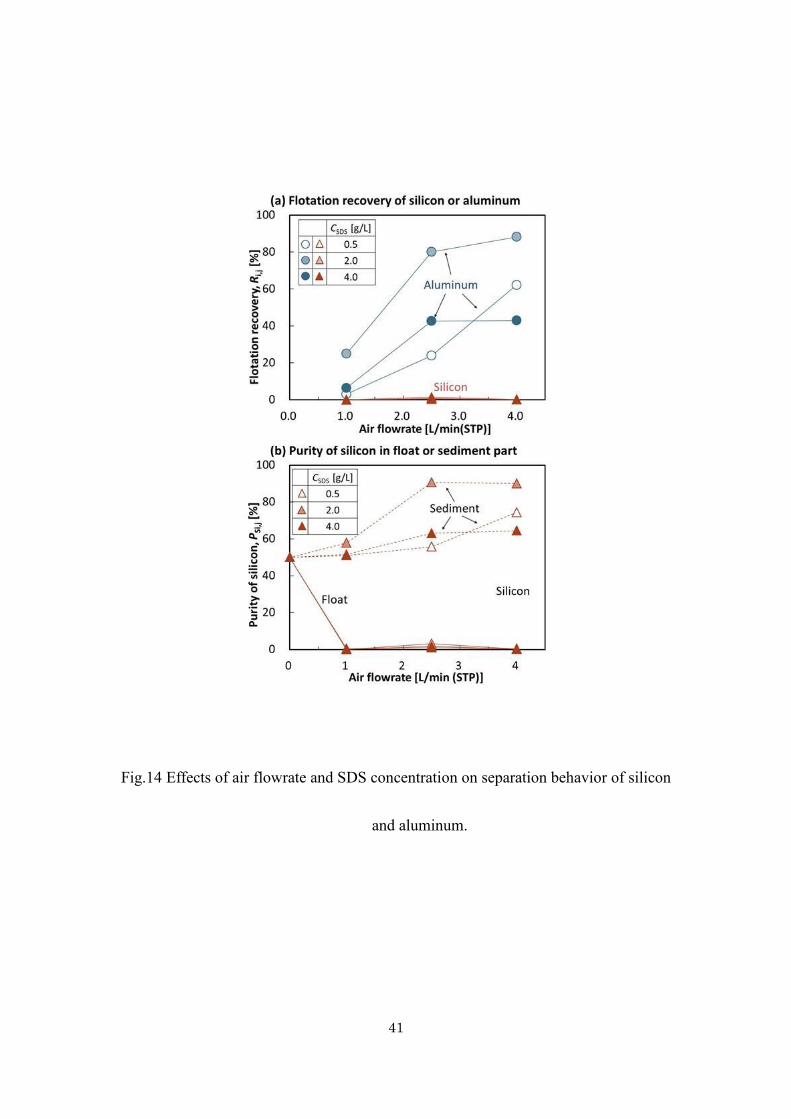
The effects of air flowrate and SDS concentration on the flotation separation
behavior are shown in Fig. 14. The flotation recovery ratio of aluminum and
sedimentary silicon purity of sediment increased with the increase of air flowrate and
reached the highest values at SDS concentration of 2.0 g/L for all air flowrate. However,
compared with air flowrate between 2.5 and 4.0 L/min (STP), their increases became
moderate or plateau, which meant 2.5 L/min (STP) was sufficient for the separation
between silicon and aluminum. Silicon did not float for any air flowrate and SDS
concentration ranges.
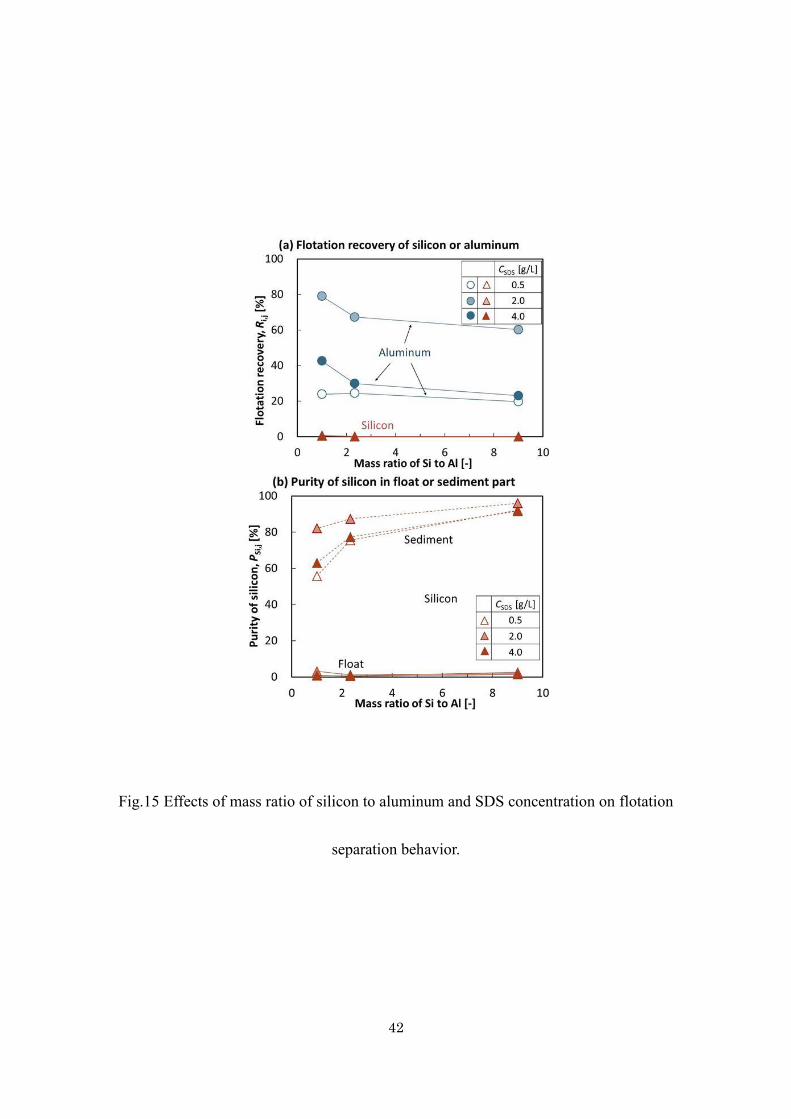
3.2.5 Effect of mass ratio of silicon to aluminum
The relationship between the flotation separation behavior and mass ratio of
silicon to aluminum is shown in Fig. 15. Air flowrate and pH were fixed to 2.5 L/min
(STP) and 6.8, respectively, and SDS concentration was varied to 0.5, 2.0 and 4.0 g/L.
For each SDS concentration, aluminum flotation ratio was roughly decreased with the
increase in mass ratio of silicon to aluminum, whereas silicon was almost kept
sedimented regardless of SDS concentration from Fig. 15 (a). On the other hand, the
sedimentary silicon purity promoted with increasing silicon ratio to aluminum as seen in
Fig. 15 (b) due to the decrease in the initial aluminum amount. Both of aluminum
recovery ratio and silicon purity at SDS concentration of 2.0 g/L indicated largest values
17
between 0.5, 2.0 and 4.0 g/L as well as Fig. 14.
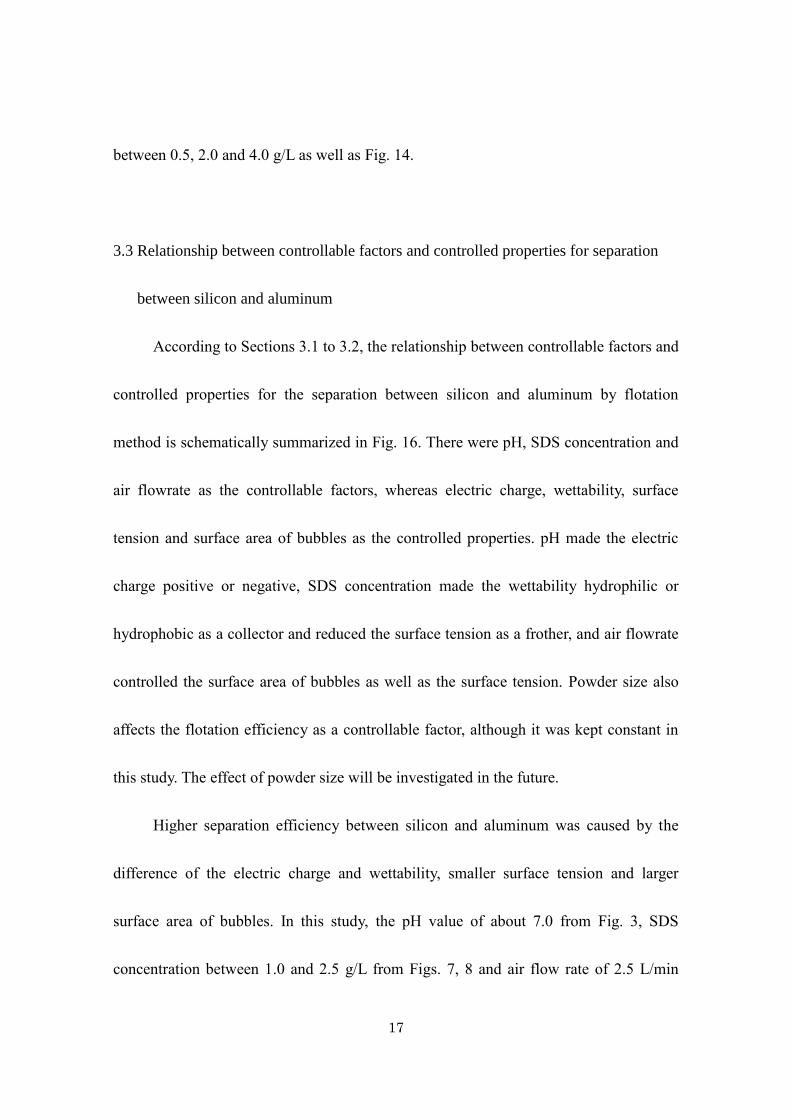
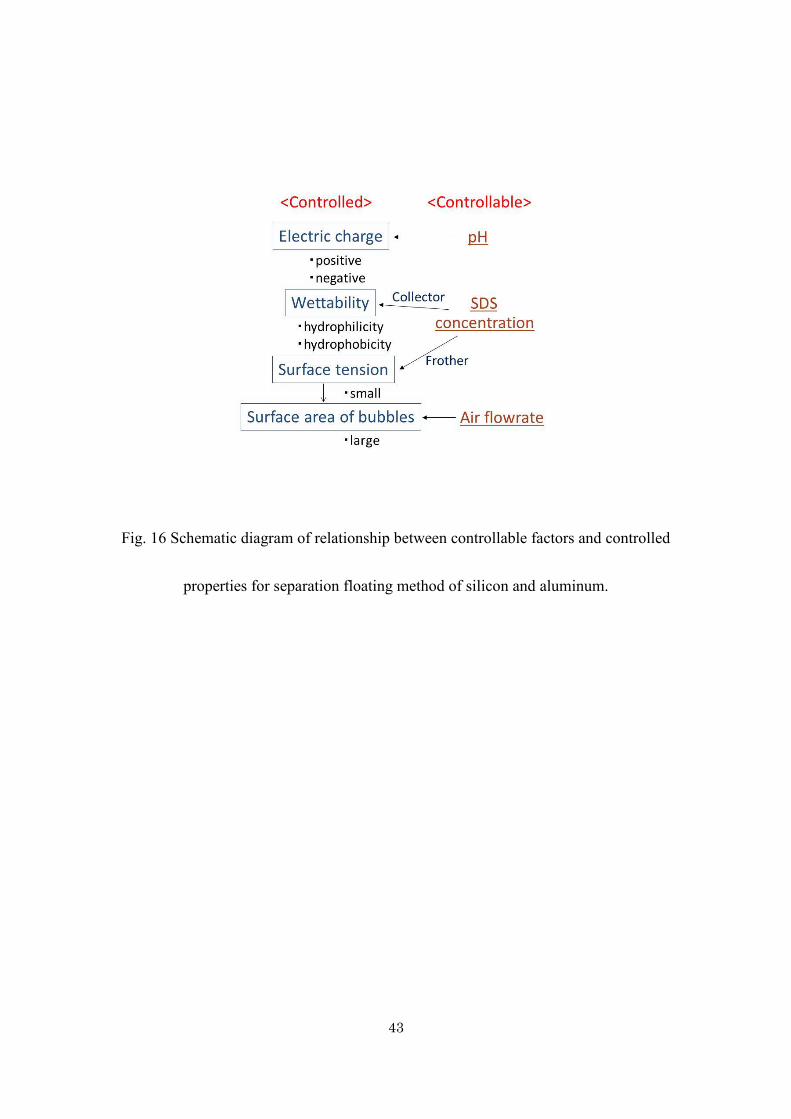
3.3 Relationship between controllable factors and controlled properties for separation
between silicon and aluminum
According to Sections 3.1 to 3.2, the relationship between controllable factors and
controlled properties for the separation between silicon and aluminum by flotation
method is schematically summarized in Fig. 16. There were pH, SDS concentration and
air flowrate as the controllable factors, whereas electric charge, wettability, surface
tension and surface area of bubbles as the controlled properties. pH made the electric
charge positive or negative, SDS concentration made the wettability hydrophilic or
hydrophobic as a collector and reduced the surface tension as a frother, and air flowrate
controlled the surface area of bubbles as well as the surface tension. Powder size also
affects the flotation efficiency as a controllable factor, although it was kept constant in
this study. The effect of powder size will be investigated in the future.
Higher separation efficiency between silicon and aluminum was caused by the
difference of the electric charge and wettability, smaller surface tension and larger
surface area of bubbles. In this study, the pH value of about 7.0 from Fig. 3, SDS
concentration between 1.0 and 2.5 g/L from Figs. 7, 8 and air flow rate of 2.5 L/min
18
(STP) from Fig. 14 became preferable conditions to purify silicon from the mixture of
silicon and aluminum by flotation separation method.
The separation between silicon and aluminum mainly composed in silicon-based
solar cells was a target in this study. The next step is the separation of silicon from the
other grinded elements in solar cells. When the other elements have a different charge of
ζ potential from silicon as shown in Fig. 3, one or multiple flotation processes enhance
the purity of silicon. However, the separation of the elements with the same ζ potential
charge as silicon is difficult and the other purification like a chemical etching [7] must
be used. In this situation, the sequential process of flotation and chemical etching is
considered to be effective in terms of low-cost and more eco-friendly recycling process.
The above purification process does not guarantee the reusing for solar-grade
silicon [38] due to a small amount of metal contamination. It seems to be safe to use this
separated silicon as a starting material of a practically used purification process for solar
grade silicon.
4. Conclusions
The flotation separation between aluminum and silicon which contained in the
waste crystalline solar silicon cells was examined by semi-batch typed experiments.
19
1) Sodium dodecyl sulfate (SDS) permitted to hydrophobize only aluminum powder
due to the difference of surface potential between silicon and aluminum.
2) SDS behaved as a collector of aluminum and a frothing agent and made it possible
to purify silicon.
3) At sample dipping time in SDS solution for 10 min and SDS concentration of 2.0
g/L, 80.1 mass% of aluminum was floated and eliminated from the system, and
sedimentary silicon purity reached 90.7 %.
4) The pH value of about 7.0, SDS concentration between 1.0 and 2.5 g/L and air flow
rate of 2.5 L/min (STP) became preferable conditions to purify silicon from the
mixture of silicon and aluminum by flotation separation method.
Acknowledgements
This work was carried out under the project of NEDO (New Energy and
Industrial Technology Development Organization), entitled “Development project for
photovoltaic (PV) recycling technology”.
20
References
1. IEA International Energy Agency (2018) Snaphot of global photovoltaic, In: Report
IEA PVPS T1-33:2018
2. Louwen A, van Sark W. G. J. H. M, Faaij A. P. C, Schropp R. E. IRuud (2016)
Re-assessment of net energy production and greenhouse gas emissions avoidance
after 40 years of photovoltaics development. Nature Communications 13728 (7):1-9
3. Ministry of the Environment Government of Japan (2016)
http://www.env.go.jp/press/files/jp/102441.pdf. Accessed 28 Jan 2019
4 Dias P, Schmidt L, Gomes L B, Bettanin A, Veit H, Bernardes A M (2018)
Recycling waste crystalline silicon photovoltaic modules by electrostatic separation.
Journal of Sustainable Metallurgy 4 (2): 176-186
5 Park J, Kim W, Cho N, Lee H, Pak N (2016) An eco-friendly method for reclaimed
silicon wafers from a photovoltaic module: from separation to cell fabrication.
Green Chemistry 18:1706-1714
6 Tsoutsos T, Frantzeskaki N, Gekass V (2005) Environmental impacts from the solar
energy technologies. Energy Policy 33(3):289-296
7 Matsubara T, Uddin M. A, Kato Y, Kawanishi T, Hayashi Y (2018) Chemical
treatment of copper and aluminum derived from waste crystalline silicon solar cell
21
modules by mixed acids of HNO3 and HCl. Journal of Sustainable Metallurgy
4(3):378-387
8 European Union (2012) Directive 2012/19/EU of the European Parliament and of
the Council of 4 July 2012 on waste electrical and electronic equipment (WEEE).
Official Journal of the European Union 197:38-71
9 Doi T, Tsuda I, Unagida H, Murata A, Sakuta K, Kurokawa K (2001) Experimental
study on PV module recycling with organic solvent. Solar Energy Materials and
Solar Cells 67(1-4):397-403
10 Jung B, Park J, Seo D, Park N (2016) Sustainable system for raw-metal recovery
from crystalline silicon solar panels: From noble-metal extraction to lead removal.
Sustainable Chemistry and Engineering 4(8):4079-4083
11 Klugmann-Radziemska E, Ostrowski P (2010) Chemical treatment of crystalline
silicon solar cells as a method of recovering pure silicon from photovoltaic modules.
Renewable Energy 35(8):1751-1759
12 Kang S, Yoo s, Lee J, Bonghyun Boo, Ryu H (2012) Experimental investigations
for recycling of silicon and glass from waste photovoltaic modules. Renewable
Energy 47:152-159

22
13 Yi Y. K, Kim H. S, Tran T, Hong S. K, Kim M. J (2014) Recovering valuable
metals from recycled photovoltaic modules Caption list. Journal of the Air & Waste
Management Association 64(7):797-807
14 Huang W. H, Shin W. J, Wang L, Sun W.C, Tao M (2017) Strategy and technology
to recycle wafer-silicon solar modules. Solar Energy 144(1):22-31
15 Acker J, Henbge A (2007) Chemical analysis of acidic silicon etch solutions II.
Determination of HNO3, HF and H2SiF6 by ion chromatography. Talanta 72:
1540-1545
16 New Energy and Industrial Technology Development (NEDO) (2015)
https://www.nedo.go.jp/content/100758482.pdf. Accessed 28 Jan 2019
17 Mukai S (1959) Journal of Chemical Engineering of Japan. 23(7):480-486
18 Wada M (1943) Untersuchungen uber die netzwirkung der schaumer in wasserigen
losungen auf paraffin. Beitrage zum schaumschwimmverfahren. (Mitteihung 1-2.)
Journal of the Mining Institute of Japan 59(704):681-698
19 Isomatsu R (1961) Journal of Chemical Engineering of Japan 25(7):547-553
20 Numata Y, Yokoyama Y, Wakamatsu T (1979) Fundamental studies on the
behavior of a-terpineol and cineol as a frother in sulfide mineral flotation. Journal of
the Mining and Metallurgical Institute of Japan 95(1098):461-465
23
21 Chen Z, Nishimura S, Sasaki H, Usui S (1990) Cationic flotation of fine quartz
using dodecyltrimethylammonium bromide (DTAB). Shigen-to-Sozai
106(9):521-525
22 Wang J, Wang H, Wang C, Zhang L, Wang T, Zheng L (2017) A novel process for
separation of hazardous poly (vinyl chloride) from mixed plastic wastes by froth
flotation. Waste Management 69:59-65
23 Wang C, Wang H, Fu J, Zhang L, Luo C, Liu Y (2015) Flotation separation of
polyvinyl chloride and polyethylene terephthalate plastics combined with surface
modification for recycling. Waste Management 45:112-117
24 Marques G. A, Tenorio A. S (2000) Use of froth flotation to separate PVC/PET
mixtures. Waste Management 20(4):265-269.
25 Truc N. T. T, Lee B. K (2016) Sustainable and selective separation of PVC and
ABS from a WEEE plastic mixture using microwave and/or mild-heat treatment
with froth flotation. Environmental Science and Technology 50(19):10580–10587
26 Eivazihollagh A, Tejera J, Svanedal I, Edlund H, Blanco A, Norgren M (2017)
Removal of Cd2+, Zn2+, and Sr2+ by ion flotation, using a surface-active derivative of
DTPA (C12-DTPA). Industrial and Engineering Chemistry Research 56(38):10605–
10614
24
27 Dey S, Paul G. M, Pani S (2013) Flotation behaviour of weathered coal in
mechanical and column flotation cell. Powder Technology 246:689-694
28 Yamasaki T (1969) Application of Surfactants for Flotation. Journal of Japan Oil
Chemists' Society 18(7):417-426
29 Esumi K (1997) Characteristics and application of surfactant adsorbed layers formed
on particles. Journal of JSCM 70(10):675-685
30 Umeda H, Sasaki A, Takahashi K, Haga K, Takasaki Y, Kuzuno E, Shibayama A
(2011) Flotation and process design for precious metals recovery from powdery
waste generated by polishing process of dental alloy. Journal of MMIJ 127
(10_11):649-655
31 Nakazawa H, Sato T, Oikawa K, Kagesawa K (1993) Recovery of precious metals
from dental material waste by flotation. Shigen-to-sozai 109(11):879-884
32 Ito R, Dodbiba G, Sadaki A, Ahn J. W, Fujita T (2007) Recovery of heavy metals
by flotation from incinerated automobile shredder residues. Resources Processing
54(3):152-157
33 Matsuoka I (1982) Flotation of oxide minerals. Journal of the Mining and
Metallurgical Institute of Japan 98(1134):664-670
25
34 Somasundaran P, Fuerstenau D. W (1966) Mechanisms of alkyl sulfonate
adsorption at the alumina-water interface. The Journal of Physical Chemistry
70(1):90-96
35 Aixing F, Somasundaran P, Turro N. J (1997) Adsorption of
Alkyltrimenthylammonium bromides on negatively charged alumina. Langmuir
13(3):506-510
36 Koopal L. K, Lee E. M, Bohmer M. R (1995) Adsorption of cationic and anionic
surfactants on charged metal oxide surfaces. Journal of Colloid and Interface
Science 170(1):85-97
37 Thermo Scientific™. Sodium Dodecyl Sulfate (SDS), Lauryl.
https://www.thermofisher.com/order/catalog/product/28364. Accessed 28 Jan 2019
38 Kato Y, Hanazawa K, Baba H, Nakamura N, Yuge N, Sakaguchi Y, Hiwasa S,
Aratani F (2000) Purification of metallurgical grade silicon to solar grade for use in
solar cell wafers 86 (11):717-724
26
Caption List
Fig. 1 Schematic recycling flow of waste PV modules.
Fig. 2 Schematic diagram of flotation equipment.
Fig. 3 Relationship between ζ potential and pH for aluminum and silicon powder.
Fig. 4 Comparison of separation behaviors of silicon and aluminum between collectors
of DTAB and SDS..
Fig. 5 Temporal change in flotation ratio of aluminum powder.
Fig. 6 Effect of pH value on flotation recovery ratio and purity of silicon and aluminum.
Fig. 7 Effect of SDS concentration on separation behavior of silicon and aluminum at
sample dipping time of 10 min.
Fig. 8 Effect of SDS concentration on separation behavior of silicon and aluminum at
sample dipping time of 120 min.
Fig. 9 Relationship between contact angle of silicon and aluminum pieces and dipping
time in SDS solution.
Fig. 10 Effect of SDS concentration on contact angles of silicon and aluminum pieces at
dipping time of 10 min.
Fig. 11 Relationship between ζ potential of silicon and aluminum powders and SDS
concentration at dipping time of 10 min in SDS solution.
Fig. 12 Schematic illustration of SDS adsorption on aluminum surface.
27
Fig. 13 Relationship between the mean bubble diameter and SDS concentration at air
flowrate of 2.5 L/min (STP).
Fig. 14 Effects of air flowrate and SDS concentration on separation behavior of silicon
and aluminum.
Fig. 15 Effects of mass ratio of silicon to aluminum and SDS concentration on flotation
separation behavior.
Fig. 16 Schematic diagram of relationship between controllable factors and controlled
properties for separation floating method of silicon and aluminum.
Table 1 Experimental conditions
28
Fig. 1 Schematic recycling flow of waste PV modules.
29
Fig. 2 Schematic diagram of flotation equipment.
30
Fig. 3 Relationship between ζ potential and pH for aluminum and silicon powder.
31
Fig. 4 Comparison of separation behaviors of silicon and aluminum between collectors
of DTAB and SDS.
32
Fig. 5 Temporal change in flotation ratio of aluminum powder.

33
Fig. 6 Effect of pH value on flotation recovery ratio and purity of silicon and aluminum.

34
Fig. 7 Effect of SDS concentration on separation behavior of silicon and aluminum at
sample dipping time of 10 min.
35
Fig. 8 Effect of SDS concentration on separation behavior of silicon and aluminum at
sample dipping time of 120 min.
36
Fig. 9 Relationship between contact angle of silicon and aluminum pieces and dipping
time in SDS solution.
37
Fig. 10 Effect of SDS concentration on contact angles of silicon and aluminum pieces at
dipping time of 10 min.

38
Fig. 11 Relationship between ζ potential of silicon and aluminum powders and SDS
concentration at dipping time of 10 min in SDS solution.
39
Fig. 12 Schematic illustration of SDS adsorption on aluminum surface.
40
Fig. 13 Relationship between the mean bubble diameter and SDS concentration at air
flowrate of 2.5 L/min (STP).
41
Fig.14 Effects of air flowrate and SDS concentration on separation behavior of silicon
and aluminum.
42
Fig.15 Effects of mass ratio of silicon to aluminum and SDS concentration on flotation
separation behavior.
43
Fig. 16 Schematic diagram of relationship between controllable factors and controlled
properties for separation floating method of silicon and aluminum.
44
Table 1 Experimental conditions