Embed Size (px)
Citation preview

Title: Relationship between Unemployment and Job-Vacancy in the National Capital Region
By: Cecille C. Mazon and Charlyndon N. Ligaya 1/
Abstract The Beveridge Curve shows the relationship between unemployment rate (horizontal axis) and job vacancy rate (vertical axis), the number of unfilled jobs expressed as a proportion of the labor force. The position on the curve can indicate the current state of the labor market in the National Capital Region. The curve is hyperbolic-shaped and slopes downward, as a higher rate of unemployment normally occurs with a lower rate of vacancies. If it moves outward over time, a given level of vacancies would be associated with higher levels of unemployment, which would imply decreasing efficiency in the labor market. Inefficient labor markets are caused by mismatches between available jobs and the unemployed and an immobile labor force. In essence, the Beveridge curve may serve as practical instrument in understanding and/or addressing changes in the labor market and providing signals to planners, decision makers on the inefficiencies in the labor market. Introduction The Philippines is consistently coined as one of the Newly Industrialized Countries that has a fair gain during the latter years. According to the 2012 World Wealth Report, the Philippines is one of the fastest growing economy in the world in 2010 driven by the growing business process outsourcing and overseas remittances. Although Philippine economy is growing steadily, it is still noticeable that our country’s population is growing fast for the past decade and unemployment rate remained high. Our population growth marks its 100.98 million as of 2015 with an unemployment rate of 6.3 percent (6.36 million). Despite of economic growth, it still proves that employment growth is not sufficient to reduce unemployment because of rapid population growth and rise in the labor force participation and slow job creation, particularly in the National Capital Region. The National Capital Region (NCR) or known Metro Manila, is the seat of government and one of the three defined metropolitan areas of the Philippines. It is composed of 16 cities and 1 municipality, and encompasses an area of 619.57-square-kilometer (239.22 sq mi) and has a population of 12.88 million as of 2015. It is the second most populous and the most densely populated region in the Philippines. Of the 12.88 million population, it is a huge problem that 8.5 percent (1.09 million) Filipinos are jobless/unemployed. The NCR is the center of culture, economy, education and government of the Philippines. The region was established in 1975 through Presidential Decree No. 824 in response to the needs to sustain the growing population and for the creation for the center of political power and the seat of the Government of the Philippines. Designated as a global power city, the region exerts a significant impact on commerce, finance, media, art, fashion, research, technology, education, and entertainment, both locally and internationally. Its economic power makes the region the country's premier center for finance and commerce. _________________________________________________________________________ 1/ Statistical Specialist I, Employment Demand Statistics Division, Social Sector Statistics Service, Sectoral Statistics Office, Philippine Statistics Authority.

From the result of the first National Migration Survey, 23 percent of the last internal migration from the past five years moved due to employment. For the past decade, there had been notable improvements in the employment situation of the region. However, unemployment and underemployment are still serious concerns that should be addressed. In the Labor Force Survey results of 2018, unemployment rate was recorded at 6.6% and underemployment rate was at 7.2%. The unemployment rate in the region is considered to be among the highest and exceeds the national rates. The supply of the right skills at the right time is essential for competitiveness and innovation. As NCR is a Service Sector dominated region, having the right post-secondary education is not enough to ace employment. Most companies prefer for its workforce to possess the 21st Century Skills. These skills are identified as combination of interpersonal skills such as communication, social, character, and career attributes (2022 JobsFit, Bureau Local Employment). Given the needed skills, the region registered to have an average of 2.77% of job vacancy rate for the past ten years. As aggregate labour markets tighten, and as shortages of particular kinds of skilled labour are felt, it becomes increasingly important to quantify the extent to which various structural and behavioural factors are associated with hiring difficulties for firms. One of the goals of many countries including Philippines by 2030 is to achieve full and productive employment and decent work for all women and men, including for young people and persons with disabilities, and equal pay for work of equal value (SDG 8). Objectives The aim of this paper is to identify the existence and position of the Beveridge Curve, the relationship between unemployment rate and job vacancy rate, in NCR over the period 2008-2017. Also, to assess the efficiency of the labor market in the region and to determine what could have caused the changes/movement in the curve. Review of Related Literature In 1904, William Beveridge created a report on “Unemployment: A Problem of Industry”. He identified that the problem of unemployment lies at the root of most other social problems. Society is build up on labor and the problem is the adjustment of the supply of labor and demand for labor. The supply of the labor in a country is the supply of population and the demand for labor is the aggregate of thousands or tens of thousands of separate demands in the present. He also wrote a lot about job openings and unemployment like this one, from his 1944 report on Full Employment in a Free Society: "Full employment does not mean literally no unemployment; that is to say, it does not mean that every man and woman in the country who is fit and free for work is employed productively every day of his or her working life. Full employment means that unemployment is reduced to short intervals of standing by, with the certainty that very soon one will be wanted in one's old job again or will be wanted in a new job that is within one's powers.” Then in 1958, he coined the “Beveridge Curve” in his report. The Beveridge Curve refers to the unemployment-vacancy ratio wherein the negative/inverse relationship depicts a balanced cycle in the labor market implying that the job matching process in the labor market is functioning well while the positive relationship implies that there is a mismatch in the labor market.

In a study of labor market mismatches by Zimmer (2012), Belgium has both a significant pool of unfilled job vacancies and persistent unemployment. This observation raises the question of how labor supply matches up with labor demand. Labor market tensions have various causes, which may be cyclical, frictional and structural. In the article, “Shifts in the Beveridge Curve, Job Matching, and Labor Market Dynamics” by Fuhrer (1997), he noted that the job-matching process is an important component of the labor market. Even in the healthiest of economic climates, large stocks of unemployed workers and vacant jobs wait to be matched. The efficiency with which workers are matched to available jobs will be a key determinant of the duration of unemployment and of the ability of the economy to fully utilize all available resources. Thus, a model of the job matching process should be a central component of any adequate description of the long-run normal state or “equilibrium” in labor markets. In the study of Edward Teo, Shandre M. Thangavelu and Elizabeth Quah entitled Singapore’s Beveridge Curve: A Comparative Study Of The Unemployment And Vacancy Relationship For Selected East Asian Countries (2005) concludes that Beveridge Curve for the Singapore economy reveals that it has become more inelastic since the 1997 asian crisis, thereby suggesting that the labour market is less responsive in recent years which suggests the possibility of greater selectiveness of employers in filling the vacancies. Likewise, Thirunaukarasu Subramaniam in his study, Unemployment, Job Vacancy And Beveridge Curve in Malaysia, Singapore and the Philippines (2007) using Autoregressive Distributed Lag (ARDL) - Unrestricted Error Correction Model (UECM) approach displays a positive relationship exist between unemployment and job vacancy for Singapore and the Philippines. In contrast, a negative relationship between unemployment and job vacancy for Malaysia. Data and Its Sources The basic data used in this paper are sourced from the surveys conducted by the Philippine Statistics Authority (PSA). Data on unemployment and persons in the labor force were generated through the Labor Force Survey (LFS) while total employment and job vacancies (from enterprises) were gathered from the Labor Turnover Survey (LTS). Labor Force Survey (LFS) Starting July 1987, the LFS used a new questionnaire design and adopted modifications in the concepts and definitions for measuring labor force and employment characteristics. The design was based on a past week reference period and the new concept on “availability and looking for work” was adopted. Starting April 2016 round, the LFS adopted the 2013 Master Sample Design, with a sample size of approximately 44,000 households. The population projections based on the 2010 Census of Population and Housing (CPH) has also been adopted to generate the labor force statistics. Starting January 2017 round, Computer Aided Personal Interviewing (CAPI) using Tablet was utilized in the LFS enumeration. LFS is a nationwide quarterly survey of households to gather data on the demographic and socio-economic characteristics of the population. LFS aims to provide a quantitative framework for the preparation of plans and formulation of policies affecting the labor market. Specifically, the survey is designed to provide statistics on levels and trends of employment, unemployment and underemployment for the country, as a whole, and for each of the administrative regions.

Labor Turnover Survey (LTS) Prior to 1989, statistics on labor turnover and layoffs were derived from two mandatory reports submitted by employers to the Department of Labor and Employment (DOLE). These reports were the Monthly Employment Report and the Employer’s Termination Report which were submitted in compliance with the implementing rules and regulations of the Labor Code of the Philippines. However, due to low compliance rates, coverage was limited and the Department was unable to come up with an accurate picture of the dynamics of the labor market.
In 1988, a special study funded by the former National Statistical Coordination Board entitled “Improvement of Client-Based Statistics on Labor and Employment,” was undertaken. Among others, the study recommended the conduct of a national survey of establishments to inquire on labor turnover, vacancies and layoffs to adequately monitor the labor market performance of the business sector. This recommendation paved way for the conduct of the Employment, Hours and Earnings Survey (EHES). In the 2nd semester of 2002, the previous DOLE Secretary instructed the former Bureau of Labor and Employment Statistics (BLES) to collect quarterly data on labor turnover to complement the data on establishment closures and layoffs. This becomes the forerunner of the current Labor Turnover Survey (LTS) and was in place from 2002 to 2007. The new survey was designed with “enterprise” as the sampling unit instead of the “establishment” in the EHES and conducted in Metro Manila only. The sample size was fixed at 500 enterprises that were selected through stratified random sampling. Two strata were formed with the first 200 top firms (based on revenue) comprising the first stratum, all of them included as samples. The rest of the enterprises formed the second stratum from which the 300 samples were drawn randomly. LTS is conducted quarterly in the National Capital Region to come up with timely information on labor market trends in the formal sector of the economy, the items of inquiry have been limited to employment, labor turnover and existing job vacancies. Labor turnover statistics, as a measure of labor demand, provides policy and decision makers complementary data on labor supply which helps them in examining and analyzing the labor market situation of the nation’s economy. The LTS covers large enterprises and the 18 major industries classified according to the amended 2009 Philippine Standards Industrial Classification (PSIC). Methodology Computational Procedures To plot the Beveridge Curve, unemployment rate and the job vacancy rate were computed. Unemployment rate is the percentage of the total number of unemployed persons to the total number of persons in the labor force. It is computed as:

Labor Force Growth
On the other hand, job vacancy rate is computed as:
Figure 1: A Simple Model of Unemployment and Vacancies Underlying the Beveridge Curve
The Beveridge curve is represented by the blue box in the middle, it is determined by the unemployment and vacancies. Unemployment is a result of job loss (lay-offs/terminations), job quits (voluntary resignation) and those who enter the labor force. Vacancies are an outcome of job creation (expansion of business) and job quits (voluntary resignation). New hire is the outflow of the Beveridge variables. The flows can be categorized as: labor market reallocation or “churning,” labor force growth, and the search and matching process. Data Analysis Unemployed. The unemployed include all persons who are 15 years old and over as of their last birthday and are reported as: without work (i.e. had no job or business during the basic survey reference period); currently available for work (i.e., were available and willing to take up work in paid employment or self-employment during the basic survey reference period, and/or would be available and willing to take up work in paid employment or self employment within two weeks after the interview date); seeking work (i.e., had taken specific steps to look for a job or establish a business during the basic survey reference period); or not seeking work due to the following reasons: (a) tired/believe no work available, i.e., the discouraged workers who looked for work within the last six months prior to the interview date; (b) awaiting results of previous job application; (c) temporary illness/disability; (d) bad weather; and (e) waiting for rehire/job recall.
Re-allocation in the
Labor Market
Job Creation Job Loss Quits
Enter into
Labor Force
Search and
Matching Process
Unemployment Vacancies Beveridge
Curve
New Hiring
The figure 1 shows a schematic model underlying the Beveridge curve. (Fuhrer, 1997)

Source: Philippine Statistics Authority, Labor Force Survey (LFS)
For the past decade, about six (6) out of ten (10) unemployed persons in the National Capital Region (NCR) were male. The graph below shows that most of the unemployed persons are male. The gender gap on unemployment became wider as the highest percentage of unemployed among men can be observed at 64 percent.
Statistics showed that in NCR unemployed persons were dominant among youth aged 15 to 24 years old from 2008 to 2017. During the given time period, the number of long-term unemployed in this age group decreased overall. More than 40 percent of the unemployed persons were under the youth age group of 15-24 years. The age group 25-34 has around 30 percent while about 10 to 14 percent were 45 years old and over.
Source: Philippine Statistics Authority, Labor Force Survey (LFS)
Figure 3: Percent Distribution of Unemployed Persons by Age, National Capital Region,
Philippines: 2008-2017
Figure 2: Percent Distribution of Unemployed Persons by Sex, National Capital Region,
Philippines: 2008-2017
Source: Philippine Statistics Authority, Labor Turnover Survey (LTS)
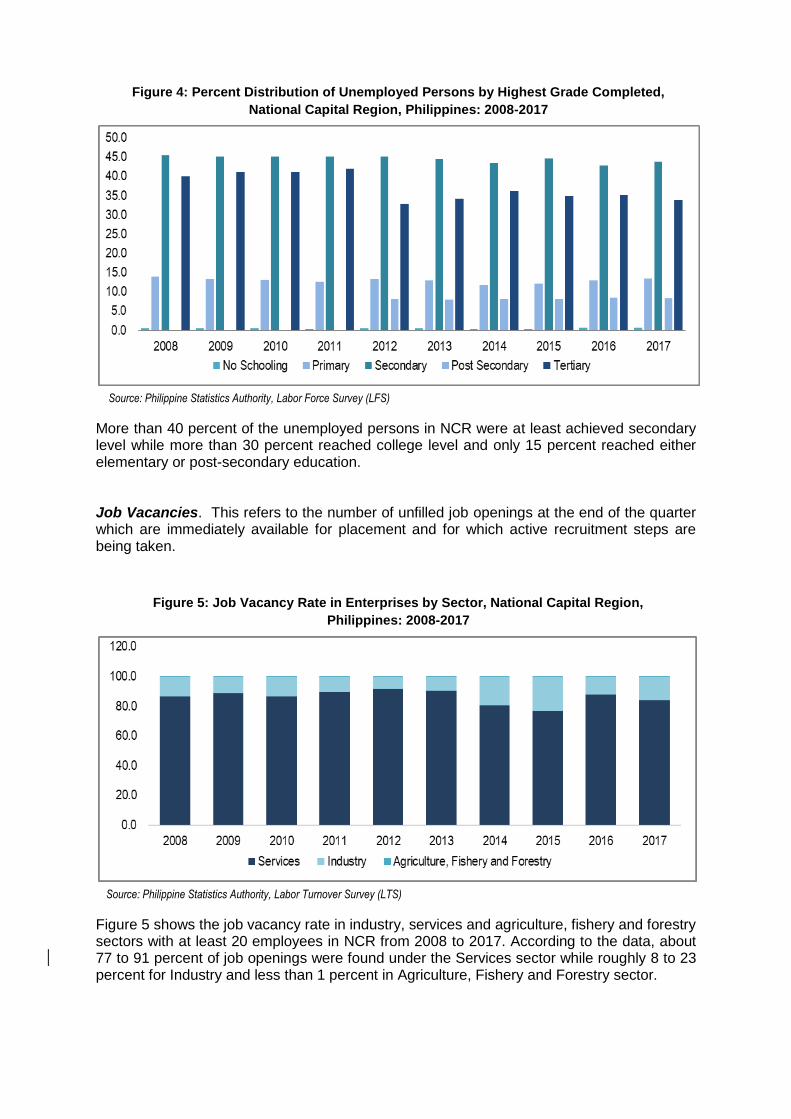
More than 40 percent of the unemployed persons in NCR were at least achieved secondary level while more than 30 percent reached college level and only 15 percent reached either elementary or post-secondary education. Job Vacancies. This refers to the number of unfilled job openings at the end of the quarter which are immediately available for placement and for which active recruitment steps are being taken.
Figure 5 shows the job vacancy rate in industry, services and agriculture, fishery and forestry sectors with at least 20 employees in NCR from 2008 to 2017. According to the data, about 77 to 91 percent of job openings were found under the Services sector while roughly 8 to 23 percent for Industry and less than 1 percent in Agriculture, Fishery and Forestry sector.
Figure 4: Percent Distribution of Unemployed Persons by Highest Grade Completed,
National Capital Region, Philippines: 2008-2017
Figure 5: Job Vacancy Rate in Enterprises by Sector, National Capital Region,
Philippines: 2008-2017
Source: Philippine Statistics Authority, Labor Force Survey (LFS)

Source: Philippine Statistics Authority, Labor Turnover Survey (LTS)
Source: Philippine Statistics Authority, Labor Turnover Survey (LTS)
Accessions. New hires or accessions refer to permanent or temporary additions to employment in the enterprise due to 1) expansion of business activity and 2) replacement of separated workers and employment resulting from changes in methods/technology of production or service. From 2008 to 2015, employers hired new ones to replace those separated workers. But, in 2016, accession due to expansion was peaked at 8.0 percent and was recorded to be relatively higher than the replacement of separated workers at 3.4 percent. This infers that 80 persons were added to the workforce due to expansion, while 34 persons were added due to replacement of separated workers. In 2017, the rates of these two reasons for hiring (expansion and replacement) were almost the same at 4.5 percent and 4.6 percent, respectively.
Separations. This refers to terminations of employment due to a) quits or terminations initiated by the employees; and b) layoffs or terminations initiated by the employers due to economic reasons (e.g., lack of market, financial losses, redundancy) and non-economic reasons (e.g., gross negligence, AWOL). The main reason for employment loss for the last decade was initiated by employees (job quitters) with an average of 4.34 percent, this means
Figure 6: Annual Accession Rate in Enterprises in the National Capital Region,
Philippines: 2008-2017
Figure 7: Annual Separation Rate in Enterprises in the National Capital Region,
Philippines: 2008-2017

Source: Philippine Statistics Authority, Labor Turnover Survey (LTS)
Source: Philippine Statistics Authority, Labor Force Survey (LFS) and Labor Turnover Survey (LTS)
Source: Philippine Statistics Authority, Labor Force Survey (LFS) and Labor Turnover Survey (LTS)
that 43 persons were separated to the total workforce. While 40 workers (4.05%) were separated due to lay-offs/terminations. From 2012 to 2015, laid-off workers were greater than the number of quitters, with the highest number in 2014 at 62 workers per 1,000 employed. On the other hand, more quitters were recorded from 2009 to 2011 and in 2016 to 2017.
Labor Turnover is more than just a number. It is the end product of a wide range of variables, including employee engagement, job satisfaction, company performance, and macro-economic trends. Measured in terms of labor turnover rate or the difference between accession and separation rates, the highest labor turnover rate was recorded at 2.6 percent for both 2010 and 2016 while the lowest labor turnover rate was 1.0 percent in 2009. The overall employment in large enterprises based in Metro Manila showed positive performances during the period.
Figure 9: Annual Unemployment and Vacancy Rates in the National Capital Region,
Philippines: 2008-2017
Figure 8: Annual Labor Turnover Rates in Enterprises in the National Capital Region,
Philippines: 2008-2017

Source: Philippine Statistics Authority, Labor Force Survey (LFS) and Labor Turnover Survey (LTS)
Unemployment and Vacancy Rates. The Philippine economy experienced high inflation rates in 2008 that led to a fiscal crisis, which actually came along with the major recession that the United States and the rest of the world experienced. During the economic slowdown due to global crisis, the low job vacancy rate went hand in hand with high unemployment rate until 2009. The recovery period can be seen in 2010, wherein job vacancies were at its peak while unemployment rate started to post a declining trend until 2016. The unemployment rate rose from 6.7 percent in 2016 to 7.4 percent in 2017. The increase in unemployment in 2017 was partly attributed to the increase in seasonal election-related jobs in 2016.
Figure 10: Number of Unemployed Persons per Job Vacancy, National Capital Region Philippines: 2008-2017
From 2008 to 2009, there was tight competition as 27 to 29 persons vied for one vacant position. It was in 2010 when the unemployment declined and job vacancies soared that the ratio dropped to 6 unemployed persons for every 1 unfilled position and remained at less than 8 persons per vacancy until 2017. The Beveridge Curve: Relationship between Unemployment and Job Vacancies The process of matching labor supply with demand and trends in the process can be shown by a Beveridge curve comparing the unemployment rate and the job vacancy rate. This establishes a negative relationship and shifting to the left upward between the two variables, both expressed as a percentage of the labor force.

Source: Philippine Statistics Authority, Labor Force Survey (LFS) and Labor Turnover Survey (LTS) During the last leg of Macapagal-Arroyo's administration in 2008 to 2010, labor policies were guided by the principles of providing decent and productive employment. Decent and productive employment means that adequate income is generated, rights at work are protected, social protection is provided for, and participation in the democratic process is guaranteed through tripartism and social dialogues. Committed in the pursuit of decent and productive employment, the government pursued more vigorously the four major employment-promoting strategies: employment generation, employment preservation, employment facilitation and employment enhancement. On the other hand, administration also admitted that despite of decreasing number of unemployment in existing labor force, many had not benefitted from good quality education and training, falling short of the level of skills required by employers. Thus, even as more jobs are created, unemployment and underemployment have barely gone down because of job mismatch. To address the apparent mismatches in jobs and skills, the major Public Employment Service Offices (PESOs) were interconnected to strengthen the labor market information system. Alternative job search modes, such as the use of SMS technology were set up to increase workers' access to information on job vacancies (as targeted in the Medium-Term Philippine Development Plan (MTPDP), 2004-2010). The curve shifts slowly upward to the left during the global crisis in 2008 which also felt until the following year. Recovery period was visible in 2010 wherein job vacancies were doubled from the previous year and the unemployment was at least reduced by 11.1 percent. This negative relationship displays an efficient labor market or the job matching process is working well.
Former President Aquino’s jobs policies for six years (2010-2016) had been described as “cheap labor policies” by labor groups. The majority were in low-paying informal, precarious jobs while those in establishments were in low-paying, unsecured non-regular jobs. One of the problems was because contractualization became a widespread work arrangement that directs workers to perform tasks considered as essential to the employer’s business, but the workers do not get regularized even after more than six months of satisfactory stint on the job. It is because of the worker’s contract is always reaching “endo” (end of contract) before the prescribed six months for the regularization. This way, the employer saves on labor costs and gains greater freedom to hire and fire as much workers as the business situation needed (Salamat, 2016).
Figure 11: Beveridge Curve for the National Capital Region (2008-2017)

According to Mara Warwick, World Bank Country Director for the Philippines said, “Economic growth in the last 10 years has created enough jobs to absorb the growing labor force. For many Filipinos, however, the main challenge is having jobs that can lift them out of poverty. With sound macro-economic fundamentals and strong growth, the Philippines is well positioned to address this challenge.” The report says many of the newly created jobs are low-paid, precarious, and informal. “Low-earning capacity of the poor reflects their low education and skills, limited access to formal jobs, and low bargaining power of informal workers,” said Jan Rutkowski, Lead Economist at the World Bank’s Social Protection and Labor Global Practice, and the leading author of the report. (The World Bank, 2016) From the peak of the curve in 2010, a sudden fall of job vacancies and unemployment in 2011 was recorded. This means that the labor demand is too low for quite huge number of unemployed. However, in 2012 and 2013 the curve shifts again to the left upward, then slows down in 2014 and slightly recovers in 2015. These fluctuating in the curve show also unbalanced labor market strategies. As for 2016, the job vacancy and unemployment rates exhibited a positive relationship of which they both shift downward to the left that causes a mismatch where, in every 67 unemployed, only 21 vacancies were available. Also in 2017, a positive relationship was recorded where in both unemployment and job vacancies were growing or shifting to the right upward. This denotes that as more jobs become available for employment, more number of the labor force gets unemployed indicating that there is no equilibrium in the labor market. Difficulties in matching supply with demand can be structural in nature, due to glitches with the labor force’s educational level, work experiences, skills or location. Conclusion Based on the study of the beveridge curve for the National Capital Region of the Philippines, the following were concluded: 1. The existence and position of the Beveridge Curve in the NCR varies in different periods. Positive relationship in the curve showed a labor market inefficiency between the labor demand and supply, it can be seen on years 2011, 2014, 2016 and 2017. On the other hand, years 2009, 2010, 2012, 2013 and 2015 gave a negative relationship wherein every time the job vacancies grows, unemployment drops. 2. There are many plausible explanations why the curve has reached such disproportionate patterns. One factor is the different labor market policies implemented by different administrations. Every political reform had an impact to both unemployment rate and job vacancy rate of the country. Despite persistent challenges, every administration's commitment to achieve full employment of the country will take some time. This study shows that further research is needed to assess to what extent the government policies will be either proactive or reactive. 3. The Beveridge curve helps determine how long it is to achieve full employment in a country. Full employment is defined as a state where there are slightly more vacant jobs than there are available workers, so people who lose jobs can find new ones immediately. Since the result of this paper shows an unstable pattern of the curve, therefore it is still a long run for our country to have efficient labor market strategies.

Recommendations We recommend the following not just for the government but for employers, job-seekers and young individuals. 1. Further study needs to be done especially to prove labor market mismatches in the Philippines and its regions. This is an initial attempt to the application of Beveridge Curve to the Philippine labor market information. 2. Provide training to update skills of unemployed people to match job vacancies and also to offer trainings on entrepreneurship especially for low skilled workers that can also help in creating more jobs. 3. To have an extensive information dissemination to the public about the reality of job mismatch (i.e in demand jobs and skills requirements) so that they will be educated and guided especially the next generation in proper career choice and gain the necessary skills to address the mismatch. 4. Ensure that all Filipino children have access to good quality education that will provide them necessary skills to match the requirements of employers. 5. To strengthen campaign on ending labor contractualization and the clamor to pass endo bill as to abolish “endo” in the country. This may help if not eliminate at least lessen unemployed persons and all employees will have security of tenure and will entitle them the benefits received by regular workers. 6. The government to think of ways in preparing the local workforce for the changes that may be brought by emerging technologies such as automation and that technologies would not compete with our jobs.

References: Beveridge, L. 1960. “Full Employment in a Free Society” Edward Teo et.al, 2005. "Singapore’s Beveridge Curve: A Comparative Study of the Unemployment and Vacancy Relationship for Selected East Asian Countries," Labor Economics Working Papers 22578, East Asian Bureau of Economic Research. Fuhrer, Jeffrey C. 1997. “Shift in the Beveridge Curve, Job Matching, and Labor Market Dynamics” Handel, Michael J. 2003. “Skills Mismatch in the Labor Market”. Department of Sociology, University of Wisconsin, Madison, Wisconsin JobsFit 2022 Labor Market Information Report Department of Labor and Employment
Bureau of Local and Employment
Philippine Development Plan 2011-2016 National Economic and Development Authority
Salamat, Marya. 2016. “Aquino’s Legacy Proliferation of Contractual, Seasonal, Low-Quality Jobs” Zimmer, H. 2012. Labour Market Mismatches Economic Review Journal. National Thirunaukarasu & Subramaniam 2007, “Unemployment, Job Vacancy and Beveridge Curve in Malaysia, Singapore and the Philippines” The World Bank, 2016 “Philippines: New Study says Higher Investments in Skills and Education, Flexible Labor Rules can help Reduce Poverty among Workers”
Zimmer, H. 2012. “Labour Market Mismatches” Economic Review Journal. National Bank of Belgium.