Embed Size (px)
Citation preview

1
Title: Predicting real-world effectiveness using overall survival and progression-free survival
from clinical trials: Empirical evidence for the ASCO value framework
Running head: Clinical trial endpoints predicting real-world effectiveness
Authors: Darius N. Lakdawalla, PhD1; Jason Shafrin, PhD
2; Ningqi Hou, PhD
2; Desi Peneva,
MS2; Seanna Vine, MPH
2; Jinhee Park, PhD
3; Jie Zhang, PhD
3; Ron Brookmeyer, PhD
4; Robert
A. Figlin MD, FACP 5
Author affiliations: 1 University of Southern California
2 Precision Health Economics
3 Novartis Pharmaceuticals
4 University of California, Los Angeles
5 Cedars-Sinai Medical Center
Corresponding author:
Darius N. Lakdawalla, PhD
Quintiles Chair in Pharmaceutical Development and Regulatory Innovation
University of Southern California
635 Downey Way, VPD 414-K
Leonard D. Schaeffer Center for Health Policy and Economics
Los Angeles, CA 90089-3333
Email: [email protected]
Phone: (213) 821-7957
Word count: 2,965 / 3,000
Funding/Support: This study was sponsored by Novartis Pharmaceuticals.
2
ABSTRACT (348 / 350 words)
Importance: Physicians and patients must translate clinical evidence into assessments of likely
real-world benefits. To help them tackle this difficult problem, the American Society of Clinical
Oncology (ASCO) recently updated a framework for measuring the real-world value of cancer
treatments. The framework assumes that real-world survival benefits will be 20% below
progression-free survival gains from randomized controlled trials (RCTs), but will be exactly
equal to overall survival (OS) gains from RCTs. No empirical evidence has been cited to support
these crucial assumptions.
Objective: To identify empirically the relationships between efficacies of oncology treatments
from RCTs using OS or PFS endpoints and their effectiveness in the broader population of
patients beyond those enrolled in RCTs.
Design, Setting, and Participants: We abstracted treatment efficacies relative to control using
21 phase III RCTs that reported OS and either PFS or time to progression (TTP) endpoints in
breast, colorectal, lung, ovarian, and pancreatic cancer. For these treatments, we estimated real-
world OS as the mortality hazard ratio (RW MHR) among patients meeting RCT
exclusion/inclusion criteria in Surveillance and Epidemiology End Results (SEER)-Medicare
data (1991-2010).
Main Outcome Measures: The main outcome variable was OS observed in the SEER-Medicare
data. We used a Cox proportional hazard regression model to calibrate the differences between
RW MHR and the hazard ratios based on clinical trials using either OS endpoints (RCT MHR) or
PFS/TTP surrogate endpoints (RCT SHR).
Results: Treatment arm therapies reduced mortality in RCTs relative to controls (average RCT
MHR=0.85, range: 0.56 – 1.10) and lowered progression (average RCT SHR=0.73, range: 0.43 –
1.03). Among (real-world) SEER-Medicare patients who used either the treatment or control
regimen from the RCT, RW MHRs were 0.6% (95% CI: -3.5% – 4.8%) higher than RCT MHRs,
and RW MHRs were 15.7% (95% CI: 11.0% – 20.5%) higher than RCT SHRs.
Conclusions and Relevance: We found that real-world OS treatment benefits were similar to
those observed in RCTs based on OS endpoints, but were approximately 16% less than RCTs
based on surrogate endpoints in the five tumors studied. Our findings provide an empirical basis
for refining the ASCO value framework and associated clinical decision tools.

3
INTRODUCTION
Two-thirds of cancer drugs are approved based on surrogate endpoints such as progression-free
survival (PFS) or time to progression (TTP) measured in randomized controlled trials (RCTs).1
In real-world practice, however, clinicians selecting treatments regularly face the challenge of
translating surrogate and overall survival (OS) benefits from RCTs into expectations about real-
world OS benefit for their patients.
Efforts are underway to help physicians better approach this problem. One example is the
American Society of Clinical Oncology (ASCO)’s value framework, which aims to help
physicians and patients select preferred therapies.2 The most salient feature of its “net health
benefit” metric is the clinical benefit component, which depends largely on the hazard ratio (HR)
measured in RCTs. In the May 2016 revised version of the value framework, the clinical benefit
component assigns an 0.8 adjustment factor (i.e., 20% reduction in points) to RCTs with
surrogate endpoints—such as PFS—compared to RCTs with OS endpoints.3 In other words, the
ASCO framework assumes that real-world mortality reductions are 20% smaller in magnitude
relative to the reduction in PFS reported in an RCT.
The fundamental question for clinicians is how treatment efficacy measured in clinical trials
translates into real-world effectiveness. Most evidence on this relationship relies on comparisons
of surrogate and non-surrogate endpoints within trials themselves as opposed to comparisons
with real-world OS.1,4-9
In this study, we examined the relationship between reported RCT
efficacy and real-world effectiveness for oncology treatments and examined whether this
relationship varies by RCT endpoint (OS vs. surrogate measures such as PFS or TTP). Using
trial endpoints from RCTs of patients with breast, colon, lung, ovarian, and pancreatic cancer, we

4
estimated a real-world percentage adjustment that would translate RCT efficacy into real-world
effectiveness and allowed this adjustment factor to vary by the type of trial endpoint. This study
proposes an evidence-based adjustment factor that could be used by ASCO’s value framework to
ensure that physicians are delivering accurate guidance to patients, and it also provides ASCO
with a method for refining and expanding their framework in the future by incorporating fast-
evolving real-world data sources.
METHODS
Data sources
We identified 25 treatments used across five tumor sites (breast, colorectal, lung, ovarian, and
pancreatic cancers) using the National Comprehensive Cancer Network Treatment Guidelines.10
We selected all tumor sites that ranked among the top ten in terms of U.S. incidence rates11
and
had ≥3 treatments FDA-approved before 2009 with phase III RCTs reporting both OS and either
PFS or TTP that could be included in our study. Treatment regimens were restricted to those
approved by the FDA before 2009 to ensure that ≥2 years of real-world survival data were
available in Surveillance and Epidemiology End Results (SEER)-Medicare. Since four of 25
treatment regimens were indicated for two tumor sites, we identified 29 RCTs.
We calculated real-world OS using 1991-2010 SEER-Medicare data. The SEER-Medicare
database contains 1.8 million individuals and links data from National Cancer Institute cancer
registries to corresponding Medicare claims.11
5
Inclusion and exclusion criteria
From SEER-Medicare, we selected patients with a primary diagnosis for breast, colorectal, lung,
ovarian, or pancreatic cancer. To control for differences between clinical trial and real-world
patients, we retained only the subset of patients that met inclusion and exclusion criteria from
corresponding RCT from which they would have been able to enroll based on the treatment
regimen received in the real world. Specifically, we applied the inclusion and exclusion criteria
related to patient age, gender, cancer histology and stage, presence of other cancers, and other
comorbidities. Finally, patients were required to have initiated cancer treatment within 90 days
of diagnosis. These patients—which we defined as the “baseline” cohort—represented real-
world patients that were similar to patients eligible to participate in the RCT corresponding to the
real-world treatment they used. Patients appeared in the sample multiple times if they received
more than one of the treatments of interest. We included only treatments that had ≥10
observations in the SEER-Medicare data for both the treatment and control arm regimens.
SEER-Medicare patients were assigned to a treatment or a comparator arm based on their tumor,
the combinations of therapies received, and line of therapy. To be assigned to one of the real-
world comparator arms, patients were required to have received the exact comparator regimen
outlined in the relevant RCT. In the case of combination treatments, we required that patients use
all treatments in the combination within 30 days of the first date on which any treatment in the
combination was used.12
First-line therapy was defined by any anti-cancer treatment that was
initiated within 3 months of diagnosis; second-line (third-line) therapy was defined as the first
claim of any anti-cancer treatment occurring after a 45-day clean period since the last claim of a
treatment in the first-line (second-line) regimen.12

6
To mitigate selection bias due to non-random receipt of treatment in the real world, we excluded
patients assigned to comparator arms if they received the comparator treatment after the date of
the relevant new therapy launch. This approach eliminated patients whose physician non-
randomly treated them with the comparator therapy, even though the novel treatment was
available. We also included only patients that were diagnosed with cancer ≤5 years before or
after the treatment arm regimen had been approved by the FDA to account for the fact that
cancer survival generally improves over time.
Statistical analysis
Real-world OS for each patient was measured as the time between each patient’s first treatment
with the treatment combination of interest and death. Data for patients who survived beyond the
data collection timeframe were censored based on the last month of available data (December
2010). Clinical trial efficacy was measured using phase III trial data reporting OS and PFS/TTP
endpoints. Clinical trial HRs for both OS and PFS/TTP were obtained from the literature. When
HRs were not directly available, we assumed a constant hazard rate over time and estimated the
HR based on the ratio between median OS (or surrogate endpoint) in the treatment arm and the
median OS (or surrogate endpoint) in the control arm.13
All statistical analyses were performed
using Stata version 14.1 (StataCorp, College Station, TX, USA).
We performed a Cox proportional hazards regression analyses to determine whether real-world
treatment effectiveness in SEER-Medicare data as measured by OS is predicted by treatment
efficacies from phase III RCTs based on either OS or surrogate endpoints (PFS/TTP). Separate
analyses were performed using trial OS endpoints and trial surrogate endpoints as predictors in
the regression analyses. The outcome variable in the analyses was real-world OS in SEER-

7
Medicare data. We controlled for patient age, gender, and cancer stage. For persons in the
treatment arm, we included an offset term which was either the RCT OS or RCT surrogate
hazard ratios (RCT SHR) (Stata command: stcox, offset). The primary independent variable was
an indicator variable that indicated whether the patient received the treatment or control regimen.
The regression coefficient (b) for that indicator variable was used to calculate the percentage
difference (f) between real-world mortality hazard ratios (RW MHR) and clinical trial hazard
ratios (RCT HR), and was calculated from the equation f = 100 × (RW MHR - RCT HR) / RCT
HR = (exp(b)-1) × 100 (see eMethods for more details).
For example, suppose the RCT MHR is 0.75 which indicates a 25% reduction in risk of mortality
with the treatment. If the RW MHR is only 0.90, then the percent difference in the hazard ratios
is f =100 × (0.9 - 0.75) / 0.75 = 20%. The interpretation in this example is that the RCT MHR
overestimates treatment effectiveness on mortality in the real world by 20%.
We conducted three sensitivity analyses. First, whereas our “baseline cohort” limited the patient
population to those who met the RCT inclusion/exclusion criteria, we also examined the “full
cohort,” which we defined as all patients receiving the relevant treatment in SEER-Medicare for
a given tumor site and line of therapy. Second, we examined how the relationship between
treatment efficacy and effectiveness varied by cancer site, line of therapy, number of patients
enrolled in the RCT, and RCT geographic location. Finally, we removed the restriction that
patients who receive the treatment in the control arm had to receive the treatment prior to the
approval of the anti-cancer therapy in the trial’s treatment arm.
We also compared the ASCO framework valuations to our empirically derived valuations for
RCTs with PFS/TTP endpoints.

8
RESULTS
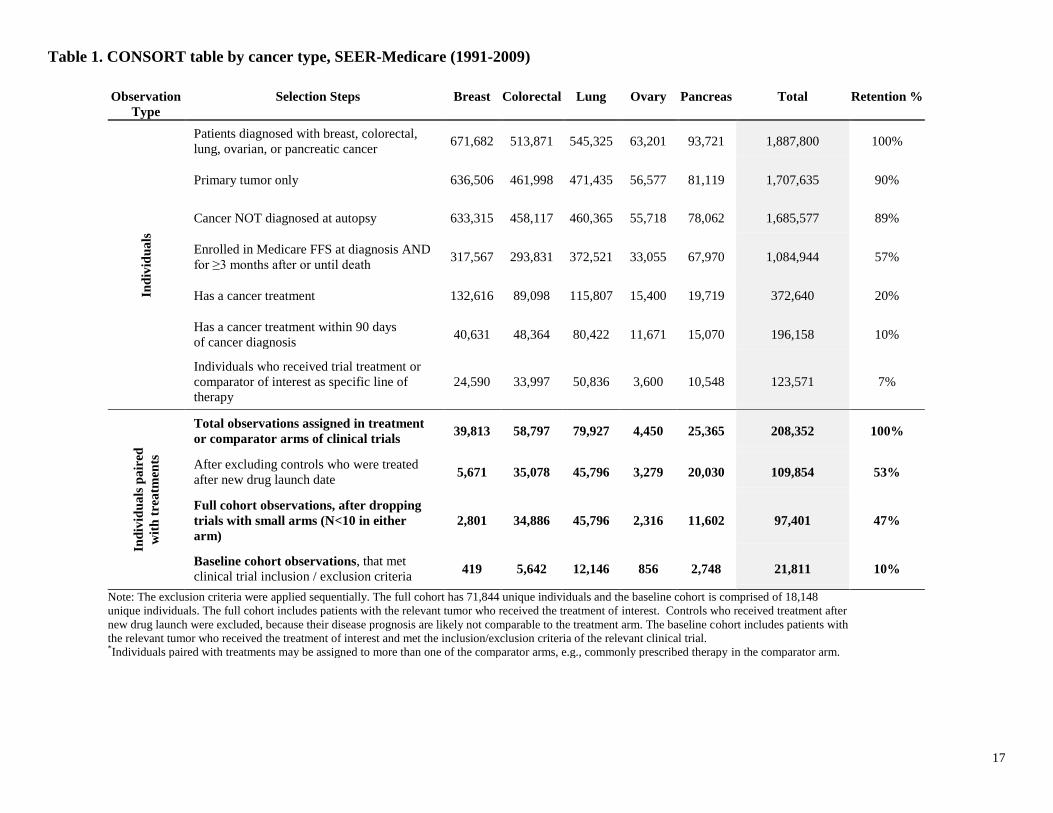
After applying the inclusion/exclusion criteria to 1,887,800 patients in the SEER-Medicare
database, we were left with 97,401 tumor-treatment-patient observations (71,844 unique
patients) that were included in the full cohort specification across 21 RCTs of interest for 18
unique treatment combinations. After applying the inclusion/exclusion criteria from each
relevant RCT for our baseline cohort, we were left with 21,811 tumor-treatment-patient
observations (18,148 unique patients).
The baseline cohort included primarily elderly patients with average age at treatment over 70
years across all five tumors. Overall, about four out of every five patients were Caucasian and
more than half of patients had stage IV cancer at diagnosis. Average survival time from
treatment—not accounting for censoring—varied across type of cancer, with the longest survival
observed for breast cancer (30.7 months) and the shortest – for pancreatic cancer (5.7 months).
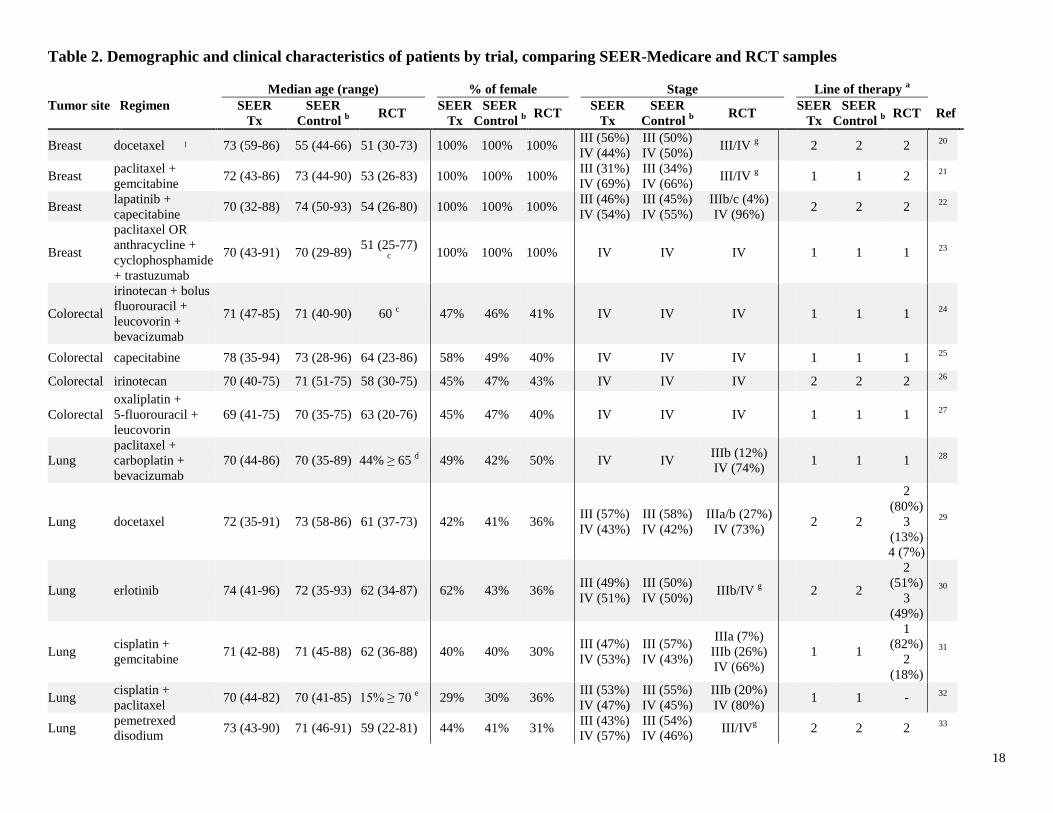
Patients in SEER-Medicare of the relevant tumor type who took the treatment or control arm
regimen of interest were older than those in RCTs (Table 2). In five of 20 simulated trials in
SEER-Medicare there were ˃10 percentage points more females than in the corresponding RCT
(1 RCT did not report patient gender).
Treatment arm efficacy relative to control arm as measured in RCTs using surrogate hazard rates
(SHR) based on PFS/TTP endpoints was generally lower (i.e., reduced mortality or progression)
compared to efficacy measured using MHR (OS). Across all 21 RCTs, treatment arm therapies
decreased progression (average SHR=0.73, minimum SHR=0.47, maximum SHR=1.03) and
mortality (average MHR=0.83, minimum MHR=0.56, maximum MHR=1.04) (Table 3).

9
Real-world effectiveness was similar to treatment efficacy when trials used OS endpoints, but it
was somewhat lower than trial efficacy when trials used surrogate endpoints. Real-world MHRs
were not different from RCT MHRs (the percent difference was f = 0.6%, 95% CI: -3.5% –
4.8%), whereas RW MHRs were significantly higher than RCT SHRs (the percent difference
was f = 15.7%, 95% CI: 11.0% – 20.5%). In other words, if an RCT uses OS endpoints, one can
expect real-world effectiveness to be similar among patients that would have qualified for the
trial. However, if an RCT measures efficacy by a surrogate PFS/TTP endpoint, one can expect
real-world effectiveness as measured by OS to be about 16% lower than the surrogate benefit
from the trial (Figure 1).
Treatments were predicted to be generally less effective when measured among all real-world
patients that received the treatment compared to only those patients who would have been
eligible for the clinical trial. In the full cohort that included patients even if they did not meet the
RCT’s inclusion/exclusion criteria, RW MHRs were 8.2% higher (95% CI: 5.7% – 10.8%) than
RCT MHRs, and RW MHRs were 24.9% higher (95% CI: 22.0% – 28.0%) than RCT SHRs.
The correspondence between real-world and RCT outcomes varied with trial and tumor
characteristics (see eTable 1). Real-world MHRs were generally more likely to be similar to
RCT hazard ratios (i.e., either MHR or SHR) when patient expected survival was lower, trial
sample sizes were larger, or when the RCT of interest was conducted in the U.S. For instance,
RW MHRs were just 6.8% (95% CI: 1.0% – 12.9%) higher than RCT SHRs among patients
receiving second-line treatment, but 28.1% (95% CI: 20.4% – 36.4%) higher for first-line
patients. Among the full cohort of individuals who received treatments of interest, tumors with
shorter expected survival (e.g., pancreas and lung) exhibited RW MHRs more similar to both
RCT MHR and RCT SHR compared to tumors with longer survival (e.g., breast, colorectal, and

10
ovary). These general findings were less apparent within our baseline cohort, perhaps due to the
smaller sample size when we stratified the analysis by tumor type. Finally, real-world
effectiveness was more likely to be similar to RCT efficacy when RCT sample sizes were larger
or when the trial was conducted in the U.S.
We evaluated how our empirical findings compare with the assumptions of the ASCO value
framework. For example, suppose a randomized controlled trial indicates the RCT SHR=0.70;
the ASCO framework suggests assigning a value of [(1 - 0.70)× 0.8] × 100 =24; while our
empirical analysis suggests assigning a value of [1 - 0.70 × (1 + 0.157)] × 100 = 19. Figure 2
compares the relationships between the RCT SHR and the valuations using both the ASCO
guideline and our empirical findings. Compared to our empirically derived scores, the ASCO
framework assigns higher scores to treatments with modest PFS improvements (RCT SHR >
0.56), but lower scores for those treatments with larger PFS improvements (RCT SHR ≤ 0.56).
When we examine the difference between the empirically derived and ASCO framework, there is
no statistically significant difference in five out of 21 cases, a small difference (<10 points) in 12
of 21 cases and a large difference (>10 points) in four cases. If we use tumor-specific factors, f,
then in majority of cases (11 of 21) the results using the empirical and ASCO frameworks are not
statistically different (not shown).
DISCUSSION
Across 21 clinical trials of breast, colon, lung, ovarian, and pancreatic cancer treatments between
1991 and 2010, we found that real-world OS associated with these treatments was comparable to
OS benefits estimated in RCTs. However, real-world OS effectiveness was 16% lower than RCT
11
efficacy estimates based on surrogate endpoints, suggesting that in the five tumors we studied
inferences about real-world OS based on RCT surrogate endpoints should be discounted by
approximately this amount. In addition, among trials using an OS endpoint, those with larger
sample sizes and later lines of therapy were more likely to reliably predict real-world OS
outcomes. On the other hand, a larger discount would apply when considering how an RCT
outcome would apply to a broader real-world patient population, which may include patients that
would not have met the RCT’s inclusion/exclusion criteria.
Several previous studies have examined the relationship between surrogate endpoints (PFS/TTP)
and OS within trials themselves (i.e., analyzing whether OS is correlated with surrogate
endpoints within trials that report both outcomes), with most demonstrating that surrogate
measures are positively but imperfectly correlated with OS.1,4-9
Fewer studies have examined
how trial outcomes compare to survival benefits in real-world patients, but most of these studies
are limited to a single therapy or cancer type 14-17
or examine only OS outcomes.18
To the best of
our knowledge, this study is the first to examine the relationship between real-world OS, and OS
and surrogate efficacy in clinical trials encompassing multiple tumor types and treatments. Our
findings suggest that despite differences in patient populations between clinical trials and real-
world settings, greater monitoring of patients in clinical trials, and concerns about crossover
contamination and patient attrition in clinical trials, real-world and clinical trial OS correlate
strongly.
The results of this paper could be used in a variety of ways. First, ASCO could alter their
framework to use the parameter f calculated in this study to ensure that the ASCO results are
empirically grounded. Second, this study provides a general framework for estimating how
surrogate endpoints are likely to translate into real-world improvements in OS. ASCO or other

12
researchers could apply various discounts depending on the patient population of interest (e.g.,
patient tumor site) and trial endpoints selected (e.g., PFS, immune-related response rate, duration
of response, and disease control rate). As new real-world data sources emerge from both private
companies (e.g., CancerLinQ, Flatiron Health, IBM, IMS, Optum, and NantHealth) and
nonprofit organizations (Patient‑Centered Outcomes Research Institute [PCORI] via
PCORnet),19 this method can be applied to an increasing number of real-world databases. Third,
this study could help inform trial design with respect to endpoint selection. Admittedly, the
choice of endpoint in a trial is a complex question that extends beyond the confines of this study.
Nevertheless, it provides new evidence to help clinicians understand under what circumstances
trial data may generalize to the real world.
This study has several limitations. First, our treatment effectiveness estimates may be
confounded by differences in the characteristics of patients who received treatment. To address
the confounding, we included patient demographics and cancer stage as controls in the Cox
model and measured survival in control arms only during the 5 years prior to the treatment arm
regimen’s approval. Second, our sample is limited to Medicare patients diagnosed with one of
five tumor types, which may limit the generalizability of the results. Third, our ability to match
our baseline sample to RCT inclusion/exclusion criteria was imperfect because SEER-Medicare
does not contain patient genotype information. Fourth, treatments may be administered
differently in clinical trial and real-world settings; whereas physicians may treat patients beyond
disease progression in the real world, in many RCTs a well-defined disease progression requires
treatment to stop. Finally, to ensure a sufficient sample size for our analysis we did not
separately measure the percentage difference ƒ for PFS and TTP, but future research should

13
examine the relationship between efficacy and effectiveness separately using a variety of RCT
surrogate endpoints.
CONCLUSION
Based on evidence from 21 RCTs of treatments across five tumor types, real-world OS was
comparable to OS benefits estimated in RCTs. On the other hand, it was approximately 16%
lower than RCT efficacy measured based on surrogate endpoints in the five tumors studied.
These findings provide an empirical basis upon which to translate surrogate endpoint evidence
from RCTs into meaningful and evidence-based assessments of real-world effectiveness. Our
analysis not only points towards future refinements of the ASCO framework, but also
demonstrates a general methodology for predicting real-world effectiveness that can be applied
to rapidly growing sources of real-world oncology data.
14
REFERENCES
1. Kim C, Prasad V. Cancer drugs approved on the basis of a surrogate end point and
subsequent overall survival: an analysis of 5 years of US Food and Drug Administration
approvals. JAMA Intern Med. 2015;175(12):1992-1994.
2. Schnipper LE, Davidson NE, Wollins DS, et al. American Society of Clinical Oncology
statement: a conceptual framework to assess the value of cancer treatment options. J Clin
Oncol. 2015;33(23):2563-2577.
3. Schnipper LE, Davidson NE, Wollins DS, et al. Updating the American Society of
Clinical Oncology Value Framework: Revisions and Reflections in Response to
Comments Received. J Clin Oncol. 2016:1-9.
4. Broglio KR, Berry DA. Detecting an overall survival benefit that is derived from
progression-free survival. J Natl Cancer Inst. 2009;101(23):1642-1649.
5. Saad ED, Katz A, Hoff PM, Buyse M. Progression-free survival as surrogate and as true
end point: insights from the breast and colorectal cancer literature. Ann Oncol.
2010;21(1):7-12.
6. Burzykowski T, Molenberghs G, Buyse M, Geys H, Renard D. Validation of surrogate
end points in multiple randomized clinical trials with failure time end points. J R Stat Soc
Ser C Appl Stat. 2001;50(4):405-422.
7. Prasad V, Kim C, Burotto M, Vandross A. The strength of association between surrogate
end points and survival in oncology: a systematic review of trial-level meta-analyses.
JAMA Intern Med. 2015;175(8):1389-1398.
8. Sherrill B, Kaye JA, Sandin R, Cappelleri JC, Chen C. Review of meta-analyses
evaluating surrogate endpoints for overall survival in oncology. Onco Targets Ther.
2012;5:287-296.
9. Suzuki H, Hirashima T, Okamoto N, et al. Relationship between progression-free
survival and overall survival in patients with advanced non-small cell lung cancer treated
with anticancer agents after first-line treatment failure. Asia Pac J Clin Oncol.
2014;11(2):121-128.
10. National Comprehensive Cancer Network. NCCN Clinical Practice Guidelines in
Oncology. Vol
http://www.nccn.org/professionals/physician_gls/f_guidelines.asp#site.2014.
11. National Cancer Institute. SEER-Medicare: Number of Cases for Selected Cancers
Appearing in the Data. Vol
http://healthcaredelivery.cancer.gov/seermedicare/aboutdata/cases.html?&url=/seermedic
are/aboutdata/cases.html2015.
12. Davidoff AJ, Tang M, Seal B, Edelman MJ. Chemotherapy and survival benefit in
elderly patients with advanced non–small-cell lung cancer. J Clin Oncol.
2010;28(13):2191-2197.
13. NCSS Statistical Software. Survival Parameter Conversion Tool. Available from:
http://www.ncss.com/software/ncss/ncss-documentation/.
14. Iwashyna TJ, Lamont EB. Effectiveness of adjuvant fluorouracil in clinical practice: a
population-based cohort study of elderly patients with stage III colon cancer. J Clin
Oncol. 2002;20(19):3992-3998.
15. Meyerhardt JA, Li L, Sanoff HK, Carpenter W, Schrag D. Effectiveness of bevacizumab
with first-line combination chemotherapy for Medicare patients with stage IV colorectal
cancer. J Clin Oncol. 2012:1-9.

15
16. Elkin EB, Hurria A, Mitra N, Schrag D, Panageas KS. Adjuvant Chemotherapy and
Survival in Older Women With Hormone Receptor–Negative Breast Cancer: Assessing
Outcome in a Population-Based, Observational Cohort. J Clin Oncol. 2006;24(18):2757-
2764.
17. Shafrin J, Brookmeyer R, Peneva D, et al. The value of surrogate endpoints for predicting
real-world survival across five cancer types. Curr Med Res Opin. 2016;32(4):731-739.
18. Unger JM, Barlow WE, Martin DP, et al. Comparison of survival outcomes among
cancer patients treated in and out of clinical trials. J Natl Cancer Inst.
2014;106(3):dju002.
19. American Society of Clinical Oncology. The state of cancer care in America, 2015: A
report by the American Society of Clinical Oncology. J Oncol Pract. 2015:1-35.
20. Nabholtz J-M, Senn H, Bezwoda W, et al. Prospective randomized trial of docetaxel
versus mitomycin plus vinblastine in patients with metastatic breast cancer progressing
despite previous anthracycline-containing chemotherapy. J Clin Oncol. 1999;17(5):1413-
1413.
21. Albain KS, Nag SM, Calderillo-Ruiz G, et al. Gemcitabine plus paclitaxel versus
paclitaxel monotherapy in patients with metastatic breast cancer and prior anthracycline
treatment. J Clin Oncol. 2008;26(24):3950-3957.
22. Geyer CE, Forster J, Lindquist D, et al. Lapatinib plus capecitabine for HER2-positive
advanced breast cancer. N Engl J Med. 2006;355(26):2733-2743.
23. Eiermann W. Trastuzumab combined with chemotherapy for the treatment of HER2-
positive metastatic breast cancer: pivotal trial data. Ann Oncol. 2001;12(suppl 1):S57-
S62.
24. Hurwitz H, Fehrenbacher L, Novotny W, et al. Bevacizumab plus irinotecan,
fluorouracil, and leucovorin for metastatic colorectal cancer. N Engl J Med.
2004;350(23):2335-2342.
25. Hoff PM, Ansari R, Batist G, et al. Comparison of oral capecitabine versus intravenous
fluorouracil plus leucovorin as first-line treatment in 605 patients with metastatic
colorectal cancer: results of a randomized phase III study. J Clin Oncol.
2001;19(8):2282-2292.
26. Rougier P, Van Cutsem E, Bajetta E, et al. Randomised trial of irinotecan versus
fluorouracil by continuous infusion after fluorouracil failure in patients with metastatic
colorectal cancer. Lancet. 1998;352(9138):1407-1412.
27. de Gramont Ad, Figer A, Seymour M, et al. Leucovorin and fluorouracil with or without
oxaliplatin as first-line treatment in advanced colorectal cancer. J Clin Oncol.
2000;18(16):2938-2947.
28. Sandler A, Gray R, Perry MC, et al. Paclitaxel–carboplatin alone or with bevacizumab
for non–small-cell lung cancer. N Engl J Med. 2006;355(24):2542-2550.
29. Shepherd FA, Dancey J, Ramlau R, et al. Prospective randomized trial of docetaxel
versus best supportive care in patients with non–small-cell lung cancer previously treated
with platinum-based chemotherapy. J Clin Oncol. 2000;18(10):2095-2103.
30. Shepherd FA, Rodrigues Pereira J, Ciuleanu T, et al. Erlotinib in previously treated non–
small-cell lung cancer. N Engl J Med. 2005;353(2):123-132.
31. Sandler A, Nemunaitis J, Denham C, et al. Phase III trial of gemcitabine plus cisplatin
versus cisplatin alone in patients with locally advanced or metastatic non–small-cell lung
cancer. J Clin Oncol. 2000;18(1):122-122.

16
32. Langer CJ, Manola J, Bernardo P, et al. Cisplatin-based therapy for elderly patients with
advanced non-small-cell lung cancer: implications of Eastern Cooperative Oncology
Group 5592, a randomized trial. J Natl Cancer Inst. 2002;94(3):173-181.
33. Hanna N, Shepherd FA, Fossella FV, et al. Randomized phase III trial of pemetrexed
versus docetaxel in patients with non–small-cell lung cancer previously treated with
chemotherapy. J Clin Oncol. 2004;22(9):1589-1597.
34. von Pawel J, Schiller JH, Shepherd FA, et al. Topotecan versus cyclophosphamide,
doxorubicin, and vincristine for the treatment of recurrent small-cell lung cancer. J Clin
Oncol. 1999;17(2):658-658.
35. Gordon AN, Fleagle JT, Guthrie D, Parkin DE, Gore ME, Lacave AJ. Recurrent
epithelial ovarian carcinoma: a randomized phase III study of pegylated liposomal
doxorubicin versus topotecan. J Clin Oncol. 2001;19(14):3312-3322.
36. Pfisterer J, Plante M, Vergote I, et al. Gemcitabine plus carboplatin compared with
carboplatin in patients with platinum-sensitive recurrent ovarian cancer: an intergroup
trial of the AGO-OVAR, the NCIC CTG, and the EORTC GCG. J Clin Oncol.
2006;24(29):4699-4707.
37. McGuire WP, Hoskins WJ, Brady MF, et al. Cyclophosphamide and cisplatin compared
with paclitaxel and cisplatin in patients with stage III and stage IV ovarian cancer. N Engl
J Med. 1996;334(1):1-6.
38. ten Bokkel Huinink W, Lane S, Ross G. Long-term survival in a phase III, randomised
study of topotecan versus paclitaxel in advanced epithelial ovarian carcinoma. Ann
Oncol. 2004;15(1):100-103.
39. Moore MJ, Goldstein D, Hamm J, et al. Erlotinib plus gemcitabine compared with
gemcitabine alone in patients with advanced pancreatic cancer: a phase III trial of the
National Cancer Institute of Canada Clinical Trials Group. J Clin Oncol.
2007;25(15):1960-1966.
40. Von Hoff DD, Ervin T, Arena FP, et al. Increased survival in pancreatic cancer with nab-
paclitaxel plus gemcitabine. N Engl J Med. 2013;369(18):1691-1703.
17
Table 1. CONSORT table by cancer type, SEER-Medicare (1991-2009)
Observation
Type Selection Steps Breast Colorectal Lung Ovary Pancreas Total Retention %
Ind
ivid
ua
ls
Patients diagnosed with breast, colorectal,
lung, ovarian, or pancreatic cancer 671,682 513,871 545,325 63,201 93,721 1,887,800 100%
Primary tumor only 636,506 461,998 471,435 56,577 81,119 1,707,635 90%
Cancer NOT diagnosed at autopsy 633,315 458,117 460,365 55,718 78,062 1,685,577 89%
Enrolled in Medicare FFS at diagnosis AND
for ≥3 months after or until death 317,567 293,831 372,521 33,055 67,970 1,084,944 57%
Has a cancer treatment 132,616 89,098 115,807 15,400 19,719 372,640 20%
Has a cancer treatment within 90 days
of cancer diagnosis 40,631 48,364 80,422 11,671 15,070 196,158 10%
Individuals who received trial treatment or
comparator of interest as specific line of
therapy
24,590 33,997 50,836 3,600 10,548 123,571 7%
Ind
ivid
ua
ls p
air
ed
wit
h t
rea
tmen
ts
Total observations assigned in treatment
or comparator arms of clinical trials 39,813 58,797 79,927 4,450 25,365 208,352 100%
After excluding controls who were treated
after new drug launch date 5,671 35,078 45,796 3,279 20,030 109,854 53%
Full cohort observations, after dropping
trials with small arms (N<10 in either
arm)
2,801 34,886 45,796 2,316 11,602 97,401 47%
Baseline cohort observations, that met
clinical trial inclusion / exclusion criteria 419 5,642 12,146 856 2,748 21,811 10%
Note: The exclusion criteria were applied sequentially. The full cohort has 71,844 unique individuals and the baseline cohort is comprised of 18,148
unique individuals. The full cohort includes patients with the relevant tumor who received the treatment of interest. Controls who received treatment after
new drug launch were excluded, because their disease prognosis are likely not comparable to the treatment arm. The baseline cohort includes patients with
the relevant tumor who received the treatment of interest and met the inclusion/exclusion criteria of the relevant clinical trial. *Individuals paired with treatments may be assigned to more than one of the comparator arms, e.g., commonly prescribed therapy in the comparator arm.
18
Table 2. Demographic and clinical characteristics of patients by trial, comparing SEER-Medicare and RCT samples
Median age (range) % of female Stage Line of therapy a
Tumor site Regimen SEER
Tx
SEER
Control b RCT
SEER
Tx
SEER
Control b
RCT SEER
Tx
SEER
Control b
RCT SEER
Tx
SEER
Control b
RCT Ref
Breast docetaxel 73 (59-86) 55 (44-66) 51 (30-73) 100% 100% 100% III (56%)
IV (44%)
III (50%)
IV (50%) III/IV
g 2 2 2
20
Breast paclitaxel +
gemcitabine 72 (43-86) 73 (44-90) 53 (26-83) 100% 100% 100%
III (31%)
IV (69%)
III (34%)
IV (66%) III/IV
g 1 1 2
21
Breast lapatinib +
capecitabine 70 (32-88) 74 (50-93) 54 (26-80) 100% 100% 100%
III (46%)
IV (54%)
III (45%)
IV (55%)
IIIb/c (4%)
IV (96%) 2 2 2
22
Breast
paclitaxel OR
anthracycline +
cyclophosphamide
+ trastuzumab
70 (43-91) 70 (29-89) 51 (25-77)
c
100% 100% 100%
IV IV IV 1 1 1 23
Colorectal
irinotecan + bolus
fluorouracil +
leucovorin +
bevacizumab
71 (47-85) 71 (40-90) 60 c 47% 46% 41%
IV IV IV 1 1 1 24
Colorectal capecitabine 78 (35-94) 73 (28-96) 64 (23-86) 58% 49% 40% IV IV IV 1 1 1 25
Colorectal irinotecan 70 (40-75) 71 (51-75) 58 (30-75) 45% 47% 43% IV IV IV 2 2 2 26
Colorectal
oxaliplatin +
5-fluorouracil +
leucovorin
69 (41-75) 70 (35-75) 63 (20-76) 45% 47% 40%
IV IV IV 1 1 1 27
Lung
paclitaxel +
carboplatin +
bevacizumab
70 (44-86) 70 (35-89) 44% ≥ 65 d 49% 42% 50%
IV IV IIIb (12%)
IV (74%) 1 1 1
28
Lung docetaxel 72 (35-91) 73 (58-86) 61 (37-73) 42% 41% 36%
III (57%)
IV (43%)
III (58%)
IV (42%)
IIIa/b (27%)
IV (73%) 2 2
2
(80%)
3
(13%)
4 (7%)
29
Lung erlotinib 74 (41-96) 72 (35-93) 62 (34-87) 62% 43% 36%
III (49%)
IV (51%)
III (50%)
IV (50%) IIIb/IV
g 2 2
2
(51%)
3
(49%)
30
Lung cisplatin +
gemcitabine 71 (42-88) 71 (45-88) 62 (36-88) 40% 40% 30%
III (47%)
IV (53%)
III (57%)
IV (43%)
IIIa (7%)
IIIb (26%)
IV (66%)
1 1
1
(82%)
2
(18%)
31
Lung cisplatin +
paclitaxel 70 (44-82) 70 (41-85) 15% ≥ 70
e 29% 30% 36%
III (53%)
IV (47%)
III (55%)
IV (45%)
IIIb (20%)
IV (80%) 1 1 -
32
Lung pemetrexed
disodium 73 (43-90) 71 (46-91) 59 (22-81) 44% 41% 31%
III (43%)
IV (57%)
III (54%)
IV (46%) III/IV
g 2 2 2
33

19
Lung topotecan 71 (44-89) 70 (48-78) f
51% 42% 43% IV IV IV 2 2 2 34
Ovary
doxorubicin
hydrochloride
liposome
73 (59-93) 72 (56-81) 60 (27-87) 100% 100% 100%
IV IV IV h 2 2 2
35
Ovary carboplatin +
gemcitabine 74 (50-88) 76 (38-93) 59 (36-78) 100% 100% 100%
III (52%)
IV (48%)
III (48%)
IV (52%) III/IV
h 2 2 2
36
Ovary cisplatin +
paclitaxel 69 (50-86) 71 (59-83) 59 (20-84) 100% 100% 100%
III (50%)
IV (50%)
III (38%)
IV (62%)
III (67%)
IV (33%) 1 1 1
37
Ovary topotecan 72 (42-92) 73 (66-87) - f
100% 100% 100% IV IV IV 2 2 2 38
Pancreas gemcitabine +
erlotinib 73 (47-86) 73 (49-94) 64 (38-84) 56% 53% 52%
IV IV III/IV
g 1 1 1
39
Pancreas gemcitabine +
paclitaxel 73 (72-75) 73 (37-95) 62 (27-86) 75% 51% 43%
IV IV IV 1 1 1
40
Note: “Ref” is the reference from which the RCT data were drawn. a Line of therapy matching occurred based on the lowest line of therapy reported in the RCT. b SEER-Tx means that patients in
SEER-Medicare data received the treatment of interest from the RCT treatment arm; SEER Control means that patients received the treatment in the RCT control arm. c Indicates mean age, since the
median is not available. d Median or mean age not reported, but 44% of patients were over age of 65. e 15% of patients were over age of 70. f Reference does not report age. g Composition of stage at
treatment of patients with locally recurrent or metastatic disease are not reported or clearly defined. h Eligibility criterion indicates recurrent or metastatic disease; stage is only reported based on stage
at diagnosis.

20
Table 3. Treatment median survival from phase III trials (baseline cohort)
Treatment Arm Comparator Arm
Regimen
PFS/TTP
(months)
OS
(months)
Regimen
PFS/TTP
(months)
OS
(months)
RCT
SHR
RCT
MHR Ref
Breast docetaxel 4.3 b 11.4 mitomycin + vinblastine 2.5
b 8.7 0.75 0.73
20
Breast paclitaxel + gemcitabine 6.1 b 18.6 paclitaxel 4.0
b 15.8 0.70 0.78
21
Breast lapatinib + capecitabine 8.4 a 10.4 capecitabine 4.1
a 8.0 0.47 0.92
22
Breast
paclitaxel OR anthracycline +
cyclophosphamide +
trastuzumab
7.2 b 25.1
paclitaxel OR anthracycline +
cyclophosphamide 4.5
b 20.3 0.63
c 0.81
c
23
Colorectal irinotecan + bolus fluorouracil
+ leucovorin + bevacizumab 10.6
a 20.3
irinotecan + bolus fluorouracil
+ leucovorin + placebo 6.2
a 15.6 0.54 0.66
24
Colorectal capecitabine 4.3 b 12.7 5-fluorouracil + leucovorin 4.4
b 13.6 1.03 1.00
25
Colorectal irinotecan 4.2 a 10.8 fluorouracil 2.9
a 8.5 0.69
c 0.79
c
26
Colorectal oxaliplatin + 5-fluorouracil +
leucovorin 9.0
a 16.2
5-fluorouracil + leucovorin 6.2
a 14.7 0.69
c 0.91
c
27
Lung paclitaxel + carboplatin +
bevacizumab 6.2
a 12.3
paclitaxel + carboplatin +
placebo 4.5
a 10.3 0.66 0.79
28
Lung docetaxel 3.1 b 7.5 best supportive care 1.8
b 4.6 0.57
c 0.56
29
Lung erlotinib 2.2 a 6.7 placebo 1.8
a 4.7 0.61 0.70
30
Lung cisplatin + gemcitabine 5.2 b 9.0 cisplatin 3.7
b 7.6 0.71
c 0.84
c
31
Lung cisplatin + paclitaxel 4.3 b 9.3 cisplatin + etoposide 2.7
b 7.4 0.63
c 0.80
c
32
Lung pemetrexed disodium 2.9 a 8.3 docetaxel 2.9
a 7.9 0.97 0.99
33
Lung topotecan 3.3 b 6.3
cyclophosphamide +
doxorubicin + vincristine 3.1
b 6.2 0.92 1.04
34
Ovary doxorubicin hydrochloride
liposome 4.1
b 14.4
topotecan 4.2
b 13.7 0.96 0.82
35
Ovary carboplatin + gemcitabine 8.6 a 18.0 carboplatin 5.8
a 17.3 0.72 0.96
36
Ovary cisplatin + paclitaxel 16.6 b 35.5 cisplatin + cyclophosphamide 13.0
b 24.2 0.78
c 0.68
c
37
Ovary topotecan 4.7 b 15.8 paclitaxel 3.7
b 13.3 0.79
c 0.97
38
Pancreas gemcitabine + erlotinib 3.8 a 6.4 gemcitabine + placebo 3.5
a 6.0 0.77 0.82
39
Pancreas gemcitabine + paclitaxel 5.5 a 8.5 gemcitabine + placebo 6.7
a 3.7 0.69 0.72
40
Average 5.9 13.5 4.4 11.1 0.73 0.83
Minimum 2.2 6.3 1.8 3.7 0.47 0.56
Maximum 16.6 35.5 13.0 24.2 1.03 1.04
Note: Median progression-free survival (PFS) or time to progression (TTP), and overall survival (OS) come from phase III clinical trial data. “Ref” is the reference from which the RCT data were
drawn. MHR = mortality hazard ratio based on OS outcomes obtained from trials. SHR = surrogate hazard ratio based on surrogate (i.e., PFS or TTP) outcomes obtained from trials. a Indicates PFS
data obtained from trials. b Indicates TTP data obtained from trials. c For eight of 21 trials, hazard ratios were calculated based on reported PFS/TTP/OS in months as hazard ratios were not available.

21
Figure 1. Measuring the relationship between RCT efficacy (PFS/TTP or OS) and real-
world effectiveness (OS) using a Cox proportional hazard model (Dependent variable: real-
world OS)
Note: PFS = progression-free survival, TTP = time to progression, OS = overall survival. The full cohort includes patients with the relevant tumor who received the treatment of interest. The baseline cohort includes patients with the relevant tumor who received the treatment of interest and met the inclusion/exclusion criteria of the relevant clinical trial. Model controls for patient age at treatment, gender, and cancer stage. Adjustment factor ƒ ˃1 indicates that real-world treatment effectiveness is inferior to measured RCT efficacy due to a higher mortality rate; adjustment factor ƒ <1 indicates that real-world treatment effectiveness is superior to RCT efficacy due to a lower mortality rate.

22
Figure 2. Comparing value framework clinical benefit scores based on ASCO’s and
empirically derived adjustment factors for clinical trials with surrogate outcomes
Note: Figure shows how the empirically-based framework score compares to the ASCO value framework score. For example, suppose a clinical trial indicates the trial SHR=0.70; then, the ASCO framework suggests assigning a value of [(1 - 0.70) × 0.8] × 100 =24; while the empirical analysis suggests assigning a value of [1 - 0.70 × (1 + 0.157)] × 100 = 19. Lower score differences indicate that the empirically-based framework is less favorable to the treatment arm of a trial than using the ASCO framework; higher score differences represent the reverse.
4
11
5
1
0 0
2
4
6
8
10
12
More than 10points lower
Less than 10points lower
No significantdifference
Less than 10points higher
More than 10points higher
Dif
fere
nce
be
twe
en
em
pir
ical
ly-b
ase
d a
nd
ASC
O v
alu
e
fram
ew
ork
sco
re
(Co
un
t o
f n
um
ber
of
tria
ls)

23
APPENDIX
eMethods
The sample included each patient 𝑖 that received a therapeutic regimen evaluated in RCT𝑗.
Define the binary variable 𝑇𝑖𝑗 = 1 if patient 𝑖 in SEER-Medicare received the treatment arm
therapy from trial j, or 𝑇𝑖𝑗 = 0 if patient 𝑖 received the comparator therapy from trial 𝑗. 𝐻𝑅𝑅𝐶𝑇,𝑗
is the hazard ratio from trial 𝑗. We assumed that, when patient 𝑖 is treated with a therapy from
trial 𝑗, her real-world mortality hazard can be predicted using his/her characteristics 𝐗𝐢 (age,
gender, and cancer stage), the relevant hazard ratio from trial 𝑗, and a constant percent difference
estimating the discrepancy between real-world and RCT benefits. The Cox model specifying the
log transformed HRRCT,j as an offset term (Stata command: stcox, offset), was stratified by the
RCT based on the treatment patients in SEER-Medicare received, and can be specified formally
as:
𝜆𝑂𝑆,𝑖,𝑗𝑅𝑊 (𝑡) = 𝜆0,𝑖,𝑗(𝑡) exp (𝛽1 + 𝑙𝑛[𝐻𝑅𝑅𝐶𝑇,𝑗])𝑇𝑖𝑗exp (𝐗𝐢)
We repeated the model two times, once defining 𝐻𝑅𝑅𝐶𝑇,𝑗 based on trial j’s OS hazard ratio, and
once defining 𝐻𝑅𝑅𝐶𝑇,𝑗 based on trial j’s PFS or TTP hazard ratio.
We can relate our value framework scoring system to the one from ASCO as follows. Define our
empirically-based percent difference as 𝑓 = 𝑒𝑥𝑝(𝛽1) − 1. A separate f is applied for each
endpoint type (i.e., OS or surrogate). The ASCO scoring system for trials with PFS endpoints is
(1 − 𝐻𝑅𝑅𝐶𝑇) × 0.8 × 100. In other words, ASCO estimates that the real-world improvement
with a PFS endpoint is (1 − 𝐻𝑅𝑅𝐶𝑇) × 0.8. Our estimate of the real-world change in mortality is
(1 − (1 + 𝑓 ) × 𝐻𝑅𝑅𝐶𝑇,𝑗). Thus, the estimated score using an empirically-derived approach
would be [1 − (1 + 𝑓 ) × 𝐻𝑅𝑅𝐶𝑇,𝑗] × 100.

24
eTable 1. Measuring the relationship between RCT efficacy (PFS/TTP or OS) and real-world effectiveness (OS) using a Cox
proportional hazard model
Baseline Cohort
Dependent Variable: Overall Survival
Full Cohort
Dependent Variable: Overall Survival
Key Independent Variable Trial PFS/TTP
Trial OS
Trial PFS/TTP
Trial OS
Treatment Effect HR 95% CI
Lower 95% CI
Upper
HR 95% CI
Lower 95% CI
Upper
HR 95% CI
Lower 95% CI
Upper
HR 95% CI
Lower 95% CI
Upper
Treatment effect relative to RCT 1.157 1.110 1.205 1.006 0.965 1.048 1.249 1.220 1.280 1.082 1.057 1.108
Age at treatment 1.006 1.004 1.008 1.006 1.004 1.009 1.014 1.012 1.015 1.014 1.013 1.015
Male 1.111 1.080 1.144 1.110 1.078 1.142 1.157 1.139 1.175 1.156 1.137 1.174
Stage IV vs. III 1.458 1.398 1.521 1.462 1.402 1.524
Stage I vs. 0 0.633 0.516 0.777 0.620 0.505 0.761
Stage II vs. 0 0.514 0.420 0.630 0.505 0.412 0.619
Stage III vs. 0 0.877 0.717 1.074 0.857 0.701 1.049
Stage IV vs. 0 1.787 1.460 2.187 1.742 1.423 2.132
Treatment effect relative to RCT ×
Breast 1.414 1.039 1.925 1.137 0.834 1.550 1.465 1.195 1.798 1.173 0.958 1.435
Colorectal 1.078 1.011 1.149 0.901 0.845 0.961 1.306 1.264 1.350 1.111 1.074 1.148
Lung 1.180 1.111 1.254 1.058 0.998 1.123 1.161 1.118 1.205 1.026 0.989 1.064
Ovary 1.487 1.249 1.771 1.277 1.077 1.515 1.546 1.347 1.775 1.364 1.192 1.561
Pancreas 1.254 0.994 1.582 1.180 0.935 1.488 1.183 1.027 1.362 1.113 0.967 1.282
Age at treatment 1.006 1.004 1.008 1.006 1.004 1.009 1.014 1.012 1.015 1.014 1.013 1.015
Male 1.112 1.080 1.144 1.111 1.079 1.144 1.155 1.137 1.174 1.155 1.137 1.173
Stage IV vs. III 1.458 1.398 1.520 1.459 1.399 1.522
Stage I vs. 0 0.636 0.518 0.781 0.622 0.507 0.763
Stage II vs. 0 0.519 0.423 0.636 0.508 0.415 0.623
Stage III vs. 0 0.883 0.721 1.080 0.860 0.703 1.053
Stage IV vs. 0 1.800 1.471 2.203 1.750 1.430 2.142
Treatment effect relative to RCT ×
1st line 1.281 1.204 1.364 1.158 1.089 1.231 1.455 1.396 1.516 1.311 1.259 1.366
2nd or 3rd line 1.068 1.010 1.129 0.898 0.849 0.949 1.156 1.122 1.191 0.979 0.950 1.009

25
Age at treatment 1.006 1.004 1.008 1.006 1.004 1.008 1.013 1.012 1.015 1.014 1.013 1.015
Male 1.113 1.081 1.146 1.112 1.080 1.145 1.158 1.140 1.176 1.157 1.139 1.176
Stage IV vs. III 1.452 1.392 1.514 1.453 1.394 1.516
Stage I vs. 0 0.628 0.512 0.771 0.614 0.500 0.754
Stage II vs. 0 0.508 0.414 0.622 0.498 0.406 0.610
Stage III vs. 0 0.869 0.710 1.063 0.847 0.692 1.037
Stage IV vs. 0 1.768 1.445 2.165 1.721 1.406 2.106
Treatment effect relative to RCT ×
Small trial (N<300) 1.766 1.537 2.029 1.587 1.384 1.821 2.612 2.424 2.814 2.316 2.150 2.494
Medium trial (300≤N<600) 1.058 1.000 1.121 0.892 0.843 0.943 1.172 1.131 1.215 0.966 0.933 1.001
Large trial (N≥600) 1.176 1.100 1.258 1.062 0.994 1.136 1.113 1.071 1.155 1.011 0.974 1.050
Age at treatment 1.006 1.004 1.008 1.006 1.004 1.008 1.014 1.013 1.015 1.014 1.013 1.015
Male 1.112 1.080 1.145 1.111 1.080 1.144 1.156 1.138 1.174 1.156 1.138 1.174
Stage IV vs. III 1.460 1.400 1.523 1.464 1.404 1.527
Stage I vs. 0 0.623 0.507 0.764 0.614 0.500 0.754
Stage II vs. 0 0.504 0.411 0.617 0.497 0.406 0.610
Stage III vs. 0 0.856 0.699 1.047 0.842 0.688 1.031
Stage IV vs. 0 1.738 1.420 2.128 1.707 1.394 2.089
Treatment effect relative to RCT ×
US trial 1.209 1.045 1.398 1.046 0.906 1.207 1.199 1.127 1.277 1.013 0.952 1.078
US + other countries trial 1.173 1.114 1.235 1.073 1.020 1.130 1.120 1.083 1.159 1.047 1.013 1.083
Trial outside of US 1.108 1.025 1.197 0.861 0.797 0.930 1.496 1.437 1.558 1.169 1.123 1.217
Age at treatment 1.006 1.004 1.008 1.006 1.004 1.008 1.014 1.013 1.015 1.014 1.013 1.015
Male 1.112 1.080 1.145 1.112 1.080 1.145 1.154 1.136 1.173 1.154 1.136 1.173
Stage IV vs. III 1.457 1.398 1.520 1.457 1.397 1.520
Stage I vs. 0 0.626 0.510 0.768 0.618 0.503 0.758
Stage II vs. 0 0.511 0.417 0.627 0.505 0.412 0.619
Stage III vs. 0 0.865 0.707 1.059 0.854 0.698 1.045
Stage IV vs. 0 1.759 1.437 2.153 1.734 1.417 2.123
Note: PFS = progression-free survival, TTP = time to progression, OS = overall survival, HR = hazard ratio. The full cohort includes patients with the relevant
tumor who received the treatment of interest. The baseline cohort includes patients with the relevant tumor who received the treatment of interest and met the
inclusion/exclusion criteria of the relevant clinical trial. The adjustment factor in the manuscript is calculated as the hazard ratio minus 1.