Embed Size (px)
Citation preview

Title Page
Dynamics of Spinning Triangle Geometry and Its Effects on
Yarn Quality
by
Noman Haleem
(M.Sc. Engineering)
Submitted in fulfilment of the requirements for the degree of
Doctor of Philosophy
Deakin University
June, 2017


iii
Acknowledgements
I owe gratitude to a number of people for their help and support in completion of my PhD
thesis
Professor Xungai Wang for providing me an opportunity to study at
Deakin University. I am also thankful for his advice and continuous
support during my PhD candidature
Dr. Christopher Hurren for critical but constructive feedback on my
experimental work and thesis draft. I am also thankful for his inspiration
and advice for 3MT thesis competition
Dr. Xin Liu for training and support in testing of yarn specimens, friendly
advice on experiments and constructive feedback on thesis revisions
Dr. Stuart Gordon (CSIRO Manufacturing, Geelong) for his tremendous
support and facilitation in resin casting, micro CT and yarn spinning
experiments. I would specially thank Stuart for accompanying me in
several visits to external facilities for experiments and meetings
Professor Saeed Najar (Amirkabir University, Iran) for friendly
discussions and critical input on the spinning triangle analysis and micro
CT of yarns during his one year sabbatical visit to Deakin University
Mark Freijah and Phil Henry (CSIRO Manufacturing, Geelong) for their
friendly support and facilitation in yarn spinning experiments
Alex Orokity for his tremendous support in mechanical workshop, training
and facilitation in designing the clear rubber rollers
Graeme Keating for technical support in textile and yarn spinning
laboratory

iv
Scott Barnes (CSIRO Manufacturing, Geelong) for allowing to use high
speed camera
Ladies in the CSIRO testing Lab for their help in yarn testing
Robynne Hall and Damien Elderfield (School of Engineering) for
development of sample holders for micro computerized tomography
Neale Gibbsons for installing and maintaining compact spinning system
on ring spinning frame to allow compact spinning experiments
Dr. Sherry Mayo (CSIRO Clayton, Melbourne) for her useful advice on
yarn micro CT scanning experiments
Dr. Andrew Stevenson (Australian Synchrotron, Melbourne) for his useful
advice and support in micro CT scanning experiments
Dr. Levi Beeching (Australian National University, Canberra) for CT
scanning of yarn specimens using helical CT technique
Dr. Asadul Haque (Monash University, Melbourne) for helping to
optimize the micro CT scanning parameters on regular micro CT scanning
system
Dr. Matthew Foley (The University of Sydney, Sydney) for his advice and
conducting multiple trials of yarn micro CT experiments on their CT
system
Januar Gotama, Mel Dell'Olio and Tri Nguyen (CSIRO Highett) for their
help in optimizing the resin processing recipe
Christine Rimmer and Helen Woodall for support on administrative and
HDR matters

v
Sandy Benness and John Robin for support on IT matters
I wish to acknowledge support from the Australian Research Council (ARC) and
Shandong Ruyi Group through an ARC Linkage project (LP120200536).
This work was also supported by the Multi-modal Australian ScienceS
Imaging and Visualisation Environment (MASSIVE) (www.massive.org.au).
Finally, I am wish to express gratitude to my family for their continued support,
patience and encouragement during the years of my PhD.

vi
List of Figures
Figure 2.1: Yarns produced from a) staple fibres and b) continuous filaments ................ 8
Figure 2.2: (a) Working principle and various components of ring spinning system (b)
formation of spinning triangle between front delivery roller and twisting
point[11] ....................................................................................................... 11
Figure 2.3: Illustration of various yarn irregularities a) neps b) thick and thin places c)
slubs [21] ...................................................................................................... 15
Figure 2.4: Pictorial comparison of hairy yarn versus non-hairy yarn[29] ..................... 17
Figure 2.5: Poor control on fibres lying at the extreme ends of the spinning triangle [26]
...................................................................................................................... 18
Figure 2.6: Path length difference of the fibres lying at the edge (Fe) and centre (Fc) of the
spinning triangle ........................................................................................... 21
Figure 2.7: Patterns of stress distribution in spinning triangle zone with left offset (d = -
1.244), right offset (d = 1.244) and no offset (d = 0) configurations [51] ... 22
Figure 2.8: Geometrical model of spinning triangle (a) with a raised part [62] (b)
concentric fibre circles at front roller nip [59] ............................................. 26
Figure 2.9: An image of spinning triangle taken using micro CCD camera [26] ........... 28
Figure 2.10: Some of the spinning triangle images captured through transparent roller
arrangement [63] .......................................................................................... 29
Figure 2.11: The idealized helical model of yarn structure [71] ..................................... 30
Figure 2.12: Trajectory of tracer fibre within a yarn[74] ................................................ 32
Figure 2.13: Yarn cross sectional images (a) cotton yarns of various fibre fineness (b)
viscose filament yarn (c) plied nylon filament yarn [85] ........................... 35
Figure 2.14: Cross sectional view of compact spun yarns produced on different compact
spinning systems [88] ................................................................................ 36
Figure 2.15: Fibre trajectories in modified ring spinning system a) deformed axis b) loops
c) local reversion [100] .............................................................................. 38
Figure 2.16: Working principle of micro computerized tomography system ................. 39
Figure 2.17: Volumetric model of cotton yarn produced by micro CT method (a)
longitudinal and (b) cross sectional views [110] .......................................... 40

vii
Figure 2.18: Various compact spinning systems (a) Rieter K46 perforated bottom cylinder
[75] (b) Zinser perforated aprons [76] (c) Sussen compact spinning system
[24] (d) Rocos compact spinning system [113] ........................................... 43
Figure 2.19: The arrangement of complete condensing spinning system [126] ............. 47
Figure 2.20: An overview of different components of Siro spinning system[135] ........ 49
Figure 2.21: Solo spinning attachment shows a specially designed grooved roller with
mounting aids [146] ..................................................................................... 51
Figure 2.22: Left offset diagonal spinning by connecting fibrous strand to adjacent
spindle[150]..................................................................................................... 53
Figure 2.23: Schematic diagram of different groove configurations to direct fibre
flow[157] ...................................................................................................... 57
Figure 2.24: Pictorial illustration of spinning without (a) and with (b) contact surface[162]
...................................................................................................................... 58
Figure 2.25: False twister installed in yarn path of a conventional ring spinning
system[165] .................................................................................................. 60
Figure 2.26: An air nozzle applied in yarn path of conventional ring spinning process[176]
...................................................................................................................... 62
Figure 2.27: Three roving feeding arrangement using a composite roving guide at
classical ring spinning frame [191] .............................................................. 65
Figure 2.28: cross sectional comparison between cluster spun yarns (left) and core spun
yarns (right) [192] ........................................................................................ 67
Figure 2.29: Illustration of twist insertion mechanism by magnetic levitated ring [201]
...................................................................................................................... 68
Figure 3.1: Images of the spinning triangle as taken from direct observation technique
[26] ............................................................................................................... 78
Figure 3.2: Images of the spinning triangle taken through clear plastic roller a) appropriate
image b) fibre slippage due to plastic roller ................................................. 79
Figure 3.3: A concept of clear rubber top roller for observing the spinning triangle during
yarn spinning ................................................................................................ 81
Figure 3.4: Concentric arrangement of plastic tube and mould to cure polyurethane rubber
layer .............................................................................................................. 84
Figure 3.5: Effect of resin components and mixture degassing on transparency of the
rubber cot...................................................................................................... 85
Figure 3.6: Different components of clear rubber roller ................................................. 86

viii
Figure 3.7: Clear rubber top roller vs original top roller................................................. 86
Figure 3.8: Yarn spinning through clear rubber roller and regular top roller on Zinser ring
frame............................................................................................................. 87
Figure 3.9: Image acquisition setup for viewing spinning triangle ................................. 89
Figure 3.10: (a) A typical image of the spinning triangle acquired using the clear rubber
roller arrangement (b) Various areas of interest annotated in the spinning
triangle image ............................................................................................... 93
Figure 3.11: Images of the spinning triangle taken at a) 1/1000 shutter speed b) 4.5 F-stop
value ............................................................................................................. 96
Figure 3.12: Comparison of end breakages that occurred during yarn spinning through
clear versus original top roller ...................................................................... 98
Figure 3.13: Comparison of yarn properties produced through clear rubber and original
top rollers...................................................................................................... 99
Figure 3.14: Continuous sequence of the spinning triangle images (contrast adjusted)
taken at 0.5 second interval for 15 seconds ................................................ 101
Figure 3.15: Close up images of contact of bottom steel roller with a) clear plastic roller
b) clear rubber roller ................................................................................... 102
Figure 3.16: a) an image of the spinning triangle b) illustration of plotting three vertices
of the triangle ............................................................................................. 104
Figure 3.17: The principle of measurement of geometrical parameters of the spinning
triangle through its three vertices ............................................................... 105
Figure 3.18: Various stages in processing of the spinning triangle images: (a) cropping
the spinning triangle region by user, (b) taking sum of the columns of the
selected region, (c) applying Savitzky-Golay smoothing filter, (d)
determining the centre of the fibrous strand, (e) determination of roller contact
line by selecting an area at 3-4 mm distance from the spinning triangle, (f)
mapping of the roller nip line on the image, (g) selecting the lower half of the
spinning triangle zone, (h) taking the sum of the columns of selected area to
locate yarn centre, (i) taking the sum of rows of selected area, (j) application
of the Savitzky-Golay smoothing filter to detect a steep decrease in pixel
intensity at the yarn twisting point, (k) plotting three vertices of the triangle,
(l) simulation of the spinning triangle geometry with measurement of its
geometrical parameters .............................................................................. 109

ix
Figure 3.19: Variation in the width of the spinning triangle in (a) time domain (b)
frequency domain .................................................................................... 111
Figure 3.20: Variation in the height of the spinning triangle in (a) time domain (b)
frequency domain .................................................................................... 111
Figure 3.21: Variation in the angle A (left angle) of the spinning triangle in (a) time
domain (b) frequency domain .................................................................. 112
Figure 3.22: Variation in the angle B (right angle) of the spinning triangle in (a) time
domain (b) frequency domain .................................................................. 112
Figure 3.23: Simulated geometry of 20 tex ring spun yarns as observed through the clear
rubber roller and analysed dynamically through image processing methods
................................................................................................................. 115
Figure 4.1: Clear rubber roller applied for imaging the spinning triangle of yarns produced
in normal spinning arrangement ................................................................. 123
Figure 4.2: Clear rubber roller applied for imaging the spinning triangle of yarns produced
in compact spinning arrangement .............................................................. 123
Figure 4.3: Measurements of tenacity (cN/tex) of 12 tex cotton yarns ......................... 126
Figure 4.4: Measurements of elongation (percentage) of 12 tex cotton yarns .............. 126
Figure 4.5: Measurements of yarn hairiness of 12 tex cotton yarns in terms of Zweigle S3
value ........................................................................................................... 127
Figure 4.6: Measurements of yarn hairiness of 12 tex cotton yarns in terms of Uster
hairiness (H) index ..................................................................................... 127
Figure 4.7: Measurements of yarn evenness in CVm % of 12 tex cotton yarns ............ 128
Figure 4.8: Spinning triangle image acquired through a) clear rubber roller in classical
spinning arrangement b) clear compact roller in compact spinning
arrangement c) magnified image of the classical ring spinning triangle d)
magnified image of the compact spinning triangle .................................... 129
Figure 4.9: Width of the spinning triangles of 12 tex cotton yarns............................... 130
Figure 4.10: Height of the spinning triangles of 12 tex cotton yarns ............................ 131
Figure 4.11: Left angle of the spinning triangles of 12 tex cotton yarns ...................... 131
Figure 4.12: Right angle of the spinning triangles of 12 tex cotton yarns .................... 132
Figure 4.13: Scaled visual representation of the simulated spinning triangle geometries of
12 tex yarns ................................................................................................ 133

x
Figure 4.14: Scatter plots of Zweigle S3 values of yarn hairiness versus a) spinning
triangle width b) spinning triangle height c) spinning triangle left angle and
d) spinning triangle right angle ................................................................ 136
Figure 4.15: Scatter plots of Uster H yarn hairiness versus a) spinning triangle width b)
spinning triangle height c) spinning triangle left angle and d) spinning
triangle right angle ................................................................................... 137
Figure 4.16: Scatter plots of yarn tenacity versus a) spinning triangle width b) spinning
triangle height c) spinning triangle left angle and d) spinning triangle right
angle ......................................................................................................... 140
Figure 4.17: Fourier transformation of 30 seconds signal of spinning triangle widths of a)
WT-HC-LO yarn b) KT-LC-NO yarn ..................................................... 142
Figure 4.18: Fourier transformation of 30 seconds signal of spinning triangle heights of
a) WT-HC-LO yarn b) KT-LC-NO yarn ................................................. 143
Figure 4.19: Fourier transformation of 30 seconds signal of spinning triangle left angles
of a) WT-HC-LO yarn b) KT-LC-NO yarn ............................................. 144
Figure 4.20: Fourier transformation of 30 seconds signal of spinning triangle right angles
of a) WT-HC-LO yarn b) KT-LC-NO yarn ............................................. 145
Figure 4.21: Scatter plots of yarn elongation versus a) spinning triangle width b) spinning
triangle height c) spinning triangle left angle and d) spinning triangle right
angle ......................................................................................................... 147
Figure 4.22: Scatter plots of Uster evenness versus a) spinning triangle width b) spinning
triangle height c) spinning triangle left angle and d) spinning triangle right
angle ......................................................................................................... 148
Figure 5.1: Two different micro CT scanning techniques a) regular micro CT scanning b)
helical micro CT scanning ....................................................................... 157
Figure 5.2: Two tubes made up of a) carbon fibre and b) plastic material, which were used
as sample holders for micro CT scanning of the yarn specimens .............. 161
Figure 5.3: Micro CT scanners a) regular CT scanner X-radia 520 versa b) Helical CT
scanner ANU Heliscan ............................................................................... 163
Figure 5.4: Micro CT scanning trials (a) & (b) of yarn at a regular type scanner ........ 171
Figure 5.5: Micro CT scanning trials (c) & (d) of yarn at helical type scanner ............ 174
Figure 5.6: Various stages involved in image processing through image enhancement
algorithm a) original CT image, b) Gaussian filtering, c) contrast adjustment,
d) first derivative of the image achieved in step c, e) image d imposed on

xi
image c, f) second order derivative of the image e, g) subtracting image f from
image e, h) binary conversion of image g, i) imposing image h on image b, j)
flood filling operation applied on image i, k) size threshold for objects more
than 20 pixels in size .................................................................................. 178
Figure 5.7: Various stages in calculation of different yarn structural parameters related to
cross-sectional distribution of fibres a) binary version of enhanced micro CT
image with hair fibres highlighted, b) morphological dilation, c) area
thresholding to isolate hair fibres, d) determination of yarn centre, e) hairs
elimination by distance thresholding, f) morphological dilation followed by
morphological erosion, g) yarn boundary tracing, h) individual segmented
fibres within yarn cross section, i) measurement of yarn radial packing density
by dividing the cross section into concentric circular zones ...................... 183
Figure 5.8: Motion based segmentation to track individual fibres in yarn CT images . 189
Figure 5.9: Application of region growing method on motion segmented images to keep
track of individual fibres ............................................................................ 191
Figure 5.10: Different views of the 3D volume of the yarn specimen achieved through
vertical stacking of CT images ................................................................... 192

xii
List of Tables
Table 2.1: Comparison of various commercially successful modifcations in ring spinning
system in terms of improvement in yarn quality parameters.......................... 55
Table 3.1: Yarn testing specifications ............................................................................. 88
Table 4.1: Full factorial design of experiment to study relationships between spinning
triangle geometry, yarn structure and yarn properties .................................. 121
Table 4.2: Yarn testing specifications ........................................................................... 124
Table 5.1: Detailed specifications of the yarn micro CT scanning trials ...................... 164
Table 5.2: Yarn structural parameters related to fibre distribution in the yarn cross-section
...................................................................................................................... 197
Table 5.3: Yarn structural parameters related to fibre arrangement along yarn length 200

xiii
List of abbreviations
CCD = Charge coupled device
CCSS = Complete condensing spinning system
CFD = Computational fluid dynamics
CT = Computerized tomography
CVlim = Limiting coefficient of variation of yarn evenness
CVm = Coefficient of variation of yarn evenness
DFTY = Different fibre triplet yarns
DSLR = Digital single lens reflex
ELS = Embeddable and locatable spinning
FT = Fourier transform
GB = Giga Bytes
HC = High compacting pressure
Hz = Hertz
KT = Knitting twist
LC = Low compacting pressure
LO = Left offset
MASSIVE = Multimodal Australian ScienceS Imaging and
Visualization Environment
MB = Mega Bytes
MF = Migration factor
MFP = Mean fibre position
NC = No compacting
NetCDF = Network Common Data Form
NO = No offset
PIXEL = Picture element
RMS = Root mean square
RO = Right offset
S3 = Number of 3 mm long hairs measured by Zweigle
hairiness tester
SFTY = Same fibre triplet yarns
TEX = Yarn linear density in direct system

xiv
TPM = Twist per meter
TSMM = Three strand modified method
VOXEL = Volume element
WT = Weaving twist

xv
Table of Contents
Title Page
Access to Thesis Statement ................................................................................................ i
Candidate’s Declaration .................................................................................................... ii
Acknowledgements .......................................................................................................... iii
List of Figures .................................................................................................................. vi
List of Tables................................................................................................................... xii
List of abbreviations ....................................................................................................... xiii
Abstract ............................................................................................................................. 1
1. Introduction ................................................................................................................ 3
2. Literature review ........................................................................................................ 8
2.1. Introduction ........................................................................................................ 8
2.1.1. Yarn ............................................................................................................. 8
2.1.2. Spinning history .......................................................................................... 8
2.2. Ring spinning ................................................................................................... 10
2.3. Yarn quality ...................................................................................................... 13
2.3.1. Evenness .................................................................................................... 13
2.3.2. Hairiness .................................................................................................... 16
2.3.3. Strength ..................................................................................................... 18
2.4. Spinning triangle .............................................................................................. 20
2.4.1. Various models of spinning triangle ......................................................... 20
2.4.2. Imaging and physical observation of ring spinning triangle ..................... 27
2.5. Yarn structure ................................................................................................... 30
2.5.1. Fibre arrangement within a yarn ............................................................... 31
2.5.2. Effects of structural arrangement of fibres on yarn properties ................. 36
2.5.3. Studying yarn structure through micro computerized tomography .......... 38
2.6. Modifications in ring spinning process ............................................................ 41
2.6.1. Commercially successful modifications ................................................... 42
2.6.2. Proposed and experimental modifications ................................................ 55
2.7. Research gaps and opportunities ...................................................................... 69
2.7.1. Research gaps ............................................................................................ 70
2.7.2. Opportunities ............................................................................................. 75

xvi
3. Analysing the Dynamic Geometry of Ring Spinning Triangle ............................... 77
3.1. Introduction ...................................................................................................... 77
3.2. Principle and hypothesis ................................................................................... 80
3.3. Experimental .................................................................................................... 83
3.3.1. Development of clear rubber roller ........................................................... 83
3.3.2. Yarn spinning ............................................................................................ 86
3.3.3. Yarn testing ............................................................................................... 87
3.3.4. Image acquisition ...................................................................................... 88
3.3.5. Digital image processing ........................................................................... 90
3.4. Results and discussion ...................................................................................... 91
3.4.1. Clarity of spinning triangle viewing ......................................................... 92
3.4.2. Non-invasiveness of the clear rubber roller .............................................. 96
3.4.3. Quantification of spinning triangle geometry ......................................... 102
3.4.4. Dynamic analysis of the spinning triangle .............................................. 109
3.5. Conclusion ...................................................................................................... 115
4. Relationships between Spinning Triangle Geometry and Yarn Quality................ 117
4.1. Introduction .................................................................................................... 117
4.2. Principle and hypothesis ................................................................................. 118
4.3. Materials and methods .................................................................................... 120
4.3.1. Design of experiment .............................................................................. 120
4.3.2. Yarn spinning .......................................................................................... 121
4.3.3. Spinning triangle imaging ....................................................................... 122
4.3.4. Yarn testing ............................................................................................. 124
4.4. Results ............................................................................................................ 124
4.4.1. Yarn properties ........................................................................................ 125
4.4.2. Spinning triangle geometry ..................................................................... 128
4.5. Discussion ...................................................................................................... 134
4.5.1. Effects of the spinning triangle geometry on yarn hairiness ................... 135
4.5.2. Effects of the spinning triangle geometry on yarn tenacity .................... 139
4.5.3. Effects of the spinning triangle geometry on yarn elongation ................ 146
4.5.4. Effects of the spinning triangle geometry on yarn evenness................... 147
4.5.5. Agreement with existing literature .......................................................... 148
4.6. Conclusion ...................................................................................................... 150

xvii
5. Investigation of Yarn Structure with Micro-computerized Tomography and Digital
Image Processing .......................................................................................................... 152
5.1. Introduction .................................................................................................... 152
5.2. Principle & Hypothesis .................................................................................. 156
5.2.1. Helical CT scanning ................................................................................ 156
5.2.2. Analysing yarn structure through CT images ......................................... 158
5.3. Materials and methods .................................................................................... 159
5.3.1. Yarn specimens ....................................................................................... 159
5.3.2. Sample preparation for micro CT scanning ............................................ 160
5.3.3. Micro computerized tomography ............................................................ 162
5.3.4. Digital image processing ......................................................................... 164
5.4. Results and discussion .................................................................................... 170
5.4.1. Optimization of micro CT scanning for yarn specimen .......................... 170
5.4.2. Analysing yarn structure using digital image processing ....................... 175
5.5. Comparison of yarn structures........................................................................ 196
5.5.1. Comparison of fibre distribution within yarn cross-section .................... 196
5.5.2. Comparison of fibre arrangement along yarn length .............................. 199
5.6. Conclusion ...................................................................................................... 201
6. Conclusion and Future Work ................................................................................. 203
6.1. Summary ........................................................................................................ 203
6.2. Suggestions for future work ........................................................................... 207
Bibliography .................................................................................................................. 210

1
Abstract
The aim of this study was to investigate the effects of the spinning triangle geometry and
internal yarn structure on the quality of ring spun yarns. The critical role of both spinning
triangle and yarn structure on ring yarn quality has been frequently discussed in yarn
spinning related research and literature. However, a clear understanding of the nature of
these relationships is not yet well established. The primary reason for lack of this
understanding is unavailability of appropriate analysis techniques that can be applied to
study the spinning triangle zone and complicated arrangement of fibres inside yarn
structure and translate them into meaningful quantitative parameters. As tremendous
amount of research to improve ring yarn quality has already examined various
possibilities to physically modify the ring spinning process, further improvements in yarn
quality may only be achieved by studying the underlying factors at a deeper level that
may provide further insight into ways to control ring yarn quality.
In order to investigate the relationships between ring spinning triangle geometry and yarn
quality, a new method based on combination of a clear rubber roller and digital image
processing techniques was proposed. The clear rubber roller, which imitated the structural
and physical characteristic of an original top drafting roller, exposed the spinning triangle
zone in a non-invasive manner. A digital camera recorded the spinning triangle geometry
and its dynamics in form of continuous videos to allow studying variations in it during
yarn spinning process. A digital image processing algorithm processed the image
sequences to extract the geometrical information of the spinning triangle in terms of
appropriate parameters. The results showed that the proposed method was capable of
quantifying the spinning triangle geometry without disturbing natural arrangement of
fibres inside it along with providing information about its dynamic behaviour.
The proposed method to study the spinning triangle zone was then applied in controlled
yarn spinning arrangement where the physical geometry of the spinning triangle was
carefully varied during ring spinning process. The geometry of the spinning triangle was
quantified and correlated with different quality parameters of the respective yarns to draw
relationships between them. It was observed that yarns produced with compact and
skewed spinning triangle showed significantly less yarn hairiness compared to the yarns

2
produced with classical spinning triangle geometry. The improved control on the edge
fibres at the spinning triangle zone through air suction and pre twisting helped to interlock
protruding fibres inside yarn body resulting in reduced hairiness. The only other yarn
quality parameter, which showed sensitivity towards the spinning triangle geometry was
yarn strength. However, yarn strength did not show significant relationships with any of
the geometrical parameters of the spinning triangle.
Another analysis technique based on combination of micro computerized tomography
(CT) and digital image processing techniques was proposed to investigate the underlying
reason of variations in yarn strength by comparing the structures of a strong and a weak
yarn specimen. The micro CT technique provided a comprehensive insight of fibre
arrangement within a yarn in a non-invasive manner while image processing techniques
extracted the yarn structural information in terms of appropriate quantitative parameters.
The combined method overcame several critical limitations associated with existing
methods of studying yarn structure. The comparison of structures of two yarn specimens
showed that the stronger yarn possessed higher extent of fibre migration in terms of
intensity and amplitude of migration compared to the weaker yarn. The frequent
occurrence of fibre migration resulted in more integrated arrangement of fibres and
stronger yarn structure, which improved its resistance towards applied tensile stresses.
The results showed that both developed methods could be successfully applied to study
the spinning triangle zone and fibre arrangement within the yarn structure. The spinning
triangle being a control point of yarn hairiness and yarn strength can be exploited in future
to improve both of these aspects of yarn quality.
3
1. Introduction
Clothes are a basic and essential component of everyday human life. In primitive times,
the primary and perhaps only purpose of clothing was to shield humans against harsh
weather conditions. However, with evolution, development and expansion of human
society, clothes have achieved higher and important status in human lives. The civilized
consumer of the 21st century is greatly concerned about the selection of clothes they wear,
not only in the aesthetic sense but also from point of view of their performance such as
comfort and durability. The demand for superior and high quality clothing is on a
consistent rise with the progression of human society. The textile industry is more
competitive today than ever in an attempt to produce high quality clothes at minimal
production costs that can meet both aesthetic and technical needs of the modern age.
Innovation and development in classical textile processing is essential to facilitate the
production of superior quality clothes.
Clothes are made up of textile fabrics, which are produced by weaving or knitting various
yarns, which are made up of fibres or filaments. The quality of the clothes depends on a
large array of variables including materials and the processing method. Textile yarns
possess one of the most critical roles among these variables as they serve as the basic unit
of the clothing structure. The quality of a yarn is one of the most influential factors in
determining the quality of the clothes and for this reason, the improvement in yarn quality
has been a focus of textile related research right from the time of the industrial revolution
when the commercial production of textiles was initiated. The interest and attempts to
produce high quality yarns have particularly spiked in the last half century with
tremendous developments occurring in the yarn spinning process. These developments
include investigating, engineering and optimising various components and settings in
yarn spinning systems in order to modify classical spinning system by introducing new
elements or the development of entirely new yarn production systems. The primary
objective of all these efforts was to improve yarn quality whilst lowering production costs.
Here, yarn quality refers to those physical characteristics of a yarn that influence fabric
production, performance and serviceability. These parameters include yarn hairiness,
yarn strength and yarn evenness

4
The goal of producing superior quality clothes by improving the quality of yarns is
achieved to a larger extent due to extensive studies and investigations in this area.
Decades of research and development have almost ‘matured’ yarn spinning technology.
The modern yarn spinning systems, particularly ring spinning, which is also the most
widely applied yarn spinning system in the world, produce high quality yarns for a large
number of clothing applications. However, the interest to further improve yarn quality is
still present among textile researchers and technologists.
Yarn quality may have been improved continuingly on the current spinning technology
however it is still far away from ideal. The loose fibres protruding out of yarn surfaces,
entangle with each other and form small ‘pills’ on the fabric surface usually after just a
few wash and wear cycles. This unwanted pilling deteriorates fabric appearance and
significantly reduces its life span. The fibre mass irregularities in yarn cause unwanted
patterns or effects on the fabric surface that not only deteriorate fabric appearance but
also lead to rejection by customers. The yarns produced from short staple, natural fibres
often require additional support of sizing material to bear stresses in downstream
processes such as in warping and weaving. Sizing is not only a non-value added process
but it is also environmentally unfriendly. The existing literature and previous studies
support the idea that the above mentioned issues can be addressed and improved to a large
extent by modifying the classical yarn spinning process. This logic fuels the interest to
further study, investigate, understand and manipulate the classical yarn spinning process
to produce ideal quality yarns. The biggest challenge now associated with this approach
is to determine the possibilities of further modifications in such a technology that is
already ‘close to maturity’ from decades of intensive research.
The second chapter of this thesis critically reviews existing literature. It pays particular
attention to recent investigations in the yarn spinning process, new methodologies that
have been investigated in this thesis and discusses critical aspects of the ring spinning
process and application of innovative technologies to modify the classical yarn spinning
system. The chapter starts by introducing some basic concepts and operations of the ring
spinning system, providing a glimpse of ring spinning history from the era of the
industrial revolution to its transformation into its current modern form, discussing
important aspects of yarn quality and their significance on the quality of the end product.
Various theoretical models that were proposed to understand the behaviour and the role

5
of a critical area in ring spinning process, the spinning triangle or twist triangle, were
discussed along with different techniques that were employed to observe it visually
through the front drafting rollers. The critical importance of yarn structure and its
inevitable role on yarn quality is brought under discussion starting from initial theory of
the ideal helical structure of a yarn to empirical realisation of the frequent fibre migration
inside it through the tracer fibre method. Different techniques that were applied in the
past to study longitudinal as well as cross sectional arrangement of fibres within the yarn
are also presented along with previous attempts to draw relationship between yarn
structure and its quality. Various modifications were introduced in the classical ring
spinning system to improve yarn quality in the past. These modifications are categorized
in two groups with respect to their commercial performance and industrial acceptance.
The principle of operation of these modifications, evaluation of their performance based
on comparisons with regular ring yarns and possible reasons of their industrial success
are discussed. A brief glimpse of attempts to improve the productivity of the ring spinning
system is also given. The chapter finishes with determining the gaps in existing literature
and previous research on ring spinning process and possibilities to translate these voids
into further opportunities to improve yarn quality.
The third chapter focuses on the proposal and development of a new type of system for
observing and analysing the spinning triangle particularly in terms of its geometry. The
proposed system was based on two components. The first component dealt with
acquisition of the geometrical data of the spinning triangle in the form of digital images
by exposing it through a specially devised top drafting roller and recording it by an
imaging setup. The top roller was evaluated in terms of its performance to effectively
visualize the spinning triangle, acceptable level of clarity and non-invasive nature of its
operation. This was to ensure that the developed roller could clearly expose the spinning
triangle without disturbing actual fragile arrangement of fibres inside the spinning
triangle zone. A comparison of yarns produced using the newly developed roller was also
made with the yarns produced using a regular top drafting roller. The second component
deals with automated analysis of the spinning triangle imagery data. An image-processing
algorithm was proposed for this purpose, which read, enhanced and segmented the digital
images of the spinning triangle leading to measurement and quantification of different
critical parameters that to represent its geometry. The dynamic nature of the spinning

6
triangle was demonstrated by analysing the variation in its geometrical parameters both
in time and frequency domains.
The fourth chapter consists of a systematic study of relationships between the spinning
triangle geometry and the quality of yarns with different spinning parameters. Firstly, the
geometry of the spinning triangle was varied in a controlled manner by using two existing
modifications in the classical yarn spinning process i.e. compact and offset spinning. The
variations in the spinning triangle geometry were made by following a statistical design
of experiment plan that comprised of different variables and their sub-levels. The
geometrical parameters of the spinning triangle for each experimental run were measured
using the analysis system proposed in chapter two. Secondly, comprehensive testing of
yarn specimens was conducted to acquire their quality data. The relationships between
the spinning triangle geometry and the yarn quality were studied by analysing the extent
of variation in yarn quality parameters as a function of variation in the geometrical
parameters of the spinning triangle. These relationships were further investigated by
visual analysis of the data in form of scatter plots and associated regression lines along
with Fourier transformation of dynamic variations in the geometrical parameters of the
spinning triangle.
Chapter five emphasizes on the importance of understanding the internal micro level
structure of textile yarns in order to study its effect on the physical properties and yarn
quality. A new approach was established to study yarn structure by combining micro
computerized tomography (CT) with digital image processing technique. Firstly, multiple
trials were conducted on two types of micro CT systems. The effects of important CT
parameters that influenced the quality of yarn CT images were investigated to achieve an
optimal quality image. Secondly, three different image processing algorithms were
developed to enhance, segment and track individual fibres through micro CT data sets.
The arrangement of the fibres within the yarn cross section and along its length was
studied. Two yarn specimens that were produced from similar material and controlled
variations in their respective spinning triangle geometries, which also significantly
differed in terms of their tensile strength were selected for analysis. The structures of both
yarn specimens were studied through the combined method of micro CT and digital image
processing. The underlying differences in their structures were discussed and compared
with the findings from existing literature.

7
Finally, chapter six concludes the thesis by summarizing the key findings of the work
conducted. It also outlines unfinished work that is still required to be undertaken to ensure
that the developments in this thesis are exploited to their full benefit in order to improve
yarn quality and the ring spinning system.

8
2. Literature review
2.1. Introduction
2.1.1. Yarn
‘Spinning’ in context of textile technology can be defined as a process to produce either
fibres or filaments from natural or synthetic origins [1]. It can also be explained as
conversion of natural or man-made fibres and filaments into yarns by twisting or some
other means of binding to hold them together. The resultant yarns must possess
continuous length and suitable properties, which should allow their conversion into
fabrics or use in technical applications. The yarns are produced from staple fibres and
continuous filaments as shown in Figure 2.1.
Figure 2.1: Yarns produced from a) staple fibres and b) continuous filaments
2.1.2. Spinning history
The history of consuming fibres for clothing dates thousands of years back since evolution
of human civilization [2, 3]. There is evidence of the existence of the spinning of thread
from staple fibres since 8,000-10,000 B.C [4]. The first evidence of fabric being produced
is dated around 5000 B.C. The first fibre used was most likely wool, as sheep existed
even a million years ago. Earlier methods of spinning involved tying an attenuated fibrous
strand with a stone called ‘whorl’ and rotating it to produce spinning torque [5]. Similarly,

9
another ancient method of inserting twist into fibres is termed as ‘hand spinning’. The
idea of a spinning spindle perhaps originated from a wooden stick rotated between thigh
and palm of a spinner for twisting and winding a strand of drawn fibres [4]. The exact
date of invention of the spinning wheel is unknown, but it is thought to be somewhere
between 500 - 1000 AD. However, it was first illustrated around the middle of the
thirteenth century and its origin lies in either Southern Asia or China [6].
The spinning wheel has undergone various changes with the passage of time until
increasing demand of yarn production led to the development of the ‘spinning jenny’ in
1764 by a British weaver [7]. The ‘spinning jenny’ initially drove 8 spindles from a single
drive source, which were later increased to 120 spindles with further developments in the
technology. The spinning jenny increased yarn production rate and reduced associated
labour. Arkwright’s water frame was the next development in yarn spinning as it coupled
the novel idea of roller drafting with spindle and flyer for twisting [8]. It is technically
considered as the first yarn spinning system. Crompton’s mule spinning is a hybrid and
refined form of its preceding developments. It combined ‘spinning jenny’ and
Arkwright’s water frame and produced comparatively stronger and softer yarns [9]. The
‘self-acting’ mule was developed around 1830, which consisted of automated spinning
elements that were synchronized with the roving feed [10]. The basic version of today’s
ring spinning machine was invented by John Thorp in 1832 with continuous and stable
drafting, twisting and winding operations [9]. The development received prompt
industrial attention and the system has remained as a leading yarn spinning mechanism
until the present day.
As the human civilization further evolved and general level of aesthetic awareness
increased, the demand of premium quality clothing at a higher production rate became an
important requirement. The quest to meet the clothing and fashion requirements of human
society in terms of both quality and production directly influenced the developments in
the yarn spinning industry. From the era of industrial revolution to the current digital age,
not only the performance of classical ring spinning system improved markedly but also
various novel spinning systems were invented and applied commercially. Some new
spinning systems are superior than ring spinning in some ways, but they are still far away
from replacing it due to its excellent flexibility to adapt to the broader requirements of a
spinner. However, the flagship status of ring spinning does not eradicate some serious

10
concerns associated with ring yarns like quality level, down-stream performance and
production rate.
The overwhelming demand of high and repeatable yarn quality with faster yarn
production can be addressed in two possible ways. One possibility is to develop highly
sophisticated novel spinning systems capable of producing excellent quality output and
the other is to improve the existing spinning system to produce almost ideal quality yarns.
Such a novel new spinning system if ever established in the future will require a very long
time to find significant acceptance in yarn spinning industry. The reason is millions of
ring spindles are already installed in thousands of yarn spinning mills worldwide, and
these cannot be replaced instantly. The economy, running costs, technical knowledge and
availability of labour are also some of the various barriers to such a transition. However,
the later approach of modifying and improving the existing spinning system holds much
more potential in terms of practical application. If the modification in existing yarn
spinning technology would be ‘simple’ and cost effective, it would be very quickly
accepted by the spinning industry as a minor change to the existing setup. However,
proposing such a simple modification that can achieve ideal standards of yarn quality on
already well-matured spinning system is the biggest challenge. Certainly, it would require
a systematic study to understand and control the deepest underlying factors that actually
govern the quality of yarns produced on ring spinning system.
2.2. Ring spinning
Since its inception, the ring spinning frame has improved significantly, however its
fundamental working principle has remained almost unchanged, which is illustrated in
Figure 2.2 (a). During the spinning process, a continuous feed of fibres is supplied from
a roving bobbin mounted on a creel above the ring frame. The fibrous strand is drafted by
multiple pairs of rollers (three to four) in top and bottom roller arrangement where a top
roller is pressed against bottom roller through a weighing arm. The rollers rotate at higher
surface speed relative to the preceding pair of rollers to generate a continuous attenuation
effect to a continuous strand of fibres passing between the two roller sets. Once the
required fineness of the strand is achieved, twist is imparted in the fibres through a ring
and traveller assembly. The ring acts as a rail for the traveller, which is driven by a spindle

11
through a linkage provided by the twisted yarn. The spindle also holds a bobbin on top of
it, which continuously winds the produced yarn in the form of a stable package. The small
area between the parallel stream of drafted fibres at the front roller nip and yarn twisting
point is termed as the ‘spinning triangle’. The reason it is called a triangle is parallel
fibrous strand twists and converges into a yarn in a triangular geometry as shown in Figure
2.2(b). The spinning triangle is considered of vital importance in ring spinning process
and thought to significantly influence yarn properties and productivity as most end
breakages occur at this point during spinning.
(a) (b)
Figure 2.2: (a) Working principle and various components of ring spinning system (b)
formation of spinning triangle between front delivery roller and twisting point[11]

12
Increasing demand of yarn production and better quality is the primary motivation for
further improvements in the classical ring spinning system. From production of average
quality, coarser yarns at lower production rates, ring frames are today able to spin much
finer (around 2 tex) yarns at higher speeds and superior quality [12]. The spinning
positions (spindles) on a ring frame have now increased to hundreds or even thousands.
The range of processable raw materials has widened over the decades. The possibilities
of producing fancy effects in ring yarns are numerous. Attempts to improve yarn
production and quality also gave birth to some novel spinning techniques like rotor,
friction, wrap, vortex and air jet spinning. Although new spinning systems offer much
higher productivity (and in some cases even comparable quality to ring yarns), the ring
spinning system still dominates the yarn production market [13]. In a recent survey among
some of the largest yarn producing countries, it was found that there exist more than 200
million ring spindles compared to approximately 5 million rotor spindles [14]. Other yarn
spinning systems were negligible in number compared to ring spinning.
Ring spinning enjoys universal acceptability because of its long history and flexibility to
meet spinner’s requirements. The flexibility of processing a wide range of raw materials
into either fine or coarse yarns makes ring spinning an ideal yarn production system for
meeting demands of a broad range of customers all over the world. In addition, ring yarn
has an optimal structure and strength, which are most suitable for various applications.
Ring spinning is in fact not a very complicated system and because of the possibility to
easily master this technology, frequent labour is also available for its operation [13].
However, in today’s competitive era of rapid and bulk manufacturing, improving the yarn
production rate and quality along with reducing the production costs are essential. The
cost of spinning yarns on a ring frame is a serious concern for a spinner as according to
an estimate, 1 kg of ring yarn costs almost 1 dollar more to produce than a comparable
rotor yarn [14]. The reason is low production rate particularly for finer ring yarns that
require higher twist, which in return reduces yarn delivery speed. Similarly, yarn quality
has some significant issues that need to be addressed. Yarn strength is not ample to bear
weaving stresses, particularly for short fibre yarns such as cotton yarns, and yarns require
application of sizing material as reinforcement (particularly for cotton yarns), which is
neither a value adding or environmental friendly process [15]. Yarn hairiness is another
crucial metric of yarn quality that refers to small protruded hairs on the yarn surface. It is

13
also regarded as a basic cause of pilling that deteriorates fabric appearance particularly in
knitted fabrics as well as in some types of woven fabrics such as bedding sheets [16].
Yarn evenness is an important aspect of yarn quality. Generation of irregular thick and
thin places in a yarn due to various process and material variations leads to uneven and
non-uniform yarns. Weak areas in a yarn are easy prey to downstream stresses and cause
breakages in fabric production, which is highly undesirable for a weaver. An uneven yarn
when woven or knitted into a fabric may spoil fabric appearance by creating random
uneven patterns, which can lead to rejection by the customer. These problems in the oldest
yet most established yarn spinning system are quite serious issues that need to be resolved.
In the following sections, various aspects of the ring spinning process and ring yarn
quality are discussed in detail with explanation on various yarn quality parameters and
indicators. The spinning triangle and yarn structure are discussed in separate sections in
context of various models as well as physical observations and analysis techniques.
Different developments in ring spinning system to improve yarn quality are explained
with categorization into commercially successful and proposed experimental
modifications. Finally, the gaps in existing knowledge on ring spinning process and
opportunities to fill them are explained.
2.3. Yarn quality
Quality can be defined as ‘standard of something as measured against other things of
similar kind; the degree of excellence of some kind’ [17]. Like any product, quality is an
important aspect of ring yarns as it describes their potential for downstream performance
and end user serviceability. There are different aspects or subdivisions of the term ‘yarn
quality’ that refer to various physical properties of yarns. However, in yarn spinning
industry three key quality parameters are generally assessed to evaluate the quality of a
yarn, which are yarn evenness, yarn hairiness and yarn strength. A uniform, strong and
less hairy yarn is considered as high quality while an irregular, weak and hairy yarn is
regarded as a low quality.
2.3.1. Evenness

14
Yarn evenness as suggested by its name refers to the uniformity in fibre mass distribution
along yarn length. It also indicates the extent of variations in mass per unit length as yarn
is not a perfectly regular structure. The variations in uniformity of yarns are generally
inevitable as they are caused by intrinsic variations in fibre characteristics and fibre
arrangement in the roving strand, which is influenced by upstream processing variables
[18]. A yarn that exhibits lower frequency and amplitude of mass variations is considered
as an even yarn and one that possesses a higher degree of variations is regarded as an
uneven yarn. Natural or synthetic fibres are common raw materials for staple yarn
spinning and both of these categories possess variations in terms of length, diameter,
thickness, cross section and shape of fibres. Natural fibres vary due to field and climatic
conditions, as they are different for each fibre while man-made fibres are influenced by
variations in their production process. However, variations in man-made fibres are
comparatively much lower than in natural fibres as they are produced in a relatively
controlled process. Similarly, arrangement and positioning of the fibres within the yarn
also influences yarn evenness directly. Yarn evenness is primarily affected by the average
number of fibres lying in yarn cross section.
During spinning preparatory process, fibres are not distributed uniformly or in an ‘end to
end’ arrangement in the sliver or roving. In fact, it is almost impossible to achieve this
ideal arrangement of fibres because no existing mechanism can handle a fibrous strand
on an individual fibre level. Hence, variations in fibre distribution within yarn are natural
and normal. Evenness is generally measured and represented in terms of coefficient of
variation of fibre mass, which is expressed as a percentage. High coefficient of variation
refers to a yarn that is more irregular. Taking into account the material and upstream
processing variations, a minimum irregularity in yarn is inevitable [19, 20]. This least
amount of variation is expressed as CV(lim) which can be calculated using a relation given
in Equation 2.1 [19].
𝐶𝑉(𝑙𝑖𝑚) = 100 (1+ ∝)
√𝑛 ……………. (2.1)
Where ∝ represents the fibre variability factor and n represents the number of fibres.
Variability factor can be negligible or zero in case of synthetic fibres but important to

15
consider for natural fibres. This relationship also indicates that minimum irregularity limit
will be higher for yarns spun with less number of fibres i.e. for finer yarns.
Average number of fibres in a yarn cross section along its length can be related to yarn
fineness, which can be descried as either weight of certain length of yarn (direct system)
or length of yarn for fixed weight (indirect system). If the number of fibres are
significantly higher than average in a certain section of yarn, a ‘thick place’ is produced
while a considerably lower than average number of fibres may generate a ‘thin place’.
Similarly, slub is another yarn fault, which represents higher concentration of fibres than
a thick place. If various fibres are clustered at one point in the yarn and entangled with
each other, they can produce a ‘nep’ that is smaller in length than a thick place but larger
in diameter. Various yarn irregularities are shown in Figure 2.3.
Figure 2.3: Illustration of various yarn irregularities a) neps b) thick and thin places c)
slubs [21]
Significant effects of yarn evenness on fabric properties are also well established [22, 23].
Occurrence of random thick and thin places on fabric surface deteriorates fabric
appearance and this phenomenon is even more prominent once the fabric is dyed. The
areas of higher fibre mass concentration absorb more light than the rest of the fabric
causing darker spots on the fabric surface, which may lead to fabric rejection by the
customer [24]. However, an interesting case is inducing controlled variations (i.e. thick
places or neps) during yarn spinning by controlled manipulation of the speeds of the
drafting rollers for producing fancy yarn effects (i.e. slub yarn and neppy yarn) [25].
Fancy yarns are then converted into fancy fabrics with non-classical fabric appearance
and distinct aesthetic effects.

16
2.3.2. Hairiness
Yarn hairiness is a structural attribute of staple spun yarns and refers to small fibres
protruding out of main yarn body as shown in Figure 2.4. Yarn is an assembly of staple
fibres (generally) that are held together in an integral structure by twisting them during
yarn spinning process. The yarn is held together by frictional forces from contact of one
fibre with the surfaces of others. The level of twist in a yarn controls the number of surface
contacts and friction levels between these surfaces to control the strength of the yarn.
However, due to certain material and process related variations not all fibres are twisted
into main yarn structure and some of them protrude out of yarn body instead of being
‘tucked into’ it. Hairiness weakens the yarn, as hair fibres do not effectively contribute
towards its structure. The lack of control on fibres at the spinning triangle zone increases
yarn hairiness [26]. If the process has better control on fibres at the spinning triangle zone
by having one end held in delivery rollers and other end in the yarn twisting point, they
can be fully twisted into the yarn body leading to reduced yarn hairiness.
Hair fibres in a yarn can be categorized into three basic types i.e. protruding hair, looped
hair and wild hair [27]. A single fibre falls into one of these categories of hairiness
depending on different conditions it encounter in the spinning triangle zone during yarn
spinning [28]. For example,
1. the leading end of fibre is gripped in yarn twisting point
2. the leading end is absolutely free of any tensions
3. the trailing end is under control of lateral friction with surrounding fibres
4. the trailing end of fibre is free of any stresses
If a particular fibre follows conditions (1) & (4), it may become a trailing hair as its back
end will be protruded out of main yarn body while its front end will be tucked inside it.
If conditions (2) & (3) are met, a leading hair will be formed with conditions exactly
opposite to the trailing hair. Following conditions (2) & (4), a wild hair may be generated
that will be wrapped around the yarn with both ends out of main yarn body. A looped hair
may also be generated in such a situation if both ends of a fibre are trapped within other
fibres and the rest of it protrudes out of the yarn structure. In addition, the fibres lying at
the extreme ends of the spinning triangle have a comparatively higher chance of becoming

17
hairs due to poor control on edges of the triangle [26]. Another cause of yarn hairiness
lies at various sharp and rough contact points, during yarn spinning and further
downstream processing. Interaction of yarn with rough metallic surfaces (i.e. guides,
tensioners, healed wires, etc.) is usually abrasive in nature, which tends to pull fibres out
of the yarn.
Figure 2.4: Pictorial comparison of hairy yarn versus non-hairy yarn[29]
Measurement of yarn hairiness is important to quantify its extent and associate it with
yarn quality. There are two different methods of yarn hairiness measurement applied in
the spinning industry based on optical sensing mechanisms as they differ in their working
principles. Yarn hairiness is represented either by the count of hairs protruding out of a
yarn body of a unit length or expressed as ratio of cumulative length of protruding hairs
to the total length of the yarn specimen. The higher the number or length of protruding
hairs, the poorer the yarn quality will be and vice versa.
Yarn hairiness has a clearly established impact on yarn quality as well as on its
performance during further processing and serviceability of the end product [30-32]. A
hairy yarn is less abrasion resistant because fibres are not well integrated into the yarn.
Hence, these yarns cannot withstand external stresses. A less abrasion resistant yarn
results in increased breakages during fabric production and associated preparatory
processing, which is highly undesirable as it creates fabric defects and reduces weaving
productivity. Poor control on fibres in the spinning triangle zone (as shown in Figure 2.5),
leads to excessive hairiness along with increased fibre fly in the spinning shed. Increased
fly may affect health of the workers and cause serious medical conditions like asthma in
long-term exposure [33-35]. The unwanted loss of fibres also affects the overall yield
output of a spinning mill by increasing the waste content. The accumulation of fibre fly
on contact points of high-speed driving components (such as bearings) can produce fire

18
sparks due to excessive friction between them, which may lead to increased fire risks in
yarn spinning mills.
Figure 2.5: Poor control on fibres lying at the extreme ends of the spinning triangle [26]
The removal of hairs from the fabric surface is necessary before dyeing or printing to
achieve uniform dyeing and surface appearance. Fabric singeing is carried out to burn
and eliminate the protruded hairs from the fabric surface, which increases the processing
costs and time. Fabric pilling is another serious problem that is frequently encountered
with knitted fabrics, which is a condition caused by the appearance of small fibrous balls
clinging to the fabric surface deteriorating its appearance. It is well established that yarn
hairiness is one of the major factors that cause the formation of small fibrous pills when
loose hairs from yarn entangle with each other after few washes and wearing of the clothes
[36, 37].
2.3.3. Strength

19
Like strength of any material or structure, yarn strength can be defined as ability of yarn
to withstand applied force and resist breakages. Yarn strength is an important metric of
yarn quality and an important factor that influences its downstream performance as it
undergoes various stresses during winding, sizing, warping and weaving. A weak place
in the yarn along its length will tend to break under these stresses. Such breakages
negatively affect the productivity of the process as well as quality of the end product. It
produces faults on fabric surface such as those in weaving like missed picks or stoppage
marks [38]. Strength of any material is generally segregated into tensile strength,
compressive strength or shear strength. However, in the case of staple spun yarns, tensile
strength is focused on as yarn is more often exposed to linear stresses along its length.
The main contributors to yarn strength are fibre characteristics and yarn twist [39-41].
Intrinsic strength of fibre directly relates to strength of yarn and using a good quality raw
material lifts the yarn strength. However, using a high quality raw material increases the
production cost of the yarns as well. In addition to strength, other fibre related parameters
such as its diameter, length and uniformity of diameter and length also influence yarn
strength. Orientation of fibres is an important factor for yarn strength. The fibres are
arranged parallel to each other through a series of drafting passages on carding machine,
draw frame, roving frame and ring frame. The input material on the ring frame is roving,
which is a drafted and slightly twisted strand of fibres. Appropriate fibre orientation
results in improved yarn strength as most of the fibres are twisted into yarn structure and
contribute towards yarn strength.
The relationship of yarn twist and strength is non-linear, as an increase in yarn twist
initially increases yarn strength up to a certain saturation point and then negatively
influences it by decreasing the strength [42, 43]. When fibres are not twisted they are
parallel to each other and possess no inter-fibre cohesion. However, twisting them
together increase their cohesion to a certain degree and converts them into a yarn. Over-
twisting of fibres increases twist angle to such an extent that fibres become quite inclined
to yarn axis, which results in a reduction of their contribution towards yarn strength. Over-
twisting also increases residual torque in yarns, which causes not only yarn snarling but
also unwanted spirality in knitted fabrics. Increase in yarn twist means a reduction in yarn
delivery rate, which negatively influences spinning productivity. In this regard, it is

20
important to use an optimal balance of both factors i.e. fibre strength and twist to achieve
a stronger yarn without increasing the yarn production cost.
2.4. Spinning triangle
The spinning triangle is considered to be the most critical and fragile area in the ring
spinning process and has been the focus of yarn quality related research for many decades
[44-46]. It would not be exaggerative to say that various structural characteristics and
physical properties of ring yarns are decided at the spinning triangle zone, as fibre
migration and their underlying arrangement within the yarn is actually controlled at this
point. End breakages during yarn spinning mostly occur at the spinning triangle zone due
to dynamic spinning stresses being applied on a delicate, drafted fibrous strand during
twisting. Various efforts to improve ring yarn quality by altering the classical ring
spinning system (as discussed in section 2.6) actually attempt to modify and improve the
spinning triangle in some way. The existing literature on the spinning triangle can be
listed in two categories. One relates to different models that explain the fibre arrangement
within the spinning triangle zone and distribution of spinning stresses in it. The second
category involves some attempts to physically observe and image spinning triangle to
understand its geometry, dynamics and behaviour with further implications on yarn
quality.
2.4.1. Various models of spinning triangle
The spinning triangle is a transition zone in the ring spinning process where a parallel
strand of drafted fibres is converged into a yarn by twisting. This transition zone is very
small and its dimensions vary due to the spinning process parameters. The spinning
triangle is almost hidden between the curvatures of opaque front drafting rollers and
rapidly changes its position and shape under influence of the spinning tension. The
inaccessible location and tiny size of spinning triangle make it quite difficult to physically
observe and analyse it. Therefore, various models of the spinning triangle have been
developed to understand its actual structure and nature.
2.4.1.1. Tension distribution in classical ring spinning triangle

21
One important feature of the classical spinning triangle is non-uniform distribution of
spinning tension between fibres lying inside it, which means that some fibres are under
higher tension than others are. The reason of uneven tension distribution in fibres is the
difference in their path lengths from roller nip line to the yarn twisting point as shown in
Figure 2.6. The fibres lying at the edges of the triangle follow longer paths to reach the
yarn twisting point compared to fibres lying at its centre [47]. Jangir [48] estimated the
amount of tension incurred by individual fibres at different positions in the spinning
triangle by proposing a theoretical model. The fibres lying at the extreme sides of the
spinning triangle were found to be under higher stress as compared to the fibres sitting in
the centre of triangle. The amount of stress incurred by a single fibre is a function of (and
directly correlates to) its distance from the centre of the triangle. If the spinning triangle
is assumed to be symmetrical with width and height of 3 mm each, the fibres lying at the
edge of the triangle (Fe) cover almost 11.6 % longer path than the fibres lying in the centre
of the triangle (Fc). It was also observed that an end breakage during yarn spinning occurs
if the amount of tension applied on the fibres exceeds their physical strength. It was
proposed that reducing the width of the spinning triangle could reduce the tension
differences among fibres.
Figure 2.6: Path length difference of the fibres lying at the edge (Fe) and centre (Fc) of the
spinning triangle
The difference in the fibre tension at the spinning triangle zone is also believed to be the
underlying cause of fibre migration, which decides the final arrangement of the fibres

22
within a yarn and controls its physical properties or quality (detailed in section 2.5.1.1).
Therefore, varying the amount of tension on fibres in the spinning triangle zone may
influence the yarn quality in some way. One possibility to affect the fibre tension is to
skew the spinning triangle in either left or right directions by diagonal offsetting method
(detailed in section 2.6.1.4). Stress distribution among fibres in a classical as well as
skewed spinning triangle is modelled through analytical modelling methods and stress on
individual fibres is calculated through a numerical simulation [49, 50]. It was observed
that uniformity in tension distribution is less for an asymmetric spinning triangle
compared to a classical spinning triangle. The patterns of stress distribution in symmetric
as well as in asymmetric spinning triangles are shown in Figure 2.7. The number of fibres
on each side of the skewed spinning triangle is unequal due to ‘skewness’ of its shape. In
the case of a narrower and longer spinning triangle, the tension distribution is relatively
uniform as a previous study proposed [48]. The diagonal offset of the spinning triangle
towards either left or right sides increases the amount of tension on fibres lying in the
opposite side of the spinning triangle while the fibres in the corresponding side become
slack [51]. It can be seen in Figure 2.7 that the range of tension being applied on fibres in
asymmetric spinning triangles is broader than symmetric spinning triangles.
Figure 2.7: Patterns of stress distribution in spinning triangle zone with left offset (d = -
1.244), right offset (d = 1.244) and no offset (d = 0) configurations [51]
Another interesting effect of differences in fibre tension at spinning triangle zone is
snarling or twist liveliness in the yarn. In case of classical spinning triangle that is nearly

23
symmetrical, the edge fibres are twisted under higher tension. This tension is then
converted into potential energy once the fibres are spun into a yarn. The fibres tend to
release this potential energy through snarling to come to a more ‘relaxed’ state whenever
the yarn is kept without tension. When these yarns are knitted into a fabric and come in a
relaxed state, they tend to release their residual energy through untwisting leading to
unwanted angular displacement in their positions within the fabric. This causes an
unbalanced fabric structure and the phenomenon is referred as fabric spirality [52]. The
theoretical modelling of stress distribution in a spinning triangle suggests that this
unwanted potential energy or residual torque is less in the yarns produced in a skewed
spinning triangle arrangement compared to regular ring spun yarns [53]. The stress
distribution in a skewed triangle follows a non-uniform pattern as fibres on one end are
under significantly higher stress compared to the other end, which results in reduced
overall residual torque in the yarn. However, horizontal offsetting beyond a certain
threshold applies quite high amounts of stress on fibres at one end in the spinning triangle,
which may lead to excessive breakages. In a further attempt to investigate the effects of
stress distribution in the spinning triangle on the yarn residual torque, theoretical models
were developed [54, 55]. It was observed that high twist resulted in higher tension on the
edge fibres and higher compressive force on the central fibres of the triangle. The higher
tension on the edge fibres resulted in higher residual torque in the yarn. In addition, the
symmetric spinning triangle resulted in slightly higher residual torque in yarns as
compared to the asymmetric (right angled) spinning triangle, which agrees with a
previous study [53].
A finite element method (FEM) based model of the spinning triangle is developed to
further refine the understanding on tension distribution in the spinning triangle zone [56].
Various process factors are selected to study their effects on fibre tension distribution
including those that are not considered in previous models due to intrinsic limitations of
the modelling technique. Two such factors are frictional contact of fibres with drafting
rollers and fibre torsional strain. It was observed that the yarn count, twist, spinning
tension and yarn inclination angle significantly influence fibre tension and torsion in the
spinning triangle. However, the results suggested lack of significant influence of friction
between the fibres and drafting rollers on stress distribution in the spinning triangle zone.

24
This work concluded that tension distribution among fibres in classical (as well as
skewed) spinning triangles is non uniform and sensitive to various process related
variations. The pattern of tension distribution in fibres affects the structural and physical
characteristics of the resultant yarns. This pattern of tension distribution can be changed
by physically modifying the shape of the spinning triangle. Ideally, a minimum width of
the spinning triangle can minimize tension differences among fibres, resulting in reduced
end breakages and increased spinning efficiency. However, it is virtually impossible to
provide an equal amount of tension to all fibres during twisting in the current ring
spinning arrangement.
2.4.1.2. Tension distribution in modified ring spinning triangle
In addition to the attempts to understand tension distribution in a classical spinning
triangle, some studies model the fibre tension in spinning triangles that are formed in
modified versions of ring spinning. Liu et al [57-59] authored a series of publications
focusing on the development of various models of the spinning triangle and analysed
stress distribution among fibres. A theoretical model was developed to explain hairiness
generation at the spinning triangle zone in Siro spun yarns [57]. The effect of two
parameters i.e. angle between roving strands at the front roller nip and horizontal offset
of the convergence point was investigated. It was observed that increased horizontal offset
and angle between roving strands reduced yarn hairiness. In addition, a narrower and
symmetrical spinning triangle resulted in less hairy yarns. A finite element model of the
Siro spinning triangle suggested that initial strain of the fibres is an important influential
parameter that affects the tension distribution in the spinning triangle and residual torque
in the resulting yarns [60]. The theoretical modelling of the fibre tension of the Solo-spun
spinning triangle suggested that tension distribution followed an ‘inverted U’ pattern
similar to a classical ring spinning triangle [58]. The division of the fibres in sub strands
through Solo spinning roller also distributed spinning tension into each strand. However,
total tension in each strand was significantly different.
Another study discusses the tension distribution in spinning triangle formed by
introducing a false twister in ring spinning process. The idea of false twisting is to first
impart and then release high twist from fibrous strand to produce low torque yarns (further
detailed in section 2.6.2.1.6). The model investigates the effect of false twisting on tension

25
distribution in spinning triangle leading to its influence on yarn quality [61]. The speed
ratio (rotational speed of the ring spindle to rotational speed of false twister) and the
inclination angle of drafted fibrous strand were noticed as the key parameters that affected
fibre tension. The stress distribution among fibres was uniform for a higher speed ratio as
the respective yarns exhibited least residual torque and a lower number of wet snarls.
Yarns produced with lower speed ratio showed improved quality in terms of tenacity,
elongation and evenness.
This observation leads to an interesting conclusion that achieving stronger and low torque
yarns simultaneously is probably not possible. The reason is a certain degree of variation
in fibre stress at the spinning triangle zone is essential for effective fibre migration to take
place, which imparts strength to the yarn by improving inter-fibre cohesion. However, it
also produces unwanted residual torque as migrating fibres are stretched among
concentric layers of fibres within a yarn and they have a natural tendency to ‘relax’ by
releasing their tension. If stress distribution among fibres is made more uniform at the
spinning triangle zone to reduce yarn residual torque as discussed above, the extent of
fibre migration will also minimize (according to classical fibre migration theory). This
may negatively affect resultant yarn strength as observed in case of yarns made with the
false twister at lower speed ratio.
2.4.1.3. Tension distribution in ‘imaginary’ ring spinning triangles
Most of the models of the spinning triangle investigate the fibre tension distribution in
classical and modified ring spinning arrangements as discussed in previous sections.
However, few studies attempt to find out the ‘particular shape’ of the spinning triangle
that can achieve desired pattern of tension distribution among fibres. Two such studies
assume hypothetical arrangements of fibres at spinning triangle zone with a raised fibrous
part and fibre arrangement in concentric circles [59, 62]. Two different models of the
spinning triangle are developed for both arrangements and tension distribution among
fibres was estimated. The spinning triangle with a raised part is an assumed three-
dimensional geometry of the spinning triangle, where a portion of fibres is raised above
the roller nip line as illustrated in Figure 2.8 (a). The raised part forms exactly at the centre
of the spinning triangle due to compressive forces acting from both sides of the spinning
triangle. The spinning triangle is then divided into three regions i.e. left, right and raised
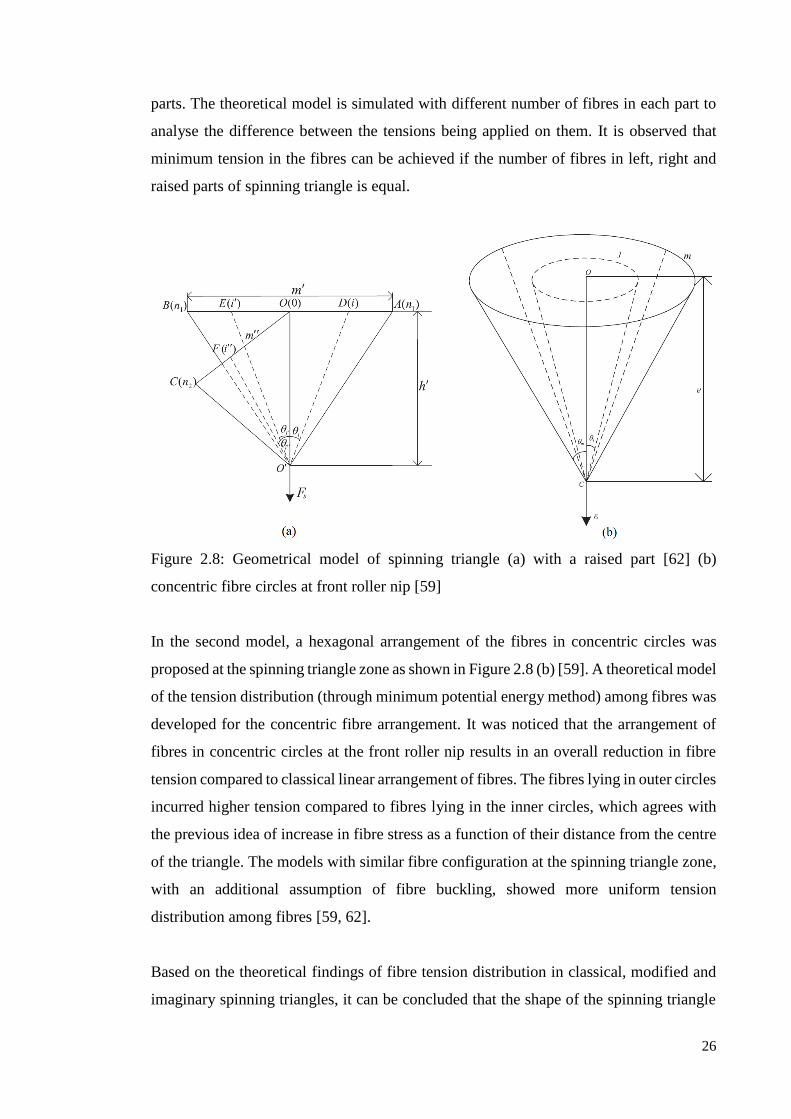
26
parts. The theoretical model is simulated with different number of fibres in each part to
analyse the difference between the tensions being applied on them. It is observed that
minimum tension in the fibres can be achieved if the number of fibres in left, right and
raised parts of spinning triangle is equal.
Figure 2.8: Geometrical model of spinning triangle (a) with a raised part [62] (b)
concentric fibre circles at front roller nip [59]
In the second model, a hexagonal arrangement of the fibres in concentric circles was
proposed at the spinning triangle zone as shown in Figure 2.8 (b) [59]. A theoretical model
of the tension distribution (through minimum potential energy method) among fibres was
developed for the concentric fibre arrangement. It was noticed that the arrangement of
fibres in concentric circles at the front roller nip results in an overall reduction in fibre
tension compared to classical linear arrangement of fibres. The fibres lying in outer circles
incurred higher tension compared to fibres lying in the inner circles, which agrees with
the previous idea of increase in fibre stress as a function of their distance from the centre
of the triangle. The models with similar fibre configuration at the spinning triangle zone,
with an additional assumption of fibre buckling, showed more uniform tension
distribution among fibres [59, 62].
Based on the theoretical findings of fibre tension distribution in classical, modified and
imaginary spinning triangles, it can be concluded that the shape of the spinning triangle

27
controls the tension among fibres lying inside it. These differences in fibre tension trigger
fibre migration that affects the resultant yarn properties as further discussed in section
2.5.1. The degree of fibre migrations may be increased or decreased by changing the
shape of the spinning triangle. However, it is also important to note that higher difference
among fibre tension may also lead to higher residual torque in yarns, which is undesirable
especially in terms of its effects on knitted fabric spirality. Utilising the minimum width
of a spinning triangle can lead to more uniform tension distribution among fibres resulting
in lower residual torque in yarns but could also affect the extent of fibre migration. The
hypothetical arrangements of fibres in concentric circles and spinning triangle with a
raised part are almost impossible to achieve in current yarn spinning arrangement. The
pressurized contact of drafting rollers necessarily delivers only a linear array of fibres to
the spinning triangle zone.
2.4.2. Imaging and physical observation of ring spinning triangle
The physical dimensions of the ring-spinning triangle are as small as few millimetres in
terms of its width and height [63, 64]. In addition, it is hidden between opaque delivery
rollers of the drafting system, which makes it a quite challenging task to get a clear view
without disturbing its fragile geometry. The fibres at the spinning triangle zone are a few
hundred in number and flow at a speed of around 10-15 m/min. The shape and position
of spinning triangle also varies under influence of the material variations and spinning
stresses making the physical observation even more difficult. However, few studies are
reported in literature that attempt to physically observe a spinning triangle through
different imaging setups.
Wang et al [26] explained the formation of yarn hairs at the spinning triangle zone by a
series of close up images acquired through a lipstick or bullet type CCD camera that was
mounted in front of the delivery rollers. One image captured through this arrangement is
shown in Figure 2.9. Various types of hairs were also classified i.e. leading hairs, trailing
hairs and loop hairs. It was noticed that the fibres lying at the edges of spinning triangle
and short fibres tend to become hairs instead of integrating into a yarn due to excessive
stress (leading to breakage) and poor control respectively. Although, viewing the spinning
triangle by putting a camera in front of the delivery rollers gives a snapshot of fibre
arrangement at spinning triangle zone it does not provide a complete picture of the

28
spinning triangle. The base of the triangle lies deep inside the delivery rollers and cannot
be exposed due to curvature of the opaque rollers. In addition, the images acquired
through this method cannot be used to analyse the exact dimensions of the spinning
triangle, which is important to study the effects of the spinning triangle on resultant yarn
quality.
Figure 2.9: An image of spinning triangle taken using micro CCD camera [26]
Another method applied to observe the spinning triangle was proposed by Najar [65] as
he replaced the top drafting roller with a transparent plastic roller to expose the complete
spinning triangle. A CCD (charged couple device) micro camera was used for viewing
the spinning triangle through the transparent roller. Recently, this technique was
improved by using a high-resolution and high-speed camera to acquire better quality
images of the spinning triangle [63, 64]. Some of these images are shown in Figure 2.10.
These images were used to study the effects of various spinning process parameters such
as spinning speed, yarn linear density and compact spinning pressure on the physical
dimensions of the spinning triangle and discussed in context of resultant yarn quality.

29
Figure 2.10: Some of the spinning triangle images captured through transparent roller
arrangement [63]
Although, using a transparent roller provides a complete and (often) clear picture of the
spinning triangle it is also important to note that a plastic roller does not possess similar
physical properties as that of a regular drafting roller, which is made up of rubber. The
rigid plastic material may not form a strong nip with bottom steel roller during drafting
which is essential to exert proper control on the fibres. The lack of friction between front
drafting rollers can cause excessive fibre slippage, which will not only increase the
number of end breakages but will also potentially deteriorate the original fibre
arrangement within the spinning triangle zone. Hence, the images of the spinning triangle
achieved through a clear plastic roller are questionable in terms of representation of
‘actual’ spinning triangle. In addition, the spinning triangle is highly dynamic transition
stage in the spinning process, which continually changes its shape and geometry due to
process and material related variations. The studies, which discussed the use of a
transparent roller only focused on few static images of the spinning triangle, which did
not represent the highly dynamic nature of the spinning triangle. Hence, in order to study
the actual spinning triangle and establishing its effects on yarn quality, both of these
factors need to be taken into account.
Badehnoush and Yazdi [66] observed the variations in the spinning triangle width through
a CCD camera and correlated it with the yarn evenness. It was noticed that increase in
width of the triangle could be directly related to thick places in the yarn. Huang and
Oxenham [67] studied twist insertion in the spinning triangle zone and explained its effect
on the yarn strength through predictive modelling followed by experimental observations.
Another study focused on observation of dynamic spinning tension distribution in fibres
[68]. To imitate the spinning triangle and physically measure tension distribution, a set of
rubber filaments was used as fibres and a spring based tension sensor was applied to
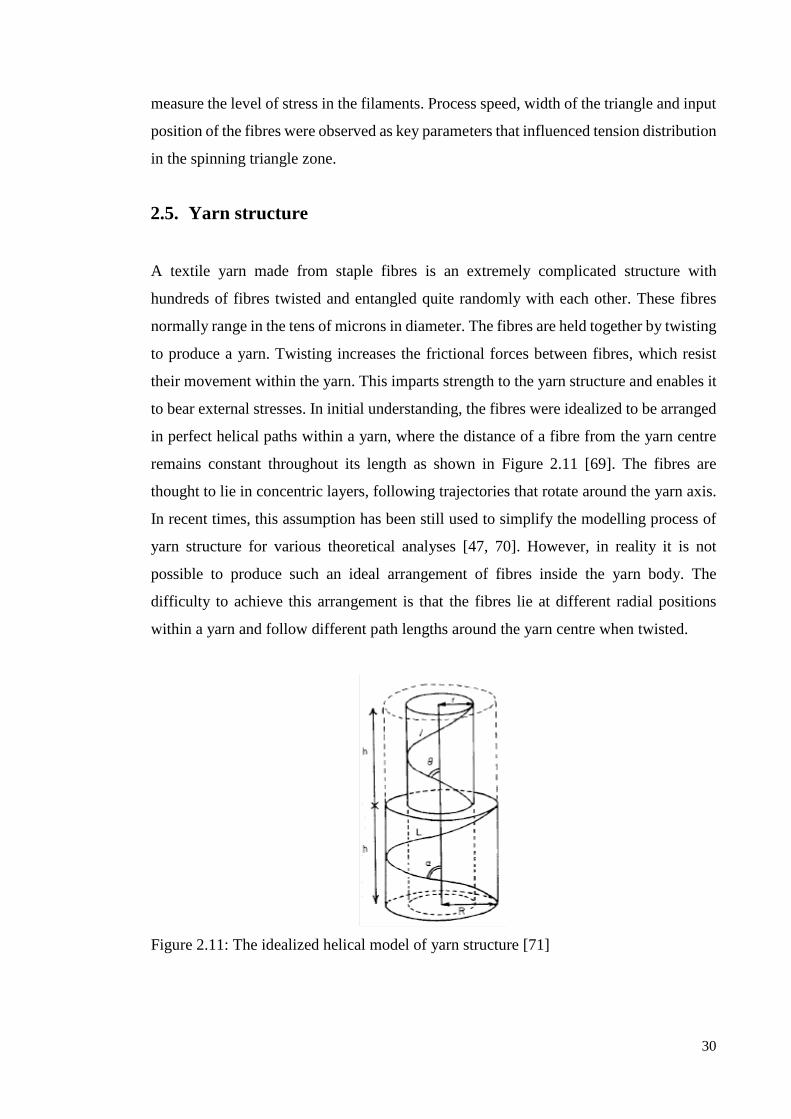
30
measure the level of stress in the filaments. Process speed, width of the triangle and input
position of the fibres were observed as key parameters that influenced tension distribution
in the spinning triangle zone.
2.5. Yarn structure
A textile yarn made from staple fibres is an extremely complicated structure with
hundreds of fibres twisted and entangled quite randomly with each other. These fibres
normally range in the tens of microns in diameter. The fibres are held together by twisting
to produce a yarn. Twisting increases the frictional forces between fibres, which resist
their movement within the yarn. This imparts strength to the yarn structure and enables it
to bear external stresses. In initial understanding, the fibres were idealized to be arranged
in perfect helical paths within a yarn, where the distance of a fibre from the yarn centre
remains constant throughout its length as shown in Figure 2.11 [69]. The fibres are
thought to lie in concentric layers, following trajectories that rotate around the yarn axis.
In recent times, this assumption has been still used to simplify the modelling process of
yarn structure for various theoretical analyses [47, 70]. However, in reality it is not
possible to produce such an ideal arrangement of fibres inside the yarn body. The
difficulty to achieve this arrangement is that the fibres lie at different radial positions
within a yarn and follow different path lengths around the yarn centre when twisted.
Figure 2.11: The idealized helical model of yarn structure [71]

31
To produce an ideal helical arrangement, each individual fibre needs to be delivered from
the drafting rollers at a different rate based on its length and position in the spinning
triangle zone, which is certainly not possible even through most modern yarn spinning
technologies available today. In addition, if such a structure could ever be achieved at
some point in the future, it would not be of much benefit, as it will clearly lack the
essential cohesion and integrity among the fibres, which is necessary to hold them
together. An “ideal” helical yarn structure would not only be least resistant towards any
external stresses but will also be extremely fragile as the concentric fibre layers will
literally ‘slide off’ each other upon any slight interference of a tensile nature. Hence, in
order to produce a stable and effective yarn structure, some kind of ‘connectivity’
between fibres is unavoidable.
2.5.1. Fibre arrangement within a yarn
2.5.1.1. Longitudinal arrangement of fibres
The arrangement of fibres within a yarn can be analysed in two different aspects i.e. along
yarn length and within its cross section. The connectivity or intertwining of the fibres
with each other can be analysed by studying their longitudinal arrangement.
2.5.1.1.1. Fibre migration
An initial theory opposing ideal helical structure of yarns, suggested that the fibres lying
on the yarn surface are also ‘tucked’ inside its main body [72]. The tucking-in of the
surface fibres is only possible if they are somehow entangled with each other within a
yarn and travel through overlapping fibrous layers. Morton and Yen showed that the
fibres frequently change their radial positions relative to yarn axis throughout their length
[6]. The fibres frequently move between the core and the surface of the yarn through
intermittent fibrous layers under influence of the spinning tension. This phenomenon of
fibre radial displacement is termed as ‘fibre migration’ that is considered to be providing
required strength to the yarn structure through effective integration of fibres. The amount
of tension at the yarn twisting point is not equal for all the fibres emerging from drafting
rollers because of their different positions at the nip line of delivery roller as already
discussed in section 2.4.1. Fibres lying in the centre of the drafted strand are slack

32
compared to the fibres lying at its edges. As the distance of a fibre from the twisting point
increases, the spinning tension applied to it will be higher. The uneven distribution of
spinning tension among fibres is the key reason that causes fibre migration, as fibres under
higher stress tend to exchange their positions with slack fibres in order to release tension,
hence pushing them out of the yarn core toward the yarn surface.
The study of fibre migration within a yarn was initiated by employing the tracer fibre
technique, which was previously applied to observe fibre displacement in lap sheets and
slivers in yarn preparatory processing [73]. The method works by mixing a small amount
of black dyed fibres (~0.1% by weight) with white cotton fibres (or other textile fibres)
either in raw stock or by systematic blending over the draw frame [74]. Once the yarn is
produced, it is immersed in a solution of suitable refractive index (usually methyl
salicylate), which fades out the uncoloured fibres and the tracer fibres are visualized under
a microscope. The trajectory of the tracer fibre is then analysed against the yarn
boundaries and it generally resembles a non-uniform sine wave as shown in Figure 2.12.
These experimental evidences clearly reveal that a fibre follows an irregular path inside
a yarn as it randomly comes closer and moves away from the yarn centre. The proof of
occurrence of fibre migration inside a yarn leads to rejection of the “ideal” helical model
of yarn structure.
Figure 2.12: Trajectory of tracer fibre within a yarn[74]
Riding [75] has extended the application of the tracer method on filament yarns by
introducing a coloured filament in static (experimental) arrangement as well as in
dynamic spinning conditions. The tracer filament when observed under a microscope
showed clear trends of migration as its trajectory exhibited varying wavelength and
amplitude along the length of the yarn, similar to staple fibre yarns. Further extending his
experiments, Riding [76] improved the experimental setup by applying a mirror in the
yarn immersion bath to observe tracer filament from two different positions that are at

33
right angle to each other. The visualization of tracer fibre trajectory was improved under
this arrangement and fibre migration was observed with better positioning accuracy. It
allowed quantitative analysis of the path followed by the fibre to characterise the extent
of fibre migration. The results suggested a strong and direct correlation of the filament
migration with the amount of twist inserted in the yarn.
2.5.1.1.2. Characterisation of fibre migration
Hearle et al [77] defined the ideal fibre migration as “one in which the fibre migrates
regularly and uniformly from the outside to the centre of the yarn and then back to its
surface, in such a way that the density of packing of fibres in the yarn is constant
throughout the yarn”. Various parameters are proposed to characterise the extent of fibre
migration by taking into account the variations in tracer fibre trajectory. The yarn cross
section is divided into multiple concentric circles to establish various zones to track fibre
movement through them. Frequency of reversal refers to the number of reversals
undertaken by a fibre in direction of migration through various zones of a yarn. Hearle et
al [77] have further proposed the characterisation of fibre migration analogous to electric
current signals and suggested three basic parameters to describe fibre migration i.e. mean
fibre position, root mean square deviation and mean migration intensity. Mean fibre
position refers to the overall tendency of a fibre to be near the surface or centre of the
yarn. The magnitude of deviation from mean fibre position is represented by root means
square deviation. Mean migration intensity described the rate of change of fibre radial
position with respect to yarn axis. Magnitude of deviation of mean fibre position and
mean migration intensity together described equivalent migration frequency.
2.5.1.1.3. Causes of fibre migration
Fibre migration is an important component of the strength of a yarn. Fibre migration has
been shown to be influenced by a number of factors in the spinning process including
twist frequency [78-80], linear density [80], fibre and yarn spinning tension [78, 79, 81],
fibre position [82] and fibre initial modulus [83] . The twist level in the yarn appears to
have the most influence with the modelling of Hua et al showing that a migration
saturation point was reached at high twist levels [84]. The position and properties of the
fibre within the yarn are also quite important with fibres in the surface of the yarn

34
exhibiting less migration than those in the intermediate fibrous layers of a yarn. As twist
insertion and fibre positioning occurs within the spinning triangle, a better understanding
of the spinning triangle may enable improvements in yarn twisting through promotion of
fibre migration.
2.5.1.2. Cross sectional arrangement of fibres
The study of arrangement and position of individual fibres in yarn cross section is another
perspective to look at yarn structure similar to studying their longitudinal arrangement
within a yarn. The cross sectional analysis is even more frequently applied than tracer
fibre technique in the past to study the arrangement of fibres in yarn cross section,
probably due to ease of its application and amount of information achieved through it.
However, it is important to note that both yarn cross sectional analysis and tracer fibre
method provide distinct sets of information about internal yarn structure, which
complement each other but any method alone does not fully describe the yarn structure.
For example, cross sectional analysis does not reveal information about fibre migration
and similarly the tracer fibre method does not tell about radial arrangement of all fibres
lying inside the yarn. Some important features of yarn structure that are commonly
studied by analyzing yarn cross sections include (but not limited to) yarn diameter, yarn
packing density and number of fibres in the yarn cross section.
Schwarz [85] initially published cross sectional images of yarns of various fineness
produced from different materials as shown in Figure 2.13. The arrangement of the fibres
was analyzed inside yarn cross section and spinning process variables that influenced this
arrangement were discussed. Yarn twist was nominated as the essential radial force that
pushed the fibres towards the yarn centre and ‘packed’ them close to each other inside
the yarn. Hearle and Bose [86] studied the arrangement of filaments in a yarn cross section
through solidifying yarn specimen in a resin medium and then slicing and observing it
under the microscope. It was observed that yarns tend to approach a uniform closely
packed structure but there is significant asymmetry and irregularity in yarn cross sectional
profile [71].
It was also noticed that the centre of close packing of fibres did not always lie on yarn
centre and yarn shape (or periphery) is more like a polygon (due to irregular fibre

35
arrangement) rather than a perfect circle. Overall packing of fibres within the yarn cross
section is represented by yarn packing density, which is defined as the ratio of the area
covered by the fibres within the yarn to the total area of the yarn. The total area of yarn
is measured by drawing a circumferential boundary around the yarn. Radial packing
density is another parameter that explains the packing of fibres with respect to their radial
distance from yarn centre.
Figure 2.13: Yarn cross sectional images (a) cotton yarns of various fibre fineness (b)
viscose filament yarn (c) plied nylon filament yarn [85]
Yarn cross sectional analysis method was applied to study the effect of various process
and material related variables on fibre arrangement inside yarn structure [87-89]. Some
parameters that were evaluated for their effects on yarn packing density included yarn
twist, yarn linear density, spindle speed, compact spinning and fibre drafting parameters.
Yilmaz et al [88] have studied packing density of various yarns produced on different
compact spinning systems as shown in Figure 2.14. It was observed that the packing
density in compact yarns was high in the yarn centre and decreased towards yarn surface,
which was similar in the case of classical ring yarns. The overall packing density of the
compact yarns was higher (up to 30%) than classical ring yarns. However, yarns produced
on different compacting systems (varying in terms of principle and design) did not exhibit
any significant differences in their packing densities. Hussain et al [89] have noticed that
increments in yarn twist and spindle speed increase yarn packing density. It was also
observed that packing density is higher for finer and less hairy yarns compared to coarser
and hairier yarns respectively. In addition to ring yarns, the cross sectional analysis

36
technique was also applied on yarns produced from spinning techniques other than ring
spinning to investigate their internal structure [90-92].
Figure 2.14: Cross sectional view of compact spun yarns produced on different compact
spinning systems [88]
Basal [93] proposed the application of digital volumetric imaging system to study yarn
structure. The method worked by fine continuous slicing of a yarn specimen embedded
in a polymer block in an automated manner. An imaging system captured yarn cross
sectional images at each sectional slice, which were then analysed on a digital computer
to understand arrangement and migration of the fibres within the yarn. Although, the
proposed method provided superior insight into the yarn structure compared to classical
microtomic technique, it only analysed very limited yarn length (1-2mm) and was
economically inefficient.
2.5.2. Effects of structural arrangement of fibres on yarn properties
The variations in ring spinning process parameters influence the arrangement of fibres in
yarn both along its length and in its cross section. These variations in fibre arrangement
or yarn structure also affect physical and mechanical properties of the yarns. Various
studies focused on investigation of the linkages between structure and properties of ring
spun yarns [94-102]. Basal and Oxenham [94] applied the tracer fibre method to
investigate the structural differences between classical and compact spun yarns to find
out the underlying reasons of superior quality of compact yarns. The compact spinning
system employed for this study was an add-on attachment type and worked on air suction
compacting method. It was found that rate and amplitude of the fibre migration is higher
in compact yarns compared to the classical ring yarns. This means that fibres are

37
integrated well into the compact yarn, which potentially increase yarn strength. However,
the type of spinning system employed for producing yarns did not significantly affect
mean fibre position. Yarn twist was found directly correlated with fibre migration
intensity.
Another study also suggested significant structural differences between classical ring and
compact spun yarns through a method of reconstructed yarn segments [95]. The packing
density and average twist angle of compact yarns were higher than those of non-compact
yarns, which was explained as basis for improved fibre integration that led to enhanced
yarn quality. Soltani and Johari [98, 99] compared the structural arrangement and fibre
migration in Siro, Solo, compact and classical ring yarns. The compact spinning method
employed for this study was mechanical condenser type. It was noticed that Siro yarns
possessed the highest magnitude in terms of fibre migration parameters (i.e. mean fibre
position, root mean square deviation, migration frequency and migration factor)
compared to other yarn types. Compact spun yarns exhibited the highest migration
coefficient value. However, a comparison of properties of all four yarns produced on the
different systems clearly showed superior quality of Siro yarns (in terms of tenacity,
evenness and hairiness) followed by compact, solo and classical ring yarns respectively.
Guo et al [100] studied the structural characteristics of low torque yarns produced by
using a false twister in ring spinning to counter fabric spirality issues. The low torque
yarns produced by a modified spinning system (detailed in section 2.6.2.1.6), possessed
significantly improved quality compared to the normal ring yarns. The evaluation of
structure of both types of yarns showed clear differences in terms of fibre arrangement as
low torque yarns exhibited a unique fibre migration pattern, which featured the ‘local
reversion’ phenomenon. Most of the fibres in low torque yarns follow deformed non-
concentric conical helix paths. A considerable percentage of these fibres produced small
knots as swift migration occurs (i.e. more radial movement in shorter yarn length). All of
these effects (as shown in Figure 2.15) together ‘bound’ the fibres and enhanced the
intrinsic cohesion of the yarn structure resulting in superior quality. Cross sectional
analysis showed that low torque yarns have higher overall packing density compared to
classical ring yarns with more concentration of fibres near the yarn core [101].
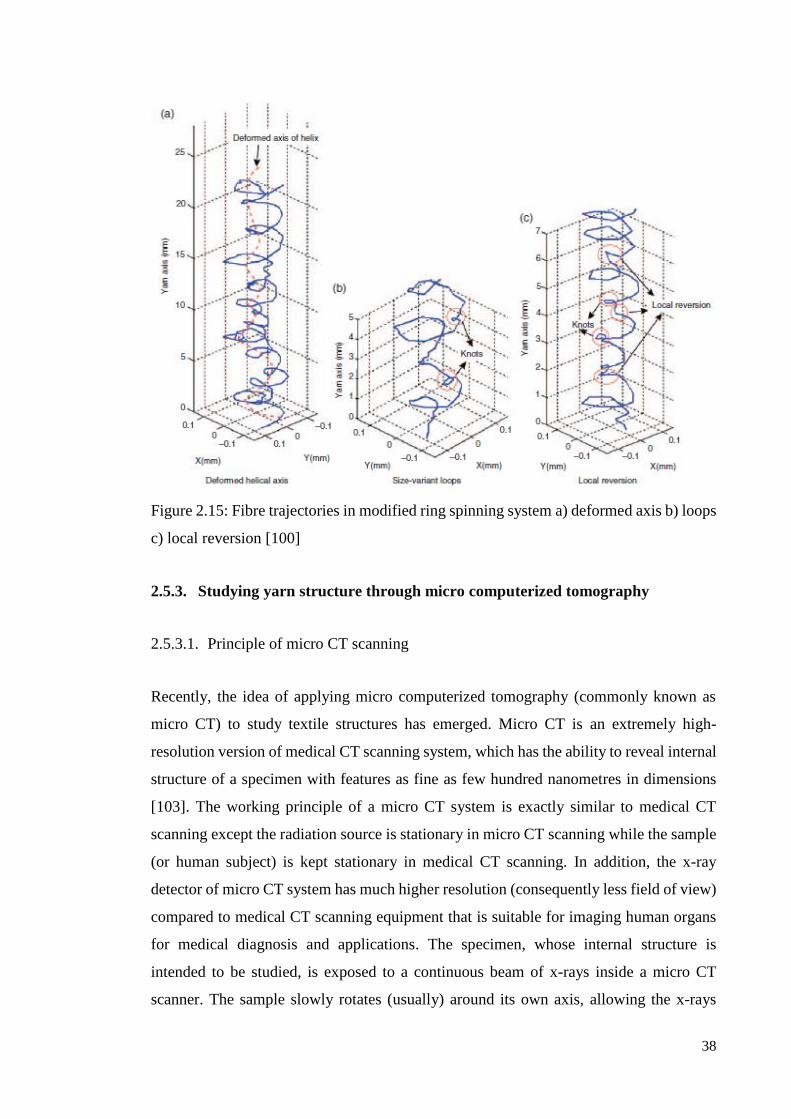
38
Figure 2.15: Fibre trajectories in modified ring spinning system a) deformed axis b) loops
c) local reversion [100]
2.5.3. Studying yarn structure through micro computerized tomography
2.5.3.1. Principle of micro CT scanning
Recently, the idea of applying micro computerized tomography (commonly known as
micro CT) to study textile structures has emerged. Micro CT is an extremely high-
resolution version of medical CT scanning system, which has the ability to reveal internal
structure of a specimen with features as fine as few hundred nanometres in dimensions
[103]. The working principle of a micro CT system is exactly similar to medical CT
scanning except the radiation source is stationary in micro CT scanning while the sample
(or human subject) is kept stationary in medical CT scanning. In addition, the x-ray
detector of micro CT system has much higher resolution (consequently less field of view)
compared to medical CT scanning equipment that is suitable for imaging human organs
for medical diagnosis and applications. The specimen, whose internal structure is
intended to be studied, is exposed to a continuous beam of x-rays inside a micro CT
scanner. The sample slowly rotates (usually) around its own axis, allowing the x-rays

39
beam to penetrate it at various angles. The attenuated x-rays beam that passes through the
sample is continually recorded by the detector placed on the other side of the specimen.
The selection of x-ray energy level depends on the density of the specimen being scanned.
The angular steps of rotation of the specimen and time of exposure to the x-rays beam are
adjustable depending on the feature size that needs to be resolved. The principle of micro
CT system is shown in Figure 2.16.
Figure 2.16: Working principle of micro computerized tomography system
The collected x-rays projections by the detector are processed and merged together to
produce a virtual three-dimensional model of the specimen, which contains information
about its internal structure. Usually, the developed volumetric model is sliced along cross
sectional plane using specialized software to reveal the internal structure and tiny features
of the specimen. The number of cross sectional digital images is usually in order of
thousands as they are sliced at an interval of few microns length (equivalent to CT
scanning resolution). One of the biggest advantages of the micro CT system is non-
invasive and non-destructive nature of its operation, which is very suitable for soft
specimen like textile fibres and yarns. However, the major limitations associated with
micro CT scanning are very limited field of view (few millimetres only) and enormous
amount of time required for scanning (several hours), especially at lab scale scanning
systems. The reason of high scanning time is limited flux of radiation source available to
lab scale micro CT system. However, Synchrotron radiation sources can resolve this
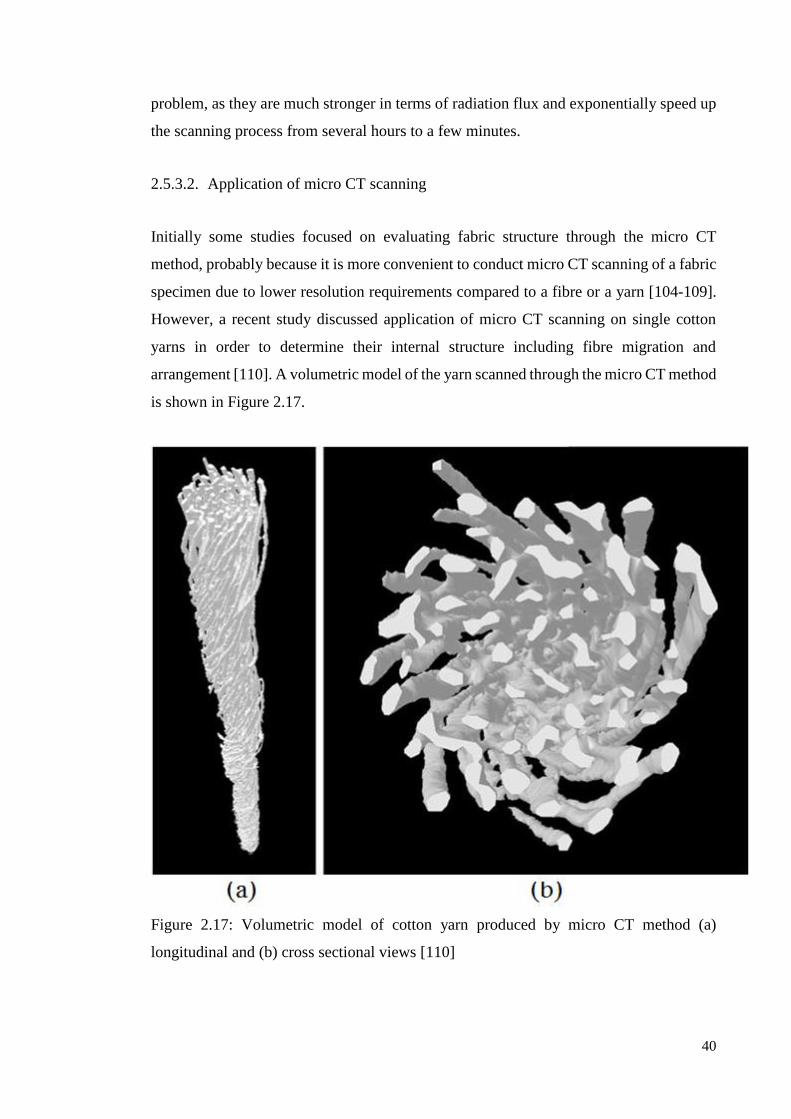
40
problem, as they are much stronger in terms of radiation flux and exponentially speed up
the scanning process from several hours to a few minutes.
2.5.3.2. Application of micro CT scanning
Initially some studies focused on evaluating fabric structure through the micro CT
method, probably because it is more convenient to conduct micro CT scanning of a fabric
specimen due to lower resolution requirements compared to a fibre or a yarn [104-109].
However, a recent study discussed application of micro CT scanning on single cotton
yarns in order to determine their internal structure including fibre migration and
arrangement [110]. A volumetric model of the yarn scanned through the micro CT method
is shown in Figure 2.17.
Figure 2.17: Volumetric model of cotton yarn produced by micro CT method (a)
longitudinal and (b) cross sectional views [110]

41
Although, the micro tomograph showed the arrangement of twisted fibres inside the yarn,
the study did not explain much about individual fibre arrangement or fibre migration. It
concluded that the fibres in the yarn core were either straight or possess small helix radius
compared to the fibres lying in the outer layers but lacked in terms of quantitative
representation of yarn structure through the micro CT data. Further extension of this work
on natural fibre ropes shed some light on the calculation of a few structural parameters
like packing distribution, mean fibre position, radial position and migration intensity of
the fibres [111]. However, it also did not explain much about the way these parameters
were calculated and the effect of the structural differences was not explained in terms of
physical properties of the yarns.
Yamasaki et al [112] had attempted to resolve complicated yarn structure and correlated
it with yarn properties particularly with tensile strength using micro CT technique. They
scanned a ramie yarn through a micro CT system and analysed the migration patterns in
the resulting data. The fibre migration patterns were observed to be quite irregular and
random. Furthermore, migration patterns were simulated through Markov chain model to
nominate yarn structural parameters that affected its tensile strength. It was noticed that
the number of migrations in a yarn have some relationship with yarn tensile strength. The
approach of investigating yarn structure and further correlating it with yarn properties is
quite novel. However, the work was published in Japanese language with no English
version provided, resulting in limited interpretation of experimental data and associated
analyses.
2.6. Modifications in ring spinning process
The developments and modifications of the classical ring spinning process in a desire to
enhance yarn quality and increase spinning productivity can be broadly divided into two
categories in context of their industrial success and application. Among various ideas and
proposals to modify the ring spinning system, only a small number of the modified
systems have achieved significant appreciation by the yarn spinning industry. Many of
the proposed modified systems remained in experimental and prototype phase only and
did not achieve much industrial attention. Both of these categories are discussed with
details on various modified ring spinning systems as follows.

42
2.6.1. Commercially successful modifications
Although a number of modifications in classical ring spinning have been reported in
literature, only a few of them found measureable industrial acceptance because they were
introduced by either machine manufacturers themselves or their application was quite
simple and effective without requirements of major changes in existing spinning system.
In addition, their benefits over classical ring spinning were well established through large
number of trials on industrial scale, which led to their immediate adoption for production
of better quality yarns. Different types of compact spinning systems, Siro spinning, Solo
spinning and diagonal offset spinning fall into this category.
2.6.1.1. Compact spinning
2.6.1.1.1. Principle
Compact spinning is perhaps the most marked innovation in ring spinning in recent years.
It produces yarns of improved quality compared to classical ring spinning. The underlying
principle of compact spinning is “compacting the fibrous strand before twisting”. The
action of compacting is achieved by different mechanisms in different types of compact
spinning systems. For example, most techniques use air suction to achieve a certain
degree of compacting while another method use mechanical means for the same purpose.
The choice of the compact spinning system affects resultant yarn quality. Various brands
of compact spinning systems are available in market, which not only vary in terms of
fibre compacting technology but also in design and application of the system.
2.6.1.1.2. Commercial compact spinning systems
The latest compact spinning machine introduced by Rieter is the K 46 compact spinning
system [75]. The compacting of the fibrous strand before twisting is achieved by various
compacting elements that include a perforated drum, air guide and air suction mechanism
as shown in Figure 2.18 (a). The resultant yarns possess superior quality with reduced
hairiness and improved strength. The system claims a significant reduction in compacting
cost compared to its predecessor model for producing compact yarns. The high
production cost associated with compact spinning system has been a serious concern for

43
spinners. Another compact spinning system was developed by Oerlikon Schlafhorst
named Zinser Modular Concept 351 Impact FX [76]. The Zinser system condenses the
drafted fibrous strand by air suction through specially designed perforated aprons, which
rotate over delivery rollers of the drafting system as shown in Figure 2.18 (b). Initially
this system countered problems like chocking of suction elements and aprons by fibres
during yarn spinning. However, a self-cleaning mechanism was developed to resolve this
issue. Both Rieter and Zinser systems are ‘integrated type’ compact spinning systems that
require the replacement of a classical ring frame to make use of compact spinning
technology, which of course requires huge investment in terms of machinery and
associated installation costs.
Figure 2.18: Various compact spinning systems (a) Rieter K46 perforated bottom cylinder
[75] (b) Zinser perforated aprons [76] (c) Sussen compact spinning system [24] (d) Rocos
compact spinning system [113]

44
The financial barrier of huge investment that limits the compact spinning technology to
brand new compact spinning frames only is addressed by development of ‘add-on type’
compact spinning systems that can be virtually attached to any existing ring frame as an
additional attachment. One such system introduced by Sussen (a German based company)
is called EliTe® compact spinning system that can be applied on regular ring frames [24].
This system also works using the air suction method and utilizes a combination of
different suction elements like base plate, perforated apron and specially designed pair of
top rollers. Air suction through the base plate condenses the drafted fibrous strand and
produces a compact yarn as depicted in Figure 2.18(c).
Another add-on type compacting system developed by Rotorcraft (a Swiss company) is
Rocos compacting attachment, which is a small condenser type component [113]. The
Rocos condenser is mounted magnetically in the drafting zone of a ring frame just behind
the front roller nip. It provides mechanical condensation effect to the drafted fibrous
strand unlike air suction based compacting methods. The Rocos attachment for the ring
spinning system is shown in Figure 2.18(d). Rocos is an economical solution for
producing compact yarns, as it virtually has no running cost associated. However, its
efficacy in terms of improving yarn quality is not as significant as air suction based
compact spinning systems [114]. In addition, Rocos compacting system is more effective
in spinning coarser yarns rather than finer yarns. Although, add-on type systems provide
a quick compact spinning solution on an existing ring spinning frame, they also add
additional load on the drive element (i.e. main motor) and could potentially damage it.
2.6.1.1.3. Comparison of compact and ring yarn quality
Various studies focused on comparing the physical properties of yarns produced on
various compact spinning systems with regular ring spun yarns [94, 115-120]. Nikolić et
al [116] compared the quality of ring spun yarns with compact yarns produced on Zinser
and Sussen compact spinning system. They had noticed a clear reduction in hairiness of
compact yarns compared to non-compact yarns. The tensile strength of compact yarns
was found superior while yarn evenness did not show any significant improvements.
Basal and Oxenham [94] have further extended the comparison of the physical properties
of compact and ring yarns produced from cotton and blended materials at different twist
levels. The compact yarns showed significant improvement in terms of yarn hairiness.

45
The strength of the compact yarns exhibited a mixed trend as it was higher than ring yarns
for low twist levels. However, it did not show consistency of superior strength at higher
twist levels. The yarn evenness remained almost unaffected by compact spinning. Both
of these studies agree well in their findings.
Another study that compared compact and ring yarns varying in terms of draft and twist
factor, supported the above mentioned findings of better strength and reduced hairiness
of compact yarns [117]. It also suggested that evenness of compact yarns is significantly
better than regular ring yarns. Ahmad [118] has conducted a comparison of compact and
regular ring yarns produced by different types of cotton. It was observed that compact
spinning yielded an overall improvement in yarn quality, i.e. for all quality parameters.
The idea of overall improvement in yarn quality through compact spinning system is
further endorsed by other studies [120].
Fabrics produced from compact yarns possessed low extensibility, higher formability,
higher bending and shear rigidity, hence provided an improved fabric handle as evaluated
through the FAST fabric evaluation system [121]. They also exhibited lower thermal
resistance, wick ability and total absorbency but higher water and air permeability [122].
In addition to superior quality, compact spinning was also noticed to enhance spinning
productivity by producing yarns at comparatively lower twist level with fewer end
breakages [94, 117, 123, 124]
2.6.1.1.4. Comparison of different compact spinning systems
The superior yarn quality and improved process productivity through compact spinning
systems inspired interest to compare different compacting systems to investigate if any
one of them performs better than the others [114, 120, 125, 126]. Khurshid et al [125]
studied different commercially available compact spinning systems to analyse their
spinning performance and resultant yarn quality. Among Rieter, Sussen and Toyota
compact spinning systems, Rieter K-44 produced highly even, stronger and less hairy
yarns. However, the best elongation properties were exhibited by yarns spun on the
Toyota RX-240 compact spinning frame. Similarly, when Almetwally et al [120] had
compared the properties of yarns produced on the similar compacting systems, they
noticed that the yarns produced on Sussen system resulted in the best tensile properties

46
while K-44 compact yarns showed the least hairiness and mass irregularities. All three
compact spinning systems that were compared, differed in terms of compacting elements
(i.e. perforated aprons or cylinders) but their underlying compacting principle was similar
i.e. compacting through air suction However, one of them (i.e. Sussen system) was an
add-on compact spinning attachment while two (i.e. RX-240 and K-44) were integrated
type compacting systems. Göktepe et al [119] showed that integrated type systems
produced superior quality yarns compared to add-on type systems. Another study showed
air suction based compact spinning produced superior quality yarns than mechanical type
compact spinning system [114]. These findings lead to two interesting conclusions. One
is the integrated compact spinning systems produce superior quality yarns than add on
type systems and secondly mechanical compacting is not as effective as pneumatic
compacting system [114, 119]. Although, pneumatic compacting systems (especially
integrated type) require higher capital investment and associated running costs but their
performance cannot be challenged by low cost mechanical compacting system.
2.6.1.1.5. Recent developments in compact spinning
The established improvements in ring yarn quality through compact spinning acted as a
motive to further refine this technology for achieving high quality yarns and improving
spinning productivity. Compact spinning is generally used for producing fine count yarns
from combed rovings. A few attempts had been made to produce compact yarns from
carded rovings as well [127-129]. The issue associated with processing the carded roving
through compact spinning system is to maintain appropriate control over short fibres as
they can be easily sucked inside the suction slots or perforations of compact spinning
system. A recently introduced design of a D-type slot in Sussen compact spinning system
was evaluated for spinning ‘compact carded’ yarns [127]. The properties of compact
carded yarns were then compared with normal carded yarns and regular compact combed
yarns. The D type slot improved yarn structure with better parallelisation and less
protruding fibres resulting in improved evenness, strength and reduced hairiness [128,
129].
Another development in compact spinning was combining pneumatic and mechanical
compact spinning together [130]. A perforated grooved roller was introduced in regular
ring spinning, where the groove provided mechanical condensation and air suction

47
through perforated surface provided pneumatic suction to the fibrous strand resulting in
stronger and less hairy yarns. A recent development in compact spinning is a complete
condensing spinning system (CCSS) as shown in Figure 2.19. The compacting element
in CCSS was a 50 mm perforated roller with grooved surface that used an air suction card
and a guide device to compact the fibrous strand. To evaluate the performance of CCSS
in terms of improvement in yarn quality, its comparison was made with apron type and
perforated drum type compact spinning systems [126]. The CCSS system showed
improved evenness compared to other two compact spinning system.
Figure 2.19: The arrangement of complete condensing spinning system [126]
In addition to physical modifications, some studies modelled the pneumatic compacting
phenomenon to understand fluid dynamics involved in fibre compacting to further
improve the design of compact spinning systems [131-133]. A numerical study focused
on simulating compact spinning action through a perforated drum [131]. The fibre
condensing action in compact spinning was split into three different phases i.e. rapid
condensing, regulative condensing and complete condensing. It was observed that fibres
were condensed as they moved over the suction surface and spinning triangle was almost
eliminated. The air suction force was split into x and y components, which revealed that
x component condensed fibres while y component facilitated their forward motion by
clinging them to the perforated drum. The condensing action was more effective on the
peripheral fibres compared to the fibres lying in the centre of the strand.

48
Su et al [132] developed a numerical simulation of the flow field in perforated bottom
drum by introducing an additional guide. The guide exhibited improved control over the
fibrous strand compared to a similar arrangement without a guiding element. The
application of a specific type of guiding device improved fibre condensing compared to
other guiding devices. Similar results were obtained by numerically simulating four roller
compact spinning mechanism with a guiding device [133]. This shows the possibility of
further improvements in existing compact spinning systems by optimizing their design
and adding new compacting elements to achieve better condensation and control on
fibres.
2.6.1.2. Siro spinning
2.6.1.2.1. Principle
Siro spinning took birth at the former CSIRO Division of Textile Industry in early 1970s
in quest of producing high quality worsted yarns [134]. The inception of Siro spinning
was based on the idea of developing an effective technique to trap protruding fibres on
the yarn surface into the yarn structure. A common practice was doubling two individual
single yarns with each other as a post spinning process to improve their strength. Siro
spinning enabled twisting and doubling of two individual fibrous strands on a ring frame
in a single step instead of doubling them in an additional post yarn spinning process. In
Siro spinning, two separate fibrous strands are drafted simultaneously on each drafting
unit of a regular ring frame. The parallel drafting is carried out by introducing few
additional components in drafting system like feeding guides, separating guides,
condensers and a breakout device as illustrated in Figure 2.20. These elements are low
cost and easy to install, which makes the modification process quite simple. As both
fibrous strands emerge from the front delivery rollers, they are twisted together in a
manner similar to normal twisting of drafted fibres by ring and traveller assembly.
The amount of twist inserted in fibrous strands is controlled by a special roller (with a
partial cut out) that is placed between spindle and convergence point of the strands. This
helped in controlling a patterning problem in fabrics produced from Siro spun yarns and
allowed to bring both strands closer to each other making their processing possible on a
single drafting unit. Twisting both strands together resulted in a unique longer spinning

49
triangle. Each strand also formed a small spinning triangle next to front roller nip. These
spinning triangles together facilitated the surface fibre trapping into yarn, which then
resulted in less hairy and stronger yarns.
Figure 2.20: An overview of different components of Siro spinning system[135]
Siro spinning evolved from the two-strand spinning approach. One of the problems in a
two-strand spinning system is that if one strand breaks, the spinning process continues
with a single strand. This results in a much finer yarn than desired and can lead to
unwanted artefacts on fabric surface. This problem is resolved by mounting a breakout
device (BOD) next to drafting unit that mechanically detects the breakage of one fibrous
strand and immediately blocks the twist propagation in the second fibrous strand resulting
in an end down. Siro spinning produces superior quality yarns compared to regular ring
yarns. It also eliminates the need for the doubling process. The commercialization of Siro
spinning system resulted in admirable economic benefit to the textile industry [136].

50
2.6.1.2.2. Comparison of Siro spinning with other systems
Some studies focused on comparing the physical properties of Siro spun yarns with the
regular ring yarns and those are produced on other modified ring spinning systems such
as compact spinning [137-141]. Ortlek et al [137] compared the properties of yarns
produced on ring spinning, Siro spinning and Rocos compact spinning systems. Yarns of
medium range counts from 100% cotton were produced and compared for their quality
parameters. Superior tensile properties were exhibited by Siro spun yarns compared to
the yarns produced on other systems. Sun and Cheng [138] compared the physical
properties of Siro spun yarns with single and plied regular ring yarns. The yarns were
produced from cotton with different twist levels and fineness. Overall quality parameters
of Siro spun yarns were found superior to regular ring yarns in terms of strength,
elongation, abrasion resistance and hairiness. Coarser Siro yarns exhibited improved
evenness and few imperfections. However, similar could not be established for finer Siro
yarns as they did not show significant improvement in evenness. In general, Siro spun
yarns showed comparable properties to plied (doubled) yarns except finer Siro yarns were
noticed to be more irregular. Other studies also confirmed a general trend of superior
tensile properties of Siro spun yarns compared to plied ring yarns [139, 140]. The Siro
spinning system also produced composite yarns with superior quality compared to the
ones produced on Solo spinning (as detailed in section 2.6.1.3) and regular ring spinning
system [141].
Some studies have extended the evaluation of performance of Siro spun yarns to fabric
stage [142, 143]. In multiple comparisons of the quality of the knitted fabrics produced
by normal ring spun yarns and Siro spun yarns, fabrics made from Siro yarns showed
better strength, air permeability, low surface friction, comparable dyeing and colorimetric
characteristics as compared to fabrics produced from regular ring yarns [142, 143]. The
explanation of improvements in fabrics made from Siro yarns is made on basis of
improved control on hairy fibres, which resulted in reduced yarn hairiness and enhanced
yarn strength that is translated into superior fabric quality.
2.6.1.3. Solo spinning

51
2.6.1.3.1. Principle
Solo spinning system was also developed around mid-1990s following the attempts to
improve ring yarn quality and its performance in fabrics. Solo spinning received some
attention from yarn spinning industry in early days of its release but it is not comparable
to Siro or compact spinning systems [144]. The principle of solo spinning is to split the
drafted fibres into various sub strands to trap them into the main yarn body [145]. The
divisions of the roving are made by using a specially designed Solo spinning roller with
grooves in it as shown in Figure 2.21.
Figure 2.21: Solo spinning attachment shows a specially designed grooved roller with
mounting aids [146]
The Solo spinning roller sits on top of the front end of the bottom delivery roller and its
grooves interact with fibres coming out of front roller nip. The slotted roller also acts as
a twist blockage device by preventing the twist insertion directly into the coming strand.
This division of the fibres into small strands creates braiding effect in the fibres that help
52
their effective trapping into the main yarn structure. The practical benefit of the system is
its easy and flexible installation on any existing ring frame. The Solo roller is a clip on
attachment that can be added to an existing ring spinning frame [147]. The mechanism
was initially developed for wool fibres, as they are coarse and easier to control by solo
spinning roller compared to fine cotton fibres.
2.6.1.3.2. Comparison of Solo spinning with other systems
Some studies have compared the yarns produced on Solo spinning system with the yarns
produced on classical and other modified ring spinning systems [98, 99, 148, 149]. Chang
and Wang [149] compared the hairiness of worsted yarns produced through Solo spinning
and classical ring spinning methods. They evaluated yarn hairiness in terms of different
parameters representing the number and extent of hairs protruded out of yarns. It was
observed that Solo spun yarns presented significantly lower hairiness than regular ring
yarns. In order to rank various developments in ring spinning with extent of improvement
in yarn quality, structural, migratory and physical properties of Siro, Solo, compact and
conventional yarns were studied in a series of publications [98, 99, 148, 149]. It was
noticed that maximum fibre migration took place in Siro yarns followed by compact, Solo
and regular ring spun yarns respectively while the highest spinning-in coefficient was
exhibited by compact yarns. The spinning-in coefficient represents the average length of
the fibres effectively spun into the yarn. In regard of tensile properties, Siro spun yarns
exhibited the highest strength followed by compact, Solo and conventional ring yarns
respectively. The strength and hairiness of Siro yarns were the best among studied
spinning mechanisms. The superiority of Siro yarn properties is attributed to higher rate
of fibre migration, higher spinning-in coefficient and lower hairiness.
2.6.1.4. Diagonal (offset) yarn spinning
Two important criteria of industrial success of any modified ring spinning system are low
cost and simplicity of application. Both of these criteria are met by an innovative yet
simple method of diagonal offset spinning [150-154]. Wang and Chang [150] introduced
the idea of diagonal offset spinning by twisting yarns in a diagonal arrangement through
spindles located on left or right side of the drafting unit as shown in Figure 2.22. Yarns
(Z twisted) were produced in both left and right offset positions and a comparison of

53
results showed a clear reduction in yarn hairiness by right diagonal offsetting. The
reduction in yarn hairiness was explained on basis of improved pre twisting in fibres at
spinning triangle zone due to offset of the fibrous strand. No significant deterioration in
yarn evenness and strength was observed in diagonal offset yarns, except yarn end
breakages increased due to excessive stretching of fibres in offset direction.
Figure 2.22: Left offset diagonal spinning by connecting fibrous strand to adjacent
spindle[150]
Thilagavathi et al [151] reconfirmed the reduction in yarn hairiness by diagonal offset
spinning technique. However, they proposed that left diagonal offsetting reduced yarn
hairiness more effectively compared to right offsetting for Z twisted yarns as it provided
enhanced control on fibres lying on the left side of the spinning triangle. In further
research on diagonal offset method, they investigated the effect of offset distance on yarn
hairiness [152]. Yarns were produced with 0-70 mm offsetting distance (in controlled
steps) in left diagonal arrangement. The roller flutes, aprons, spacers and pneumafil
suction pipe were also modified accordingly. Minimum hairiness was observed at 60 mm
offset distance for various yarn counts. However, very fine yarns did not exhibit
significant reduction in hairiness by diagonal offsetting. Yarn strength was slightly
improved for diagonal offset yarns.

54
However, Su et al [154] proposed that maximum reduction in yarn hairiness can be
achieved by right diagonal offsetting as left offsetting seemed to increases yarn hairiness.
This is contrary to the studies by Thilagavathi et al [151, 152] but agrees to the initial
findings of Wang and Chang [150]. Wu et al [153] further studied the effect of offset
direction and distance by controlled offsetting of yarn path in right and left directions at
various offset intervals. The only yarn quality parameter significantly affected was yarn
hairiness and rest of the yarn properties showed no noticeable improvements. The lowest
yarn hairiness was achieved by a right offset of 12 mm in case of Z-twisted yarns. The
reduction in yarn hairiness was more evident in coarser yarns compared to finer yarns.
It is interesting to note that horizontal offsetting reduced yarn hairiness significantly in
almost all studies reported, but other yarn quality parameters like strength and evenness
did not show any significant improvements. If the fibres are better integrated within yarn
structure because of better pre twisting, they should exhibit improved yarn strength and
reduced hairiness. A recent study mentioned that the ‘inconvenience’ in operation of
diagonal offset method is a limitation towards its further commercial success and
acceptance [155]. The inconvenience probably refers to the fact that connecting broken
yarn ends with diagonal spindles might be difficult or ‘unusual’ for machine operators.
2.6.1.5. Comparison of commercially successful modifications in ring yarn spinning
The performance of above discussed commercially successful modifications in the ring
spinning process is compared as shown in Table 2.1. The comparison shows improvement
in individual yarn quality parameters (i.e. hairiness, strength, evenness and elongation)
achieved by each modification compared to classical ring yarns. It could be noticed that
compact and siro spinning technologies resulted in superior quality yarns by improving
their overall quality. However, solo and diagonal offset spinning only reduced yarn
hairiness and did not affect any other yarn quality parameters.

55
Table 2.1: Comparison of various commercially successful modifications in ring spinning
system in terms of improvement in yarn quality parameters
Proposed
system
Improvement in Yarn Quality
Parameters
References
Hairiness Strength Evenness Elongation
Compact
spinning
[116]
[94]
[117]
[118] [120]
Siro spinning
[137] [139, 140]
[138]
Solo spinning
[149]
Left diagonal
offsetting
[150] [151] [152]
[153, 154]
2.6.2. Proposed and experimental modifications
Apart from commercially successful changes in ring spinning system, there are numerous
other modifications reported in past that did not get wide industrial appreciation due to
technical complexities, non-significant effectiveness in terms of improvement in yarn
quality and associated economic concerns in their application. These modifications in
ring spinning were proposed on experimental grounds and the effects of various changes
in classical ring spinning process over yarn properties were studied. The range of
modifications over ring frame includes alterations in classical drafting system, devices
for varying spinning triangle arrangement, false twisting yarns to reduce residual torque,

56
applying compressed air for winding protruded hairs around the yarn body, yarn spinning
through multiple fibrous strands and composite ring spinning. These modifications along
with their subsequent effects on yarn quality parameters are discussed in this section.
2.6.2.1. Drafting zone modifications
2.6.2.1.1. Air jet
Murugan et al [156] attempted to improve intertwining of fibres in the front drafting zone
of a ring frame by using an air jet embedded in an intertwining chamber. The idea was to
condense the fibrous strand while drafting to make it compact. The modification
apparently improved yarn properties as condensing the fibres increased inter-fibre
cohesion and provided better control of strand resulting in better evenness and tensile
properties. However, a clear explanation of designed intertwining chamber and details of
its functionality were not provided. In addition, the comparison of condensed yarn
properties with compact spun yarns and its economic feasibility may give some better
insight for its application.
2.6.2.1.2. Grooved rollers
In another study, fibre movement was controlled in the delivery zone of the drafting
system by directing it through biased grooved top rollers [157]. An example of grooved
top rollers is shown in Figure 2.23. The front delivery roller of a classical ring frame is
loaded with an additional top roller. The additional roller acting as a new front top roller
has a special grooved profile of different angles and configurations. Different rollers with
grooves at angles of 15o, 45o, 75o and 90o both in left and right directions were developed.
The 75o grooved roller achieved maximum reduction in yarn hairiness (i.e. more than
40%). The yarns produced through grooved rollers were uniform than normal ring yarns
but surprisingly no considerable improvement was noticed in terms of yarn strength (i.e.
less than 5%). Despite of improvements in yarn quality through grooved top rollers, it
seems there is no follow up study conducted on this system. One possible issue that may
limit the industrial application of this system is high wear and tear of the grooved rollers
compared to regular top drafting rollers due to uneven (grooved) surface profile.

57
Figure 2.23: Schematic diagram of different groove configurations to direct fibre
flow[157]
2.6.2.1.3. Fibre rubbing
In an attempt to improve yarn abrasion resistance for enhancing its downstream
performance, Aslam et al [158] introduced a rubbing roller in drafting zone of a ring
frame. The basic idea was to incorporate fibres into yarn body by rubbing them together
before twist insertion. This attempt was partially successful as it resulted in a significant
reduction in yarn hairiness and improved abrasion resistance but rubbing action also
reduced yarn evenness and tenacity. The reason of partial deterioration in yarn quality is
unwanted stretching of delicate fibrous strand during rubbing action that led to poor
evenness [159]. Another explanation is rapid oscillations of strand in both left and right
directions caused by the rubbing action, which might have induced false twist and
disturbed yarn structure. If rubbing could be carried out in one direction only, it may lead
to improvements in yarn evenness.
2.6.2.1.4. Perforated bottom roller
Kantharaj and Sampath [160] modified the bottom delivery roller of a classical ring
spinning system by producing small mesh of holes on its surface. The roller was drilled
to make it hollow to allow air suction for producing compact spinning effect. The yarns
produced through modified bottom roller were then compared to the similar yarns spun
on the compact and normal ring spinning system. As a general trend, yarns produced on
modified system possessed improved quality than normal ring yarns but inferior than
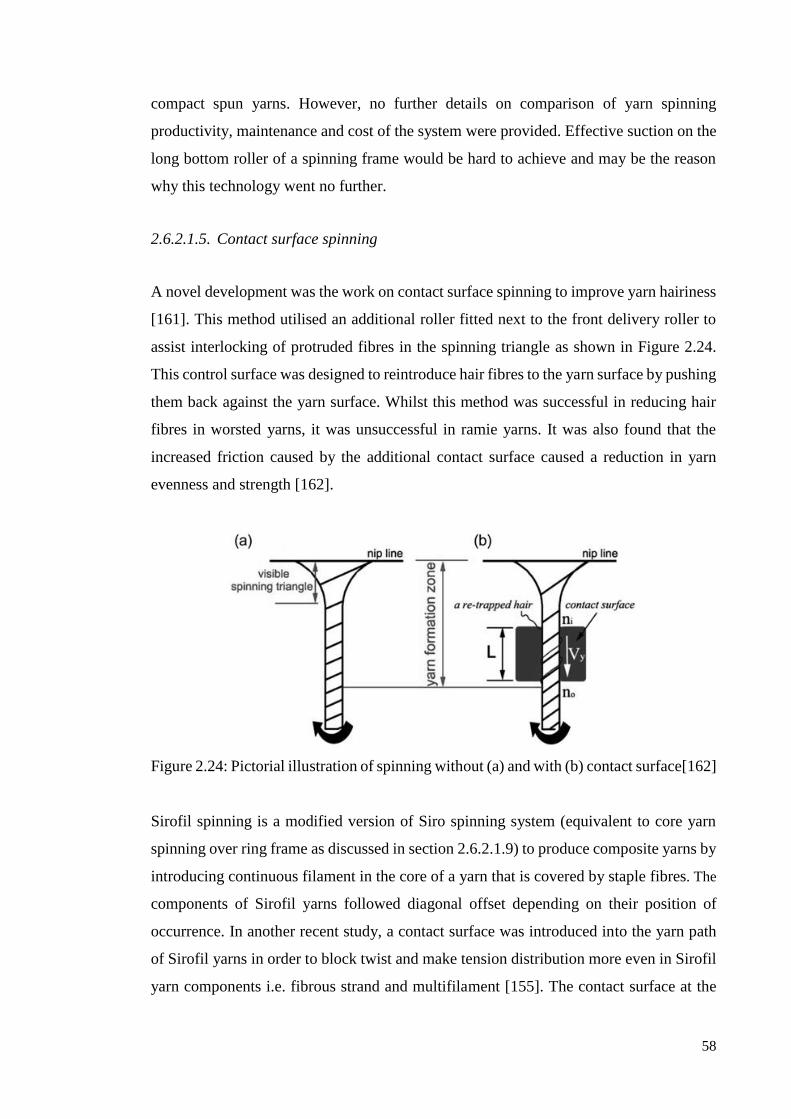
58
compact spun yarns. However, no further details on comparison of yarn spinning
productivity, maintenance and cost of the system were provided. Effective suction on the
long bottom roller of a spinning frame would be hard to achieve and may be the reason
why this technology went no further.
2.6.2.1.5. Contact surface spinning
A novel development was the work on contact surface spinning to improve yarn hairiness
[161]. This method utilised an additional roller fitted next to the front delivery roller to
assist interlocking of protruded fibres in the spinning triangle as shown in Figure 2.24.
This control surface was designed to reintroduce hair fibres to the yarn surface by pushing
them back against the yarn surface. Whilst this method was successful in reducing hair
fibres in worsted yarns, it was unsuccessful in ramie yarns. It was also found that the
increased friction caused by the additional contact surface caused a reduction in yarn
evenness and strength [162].
Figure 2.24: Pictorial illustration of spinning without (a) and with (b) contact surface[162]
Sirofil spinning is a modified version of Siro spinning system (equivalent to core yarn
spinning over ring frame as discussed in section 2.6.2.1.9) to produce composite yarns by
introducing continuous filament in the core of a yarn that is covered by staple fibres. The
components of Sirofil yarns followed diagonal offset depending on their position of
occurrence. In another recent study, a contact surface was introduced into the yarn path
of Sirofil yarns in order to block twist and make tension distribution more even in Sirofil
yarn components i.e. fibrous strand and multifilament [155]. The contact surface at the

59
front roller nip was found to be facilitating twist insertion by stabilizing the composite
Sirofil yarn. Hairiness was improved for left diagonal Sirofil yarns while evenness was
comparatively better for right diagonal Sirofil yarns because of better control of fibrous
strand and filaments in both cases respectively. Improvement in evenness is attributed to
higher fibre loss from the yarn surface due to the contact surface making multi filaments
more evident in the resultant composite yarns. Conclusively, it is hard to achieve better
hairiness and evenness at the same time in Sirofil yarns in presence of a contact surface.
The introduction of stationary contact points in the path of fibre flow or yarns (as
presented in above-mentioned methods) may increase yarn hairiness and deteriorate other
quality parameters. This has been described previously in a study explaining yarn contact
with guide, balloon breaker, ring and traveller [163]. The relationship of yarn quality and
its interactions with various contact points at different stages of ring spinning needs
further investigations.
2.6.2.1.6. False twisting
Yarn residual torque or twist liveliness is one of the serious yarn related problems, which
is encountered in downstream processing and can significantly affect the quality of end
products like causing spirality in knitted fabrics. The yarns produced by synthetic
filaments or staple fibres can be subjected to certain heat treatments or vacuum steaming
for twist stabilisation but these procedures can lead to yarn / fibre degradation as well
[113, 164]. In addition, further processing increases yarn manufacturing cost and these
procedures cannot be applied to natural fibres. However, the best possibility to counter
this issue is to modify the yarn structure itself in order to control twist liveliness so it can
perform better in downstream processing and additional processing requirements can be
eliminated.
Yang et al [101] attempted to decrease twist liveliness and improve yarn quality by
introducing a false twister and a fibre separation device in the yarn path as shown in
Figure 2.25. The principle of the modification is to first impart high false twist into fibres
and later relax it by inserting low actual twist that results in lower radial bias of fibres.
This phenomenon decreased overall yarn torque as fibres were in a relaxed state when
compared to classical ring yarns. The structural arrangement of the modified yarn was

60
investigated by imaging and tracer fibre techniques. The fibre trajectory was
reconstructed using the yarn images by locating the position of the tracer fibre. It was
found that spinning with a false twister produced yarns with a unique structure. Fibre
segments were observed rotating in clockwise as well as anti-clock wise directions within
the same yarn. The presence of opposite rotations counteracted the torque generated by
each segment resulting in reduction of total residual torque in the yarn. The reversed
wrapping of fibres, improved entanglement at the spinning triangle zone and reduced yarn
hairiness to some extent.
Figure 2.25: False twister installed in yarn path of a conventional ring spinning
system[165]
The false twisting method was further researched by developing models of its effects on
spinning process and improving its initial design [165, 166]. The comparison of quality
of false twisted yarns with regular ring yarns showed superiority of false twisted yarns in
terms of tenacity, reduced hairiness and residual torque [100, 167]. However, it was
observed that yarn evenness and elongation were negatively influenced by false twisting

61
[168]. Recently, the idea of inserting false twist into yarn right after it leaves the nip of
front delivery roller is further modified by introducing two false twisters on ring spinning
frame [169]. The yarns produced through application of double false twisters showed
superior tenacity, low hairiness and comparable imperfections to the classical ring yarns.
The comparison of yarn quality is extended to fabric and garment stages as different types
of fabrics were produced from false twisted and regular ring yarns for comparison [170-
173]. Superior quality of fabrics produced from false twisted yarns was observed
especially in terms of fabric spirality and its dimensional stability. In addition, fabrics
produced from false twisted yarns showed improved breaking strength, high abrasion
resistance and tear strength compared to fabrics made out of regular ring yarns [171].
The concept of false twisting of fibres is novel and its positive impact on yarn quality is
established through number of studies as mentioned above. The false twisting method is
also patented [174, 175]. However, a major limitation associated with commercialization
of false twisting method is requirement of complicated modification of the ring spinning
frame to allow installation of false twisting elements. The additional false twisters (that
run at equivalent or even higher speeds than ring frame spindles) require more power to
run, which can substantially add to yarn production cost when applied to thousands of
spindles in a yarn spinning mill. The complexity of design of false twisting elements and
their economic feasibility needs to be reviewed in order to make it commercially
successful.
2.6.2.1.7. Air Nozzle
Some studies that focused on improving yarn quality, proposed to ‘treat’ hairy yarns by
applying an air nozzle next to the spinning triangle zone to minimize yarn hairiness [176-
182]. Different types of air nozzles varying in their designs were tried in different
spinning arrangements on ring frame. Hua et al [176] applied an air nozzle next to the
front delivery roller of a ring frame as shown in Figure 2.26. The air was injected at two
different positions in the nozzle tangential to its periphery. This aerodynamic arrangement
created a swirling effect inside the nozzle, which ‘rewrapped’ the protruding hair fibres
around main yarn body as the yarn passed through the nozzle. As a result of rewrapping
of loose fibres, yarn hairiness was significantly reduced particularly in terms of hairs
longer than 3 mm. The compressed air pressure was a key parameter in reduction of yarn

62
hairiness. In another study, an air nozzle was installed in yarn path of Rocos compact
spinning system and this hybridization of two techniques was termed as ‘compact-jet’
spinning [177]. Different air injection angles were tried to minimize yarn hairiness [178].
Compact-jet yarns showed 40% and 70% less hairiness compared to Rocos and regular
ring yarns respectively. A further comparison of compact-jet yarns was made with
classical ring, regular compact and jet ring yarns [179].
Figure 2.26: An air nozzle applied in yarn path of conventional ring spinning process[176]
Jet ring yarns were produced by mounting an air nozzle on classical ring frame [183]. The
wrapping of fibres by air nozzle resulted in less hairy yarns both in compact and normal
ring spinning arrangements. However, it was found more effective in combination with
compact spinning. The design of air nozzle was also optimized by computational fluid
dynamics (CFD) modelling, which suggested that the longitudinal centre of the nozzle is
an ideal position for air injection compared to its main inlet or outlet for achieving
minimum yarn hairiness [180]. A similar type of air nozzle was combined with Siro
spinning technique to explore the possibility of improvement in Siro yarn quality [181].
Two air nozzles were developed with different number of air injectors. The Siro-jet yarns
(as they were termed) exhibited less hairiness compared to regular Siro yarns but also
possessed low strength and high unevenness. The findings agreed with a previous attempt
to produce Siro-jet yarns where yarn hairiness was decreased considerably but evenness
and strength were deteriorated although not significantly [182].
63
Some other studies discussed the use of air nozzle for producing low torque yarns [184,
185]. Liu and Su [184] produced ring yarns by replacing the pig tail guide on a ring frame
by an air twisting device. The device generates an air vortex in the yarn path that improves
the twist propagation in spinning triangle zone. The objective was to influence the stress
distribution among fibres at spinning triangle to minimize yarn residual torque, which
resembles to the idea of mechanical false twister as discussed in section 2.6.2.1.6. The
yarns of medium to fine count range were produced on this system, which exhibited
significant reduction in residual torque. However, other yarn quality parameters did not
show a clear trend of improvement. The application of similar kind of air twisting device
in Siro spinning also resulted in low torque Siro yarns [185].
The modification of classical ring spinning method by attaching an air nozzle for reducing
yarn hairiness or torque is an additional process in yarn spinning which also comes with
additional running and maintenance costs. This cost will be further increased if the air
nozzle method is coupled with compact spinning, which has its own additional costs
[186]. This will result in significantly higher yarn production cost, which is of course not
very favourable in a competitive production environment. It is also important to note that
an air nozzle does not eliminate the causes of yarn hairiness by enhancing control on fibre
in the spinning triangle zone but only reduces hairiness that has already been generated.
However, the concept of twist propagation by an air twisting device is interesting that
may achieve dual benefit of reducing yarn hairiness along with producing comparable
yarns with low twist that will improve spinning productivity.
2.6.2.1.8. Multiple fibrous strands spinning
The industrial success of relatively simpler and low cost mechanism of Siro spinning had
set up a precedent for achieving significant improvements in yarn quality by processing
and twisting more than one fibrous strand together. It also opened up an opportunity for
researchers to further experiment different combinations of spinning two (or more)
fibrous strands together to achieve even better quality yarns [187-191]. Matsumoto et al
[187] produced same fibre triplet yarns (SFTY) and different fibre triplet yarns (DFTY)
from three roving strands of similar and different raw materials respectively. Three
rovings were fed into the drafting zone of a modified ring frame with an interspacing of
3 mm and twisted together after drafting. The SFTY yarns exhibited improved evenness,

64
hairiness and strength compared to classical ring yarns of comparable linear density.
However, the DFTY yarns were not considerably higher in quality compared to ring
yarns. A possible reason of quality deterioration in DFTY yarns can be selection of fibres
with significantly different fineness. Generally, a condition for blending different fibre
materials together is agreement of their fineness, which if not followed may lead to yarn
quality issues like excessive hairiness in blended ring yarns.
Another noteworthy development in multi-strand yarn spinning is embeddable and
locatable spinning (ELS) system, which works by wrapping the drafted fibrous strand
through fine continuous filaments by modifying classical ring frame [188]. The staple
fibres are integrated into main yarn body surrounded by a filament wrapped around them,
which results in two key benefits. One is the possibility of spinning quite fine yarns as
delicate fibrous strand is reinforced by filaments and secondly the production of fine yarns
through medium quality fibres, which would otherwise be non-feasible due to their short
length and low strength. It was observed that inter-filament and inter-roving spacing at
feeding point affects not only the shape of the spinning triangle formed in ELS system
but also influences the properties of the resultant yarns [189]. The optimization of rovings
and filaments arrangement at feeding zone reduced fibre loss in ELS yarns and improved
the entrapping of fibres [190]. An interesting feature of ELS system is ‘self-splicing’ of
broken fibre strand at yarn formation zone if filaments are intact. The economic aspects
of this newly devised spinning technique are still unclear and production of 100% staple
fibre yarns is not possible in this arrangement.
Ishtiaque et al [191] have applied a new concept of ‘engineering’ yarns by controlled
placement of wool fibres of different quality grades at various locations inside yarn cross
section. The three-layered yarns were produced from three rovings on worsted spinning
system by using special guiding elements as shown in Figure 2.27. Out of three roving
strands, central roving consisted of two layers of fibres that were achieved by
sandwiching two slivers on a single drafting unit of roving frame. The other two (side)
rovings were normal single layer fibrous strands. The yarns produced by varying the
composition of rovings and their position in the drafting zone showed reasonable
variation in terms of their properties. It was noticed through yarn cross sectional analysis
that positioning of a certain kind of fibres within yarn cross section can be controlled by
feeding positions of the rovings, which also affect the resultant yarn properties.

65
Figure 2.27: Three roving feeding arrangement using a composite roving guide at
classical ring spinning frame [191]
The physical properties of yarns produced from above shown arrangement varied due to
different underlying fibre arrangement and so does the carpets, which were produced
through these yarns. The idea of engineering yarn structure by manipulating the fibre
positions in cross section, if applied to regular yarns can help to achieve desired yarn
properties. However, formulating such controls for spinning finer yarns would be a
challenge to address.
2.6.2.1.9. Core spinning related modifications
Core spinning or composite spinning has emerged as a modified version of ring spinning
with a possibility to achieve superior and functional characteristics of a yarn. In core
spinning system, a filament is introduced as a core layer in the yarn, which is covered by
a sheath of staple fibres. A widely known application of this method is inserting
polyurethane filaments (Lycra) into cotton fibre sheath to achieve superior extensibility

66
in yarns with comfort of cotton fibres. However, Core spinning system has one serious
issue associated that is the stripping of sheath from the core filament, which is also termed
as ‘barber pole’ or ‘strip back’ effect. This usually happens due to unwanted material and
process related variations. The missing or loose sheath around the core filament causes
problems in downstream processing and deteriorates the appearance of the garment.
Different approaches have been presented to address this problem [192-194].
Cluster spinning is a novel approach in core yarn spinning to remedy the strip back of the
sheath fibres [192]. The principle of cluster-spun yarns is to divide the multi filament core
into sub strands before it enters into the drafting zone. The idea is inspired by Solo
spinning method as the filaments are split by a special slotted roller. The distribution of
filaments into small clusters helps to prevent stripping back of sheath by providing more
control over sheath fibres. The cross sectional views of cluster spun yarns and normal
Core spun yarns are shown in Figure 2.28. Yarns produced through the cluster spinning
possessed improved structural integrity, which led to superior quality compared to regular
Core spun yarns. The idea of splitting the core filament into sub strands to improve
composite yarn structure and properties is also supported in a recent investigation [195].
In another approach to counter the ‘strip-back’ issue, the filament core was treated with
Methyl Methacrylate binder to improve its adhesion to the sheath fibres [193]. The yarns
produced by treated filaments resulted in better quality fabrics although quality
improvement was not obvious at the yarn stage. An idea of spinning three strand core
spun yarns was introduced to minimize sheath slippage [194]. The yarns were termed as
three strand modified method (TSMM) yarns. Three strands of each roving and filaments
were fed into drafting zone separated by a guiding device. A filament intake roller with
three grooves was used to separate filaments from each other. Various possible
combinations of filaments insertion into fibrous sheaths were tried to minimize the extent
of sheath slippage and optimize yarn quality. The physical and mechanical properties of
TSMM yarns were found best at 8 mm interspacing of rovings and at yarn linear density
of 45 tex [97].

67
Figure 2.28: cross sectional comparison between cluster spun yarns (left) and core spun
yarns (right) [192]
In addition to counter the barber pole effect, an interesting idea was proposed to use the
Core spinning system for improving the quality of regular ring yarns. Moghassem and
Gharehaghaji [196, 197] produced Core yarns with PVA filament in their core and
covered it with viscose sheath. The PVA core was later extracted or dissolved by
immersing the yarn in hot water bath and a new ‘hollow yarn’ was achieved. The
properties of the hollow yarns were compared with regular ring yarns. In general, the
hollow yarns did not show any improvement in yarn quality except elongation at break.
In fact, most of the yarn quality indicators were deteriorated due to unstable structure of
the hollow yarns. The fabrics produced from these yarns exhibited less bending length,
bending rigidity, bending modulus and more air permeability compared to fabrics
produced from normal ring yarns.
Some studies focused on comparison of yarns produced on the Core spinning system with
other composite yarn spinning systems [141, 198]. In a comparison of Core spun yarns
produced on normal ring spinning, Siro spinning and Solo spinning, Pourahmad and
Johari found that Siro core spun yarns (Sirofil) possessed overall better quality [141]. The
pretension of the Core filament was observed a key parameter that controls the quality of
Core spun yarns. In another comparison of Core spun yarns produced on ring, Siro and

68
modified rotor spinning systems [198], the modification in rotor spinning frame was made
by inserting a pre-tensioned filament into rotor using a pair of feed rollers, and yarn was
collected by a doffing tube on the other end. Core yarns produced on rotor spinning
showed better evenness, abrasion resistance, appearance and minimum hairiness while
Sirofil yarns were superior in terms of strength.
2.6.2.1.10. Ring spinning productivity
One of the important concerns associated with ring spinning is its slow production speed,
which is many times less than other yarn spinning systems exist today. The primary
limitation in increasing the production speed of ring spinning is frictional contact of the
traveller with the ring that does not allow significant increase in established limit of 25000
rpm spindle speed. However, alternatives methods were investigated to eliminate this
classical barrier of ring spinning production [199-203]. Recently, attempts have been
made to raise the productivity of ring spinning without compromising yarn quality by
replacing the conventional ring-traveller setup with a magnetically elevated rotor [199,
200]. The proposed arrangement is shown in Figure 2.29. The ring rotates at up to 40,000
rpm without any frictional contact as it actually levitates in air under influence of
magnetic forces. Yarn spinning by magnetic rotor setup was also simulated through
modelling techniques. However, no comparison of yarn quality was presented.
Figure 2.29: Illustration of twist insertion mechanism by magnetic levitated ring [201]

69
The idea of yarn twisting through magnetically elevated elements was further refined by
using super conducting bearings instead of magnetic rotors [201, 202]. The yarns
produced on magnetic bearing based twisting system showed comparable quality to the
normal ring yarns. In a recent extension of this work, spinning speed of magnetic ring
was set up to 11000 rpm [203]. The effects of magnetic levitating parameters such as
resonance frequency and tilting of the ring were also discussed. An important concern
associated with super conducting method is essential requirement of very low working
temperature (i.e. -196 degree Celsius) to enable the superconductor to perform levitation.
Such arrangement on large number of ring spindles on the yarn production floor would
be quite challenging if not impossible.
Some studies focused on reducing the number of end breakages to improve the
productivity of the ring spinning process [204, 205]. An interesting concept of a moveable
balloon breaker instead of a static one was introduced to minimize the spinning tension
and to reduce the end breakage during yarn spinning [204]. A separate drive mechanism
with programmable controls is applied to move the balloon breaker in upward and
downward directions relative to the ring rail. It was observed that the proposed system
not only reduced and stabilized the spinning tension but also reduced yarn hairiness
because of balanced stresses and improved control in yarn ballooning zone. However, the
modification did not influence any other yarn quality parameters. Another study focused
on the phase lag of asynchronous motor on ring frame and its effect on the position of the
ring rail, which may relate to number of end breakages during the spinning process [205].
It was noticed that the reconstruction of the transducer signal and layer wise regulation
of spinning speed while considering the phase lag, could lead to better synchronization
between position of the ring rail and spinning speed. This improved synchronization can
enhance spinning productivity by reducing the number of yarn breakages.
2.7. Research gaps and opportunities
Decades of research and development on ring spinning technique have provided great
insights into numerous factors that control the quality of ring yarns and productivity of
spinning process itself but there is still room for further developments to produce superior
quality yarns at wider industrial scale. Among various modifications that have been

70
proposed in classical ring spinning process, only a few enjoyed measurable industrial
appreciation while others remained on experimental grounds only, due to their inability
to achieve significant improvements in overall yarn quality or complexity of their
application or higher associated costs. The ring yarns have not achieved enough strength
and abrasion resistance yet so that the need of sizing them before weaving a fabric can be
eliminated. Yarn hairiness is still a major concern that causes pilling on fabric surface,
which not only deteriorates its appearance but also reduces its lifetime.
In addition, there are a few areas of limited understanding in classical ring spinning such
as spinning triangle and yarn structure. The structure of any engineered assembly has
undeniable importance with respect to its physical properties. The actual and complete
picture of yarn structure is yet unknown. The same can be established for spinning
triangle, which is the most critical area in ring spinning process and serves as a control
point for fibre arrangement inside a yarn. The lack of knowledge about these critical areas
can be linked with the inability to effectively modify ring spinning systems that could
result in superior quality yarns. The problems associated with several modifications in
the ring spinning system and areas of limited understanding in yarn spinning are discussed
below as gaps in existing literature. The opportunities to extend research on these lines
are presented.
2.7.1. Research gaps
2.7.1.1. Limited improvements in overall yarn quality
Among various concerns in proposed and even in some commercially applied
modifications in ring spinning, the most serious one is their inability to achieve an overall
improvement in yarn quality. A certain modification in ring spinning generally improves
a particular parameter of yarn quality but does not improve (or in some cases even
deteriorate) other quality parameters. However, it is quite logical to think that various
yarn quality parameters are actually linked with each other quite closely. For example, a
more regular (or even) yarn is also considered to be stronger than a comparable irregular
yarn because it possesses fewer weak areas (or thin places) that could be prone to
breakages. Similarly, a less hairy yarn should be stronger than a severely hairy yarn
because more fibres would contribute towards its main structure rather than protruding

71
out of it, which is the case with hairy yarns. However, some modifications in ring spinning
system (as discussed in sections 2.6.2.1 & 2.6.2.1.5) showed a clear and significant
reduction in yarn hairiness but did not bring any noticeable improvements in yarn
strength. It is in fact quite surprising that more than 40-50% reduction in yarn hairiness
(in terms of S3 value) did not improve yarn strength in similar proportion [94, 116, 158].
This trend of partial improvements is not only evident in proposed experimental
modifications but also observed in commercially most successful modification made on
ring spinning system i.e. compact spinning. The condensing of fibres on compact
spinning results in a significant decrease in yarn hairiness compared to non-compact yarns
but it did not consistently improve yarn strength [94, 116, 158].
The poor translation of reduced yarn hairiness into improved yarn strength raises some
interesting questions such as; whether hair fibres are merely trapped inside a yarn instead
of properly integrating into its structure and what exactly makes a yarn stronger if more
fibres twisted inside it do not strengthen it. It would not be of much benefit to control
yarn hairiness by merely trapping fibres inside a yarn through an expensive and
complicated modification on the ring spinning system. The merely trapped fibres will not
improve tensile properties of yarn and may protrude again out of it once the garments
produced from these yarns are subjected to wearing and washing. Certainly, it can be
assumed that there are other factors in play, which actually decide the physical properties
of yarns and existing literature does not shed much light on them.
One of the reasons of partial improvements in yarn quality due to a certain modification
in ring spinning process is unknown relationships between different critical stages of yarn
production. The physical properties of a yarn depend on the arrangement of the fibres
inside it, which is controlled by tension differences in the spinning triangle zone. A
scientific way of improving yarn quality is to systematically investigate the relationships
between the spinning triangle, fibre migration, and yarn structure leading to its physical
properties. In order to achieve overall improvement in yarn quality, the knowledge of
these underlying factors and their relationships with resultant yarn quality is of vital
importance.
2.7.1.2. Relationships between spinning triangle and yarn quality

72
Although spinning triangle has been a focus of yarn quality related research for a long
time and numerous studies are reported on this topic over span of decades but even today
the understanding of ‘actual’ spinning triangle and its relationship with resultant yarn
quality is not clear. Most of the existing knowledge on the spinning triangle is based on
various theoretical models, which are developed to study the distribution of spinning
tension in fibres lying at different positions inside spinning triangle zone as discussed in
section 2.4.1. The simulation of these models shows that fibres at the edges of the
spinning triangle bear higher spinning tension compared to the fibres in the centre of the
spinning triangle due to differences in their path lengths. They also indicate that changing
the shape of the spinning triangle (for example skewing it) can change the tension
distribution among fibres. These findings are important as tension differences in fibres at
spinning triangle zone are thought to be the underlying cause of fibre migration, as
stressed fibres radially displace through concentric fibrous layers of yarns to release their
excessive tension. However, a serious limitation associated with these models is they do
not extend or translate the understanding of fibre tension distribution in terms of physical
properties of a yarn. The reason for this is theoretical nature of the models, which is not
complemented by the physical observation of the actual spinning triangle and systematic
investigation of its influence on yarn properties.
In addition, the assumptions of these models are too idealistic that do not agree with
extremely complicated interactions of numerous variables involved in actual yarn
spinning process. For example, a common assumption for various spinning triangle
models is perfect cylindrical fibres with equal length and symmetrical distribution on the
roller nip line. However, in reality it is impossible as fibres broadly vary in terms of cross
sectional profile and length. The fibres spread randomly at the nip line of the drafting
rollers. Some models assume constant spinning tension in the spinning triangle zone and
neglect the effect of roller friction with fibres, which is again unrealistic and limits their
applicability.
The gap of knowledge about the influence of the spinning triangle on yarn properties can
also be attributed to absence of a standard system to observe and analyse actual spinning
triangle. The spinning triangle is an extremely fine, tiny, delicate and dynamic transition
zone in ring spinning process, which is not understandable by physical observation with
naked eye. In addition, the hidden location of the spinning triangle makes things even

73
worst as it hides deep inside the curvatures of the opaque drafting rollers and only its fine
tip (i.e. yarn twisting point) is visible in normal ring spinning arrangement. Few
researchers have actually tried to reveal the spinning triangle by different techniques,
which are already discussed in section 2.4.2. However, these attempts resulted in a partial
view of the spinning triangle when observed in normal spinning conditions or viewing it
through clear rollers turned out to be a potentially invasive operation due to their effect
on actual spinning triangle shape. Hence, the ‘real’ spinning triangle remained
unexplored.
Another critical limitation of the systems proposed to observe the spinning triangle is they
only focus on few static images of the spinning triangle. In reality, spinning triangle is an
extremely dynamic zone, which changes its shape under influence of numerous process
and material related variations like spinning tension variation and roving irregularities.
Such a dynamically moving object needs to be analysed with much higher sample size
(i.e. number of images). Due to the constraints in physical observation of the spinning
triangle and inability to extend the theoretical models to yarn production stage, the exact
nature of the relationships between the spinning triangle and resultant yarn quality are
still unknown.
2.7.1.3. Relationships between yarn structure and yarn quality
Just like any engineered assembly, the structure of a yarn plays a critical role in
determining its physical properties. It is quite logical to conceive that two yarns exhibiting
significantly different physical properties for example yarn strength, must also have some
significant differences in terms of their structures just as two bridges with different
construction designs will vary in their loading limits. The yarn structure is a collective
representation of arrangement of all fibres inside it. The ring yarns (or yarns in general)
possess an extremely complicated structure where hundreds of constituting fibres are not
only twisted with each other but also randomly displaced between concentric fibrous
layers making their arrangement even more difficult to understand as discussed in section
2.5. The existing understanding of complicated yarn structure comes from tracer fibre and
yarn cross sectional analysis techniques, which were developed more than half century
ago. The tracer fibre technique has shown evidence of fibre migration while cross
sectional analysis suggest that fibres can be loose or tightly packed inside a yarn cross

74
section depending on the selection of the processing parameters. However, the problem
is this knowledge on yarn structure is not clearly translated in terms of yarn properties
through controlled variations in yarn structure and observing its effects on yarn
properties. It is still unknown what type of yarn structure and associated fibre arrangement
may result in superior yarn properties. The reason for this knowledge gap is quite simple
and exactly similar to what is discussed in case of the spinning triangle. There is no
established method to study ‘real and complete’ yarn structure.
The existing methods of studying yarn structure provide limited information on two
completely different dimensions. Yarn cross sectional analysis tells about the fibre
arrangement inside the yarn cross section while tracer fibre technique sheds light on
longitudinal arrangement of fibres inside a yarn. The complete yarn structure can be
explained only by combining cross sectional and longitudinal arrangement of fibres
together. This cannot be achieved for a certain section of yarn length because both cross
sectional and tracer fibre methods are invasive in nature and cannot be applied together
on a particular specimen. In addition, both techniques have various limitations associated
with them. The biggest concern of the tracer fibre method is it can only visualize the path
of a single tracer fibre in a certain section of yarn out of stack of hundreds of fibres.
Synthetic fibres (like polyester) are generally selected as tracers to achieve improved
visibility among natural fibres for easier tracing of their paths. As every fibrous material
has a different set of physical properties like friction and bending coefficients, a synthetic
tracer may follow a significantly different path compared to the natural fibres. The
observations made on synthetic tracer fibres could be unreliable. Few studies had utilized
‘fibro’ material (i.e. viscose fibres) to produce yarns with tracer fibres because some
materials like cotton fibres do not allow a clear visualization of the tracer fibres when
immersed in solution of suitable refractive index (usually methyl salicylate).
The yarn cross sectional analysis technique has also some serious limitations associated,
which can influence the results acquired through this method. The yarn has very fragile
structure, which can be disturbed even by mere slight contact. The cross sectional
microtomy method involves lots of contact with yarn specimen during handling,
mounting and slicing. It is also very laborious and time consuming as embedding a yarn
in a wax medium and later freezing to solidify it can take substantial time [206]. Another
important concern is the compressive force being applied on the yarn by the embedding

75
medium as it cures or solidifies [207]. Such compression can cause unwanted
disturbances in actual yarn structure and particularly increase yarn packing density as
compressive forces ‘squeeze’ the specimen. Slicing of yarn cross sections using
microtome requires an expert operator, as there are high chances of oblique and
inappropriate slicing due to non-uniform slicing speed, inaccurate blade angle and
inappropriate sample positioning. The handling of the yarn slices requires great care in
order to avoid any damage to the specimen. Yarn cross sectional images that are taken
through a microscope are manually processed to measure different yarn structural
parameters, which is again a laborious task. An expert user manually points out centres
of the individual fibres and draws boundaries around them, which is a subjective
procedure and prone to higher rate of human error. Due to these limitations of existing
methods of studying yarn structure, understanding of actual and complete arrangement of
fibres inside a yarn and its effects on yarn quality are still unknown.
2.7.2. Opportunities
In highlight of above discussion, it can be concluded that various recent modifications in
ring spinning process have achieved limited commercial success because they targeted a
certain parameter of yarn quality and did not bring about an overall improvement in ring
yarn properties. The reason for partial improvement in yarn quality can be attributed to
limited understanding of the relationships between yarn quality and the deep underlying
factors that influence it in some way. These areas of limited understanding include
spinning triangle and micro level yarn structure. The primary reason for lack of
knowledge in these areas is unavailability of appropriate techniques that can reveal ‘real’
spinning triangle and ‘actual’ yarn structure as existing methods only provide partial and
doubtful information about them due to several associated limitations.
Development of appropriate techniques that can be applied to study and analyse the
spinning triangle and yarn structure will not only provide a deeper insight of these critical
areas of yarn spinning but will also provide an opportunity to conduct systematic
investigations to establish relationships between them and on yarn properties. There is an
essential need to establish this three-layered relationships between spinning triangle, yarn
structure and yarn properties as all of them are directly linked and pose influence on each
in order of sequence. If appropriate methods can be developed to measure controlled

76
variations in the spinning triangle zone and quantify its effects on fibre arrangement and
migration within a yarn, the yarn structure can be controlled through changes in the
spinning triangle. The quantification of fibre arrangement in yarn structure can then be
linked with the physical properties of the yarns. This can establish entirely new
understanding of using the spinning triangle as a regulator of ring yarn properties.
Although the idea of systematically investigating the relationships between the spinning
triangle, yarn structure and yarn properties to improve yarn quality, is quite novel and has
not been applied in past but its importance was realized at least half century ago in one of
the most well-known (and cited) studies in textile technology. Prof. John Hearle had
stressed the importance of understanding these critical underlying areas in ring spinning
process as follow
“The pattern of fiber migration within a yarn must influence its properties, and this
control of migration is a possible way of controlling yarn properties. However, in
practice, migration is not measured or controlled, but merely happens as a consequence
of the operation of the twisting mechanism, If new methods of spinning are to be
introduced, it is important that they should lead to migration ; and the particular pattern
of migration which occurs will influence the yarn properties. The theoretical and
experimental study of fiber migration is thus of considerable importance”. [77]

77
3. Analysing the Dynamic Geometry of Ring Spinning Triangle
3.1. Introduction
The ring spinning process in use today has evolved over the span of centuries as discussed
in section 2.1.2. During all those years, ring spinning has been studied in such depth of
detail that the effects of even the smallest factors such as traveller age and drafting spacer
height on yarn quality are now well established [208, 209]. In fact, almost every single
element of ring frame spinning has been researched and optimized to an extent where it
would not be exaggerative to term ring spinning as a ‘well-matured’ spinning system.
However, a few grey areas still exist in the ring spinning process, where the scientific
understanding seems quite limited from a practical perspective. Spinning triangle is one
such grey area of ring spinning as most of the understanding about it is theoretical in
nature [47]. The influence of the spinning triangle particularly in terms of yarn quality is
not yet fully explained. The primary reason for the lack of knowledge about the spinning
triangle is quite simple. There is no established standard method to observe and analyse
the spinning triangle in real time yarn spinning.
The fundamental challenge associated with observation of the spinning triangle is its
‘hidden’ location, as it lies deep inside the curvatures of a pair of opaque drafting rollers.
In the classical ring spinning process, the spinning triangle starts forming at the nip line
of the front drafting rollers and ends at the yarn twisting point. With a short fibre such as
cotton this triangle is barely a few millimetres in length [210]. Similar scale of dimension
can be applied to its base or width, which depends on the spread of the drafted fibrous
strand emerging from main drafting zone. In addition to these issues, the shape and
geometry of the spinning triangle continually vary during yarn spinning under influence
of numerous material and process related variations. These variations are so rapid and
frequent that even if some mechanism can be developed to expose the tiny triangle from
the drafting rollers, its shape will never be consistent. This will pose another challenge in
its observation and understanding. It is also important to note that the spinning triangle is
an extremely fragile zone, where fibres are merged to form a yarn through twisting. Any
intrusive mechanism applied to observe the spinning triangle could potentially affect the

78
fibre arrangement inside it. This would result in a shift in its actual shape, which may lead
to inaccurate observations and wrong conclusions.
In past, there have been attempts to view the spinning triangle in order to understand its
dynamics during the yarn spinning process and to explain its influence on yarn quality.
One method involves the direct observation technique, which uses a small probe style
camera that is placed near the curvatures of the drafting rollers to look at the spinning
triangle [26]. The images of the spinning triangle are recorded for analysis as shown in
Figure 3.1. The main problem associated with this method is its inability to reveal the
complete spinning triangle. The only area of the triangle that can be visualized in regular
drafting arrangement is its lower half towards the tip or yarn twisting point. The upper
half of the triangle towards the base is hidden in the drafting rollers, which cannot be
captured even through the use of a very fine probe camera. The reason is field of view
reduces significantly as the probe approaches the drafting rollers. The limited field of
view again provides partial view of the spinning triangle. In addition, there are high
chances of damage to the probe due to even the slightest contact with the fast moving
drafting rollers. In order to study the spinning triangle, the minimum prerequisite is the
ability to at least see it completely.
Figure 3.1: Images of the spinning triangle as taken from direct observation technique
[26]

79
Another method to observe the spinning triangle is based on replacing the top roller of
the drafting system with a clear roller of similar dimensions that is made from a plastic
material [61, 210]. The clear roller allows a direct view of the spinning triangle by
mounting a camera above the roller rather than at the front end of the drafting system. As
the clear roller reveals the area between the drafting rollers, which is otherwise hidden, it
exposes the complete spinning triangle starting from its base to tip as shown in Figure 3.2
(a). The clear plastic roller is simple to apply on a ring frame for studying spinning
triangle in real time yarn spinning. However, one serious limitation is excessive fibre
slippage that was noticed in initial trials to observe the spinning triangle using clear plastic
roller as shown in Figure 3.2 (b).
Figure 3.2: Images of the spinning triangle taken through clear plastic roller a) appropriate
image b) fibre slippage due to plastic roller
Most transparent plastic materials that a roller could be made out of are not compressible
like an original rubber roller. A soft roller is required to make an appropriate nip with the
bottom roller in order to have good control over the fibres. One possibility to overcome
this problem is masking the bottom steel roller with a rubber surface so an appropriate
nip can be formed as the rollers engage with each other. However, masking the bottom
roller with rubber also covers its grooves, which provide essential fibre control during
drafting [211]. Lack of friction again leads to fibre slippage that disturbs the natural
arrangement of the fragile spinning triangle as shown in Figure 3.2 (b). Fibre slippage
caused by a hard plastic roller not only leads to higher number of end breakages but also
any observations made through it have a high chance of error because they do not
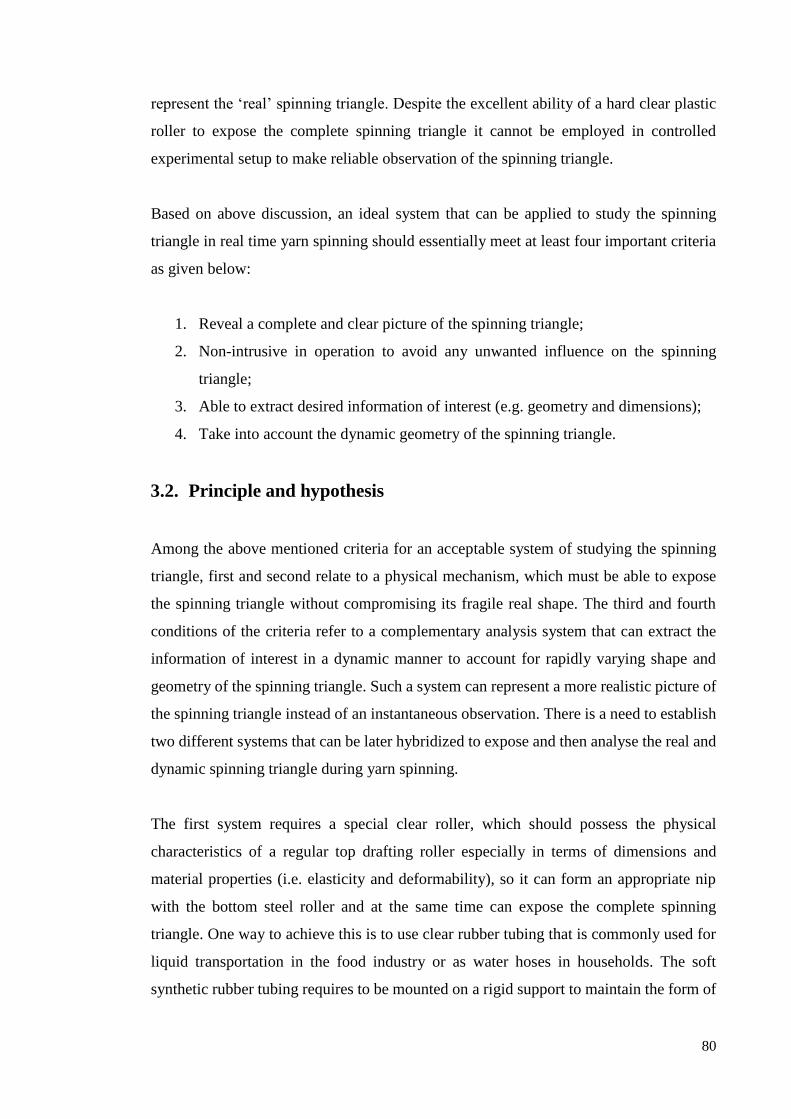
80
represent the ‘real’ spinning triangle. Despite the excellent ability of a hard clear plastic
roller to expose the complete spinning triangle it cannot be employed in controlled
experimental setup to make reliable observation of the spinning triangle.
Based on above discussion, an ideal system that can be applied to study the spinning
triangle in real time yarn spinning should essentially meet at least four important criteria
as given below:
1. Reveal a complete and clear picture of the spinning triangle;
2. Non-intrusive in operation to avoid any unwanted influence on the spinning
triangle;
3. Able to extract desired information of interest (e.g. geometry and dimensions);
4. Take into account the dynamic geometry of the spinning triangle.
3.2. Principle and hypothesis
Among the above mentioned criteria for an acceptable system of studying the spinning
triangle, first and second relate to a physical mechanism, which must be able to expose
the spinning triangle without compromising its fragile real shape. The third and fourth
conditions of the criteria refer to a complementary analysis system that can extract the
information of interest in a dynamic manner to account for rapidly varying shape and
geometry of the spinning triangle. Such a system can represent a more realistic picture of
the spinning triangle instead of an instantaneous observation. There is a need to establish
two different systems that can be later hybridized to expose and then analyse the real and
dynamic spinning triangle during yarn spinning.
The first system requires a special clear roller, which should possess the physical
characteristics of a regular top drafting roller especially in terms of dimensions and
material properties (i.e. elasticity and deformability), so it can form an appropriate nip
with the bottom steel roller and at the same time can expose the complete spinning
triangle. One way to achieve this is to use clear rubber tubing that is commonly used for
liquid transportation in the food industry or as water hoses in households. The soft
synthetic rubber tubing requires to be mounted on a rigid support to maintain the form of

81
a drafting roller and to bear the drafting pressure applied from the drafting cradle. A clear
plastic tube (such as an acrylic tube) can be used as a core and a piece of clear rubber
tubing can be mounted over it as a rubber cot. The conceived image of a clear rubber
roller is shown in Figure 3.3. However, any form of adhesive applied between the rubber
cot and core layer to join them will eventually result in a loss in clarity of the roller,
compromising the primary objective of viewing the spinning triangle through it. In
addition, the pressure exerted from drafting cradle will literally ‘slough off’ the rubber
cot from the core layer making it non-feasible to be consistently applied during yarn
spinning.
Figure 3.3: A concept of clear rubber top roller for observing the spinning triangle during
yarn spinning
Another possibility to develop the clear rubber roller is to use chemical resins like
polyurethane or silicon, which are cured into optically clear rubber objects or surfaces.
Such resins are widely used in fine arts and handicrafts for decorative purposes. The clear
resin system is usually based on two parts that are mixed together and allowed to cure in
a specialized mould to achieve a desired shape upon solidification. The objects produced
through clear rubber resin possess rubber like properties and are optically transparent.
The idea of applying clear rubber resin to develop clear rubber drafting rollers can lead
to a simple testable hypothesis i.e. if the top drafting roller can be produced by clear
rubber resin, will it allow visual evaluation of the spinning triangle in a non-invasive way.
Such a roller should carry out fibre drafting like a regular top roller, as it will be consistent
with it in terms of physical characteristics i.e. dimensions and rubber hardness. A major
benefit of the clear rubber roller would be ease of operation, as it may be simply clipped

82
in place of the original top roller without any further alteration in the drafting system
(such as masking the bottom roller with rubber).
If the proposed clear rubber roller is able to reveal the spinning triangle without
compromising its original shape or dynamics, extracting the information of interest on
the spinning triangle is still a question to answer. The fibres flow through the spinning
triangle zone at a speed of 10-15 m/min while thousands of twists are also inserted in
them. It is quite difficult to observe, analyse and understand the spinning triangle with
naked eye at such high fibre delivery rate even if it can be clearly viewed through the
above-mentioned clear roller. Hence, manual extraction of any information of interest
will not be possible. In addition, the continually varying shape and geometry of the
spinning triangle makes things even more difficult. An appropriate system of analysing
the spinning triangle is essential to understand it fully.
A sophisticated computational technology called digital image processing has emerged a
few decades ago with excellent abilities like performing complicated measurements on
digital images of an object or event, which are otherwise difficult for human beings to
carry out manually [212]. Image processing has also found wider applications in textile
technology to address a variety of research problems ranging from contamination sorting
in cotton flocks in spinning mills to automated fault detection in fabrics and garments
[213]. Image processing methods process the recorded images of the subject and apply a
range of mathematical algorithms on numerical values of the image pixels to isolate the
information of interest out of them. Due to easier availability of high quality imaging
devices for scientific applications, appropriate image acquisition is not a big issue. High
resolution and high speed imaging devices can pick up micro level features of a fast
moving object in fraction of a second, which can later be analysed at slower speeds to
easily understand a complicated phenomenon. Availability of high-level technical
programming languages makes it easier for technologists from non-computational
backgrounds to process their imagery data through image processing methods.
If the use of a clear rubber roller can allow the visualisation of the spinning triangle
without disturbing its natural arrangement, its digital images can be recorded through an
appropriate imaging device that can be later processed through appropriate image
processing algorithms to quantify the information of interest. Such a combination of the

83
clear rubber roller and image processing methods together will develop a new and
complete system to analyse the spinning triangle geometry that will meet all essential
criteria as outlined in section 3.1.
In this chapter the development and implementation of a clear rubber drafting roller has
been discussed. The non-invasiveness of the clear rubber roller is evaluated by comparing
it with a regular top drafting roller. An image processing algorithm is proposed to process
spinning triangle imagery data and to quantify it into various geometrical parameters. The
possibilities of analysing the geometrical data of the spinning triangle both in time and
frequency domains are discussed.
3.3. Experimental
The aim of this experiment was to test the hypothesis whether a clear rubber roller could
be successfully applied to study the dynamic spinning triangle without affecting the
natural arrangement of fibres inside it. In the first part of the experiment, a clear rubber
roller was developed from a polyurethane rubber resin system. The clear rubber roller
was made in accordance to the size and dimensions of regular top drafting roller so it
could be fitted over the ring frame. In the second part, the developed roller was tested by
applying it in the drafting zone of a ring spinning frame. During yarn spinning, the ring
spinning triangle was imaged through the clear rubber roller by an appropriate image
acquisition setup. The ability of the roller to observe the spinning triangle in non-invasive
manner was then evaluated through different aspects to approve or disapprove the stated
hypothesis.
3.3.1. Development of clear rubber roller
As already shown in Figure 3.3, the proposed clear rubber roller was a composite structure
of a hard base layer with a flexible rubber cot on top of it. Both components were required
to be optically transparent to allow the observation of the spinning triangle. A clear plastic
tube made up of acrylic was selected to produce a core layer. The inner and outer
diameters of the acrylic tube were 16 mm and 22 mm respectively. The clear polyurethane
resin used was Clear Flex 95 (Smooth-on, USA) to produce the rubber cot around the

84
acrylic tube. The hardness of the cured polyurethane rubber was 90-95 A shore, which
was comparable to the hardness of original drafting rollers. A circular mould was
developed from another acrylic tube that had an inner and outer diameter of 26 mm and
32 mm respectively for casting the polyurethane resin. The inner diameter of the tube was
machined to 27.5 mm with a smooth finish so that the cured rubber cot matched the
(outside) diameter of the original top roller. The aerosol based release agent applied inside
the mould to enable easy extraction of the rubber cot after curing was universal mould
release (Smooth-on, USA). The base tube and mould (for the rubber cot) were fixed on a
plastic plate in a concentric arrangement in order to pad the resin into the rubber cots as
shown in Figure 3.4.
Figure 3.4: Concentric arrangement of plastic tube and mould to cure polyurethane rubber
layer
The Clear flex 95, a two-part based resin system, was used at a mix ratio of 1:1.5 (by
weight) of part A and part B respectively. The resin processing was initiated by separately
degassing 10 grams of part A and 15 grams of part B. The degassing was carried out for
10 minutes for each part in a vacuum chamber at negative pressure of -15 inches of
mercury. After degassing separately, both parts were thoroughly mixed with each other
and degassed again for 15 minutes to remove any air bubbles out of the mixture. The

85
degassing of individual components as well as of the mixture had significant impact on
the clarity of the cured rubber cot. If air bubbles were not removed properly, they could
result in a hazy layer of rubber, which was of course not suitable for the intended
application of viewing of the spinning triangle as shown in Figure 3.5.
Figure 3.5: Effect of resin components and mixture degassing on transparency of the
rubber cot
The degassed mixture was then injected into the fine spacing between the base tube and
the mould using a syringe. The degassing and the application of the resin were carried out
at approximately 20 °C temperature in a fume hood to ventilate toxic fumes of the resin
mixture. The resin mixture was allowed to cure in air for 18 hours. Post curing was then
conducted at 70 °C for another 18 hours in a laboratory oven (GE182171, Crown
Scientific, Australia) to achieve maximum physical properties of the cured rubber. Two
units of clear rubber roller pieces were developed through the above mentioned process.
One end of the core plastic tube in each unit was machined on a Lathe to create a slot
inside it. The outer ring (19 mm diameter) of a high-speed IKO roller bearing (IKO
international, Inc., USA) was inserted into each slot. The inner rings of the bearings were
fixed on both ends of a steel rod to mount the rollers over it as shown in Figure 3.6. The

86
steel rod also contained a groove in its centre to clip inside the drafting arm of a ring
frame. The final developed form of clear rubber top roller is shown in Figure 3.7.
Figure 3.6: Different components of clear rubber roller
Figure 3.7: Clear rubber top roller vs original top roller
3.3.2. Yarn spinning

87
In order to test the performance of clear rubber roller in terms of exposing the spinning
triangle zone and non-invasive nature of its operation, 20 tex yarns with 798 twists per
meter were produced from 100% cotton rovings (from 30.55 mm upper half mean length
and 4.98 Micronaire cotton). The yarn spinning was conducted on an industrial scale
Zinser 350 ring frame (Saurer, Switzerland) using both ends of the clear rubber roller as
well as a regular top drafting roller producing two yarn bobbins from each type of roller.
The spindle speed was set at 10500 rpm, and ring of 38 mm diameter was used with
traveller number 36. The temperature and relative humidity in the spinning shed was 25°C
and 55% respectively. The yarn spinning arrangement through the clear rubber roller is
shown in Figure 3.8. The number of end breakages during yarn spinning was manually
recorded, while the quality of the yarn was tested as discussed in section 3.3.3 to compare
and study any disruptive effects of the clear rubber roller on the spinning triangle.
Figure 3.8: Yarn spinning through clear rubber roller and regular top roller on Zinser
ring frame
3.3.3. Yarn testing
The yarn specimens were subjected to yarn quality testing to evaluate four important
quality related parameters i.e. yarn hairiness, tensile strength, elongation and evenness.

88
All yarn samples were conditioned for at least 24 hours before testing in standard lab
conditions (i.e. 20 ± 2 °C temperature and 65 ± 2 % relative humidity). Five yarn
specimens were tested for yarn evenness and hairiness while fifty yarn specimens were
tested for yarn strength and elongation. Uster evenness tester with OH module and Uster
Tensorapid were used for yarn quality testing. The specifications of yarn testing
procedures in terms of number of samples, sample length and testing parameters are given
in Table 3.1. In addition to quality testing, the end breakages during yarn spinning were
also recorded.
Table 3.1: Yarn testing specifications
Quality
parameter
Equipment Sub
samples
Within
samples
Pre
tension
(cN/tex)
Test
speed
(m/min)
Test
time
(min)
Yarn
length
(m)
Evenness
&
hairiness
Uster
tester 4 1 5 - 400 5 2000
Strength
&
elongation
Uster
Tensorapid
4
1 50 6 5 -
25
(0.5 ×
50)
3.3.4. Image acquisition
In order to observe and record the spinning triangle, a Canon 550D (Canon, Japan) high-
resolution digital single lens reflex (DSLR) camera was selected. A macro lens (Canon,
Japan) of 100 mm focal length was coupled with the camera to observe the spinning
triangle zone closely through the clear rubber roller as shown in Figure 3.9. The ISO (light
sensitivity of the camera), shutter speed and F-stop number (lens focal length to aperture
ratio) of the camera were set to 800, 1/60 and 2.8 respectively. The F-stop number was
kept at a minimum to achieve the shallowest possible depth of field to focus on the
spinning triangle only. This eradicated any unwanted objects from the image such as fibre
fluff and fly by defocusing them as they mostly lie in a different plane along the Z-axis.
High quality and consistent images of the spinning triangle could be achieved by keeping
undesired variations to a minimum. Such images were relatively easier to process for

89
extracting the information of interest out of them. ISO and shutter speed were also
selected to facilitate the elimination of any unwanted features in the image. For example,
low ISO value only visualized the main fibrous strand and spinning triangle in the image
and suppressed any short fibres surrounding it by assigning them dark pixels. It is also
important to note that the lighting arrangement significantly influences the image
acquisition and downstream image processing due to its role in determining the image
quality. The image acquisition was conducted under normal indoor lighting conditions,
which remained consistent throughout imaging phase.
Figure 3.9: Image acquisition setup for viewing spinning triangle
A ruler was placed under the clear rubber roller to calibrate pixel dimensions into physical
units (i.e. millimetres). The images of the spinning triangle were recorded in continuous
video format at 640 x 480 resolution. Five videos of the spinning triangle were recorded
for one yarn produced with the clear rubber roller. The length of each video was 30
seconds and imaging speed was 50 frames per second, which resulted in 7500 continuous
images of the spinning triangle. The videos of the spinning triangle geometry were then
transferred to a computer for further processing.

90
3.3.5. Digital image processing
In order to process the imagery data of the spinning triangle acquired using the clear
rubber roller, an algorithm was developed using multiple functions from image
processing, signal processing and statistical toolboxes in Matlab R2016a (MathWorks,
USA). The objective of the image processing operations was to detect all three vertices
of the spinning triangle and quantify its physical dimensions such as width and height in
an automated manner. The various steps that were involved in the workflow of the image
processing algorithm are given as follows.
1. Reading the recorded video of the spinning triangle into Matlab workspace and
splitting it into individual frames (or images)
2. Cropping (manually) the spinning triangle in the first image of the sequence using
a rectangular drawing tool
3. Using the spatial coordinates of the rectangular region for segmentation of the
spinning triangle part from the rest of the image in subsequent frames
4. Adding the pixel intensity values together in each column of the spinning triangle
image
5. Smoothing the resultant signal with Savitzky-Golay algorithm to determine the
signal peak, which represented the centre of the fibrous strand
6. Selecting a small rectangular region of 1 mm width at 3 mm distance from the
centre of the fibrous strand towards its right to detect roller nip line
7. Applying contrast adjustment and binary conversion of the image to segment
roller contact area whose bottom edge represented the roller nip line
8. Extending and drawing the roller nip line 3 mm back into the spinning triangle
zone

91
9. Determining the left and right vertices of the spinning triangle by contrast
adjustment and binary conversion of fibrous strand along roller nip line
10. Splitting the spinning triangle region into two equal vertical halves to determine
third vertex or the tip of the spinning triangle
11. Adding the pixels intensity values in each row as well as in each column in the
lower half of the spinning triangle
12. Smoothing the resultant signals through Savitzky-Golay algorithm to minimize
noise fluctuations
13. Detecting the peak of the signal achieved through adding columns, which
represented the x-component of the third vertex on image plane
14. Detecting the steep decrease in intensity values in the second signal achieved
through adding rows, which represented convergence of fibres into the yarn and
also the y-component of the third vertex
15. Marking all three vertices on the input spinning triangle image and calculating
various geometrical parameters of interest
3.4. Results and discussion
The developed clear rubber roller was applied for producing yarns to test its suitability
for studying the spinning triangle without affecting the natural arrangement of fibres. As
mentioned earlier, any system that could be employed to study the spinning triangle
should at least meet four important criteria, i.e. be able to produce complete and clear
view of the spinning triangle, non-invasive in operation, extract the information of interest
and dynamically analyse the spinning triangle. The performance of the clear rubber roller
in terms of these criteria has been discussed individually in the following sections of this
chapter. In addition, a new method based on digital image processing technique to analyse

92
the imagery data of the spinning triangle and extract the information of interest in a
dynamic manner has also been presented.
3.4.1. Clarity of spinning triangle viewing
The primary requirement of any system to observe the spinning triangle is its ability to
clearly recognise the entire area of the triangle from the other elements in the drafting
zone. A complete view of the spinning triangle includes the area starting from roller nip
line, where a parallel strand of drafted fibres starts to converge under influence of twisting
forces (triangle base) up to the yarn formation zone or twisting point. In addition, the view
of the spinning triangle provided by the system should be quite clear so the important
features of the triangle such as its geometry and physical dimensions can be observed and
analysed. A typical image of the spinning triangle that was acquired through the clear
rubber roller arrangement by the imaging setup proposed in section 3.3.4 is shown in
Figure 3.10 (a). The important geometrical features of the spinning triangle are annotated
as shown in Figure 3.10 (b).
The image of the spinning triangle as acquired using the clear rubber roller represents the
complete picture and geometry of the spinning triangle. A continuous parallel strand of
fibres (shown in purple dotted line) can be seen lying on the bottom drafting roller
(marked with a red boundary). The fibrous strand then converges into a small triangular
shape as it leaves the roller contact area (marked with a green boundary). The lower
boundary of the contact area of the rollers refer to the roller nip line, where the fibres
started deflecting towards the yarn twisting point (marked with a yellow arrow) under
influence of yarn twist. This deflection of fibres forms the spinning triangle zone (shown
with a black boundary). The spinning triangle zone was tiny in dimensions and started
forming at the nip line of the drafting rollers. The yarn twisting point or the tip of the
spinning triangle was exactly the place, where the yarn (marked with a blue arrow)
formed. This view of the spinning triangle was quite similar to the image (Figure 3.2)
shown previously, which was recorded using a clear plastic roller. Both images show the
complete spinning triangle unlike a partial view that was acquired by direct observation
in a normal drafting arrangement (Figure 3.1). However, the image of the spinning
triangle acquired through clear rubber roller was not as clear as the image achieved
through the clear plastic roller. The image of the spinning triangle captured using the clear

93
rubber roller is slightly fuzzy or hazy especially near the edges of the fibrous strand while
the image captured through the clear plastic roller had superior resolution and sharper
appearance of the fibrous strand as previously shown in Figure 3.2. There are two possible
reasons for inferior clarity in spinning triangle image captured through the clear rubber
roller i.e. the structure of the clear rubber roller and selection of the imaging parameters
on the camera.
Figure 3.10: (a) A typical image of the spinning triangle acquired using the clear rubber
roller arrangement (b) Various areas of interest annotated in the spinning triangle image

94
3.4.1.1. Effect of roller structure
One of the hindrances in achieving clear view of the spinning triangle through the rubber
roller is its composite structure (two layered i.e. plastic and rubber). The image of the
spinning triangle taken through the plastic roller arrangement as shown in Figure 3.2 (a)
did not encounter this problem due to the single layered structure of the plastic roller. In
the case of the clear rubber roller, light reflecting back from the spinning triangle zone
needs to pass through two different mediums of varying refractive indices i.e. plastic and
rubber. This difference in refractive indices influenced the regular reflection of light and
resulted in some loss of information about the spinning triangle physique carried by the
reflecting light. This degraded the quality of the images of the spinning triangle. As the
light passed only through a single medium of consistent refractive index in the case of
clear plastic roller, which does not negatively influence the reflecting light, the image of
the spinning triangle was much clearer.
Another reason of lack of clarity in clear rubber roller was unwanted accumulation of a
few fibres on roller surface during the drafting process. The accumulation of fibres may
have occurred due to two reasons. Firstly, the outer surface of the clear rubber roller was
not perfectly smooth or uniform as that of a regular drafting roller used in normal ring
spinning process. The clear rubber roller was produced through a resin casting process
(as discussed in 3.3.1), which is different from the process of producing regular drafting
rollers. The regular drafting rollers are produced by fixing a tube of rubber on a bearing
by glue under certain pretension [214]. This rubber tube is normally made by plying
various layers of a rubber sheet through a high pressure calendaring process followed by
grinding and fine polishing. This gives a smooth and uniform finish to the outer surface
of the regular drafting roller. In comparison, the casting process did not achieve a similar
level of finish of the outer surface of the roller. The surface finish in the case of clear
rubber rollers depended on the smoothness and evenness of the inner walls of the casting
mould. As the casting mould was produced by manual machining of plastic tubes, its
inner walls were not perfectly smooth or uniform due to human and machine related
variations. Although, grinding and polishing of the clear rubber roller could improve its
smoothness it would also make it opaque, compromising its primary objective of viewing
the spinning triangle.

95
Secondly, the casting of clear rubber resin into a roller required application of a release
agent on the inner walls of the mould to allow extraction of the rubber part after the curing
process completed. Although, the application of the release agent facilitated the extraction
of the cured rubber roller from the mould it also left some residuals of the release agent
on the outer surface of the roller during the casting process. These residuals of the release
agent made the roller surface slightly sticky, which promoted unwanted clinging of fibres
to the roller surface. As cotton fibres are non-transparent, these clinging fibres were
elucidated out of the field of view by achieving a shallow depth of field during image
acquisition (as further discussed in section 3.4.1.2) but their effect on clarity of view of
the spinning triangle could not be completely eliminated.
It is also important to mention that the acquired images were slightly distorted in terms
of physical dimensions of the spinning triangle due to curved surface of the roller. The
effect of distortion was significant on the spinning triangle geometry, which appeared
smaller in the images than its actual size. The effect of this unwanted distortion was
eliminated by placing a plastic ruler under the clear rubber roller and imaging it as already
discussed in section 3.3.4. The similar distortion was also reflected in the ruler image.
The pixel distance between any two marked points on the ruler surface not only allowed
the pixel to physical unit conversion but also compensated the distortion factor.
3.4.1.2. Effect of imaging parameters
Another possible reason of lack of clarity in the spinning triangle image achieved when
using the clear rubber roller may be due to the particular settings on the camera employed
for image acquisition. For example, slow shutter speed during image capture of moving
material results in slightly blurred and less sharp image by default. However, slow shutter
speed also minimizes the noise (random dark and bright pixels) in the image by increasing
the sample size of the object. One example of a spinning triangle image that was captured
at a high shutter speed (i.e. 1/1000) is shown in Figure 3.11(a). The excessive noise may
be clearly noticed in the image, which shadows important geometrical details of the
spinning triangle.
Similarly, the low F-stop value shallowed the depth of field during imaging, which
resulted in a sharp focus on the spinning triangle while eradicating any unwanted features

96
by keeping them out of the focus like fibre fluff and fly on the upper side of the roller or
floating in the air. It was this reason that the above image of the spinning triangle showed
no prominent fibre fluff or fly while some fibres were clinging to the upper surface of the
roller during yarn spinning and imaging. An image of the spinning triangle at a higher F-
stop value (i.e. 4.5) is shown in Figure 3.11(b) where the fibres that were clinging to the
roller could be noticed. As the fibre fluff and fly cannot be eliminated during yarn
spinning, the best possibility is to eradicate them from the focal plane by selecting
appropriate camera settings. Otherwise, it can deteriorate the overall quality of the image
by shadowing the important features of the spinning triangle. Despite the slight fuzziness,
the image of the spinning triangle was complete in physical terms and was suitable for
further analysis due to absence of unwanted artefacts in it.
Figure 3.11: Images of the spinning triangle taken at a) 1/1000 shutter speed b) 4.5 F-stop
value
3.4.2. Non-invasiveness of the clear rubber roller
Almost 100 fibres were present in the spinning triangle zone of the yarns measured as
part of this project (calculated as the ratio of yarn and fibre linear densities). They were
gripped in the nip of the drafting rollers at one end and trapped in the yarn twisting point
at the other end. The control over the fibres is stronger and firmer at the drafting nip
compared to the yarn twisting point due to pressurized contact of the drafting rollers. On
the other hand, fibres are merely controlled by twisting forces at the yarn formation point
that originate from the ring spindle. Hence, the main control over fibres in the spinning
triangle zone is exerted by the front drafting rollers, which also implies that any degree

97
of modification in default drafting arrangement can potentially disturb the essential
control over fibres. This lack of control can lead to unwanted influences over the actual
arrangement of fibres in the spinning triangle zone leading to a shift in its actual physique
or geometry. The issue becomes even more critical when the purpose of such modification
is to study the actual spinning triangle itself, which was the case with the clear rubber
roller. Hence, it was important to investigate whether replacement of the regular top roller
with a clear rubber roller affected the actual fibre arrangement inside spinning triangle in
a negative way before it could be applied in a controlled experimental arrangement to
study the spinning triangle.
3.4.2.1. Effect on end breakages
The possible disrupting effects of the clear rubber roller on the actual geometry of the
spinning triangle can be evaluated through multiple criteria. One such aspect was to study
and compare the number of end breakages that occurred during yarn spinning using the
clear rubber roller with that of a regular drafting roller. As already discussed in section
2.1.2, the spinning triangle not only influences the yarn quality but also the productivity
of the spinning process as most of the end breakages occur at this point. Any disruptive
action at the spinning triangle zone would exert poor or lose control on fibres causing an
increase in the number of end breakages. Hence, an analysis of the number of end
breakages occurred during yarn spinning using both rollers could demonstrate any
significant invasive effects caused by the clear rubber roller on the actual fibre
arrangement at the spinning triangle zone. The comparison of number of end breakages
occurred at two spindles during the spinning of a complete yarn bobbin through both
types of the rollers shown in Figure 3.12.

98
Figure 3.12: Comparison of end breakages that occurred during yarn spinning through
clear versus original top roller
The number of end breakages per bobbin of yarn produced through the clear rubber roller,
were not only few in number but also very close to the number of breakages that occurred
with the normal drafting arrangement (with original top roller). The comparison of end
breakages supports the idea that the clear rubber roller exerted appropriate control on
fibres at the spinning triangle zone through an appropriate roller nip and did not
negatively influence their actual arrangement. Hence, the nature of operation of clear
rubber roller was likely to be non-invasive. The formation of appropriate nip between
clear rubber roller and the bottom steel roller is further discussed in section 3.4.2.3.
3.4.2.2. Effect on yarn properties
Another possibility to evaluate the non-invasiveness of clear rubber roller is to compare
the properties of the yarns produced using the clear rubber roller and the regular top roller.
If the clear rubber roller posed negative effects on normal fibre flow within the roller nip
and the spinning triangle zone, it would be reflected in terms of deterioration in yarn
quality. A comparison of properties of yarns produced through both types of rollers is
presented in Figure 3.13 where the error bars represent one standard deviation on both
sides of the mean value.
0
1
2
3
4
Spindle 1 Spindle 2
Aver
age
nu
mb
er o
f en
d b
reak
ges
per
yar
n b
ob
bin
Clear roller
Original roller

99
Figure 3.13: Comparison of yarn properties produced through clear rubber and original
top rollers
The differences between physical properties of yarns produced using the clear rubber and
original top roller were minor. The yarns produced using the clear rubber roller exhibited
slightly less tenacity and elongation than comparable yarns produced on the original top
roller. There was also a difference in terms of yarn evenness and hairiness as the yarns
produced with the clear rubber roller were slightly more hairy and less even than the yarns
produced through the clear rubber roller. The possible reason for increased yarn hairiness
and unevenness may be attributed to the slightly sticky surface of the clear rubber roller
due to the application of release agent on the mould before curing the rubber roller. As
the clear rubber roller did not significantly deteriorate the overall yarn quality, it could be
inferred that the effect of the clear rubber roller was likely to be non-invasive on yarn
quality.

100
3.4.2.3. Physical observation of fibre slippage
Another possibility to determine any detrimental effect of the clear rubber roller on the
actual spinning triangle is to look directly at the imagery data of the spinning triangle
acquired using the clear rubber roller. The analysis of the continuous sequence of the
spinning triangle images that were taken at 20 millisecond interval would reveal if the
clear rubber roller had an invasive effect on the shape of the spinning triangle due to a
lack of control on fibres causing fibre slippage. A similar case is previously discussed in
in section 1, where the fibre slippage at the spinning triangle zone was visually noticeable
from the clear plastic roller as already shown in Figure 3.2 (b). The lack of control on
fibres exerted by the clear plastic roller due to its inappropriate nip with the bottom steel
roller caused fibre slippage and affected the actual shape of the spinning triangle.
Similarly, if the clear rubber roller did not form an appropriate nip with the bottom steel
roller, it would not have been able to control the fibre flow resulting in excessive fibre
slippage, which should have been noticeable in the images captured of the spinning
triangle. However, the analysis of the sequence of spinning triangle images does not
suggest fibre slippage was present in the case of clear rubber roller. This is further
illustrated through a 15 seconds long sequence of the spinning triangle images that were
taken at 0.5 second intervals in Figure 3.14. The consistency in the fundamental shape of
the spinning triangle and its convergence into a yarn as shown in the image sequence
supports the idea of necessary control over the fibres.

101
Figure 3.14: Continuous sequence of the spinning triangle images (contrast adjusted)
taken at 0.5 second interval for 15 seconds
The consistent shape of the spinning triangle during yarn spinning through the clear
rubber roller also indicated that the rubber roller formed a strong nip and appropriate
contact with the bottom steel roller, which resulted in almost identical control over the
fibres to that of a normal front roller. This idea of effective control on the fibres can be
further supported by the fact that the rubber roller was flexible unlike the plastic roller
and slightly deforms upon application of drafting pressure producing appropriate and

102
strong nip with the bottom drafting roller. Two close up images of the nips formed by a
clear plastic roller and a clear rubber roller with the bottom steel roller of the drafting
system are shown in Figure 3.15 (a) & (b) respectively. The plastic roller just pressed
against the grooved (or slotted) profile of the bottom steel roller and did not show any
deformation in its circular periphery due to intrinsic hardness of the plastic material. On
the other hand, the clear rubber roller showed certain degree of deformation upon
pressurized contact with the bottom steel roller and exhibited improved contact between
rollers resulting in better nip and effective control on the fibres. The superior control on
fibres minimized the chances of fibre slippage due to clear rubber roller as well as the
possibility of any detrimental effect on the actual spinning triangle geometry.
Figure 3.15: Close up images of contact of bottom steel roller with a) clear plastic roller
b) clear rubber roller
3.4.3. Quantification of spinning triangle geometry
The discussion on the suitability of the clear rubber roller to study the spinning triangle
suggests that the clear rubber roller may be used to effectively visualize the spinning
triangle while causing minimal changes on the actual shape and action of the spinning
triangle. The next step was to analyse the images of the spinning triangle and extract the
information of interest out of them. This information needed to be in a form of quantified
data about the spinning triangle that could explain variations in it under influence of
process and material related variables. The geometry of the ring-spinning triangle was
selected as the most appropriate indicator that could be easily measured, to define its
structure and shape. Various physical dimensions such as width, height and angles of the
spinning triangle can provide information about its overall shape and structure. In order

103
to extract this geometrical information, the images of the spinning triangle needed to be
appropriately processed.
3.4.3.1. Vertices of the triangle
A typical image of the spinning triangle as already shown in Figure 3.10 contains
complete geometry as well as quantifiable information about the geometrical parameters
of the spinning triangle. If the nip line can be traced on spinning triangle image where the
fibres exactly start to converge in a triangular shape, the initiating point (or base) of the
spinning triangle can be determined. Two points that lie on the roller nip line where the
fibrous strand starts and ends (width wise), represent left and right vertices of the triangle.
The third vertex of the triangle is the yarn twisting point, which lies at the tip of the
triangle. In order to quantify the geometrical parameters of the spinning triangle,
determination of these vertices in the digital images of the spinning triangle was required.
A conceptual illustration of the idea is shown in Figure 3.16. The roving strand is shown
with dotted black lines while the base of the triangle is shown with a solid black line. The
yarn is shown with solid yellow lines. The connecting solid red line from yarn centre to
the base of the spinning triangle forms side edges of the spinning triangle. The three
vertices that can quantify the spinning triangle geometry are shown in red coloured dots.
The quantification of the spinning triangle geometry through its three vertices is shown
in Figure 3.17. The distance between left and right vertices refers to the width of the
triangle. The vertical distance between the tip of the triangle and either left or right vertex
represents the height of the spinning triangle. Similarly, the left and right angles of the
spinning triangle represent the angles between left vertex with triangle tip and right vertex
with triangle respectively. The resultant measurements, which were measured as pixels
from the images, were converted to physical units by calibrating the camera magnification
level with a ruler as discussed in section 3.3.4.

104
Figure 3.16: a) an image of the spinning triangle b) illustration of plotting three vertices
of the triangle

105
Figure 3.17: The principle of measurement of geometrical parameters of the spinning
triangle through its three vertices
3.4.3.2. Image processing algorithm
The determination of the vertices of the spinning triangle opens up the possibility to
quantify its geometrical parameters and extract the quantitative data about its shape.
However, one challenge associated with such measurements is manual processing of
exceptionally high number of images (e.g. a few thousands) of the spinning triangle
captured during the image acquisition phase. The reason for recording such a high number
of images of the spinning triangle was to study the changes in its geometry over time. In
addition, an analysis based on a higher number of images (or samples) would result in
more accurate estimate of its real geometry. However, manual processing of such a huge
amount of data is not only laborious but also prone to higher chances of error. Hence, an
automated method has been proposed using digital image processing to handle the task
of determining the three vertices of the spinning triangle from each of the thousands of
spinning triangle images as discussed in section 3.3.5. The algorithm also extracted and

106
recorded the geometrical information acquired from the vertices of the spinning triangle.
An example of the application of image processing algorithm on one of the spinning
triangle image captured in this work and its outcomes are shown in Figure 3.18.
The first image of the spinning triangle video sequence was cropped by the user to
manually select the spinning triangle region using a rectangle drawing tool as shown in
Figure 3.18 (a). This isolated the area of interest in the image for application of the image
processing operations. Two of the important requirements of quantifying the spinning
triangle geometry were determining the roller nip line and the yarn twisting point. Left
and right vertices of the spinning triangle lie on the roller nip line while the third vertex
lies on the tip of the spinning triangle. The roller nip line could be determined anywhere
along the width of the bottom roller. However, the ideal place was where the presence of
fibre fluff and fly was at a minimum such as at some distance from the main fibrous
strand. However, the centre of the fibrous strand needed to be nominated first so that it
could be used as a reference for selecting an area at a specific distance from it. To achieve
this, the sum of all pixel values (i.e. greyscale intensity) in each column of the selected
rectangular region was calculated as plotted in Figure 3.18 (b). The Savitzky-Golay
algorithm was applied on the resulting signal for smoothening it as shown in Figure 3.18
(c). The peak of the signal represented the centre of the fibrous strand as the maximum
number of non zero pixels lay in the column that formed the centre of the fibrous strand.
The detected centre of the triangle was imposed on the initial image in a green color as
shown in Figure 3.18 (d). The centre of the triangle referred to a line that was normal to
its base and passed through its tip.
Further proceeding with determination of the roller nip line, a small 1 mm wide region
was selected at 3 mm right offset to the centre of the fibrous strand as shown in Figure
3.18 (e). The selected area being quite distant from the spinning triangle zone had minimal
chance of the presence of fibre fluff or fly that could possibly affect the roller nip
detection. The principle of determining the roller nip line was based on the fact that
maximum reflection of light occurs at the contact area of the clear rubber roller and
bottom steel roller producing a bright region in the image. This bright region was detected
by basic contrast adjustment and binary conversion of the image as shown in a small
window in Figure 3.18 (e). The bottom row of the pixels of the roller contact area
represented the roller nip line, which was then extended back to the spinning triangle zone

107
as illustrated in Figure 3.18 (f). As the left and right vertices of the triangle lay on the
roller nip line, they were determined by simple thresholding of the light coloured fibrous
strand from the darker background.
To complete the quantification of the spinning triangle geometry, the determination of
the third vertex of the spinning triangle was also required. In order to determine it, the
rectangular region as shown in Figure 3.18 (a) was split into two equal vertical halves i.e.
top triangle zone and the bottom triangle zone. The yarn twisting point essentially lay in
the bottom half of the spinning triangle as shown in Figure 3.18 (g). The yarn twist point
was the specific point, where the triangular shape spread of fibres converged in to the
form of a yarn. The pixels in each column and row of the bottom half of the spinning
triangle zone were added separately and plotted as shown in Figure 3.18 (h) & (i)
respectively. The signal plotted in Figure 3.18 (i) was smoothed using Savitzky-Golay
filter as shown in Figure 3.18 (j) to minimize unwanted noise and fluctuations. The peak
of the signal in Figure 3.18 (h) referred to the yarn centre whilst the sharp decrease in
Figure 3.18 (j) referred to the area where the triangle converged into a yarn. Both of these
positions were taken as horizontal (x) and vertical (y) coordinates of the yarn twisting
point respectively. The yarn twisting point was then marked on the actual spinning
triangle image as shown in Figure 3.18 (k).
Various measurements regarding the spinning triangle geometry were conducted through
these three coordinates as shown in Figure 3.18 (l). The width and the height of the
triangle were calculated as the distances between left and right vertices and roller nip line
and yarn twisting point respectively. Left and right angles referred to the angles between
yarn twisting point and left and right vertices of the spinning triangle respectively.

108

109
Figure 3.18: Various stages in processing of the spinning triangle images: (a) cropping
the spinning triangle region by user, (b) taking sum of the columns of the selected region,
(c) applying Savitzky-Golay smoothing filter, (d) determining the centre of the fibrous
strand, (e) determination of roller contact line by selecting an area at 3-4 mm distance
from the spinning triangle, (f) mapping of the roller nip line on the image, (g) selecting
the lower half of the spinning triangle zone, (h) taking the sum of the columns of selected
area to locate yarn centre, (i) taking the sum of rows of selected area, (j) application of
the Savitzky-Golay smoothing filter to detect a steep decrease in pixel intensity at the
yarn twisting point, (k) plotting three vertices of the triangle, (l) simulation of the spinning
triangle geometry with measurement of its geometrical parameters
3.4.4. Dynamic analysis of the spinning triangle
The application of image processing techniques to quantify the geometry of the ring
spinning triangle provided an opportunity to process large amounts of spinning triangle
imagery data in a relatively short time. Although, the measurement of the geometrical
parameters of the spinning triangle gave a clear understanding about its structure, a single

110
image alone cannot truly represent the dynamic geometry of the spinning triangle. The
geometry of the spinning triangle changed rapidly and a single image could only cover
its shape at a fixed point in time, valid merely for a fraction of a second. The variations
in the spinning triangle geometry over time were determined by analysing the continuous
serial images of the spinning triangle through the proposed image processing method.
Five hundred continuous serial images of the spinning triangle were processed to
calculate its different geometrical parameters over a period of ten seconds. The variations
in individual geometrical parameters of the spinning triangle were plotted in the time
domain (i.e. time series) as well as in the frequency domain by applying Fourier transform
as shown in Figure 3.19 - Figure 3.22. All of the measured geometrical parameters of the
spinning triangle exhibited a significant amount of variations in their magnitude over time
as it can be seen in the relevant graphs. These variations were caused by the continuous
fluctuations in the overall geometry of the spinning triangle. The origin of this variation
in spinning triangle geometry may lie in process and material related variables such as
roving irregularities and spinning tension. Firstly, the extent of variations in the
geometrical parameters indicated that the approach to measure the spinning triangle
geometry by merely looking at one or few images was not an appropriate method as the
spinning triangle changed its shape at a high frequency. Secondly, Statistical principles
suggest that a higher number of samples were required to closely estimate the actual value
of a parameter, which exhibit high extent of variation [215]. Hence, the best estimate of
the actual spinning triangle geometry can then be made by averaging a substantial amount
of observations for each parameter of the spinning triangle geometry.

111
Figure 3.19: Variation in the width of the spinning triangle in (a) time domain (b)
frequency domain
Figure 3.20: Variation in the height of the spinning triangle in (a) time domain (b)
frequency domain

112
Figure 3.21: Variation in the angle A (left angle) of the spinning triangle in (a) time
domain (b) frequency domain
Figure 3.22: Variation in the angle B (right angle) of the spinning triangle in (a) time
domain (b) frequency domain

113
The width of the spinning triangle has a relationship with the evenness of the input roving
strand as it expands and contracts due to the presence of thick and thin places respectively
[216]. However, random irregularities of a small magnitude occurred in the roving strand
due to intrinsic variations in the spinning process and the natural variations in the fibre
material, which cannot be eliminated fully. The width of the spinning triangle as measured
through its images was sensitive to these irregularities and showed fluctuations in its value
as can be seen in Figure 3.19 (a). However, a roving strand may also contain periodic
faults caused by specific factors related to yarn spinning such as roller eccentricity. These
specific variations in the width of the spinning triangle may not be clearly visible in time
series plots and require analysis of the signal in frequency domain through Fourier
transform as shown in Figure 3.19 (b). One peak at 4 Hz can be noticed in the frequency
spectrum that may be referring to a periodic fault that occurs four times in one second.
However, it can only be confirmed by studying the evenness data of the roving strand.
The trend of the variation in height of the spinning triangle appeared to follow an
oscillation pattern in the form of alternate and consecutive peaks and valleys as shown in
Figure 3.20 (a). There could be two possible reasons for this oscillatory pattern of
variation in the spinning triangle height. Firstly it could be linked to the yarn formation
and twisting process [54]. As the fibres were twisted, the height of the triangle decreased
and with the entrance of more fibres into the spinning triangle zone through the drafting
rollers the height of the triangle increased, which generated alternative peaks and valleys.
Secondly, the vertical traverse of the ring rail could cause the variation in the height of
the spinning triangle by influencing the amount of spinning tension applied on the
spinning triangle zone [217].The Fourier transformation of the height signal showed the
maximum amplitude peak at around 2 Hz frequency as shown in Figure 3.20 (b). This
does not correspond with ring rail traversing frequency, which was 0.05 Hz as it took
around 20 seconds to complete one vertical traverse cycle. However, it coincides with the
number of twists inserted into the spinning triangle zone in one second, which was 2.18
as calculated below.

114
Spindle speed (or total twists) per minute = 10,500 rpm
Number of twists inserted per second = 175 twists / second
Average distance between traveller and front roller nip = 40 cm
Assuming a uniform twist propagation in 40 cm yarn length,
Number of twists inserted in 1 cm yarn per second = 4.375 twists / second
Average height of the spinning triangle = 0.5 cm
Twists inserted into the spinning triangle zone per second = 2.18 twists / second
This suggests the variation in the height of the spinning triangle could be caused by yarn
twisting. The height of the triangle was determined by the distance between the tip of the
spinning triangle and the roller nip line as already shown in Figure 3.17. During twisting,
one side of the fibrous strand was folded on the other side, which influenced the position
of the tip of the triangle as determined by the image processing algorithm. Once the twist
cycle was completed, the twisting point returned to its previous position generating a
continuous oscillatory pattern. This pattern was picked up by FT analysis of the spinning
triangle height signal and represented by a peak at around 2 Hz frequency. Both angles
of the spinning triangle showed some degree of oscillation in their magnitudes as shown
in Figure 3.21 (a) & Figure 3.22 (a). However, this variation was quite random due to the
presence of multiple frequency peaks, when viewed in respective frequency spectrums as
shown in Figure 3.21 (b) & Figure 3.22 (b).
As an example to quantify the dynamic geometry of the spinning triangle through the
combined method of clear rubber roller and image processing techniques, 7500 images
of the spinning triangle that were recorded in five videos using clear rubber roller were
processed through the proposed image processing algorithm. The analysis resulted in
7500 measurements of each individual geometrical parameter of the spinning triangle.
These observations were then averaged to represent the geometry of the spinning triangle
as shown in Figure 3.23. The shape and the averaged measurements of the spinning
triangle geometry shown in Figure 3.23 provide an estimate of actual and dynamic
geometry of the ring spinning triangle for the particular yarn type.

115
Figure 3.23: Simulated geometry of 20 tex ring spun yarns as observed through the clear
rubber roller and analysed dynamically through image processing methods
3.5. Conclusion
A new type of clear rubber roller has been produced using a clear polyurethane resin to
expose the spinning triangle to enable viewing and measurement of the triangle geometry.
A clear rubber roller was used as it allowed effective visualisation of the spinning triangle
zone without disturbing its real shape. The developed roller was firstly used to observe
the spinning triangle through it and then by testing its influence on spinning triangle and
yarn spinning process in terms of end breakages, yarn properties and physical
observation. The key results were.
The clear rubber roller provided a complete picture of the triangle for the yarns
measured by exposing its complete geometry starting from roller nip line to yarn
twisting point;
The images of the spinning triangle acquired from the clear rubber roller were
slightly fuzzy due to the composite structure of the roller and specific settings of
the camera. Despite the lower image quality the information of interest about the
spinning triangle geometry was able to be extracted;

116
The clear rubber roller did not negatively influences the fibre arrangement in
spinning triangle zone or classical shape of the spinning triangle as observed by
analysis of the images of the spinning triangle and estimated through studying the
number of end breakages due to the clear rubber roller;
The comparison of properties of yarns produced through the clear rubber roller
and original roller indicated no significant differences in terms of tenacity and
elongation but a slight deterioration was observed in evenness and hairiness due
to the clear rubber roller;
The spinning triangle was quantified in terms of its geometrical parameters
including width, height and angles on left and right side, which represented its
overall shape and geometry;
An image processing algorithm was proposed to process a bulk number of
spinning triangle imagery data. This algorithm determined the vertices of the
triangle and used these to carry out measurements of its geometrical parameters,
which were averaged out to estimate the actual geometry of the spinning triangle;
All of the geometrical parameters of the spinning triangle appeared to continually
vary under the influence of various process and material related variations. The
proposed image processing algorithm took this variation into account and
estimated a mean dynamic geometry of the spinning triangle;
The application of Fourier transform on the geometrical parameters of the
spinning triangle may be used as a tool to determine periodic variations caused by
spinning process at the spinning triangle zone.

117
4. Relationships between Spinning Triangle Geometry and
Yarn Quality
4.1. Introduction
The quest to improve yarn quality in order to produce aesthetically superior and durable
clothes has led to various developments in the ring spinning process especially in the last
two decades. If the recent developments in the ring spinning process are closely reviewed,
two different approaches can be observed that dominate the trends in yarn quality related
research. The first approach is based on studying the spinning triangle. The second is by
modifying the classical ring spinning process through the addition of new devices or the
redesign of existing components on the ring spinning frame.
A comprehensive understanding of the spinning triangle should eventually lead to the
formation of appropriate controls to improve yarn quality. The importance of the spinning
triangle in the ring spinning process is well known both in terms of productivity of the
spinning process and the quality of the yarns produced through it as discussed in section
2.4. The attempts to improve yarn quality through the spinning triangle had led
researchers to study tension distribution in the spinning triangle zone to modify fibre
arrangement inside it. Most of the studies focused on understanding the spinning triangle
are based on various theoretical models, as no standard method existed to observe it
directly. The proposed models of the spinning triangle provide some idea about its
geometry and stress incurred by individual fibres lying at various positions inside it.
However, they lack in explanation of the precise influence of the shape of spinning
triangle on yarn quality and possibilities to further improve it, which is the ultimate
objective of these studies.
Various physical developments in the ring spinning process have already been discussed
in section 2.6. Some of these modifications resulted in significant improvements in yarn
quality and received prompt industrial attention, while other proposed modifications did
not markedly enhance yarn quality and remained on experimental grounds. An interesting
similarity in almost all modifications made to the classical ring spinning process
irrespective of their commercial performance, is their relationship with the spinning

118
triangle. For example, Siro spinning results in a unique spinning triangle made from two
parallel strands of fibres [134, 138]. Solo spinning splits the spinning triangle in various
sub strands [147]. Compact spinning condenses the fibrous strand resulting in smaller
spinning triangle through either pneumatic suction or other mechanical means [218].
False twisting improves propagation of twist in the spinning triangle zone, rubbing of
fibres in the drafting zone shortens the width of the triangle, angled grooves in the bottom
roller direct fibre paths through spinning triangle zone and so on [101, 157-159, 165].
Surprisingly, this critical influence of most physical modifications made in classical ring
spinning over the spinning triangle is generally neglected. A common approach is to
modify the classical spinning process based on a theoretical hypothesis and the influence
of the modification is then explained in terms of yarn properties. The intermediate layer
of the spinning triangle is usually overlooked. It is very important to understand that the
spinning triangle acts as a fundamental control point that delivers the fibres to the yarn
twisting area. The angles and positions of the fibres at which they are delivered into a
yarn, essentially affect their arrangement in the yarn structure that directly control yarn
properties. The overall angles and positions of the fibres in the spinning triangle zone can
be regarded as the shape of the spinning triangle. Hence, an understanding of the influence
of spinning process modification on the shape of the spinning triangle is essential. More
importantly, before even proposing any modification in classical ring spinning process to
improve yarn quality, a clear understanding of the relationship between shape of the
spinning triangle and yarn properties is vital.
4.2. Principle and hypothesis
The underlying effect of modification of the ring spinning process to improve yarn quality
will usually have some degree of influence on the spinning triangle. The modifications in
ring spinning process that also influence spinning triangle, do not necessarily improve
overall yarn quality but they essentially cause some effect over it that can also be of a
negative nature. For example, various modifications at least partially improve yarn
quality, while some modifications even deteriorate some quality parameters like evenness
and tenacity. This argument can serve as a basis of an assumption that yarn properties are
in fact sensitive to the spinning triangle irrespective of the design and principle of the
proposed modification in ring spinning.

119
Further expanding on this assumption, the only possibility to vary the spinning triangle is
in terms of its geometry or shape. The reason is the degree of freedom for variations in
the spinning triangle is very limited. The base of the triangle is constrained in the nip of
the drafting rollers while its tip is under direct influence of the twisting forces. Under this
arrangement, any modification in the ring spinning process can only influence its physical
dimensions such as reducing its base width and height or skewing it to left or right
directions. A physical intervention of a higher magnitude in the fragile spinning triangle
zone may lead to excessive yarn end breakage. Therefore, it can be imagined that yarn
properties are sensitive to the spinning triangle particularly in terms of its shape and
geometry. This idea can lead to a simple hypothesis that yarn quality may be improved
by optimizing the geometry of the spinning triangle.
This hypothesis can be tested by producing a variety of yarns in a controlled yarn spinning
arrangement, where the geometry of the spinning triangle is carefully varied as well as
physically measured in real time. The quality of the yarns will be evaluated through
established yarn testing procedures. The relationships between the spinning triangle
geometry and resultant yarn properties can then be established by analysing the collected
data and investigating the linkages between different variables in both data sets. In order
to perform this experiment, two important issues need to be addressed first. One is
developing the appropriate mechanisms to control the spinning triangle geometry during
yarn spinning. A possibility to achieve this is to make use of those modifications that are
already developed for ring spinning process and known for their influence on physical
geometry of the spinning triangle. For example, horizontal offset spinning is known for
skewing the spinning triangle in left or right direction [150]. Similarly, compact spinning
is known for minimizing the spread or width of the spinning triangle [218]. Yarn twist
has established influence on the height of the spinning triangle [54, 219].
The second issue is to measure the spinning triangle geometry during a real time spinning
process. As discussed in chapter 3, a clear rubber roller can be applied in place of a top
drafting roller to reveal the spinning triangle zone without causing an invasive effect on
its shape. The application of the clear top roller does not require any significant changes
in the normal ring spinning process and continuous images (or videos) of the spinning
triangle can be recorded using an appropriate image acquisition setup. The collected
imagery data of the spinning triangle can then be processed through the associated image

120
processing method and geometry of the spinning triangle can be quantified for further
analysis.
4.3. Materials and methods
The aim of the experimentation detailed in this section was to explore the quantitative
relationships between the geometry of ring spinning triangle and resultant yarn properties.
To achieve this, the shape and the geometry of the spinning triangle were varied in a
controlled manner keeping all other variables consistent throughout the experiment, such
as yarn spinning and testing equipment, material and process variables and environmental
conditions. The variations in the spinning triangle geometry were induced through the
ring spinning process in a systematic manner, following a full factorial design of
experiment based on different spinning process variables and their associated levels. The
geometry of the spinning triangle was measured and quantified through a clear rubber
roller and associated image processing technique as detailed in chapter 2.
4.3.1. Design of experiment
Three process variables were nominated for inducing controlled variations in the spinning
triangle geometry, namely yarn twist, diagonal horizontal offsetting and fibre compacting
according to a full factorial design of experiment as shown in Table 4.1. Diagonal
offsetting was varied in three levels i.e. left offset (LO), right offset (RO) and no offset
(NO) to influence the skewness or angles of the spinning triangle. Fibre compacting was
also varied in three levels i.e. high pressure compacting (HC), low pressure compacting
(LC) and no compacting (NC) to affect the width of the spinning triangle. Yarn twist was
varied in two levels i.e. weaving twist (WT) and knitting twist (KT) to control the height
of the spinning triangle. Weaving and knitting twists referred to higher and lower twist
levels in the yarn. The twist was selected in accordance with the twist factor selected for
yarn spinning.
The design of experiment comprised of eighteen experimental runs in randomized order.
The full factorial experimental matrix did not only provide a roadmap to conduct the
experiments systematically by proposing random combinations of different levels of the
selected factors but also facilitated the statistical analysis of the collected experimental

121
data. Full factorial experimental design reduces the chances of experimental error,
suitable for analysing the effect of single variables (and interactions between multiple
variables) and provides maximum information on the relationships between input factors
and the response variables.
Table 4.1: Full factorial design of experiment to study relationships between spinning
triangle geometry, yarn structure and yarn properties
S.no Yarn twist Compact spinning Horizontal offsetting
1 KT HC NO
2 WT HC LO
3 WT LC LO
4 WT NC RO
5 KT HC LO
6 WT LC RO
7 KT LC RO
8 KT HC RO
9 WT HC RO
10 WT LC NO
11 WT NC LO
12 KT NC NO
13 KT LC LO
14 KT LC NO
15 KT NC RO
16 KT NC LO
17 WT NC NO
18 WT HC NO
4.3.2. Yarn spinning
The proposed experimental design was executed for producing 12 tex yarns with
controlled variations in the spinning triangle geometry. The yarns were produced from
100% Australian cotton (upper half mean length 31.5 mm, 4.5 Micronaire) on an
industrial scale Zinser 350 ring frame (Saurer, Switzerland). The cotton sliver was drafted

122
three times over the draw frame and combed to remove the short fibres. The combed
sliver was used to produce cotton rovings with linear density and roving twist of 724 tex
and 42 TPM respectively. The drafting system on the ring frame was SKF 2025 (SKF,
Sweden) and a total draft of 62 was applied to the roving. The spinning speed was set at
10600 rpm. A ring of 45/42 mm (outside / inside) diameter and traveller no. 36 were used.
The temperature and relative humidity in the spinning shed were 25°C and 55%
respectively.
Yarns were produced with two different twist levels i.e. 1032 and 1108 TPM (Z
direction), which could be referred as knitting and weaving twists respectively. The yarn
twist range was narrow as per the access and the availability of the ring spinning frame.
In order to compact the fibres during yarn spinning, Sussen Elite® CompactSet (Sussen,
Germany) attachment was mounted on the ring frame. The compact spinning attachment
was fitted with an adjustable air suction mechanism and negative air pressure was tuned
by varying fan setting to achieve low compacting (LC) and high compacting (HC) of
fibres. No compact yarns (NC) were produced in classical ring spinning arrangement
without a compact spinning attachment. The left or right diagonal offsetting arrangement
was achieved by threading and spinning the yarns through left or right adjacent spindles
respectively to vary the angles of the spinning triangle.
4.3.3. Spinning triangle imaging
The spinning triangle was observed through two clear rubber rollers while producing
various yarn specimens according to the proposed experimental matrix. The development
of the clear rubber roller for regular ring spinning has already been discussed in Chapter
2. Another clear rubber roller that imitated the top roller of compact spinning system was
developed to study the spinning triangle during trials that involved compacting of fibrous
strand. The clear roller for compact spinning system was developed using the similar resin
casting procedure as previously explained in section 3.3.1.
Both regular and compact clear rubber rollers were mounted over the ring frame to image
the spinning triangle during each run of the experimental matrix as shown in Figure 4.1
& Figure 4.2 respectively. A Canon 550D DSLR camera with 100 mm macro lens was
mounted on top of the clear rollers for imaging the spinning triangle geometry during

123
yarn spinning. The ISO (light sensitivity of the camera), shutter speed and F-stop number
(lens focal length to aperture ratio) at the camera were set at 800, 1/60 and 2.8
respectively. Imaging was conducted at 640 x 480 resolution. Five videos of thirty
seconds each were recorded at fifty frames per second imaging speed for each
experimental run, totalling in almost 7500 continuous images of the spinning triangle for
each experimental run.
Figure 4.1: Clear rubber roller applied for imaging the spinning triangle of yarns produced
in normal spinning arrangement
Figure 4.2: Clear rubber roller applied for imaging the spinning triangle of yarns produced
in compact spinning arrangement

124
4.3.4. Yarn testing
The yarn specimens produced in accordance with the experimental matrix were subjected
to yarn testing to evaluate four important yarn quality parameters i.e. yarn hairiness,
tensile strength, elongation and evenness. Uster evenness tester with OH module
(hairiness), Uster Zweigle hairiness tester and Uster Tensorapid were used for yarn
quality testing as discussed previously in section 3.3.3. The specifications of yarn testing
procedures in terms of number of samples, sample length and testing parameters are given
in Table 4.2. All yarn samples were conditioned for at least 24 hours before testing in
standard lab conditions (i.e. 20 ± 1 °C temperature and 65 ± 2 % relative humidity).
Table 4.2: Yarn testing specifications
Equipment Model Sub
samples
Within
samples
Pre
tension
(cN/tex)
Test
speed
(m/min)
Test
time
(min)
Yarn
length
(m)
Uster tester UT4 1 5 - 400 5 2000
Uster
Zweigle
hairiness
tester
HL400 1 5 - 400 5 2000
Uster
Tensorapid
Uster
Tensorapid
4
1 50 6 5 - 25 (50
× 0.5)
4.4. Results
Eighteen different yarn specimen varying in terms of fibre compacting level, diagonal
offset direction and twist were produced and subjected to testing for evaluating their
quality parameters. The yarns have been referred to in a standard format while plotting
their quality parameters in graphs or citing them in the discussion. The standard format
used follows the form (yarn twist- compacting level- diagonal offset). For example, the
first experimental run as shown in the experimental matrix in Table 4.1 was abbreviated

125
as KT-HC-NO, which referred to a particular yarn produced with knitting twist (KT),
high compacting pressure (HC) and no horizontal offset (NO).
4.4.1. Yarn properties
The results of strength, elongation, evenness and hairiness (both Zweigle S3 and Uster H
index) for all yarn specimen are plotted in Figure 4.3 - Figure 4.7. The plotted data of
yarn properties show a good contrast as different quality parameters vary from poor to
good quality. For example, yarn strength ranged from 12.9 cN/tex to 16.6 cN/tex while
S3 value of yarn hairiness ranged from 61 to 443. The superior quality yarns have been
indicated with green bars for each particular quality parameter, while the poor quality
yarns have been shown with red bars.
It is also interesting to note that not a single yarn specimen out of the experimental matrix
possessed overall best quality. For example, WT-NC-NO showed the highest uniformity
but its strength was not the highest among the group. Similarly, WT-HC-LO showed the
highest yarn strength and elongation while KT-HC-LO exhibited the least hairiness in
terms of S3 value. However the same yarn, which possessed the least S3 value of yarn
hairiness as measured on Zweigle hairiness tester, did not exhibit the minimum hairiness
in terms of H index when tested over Uster tester (with hairiness testing module). This
probably points towards the established discrepancy between both hairiness equipment
due to the different principles of measurement [220].

126
Figure 4.3: Measurements of tenacity (cN/tex) of 12 tex cotton yarns
Figure 4.4: Measurements of elongation (percentage) of 12 tex cotton yarns
0 2 4 6 8 10 12 14 16 18
KT-HC-NO
WT-HC-LO
WT-LC-LO
WT-NC-RO
KT-HC-LO
WT-LC-RO
KT-LC-RO
KT-HC-RO
WT-HC-RO
WT-LC-NO
WT-NC-LO
KT-NC-NO
KT-LC-LO
KT-LC-NO
KT-NC-RO
KT-NC-LO
WT-NC-NO
WT-HC-NO
Yarn tenacity (cN/tex)
Yar
n s
amp
le I
D
0 1 2 3 4 5 6 7
KT-HC-NO
WT-HC-LO
WT-LC-LO
WT-NC-RO
KT-HC-LO
WT-LC-RO
KT-LC-RO
KT-HC-RO
WT-HC-RO
WT-LC-NO
WT-NC-LO
KT-NC-NO
KT-LC-LO
KT-LC-NO
KT-NC-RO
KT-NC-LO
WT-NC-NO
WT-HC-NO
Yarn elongation (%)
Yar
n s
amp
le I
D

127
Figure 4.5: Measurements of yarn hairiness of 12 tex cotton yarns in terms of Zweigle S3
value
Figure 4.6: Measurements of yarn hairiness of 12 tex cotton yarns in terms of Uster
hairiness (H) index
0 100 200 300 400 500
KT-HC-NO
WT-HC-LO
WT-LC-LO
WT-NC-RO
KT-HC-LO
WT-LC-RO
KT-LC-RO
KT-HC-RO
WT-HC-RO
WT-LC-NO
WT-NC-LO
KT-NC-NO
KT-LC-LO
KT-LC-NO
KT-NC-RO
KT-NC-LO
WT-NC-NO
WT-HC-NO
Yarn hairiness (S3 value)
Yar
n s
amp
le I
D
0 0.5 1 1.5 2 2.5 3 3.5 4 4.5
KT-HC-NO
WT-HC-LO
WT-LC-LO
WT-NC-RO
KT-HC-LO
WT-LC-RO
KT-LC-RO
KT-HC-RO
WT-HC-RO
WT-LC-NO
WT-NC-LO
KT-NC-NO
KT-LC-LO
KT-LC-NO
KT-NC-RO
KT-NC-LO
WT-NC-NO
WT-HC-NO
Yarn hairiness (H index)
Yar
n s
amp
le I
D

128
Figure 4.7: Measurements of yarn evenness in CVm % of 12 tex cotton yarns
Each one of the variables above was selected because of its effect on the geometry of the
spinning triangle. Offsetting skewed the shape [150, 152, 153] compacting narrowed the
width [94, 119, 218, 221] and twist variation altered the height of the triangle [54, 219].
The spinning triangle geometry was varied by these spinning process variables keeping
other material and process related variables consistent. The broad range of variations in
the properties of yarn produced by controlled manipulation of the spinning triangle
indicated a high influence of the spinning triangle geometry on resultant yarn properties.
An overview of the yarn quality data established the fact that yarn quality had a strong
linkage with the spinning triangle geometry, which also supported the classical thought
that the ‘spinning triangle is perhaps the most critical area in ring yarn spinning’ [135,
222]. To explore the nature and the degree of these relationships between the spinning
triangle geometry and the resultant yarn quality, the data acquired for the spinning
triangles of these yarns is presented in the following section.
4.4.2. Spinning triangle geometry
0 5 10 15 20
KT-HC-NO
WT-HC-LO
WT-LC-LO
WT-NC-RO
KT-HC-LO
WT-LC-RO
KT-LC-RO
KT-HC-RO
WT-HC-RO
WT-LC-NO
WT-NC-LO
KT-NC-NO
KT-LC-LO
KT-LC-NO
KT-NC-RO
KT-NC-LO
WT-NC-NO
WT-HC-NO
Yarn evenness ( CVm %)
Yar
n s
amp
le I
D

129
The typical images of the spinning triangle as acquired through the imaging setup (as
detailed in section 4.3.3) in classical ring spinning are shown in Figure 4.8 (a) & (c) while
spinning triangle images under compact spinning arrangements are shown in Figure 4.8
(b) & (d) respectively. The spinning triangle formed in the classical ring spinning
arrangement was clearly bigger in dimensions than the compact spinning triangle, where
the fibres were condensed through air suction before twist insertion. However, the claim
of eliminating the spinning triangle through compact spinning (by compact spinning
system manufacturers) is not true as a thicker strand of fibres can be seen transforming
into a finer yarn in Figure 4.8 (b) & (d) [218]. In fact, in a spinning system where a
continuous feed of fibres is drafted through a pressurized pair of rollers, the spinning
triangle can never be eliminated as a two dimensional sheet of fibres being twisted into a
three dimensional yarn must show some degree of fibre convergence. However, its
dimensions may be minimized by condensing the fibres through air suction or other
mechanical means.
Figure 4.8: Spinning triangle image acquired through a) clear rubber roller in classical
spinning arrangement b) clear compact roller in compact spinning arrangement c)
magnified image of the classical ring spinning triangle d) magnified image of the compact
spinning triangle

130
The videos of the spinning triangle of all eighteen yarn specimen were processed through
the proposed image analysis method (as described in section 3.4.3.2) to quantify their
geometrical parameters. Four parameters of the spinning triangle geometry namely width,
height, left angle and right angle were measured and the results were averaged out from
bulk of imagery data. High sample size in terms of spinning triangle images facilitated
the analysis of dynamic nature of the spinning triangle along with justifying the statistical
requirements of studying the rapidly varying spinning triangle. The averaged values of
the measured parameters of the spinning triangle geometry are plotted in Figure 4.9-
Figure 4.12.
Figure 4.9: Width of the spinning triangles of 12 tex cotton yarns
0.0 0.5 1.0 1.5 2.0 2.5 3.0 3.5 4.0
KT-HC-NO
WT-HC-LO
WT-LC-LO
WT-NC-RO
KT-HC-LO
WT-LC-RO
KT-LC-RO
KT-HC-RO
WT-HC-RO
WT-LC-NO
WT-NC-LO
KT-NC-NO
KT-LC-LO
KT-LC-NO
KT-NC-RO
KT-NC-LO
WT-NC-NO
WT-HC-NO
Spinning triangle width (mm)
Yar
n s
amp
le I
D

131
Figure 4.10: Height of the spinning triangles of 12 tex cotton yarns
Figure 4.11: Left angle of the spinning triangles of 12 tex cotton yarns
0.0 0.5 1.0 1.5 2.0 2.5 3.0 3.5 4.0 4.5 5.0
KT-HC-NO
WT-HC-LO
WT-LC-LO
WT-NC-RO
KT-HC-LO
WT-LC-RO
KT-LC-RO
KT-HC-RO
WT-HC-RO
WT-LC-NO
WT-NC-LO
KT-NC-NO
KT-LC-LO
KT-LC-NO
KT-NC-RO
KT-NC-LO
WT-NC-NO
WT-HC-NO
Spinning triangle height (mm)
Yar
n s
amp
le I
D
0 10 20 30 40 50 60 70 80 90 100
KT-HC-NO
WT-HC-LO
WT-LC-LO
WT-NC-RO
KT-HC-LO
WT-LC-RO
KT-LC-RO
KT-HC-RO
WT-HC-RO
WT-LC-NO
WT-NC-LO
KT-NC-NO
KT-LC-LO
KT-LC-NO
KT-NC-RO
KT-NC-LO
WT-NC-NO
WT-HC-NO
Left angle (degrees)
Yar
n s
amp
le I
D

132
Figure 4.12: Right angle of the spinning triangles of 12 tex cotton yarns
An overview of the spinning triangle geometrical data suggests that the width and height
of the spinning triangles of the yarns produced with the classical ring spinning
arrangement were significantly higher than the yarns produced through the compact
spinning system. However, the angles of the spinning triangle were more sensitive to yarn
offset direction compared to fibre compacting level. In order to provide a visual
comparison of the variations in the spinning triangle geometry, the quantified geometrical
data were used to simulate spinning triangles as shown in Figure 4.13.
It can be seen through the comparative view of the triangle geometries that horizontal
offsetting dragged the spinning triangle towards the left or right direction and created a
skewed and asymmetrical triangle. The fibre compacting condensed the overall geometry
of the triangle by reducing its width and height. Similarly, a triangle that was compacted
and skewed simultaneously showed a unique ‘skewed compact’ shape. The classical
spinning triangle (without any offset) showed a symmetrical shape as the yarn twisting
point lay almost in the centre of the triangle as opposed to asymmetrical triangles where
the twisting point lay in extreme left or right direction.
0 10 20 30 40 50 60 70 80 90 100
KT-HC-NO
WT-HC-LO
WT-LC-LO
WT-NC-RO
KT-HC-LO
WT-LC-RO
KT-LC-RO
KT-HC-RO
WT-HC-RO
WT-LC-NO
WT-NC-LO
KT-NC-NO
KT-LC-LO
KT-LC-NO
KT-NC-RO
KT-NC-LO
WT-NC-NO
WT-HC-NO
Right angle (degrees)
Yar
n s
amp
le I
D
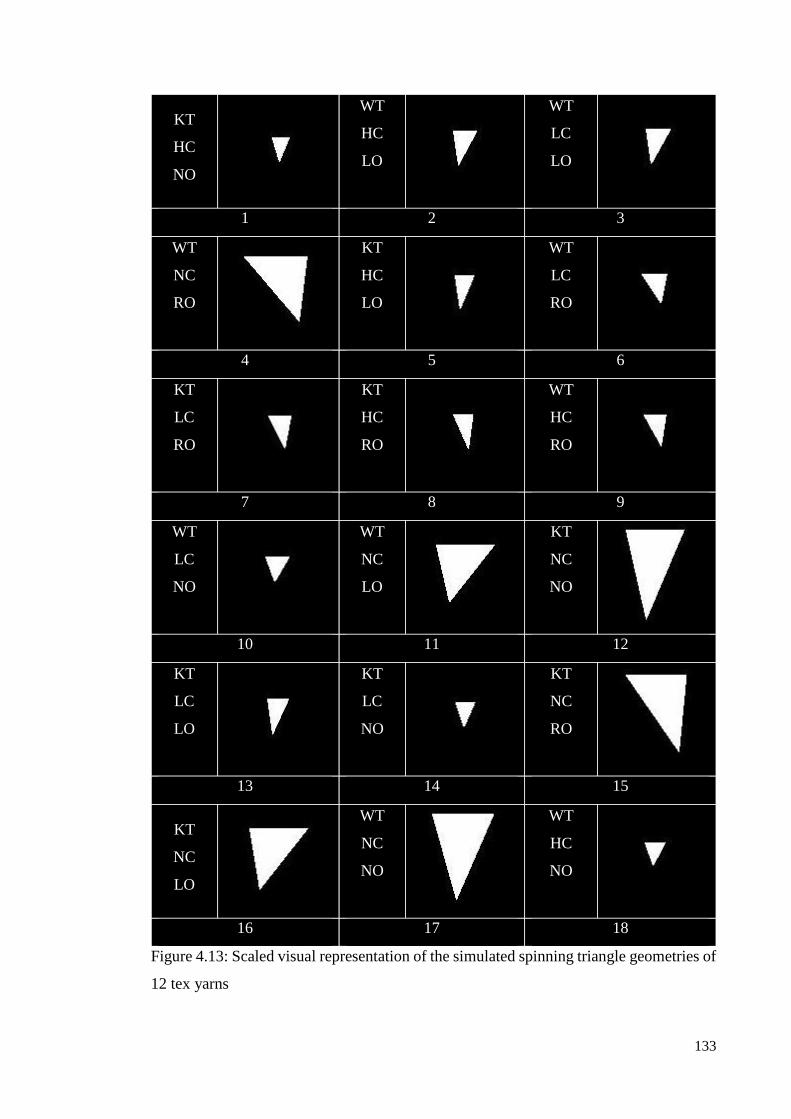
133
KT
HC
NO
WT
HC
LO
WT
LC
LO
1 2 3
WT
NC
RO
KT
HC
LO
WT
LC
RO
4 5 6
KT
LC
RO
KT
HC
RO
WT
HC
RO
7 8 9
WT
LC
NO
WT
NC
LO
KT
NC
NO
10 11 12
KT
LC
LO
KT
LC
NO
KT
NC
RO
13 14 15
KT
NC
LO
WT
NC
NO
WT
HC
NO
16 17 18
Figure 4.13: Scaled visual representation of the simulated spinning triangle geometries of
12 tex yarns

134
Similar to the variations in yarn properties, geometrical parameters of the spinning
triangle also exhibited variations under influence of controlled changes in yarn spinning
process. For example, the width of the spinning triangle ranged between 0.84 mm to 3.14
mm while left angle ranged between 49.37° to 81.98°. The extent of variation in the
spinning triangle geometry indicated that the selected process variables i.e. offsetting,
compacting and twisting had significantly influenced the spinning triangle geometry as
intended. The quantified geometry of the triangle provided an opportunity to relate it with
resultant yarn properties to reveal any relationships between them. A correlation analysis
between both sets of data (i.e. yarn quality parameters and dimensions of the triangle)
enabled understanding the nature and strength of the relationships between them.
4.5. Discussion
The relationships between the geometrical parameters of the spinning triangle and yarn
quality can be drawn by looking at three different aspects of acquired data. Initially, the
range of variations in a particular yarn quality parameter would be analysed to evaluate
if the changes in the spinning triangle geometry influenced that particular quality
parameters in some way. If the range of these variations is broad and significant, the
influence of the spinning triangle geometry on that yarn quality parameter may be
established. The next step would be to correlate the averaged values of the geometrical
parameters of the spinning triangle and yarn quality parameters and visualizing these data
in the form of scatter plots. The nature of relationship (i.e. direct, indirect, strong or weak
relation) may be noticed by visually analysing the presence of any trends in scatter plots.
The nature and strength of these relationships could be established by analysing the
respective R2 values.
However, if no clear trends would be observed in the scatter plots despite of significant
variation in a particular yarn quality parameter, the next possibility would be to look at
dynamic data of the spinning triangle geometry. Although, averaged values of the
spinning triangle geometrical parameters come from a large sample size but they do not
represent the dynamic variations in the spinning triangle geometry (i.e. over time). Hence,
Fourier transformation can be applied on the continuous signals of different geometrical
parameters of the spinning triangle to analyse dynamic variations in them as previously
discussed in section 3.4.4. The analysis of frequency and amplitude of dynamic variations

135
in the geometrical parameters of the spinning triangle would establish if dynamic
variation in the spinning triangle geometry somehow influences yarn quality.
4.5.1. Effects of the spinning triangle geometry on yarn hairiness
4.5.1.1. Scatter plots
As already discussed in section 4.4, yarn hairiness showed a broad range of variation as
the geometry of the spinning triangle was modified by compacting, offsetting and yarn
twist variations. This establishes the role of the spinning triangle geometry on yarn
hairiness. To investigate this relationship between yarn hairiness and the geometry of the
spinning triangle a series of scatter plots were drawn. The yarn hairiness was measured
using both the Zweigle hairiness tester and Uster tester, which resulted in S3 value and H
index respectively. Scatter plots between yarn hairiness S3 value and geometrical
parameters of the spinning triangle are shown in Figure 4.14, while the scatters plots of
yarn hairiness H index and geometrical parameters of the spinning triangle are given in
Figure 4.15.

136
Figure 4.14: Scatter plots of Zweigle S3 values of yarn hairiness versus a) spinning
triangle width b) spinning triangle height c) spinning triangle left angle and d) spinning
triangle right angle

137
Figure 4.15: Scatter plots of Uster H yarn hairiness versus a) spinning triangle width b)
spinning triangle height c) spinning triangle left angle and d) spinning triangle right angle
The scatter plots of Zweigle S3 value show clear linear trends with both the width and the
height of the spinning triangle. An increase in the width and the height of the spinning
triangle resulted in higher S3 values of yarn hairiness. The R2 value of these relationships
(width: 0.844 and height: 0.75) and presence of clear visual trends in scatter plots would
suggest that there is a strong relationship between these two geometrical parameters of
the spinning triangle and yarn hairiness. Similar observations were noticed in the scatter
plots of the width and the height of the spinning triangle versus yarn hairiness in terms of
Uster H index. It is important to note that the height and the width of the spinning triangle
were actually covariates in this case, as compact spinning condenses the width and
decreases the height of the spinning triangle simultaneously. It was practically impossible
to condense the width of the triangle only without affecting its height through air suction
based fibre compacting mechanism. The left and the right angles of the spinning triangle
did not show any noticeable trends with S3 value of yarn hairiness as well as with Uster

138
H index. This is further backed up by low R2 values for relationships between yarn
hairiness and angles of the spinning triangle.
One important feature of the scatter plots between both S3 value and H index versus width
and height of the spinning triangle was the gap between the two clusters of the data points.
The data points of the width of the spinning triangle are clustered around 1 mm and 3
mm. Similarly, the data points of the height of the spinning triangle are clustered around
1.5 mm and 3.5 mm. There were no data points between these two extreme values and
there exists a possibility that the nature of the relationship between variables could
dramatically differ at unknown intermediate values (i.e. a curvature may be present). The
absence of the intermediate data points is due to the inability to observe the spinning
triangle geometry at a 2 mm width.
It is important to note that the geometry of the spinning triangle could not be precisely
controlled as a physical setting on the ring spinning frame such as spindle speed or yarn
twist. The geometry of the spinning triangle could only be influenced indirectly by other
process parameters such as fibre compacting level, offset direction and twist level.
Although multiple levels of fibre compacting were selected (i.e. low pressure compacting
and high pressure compacting) to achieve appropriate variations in the spinning triangle
width but the width of the triangle achieved at low and high pressure compacting was not
substantially different. In addition, the linear nature of the relationship between width of
the spinning triangle and the yarn hairiness has also been established in previous studies
[94, 119, 177, 220, 221]. Hence, on basis of this explanation and available data, a linear
relationship between yarn hairiness and spinning triangle width must be considered with
some care.
Linear regression, as applied above, should only be conducted on a dataset with a normal
distribution. It can be clearly seen from the results given in Figure 4.14 and Figure 4.15
that the values of the spinning triangle width and height were not normally distributed.
For this reason, the R2 values obtained are probably significantly higher than what would
be achieved in reality if the dataset followed normal distribution. Further work is required
to obtain data distributed in the 2 mm width range of the spinning triangle to complete
the dataset. However, time within this present work would not allow this to take place.
One of the less effective means of compact spinning (i.e. mechanical fibre condensing)

139
could be employed to achieve missing values of the spinning triangle width. The deviation
of spinning triangle geometrical data from a normal distribution should be considered
when evaluating the remainder of the analysis given within this chapter. Even considering
the reduced R2 value of the relationship between the spinning triangle width and yarn
hairiness, there is still some relationship between these two parameters.
4.5.2. Effects of the spinning triangle geometry on yarn tenacity
4.5.2.1. Scatter plots
The scatter plots between yarn tenacity and various parameters of the spinning triangle
geometry are given in Figure 4.16. Comparing the effect of all four parameters of the
spinning triangle geometry on yarn tenacity, no clear relationship of any parameter of the
spinning triangle geometry was noticed with yarn tenacity. The yarns that were produced
with shorter spinning triangles (i.e. through compact spinning) exhibited both high and
low values of tensile strength. Similarly, skewing the geometry of the spinning triangle
in both left and right directions through horizontal offset method did not show any clear
relationships with yarn tenacity. The left offset and right offset yarns showed both high
and low values of the yarn strength. The lack of any clear patterns and weak trends
between the variables suggest that the variations in yarn tenacity could not be explained
by the variations in the spinning triangle geometry as measured using the method
developed.

140
Figure 4.16: Scatter plots of yarn tenacity versus a) spinning triangle width b) spinning
triangle height c) spinning triangle left angle and d) spinning triangle right angle
The lack of statistical evidence of direct influence of the spinning triangle geometry over
yarn tenacity is quite unexpected due to two reasons. Firstly, the reduction in yarn
hairiness by manipulating the shape of the spinning triangle did not improve the strength
of the less hairy yarns. Logically less hairy yarns should also exhibit higher strength as
more fibres are integrated in main yarn body rather than protruding out of the yarn
surface. These additional fibres would contribute towards yarn structure and would allow
it to withstand higher tensile stress compared to a severely hairy yarn. Secondly, the
variations in the spinning triangle geometry resulted in a reasonably broad range of yarn
tenacity as shown in Figure 4.3, but the variations in spinning triangle geometry do not
explain why some yarns are weaker (12.9 cN/tex) than others (16.6 cN/tex).
4.5.2.2. Fourier transformation

141
It can be deduced that some other ‘phenomenon’, which is actually responsible for
controlling yarn strength is not reflected in terms of geometrical parameters of the
spinning triangle. Instead, it acted as a hidden layer between spinning triangle and yarn
properties. For example, fibre arrangement within a yarn and associated fibre migration
are important factors that provides essential inter-fibre cohesion to fragile yarn structure
and impart strength in it. The shape of the spinning triangle controls the tension
distribution among fibres as previously discussed in section 2.4.1. The variations in the
shape or geometry of the spinning triangle may have influenced the underlying fibre
arrangement within yarns, which may have caused a variation in their strength.
As the shape of the spinning triangle is not consistent during yarn spinning and
continually fluctuates due to material and process related variations, it would be useful to
analyse the dynamic geometry of the spinning triangle to investigate the variations in yarn
strength. For this purpose, the dynamic data of the geometrical parameters of the spinning
triangle for WT-HC-LO and KT-LC-NO yarns, which showed the maximum and
minimum values of yarn strength, were analysed using Fourier transform method. The
comparison of width, height, left and right angles of both yarns in terms of frequency and
amplitude of highest peak present in the signal are given in a series of graphs from Figure
4.17 - Figure 4.20.

142
Figure 4.17: Fourier transformation of 30 seconds signal of spinning triangle widths of a)
WT-HC-LO yarn b) KT-LC-NO yarn

143
Figure 4.18: Fourier transformation of 30 seconds signal of spinning triangle heights of
a) WT-HC-LO yarn b) KT-LC-NO yarn

144
Figure 4.19: Fourier transformation of 30 seconds signal of spinning triangle left angles
of a) WT-HC-LO yarn b) KT-LC-NO yarn

145
Figure 4.20: Fourier transformation of 30 seconds signal of spinning triangle right angles
of a) WT-HC-LO yarn b) KT-LC-NO yarn
The comparison of the physical shapes of the spinning triangles of WT-HC-LO and KT-
LC-NO yarns (as shown in Figure 4.13) in terms of their geometrical parameters as well
as the frequencies of variations in them suggested differences between both spinning
triangles. These differences were essentially caused by the variations induced in the yarn
spinning process such as compacting, offsetting and twist variation. A shift in the peak
amplitude in FT data was noticed particularly for the height (where peak amplitudes of
stronger yarn and weaker yarns were 0.086 and 0.175 respectively) and angles of spinning
triangle (where peak amplitudes of stronger and weaker yarns were 1.063 and 1.7
respectively). Similarly, the variation in peak frequencies was also noticed in height and
angles of the spinning triangle. These differences in the spinning triangle geometries and

146
frequencies of variation in them could be the basis for differences in fibre delivery, fibre
arrangement and structure in both yarns that eventually affected yarn strength. There is a
similar suggestion in literature, where a change in fibre configuration at the spinning
triangle zone affected fibre arrangement within the yarn, which influenced the properties
of resultant yarns [223]. However, this idea needs to be further confirmed by studying the
structure and arrangement of fibres within both yarns and comparing them together to
reveal the link between spinning triangle geometry and yarn strength.
4.5.3. Effects of the spinning triangle geometry on yarn elongation
4.5.3.1. Scatter plots
The range of the variations in yarn elongation was not very broad (i.e. 4.99% to 6.49%)
unlike yarn hairiness and yarn tenacity, which suggested a lack of relationship between
yarn elongation and the geometry of the spinning triangle. The scatter plots of various
parameters of the spinning triangle geometry and yarn elongation are given in Figure 4.21
to observe presence of any data trends or relationships. The spread of the data points for
yarn elongation when plotted against the geometrical parameters of the spinning triangle
was quite random and did not follow any particular pattern. Similar to yarn tenacity, the
scatter plots showed very low R2 values for the geometrical parameters of the spinning
triangle and yarn elongation. The R2 values for the width, height, left and right angles of
the spinning triangle were 0.037, 0.006, 0.002 and 0.121 respectively. The low R2 values
and absence of any visual data trends suggested the lack of any clear relationship between
the spinning triangle geometry and yarn elongation.

147
Figure 4.21: Scatter plots of yarn elongation versus a) spinning triangle width b) spinning
triangle height c) spinning triangle left angle and d) spinning triangle right angle
4.5.4. Effects of the spinning triangle geometry on yarn evenness
4.5.4.1. Scatter plots
The range of variation in yarn evenness due to changes in the spinning triangle geometry
is 15.96 % -19.52 %, which represented a significant and broad variation. However, the
scatter plots of the spinning triangle geometrical parameters and yarn evenness as shown
in Figure 4.22, suggest that the maximum value data point of yarn evenness (i.e. 19.52
%) was actually an outlier in the data set. The higher value of yarn evenness refers to the
poor yarn regularity and high mass variations that could be caused by an unknown
variation in the roving or spinning process (such as variations caused in a roving by an
eccentric roller). If the data point is considered as an outlier and ignored, the range of
yarn evenness would be 15.96 – 17.7%, which represents a limited range of variation.
This suggests that yarn evenness was independent of the spinning triangle geometry. The

148
scatter plots of yarn evenness and the geometrical parameters of the spinning triangle also
suggest lack of any relationships between both of these parameters as respective R2 values
are quite low and data does not show any clear trends.
Figure 4.22: Scatter plots of Uster evenness versus a) spinning triangle width b) spinning
triangle height c) spinning triangle left angle and d) spinning triangle right angle
4.5.5. Agreement with existing literature
The statistical analysis to establish relationships between the spinning triangle geometry
and yarn properties suggests that the most sensitive yarn quality parameter with respect
to the spinning triangle geometry is yarn hairiness. Although, yarn tenacity shows a
considerable amount of variation by modifying the spinning triangle geometry there is
not enough statistical evidence of linear relationships between them. Yarn elongation and
yarn evenness are least influenced by the carefully induced variations in the spinning
triangle respectively. These findings agree with outcomes of some previous studies,
149
which focused on improving the yarn spinning process rather than understanding the
effect of the spinning triangle geometry on yarn properties.
For example, Aslam et al. [158] applied a rubbing assembly on a ring frame to rub the
fibres together for improve their intermingling with each other that could lead to better
quality yarns. However, they noticed significant improvement only in yarn hairiness
while other parameters were neither improved at all nor even deteriorated. It is important
to note that rubbing the fibrous strand in the drafting zone essentially reduces its width
(i.e. the similar effect achieved through compact spinning) [224]. The condensed fibrous
strand resulted in a smaller width of the spinning triangle providing better control on the
fibres and reducing yarn hairiness. The results presented above also suggest that
variations in the spinning triangle geometry led to the most significant improvements in
yarn hairiness that agrees with the described study.
Wu et al. [153] had produced yarns with various diagonal yarn path offsets in an attempt
to improve yarn properties. The diagonal offsetting used was direct manipulation of the
spinning triangle geometry as it mainly affects its angles by skewing it in left or right
direction. However, the only yarn property that had improved was yarn hairiness without
any significant influence on yarn tensile properties and evenness. These findings are quite
consistent with the findings reported by Wang and Chang [150] who actually initiated the
idea of diagonal offset spinning. They had found that “right diagonal yarn path led to
reduced yarn hairiness, while yarn evenness and tenacity were not as sensitive to the
modified yarn path”. The only improvement in yarn quality achieved was yarn hairiness
indicating that it may be the only quality parameter that is sensitive to the spinning
triangle shape.
In a well-known study by Basal and Oxenham, [94] they compared the blended (poly /
cotton) and 100% cotton yarns produced on a compact spinning system with classical ring
yarns at different twist levels. They have reported that yarn hairiness was the only
parameter that had consistent improvement for all twist levels under influence of fibre
compacting. Yarn tenacity had shown mixed trends, as it was higher for compact yarns
compared to ring yarns produced at low twist levels but this difference diminished as the
twist level increased. Yarn elongation and evenness were not significantly influenced by

150
compact spinning. It agrees well with the findings presented in this chapter about
significant influence of spinning triangle geometry on yarn hairiness.
4.6. Conclusion
The geometry of the yarn spinning triangle plays a key role in deciding the yarn quality.
Various modifications made in the classical ring spinning process that improved or
degraded yarn quality also influenced spinning triangle directly or indirectly. However,
the exact relationships between spinning triangle and yarn properties are unknown due to
unavailability of an appropriate method that can be applied to study the spinning triangle
in real time yarn spinning process. If these relationships are established, the spinning
triangle geometry can be optimized by formulating simple controls in ring spinning
process to produce superior quality yarns.
The newly developed method to study the ring spinning triangle using a clear rubber roller
and image processing techniques was applied on a variety of yarns, which were produced
according to a statistical design of experiment. The variation in the spinning triangle
geometry was achieved by controlled manipulation of developed modifications for the
ring spinning process. Different methods and factors such as horizontal offsetting, fibre
compacting and yarn twisting were selected to influence the geometry of the spinning
triangle. The properties of the yarns were tested for strength, elongation, evenness and
hairiness. Statistical analysis was conducted on the acquired spinning triangle data and
correlated with the geometry of the spinning triangle. The key outcomes of the analysis
are given as follows:
Yarn properties particularly yarn hairiness and yarn tenacity were found sensitive
to the spinning triangle geometry as they exhibited a good range of variation from
low quality to high quality yarns merely by physical variation in the shape of the
spinning triangle;
The yarn quality parameter that was highly influenced by the geometry of the
spinning triangle was yarn hairiness as it ranged from 66 to 443 S3 value and
showed a possibility of a strong statistical correlation with the width of the
spinning triangle (i.e. R2 value 0.916). Similar trend was noticed for Uster H index

151
(R2 value 0.844). However, further experimentation is required to achieve the
spinning triangle width at missing data points and establish this relationship;
The physical parameter of the spinning triangle geometry that greatly influenced
S3 and H index values of the yarn hairiness was the width of the spinning triangle
as observed through scatter plots of the data;
Yarn tenacity was also found sensitive to the spinning triangle geometry in some
way as it showed a good range of variation from 12.9 cN/tex to 16.6 cN/tex.
Surprisingly, yarn tenacity did not show a clear statistical correlation with any
geometrical parameters of the spinning triangle as observed in scatter plots and
associated R2 values. However, the analysis of variations in the spinning triangle
geometry over time through Fourier transformation technique showed differences
in terms of frequency and amplitude of geometrical parameters for a strong and a
weak yarn;
The variation in yarn tenacity might be explained based on the fibre arrangement
in yarn structure instead of geometry of the spinning triangle geometry. The
variations in the shape of the spinning triangle influenced the way in which the
fibres were arranged within the yarn. These variations in fibre arrangement could
possibly affect the extent of fibre migration that could result in improvement or
degradation in yarn strength. However, it needs to be further explored by studying
the structure of the weakest and strongest yarns;
Yarn elongation and evenness did not show a great range of variation by varying
the physical geometry of the spinning triangle compared to yarn hairiness and
tenacity. In addition, both of these parameters did not show any clear relationships
with the geometrical parameters of the spinning triangle. This suggests that yarn
elongation and evenness are not sensitive to the geometry of the spinning triangle.

152
5. Investigation of Yarn Structure with Micro-computerized
Tomography and Digital Image Processing
5.1. Introduction
The controlled variations in the geometry or shape of the spinning triangle in terms of its
width, height and angles caused significant influence on the yarn quality parameters, as
previously discussed in Chapter 4. This draws two important conclusions. Firstly, the
spinning triangle truly acts as a critical control point of yarn quality. This was although
generally thought, but was not established by studying the effects of the controlled
variations in the spinning triangle geometry on the yarn quality. Secondly, within the
spinning triangle space, its physical geometry is an aspect of vital importance with respect
to resultant yarn quality. In fact, the geometry is probably the only variable of the spinning
triangle that can be changed without introducing significant changes or new devices in
the classical spinning process. A comprehensive understanding of the role of the spinning
triangle geometry on yarn quality can inspire simple modifications in classical ring
spinning process to improve yarn quality in the future.
The analysis of the relationships between physical geometry of the spinning triangle and
yarn quality parameters suggested that only the variations in yarn hairiness could be
explained by the changes in the geometry of the spinning triangle. Interestingly, yarn
tenacity did not show any significant relationships with the spinning triangle geometry.
However, the difference between the strongest (i.e. 16.6 cN/tex) and the weakest yarns
(i.e. 12.9 cN/tex) in the group of eighteen yarns was statistically significant (P-value =
0.001), as previously discussed in section 4.5.2. The origin of this significant difference
in yarn strength was certainly not material related variations as all yarns were produced
from the same cotton roving. The only other imaginable origin of variation in yarn
strength is internal yarn structure as the structure of any object plays a vital role in
determination of its physical characteristics. However, a comprehensive analysis
technique is required to study and compare any differences in the structures of both of
these yarns that lead to significant variation in their tenacities.

153
The history of attempts to study and understand yarn structure is spanned over several
decades. Initially, the yarn structure was thought to be consisting of fibres twisted in
perfectly helical arrangement around yarn centre forming an ideal cylindrical physique of
the yarn, but investigations carried out by tracer fibre technique and cross-sectional
microtomy rejected this idea (as detailed in section 1.5.1). The tracer fibre technique
exposed the occurrence of frequent radial disposition of fibres with respect to central yarn
axis, which was later termed as ‘fibre migration’. The cross-sectional analysis through
microtomic slicing revealed the variation in packing density of fibres as a function of yarn
radius [88]. The fibres were found densely packed around the yarn centre and loosely
scattered around yarn periphery. Since the introduction of both of these methods, they
have been frequently applied on a variety of yarns to establish relationships between yarn
structure and its quality (as discussed in section 1.5.2). However, these relationships are
still far from fully understood.
This lack of understanding on yarn structure and its further influence on yarn quality can
be attributed to several limitations associated with both existing methods of studying yarn
structure. The most important and common limitation of both methods of yarn structural
investigation is they provide very limited amount of information about actual
arrangement of fibres inside a yarn. The tracer fibre method reveals the trajectory of only
few fibres from a stack of few tens to hundreds of fibres (depending on its linear density).
The cross-sectional microtomy gives a snapshot peek only at a certain section of yarn and
does not provide enough information about variations in fibre position along yarn length.
Both of these methods are also invasive in nature, which affects their accuracy and
performance.
In addition to the inability to provide complete information about yarn structure, there are
some other concerns related to both existing methods of yarn structural investigation. For
example, some studies have selected synthetic or regenerated fibres (such as viscose,
rayon and tencel) to produce tracers by dyeing them in a dark color as they have an
improved visibility under a microscope, compared to natural fibres such as cotton [74,
78, 101]. However, if these tracer fibres are applied to study the structure of natural fibre
yarns, they could result in misleading observations as they have different physical
properties such as tensile modulus, elasticity and friction coefficient. This would
influence the actual fibre arrangement within the yarn and the observed fibre trajectories

154
may not apply to other fibres, such as cotton. Some studies, which employed tracer fibre
method to study yarn structure had blended tracer fibres with ‘fibro’ material (i.e. viscose
fibres) [6, 73, 74]. The most probable reason for this is some natural fibres do not allow
clear visualization of the tracer fibres due to their opaqueness, which also implies that the
tracer fibre technique may not be effectively used to study fibre arrangement in all kind
of materials and yarns.
Similarly, the cross-sectional microtomy involves extensive physical contact with the
yarn specimen during sample mounting, microtomic slicing and slice handling operations,
which can easily affect the actual arrangement of fibres within the yarn. The cross-
sectional microtomy is also time consuming and laborious method of analysis [206].
Initially, a yarn specimen is mounted in a resin or a wax medium, which is then solidified
and sliced through a microtome. The mounting medium applies compressive forces on
the soft yarn specimen as it solidifies. This unwanted compression can potentially affect
the ‘actual’ fibre arrangement within the yarn by ‘squeezing’ the fibres together, which
would possibly affect the original yarn structure. For example, unwanted compression on
fibres can affect the value of yarn packing density, which is a measurement of the degree
of ‘closeness’ of fibres within a yarn [207]. In addition, the slicing through a microtome
requires an expert operator as oblique and inappropriate slicing can occur due to non-
uniform slicing speed, wrong angle of microtome blade and inadequate sample
positioning [225]. The handling of the fine microtomic slices also require great care. The
manual analysis of cross-sectional arrangement of fibres by viewing the sliced sections
under a microscope is prone to higher chances of experimental error.
Due to these limitations associated with both existing methods of studying yarn structure,
a true and complete picture of fibre arrangement within yarn has not been achieved. There
had been some attempts in the past that focused on the improvement of these methods
[84, 87, 226-229]. Li et al [226] proposed a digital image processing method to convert a
sequence of tracer fibre images into a single large panoramic image and to automatically
extract fibre trajectories out of it. Huh et al [84] improved imaging setup of tracer fibre
technique by taking two images of tracers at right angle to each other, which were then
joined together to produce three dimensional fibre trajectories. Primentas and Iype [227]
also attempted to study three dimensional arrangement of tracer fibres by varying the
depth of field of a projection microscope to achieve a better understanding about their

155
position within yarns. In case of cross-sectional microtomy, Chiu and Liaw [228] and
Chiu et al [229] applied image processing techniques and voting methods to study fibre
arrangement within yarn cross section in an automated manner. Similarly, another study
proposed application of Chan-Vese segmentation method to automatically analyze fibre
arrangement in microtomic images of yarn and calculating fibre packing density [87].
Although these attempts improved both existing techniques to some extent, they still were
not able to overcome the fundamental limitations associated with them.
Recently, another interesting idea to investigate yarn structure by applying micro
computerized tomography (CT) has emerged [110-112]. The working principle of micro
CT scanning is already discussed in section 1.5.3. The micro CT scanning of a yarn
specimen can capture a series of yarn cross-sectional images along yarn length, which
contains information about its internal structure. A CT image of the yarn cross-section
when viewed individually shows fibre arrangement within yarn cross section at a certain
point along yarn length. As the CT images are in a continuous series, the cross-sectional
arrangement of fibres can be viewed at several finely spaced sections (depending on the
scanning resolution) along yarn length. On the other hand, a collective representation of
the complete series of CT images provides an insight into the longitudinal arrangement
of each fibre, twisted within the yarn. These two aspects of looking at the yarn structure
provide a new opportunity to study both cross-sectional as well as longitudinal
arrangement of fibres within a single yarn specimen, which was not previously possible
due to invasive operation of existing methods of studying yarn structure. Hence, a
superior and comprehensive understanding of yarn structure can be achieved through
micro CT scanning of textile yarns. Due to non-invasive nature of micro CT scanning,
the chances of interference with actual yarn structure are also minimum.
The solution to the problem of investigating complete and actual yarn structure can be
micro CT scanning if two important issues associated with it can be addressed. Firstly,
the micro CT scanning of textile yarns is conducted at quite high resolution setting
(usually less than 2 microns) in order to visualize individual fibres effectively inside the
yarn. This narrows down the field of view of the CT system to only few millimetres.
Hence, a regular micro CT scan can only cover very limited yarn length (~1-3 mm) in a
single scan. Such a short length of the yarn does not provide enough information about
the longitudinal arrangement of fibres. Secondly, a subjective visual analysis of the yarn

156
CT images does not provide an adequate description of fibre arrangement within a yarn.
The information of internal yarn structure that is present in form of CT images needs to
be translated in terms of meaningful yarn structure related parameters such as yarn
packing density or fibre migration intensity. However, the yarn CT dataset is usually
evaluated subjectively, which does not allow an appropriate comparison between
structures of different yarns [110, 111]. The accurate extraction and quantification of the
information about yarn structure from the CT dataset is essential for successful
application of micro CT method to investigate yarn structure.
5.2. Principle & Hypothesis
In order to address both issues related to the application of micro CT method for
effectively studying and comparing the structures of a weak and a strong yarn, a two-step
approach can be proposed. The first step is to optimize the micro CT system to meet two
important requirements. The first requirement is optimizing the quality of the CT images,
which refers to the determination of minimum scanning resolution (or voxel size) of the
CT system that can produce yarn CT images with individual fibres clearly visible in them.
This is an essential requirement for further processing of CT images to extract the yarn
structural information out of them. In addition, the CT images should have minimum
noise and unwanted artefacts to avoid errors in downstream quantification of yarn
structural information.
The second requirement is to achieve substantial length of the yarn specimen through
micro CT scanning method. Generally, high resolution CT scanning is required for good
quality CT images (first requirement) as it visualizes fine features inside the specimen but
it also limits the field of view of the CT system and cover very short yarn length. The
substantial length of the yarn specimen would vary from material to material depending
on the length of the fibres that are used to produce yarns. However, in case of cotton
yarns, CT scanning of 30 mm yarn length (i.e. average fibre length) can provide adequate
information about longitudinal arrangement of most of the fibres inside a yarn.
5.2.1. Helical CT scanning

157
The above-mentioned requirements of achieving good quality CT images with substantial
length of the yarn specimen could be met by an interesting development in micro CT
scanning technology, called Helical CT scanning. Previous studies that discussed the
micro CT scanning of yarns had applied regular type micro CT scanners, which operate
by rotating the yarn specimen around its own axis while exposing it to an x-ray beam as
previously discussed in section 2.5.3. In this regular CT scanning arrangement, only very
limited length of the yarn specimen is exposed to the field of view of the CT system.
However, in Helical CT scanning, the CT system rotates as well as vertically traverses
the specimen, which covers longer specimen length through a helical scanning trajectory.
Such arrangement is very suitable for those specimens that have a higher aspect ratio such
as textile yarns. The simultaneous rotation and longitudinal traversing exposes longer
length of the specimen to the field of view of the CT system. A comparison of the
scanning principles of regular and helical type micro CT scanners is shown in Figure 5.1.
Although, the regular CT system can also cover longer specimen length by serial scanning
method, which involves scanning shorter segments of yarn specimen and then stitching
them together. However, serial scanning is not only highly time-consuming and resource
intensive process but it can rise complexities in CT data reconstruction for longer
specimen lengths such as stitching artefacts and volume misalignment issues.
Figure 5.1: Two different micro CT scanning techniques a) regular micro CT scanning b)
helical micro CT scanning

158
5.2.2. Analysing yarn structure through CT images
The second step is related to accurate extraction of yarn structural information from CT
data set in terms of appropriate parameters. This can be addressed using digital image
processing of the optimal quality CT images achieved through step one. The image
processing methods are capable to enhance yarn CT images, segment fibres from the
background, track them through continuous series of CT images and extract the
information of interest out of them. The long series of images in the CT dataset can be
processed in two different ways to extract the yarn structural information.
Firstly, each image in the dataset can be processed in individual capacity to calculate
those parameters that are related to fibre arrangement within yarn cross section such as
fibre packing density and yarn diameter. This will complement the information classically
achieved through cross-sectional microtomic method. Secondly, the longitudinal
arrangement of the fibres can be analysed by tracking each fibre inside the yarn through
each image in the CT dataset. The movement of fibres can then be recorded by locating
the spatial coordinates of their centroids as the fibres slowly move in between two
consecutive CT images in the CT dataset. The spatial coordinates of the fibres in each CT
image can be used to draw their longitudinal trajectories similar to what is achieved
through tracer fibre technique. However, the micro CT method can trace three-
dimensional path of each single fibre within the yarn cross section, which is not possible
through tracer fibre technique. The combination of information achieved from cross-
sectional distribution as well as longitudinal arrangement of fibres can produce a
complete picture of internal yarn structure that can be quantified in terms of various
parameters to represent actual and complete yarn structure.
In highlight of above discussion and proposed possibilities to improve the application of
micro CT method to study yarn structure, it is possible to develop a combined method of
yarn structural analysis that can overcome the limitations associated with the existing
methods. Such a method can be used to analyse the structural differences in yarns. In this
work, it can be applied to study and compare the structures of two yarns that showed
significant difference in their tensile strength. Hence, a simple hypothesis can be proposed
to investigate the yarn structure-property relationship. If a combined method based on
micro CT scanning and image processing techniques can be developed to study actual

159
and complete yarn structure, the role of yarn structure in determination of yarn tensile
strength can be established.
In order to test this hypothesis, the micro CT scanning variables were first optimized to
achieve good quality CT images along with substantial length of the yarn specimen. The
digital image processing algorithms were then developed to extract the yarn structural
information. After converting this information into appropriate yarn structure related
parameters, a comparison between the structures of both yarns was made. This
comparison was used to establish the effects of the differences in the structures of both
yarns on their quality (particularly on strength) and pave the way to improve it by
controlled manipulation of fibre arrangement inside a yarn.
5.3. Materials and methods
The objective of the following experiments was to select appropriate type of the micro
CT system and to optimize important CT scanning variables in order to achieve optimal
quality CT images as well as substantial length of the yarn specimen. The experimentation
was conducted on two different types of micro CT systems by varying those parameters,
which affected both the quality of the resulting CT images as well as the length of the
yarn scanned. The optimal quality CT images of both yarns (that varied in terms of their
tensile strength) were processed through three different image processing algorithms to
extract yarn structural information and to quantify it into suitable parameters. A
comparison was then made between these parameters to understand the differences
between structures of two different yarns and outcomes of the comparison were discussed
in context of difference in their tensile strength.
5.3.1. Yarn specimens
Two yarn specimens i.e. WT-HC-LO and KT-LC-NO were selected from an
experimental matrix as discussed in section 4.4. WT-HC-LO was produced with 1108
TPM twist, high compacting pressure and left offset diagonal spinning arrangement while
KT-LC-NO was produced with 1032 TPM twist and low compact pressure in regular
spinning arrangement (no offsetting). The yarns WT-HC-LO and KT-LO-NO will now
be referred as yarn H and yarn L respectively, for sake of simplicity. Yarn H showed the

160
highest value (i.e. 16.6 cN/tex) while yarn L showed the lowest value (i.e. 12.9 cN/tex)
of yarn tenacity respectively in a group of 18 different yarn specimens, which was
produced by controlled variation in their yarn tenacity. Yarn H was used as a primary
specimen to conduct initial optimization trials on two different CT systems by varying
important CT scanning variables. Yarn L was only scanned at the optimal settings of the
selected CT system achieved for yarn H in order to compare their structures. As yarn H
and yarn L were produced from similar raw material and had similar linear density (i.e.
12 tex), the CT parameters optimized for one of them were applicable for scanning the
other as well due to their similar physical dimensions and constituting material.
5.3.2. Sample preparation for micro CT scanning
The micro CT scanning of a yarn specimen required careful sample preparation
procedure, as there were at least three important requirements that needed to be taken into
account. Firstly, the yarn specimen should be mounted and kept under appropriate
pretension during the whole length of the CT scan. This would keep the yarn within the
field of view of the CT system and would avoid unwanted movements of the specimen
that could generate motion related artefacts in the resulting CT images such as blurring
[230]. Secondly, the yarn specimen should be mounted in vertical arrangement between
the sample-detector assembly to allow effective transmission of the x-ray beam through
it. As the yarn specimen could not stand vertically straight by itself, it required a sample
holder for mounting. Thirdly, the dimensions and the shape of the sample holder were
also critical in achieving a useful outcome from the CT scan. The high resolution and
high magnification micro CT scanning often requires close distance between the sample
to the detector and the sample to the source [231]. The inappropriate shape or size of the
sample holder could obstruct the rotation of the specimen during the scan by unwanted
contact with the source or the detector of the CT system. This unwanted interference
would not only affect the outcomes of a scan but could also potentially damage the
sensitive components of the CT system.
Hence, two tubes made up of carbon fibre and plastic material with a diameter of 3 mm
were used as yarn sample holders, as shown in Figure 5.2. The selection of either carbon
fibre or plastic tube was made on the basis of x-ray beam energy selected for a particular
CT trial to achieve appropriate contrast between the fibres and the background in the CT

161
images. During yarn specimen mounting in the sample holder tube, one end of the
specimen was taken from the yarn bobbin and held carefully to avoid any loss of yarn
twist. The physical contact between tube and the yarn specimen was kept to a minimum
to avoid any unnecessary interference with actual arrangement of the fibres. One yarn end
was threaded through the tube and some length of the yarn was skipped to avoid scanning
any part of the yarn that could be interfered during the mounting process. After threading,
the other end of the yarn was cut from the bobbin and both ends were tapped around the
outlets of the tube to keep the specimen stationary during scanning process. The tube was
vertically mounted and tightened in the holder of the CT scanning stage in alignment with
the field of view of the CT system before initiating the scanning process.
Figure 5.2: Two tubes made up of a) carbon fibre and b) plastic material, which were used
as sample holders for micro CT scanning of the yarn specimens

162
5.3.3. Micro computerized tomography
The cotton yarn specimen H was scanned on two different micro CT systems, which
varied in terms of their scanning type or principle. One system was ANU Heliscan
(Australian National University, Australia) which was a helical type CT scanner while
the other one was Xradia 520 Versa (Carl Zeiss GmbH, Germany), which was regular
type micro CT scanner. Both of these CT scanners are shown in Figure 5.3. Two trials of
micro CT scanning of yarns were conducted at each CT scanner resulting in a total of four
different trials. The parameters that were varied during CT scanning trials included the
CT scanning resolution and the magnification of the CT system as both of them not only
affected the quality of the CT images but also affected the field of view of the CT system,
which then influenced the length of the yarn covered during the scan. The scanning
resolution was varied from 1.89 microns to 0.69 microns while magnification was
changed from 10 x to 110 x. The x-ray energy level was selected accordingly to achieve
desired contrast between the cotton fibres and the background in the CT images. The yarn
L was only scanned at optimal settings achieved through CT trials conducted on yarn H.
The detailed technical specifications of these four CT trials are given in Table 5.1.

163
Figure 5.3: Micro CT scanners a) regular CT scanner X-radia 520 versa b) Helical CT
scanner ANU Heliscan

164
Table 5.1: Detailed specifications of the yarn micro CT scanning trials
Parameter /
Scanning trial a b c d
CT Scanner Xradia 520
versa
Xradia 520
versa
ANU Heliscan
micro-CT
ANU Heliscan
micro-CT
Scanner type Regular CT Regular CT Helical CT Helical CT
Contrast
technique
Absorption
contrast
Absorption
contrast
Absorption
contrast
Absorption
contrast
Sample holder
type Plastic tube Plastic tube
Carbon fibre
tube
Carbon fibre
tube
Resolution /
voxel
(microns)
1.89 0.69 1.7 1.33
Magnification
level (x) 10 40 10 110
X-ray energy
(KeV) 80 80 60 60
5.3.4. Digital image processing
The optimal quality CT datasets of yarn H and L that were achieved through above-
mentioned CT trials were selected for processing and extracting the yarn structure related
information. The dataset contained 306 discreet data blocks in Network Common Data
Form (NetCDF) file format containing continuous series of CT images. Each block of
data consisted of 40 yarn CT images, which resulted in a total of 12240 CT images. These
images were first extracted from the blocks and then converted into TIF file format for
further processing. The size of each CT image was 12.5 MB (megabytes) resulting in a
size of 149.4 GB (gigabytes) for the complete CT data set. Due to high size and number
of the CT images, they could not be processed in raw form as reading, processing and
visualizing those images required intensive computing resources and time. This problem
of handling and processing of big data was addressed in two ways. Firstly, the sequence
of CT images was cropped to only select the area of interest (i.e. yarn cross section),
which substantially reduced the overall size of each image. However, no image

165
compression or downsizing was carried out to avoid any degradation or loss of important
information relating to yarn structure. Secondly, a high performance computing cluster
called Multi-modal Australian ScienceS Imaging and Visualization Environment
(MASSIVE) was used for processing the CT images. It not only met the requirements of
intensive computing resources due to high performance node structure but also reduced
the computing time.
The selected yarn CT datasets were processed through three different image processing
algorithms that were developed in Matlab R2016a (MathWorks, USA) by using various
functions from image processing, signal processing and statistical toolboxes. The
proposed algorithms enhanced CT images, analysed fibre arrangement in yarn cross
section and tracked fibre paths along yarn length. These algorithms processed the CT
dataset in an automated manner to avoid laborious and time consuming task of manual
processing. The application of the image processing algorithms resulted in calculation of
various quantitative parameters related to yarn structure that were also statistically
analysed through the statistical functions available in Matlab software. However, for
three-dimensional visualization of the CT data set, ImageJ 1.46r (National Institutes of
Health, USA) with 3D viewer plugin was used.
5.3.4.1. Algorithm for image enhancement
The yarn CT dataset intrinsically contained unwanted features and artefacts such as
random noise and uneven background. In order to apply the image processing operations
and to quantify the information of interest out of the CT images, some degree of pre-
processing or enhancement was essential. The objectives of the first image processing
algorithm are noise elimination, segmenting fibres from the background and minimizing
variations in the pixels that belong to the fibrous regions. This was achieved by applying
noise removal filter, derivative operations (for detection of steep changes in pixel
intensity), binary conversion and flood filling operations. The first image processing
algorithm worked in the following sequence;
1) Reading every single image (one at a time) from the CT dataset into Matlab
workspace;

166
2) Increasing the image size by a factor of two using ‘bicubic’ interpolation to
improve its digital resolution;
3) Smoothing the image by a ‘Gaussian filter’ at sigma level 0.5 to minimize the
normally distributed noise;
4) Improving image contrast by mapping the pixels with grayscale intensity values
between 0.4 and 0.6 such that 1% data (or pixels) was saturated at lowest and
highest intensity values;
5) Taking first derivative of the pixels intensities in the spatial domain along x-axis,
y-axis, +45º and -45º directions, using the following mathematical relation:
𝜕𝑓
𝜕𝑥= 𝑓(𝑥 + 1) − 𝑓(𝑥) -------------------- (5.1)
Where,
𝜕𝑓
𝜕𝑥 = Derivate of pixel 𝑥 and 𝑥 + 1, which lie along x-axis
𝑓(𝑥) = Grayscale intensity value of pixel x
𝑓(𝑥 + 1) = Grayscale intensity value of pixel x+1
6) Imposing the fibres boundaries achieved through derivative operation on the
original CT image to supress its background;
7) Taking second derivative of the resultant image along x-axis, y-axis, +45º and -
45º directions, according to equation (5.2):
𝜕2𝑦
𝜕𝑥= 𝑓(𝑥 + 1) + 𝑓(𝑥 − 1) − 2𝑓(𝑥) -------------------- (5.2)
Where,
𝜕2𝑦
𝜕𝑥 = Second derivative of the pixel 𝑓(𝑥)
𝑓(𝑥) = Grayscale value of pixel x
𝑓(𝑥 + 1) = Grayscale value of pixel x+1, lying next to pixel x
𝑓(𝑥 − 1) = Grayscale value of pixel x-1, lying before pixel x

167
8) Subtracting second derivative image from the image achieved in step 6 to
eliminate noise pixels / objects from the background;
9) Converting the segmented image to binary image (at 0.1 threshold value) using
Otsu’s method [232];
10) Imposing the binary image onto the original CT image such that the pixels having
a value 1 in the binary image remain unchanged while the pixels having value 0
in the binary image are set to 0;
11) Filling the small holes within fibres through image flood filling operation;
12) Eliminating any isolated objects in the image less than an area of 20 pixels, which
represented random noise pixels / objects arising from unwanted artefacts in the
CT image.
5.3.4.2. Algorithm for yarn cross-sectional analysis
The information related to fibre arrangement in yarn structure was spread along two
dimensions of CT dataset i.e. within yarn cross section and along yarn length. The second
image processing algorithm dealt with analysing the pre-processed CT images (achieved
from first algorithm) and quantifying the yarn structural parameters related to cross-
sectional arrangement of fibres. As the fibres were already segmented from the
background using first image processing algorithm, application of simple morphological
operations (i.e. dilation and erosion) on the image would allow determining the yarn
boundaries that would lead to calculation of yarn structural parameters relating to the
cross sectional arrangement of fibres. The sequence of image processing operations
involved in the second algorithm is given as follows:
1) Reading the binary version of pre-processed yarn CT image (as achieved from
first algorithm) into Matlab workspace;
2) Dilating the image with a disk shape structuring element (radius 3 pixels) to
increase fibre diameter to merge them together into a single object;

168
3) Keeping only the biggest object (connected fibrous cluster) in the CT image
through size threshold and eliminating other objects that represented distant fibres
i.e. hairs;
4) Determining the centre of the connected fibrous cluster and taking it as the yarn
centre;
5) Marking the yarn centre on the image in step 1 and eliminating the hair fibres by
Euclidean distance threshold by measurement of yarn radius based on its linear
density through equation (5.3) [233];
𝑌𝑟𝑎𝑑 = 1
56√𝑁𝑒 --------------------(5.3)
6) Applying morphological dilation followed by morphological erosion through a
disk shape structuring element (radius 15 pixels) on the remaining fibres to
determine the yarn boundary;
7) Calculating the total number of white pixels inside the yarn boundary, which
represent the total fibre area within the yarn cross section;
8) Calculating the total number of pixels within the yarn boundary, which represent
the total yarn area.
The determination of yarn boundary and the measurement of total yarn and fibre areas
led to calculation of some established parameters that represented yarn structure such as
fibre packing density, yarn diameter, yarn radial packing density, yarn shape factor and
the number of fibres in the yarn cross section.
5.3.4.3. Algorithm for yarn longitudinal analysis
The third image processing algorithm analysed the longitudinal arrangement of fibres
along yarn length. It involved motion-based segmentation and region growing techniques
169
to first segment the connected fibres into individual objects followed by tracking their
movement through each individual CT image in the dataset. The spatial coordinates of
the centroid of each fibre were recorded to later draw and analyse their trajectories.
Various steps involved in the third image processing algorithm are sequenced as follows:
1) Manually segmenting the individual fibres in first image (N) of the CT dataset,
reading it into Matlab workspace and labelling each individual fibre inside it with
a number in incremental order i.e. 1, 2, 3, …., All other pixels, which did not
belong to any fibre in N were assigned a value of 0;
2) Reading the second pre-processed CT image (N+1) into Matlab workspace;
3) Converting image N+1 into a binary image with threshold value 0, which means
all pixels with a value greater than 0 in N+1 will be assigned 1 in the respective
binary image;
4) Labelling each object (either single fibre or a cluster of fibres) in the binary image
N+1 and recording the coordinates of each pixel that belong to each object;
5) Taking a Boolean image intersection of each fibre lying in the image N with each
individual object in image N+1;
6) All pixels of image N+1 that were matched with a particular object (or fibre) in
image N, were assigned the same number as that of the matching object in N,
leading to segmentation of individual fibres. The remaining pixels of N+1 were
assigned 0 value;
7) The area (or number of pixels) of each segmented fibre in image N+1 was grown
in 20 iterations under condition that it would not exceed the area of the fibre in
image N;
8) Similar operation was then repeated on image N+2 by taking image N+1 as a
reference image, which was already segmented and the loop continued on all
images throughout the length of the CT dataset.

170
5.4. Results and discussion
5.4.1. Optimization of micro CT scanning for yarn specimen
The CT images of cotton yarn specimens acquired through four different trials of micro
CT scanning are shown in Figure 5.4 & Figure 5.5. Each image is labelled with an alphabet
according to the respective ID of the CT scanning trials as previously assigned in Table
5.1. The first two CT trials i.e. (a) & (b) were conducted using a regular type micro CT
system while third and fourth trials were conducted at helical type micro CT system i.e.
trials (c) & (d). The scanning voxel size was varied from 1.89 microns to 0.69 microns
while the magnification was changed from 10x to 117x. The x-ray energy was consistent
for each type of CT scanner i.e. 80 KeV for the trials (a) & (b) and 60 Kev for trials (c)
& (d) as it achieved desired contrast in the images in respective trials and effectively
visualized the fibres inside the yarn cross section.
In the CT trial (a) which was both a low-resolution and low magnification CT experiment,
the cross section of the yarn specimen achieved is shown in Figure 5.4 (a). The individual
fibres inside the yarn can be seen as small light coloured dots against the darker
background. However, a clear view of the individual fibres constituting the yarn cross
section is not achieved. The boundaries of individual fibres are not even visually
separable from each other. The low scanning resolution and magnification together
resulted in poor optical resolution of the CT system that was not substantial to effectively
resolve the fine fibre dimensions and even finer inter-fibre spacing in the resultant yarn
CT image. The CT image achieved through the trial (a) did not carry enough and clear
information about yarn structure and cannot be processed further to study fibre
arrangement within the yarn. The yarn length achieved in the trial (a) was 1.88 millimetres
at 1.89 microns resolution.

171
Figure 5.4: Micro CT scanning trials (a) & (b) of yarn at a regular type scanner
The first CT trial clearly indicates the essential need of increasing the scanning resolution
and the magnification to improve the visualization of the individual cotton fibres. Hence,
the second experiment of yarn CT scanning i.e. CT trial (b) was conducted at 0.69 micron
resolution and 40x magnification. The CT image achieved through trial (b) is shown in
Figure 5.4 (b). The increment in scanning resolution and magnification has a clear effect
on the quality and the level of detail in the respective CT image. The optical resolution of
the CT system has improved significantly, as the individual fibres are now visually

172
separable from each other. In addition, the cross-sectional profile and perimeter of each
fibre are also evident. The peripheries of the fibres in CT image are darker (low intensity
value) than the rest of the fibre, producing a superior contrast between the fibres and the
background. This feature of the CT image can make downstream image processing easier
and more accurate as individual fibre segmentation can be conducted using a simple
intensity threshold method. However, one major issue associated with the CT trial (b) is
extremely short length of the yarn covered during the scan, which is only 0.35 millimetre
(or 350 microns). Such a short yarn length does not provide any useful information about
longitudinal arrangement of fibres, which is important for comprehensive understanding
of the yarn structure. The reason of the limited yarn length is very small field of view that
the CT system achieved at high resolution and high magnification settings. It established
that a high quality CT image is achieved only at a significant compromise on the yarn
length scanned in a regular type CT system.
The problem of short length of the yarn specimen scanned in trial (b) can be addressed
by a serial scanning method. The serial scanning technique works by conducting a number
of scans in a continuous series on a single specimen that otherwise does not fit in the field
of view of the CT system due to its physical dimensions. The CT volumes generated from
serial scanning are then virtually stitched together to achieve a longer length of the
specimen. However, as discussed earlier, the substantial length of the yarn required in
case of cotton fibres should be around the length of a single cotton fibre (i.e. 30 mm) to
allow tracking the longitudinal arrangement of fibres inside the yarn. In order to achieve
this length at 0.69 microns scanning resolution on a regular type CT system, at least 86
serial scans are required as each scan covers only 0.35 mm yarn length. The number of
serial scans would even increase, as stitching process requires some overlapping length
of the volumes.
The laboratory scale micro CT systems have limited flux of x-ray radiation. This increases
the time required for such a large number of serial scans and associated costs of scanning.
One possibility to address this problem is to use a Synchrotron based high resolution
micro CT system, which has much higher x-ray flux than the laboratory scale equipment
that can substantially reduce the CT scanning time. However, the problem of stitching the
volumes together and avoiding the stitching artefacts such as volume misalignment would
still be an issue to address. The other possibility is to use a helical type CT scanning

173
system, which scans the specimen in helical trajectory arrangement, which covers longer
specimen length without the need to stitch multiple volumes together. Helical CT
scanning is also a time consuming and resource intensive process. However, the
requirement of time and associated costs are substantially less than serial scanning
method on a regular type CT system.
The CT trial (c) was conducted on a helical type CT scanning system. The first two CT
trials (a) and (b) had indicated that the minimum scanning resolution to achieve a clear
view of individual fibres should be less than 1.89 microns. The third CT trial (c) was
conducted at 1.7 microns scanning resolution and 117x magnification setting, and the CT
image is shown in Figure 5.5. The view of the fibres in the CT image is superior to what
was achieved at 1.89 microns in trial (a) due to higher magnification setting as individual
fibres can be separably noticed to some extent. However, the CT image is not as superior
as the one achieved in CT trial (b) at 0.69 micron resolution. The optical resolution of the
CT system was not substantial to effectively visualize fine inter-fibre spacing. Hence,
downstream processing of this CT image in order to analyse the arrangement and
positions of individual fibres would be challenging and prone to higher chances of errors.
This indicates the requirement to increase the scanning resolution to improve the level of
detail in the image. However, the impressive feature of trial (c) is it covered 19.4 mm
yarn length in a single scan. This length of the yarn specimen is more than 10 times longer
than the yarn length achieved in trial (a) and 55 times longer than the yarn length achieved
in trial (b). The helical CT system due to its distinct scanning technique was able to scan
longer yarn length compared to the regular CT system. This shows that helical CT
scanning is more suitable for scanning textile yarns compared to regular type CT system.

174
Figure 5.5: Micro CT scanning trials (c) & (d) of yarn at helical type scanner
The final CT trial (d) was also conducted on helical type CT system at higher resolution
than trial (c) to improve the quality of the CT image along with minimum compromise
on the length of the yarn specimen, so the CT images can be further processed to analyse
yarn structure. The CT trial (d) was conducted at 1.33 microns scanning resolution and
110 x magnification setting, and the resultant yarn CT image is shown in Figure 5.5,
which is superior in quality and level of detail than the CT image achieved through trial
(c). The fibres have an improved contrast against the background. The inter-fibre spacing

175
are not as clearly visible as it was in case of CT trial (b) that was conducted at 0.69
microns but the darker edges of the fibres makes them visually separable from each other.
Although, the quality of the CT image can be further improved by increasing the scanning
resolution it is not required for fibre identification using the system proposed in this thesis.
Increasing the scanning resolution would be more cost and resource intensive, limiting
the field of view of the CT system. The limited field of view will compromise the length
of the yarn specimen scanned, which is highly undesired. The yarn length covered in CT
trial (d) was 16.28 mm, which is slightly less than the yarn length achieved in CT trial (c)
i.e. 19.4 mm but it is still much higher than the yarn length achieved in trials (a) & (b).
Although, 16.28 mm does not represent average (upper half mean) length of a cotton fibre
it can still provide some useful insight into the longitudinal arrangement of fibres. Hence,
in highlight of outcomes achieved through four different CT trials, the CT settings setup
for trial (d) using a helical type CT system were selected as optimal for scanning yarn
specimens. The CT scanning of two yarn specimens varying in terms of their tensile
strength was conducted on these CT settings and resulting datasets were selected for
further image processing to study their structures.
5.4.2. Analysing yarn structure using digital image processing
The optimal quality CT dataset of cotton yarns was achieved through scanning trial (d),
which required further processing using digital image processing techniques to analyse
and quantify yarn structural information in terms of appropriate parameters. The image
processing algorithms that were developed for this purpose are already given in section
5.3.4. However, the application of each of these algorithms on the CT images achieved
through CT trial (d) leading to the measurement of yarn structure related parameters is
discussed as follows.
5.4.2.1. Image enhancement
A yarn cross sectional image acquired from CT trial (d) is already shown in Figure 5.5. It
can be clearly seen that the CT image in its original form is not of ideal quality due to the
presence of unwanted features such as random noise and inconsistent background, which
surrounds the cotton fibres and blur their boundaries and perimeters to some extent. These
undesired features shadow the information of interest in the CT images and would not

176
allow direct application of image processing operations to segment individual fibres and
track their arrangement. Hence, the first image processing algorithm as described in
section 5.3.4.1, focused on enhancing the yarn CT images by improving their appearance
and eliminating unwanted features from them.
The outcomes of various steps involved in image enhancement process are shown in a
series of images in Figure 5.6, where Figure 5.6 (a) shows the original CT image, which
is then resized by a factor of 2 to improve its digital resolution. Figure 5.6 (b) & (c) show
the outcome of Gaussian filtering to counter normally distributed noise in the image
followed by image contrast adjustment respectively. Although, the simple contrast
adjustment by specifying intensity threshold, isolates most of the fibrous part from the
background it also eliminates the low intensity areas (less than threshold value) from
fibres and keeps high intensity areas (higher than specified threshold) in the background.
This is highly undesired as it could lead to errors in downstream image processing
workflow. Figure 5.6 (d) shows the boundaries of the fibres as determined by taking first
order derivative of the image in Figure 5.6 (c). The image derivative results in higher
values at steeper intensity gradients (which occurs at the object boundary) compared to
gradual intensity gradients (which occur inside an object) [212].
The fibre boundaries as determined by derivative operations were then imposed on the
contrast enhanced image (Figure 5.6 c) to emphasize the fibrous areas and suppress the
background as shown in Figure 5.6 (e). However, a few small white objects in the
background that do not belong to any fibre can still be observed in the image. These small
objects need to be removed to achieve a smooth background. Hence, second order
derivative operation was applied on the image shown in Figure 5.6 (e) and the outcome
of its application is shown in Figure 5.6 (f). The second order derivative of an image has
an aggressive response (as it assigns high pixel values) to the finer details in the image
(such as thin lines and isolated points) compared to the first order derivative operation
[212]. The result can be noticed in Figure 5.6 (g), where the second order derivative image
was subtracted from Figure 5.6 (e) resulting in a smooth and even background. The image
was then converted to a binary image as shown in Figure 5.6 (h) and further imposed on
the Gaussian noise removed image in Figure 5.6 (b) to keep important details of fibres
along with an even background as shown in Figure 5.6 (i). In order to compensate small
holes in the fibres at low intensity areas, flood filling morphological operation was

177
applied as its outcome is shown in Figure 5.6 (j). Few small objects that could still be
noticed around the fibres were removed through size threshold operation by removing
objects less than 20 pixels in size and the final form of the enhanced image is shown in
Figure 5.6 (k).
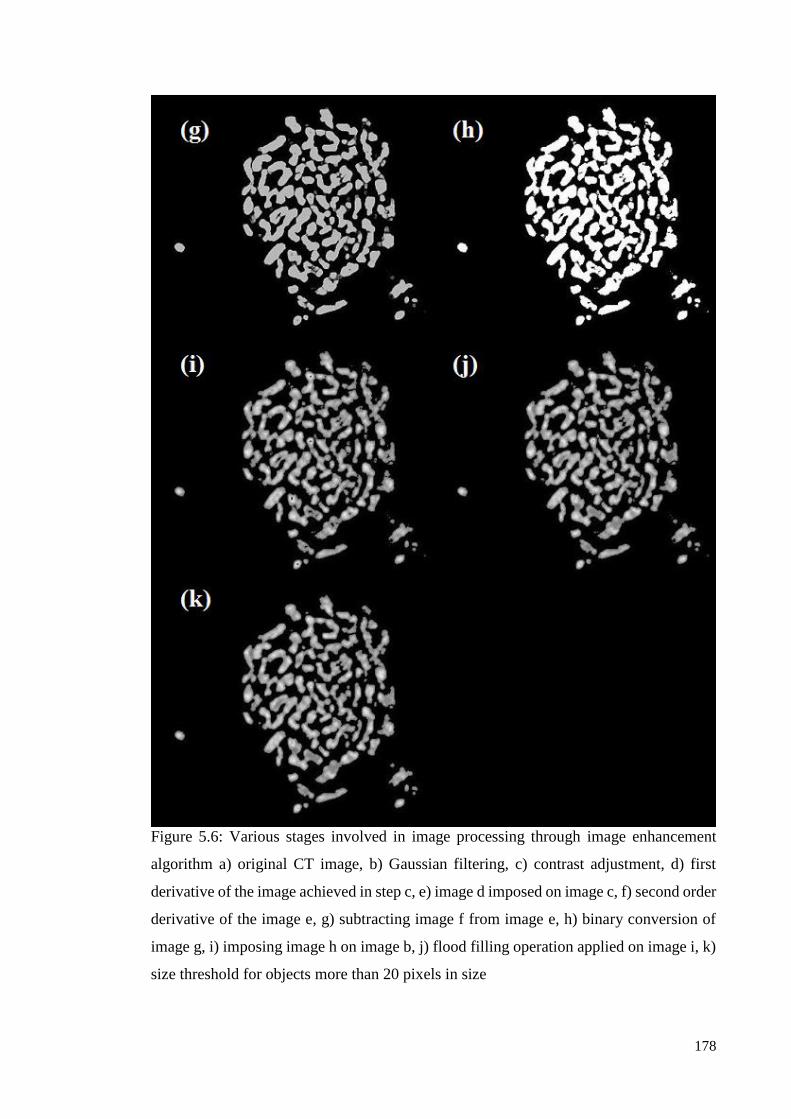
178
Figure 5.6: Various stages involved in image processing through image enhancement
algorithm a) original CT image, b) Gaussian filtering, c) contrast adjustment, d) first
derivative of the image achieved in step c, e) image d imposed on image c, f) second order
derivative of the image e, g) subtracting image f from image e, h) binary conversion of
image g, i) imposing image h on image b, j) flood filling operation applied on image i, k)
size threshold for objects more than 20 pixels in size

179
5.4.2.2. Analysis of fibre arrangement in yarn cross section
The enhancement of yarn CT images after noise adjustment and background evenness,
allows the application of further image processing operations to quantify yarn structure
related information (i.e. arrangement and position of fibres) out of them. As discussed
earlier, this information lies along two different dimensions of the CT data set i.e. within
yarn cross section and along the yarn length. The second image processing algorithm
deals with analysing the fibre arrangement within the yarn cross section. It quantifies this
information in terms of the parameters that are frequently reported in literature to
represent cross-sectional arrangement of fibres within a yarn [87, 88, 234]. These
parameters include fibre packing density, yarn diameter, number of fibres in yarn cross-
section and fibre radial packing density. A new parameter named yarn shape factor is also
introduced to characterize overall shape of the yarn cross-sectional profile.
The outcomes of the application of second image processing algorithm in terms of images
at various steps of its workflow are shown in Figure 5.7. The image in Figure 5.7 (a) is
the binary form of the final enhanced image, which was achieved through first image
processing algorithm as previously shown in Figure 5.7 (k). The reason for binary
conversion of this image was to allow the application of image morphological operations,
which could be applied only on binary images. The first issue with the yarn cross-
sectional image was the presence of hair fibres, which needed to be identified and
eliminated from the image for accurate measurement of yarn structure related parameters.
The hairs in the yarn CT images are those fibres, which surround the main yarn body but
are not integrated into it and can be noticed in the CT images at some distance from outer
yarn boundary. Hair fibres can be seen in the lower right corner and at bottom centre of
Figure 5.7 (a) indicated with red arrows, which appear at some distance from the main
yarn body compared to the fibres, which are a part of main yarn body. The distance of a
fibre from the yarn centre is a primary criterion to determine whether it belongs to actual
yarn body or it is a random hair. Hair fibres not only lie at the highest distance from yarn
centre compared to the fibres that are part of main yarn body but they also lie far apart
from their neighbouring fibres. The fibres that belong to the main yarn body lie close to
their neighbouring fibres and this rule can be used as a distinction metric between the
fibres that constitute yarn body and hairs.

180
Figure 5.7 (b) shows the output of morphological dilation on the binary enhanced image
with a disk shaped structuring element (3 pixels radius). There are two purposes of
dilating the fibres and increasing their size. Firstly, those fibres that belong to main yarn
body and essentially lie close to their neighbouring fibres would eventually touch and
merge into each other to form a single big fibrous cluster (or object). The hairs, which lie
at a distance from their neighbouring fibres, would not become a part of this fibrous
cluster. This will allow isolating the hairs from the main yarn body by using object size
as a threshold as shown in Figure 5.7 (c). Secondly, the yarn centre can be determined
simply as the centroid of the single big fibrous cluster, which is marked with a red dot in
Figure 5.7 (d). The final step of eliminating hair fibres was to measure the distance of
each fibre in Figure 5.7 (a) from the yarn centre and if it exceeded the yarn radius
threshold (as previously calculated through equation 5.3), the fibre was considered a hair
and eliminated as shown in Figure 5.7 (e). The reason for applying dual criteria to detect
hairs was to ensure accuracy and avoid unnecessary removal of fibres lying at the
periphery of the yarn, which could significantly influence the value of the calculated
parameters. The total fibre area could then be calculated as the number of white pixels
that belong to the remaining fibres, which were a part of the main yarn body.
Once the main yarn body was isolated from hairs, the next step was to nominate the yarn
boundary to allow calculation of yarn area. This was achieved by morphological dilation
followed by morphological erosion of the image shown in Figure 5.7 (e) with a disk
shaped structuring element (radius 15 pixels). The outcome is shown in Figure 5.7 (f).
The dilation operation increased the size of each fibre to an extent that all fibres merged
into each other to form a single object. The successive erosion of that object eroded pixels
from its edges bringing its size equal to the yarn cross-section. The boundary of the
resultant fibrous object represented the yarn boundary as it is imposed on the yarn cross-
section as shown in Figure 5.7 (g). The total number of pixels within the yarn boundary
(including boundary pixels) represented the total yarn area.
At this stage, the total area of the yarn (i.e. total number of pixels within yarn boundary)
and total area of the fibres (i.e. total white pixels within yarn boundary) was determined.
This information led to the calculation of fibre packing density and the yarn diameter. In
addition, the shape factor of the yarn was also determined by measuring the degree of
circularity of the yarn boundary. In order to calculate total number of fibres in yarn cross-

181
section, individual fibre segmentation was achieved through the third image processing
algorithm whose details are given in sections 5.3.4.3 and 5.4.2.3. Figure 5.7 (h) shows the
individual segmented fibres achieved through the third image processing algorithm.
Figure 5.7 (i) demonstrates the principle of measurement of radial packing density by
dividing the yarn cross-section into five concentric circular zones centring at the yarn
centre [88]. These fives yarn structural parameters related to the cross-sectional
arrangement of fibres were calculated from yarn CT images as discussed below. All of
these parameters were measured in pixel units (except unit less quantities), which were
then converted into physical units (i.e. microns) simply by multiplying them with the
voxel size i.e. 1.33 micron.

182

183
Figure 5.7: Various stages in calculation of different yarn structural parameters related to
cross-sectional distribution of fibres a) binary version of enhanced micro CT image with
hair fibres highlighted, b) morphological dilation, c) area thresholding to isolate hair
fibres, d) determination of yarn centre, e) hairs elimination by distance thresholding, f)
morphological dilation followed by morphological erosion, g) yarn boundary tracing, h)
individual segmented fibres within yarn cross section, i) measurement of yarn radial
packing density by dividing the cross section into concentric circular zones
5.4.2.2.1. Fibre packing density
Fibre packing density is defined as the ratio of the total area covered by the fibres present
within the yarn cross-section to the total area of the yarn [87]. It is a representation of the
degree of ‘closeness’ of the fibres. Yarn packing density is an important parameter of
yarn structure as it is influenced by a number of material and process related variations

184
and affects the yarn quality parameters [88, 89, 167]. A higher value of packing density
refers to a compact yarn structure where inter-fibre spacing are minimum and vice versa.
The fibre packing density is a unit less quantity as it a ratio of fibre and yarn areas. Using
the micro CT images of yarn specimens, the packing density could be simply calculated
through the relation given in equation 5.4.
𝑃𝐷𝑓 = 𝑃𝑓
𝑃𝑦 -------------------- (5.4)
Where,
PDf = fibre packing density
Pf = total number of pixels belonging to the fibres within yarn boundary
Py = total number of pixels lying within yarn boundary
5.4.2.2.2. Yarn diameter
As yarn is generally assumed as an ideal cylindrical structure, it also implies that it has a
perfect circular cross-section when viewed in two-dimensional plane of reference.
However, in reality this is not true. The cross-sectional profile of the yarn depends on the
fibre arrangement inside it, particularly on those fibres that lie at its outer periphery, as it
can be observed in the previously shown yarn cross-sectional images in Figure 5.7 (a).
Hence, the yarn diameter cannot be directly measured from CT images due to the arbitrary
shape of its cross-section. However, equivalent diameter of yarn can be calculated instead.
The equivalent diameter can be defined as the diameter of an imaginary circle with an
area exactly equal to the area of a non-circular or an arbitrary shaped object [234]. The
yarn area, which is the total number of pixels within the yarn boundary, is used to
calculate equivalent yarn diameter through the relation given in equation 5.5 [235].
𝑌𝐷𝐸𝑄 = √4 ×𝑃𝑦
𝜋 -------------------- (5.5)
Where,
𝑌𝐷𝐸𝑄 = Equivalent diameter of yarn
Py = total number of pixels lying within yarn boundary (i.e. yarn area)

185
5.4.2.2.3. Yarn shape factor
Yarn shape factor is a new parameter that has not been previously used to characterize
the degree of circularity of the yarn cross-sectional profile. The value of the yarn shape
factor ranges from 0 to 1, where 0 indicates an ideal circle while 1 refers to a straight line.
However, both 0 and 1 are degenerate cases. Higher value of shape factor refers to an
irregular arrangement of fibres while lower value refers to fibre arrangement in an ideal
circle inside the yarn cross-section. The shape factor indicates an overall picture of fibre
arrangement within the yarn. The quantification of yarn cross-sectional profile in terms
of the shape factor will allow analysis to determine if an overall pattern of fibre
arrangement inside the yarn has some effect on its quality parameters. The yarn shape
factor may be calculated through the relationship given in equation 5.6 by assuming the
yarn cross-sectional shape as an ellipse and taking ratio of its smallest and largest
diameters [236].
𝑌𝑆 = 𝐿𝑓
𝐿𝑚𝑎 -------------------- (5.6)
Where,
YS = yarn shape factor
Lf = distance between foci of the ellipse of yarn cross-section
Lma = length of the major axis of the ellipse of yarn cross section
5.4.2.2.4. Number of fibres in yarn cross-section
The total number of fibres within the yarn cross section is a measure of regularity or
evenness in the yarn. Yarn evenness is generally calculated for longer yarn specimens (at
least few hundred meters). However, total number of fibres within the yarn cross-section
can be calculated through CT images as well. In order to calculate total number of fibres
within the yarn cross-section, the individual fibre segmentation is essential, which is
achieved through the third image processing algorithm as will be discussed in section
5.4.2.3. An example of the application of the third image processing algorithm to achieve
individual fibre segmentation is shown in Figure 5.7 (h). The total number of fibres in a
yarn CT image was simply the total number objects present in that image.
186
5.4.2.2.5. Radial packing density
Radial packing density is another perspective to look at the degree of closeness of fibres
within yarn cross-section as a function of yarn radius [88]. The radial packing density of
a yarn is calculated by dividing yarn cross-section into five concentric circular regions at
equal radial distance from the yarn centre as shown in Figure 5.7 (i). All five circles with
radius of 25, 50, 75, 100 and 125 microns are centred at the yarn centre. The radial
packing density of the yarn was calculated by taking ratio of total number of white pixels
in each circular region (fibres) to the total number of pixels present in each circular region
(area of that circle).
5.4.2.3. Analysis of fibre arrangement along yarn length
The longitudinal arrangement of fibres within a yarn is the second dimension to study the
yarn structure in addition to cross-sectional arrangement of the fibres. In order to analyse
the longitudinal arrangement of fibres within a yarn, tracking of the fibre path along yarn
length is essential. This requires the accurate segmentation of individual fibres in each
CT image, which will allow tracking individual fibres throughout the CT dataset. While
the CT images have been pre-processed to segment fibres from the background,
individual fibres still appear to be ‘connected’ with each other in the form of small clusters
as fine inter-fibre spacing is not fully resolved at the selected CT scanning resolution. Of
course, these connections of the fibres could have been eliminated to achieve individual
fibre segmentation by improving the scanning resolution but this would also have
compromised the length of the yarn specimen scanned. Hence, an appropriate image
segmentation technique was required to split the fibrous clusters into individual fibres.
There are several approaches to segment an object in a digital image based on its grayscale
intensity, size difference and shape [212]. However, the problem of individual fibre
segmentation in this case was quite complicated as the grayscale intensity of the fibres
was not consistent. The differences between the grayscale intensities of different fibres
were not significant. Similarly, the size and shape of the fibres were not only random but
they also varied along yarn length, which is depicted in series of four CT images as shown
in Figure 5.9 (a) - (d). Hence, any segmentation approach based on the physical

187
appearance (i.e. colour or shape) of the fibres could not be applied to achieve desired
segmentation outcomes in the given CT dataset.
Another possible way to segment individual fibres in yarn CT images is by considering
the fact that fibres slightly change their positions between any two consecutive CT images
under influence of yarn twist. This change in position is very small as the physical
distance between two CT images is only 1.33 microns (i.e. the voxel size). Hence, the
position of every fibre is trackable from one CT image to its immediate next CT image
based on this slight movement. This approach is called motion-based segmentation. The
idea of motion-based segmentation is based on displacement of an object between the
sensing system and its field of view at two different time intervals i.e. T1 and T2. This
essentially requires at least two images of an object where its position is changed from
one point to another keeping the field of view of the sensing system consistent, which
was exactly the case with the CT dataset.
Motion-based segmentation is simple when only one object changes its position and the
background remains constant. However, it becomes complicated when all objects (i.e.
fibres) are continually changing their positions and the background is not consistent.
Hence, nothing in the image can be used as a reference point to track fibres between two
images. This problem was resolved by manually segmenting the first image to use as a
reference to segment fibres in subsequent CT images. To achieve individual fibre
segmentation, the third image processing algorithm as discussed in section 5.3.4.3 was
applied and its outcomes are demonstrated on a series of four consecutive images in the
CT dataset, which are represented as N, N+1, N+2 and N+3 as shown in Figure 5.9 (a) –
(d) respectively. Image N was the first image in the CT dataset, which was manually
segmented and used as a reference image as shown in Figure 5.9 (e). The fibres slightly
change their positions between each consecutive image but because this change in
position was so small it can only be clearly noticed by comparing image N (i.e. Figure
5.9 a) with image N+3 (Figure 5.9 d).
The fibre segmentation was carried out among consecutive pair of images, (i.e. N and
N+1, N+1 and N+2, N+2 and N+3 and so on). The reference image N was converted to a
binary image and all individual fibres were labelled and assigned a distinct number and
RGB value. Each object (i.e. fibre) in image N was then compared with all objects (or

188
fibres) present in image N+1. The overlapping regions of the matching objects in N+1
were assigned the number and RGB value of the respective object in image N as shown
in Figure 5.9 (e) & (f). The similar technique was replicated on other image pairs as shown
in Figure 5.9 (g) & (h). However, one problem associated with this technique is shrinkage
in the overlapping fibre area as the segmentation operation proceeds. This can be noticed
in Figure 5.9 (g) & (h), which shows small greyish regions (indicated by small red arrows)
that do not overlap with any object in its preceding image. If the greyish areas keep on
increasing with each image, eventually the track of the fibres being traced will be lost.
Hence, it is essential to fill these grey fibrous spaces with the RGB values that belong to
the respective fibres.

189
Figure 5.8: Motion based segmentation to track individual fibres in yarn CT images

190
In order to address this issue, region growth techniques were used to grow the area of
fibres in the greyish zones in each CT image. The regions were grown by comparing the
total area of each fibre (motion segmented area and grown area) in a CT image with the
area of the respective fibre in previous CT image. The regions were only grown in non-
zero pixels (greyish zones) of the image. The grown regions for images N, N+1 and N+2
are shown in Figure 5.9 (a) – (c) respectively. The final outcomes of individual fibre
tracking by combining motion based segmentation with region growing technique are
shown in Figure 5.9 (d) – (g), where each individual fibre was segmented and assigned
with different RGB value and grey areas in the fibres were also assigned the respective
RGB values. The filled grey areas are shown with small green arrows in Figure 5.9 (f) &
(g) which were previously unoccupied as shown in Figure 5.9 (g) & (h).
The final processed CT images were stacked together to visualize their longitudinal
arrangement inside the yarn as shown in Figure 5.10, where each fibre has been illustrated
in a different colour according to the RGB value assigned to it during tracking. The
volume shown in Figure 5.10 consisted of 500 processed CT images. The spatial
coordinates of all segmented fibres were recorded to calculate yarn structural parameters
that are related to the longitudinal arrangement of fibres. The critical aspect of the
longitudinal arrangement of fibres is their migration behaviour, which was then
characterised through the equations proposed by Hearle et al [77]. The parameters, which
were calculated from yarn CT images to represent the fibre migration behaviour, included
mean fibre position, root mean square deviation (amplitude of migration) and mean
migration intensity. In addition, another parameter i.e. migration factor that represented
the overall extent of fibre migration occurring within a yarn was also calculated as
proposed by Huh et al [84].

191
Figure 5.9: Application of region growing method on motion segmented images to keep
track of individual fibres

192
Figure 5.10: Different views of the 3D volume of the yarn specimen achieved through
vertical stacking of CT images
5.4.2.3.1. Mean fibre position
Mean fibre position refers to the average radial position of a fibre with respect to the
central yarn axis. As the fibres radially displace from the yarn surface towards the yarn
core and back to the surface, mean fibre position provides an estimate of average radial

193
position of a fibre within the yarn. However, mean fibre position does not directly
represent the extent of fibre migration but it contributes towards calculation of other
parameters that represent the extent of fibre migration such as migration amplitude and
intensity. The mean fibre position (�̅�) can be calculated by the relations given in equations
(5.7) & (5.8) [77].
𝑌 = (𝑟
𝑅)
2
-------------------- (5.7)
�̅� =1
𝑍𝑛∫ 𝑌 𝑑𝑧
𝑍𝑛
0=
∑ 𝑌
𝑛 -------------------- (5.8)
Where,
r = distance of fibre from central yarn axis at a certain point n along yarn
length
R = radius of yarn at point n
Y = fibre position with respect to central yarn axis at point n
Y̅ = mean fibre position
Z = total observed yarn length
n = number of observations made on yarn length Z
The spatial coordinates of the yarn centre at each point n along yarn length Z have already
been recorded by the second image processing algorithm as discussed in section 5.4.2.2
as yarn centre was nominated on each CT image in the dataset. Similarly, the yarn
diameter was calculated at each point n through the same algorithm, which enabled
calculation of the yarn radius R. The position of each fibre at point n was determined by
the third image processing algorithm as it tracked fibre position along yarn length. This
enabled the calculation of r, which is the distance between fibre and yarn centre. The
square of the ratio of r and R determined the fibre radial position Y that was calculated at
each point n along the yarn length. The average of Y at n observations yielded the mean
fibre position Y̅.
5.4.2.3.2. Amplitude of migration

194
The amplitude of migration refers to the degree of deviation of a fibre from its mean
position. A fibre can move either towards the yarn centre or towards the yarn surface
during migration. Hence, amplitude of migration is measured in terms of root mean square
(r.m.s) value to measure the magnitude of deviation of fibre from its mean position and it
is not affected by the direction of migration. The amplitude of migration was calculated
using equations (5.9) & (5.10) [77]
𝑟. 𝑚. 𝑠 𝑑𝑒𝑣𝑖𝑎𝑡𝑖𝑜𝑛 = 𝐷 = [1
𝑍𝑛∫
(𝑌−�̅�)2
𝑛 𝑑𝑧
𝑍𝑛
0]
1/2
-------------------- (5.9)
𝐴𝑚𝑝𝑙𝑖𝑡𝑢𝑑𝑒 𝑜𝑓 𝑚𝑖𝑔𝑟𝑎𝑡𝑖𝑜𝑛 = 𝐴 = √3 × 𝐷-------------------- (5.10)
In order to calculate the amplitude of fibre migration, the distance between the radial
position of a fibre (Y) at each point n along yarn length and its mean position (Y̅) was
required, which were already calculated in previous steps. If a fibre moves well beyond
its mean position Y̅, it would result in a higher value of root mean square deviation and
then higher amplitude of fibre migration and vice versa. This showed the higher extent of
radial displacement in a fibre, which in other words meant a higher amount of migration
exhibited by a particular fibre.
5.4.2.3.3. Mean migration intensity
The intensity of fibre migration refers to the slope of the migrating fibre, which was
calculated as the change in radial position of a fibre with respect to the change in yarn
length. As the value of the slope can be either positive or negative depending on the
direction of fibre migration (i.e. towards yarn centre of away from it), the migration
intensity was also calculated in the form of a root mean square value. The mean migration
intensity was calculated according to the relation in equation 5.11.[77]
𝑀𝑒𝑎𝑛 𝑚𝑖𝑔𝑟𝑎𝑡𝑖𝑜𝑛 𝑖𝑛𝑡𝑒𝑛𝑠𝑖𝑡𝑦 = 𝐼 = [1
𝑍𝑛∫ (
𝑑𝑌
𝑑𝑧)
2
𝑑𝑧𝑍𝑛
0]
1/2
-------------------- (5.11)
In order to calculate mean migration intensity of fibres through micro CT images, the
change in the radial position of a fibre (Y) between two consecutive slices of CT dataset

195
was required. This was calculated by finding the Euclidean distance between the spatial
coordinates of a fibre in two consecutive CT images (i.e. N & N+1). The factor dZ
(change in yarn length) was the physical distance between two CT images, which was
equal to the scanning voxel size (i.e. 1.33 microns) and it was constant for all images in
the CT dataset. Hence, the ratio dY/dZ was calculated for all images in the CT dataset.
The mean of dY/dZ represented the mean migration intensity (I) of a particular fibre
within the yarn. The higher value of mean migration intensity referred to a higher extent
of radial displacement of a fibre, which also referred to a higher degree of fibre migration
for that particular fibre and vice versa.
5.4.2.3.4. Migration factor
The amplitude and intensity of fibre migration describe the extent of migration in two
different aspects i.e. broadness and steepness of the fibre trajectory curve. Higher values
of these parameters indicate a higher extent of fibre migration within a yarn and vice
versa. However, a single parameter that takes into account both the spread and steepness
of fibre trajectory can provide an overall picture of migratory behaviour of a fibre. Huh
et al. [84] have proposed one such parameter and termed it as migration factor (MF).
Migration factor is simply a product of root mean square deviation of fibre trajectory (D)
and the intensity of migration (I) as given in equation 5.12 [84]. As the values of both D
and I have already been calculated, migration factor was calculated by taking their
product. A higher value of migration factor (MF) indicated an overall higher degree of
migration exhibited by a fibre and vice versa.
𝑀𝐹 = 𝑟. 𝑚. 𝑠 𝑑𝑒𝑣𝑖𝑎𝑡𝑖𝑜𝑛 (𝐷) × 𝑚𝑖𝑔𝑟𝑎𝑡𝑖𝑜𝑛 𝑖𝑛𝑡𝑒𝑛𝑠𝑖𝑡𝑦(𝐼)-------------------- (5.12)
It is also important to mention that the yarn structure related measurements achieved
through the combined method are sensitive to both CT scanning parameters that were
selected (such as x-rays energy level and detector resolution) and the image processing
steps that were followed in this study. However, as both yarns H and L were scanned
under similar CT settings and processed using same image processing operations, a
comparison between their structural parameters is possible.

196
5.5. Comparison of yarn structures
The combined method based on micro CT scanning and digital image processing was
applied to analyse and compare the structures of two yarn specimens i.e. yarn H and yarn
L, varying in terms of their tensile strength. Both yarns were produced using a similar
material (i.e. roving) but the geometries of their respective spinning triangles were
manipulated in a controlled arrangement during the spinning process as previously
discussed in section 4.5.2. The changes in the spinning triangle geometry resulted in a
significant difference in their tensile strength (i.e. yarn H stronger than yarn L), which
was then assumed to be linked with the differences in their fibre arrangement and internal
structures.
In order to investigate this assumption and the role of yarn structure on its tensile strength,
both yarns were scanned through the optimal settings achieved from CT scanning trial (d)
as discussed in section 5.4.1. The two CT datasets comprised of 12240 CT images each
that covered 16.28 mm yarn length. Each CT image in the dataset was then processed
through three image processing algorithms as discussed in section 5.4.2. The yarn
structure was then quantified in terms of suitable yarn structural parameters that
represented the fibre distribution both within yarn cross-section and along its length.
5.5.1. Comparison of fibre distribution within yarn cross-section
The yarn structural parameters related to fibre distribution within yarn cross-section for
both yarn H and L are presented in Table 5.2. These parameters include fibre packing
density, yarn diameter, yarn shape factor, number of fibres in yarn cross-section and radial
packing density of the yarn. The yarn radial packing density was calculated by dividing
the yarn cross-section into five concentric circular regions, which were labelled from A
to E. The circular regions lied in 0 to 125 pixels yarn radial space in increment of 25 pixel
step. Each CT image in the datasets of yarn H and L provided an independent view of the
fibre distribution within yarn cross-section at a certain point along the yarn length. The
above mentioned yarn structural parameters related to fibre distribution within yarn cross-
section were separately calculated from each CT image producing 12240 observations of
each parameter and their average values are given in Table 5.2. The values of these yarn
parameters changed in each CT image as the arrangement of the fibres slightly changed

197
under the influence of yarn twist. The standard deviation mentioned next to the average
values show the extent of this variation in the respective parameters.
Table 5.2: Yarn structural parameters related to fibre distribution in the yarn cross-section
Parameters Specimen ID
Yarn H Yarn L
Yarn diameter (microns) 306.7 ± 11.4 313.9 ± 8.3
Fibre packing density 0.499 ± 0.02 0.494 ± 0.02
Yarn shape factor 0.39 ± 0.1 0.37 ± 0.1
Average number of fibres 80 ± 8 81 ± 8
Radial packing
density
Zone A 0.51 ± 0.05 0.53 ± 0.05
Zone B 0.51 ± 0.03 0.52 ± 0.03
Zone C 0.5 ± 0.03 0.5 ± 0.03
Zone D 0.46 ± 0.03 0.46 ± 0.03
Zone E 0.29 ± 0.07 0.34 ± 0.05
The comparison of the yarn structural parameters related to fibre distribution within yarn
cross-section shows slight difference between yarns H & L. The diameter of yarn H (i.e.
306.7 microns) is slightly smaller than that of yarn L (i.e. 313.9 microns) but this minor
difference is statistically significant (P-value = 0.001). The reason for statistical
significance was high sample size i.e. 12240 observations of each parameter were made
relating to each single image of the CT dataset. The yarn diameter is generally considered
as a function of total number of fibres within the yarn cross-section, which then relies on
yarn linear density [18]. As the linear density of both yarns was 12 tex, the average total
number of fibres within yarn cross-section were also almost equal i.e. 80 for yarn H and
81 for yarn L. Hence, yarn diameter and total number of fibres within yarn cross-section
can be considered as non-influencing factors on yarn strength.
The difference between the fibre packing density of yarn H (i.e. 0.499) and yarn L (i.e.
0.494) was also negligible but statistically significant (P-value = 0.001). Similarly, the
pattern of radial packing density of both yarns in terms of number of fibres lying in each
circular zone around the yarn centre was similar. The radial packing density was the
highest around the yarn centre and intermediate fibrous zones, as calculated in circular

198
zones A, B and C (around 0.5). The radial packing density then slightly decreased in zone
D (i.e. 0.46) and dropped quite significantly in zone E (i.e. around 0.3). The difference
between the number of fibres in zone A, B and E was statistically significant (P-value =
0.001) while the difference between the number of fibres in zone C and D was non-
significant (P-value = 1). This indicated that the fibre packing density in terms of area
occupied by and distribution in radial zones around the yarn centre did not greatly differ
between both yarns and most likely did not influence yarn strength.
Generally, the fibre packing density is thought to be influenced by spinning process
parameters such as yarn twist and fibre compacting in the drafting zone [88, 89]. It is
previously established that the yarns produced with substantially higher twist level
showed higher value of packing density and vice versa [88]. Similarly, fibre compacting
in the drafting zone of a spinning frame through an air suction-based mechanism results
in higher values of fibre packing density compared to non-compact yarns. Yarn H was
produced with 1108 TPM twist and high pressure compacting while yarn L was produced
with 1032 TPM twist and low pressure compacting. Both yarns were compacted by an air
suction based mechanism. The possible reasons for no significant difference between
fibre packing densities of both yarns could be narrow difference in air suction pressures
at low and high suction settings.
The comparison of the shape factors of both yarns indicated lack of substantial difference
between them as the shape factors for yarn H and L were 0.39 and 0.37 respectively
although it was statistically significant (P-value = 0.001). The values of the shape factor
indicated that none of the yarns exhibited perfectly circular profile of their cross-section
but instead it was arbitrary. This arbitrary shape of yarn can be noticed in Figure 5.7 (g),
where a boundary was imposed on the yarn cross-section. If there existed a significant
difference between shape factor values of both yarns, it could be deduced that uniform
circular arrangement of fibres may have some influence on yarn quality compared to
arbitrary or random arrangement of fibres, but the above shown results does not support
this idea.
The above-mentioned results in Table 5.2 and lack of any significant differences between
cross-sectional arrangements of fibres indicate that the fibre distribution and arrangement
in yarn cross-section did not affect its tensile strength. In fact, this remark agrees with

199
two previous studies to some extent that attempted to analyse cross-sectional arrangement
of fibres through microtomic method and correlated it with the resultant yarn properties
[237, 238]. For example, a study that focused on comparison between the packing
densities of compact and regular ring spun yarns showed that significant difference in the
value of fibre packing density caused slight influence on yarn tenacity (i.e. 6.2%) but
great influence on yarn hairiness (i.e. 111.85%) [237]. Similarly, another study showed
that slight difference in packing density led to huge difference in terms of yarn hairiness
and only minute difference in yarn tenacity [238]. Hence, it can be concluded that the
cross-sectional distribution of fibres affects yarn quality particularly yarn hairiness but
does not significantly affect yarn strength. The last avenue to look for the origin of
variations in tensile strengths of yarn H and L is longitudinal arrangement of fibres and
their migratory behaviour inside the yarn.
5.5.2. Comparison of fibre arrangement along yarn length
The yarn structural parameters related to the longitudinal arrangement of fibres include
mean fibre position, amplitude of fibre migration, intensity of fibre migration and fibre
migration factor. The values of these parameters for both yarn H and L are given in Table
5.3. These parameters describe the extent of fibre migration by representing the
magnitude of variations in radial position of a fibre with respect to the yarn central axis.
However, unlike the yarn structural parameters related to the cross-sectional arrangement
of fibres, the parameters related to the longitudinal arrangement of fibres cannot be
calculated from individual CT images in the dataset. Instead, the information on
longitudinal arrangement of fibres is spread across the CT dataset as each individual CT
image represents a small segment (i.e. equal to voxel size) of the yarn length. Hence, in
order to provide an overall picture of the longitudinal arrangement of all fibres within a
yarn, the values of the above-mentioned parameters were calculated for each individual
fibre and their averaged values are given in Table 5.3. The standard deviation associated
with each parameter indicates the differences in values of that parameter exhibited by
different fibres inside the yarn.

200
Table 5.3: Yarn structural parameters related to fibre arrangement along yarn length
Parameters Specimen ID
Yarn H Yarn L
Mean fibre position 0.31 ± 0.4 0.21 ± 0.23
Mean amplitude of migration 0.25 ± 0.2 0.21 ± 0.1
Mean migration intensity 1.61 ± 0.05 1.36 ± 0.02
Migration factor 0.23 0.16
The mean fibre positions calculated for yarns H and L were 0.31 and 0.21 respectively.
According to the ideal helical model, the value of mean fibre position should be around
0.5 but it is not practical, as fibre migration does not follow the ideal helical model. Mean
fibre position itself does not explain the migration behavior of a fibre or its longitudinal
arrangement as it merely represents average radial position of a fibre with respect to the
yarn central axis. However, the standard deviation of the mean fibre position for both
yarn H and L was quite high, compared to the average of the mean position of all fibres
inside the respective yarns. This indicates the variation in mean position of various fibres
inside the yarn, as some of them were located at a high radial distance from the yarn
centre while others were located quite close to the yarn centre.
The amplitudes of fibre migration for yarn H and L were 0.25 and 0.21 respectively. The
higher value of amplitude of migration refers to the higher amount of deviation of a fibre
from its mean position, which also indicates a higher extent of fibre migration taking
place inside the yarn. The amplitude of migration had a higher value for yarn H compared
to yarn L. However, this difference was not statistically significant. One reason for lack
of significant difference between amplitude of migration was different fibres (depending
on their position within yarn cross-section) exhibiting different migratory behavior. Some
fibres exhibit higher amplitude of fibre migration under influence of residual spinning
stress while other fibres showed less amplitude of fibre migration as they were not equally
stressed. When the amplitude of fibre migration was averaged, the differences between
the two yarns become non-significant (P-value = 0.11) due to the higher values of the
standard deviation.

201
The values calculated for mean migration intensities for yarn H and L were 1.61 and 1.36
respectively indicating that the average slope of fibre trajectories in yarn H was higher
than in yarn L. The difference in the fibre migration intensities was also statistically
significant (P-value = 0.001). The higher value for mean migration intensity in yarn H
indicate more frequent radial displacement of fibres, which refers to a higher extent and
frequency of fibre migration inside the yarn. The migration factor (which is a product of
migration intensity and the migration amplitude) was higher for yarn H (i.e. 0.23) than
yarn L (i.e. 0.16). The overall higher values of the migration parameters related to
longitudinal arrangement of fibres within a yarn represents a higher extent of fibre
migration occurring inside yarn H. The frequent and broader radial disposition of fibres
together could produce a more integrated yarn structure, as fibres would be more
‘intertwined’ together. This could be assumed to provide better cohesion to the yarn
allowing it to withstand comparatively higher tensile stresses.
5.6. Conclusion
This chapter examined the use of micro-CT as a method to comprehensively study and to
compare the arrangement of fibres within a yarn structure. It described a method for micro
CT scanning of a yarn specimen and the subsequent processing of the CT dataset through
digital image processing techniques. The key findings of the chapter are:
With the yarns studied, micro CT scanning has proven to be a non-invasive and
comprehensive analysis technique to investigate complete yarn structure and fibre
arrangement as it overcomes the limitations associated with both existing methods
of studying yarn structure;
With the yarns studied, Helical CT scanning was a more suitable micro CT
scanning method compared to regular CT scanning due to its ability to scan longer
yarn length within a shorter time;
Digital image processing methods when applied on the micro CT dataset achieved
through helical CT method, could effectively analyse the fibre arrangement inside

202
the yarns studied and translate it into appropriate parameters that represent yarn
structure;
With the yarns studied, there was a lack of relationship between yarn tensile
strength and the cross-sectional arrangement of fibres in terms of fibre packing
density and other parameters. The existing literature also supports this fact as
cross-sectional distribution of fibres more significantly affects yarn hairiness
compared to its tensile strength;
With the yarns studied, the longitudinal arrangement of fibres in terms of their
migratory behaviour had a decisive influence on the tensile properties of the yarn.
The stronger yarn showed a higher value of the amplitude and intensity of fibre
migration compared to the weaker yarn, which referred to a more cohesive yarn
structure due to higher extent of fibre migration;
This work indicates that the proposed method of analysis could be used for
determining structural parameters for a range of other yarns made from a range of
other fibres to give scientists a new approach to improve yarn quality;
Although the combined micro CT and image processing method of studying yarn
structure provides deeper insights into the fibre positioning and arrangement
within the yarn compared to the previously applied techniques but limited length
and number of the yarn specimens were analysed in this study as per available
resources. As yarn structure varies significantly along yarn length, substantial
length and number of the yarn specimens should be analysed before drawing any
generalized conclusions about the yarn structure.
203
6. Conclusion and Future Work
6.1. Summary
A critical review of existing literature on recent developments of the ring spinning process
to improve yarn quality concludes that only a few modifications made on the ring frame
had received wider industrial appreciation and commercial success while various
proposed modifications remained at the experimental level. The reason was their inability
to achieve an overall or significant improvement in yarn quality, economic concerns or
complications in application on existing yarn spinning system. Irrespective of the
commercial performance, perhaps the only commonality in almost all modifications made
in the classical ring spinning process to improve yarn quality was their interaction with
the spinning triangle zone and some degree of influence over it. This establishes a decisive
effect of the spinning triangle on yarn quality. However, the exact understanding of the
spinning triangle and its relationship with yarn quality are still not fully understood.
Most of the knowledge of spinning triangle exists in the form of theoretical models and
limited physical observations, which cannot be effectively translated into yarn quality
improvement. In addition to the spinning triangle, another critical but less explored area
in yarn spinning related research is internal yarn structure and fibre arrangement within a
yarn. The structure of a yarn influences its physical properties or quality but the degree
and nature of these relationships have not been clearly established. The primary reason
for limited understanding of the spinning triangle as well as yarn structure is
unavailability of appropriate techniques to study both of these areas in controlled yarn
spinning arrangement. Hence, this work focused on development and application of two
different methods to analyse both the spinning triangle and the yarn structure by
introducing controlled variations into the yarn spinning process whilst monitoring the
spinning triangle and internal structure of the yarns. This work has been aimed to fill these
voids in yarn spinning and quality related research.
A newly developed clear rubber roller with two layered composite structure (plastic and
rubber) exposed the spinning triangle during the yarn spinning process and overcame
several limitations associated with the existing techniques of observing the spinning

204
triangle zone. The clear rubber roller provided a complete view of the shape of the
spinning triangle ranging from the base of the triangle (i.e. roller nip line) to its tip (i.e.
yarn twisting point). An image acquisition setup with optimal settings of the digital
imaging parameters captured a series of images of the spinning triangle through the clear
rubber roller. The level of clarity in the spinning triangle images was not excellent but
acceptable as various important geometrical and shape related features of the triangle
were effectively visualized. The significant features of the clear rubber roller were its
design and structure, which imitated a regular (opaque) drafting roller and could be
simply clipped on a ring frame. Due to the similarity of the physical properties of
materials used, the clear rubber roller formed a strong nip with the bottom drafting roller
and applied necessary friction and control on the fibrous strand. This made the operation
of the clear rubber roller non-invasive as it did not cause any detrimental effects on the
natural arrangement of fibres at the spinning triangle zone. The comparison of end
breakages, quality of yarns produced on regular and clear rubber roller and visual analysis
of the spinning triangle images also confirmed this fact. This suggests that the clear rubber
roller could be applied to expose the spinning triangle zone in a simple, effective and non-
invasive manner.
Perhaps the most useful, measureable and quantifiable information that lay in the spinning
triangle images was its physical geometry or shape that could be extracted in terms of
different geometrical parameters such as width, height and angles of the spinning triangle.
An image processing algorithm that was developed for analysing the spinning triangle
images successfully processed the bulk of imagery data acquired from the clear rubber
roller and quantified important geometrical parameters of the spinning triangle in an
automated manner. The analysis of spinning triangle geometrical data that was
represented in time domain showed significant variations in the shape and the geometry
of the spinning triangle under influence of various process and material related variations.
The analysis of the spinning triangle data in frequency domain (through Fourier
transformation) was another way to study the variations in the spinning triangle geometry
and to further link them with the periodic variations in spinning preparatory process. This
also stressed the need to observe the spinning triangle with a large sample size over a
substantial period of time due to its highly dynamic geometry. A few static images could
not represent the dynamic nature and behaviour of the spinning triangle. The proposed

205
image processing algorithm successfully quantified the spinning triangle geometry and
facilitated the analysis of dynamic variations in its geometrical parameters.
In order to establish the relationships between the geometry of the spinning triangle and
yarn quality, the spinning triangle geometry was controlled by making use of selected
existing modifications in ring spinning process such as compact spinning and diagonal
offset spinning. Compact spinning condensed the width of the fibrous strand and
squeezed the spinning triangle while diagonal offsetting skewed it to either left and right
directions. Yarn twist variation was used to control the height of the spinning triangle.
The variations in the spinning triangle geometry when measured by using the clear rubber
roller and image processing based analysis system and correlated with the quality of
respective yarns showed high influence on yarn hairiness and yarn strength. Yarn
elongation and evenness were not significantly affected by variations in the spinning
triangle shape or geometry.
Yarn hairiness was found to be the most sensitive yarn quality parameter as it showed
broad range of variation (S3 value 66 – 443) as the geometry of the spinning triangle was
varied. Least yarn hairiness was noticed for a ‘compact and skewed’ spinning triangle
compared to regular ring spinning triangle. A compact triangle provided better control on
fibres in the roving strand by keeping them intact through pneumatic suction and locking
them effectively into the yarn structure. A skewed spinning triangle exerted improved
control on fibres lying at one edge of the spinning triangle through pre twisting of fibrous
strand. Hence, a combination of both compact and skewed triangle led to minimum
hairiness in yarns. However, the contribution of compacting was greater than the
contribution of skewing in reducing yarn hairiness probably because compacting
controlled fibres on both edges of the spinning triangle while offsetting controlled fibres
on one edge of the spinning triangle only depending on offset direction. Overall, yarn
hairiness was found to be directly influenced by the shape of the spinning triangle formed
during yarn spinning process.
Yarn strength also showed significant variation (12.9 cN/tex – 16.6 cN/tex) caused by
varying the spinning triangle geometry. However, unlike yarn hairiness, yarn strength did
not show strong statistical relationships with any of the geometrical parameters of the
spinning triangle. The variation in the yarn strength might be related to a variable that did

206
not reflect the geometrical variation in the spinning triangle. One such variable is stress
distribution among fibres at the spinning triangle zone that influenced fibre arrangement
within the yarn structure and extent of fibre migration, which caused variations in the
yarn strength. This was further supported by presence of differences in the amplitude and
frequency of geometrical parameters of the spinning triangles of a strong and a weak yarn,
as analysed by applying Fourier transformation technique.
Another interesting finding from the analysis of relationships between the spinning
triangle and yarn quality was a particular spinning triangle geometry did not result in an
overall improvement in yarn quality. For example, the spinning triangle geometry that led
to production of the least hairy yarn was not the one that also produced the strongest yarn.
The reduction in hairiness was explained on basis of improved control on edge fibres
while the improvement in yarn strength was found dependent on fibre arrangement within
the yarn structure. In addition, both spinning triangles that produced least hairy and
strongest yarns did not significantly affect the evenness and the elongation of respective
yarns. This suggests lack of dependency and relationship among various parameters of
yarn quality and improbability to achieve an ideal spinning triangle geometry that can
bring an overall improvement in yarn quality.
In order to study the yarn structure to determine the underlying reasons for difference in
yarn strength, a new combined approach based on micro computerized tomography and
digital image processing was proposed. The combined method overcame certain critical
limitations associated with existing methods of analysing yarn structure such as inability
to expose complete yarn structure, invasive operation and intensive labour and time
requirements. The results showed that the combined approach could be used to study the
complete yarn structure both in terms of cross sectional as well as longitudinal
arrangement of fibres in a non-invasive manner.
The optimization of the micro CT parameters to acquire a clear view of fibres in CT
images suggested that scanning resolution of around 1.33 micron with magnification of
110x could reveal the important features of internal yarn structure by visualizing
individual fibre arrangement. The helical type CT system was found more appropriate for
scanning textile yarn specimens compared to regular micro CT system due to its distinct
helical scanning trajectory, which was suitable for specimens with a high aspect ratio.

207
The image processing algorithms developed to analyse yarn CT data successfully
enhanced the acquired micro CT images to eliminate unwanted features and artefacts,
analysed the fibre arrangement within the yarn cross section, tracked individual fibres
along the yarn length and translated this information into various meaningful parameters
to completely represent yarn structure.
The structure of two yarn specimens, which showed highest and lowest yarn strength due
to variation in their spinning triangle geometries, when analysed using the combined
method showed significant differences, which served as a cause of variation in their
strength. Among cross sectional and longitudinal arrangement of fibres, the latter was
noticed to significantly influence yarn strength. The stronger yarns showed higher
amplitude and intensity of fibre migration, which provided necessary cohesion to the yarn
structure resulting in higher resistance towards applied tensile forces. The cross sectional
arrangement of fibres did not show clear and significant differences in terms of yarn
diameter, packing density and radial packing density. This suggests that the variations in
the spinning triangle geometry influenced the fibre arrangement within the yarns, which
then led to variations in its tensile strength. Hence, both yarn hairiness and yarn strength
were found sensitive towards the physical geometry of the spinning triangle.
6.2. Suggestions for future work
The spinning triangle and the yarn structure were investigated using two different
methods and their effects on yarn quality were explored in this study. The work and ideas
proposed in this thesis can be extended in future and possibilities of further improvements
can be divided in two categories. Firstly, the relationships of the spinning triangle and
yarn structure were drawn for a particular yarn type in terms of material and linear density
i.e. 12 tex cotton yarns. In order to generalize the outcomes of the work carried out,
various yarn specimens made up of different materials and linear densities need to be
investigated using the same techniques. The comprehensive understanding of the
relationships between the spinning triangle, yarn structure and yarn quality can then be
translated in terms of improvement in yarn quality by using spinning triangle geometry
as a control point through a certain modification in the ring spinning process. Secondly,
both newly proposed methods are in an early stage of development and may be researched

208
further to improve their accuracy, performance and application. Some suggestions to
extend the work on these lines are given as follows.
The clear rubber roller imitated the regular top drafting roller with ability to
expose spinning triangle during yarn spinning. However, the level of clarity of the
spinning triangle images acquired using clear rubber roller may be improved
further as they appeared slightly fuzzy. One reason of deterioration of clarity in
images was fibre clinging to the clear rubber roller due to its slightly sticky
surface. The intrinsic opaqueness of fibres compromised the clarity of the rollers
to some extent. Further experiments with different types of resins, optimizing
resin processing conditions, release agents and mould design can resolve this
issue. The images of the spinning triangle with higher levels of clarity will allow
studying spinning triangle at the individual fibre level. A high resolution and high
speed camera can be used with a clear rubber roller to achieve superior
information about behaviour and dynamics of the spinning triangle.
The combination of a clear rubber roller, appropriate imaging hardware and image
processing algorithms can form a clip on diagnostic tool or attachment for a ring
spinning frame. Such an attachment will not only allow studying the spinning
triangle to diagnose any quality deterioration originating at the spinning triangle
zone (such as yarn hairiness) but can also serve as an online trouble shooter for
back processing related faults. The Fourier transformation of the spinning triangle
geometrical data can reveal periodic faults in yarn preparatory process such as
occurrence of thick and thin places due to roller eccentricity. The idea may be
further extended to use the clear rubber roller with independent drive mechanism,
where its rotational speed can be varied to counter mass irregularities in the
fibrous strand in a similar way an auto leveller operates at a draw frame to even
thick and thin places in slivers.
The analysis of the spinning triangle geometry needs to be extended on more yarns
of varying linear densities to establish if the skewed and compact spinning triangle
that significantly reduced yarn hairiness, can also effectively reduce hairiness for
other yarn linear densities. Similarly, the particular shape of the spinning triangle

209
that resulted in high strength yarns needs to be generalized on other yarns
produced on the ring spinning frame with different linear densities.
The highly influenced parameter of yarn quality by variations in the spinning
triangle geometry was yarn hairiness. However, more precise controls on the
spinning triangle geometry need to be researched to quantify its exact role on yarn
hairiness. In the experiments discussed in Chapter 3, some data points were
missing due to lack of ability to control spinning triangle geometry on those
values. This resulted in a dataset that was not normally distributed and did not
allow application of further statistical analysis to quantify the relationships
between both variables. The establishing of clear quantified relationships between
yarn hairiness and the spinning triangle geometry would facilitate further
reduction of yarn hairiness.
The yarn strength was also significantly influenced by the variations in the
geometry of the spinning triangle but did not show significant correlations with
the geometrical parameters of the spinning triangle. It was assumed that the
spinning triangle controlled the fibre arrangement in yarn structure but due to
limited resources, only two yarns were studied using the micro CT and image
processing based technique. In order to draw concrete relationships between
spinning triangle geometry, yarn structure and its quality, more yarn specimens
that are produced with variations in spinning triangle geometries need to be
studied. This would allow drawing the relationships between yarn structural
parameters and the geometry of the spinning triangle, which can be exploited to
further improve yarn strength.
In order to study the structure of an array of yarn specimens, a synchrotron light
source with dedicated imaging beamlines can be used. Micro CT scanning of yarn
specimen is a cost and resource intensive process especially when conducted at
high resolution settings. The lab scale equipment can take several hours to several
days to scan just a few millimetres of yarn specimen due to limited x-rays flux.
However, Synchrotron light source can address this problem due to higher flux
and time requirement for CT scanning of yarn specimens can be greatly reduced.
210
Bibliography
1. J.E. McIntyre, 1995, Textile terms and definitions. The Textile Institute,
Manchester, UK.
2. E. Kvavadze, O. Bar-Yosef, A. Belfer-Cohen, E. Boaretto, N. Jakeli, Z.
Matskevich and T. Meshveliani, 2009, '30,000-year-old wild flax fibers', Science,
325(5946): p. 1359.
3. M. Balter, 2009, 'Clothes make the (Hu) man', Science, 325(5946): p. 1329-1329.
4. C.A. Lawrence, 2010, Advances in yarn spinning technology. Woodhead
Publishing Limited. 4-5.
5. J. Cameron, 2011, 'Iron and cloth across the Bay of Bengal: New data from Tha
Kae, central Thailand', Antiquity, 85(328): p. 559-567.
6. W.E. Morton and K.C. Yen, 1952, 'The arrangement of fibres in fibro yarns',
Journal of the Textile Institute Transactions, 43(2): p. T60-T66.
7. W.E. Morton, 2008, An Introduction to the Study of Spinning. Lightning Source
Incorporated.
8. R.A. Rusca and R.S. Brown, 1956, 'Some historical and technical aspects of
spinning', Textile Research Journal, 26(6): p. 460-469.
9. C.A. Lawrence, 2010, Advances in yarn spinning technology. Woodhead
Publishing Limited.
10. G. Dakin, 1951, 'A review of the development of cotton spinning machinery',
Journal of the Textile Institute Proceedings, 42(8): p. P457-P478.
11. 'Ring spinning: operating principle ', Rikipedia 03.2015; Available from:
http://www.rieter.com/cz/rikipedia/articles/ring-spinning/function-and-mode-of-
operation/operating-principle/.
12. 'G 36 ring spinning machine', 01.2015 [2015]; Available from:
http://www.rieter.com/en/spun-yarn-systems/products/ring-spinning/g-36-ring-
spinning-machine/.
13. W. Klein, 2008, The Rieter Manual of Spinning: Technology of Short-staple
spinning. Rieter.
14. B. J. Hamilton, W. Oxenham and K. A. Thoney, 2013, 'Textile manufacturing:
Global cost trends from a U.S. Perspective: Staple spinning', Textile World.

211
15. I.G. Schwarz, S. Kovacevic and K. Dimitrovski, 2011, 'Analysis of changes in
mechanical and deformation properties of yarn by sizing', Textile Research
Journal, 81(5): p. 545-555.
16. R. Beltran, L. Wang and X. Wang, 2007, 'A controlled experiment on yarn
hairiness and fabric pilling', Textile Research Journal, 77(3): p. 179-183.
17. 'Oxford dictionaries: Quality', 03.2015 [10.03.2015]; Available from:
http://www.oxforddictionaries.com/definition/english/quality.
18. K. Slater, 1986, 'Yarn evenness', Textile Progress, 14(3-4): p. 1-90.
19. J.G. Martindale, 1945, 'A new method of measuring the irregularity of yarns with
some observations on the origin of irregularities in worsted slivers and yarns',
Journal of the Textile Institute Transactions, 36(3): p. T35-T47.
20. J.G. Martindale, 1942, 'Irregularities in rovings and yarns', Journal of the Textile
Institute Proceedings, 33(2): p. P9-P22.
21. R. Singh, [18.05.2017]; Available from:
http://textilelearner.blogspot.com.au/2013/07/different-types-of-yarn-
defectsfaults.html.
22. R.A. McFarlane, 1950, 'Yarn irregularities and their effect on viscose rayon
fabrics', Journal of the Textile Institute Proceedings, 41(7): p. 566-589.
23. K. Srinivasan, P.H. Dastoor, P. Radhakrishnaiah and S. Jayaraman, 1992, 'FDAS:
A knowledge-based framework for analysis of defects in woven textile structures',
The Journal of The Textile Institute, 83(3): p. 431-448.
24. R. Shamey and T. Hussein, 2005, 'Critical solutions in the dyeing of cotton textile
materials', Textile Progress, 37(1-2): p. 1-84.
25. W. Bowald, 2009, 'Amsler effect yarn for authentic fabrics', Textile Magazine,
50(7): p. 24-26.
26. X. Wang, W. Huang and X.B. Huang, 1999, 'A study on the formation of yarn
hairiness', Journal of the Textile Institute, 90(1 PART IV): p. 555-569.
27. A. Barella, 1983, 'Yarn hairiness', Textile Progress, 13(1): p. 1-57.
28. J.Q. Wang, 1985, The mechanism of hairiness formation and research for the
standard hairiness testing method China Textile University, Masters thesis.
29. I. Biermann and A. Knick, 'Rieter com4® yarns', 2015 cited 10.03.2015;
Available from: www.rieter.com.
30. N. Haleem and X. Wang, 2015, 'Recent research and developments on yarn
hairiness', Textile Research Journal, 85(2): p. 211-224.
212
31. A. Barella and A. Manich, 1997, 'Yarn hairiness update', Textile Progress, 26(4):
p. 1-29.
32. A. Barella and A. Manich, 2002, 'Yarn hairiness: a further update', Textile
Progress, 31(4): p. 1-44.
33. A.B. Hill, 1965, 'The environment and disease: Association or causation?',
Proceedings of the Royal Society of Medicine, 58(5): p. 295-300.
34. D.C. Christiani, T.T. Ye, D.H. Wegman, E.A. Eisen, H.L. Dai and P.L. Lu, 1994,
'Cotton dust exposure, across-shift drop in FEV1, and five-year change in lung
function', American Journal of Respiratory and Critical Care Medicine, 150(5):
p. 1250-1255.
35. N. Bhowmick and S. Ghosh, 2008, 'Role of yarn hairiness in knitting process and
its impact on knitting room's environment', WSEAS Transactions on Environment
and Development, 4(4): p. 361-372.
36. M. Akaydin and Y. Can, 2010, 'Pilling performance and abrasion characteristics
of selected basic weft knitted fabrics', Fibres & Textiles in Eastern Europe, 18(2):
p. 79.
37. R. Beltran, L. Wang and X. Wang, 2005, 'Predicting the pilling propensity of
fabrics through artificial neural network modeling', Textile research journal,
75(7): p. 557-561.
38. A. Majumdar, A. Das, R. Alagirusamy and V.K. Kothari, 2012, Process control
in textile manufacturing. Elsevier Science.
39. A. Ghosh, 2012, Application of fuzzy logic in fiber, yarn, and fabric engineering,
in Modeling and Simulation in Fibrous Materials: Techniques and Applications.
p. 89-112.
40. L. Cheng and D.L. Adams, 1995, 'Yarn strength prediction using neural networks:
Part I: Fiber properties and yarn strength relationship', Textile Research Journal,
65(9): p. 495-500.
41. W. Zurek, I. Frydrych and S. Zakrzewski, 1987, 'A method of predicting the
strength and breaking strain of cotton yarn', Textile Research Journal, 57(8): p.
439-444.
42. R.R. Sullivan, 1942, 'A theoretical approach to the problem of yarn strength',
Journal of Applied Physics, 13(3): p. 157-167.

213
43. Y.E. Mogahzy and C. Charles, 2002, Understanding the fiber-to-yarn conversion
system Part II: Yarn characteristics, in Cotton Fiber to Yarn Manufacturing
Technology. Cotton Incorporated.
44. H. Kawakami, M. Hashimoto and F. Yamamoto, 1974, 'Theoretical estimation of
end-breakage rate in spinning', Journal of The Textile Machinery Society of Japan,
20(1): p. 1-7.
45. H.W. Krause, H.A. Soliman and J.L. Tian, 1991, 'Investigation of the strength of
the spinning triangle in ring spinning', Melliand Textilberichte, 72(7): p. 499-504.
46. A. El-Shiekh and S. Backer, 1972, 'The mechanics of fiber migration: Part I :
Theoretical analysis', Textile Research Journal, 42(3): p. 137-146.
47. D. Mahdiyeh and E. Esfandiyar, 2014, 'Review of distribution of fiber tension at
the spinning triangle', The Journal of The Textile Institute, 105(11): p. 1167-1177.
48. N.K. Jangir, 2013, 'Derive an expression of individual fibre stress in spinning
triangle', Journal of the Textile Association, 74(2): p. 65-67.
49. X. Su, W. Gao, X. Liu, C. Xie and B. Xu, 2013, 'Theoretical study of fiber tension
distribution at the spinning triangle', Textile Research Journal, 83(16): p. 1728-
1739.
50. X. Liu, X. Su and T. Wu, 2011, 'Quasistatic model for the symmetrical ring
spinning triangle', Advanced Materials Research, 331: p. 498-501.
51. X. Liu, X. Su and T. Wu, 2013, 'Effects of the horizontal offset of the ring spinning
triangle on yarn', 21(1): p. 35-40.
52. G. Lagogiannis, 'Spirality correction system (SCS)', cited 18.05.2017; Available
from: http://textilelearner.blogspot.com.au/2014/02/spirality-correction-system-
scs-of.html.
53. X. Su, W. Gao, X. Liu, C. Xie and B. Xu, 2012, 'Theoretical study of the effects
of spinning triangle horizontal offset on yarn torque', Tekstil ve Konfeksiyon,
22(4): p. 332-339.
54. T. Hua, X.M. Tao, K.P.S. Cheng and B.G. Xu, 2007, 'Effects of geometry of ring
spinning triangle on yarn torque part I: Analysis of fiber tension distribution',
Textile Research Journal, 77(11): p. 853-863.
55. T. Hua, X.M. Tao, K.P.S. Cheng and B.G. Xu, 2010, 'Effects of geometry of ring
spinning triangle on yarn torque: Part II: Distribution of fiber tension within a yarn
and its effects on yarn residual torque', Textile Research Journal, 80(2): p. 116-
123.

214
56. S.Y. Li, B.G. Xu, X.M. Tao and J. Feng, 2011, 'Numerical analysis of the
mechanical behavior of a ring-spinning triangle using the finite element method',
Textile Research Journal, 81(9): p. 959-971.
57. X. Liu, X. Su and Y. Yu, 2013, 'Effects of spinning triangle geometry on yarn
hairiness for two-strand yarn spinning', Tekstil ve Konfeksiyon, 23(4): p. 330-337.
58. X. Liu and X. Su, 2014, 'Theoretical study of fiber tension distribution at Solospun
spinning triangles', Fibers and Polymers, 15(3): p. 599-604.
59. X. Liu, X. Su and H. Zhang, 2014, 'Theoretical study of spinning triangle with
fiber concentric circular cones arrangement at front nip line', The Journal of The
Textile Institute: p. 1-6.
60. X. Liu, N. Liu and X. Su, 2014, 'Research on mechanical properties of the siro-
spinning triangle using the finite element method', Textile Research Journal,
85(4): p. 416-431.
61. J. Feng, B.G. Xu, X.M. Tao and T. Hua, 2010, 'Theoretical study of a spinning
triangle with its application in a modified ring spinning system', Textile Research
Journal, 80(14): p. 1456-1464.
62. X. Liu and X. Su, 2014, 'Theoretical study of spinning triangle with raised part',
The Journal of The Textile Institute, 105(5): p. 483-490.
63. L. Wei, S. Huang, T. Zhu and X. Su, 2015, 'Research on shape of spinning
triangles in the ring spinning system', The Journal of The Textile Institute: p. 1-
11.
64. J. Feng, B. Xu, X. Tao and T. Hua, 2010, 'Theoretical study of a spinning triangle
with its application in a modified ring spinning system', Textile Research Journal,
80(14): p. 1456-1464.
65. S. Najar, 1996, An analysis of the twist triangle in ring spinning, University of
New South Wales, PhD: p. 68-70.
66. A. Badehnoush and A. Yazdi, 2011, 'Real-time yarn evenness investigation via
evaluating spinning triangle area changes', The Journal of The Textile Institute,
103(8): p. 850-861.
67. X.C. Huang and W. Oxenham, 1994, 'Predicting End Breakage Rates in Worsted
Spinning', Textile Research Journal, 64(11): p. 619-626.
68. Y. Huh, H. Kim and J. Kim, 2008, 'Tension dynamics of the fibers in a triangular
plane flow of bundle', Fibers and Polymers, 9(3): p. 349-354.

215
69. J.W.S. Hearle, 1969, Form and fibre arrangement in twisted yarns, in Structural
mechanics of fibres, yarns and fabrics. Wiley-Interscience: New York. p. 101-
105.
70. X. Liu, X. Su and H. Zhang, 2015, 'Theoretical study of spinning triangle with
fiber concentric circular cones arrangement at front nip line', The Journal of The
Textile Institute, 106(4): p. 377-382.
71. J.W.S. Hearle, 1969, One dimensional structures: Yarn geometry, in Structural
mechanics of fibres, yarns and fabrics. Wiley-Interscience: New York. p. 65.
72. F.T. Peirce, 1947, 'Geometrical principles applicable to the design of functional
fabrics', Textile Research Journal, 17(3): p. 123-147.
73. W.E. Morton and K.C. Yen, 1952, 'Fibre arrangement in cotton slivers and laps',
Journal of the Textile Institute Transactions, 43(9): p. T463-T472.
74. W.E. Morton, 1956, 'The Arrangement of Fibers in Single Yarns', Textile
Research Journal, 26(5): p. 325-331.
75. G. Riding, 1959, 'An experimental study of the geometrical structure of single
yarns', Journal of the Textile Institute Transactions, 50(7): p. T425-T442.
76. G. Riding, 1964, 'Filament migration in single yarns', Journal of the Textile
Institute Transactions, 55(1): p. T9-T17.
77. J.W.S. Hearle, B.S. Gupta and V.B. Merchant, 1965, 'Migration of fibers in yarns:
Part I: Characterization and idealization of migration behavior', Textile Research
Journal, 35(4): p. 329-334.
78. J.W.S. Hearle and B.S. Gupta, 1965, 'Part III: A study of migration in staple fiber
rayon yarn', Textile Research Journal, 35(9): p. 788-795.
79. J.W.S. Hearle and B.S. Gupta, 1965, 'Part IV: A study of migration in a continuous
filament yam', Textile Research Journal, 35(10): p. 885-889.
80. B.S. Gupta, 1972, 'Fiber migration in staple yarns: Part III: An analysis of
migration force and the influence of the variables in yarn structure', Textile
Research Journal, 42(3): p. 181-196.
81. X. Tao, 1996, 'Mechanical properties of a migrating fiber', Textile Research
Journal, 66(12): p. 754-762.
82. B.S. Gupta and D.S. Hamby, 1969, 'Fiber migration in staple yarns: Part I: Mean
fiber position as a controlling factor and the influence of spindle speed and
spinning tension', Textile Research Journal, 39(1): p. 55-69.

216
83. H.M. El-Behery and D.H. Batavia, 1971, 'Effect of fiber initial modulus on its
migratory behavior in yarns', Textile Research Journal, 41(10): p. 812-820.
84. Y. Huh, Y.R. Kim and W.Y. Ryu, 2001, 'Three-dimensional analysis of migration
and staple yarn structure', Textile Research Journal, 71(1): p. 81-90.
85. E.R. Schwarz, 1951, 'Certain Aspects of Yarn Structure', Textile Research
Journal, 21(3): p. 125-136.
86. J.W.S. Hearle and O.N. Bose, 1966, 'The form of yarn twisting part ii:
Experimental studies', Journal of the Textile Institute Transactions, 57(7): p.
T308-T320.
87. M. Eldessouki and S. Ibrahim, 2015, 'Chan-Vese segmentation model for faster
and accurate evaluation of yarn packing density', Textile Research Journal.
88. D. Yilmaz, F. Göktepe, Ö. Göktepe and D. Kremenakova, 2007, 'Packing density
of compact yarns', Textile Research Journal, 77(9): p. 661-667.
89. U. Hussain, A. Shafqat, M. Iqbal, T. Hussain, N. Zahra, A. Sarwar, M. Muzaffar
and F. Ahmed, 2014, 'Effect of spinning variables on packing density of cotton
yarn', Indian Journal of Fibre & Textile Research, 39(4): p. 434-436.
90. S. Zheng, Z. Zou, W. Shen and L. Cheng, 2012, 'A study of the fiber distribution
in yarn cross section for vortex-spun yarn', Textile Research Journal, 82(15): p.
1579-1586.
91. X.Y. Jiang, J.L. Hu, K.P.S. Cheng and R. Postle, 2005, 'Determining the Cross-
Sectional Packing Density of Rotor Spun Yarns', Textile Research Journal, 75(3):
p. 233-239.
92. B. Neckář, S. Ishtiaque and L. Švehlová, 1988, 'Rotor yarn structure by cross-
sectional microtomy', Textile Research Journal, 58(11): p. 625-632.
93. G. Basal, 2003, The structure and properties of vortex and compact spun yarns
PhD thesis.
94. G. Basal and W. Oxenham, 2006, 'Comparison of properties and structures of
compact and conventional spun yarns', Textile Research Journal, 76(7): p. 567-
575.
95. H. Wu, M. Chen, W. Wang, K. Lai and B. Ma, 2009, 'The structure of compact
yarn', Textile Research Journal, 79(9): p. 810-814.
96. G. Basal and W. Oxenham, 2006, 'Effects of some process parameters on the
structure and properties of vortex spun yarn', Textile Research Journal, 76(6): p.
492-499.

217
97. R. Mahlouj.chi, P. Soltani and M.S. Johari, 2012, 'The effect of spinning
parameters on mechanical and physical properties of core-spun yarns produced by
the three-strand modified method (TSMM)', Fibers and Polymers, 13(7): p. 923-
927.
98. P. Soltani and M.S. Johari, 2012, 'A study on siro-, solo-, compact-, and
conventional ring-spun yarns. Part I: structural and migratory properties of the
yarns', The Journal of The Textile Institute, 103(6): p. 622-628.
99. P. Soltani and M.S. Johari, 2012, 'A study on siro-, solo-, compact-, and
conventional ring-spun yarns. Part II: yarn strength with relation to physical and
structural properties of yarns', The Journal of The Textile Institute, 103(9): p. 921-
930.
100. Y. Guo, X. Tao, B. Xu, J. Feng and S. Wang, 2011, 'Structural characteristics of
low torque and ring spun yarns', Textile Research Journal, 81(8): p. 778-790.
101. K. Yang, X.M. Tao, B.G. Xu and J. Lam, 2007, 'Structure and properties of low
twist short-staple singles ring spun yarns', Textile Research Journal, 77(9): p. 675-
685.
102. A. Ghosh, S. Das and P. Mal, A comparative study of hooks in the yarns produced
by different spinning technologies, in Autex Research Journal. 2015. p. 260.
103. S.R. Stock, 2008, Microcomputed tomography: Methodology and applications.
CRC Press.
104. T. Shinohara, J.Y. Takayama, S. Ohyama and A. Kobayashi, 2010, 'Extraction of
yarn positional information from a three-dimensional CT image of textile fabric
using yarn tracing with a filament model for structure analysis', Textile Research
Journal, 80(7): p. 623-630.
105. R.H. Gong, B. Ozgen and M. Soleimani, 2009, 'Modeling of yarn cross-section in
plain woven fabric', Textile Research Journal, 79(11): p. 1014-1020.
106. G. Harjkova, M. Barburski, S.V. Lomov, O. Kononova and I. Verpoest, 2013,
'Weft knitted loop geometry of glass and steel fibre fabrics measured with X-ray
micro-computer tomography', Textile Research Journal.
107. S. Zhao, W. Jakob, S. Marschner and K. Bala, 2011, 'Building volumetric
appearance models of fabric using micro CT imaging', ACM Transactions on
Graphics, 30(4): p. 1-10.

218
108. T. Shinohara, J. Takayama, S. Ohyama and A. Kobayashi, 2005, 'Analysis of
knitted fabric structure using 3-d voxel data of x-ray CT images', Transactions of
the Society of Instrument and Control Engineers, 41(11): p. 879-885.
109. K. Doczyova, V. Glombikova and P. Komarkova, 2014, 'Application of
microtomography in textile metrology '.
110. M. Toda and K.E. Grabowska, 2013, 'Computed microtomography in the analysis
of fiber migration in yarn', Autex Research Journal, 13(1): p. 28-32.
111. M. Toda, K.E. Grabowska and I.L. Ciesielska-Wrobel, 2015, 'Micro-CT
supporting structural analysis and modelling of ropes made of natural fibers',
Textile Research Journal, 86(12).
112. E. Yamasaki, S. Sakurada, R. Nakamura and K. Goda, 2015, 'Identification of
migration structure in a natural fiber twisted yarn and its effect on tensile strength',
Journal of the Society of Materials Science, Japan, 64(3): p. 215-222.
113. S. Şardaǧ and Ö. Özdemir, 2013, 'Effects of vacuum steaming process on the twist
liveliness of staple yarns', Fibres and Textiles in Eastern Europe, 101(5): p. 49-
53.
114. S. Altas and H. Kadoǧlu, 2012, 'Comparison of conventional ring, mechanical
compact and pneumatic compact yarn spinning systems', Journal of Engineered
Fibers and Fabrics, 7(1): p. 87-100.
115. C.A. Lawrence, 2010, Fundamentals of spun yarn technology. CRC Press.
116. M. Nikolić, Z. Stjepanovič, F. Lesjak and A. Štritof, 2003, 'Compact spinning for
improved quality of ring-spun yarns', Fibres and Textiles in Eastern Europe,
11(4): p. 30-35.
117. G.K. Tyagi, M. Bhowmick, S. Bhattacharyya and R. Kumar, 2010, 'Effect of
spinning conditions on mechanical and performance characteristics of cotton ring-
and compact-spun yarns', Indian Journal of Fibre and Textile Research, 35(1): p.
21-30.
118. M.M. Ahmad, 2009, 'Future spinning technology: Compact spinning', Pakistan
Textile Journal, 58(2): p. 52-54.
119. F. Göktepe, D. Yilmaz and Ö. Göktepe, 2006, 'A comparison of compact yarn
properties produced on different systems', Textile Research Journal, 76(3): p.
226-234.
120. A.A. Almetwally, M. Mourad, A.A. Hebeish and M.A. Ramadan, 2015,
'Comparison between physical properties of ring-spun yarn and compact yarns

219
spun from different pneumatic compacting systems', Indian Journal of Fibre &
Textile Research, 40(1): p. 43-50.
121. G.K. Tyagi, S. Bhattacharyya, M. Bhowmick and R. Narang, 2010, 'Study of
cotton ring-and compact-spun yarn fabrics: Part I –Effects of spinning variables
on hand-related characteristics', Indian Journal of Fibre and Textile Research,
35(1): p. 45-49.
122. G.K. Tyagi, S. Bhattacharyya, M. Bhowmick and R. Narang, 2010, 'Study of
cotton ring- and compact-spun yarn fabrics: Part II – Effects of spinning variables
on comfort characteristics', Indian Journal of Fibre and Textile Research, 35(2):
p. 128-133.
123. S. Altas and H. Kadoǧlu, 2013, 'Comparison of the evenness, faults and hairiness
of compact and conventional spun ring yarns', Industria Textila, 64(2): p. 65-69.
124. P. Çelik and H. Kadoǧlu, 2004, 'A research on the compact spinning for long
staple yarns', Fibres and Textiles in Eastern Europe, 12(4): p. 27-31.
125. M.F. Khurshid, K. Nadeem, M. Asad, M.A. Chaudhry and M. Amanullah, 2013,
'Comparative analysis of cotton yarn properties spun on pneumatic compact
spinning systems', Fibres and Textiles in Eastern Europe, 101(5): p. 30-34.
126. X. Liu, W. Liu, H. Zhang and X. Su, 2014, 'Research on pneumatic compact spun
yarn quality', The Journal of The Textile Institute: p. 1-12.
127. R. Loganathan, M. Mallyah and T. Ramachandran, 2009, 'Influence of D - Type
slot compact system on migration properties of the carded compact yarn', Journal
of Engineered Fibers and Fabrics, 4(4): p. 7-13.
128. R. Loganathan, C.B. Lakshmikantha and T. Ramachandran, 2009, 'Mechanical
properties and fault analysis of D-slot carded compact yarn', Indian Journal of
Fibre and Textile Research, 34(3): p. 225-230.
129. N. Mahmood, M.Q. Tusief, G. Murtaza, R. Kanwar and M.A. Khan, 2013,
'Comparative study of D-slot and straight slot in compact spinning system under
mechanical variables', Pakistan Journal of Scientific and Industrial Research
Series A: Physical Sciences, 56(1): p. 47-53.
130. H. Dou and S. Liu, 2011, 'Trajectories of fibers and analysis of yarn quality for
compact spinning with pneumatic groove', The Journal of The Textile Institute,
102(8): p. 713-718.

220
131. Z.Y. Zou, L.D. Cheng and Z.H. Hua, 2010, 'A numerical approach to simulate
fiber motion trajectory in an airflow field in compact spinning with a perforated
drum', Textile Research Journal, 80(5): p. 395-402.
132. X. Su, W. Gao, X. Liu, C. Xie and B. Xu, 2013, 'Numerical simulation of a three-
dimensional flow field in compact spinning with a perforated drum: Effect of a
guiding device', Textile Research Journal, 83(19): p. 2093-2108.
133. X. Liu, C. Xie, X. Su and H. Mei, 2013, 'Numerical studies on a three-dimensional
flow field in four-roller compact spinning with a guiding device', Fibres and
Textiles in Eastern Europe, 21(6): p. 50-57.
134. 'Sirospun', 02.2015 [02.2015]; Available from:
http://www.csiropedia.csiro.au/display/CSIROpedia/Sirospun.
135. C.A. Lawrence, 2010, Advances in yarn spinning technology. Woodhead
Publishing Limited. 223.
136. B. Johnston, 1992, Sirospun: The economic gains from sirospun technology.
Australian Bureau of Agricultural and Resource Economics.
137. H.G. Ortlek, G. Kilic and S. Bilgin, 2011, 'Comparative study on the properties of
yarns produced by modified ring spinning methods', Industria Textila, 62(3): p.
129-133.
138. M.N. Sun and K.P.S. Cheng, 2000, 'Structure and properties of cotton sirospun®
yarn', Textile Research Journal, 70(3): p. 261-268.
139. K.P.S. Cheng and C.H. Yuen, 1997, 'Siro and two-fold yarns', Research Journal
of Textile and Apparel, 1(1): p. 64-70.
140. I.C. Sharma, A. Pandey, A. Janveja and N. Sharma, 1986, 'Comparison of
properties of Siro-spun and conventional two-fold yarns and of their fabrics',
Indian Journal of Fibre & Textile Research, 11(1): p. 15-18.
141. A. Pourahmad and M.S. Johari, 2011, 'Comparison of the properties of Ring, Solo,
and Siro core‐spun yarns', The Journal of The Textile Institute, 102(6): p. 540-
547.
142. P. Çelik, T.B. Üte and H. Kadoǧlu, 2012, 'Comparative analysis of the physical
properties of the fabrics knitted with sirospun and ring spun yarns produced by
short and long staple fibres', Tekstil ve Konfeksiyon, 22(4): p. 324-331.
143. H.İ. İçoğlu and A. Kireçci, 2011, 'Investigation of the fastness properties and color
values of cotton fabrics knitted from ring spun and Sirospun® yarns', The Journal
of The Textile Institute, 102(2): p. 114-119.

221
144. Anonymous, 2000, '60,000 go solo', Textile Month, 38(December).
145. C.A. Lawrence, 2010, Advances in yarn spinning technology. Woodhead
Publishing Limited. 225-229.
146. P. Lamb and X. Wang, 2010, Advances in yarn spinning technology, C.A.
Lawrence, Editor., Woodhead Pub Ltd: Cambridge, England. p. 226.
147. 'Solospun™ - the long staple weavable singles yarn', 02.2015 [02.2015];
Available from:
http://www.csiropedia.csiro.au/pages/viewpage.action?pageId=426151.
148. P. Soltani, J. Shahrabi, S. Asadi, E. Hadavandi and M.S. Johari, 2013, 'A study on
siro, solo, compact, and conventional ring-spun yarns. Part III: modeling fiber
migration using modular adaptive neuro-fuzzy inference system', Journal of the
Textile Institute, 104(7): p. 755-765.
149. L. Chang and X. Wang, 2003, 'Comparing the hairiness of solospun and ring spun
worsted yarns', Textile Research Journal, 73(7): p. 640-644.
150. X. Wang and L. Chang, 2003, 'Reducing yarn hairiness with a modified yam path
in worsted ring spinning', Textile Research Journal, 73(4): p. 327-332.
151. G. Thilagavathi, G. Gukanathan and B. Munusamy, 2005, 'Yarn hairiness
controlled by modified yarn path in cotton ring spinning', Indian Journal of Fibre
and Textile Research, 30(3): p. 295.
152. G. Thilagavathi, D. Udayakumar, L. Sasikala and T. Kannaian, 2009, 'Yarn
hairiness controlled by various left diagonal yarn path offsets by modified bottom
roller flute blocks in ring spinning', Indian Journal of Fibre and Textile Research,
34(4): p. 328-332.
153. T. Wu, C. Xie, X. Su, X. Liu and B. Huang, 2011, 'A modified ring spinning
system with various diagonal yarn path offsets', Procedia Engineering, 18: p. 1-
6.
154. X. Su, W. Gao, T. Wu, X. Liu and Y. Zhang, Reducing yarn hairiness in a
modified ring spinning yarn path by various offsets, in Advanced Materials
Research. 2011. p. 493-497.
155. Z. Xia, H. Liu, J. Huang, S. Gu and W. Xu, 2015, 'A study on the influence of a
surface-contacting spinning strand on yarn appearance during sirofil spinning',
Textile Research Journal, 85(2): p. 128-139.

222
156. R. Murugan, C. Vigneswaran and A. Ghosh, 2011, 'Novel technique for
improving yarn quality and reducing hairiness in conventional ring frame', Indian
Journal of Fibre and Textile Research, 36(3): p. 211-214.
157. A. Alamdar‐Yazdi, 2011, 'Effects of directed movement of fibres in a twist
triangle on yarn quality', The Journal of The Textile Institute, 102(3): p. 263-271.
158. S. Aslam, P.R. Lamb and X. Wang, 2013, 'Improved incorporation of fibres for
more abrasion resistant yarns', The Journal of The Textile Institute, 104(11): p.
1221-1229.
159. S. Aslam, 2012, Improvement in yarn quality for cotton and cotton blend yarns,
Institute for Frontier Materials, Deakin University, PhD.
160. M. Kantharaj and V. Sampath, 'Study on properties of ring yarn and compact yarn
made with custom built attachment'.
161. Z. Xia, X. Wang, J. Huang, Y. Wang, W. Ye and W. Xu, 2011, 'A study of
influence of the delivery rubber roller on yarn properties', Textile Research
Journal, 81(14): p. 1477-1483.
162. Z. Xia, W. Xu, M. Zhang, W. Qiu and S. Feng, 2012, 'Reducing ring spun yarn
hairiness via spinning with a contact surface', Fibers and Polymers, 13(5): p. 670-
674.
163. W.S. Shim, H. Lee and D.W. Lee, 2013, 'The interaction of moving yarns with
stationary surfaces', Fibers and Polymers, 14(1): p. 164-171.
164. J. Czekalski, I. Krucińska, S. Kowalska and M. Puchalski, 2013, 'Effect of twist
stabilisation and dyeing on the structural and physical properties of agricultural
strings', Fibers & Textiles in Eastern Europe, 21(6): p. 39-44.
165. B.G. Xu and X.M. Tao, 2008, 'Techniques for torque modification of singles ring
spun yarns', Textile Research Journal, 78(10): p. 869-879.
166. H.B. Tang, B.G. Xu, X.M. Tao and J. Feng, 2011, 'Mathematical modeling and
numerical simulation of yarn behavior in a modified ring spinning system',
Applied Mathematical Modelling, 35(1): p. 139-151.
167. J. Feng, B. Xu and X. Tao, 2014, 'Structural analysis of finer cotton yarns
produced by conventional and modified ring spinning system', Fibers and
Polymers, 15(2): p. 396-404.
168. J. Feng, B. Xu and X. Tao, 2013, 'A comparative study of finer conventional and
modified cotton yarns and their resultant woven fabrics', Fibers and Polymers,
14(11): p. 1899-1905.

223
169. G. Ying, F. Jie, Y. Rong, W. Xungai, M. Van der Sluijs and T. Xiaoming, 2015,
'Investigation and evaluation on fine Upland cotton blend yarns made by the
modified ring spinning system', Textile Research Journal, 85(13): p. 1355-1366.
170. B. Xu, X. Tao and C.-S. Leung, 2010, 'A comparative study of cotton knitted
fabrics and garments produced by the modified low twist and conventional ring
yarns', Fibers and Polymers, 11(6): p. 899-904.
171. J. Feng, B.G. Xu and X.M. Tao, 2013, 'Systematic investigation and optimization
of fine cotton yarns produced in a modified ring spinning system using statistical
methods', Textile Research Journal, 83(3): p. 238-248.
172. T. Hua, X.M. Tao, K.P.S. Cheng, B.G. Xu and X.X. Huang, 2013, 'An
experimental study of improving fabric appearance of denim by using low torque
singles ring spun yarns', Textile Research Journal, 83(13): p. 1371-1385.
173. T. Hua, X.M. Tao and K.P.S. Cheng, 2014, 'Comparative study on appearance
and performance of garments made from low torque ring, conventional ring and
open-end spun yarn fabrics using subjective and objective evaluation methods',
Textile Research Journal.
174. X. Tao and B. Xu, Method and apparatus for manufacturing a singles ring yarn,
U.S. Patent, Editor. 2010, The Hong Kong Polytechnic University.
175. X. Tao and B. Xu, Manufacturing method and apparatus for torque-free singles
ring spun yarns. 2002, Chineese patent.
176. H. Qiu, Y. Zhang, Z. Xu and M. Ge, 2012, 'A novel method to reduce hairiness
level of ring spun yarn', Fibers and Polymers, 13(1): p. 104-109.
177. D. Yilmaz and M.R. Usal, 2011, 'A comparison of compact-jet, compact, and
conventional ring-spun yarns', Textile Research Journal, 81(5): p. 459-470.
178. D. Yilmaz and M.R. Usal, 2012, 'Effect of nozzle structural parameters on
hairiness of compact-jet yarns', Journal of Engineered Fibers & Fabrics, 7(2): p.
56-65.
179. D. Yilmaz and M.R. Usal, 2013, 'Investigation of yarn properties of modified yarn
spinning systems with air nozzle attachment', Fibres and Textiles in Eastern
Europe, 98(2): p. 43-50.
180. D. Yilmaz and M. Usal, 2012, 'The effect of different nozzle configurations on
airflow behaviour and yarn quality', World Academy of Science, Engineering and
Technology, 6(11): p. 2310-2314.

224
181. D. Yilmaz and M.R. Usal, 2013, 'Improvement in yarn hairiness by the siro-jet
spinning method', Textile Research Journal, 83(10): p. 1081-1100.
182. A.S. Nejad, S.S. Najar and H. Hasani, 2011, 'Application of air‐jet nozzle in short
staple Siro spinning system', The Journal of The Textile Institute, 102(1): p. 14-
18.
183. D. Yilmaz and M.R. Usal, 2011, 'Characterization of jet ring yarn structure and
properties', Science and Engineering of Composite Materials, 18(3): p. 127-137.
184. X. Liu and X. Su, 2013, 'Research on spun yarn qualities in a modified ring-
spinning system using airflow-twisting device', The Journal of The Textile
Institute, 104(11): p. 1258-1267.
185. X. Liu and X. Su, 2012, 'Research on Sirospun yarn torque using airflow false
twisting device', The Journal of The Textile Institute, 104(5): p. 473-480.
186. M. El Messiry, N. Hosny and A. Mohamed, 2012, 'Optimization of specific energy
consumption for compact-spun yarns', Indian Journal of Fibre and Textile
Research, 37(1): p. 34-38.
187. Y. Matsumoto, H. Kimura, T. Yamamoto, T. Matsuoka and K. Fukushima, 2009,
'Characteristics of novel triplet spun yarns made from fibers of differing fineness',
Textile Research Journal, 79(10): p. 947-952.
188. W. Xu, Z. Xia, X. Wang, J. Chen, W. Cui, W. Ye, C. Ding and X. Wang, 2011,
'Embeddable and locatable spinning', Textile Research Journal, 81(3): p. 223-229.
189. J. Chen, Q. Xu, Z. Xia and W. Xu, 2012, 'An experimental study of influence of
filament and roving location on yarn properties during embeddable and locatable
spinning', Fibers and Polymers, 13(9): p. 1196-1200.
190. Z. Xia, X. Wang, W. Ye, H.A. Eltahir and W. Xu, 2012, 'Fiber trapping
comparison of embeddable and locatable spinning with sirofil and siro core-
spinning with flute pipe air suction', Textile Research Journal, 82(12): p. 1255-
1262.
191. S. Ishtiaque, K. Sen and A. Kumar, 2013, 'New approaches to engineer the yarn
structure; Part A: For better carpet performance', Journal of Industrial Textiles,
44(4): p. 605-624.
192. A.A. Gharahaghaji, E.N. Zargar, M. Ghane and A. Hossaini, 2010, 'Cluster-spun
yarn — a new concept in composite yarn spinning', Textile Research Journal,
80(1): p. 19-24.

225
193. M. Shanbeh, B. Baghaei, S. Alidadi and A. Tabibi, 2011, 'Coating of core yarn:
An alternative method of decreasing the strip-back phenomenon of core-spun
yarns', Fibres and Textiles in Eastern Europe, 88(5): p. 28-32.
194. A. Pourahmad and M.S. Johari, 2009, 'Production of core-spun yarn by the three-
strand modified method', The Journal of The Textile Institute, 100(3): p. 275-281.
195. M.A. Naeem, W. Yu, Y.-h. Zheng and Y. He, 2014, 'Structure and spinning of
composite yarn based on multifilament spreading method using modified ring
frame: Staple core filament wrapped composite yarn', Textile Research Journal,
84(19): p. 2074-2084.
196. A.R. Moghassem and A.A. Gharehaghaji, 2009, 'Redistribution of fibers in the
structure of hollow ring spun yarn', International Journal of Engineering,
Transactions B: Applications, 22(2): p. 197-204.
197. A.A. Merati and M. Okamura, 2000, 'Hollow yarn in friction spinning. Part I:
Tensile properties of hollow yarn', Textile Research Journal, 70(12): p. 1070-
1076.
198. R.H. Yang, Y. Xue and S.Y. Wang, 2010, 'Comparison and analysis of rotor-spun
composite yarn and sirofl yarn', Fibres and Textiles in Eastern Europe, 78(1): p.
28-30.
199. F. Abdel-Hady and Y. Elmoghazy, A ring-spinning system for making yarn having
a magnetically-elevated ring. 2004, Google Patents.
200. F. Abdel-Hady, Y. El Mogahzy, S. AbuElenin and R. Abdel-Kader, 2006,
'Innovative approach to high-speed spinning using a magnetically-elevated
spinning ring', Autex Research Journal, 6(3): p. 113-121.
201. M. Hossain, A. Abdkader, C. Cherif, M. Sparing, D. Berger, G. Fuchs and L.
Schultz, 2014, 'Innovative twisting mechanism based on superconducting
technology in a ring-spinning system', Textile Research Journal, 84(8): p. 871-
880.
202. A. Abdkader, D. Berger, C. Cherif, H.O. De, L. Kuehn and L. Schultz, Spooling
and spinner device of a ring spinning frame or a ring twisting frame, and ring
spinning and ring twisting method. 2012, Google Patents.
203. M. Sparing, M. Hossain, D. Berger, A. Berger, A. Abdkader, G. Fuchs, C. Cherif
and L. Schultz, 2015, 'Superconducting magnetic bearing as twist element in
textile machines', IEEE Transactions on Applied Superconductivity, 25(3): p. 1-
4.

226
204. J.S. Qiu, Z.L. Zhong, H. Guo and X.G. Wang, Investigation of movable balloon
controller system on a ring spinning frame, in Advanced Materials Research.
2011. p. 474-479.
205. V.A. Ovchinnikov, A.N. Timokhin and Y.D. Rumyantsev, 2013, 'Study and
design of a system to automatically control the speed of a ring-spinning machine
with anticipation (base control and layerwise control)', Fibre Chemistry, 45(3): p.
184-187.
206. Technical University Liberec, Internal Standards in Recommended procedure for
preparation of samples, soft and hard sections (slices). 2004, TUL Library
207. K. Geels, 2007, Metallographic and Materialographic Specimen Preparation,
Light Microscopy, Image Analysis, and Hardness Testing. ASTM.
208. A. Razzaque, J. Saha, A.A.H. Asif and M. Rahman, 2015, 'Influence of Pin Spacer
on Yarn Quality in a Ring Frame', International Journal of Current Engineering
and Technology, 5(4): p. 2380-2382.
209. K.B. Kumar, R.V. Kumar and G. Thilagavathi, 2006, 'Effect of spacers and shore
hardness on yarn quality', The Indian Textile Journal, 117(3): p. 50-52.
210. L. Wei, S. Huang, T. Zhu and X. Su, 2016, 'Research on shape of spinning
triangles in the ring spinning system', The Journal of The Textile Institute, 107(4):
p. 420-430.
211. P.R. Lord, 2003, Handbook of yarn production: Technology, science and
economics. Taylor & Francis.
212. R.C. Gonzalez and R.E. Woods, 2011, Digital image processing. Pearson
Education.
213. B.K. Behera, 2004, 'Image-processing in textiles', Textile Progress, 35(2-4): p. 1-
193.
214. Rieter, 'The top rollers: Cover', cited 2017 [25.04]; Available from:
(http://www.rieter.com/en/rikipedia/articles/ring-spinning/structural-
configuration-of-the-machine/the-drafting-system/the-top-rollers/covers/).
215. J.B. Kennedy and A.M. Neville, 1986, Basic statistical methods for engineers and
scientists. Harper & Row.
216. A. Badehnoush and A. Alamdar Yazdi, 2011, 'Real-time yarn evenness
investigation via evaluating spinning triangle area changes', The Journal of The
Textile Institute, 103(8): p. 850-861.

227
217. Z.X. Tang, X. Wang, W.B. Fraser and L. Wang, 2004, 'An experimental
investigation of yarn tension in simulated ring spinning', Fibers and Polymers,
5(4): p. 275-279.
218. Suessen Compact Spinning, 'What is compact spinning', cited 2016 [30.08];
Available from: https://www.suessen.com/products/ring-spinning/elitercompact-
spinning-system/what-is-compact-spinning/.
219. 'The dimensions of the spinning triangle (width and length)', cited 2015;
Available from: http://www.rieter.com/en/rikipedia/articles/ring-
spinning/technological-addenda/spinning-geometry/the-spinning-triangle/the-
dimensions-of-the-spinning-trianglewidth-and-length/.
220. N. Haleem and X. Wang, 2013, 'A comparative study on yarn hairiness results
from manual test and two commercial hairiness metres', The Journal of The
Textile Institute, 104(5): p. 494-501.
221. A. Kumar, S.M. Ishtiaque and K.R. Salhotra, 2003 Compact spinning - a critical
review. in American Society of Mechanical Engineers, Textile Engineering
Division (Publication) TED.
222. W. Klein, 1900, The technology of short-staple spinning : manual of textile
technology. Manchester: The Textile Institute.
223. X.C. Huang, W. Oxenham and P. Grosberg, 1994, 'Predicting End Breakage Rates
in Worsted Spinning', Textile Research Journal, 64(12): p. 717-722.
224. N. Haleem, High speed video graphic study of a modified ring spinning system,
in Asian Textile Conference 13. 2015: Geelong, Australia. p. 175.
225. 'Troubleshooting common microtomy problems', [12.04.2017]; Available from:
https://www.labce.com/spg605401_troubleshooting_common_microtomy_probl
ems.aspx.
226. S.Y. Li, B.G. Xu, X.M. Tao and Z.R. Chi, 2015, 'An intelligent computer method
for automatic mosaic and segmentation of tracer fiber images for yarn structure
analysis', Textile Research Journal, 85(7): p. 733-750.
227. A. Primentas and C. Iype, 2001, 'The configuration of textile fibres in staple
yarns', Journal of Textile and Apparel, Technology and Management, 1(4): p. 1-
8.
228. S.H. Chiu and J.J. Liaw, 2005, 'Fiber recognition of pet/rayon composite yarn
cross-sections using voting techniques', Textile Research Journal, 75(5): p. 442-
448.

228
229. S.H. Chiu, J.Y. Chen and J.H. Lee, 1999, 'Fiber recognition and distribution
analysis of pet/rayon composite yarn cross sections using image processing
techniques', Textile Research Journal, 69(6): p. 417-422.
230. F.E. Boas and D. Fleischmann, 2012, 'CT artefacts: causes and reduction
techniques', Imaging in Medicine, 4(2): p. 229-240.
231. A. Sharir, G. Ramniceanu and V. Brumfeld, 2011, 'High resolution 3d imaging of
ex-vivo biological samples by micro CT', Journal of Visualized Experiments :
JoVE,(52): p. 2688.
232. N. Otsu, 1975, 'A threshold selection method from gray-level histograms',
Automatica, 11(285-296): p. 23-27.
233. A. Majumdar, 2016, Principles of Woven Fabric Manufacturing. CRC Press.
234. H.G. Merkus, 2009, Particle Size Measurements: Fundamentals, Practice,
Quality. Springer Netherlands.
235. E. Gregorova and W. Pabst, 2007, 'Characterization of particles and particle
systems', ICT Prague: p. 28.
236. R. Heilbronner and S. Barrett, 2013, Image analysis in earth sciences:
Microstructures and textures of earth materials. Springer Berlin Heidelberg.
237. S. Ishtiaque, P. Subramani, A. Kumar and B. Das, 2009, 'Structural and tensile
properties of ring and compact plied yarns', Indian Journal of Fibre & Textile
Research, 34: p. 213-218.
238. J.R. Dash, S.M. Ishtiaque and R. Alagirusamy, 2002, 'Properties and
processibility of compact yarns', Indian Journal of Fibre & Textile Research, 27:
p. 362-368.


![(Post Spinning Yarn Machine Operator) - CTEVTctevt.org.np/uploads/docs/2019-07-16_Post Spinning Yarn... · 2020. 1. 31. · 1 kf]i6 l:klgË ofg{ d]lzg ck/]6/ (Post Spinning Yarn Machine](https://img.dokumen.tips/doc/110x75/611952157645b175e1697525/post-spinning-yarn-machine-operator-spinning-yarn-2020-1-31-1-kfi6.jpg)