Embed Size (px)
Citation preview
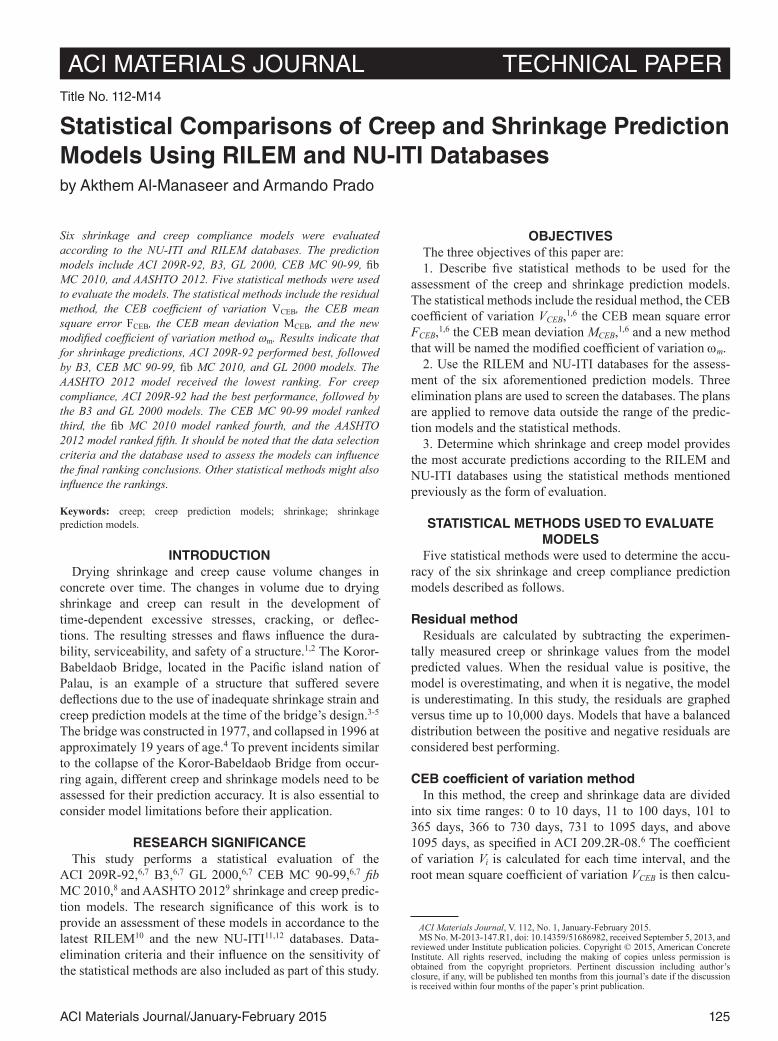
125ACI Materials Journal/January-February 2015
ACI MATERIALS JOURNAL TECHNICAL PAPER
Six shrinkage and creep compliance models were evaluated according to the NU-ITI and RILEM databases. The prediction models include ACI 209R-92, B3, GL 2000, CEB MC 90-99, fib MC 2010, and AASHTO 2012. Five statistical methods were used to evaluate the models. The statistical methods include the residual method, the CEB coefficient of variation VCEB, the CEB mean square error FCEB, the CEB mean deviation MCEB, and the new modified coefficient of variation method ωm. Results indicate that for shrinkage predictions, ACI 209R-92 performed best, followed by B3, CEB MC 90-99, fib MC 2010, and GL 2000 models. The AASHTO 2012 model received the lowest ranking. For creep compliance, ACI 209R-92 had the best performance, followed by the B3 and GL 2000 models. The CEB MC 90-99 model ranked third, the fib MC 2010 model ranked fourth, and the AASHTO 2012 model ranked fifth. It should be noted that the data selection criteria and the database used to assess the models can influence the final ranking conclusions. Other statistical methods might also influence the rankings.
Keywords: creep; creep prediction models; shrinkage; shrinkage prediction models.
INTRODUCTIONDrying shrinkage and creep cause volume changes in
concrete over time. The changes in volume due to drying shrinkage and creep can result in the development of time-dependent excessive stresses, cracking, or deflec-tions. The resulting stresses and flaws influence the dura-bility, serviceability, and safety of a structure.1,2 The Koror- Babeldaob Bridge, located in the Pacific island nation of Palau, is an example of a structure that suffered severe deflections due to the use of inadequate shrinkage strain and creep prediction models at the time of the bridge’s design.3-5 The bridge was constructed in 1977, and collapsed in 1996 at approximately 19 years of age.4 To prevent incidents similar to the collapse of the Koror-Babeldaob Bridge from occur-ring again, different creep and shrinkage models need to be assessed for their prediction accuracy. It is also essential to consider model limitations before their application.
RESEARCH SIGNIFICANCEThis study performs a statistical evaluation of the
ACI 209R-92,6,7 B3,6,7 GL 2000,6,7 CEB MC 90-99,6,7 fib MC 2010,8 and AASHTO 20129 shrinkage and creep predic-tion models. The research significance of this work is to provide an assessment of these models in accordance to the latest RILEM10 and the new NU-ITI11,12 databases. Data- elimination criteria and their influence on the sensitivity of the statistical methods are also included as part of this study.
OBJECTIVESThe three objectives of this paper are:1. Describe five statistical methods to be used for the
assessment of the creep and shrinkage prediction models. The statistical methods include the residual method, the CEB coefficient of variation VCEB,1,6 the CEB mean square error FCEB,1,6 the CEB mean deviation MCEB,1,6 and a new method that will be named the modified coefficient of variation ωm.
2. Use the RILEM and NU-ITI databases for the assess-ment of the six aforementioned prediction models. Three elimination plans are used to screen the databases. The plans are applied to remove data outside the range of the predic-tion models and the statistical methods.
3. Determine which shrinkage and creep model provides the most accurate predictions according to the RILEM and NU-ITI databases using the statistical methods mentioned previously as the form of evaluation.
STATISTICAL METHODS USED TO EVALUATE MODELS
Five statistical methods were used to determine the accu-racy of the six shrinkage and creep compliance prediction models described as follows.
Residual methodResiduals are calculated by subtracting the experimen-
tally measured creep or shrinkage values from the model predicted values. When the residual value is positive, the model is overestimating, and when it is negative, the model is underestimating. In this study, the residuals are graphed versus time up to 10,000 days. Models that have a balanced distribution between the positive and negative residuals are considered best performing.
CEB coefficient of variation methodIn this method, the creep and shrinkage data are divided
into six time ranges: 0 to 10 days, 11 to 100 days, 101 to 365 days, 366 to 730 days, 731 to 1095 days, and above 1095 days, as specified in ACI 209.2R-08.6 The coefficient of variation Vi is calculated for each time interval, and the root mean square coefficient of variation VCEB is then calcu-
Title No. 112-M14
Statistical Comparisons of Creep and Shrinkage Prediction Models Using RILEM and NU-ITI Databasesby Akthem Al-Manaseer and Armando Prado
ACI Materials Journal, V. 112, No. 1, January-February 2015.MS No. M-2013-147.R1, doi: 10.14359/51686982, received September 5, 2013, and
reviewed under Institute publication policies. Copyright © 2015, American Concrete Institute. All rights reserved, including the making of copies unless permission is obtained from the copyright proprietors. Pertinent discussion including author’s closure, if any, will be published ten months from this journal’s date if the discussion is received within four months of the paper’s print publication.

126 ACI Materials Journal/January-February 2015
lated. A lower VCEB is obtained by models that are more accurate. The VCEB can be calculated as follows
V
NVCEB i
i
N
= ∑=
1 2
1
(1)
V
y nY yi
i
ij ijj
n
=−
−∑=
1 1
12
1( ) (2)
y
nyi ij
j
n
= ∑=
1
1( ) (3)
where n is the number of data points in data set i; N is the total number of data sets considered; Vi is the coefficient of variation for interval i; VCEB is the root mean square coeffi-cient of variation; yi is the mean shrinkage strain or creep compliance of data set i; yij is the observed shrinkage strain or creep compliance at time j of interval i; and Yij is the predicted shrinkage strain or creep compliance value for the j-th data point in data set i.
CEB mean square error methodThe CEB mean square error FCEB computes an overall
error of the predicted values. In this statistical method, the percent difference between calculated and observed data points fj is calculated for each shrinkage and creep compli-ance prediction. The mean square error Fi is then calculated for each specified time range by combining all the fj values in that range. Fi for shrinkage strain and creep compliance is calculated for the following six time ranges: 0 to 10 days, 11 to 100 days, 101 to 365 days, 366 to 730 days, 731 to 1095 days, and above 1095 days, as specified in ACI 209.2R-08.6 FCEB is then calculated by using the Fi values from each interval. Models that perform better produce lower FCEB values. The method used to calculate FCEB is as follows
F
NFCEB i
i
N
= ∑=
1 2
1
(4)
F
nfi j
j
n
=−
∑=
1
12
1 (5)
f
Y y
yj
ij ij
ij
=−
×( )
100 (6)
where yij is observed shrinkage strain or creep compliance at time j of interval i; Yij is predicted shrinkage strain or creep compliance value for the j-th data point in data set i; fj is percent difference between calculated and observed data point j; FCEB is mean square error; n is the number of data points in data set i; and N is the total number of data sets considered.
CEB mean deviation methodThis method is used to indicate the systematic overes-
timation or underestimation of a given prediction model. The CEB mean deviation MCEB method first computes the average ratio of calculated to experimental values Mi for each shrinkage strain or creep compliance time interval. The calculated Mi values for the different time intervals are then combined to compute the overall MCEB. Models that perform better in this statistical method produce an MCEB value closest to 1. In this study, Mi is calculated for the following six time ranges: 0 to 10 days, 11 to 100 days, 101 to 365 days, 366 to 730 days, 731 to 1095 days, and above 1095 days as speci-fied in ACI 209.2R-08.6 The method used to calculate MCEB is as follows
M
M
NCEB
ii
N
=∑=1 (7)
M
n
Y
yi
ij
ijj
n
= ∑=
1
1 (8)
where yij is the observed shrinkage strain or creep compli-ance at time j of interval i; Yij is the predicted shrinkage strain or creep compliance value for the j-th data point in data set i; Mi is the ratio of calculated to experimental values in time range i; MCEB is the mean deviation; n is the number of data points in data set i; and N is total number of data sets considered.
Modified coefficient of variation methodThe modified coefficient of variation ωm is a new approach
used for the first time in this study. The ωm method uses a similar concept to the coefficient of variation of regression errors method described by Bažant and Li.3 In this method, however, the coefficient of variation is calculated based on populations (or groups of data) as opposed to individual points. In addition, the ωm method applies different statistical weights to different populations of data. The new method was developed to emphasize the comparison of the models at longer ages of loading and drying. Because the analyzed databases contain significantly fewer measurements for extensive ages of loading and drying, higher statistical weights are assigned to boxes having fewer measurements.
In the ωm method, data is divided using the procedures described as follows in an attempt to minimize the amount of boxes (or groups) with boundary ranges that do not coincide with the properties of the data (that is, empty boxes). Empty boxes of data provide no statistical value for the analysis. Therefore, empty boxes need to be reduced or assigned zero weight when they appear to exclude them from the analysis.
The shrinkage strain data is divided into boxes based on the length of drying and effective thickness of the specimen. Shrinkage strain data is divided into 16 boxes in this study. The boxes are made by dividing the duration of drying t-tc into four intervals, and then dividing each of those intervals into four subintervals based on the effective thickness of the specimen. The duration of drying intervals are the following:

127ACI Materials Journal/January-February 2015
0 to 10 days, 11 to 100 days, 101 to 1000 days, and 1001 to 10,000 days. The effective specimen thickness D is divided into the following intervals: 0 to less than 11 mm (0 to less than 0.4 in.); 11 to less than 21 mm (0.4 to less than 0.8 in.); 21 to less than 31 mm (0.8 to less than 1.2 in.); and above or equal to 31 mm (≥ 1.2 in.). For creep compliance, the data is divided into 20 boxes based on load duration and relative humidity. The boxes are made by dividing the age of loading t-t′ into four intervals. Each of those boxes is then subdi-vided into five subintervals based on the relative humidity. In this study, the age of loading is divided into the following intervals: 0 to 10 days, 11 to 100 days, 101 to 1000 days, and 1001 to 10,000 days. The relative humidity is divided into the following intervals: 0 to 20%, 21 to 40%, 41 to 60%, 61 to 80%, and 81 to 100%.
In this method, a modified standard error sm is first calcu-lated using the groupings of data mentioned previously. Next, the weighted mean of observed shrinkage or creep compliance measurements yw is calculated by combining the average measurements of each box of data. The ωm is then computed by comparing the modified standard error to the weighted mean. Prediction models that perform better produce a lower ωm. The ωm can be calculated as follows
ωm
m
w
s
y=
(9)
s w
mY ym i
i
N
iij ij
j
mi
= ∑ ⋅ −∑= =1
2
1
1( ) (10)
y w
myw i
iij
j
m
i
N i
= ⋅ ∑∑==
1
11 (11)
w
m ww
mi
i ii
N
= = ∑=
1 1
1,
(12)
where ωm is the modified coefficient of variation; sm is the modified standard error; yw is weighted mean of observed shrinkage or creep compliance measurements; mi is the number of data points in data set i; N is the total number of data sets or boxes considered; wi is the statistical weight assigned to box or data set i; yij is the observed shrinkage strain or creep compliance value at time j-th of interval i; and Yij is the predicted shrinkage strain or creep compliance value for the j-th data point in data set i.
DATABASES USED FOR ANALYSIS AND DATA SELECTION CRITERIA
The RILEM10 and NU-ITI11,12 databases were used to evaluate the accuracy of the shrinkage and creep prediction models. The RILEM database is composed of 426 shrinkage data sets (that is, 7153 experimental measurements) and 716 creep data sets (that is, 13,769 experimental measure-ments).10 The NU-ITI database consists of 490 shrinkage data sets (that is, 8326 experimental measurements)
and 621 creep data sets (that is, 11,821 experimental measurements).12
Data sets in the RILEM database having a relative humidity of 101% imply that those specimens were sealed during testing.10 The NU-ITI database assigns a relative humidity of 99% to specimens that were sealed during testing.11,12 In the prediction models, sealed testing conditions are defined by different relative humidity input values. A value of 100% is assigned to those specimens when using the ACI 209R-92, AASHTO 2012,9 and fib MC 20108 models. A value of 99% relative humidity is assigned when using the CEB MC 90-99 model; 98% is assigned when using the B3 model; and 96% is assigned when using the GL 2000 model.
In this study, different data point elimination scenarios will be used to examine the sensitivity of the statistical methods. The data elimination will be performed in three different plans: Plan A, Plan B, and Plan C. Table 1 summa-rizes the number of data points used for each prediction model according to each plan.
Plan APlan A applies general elimination criteria pertaining to
all models and specific elimination criteria pertaining to each model. The general elimination criteria are described as follows:
1. Experimental measurements of zero creep or shrinkage are excluded because such measurements lead to an error when calculating MCEB and FCEB. In both cases, it is required to divide by the experimental value, and dividing by zero causes an error;
2. Repeated data measurements and swelling data points (positive shrinkage measurements) are also omitted for the purpose of this study; and
3. Values of the elastic modulus of concrete at 28 days Ecm28 and compressive strength at 28 days fcm28 are provided in the database for several specimens. A significant number of specimens, however, do not contain Ecm28. Therefore, in this study, Ecm28 will be derived from the experimental fcm28 for each model using the procedure described in the corre-sponding model.6-9 Data missing fcm28 values will not be used in this study.
For the specific elimination criteria, all data from the RILEM and NU-ITI databases was used. Elimination, however, was performed as described in Table 2 when avail-able data was not adequate to perform a complete analysis.
The selection to use general and specific elimination criteria will allow the incorporation of a wider range of data than what is permitted by the model limitations, as summa-rized in Table 3.
Plan BPlan B is the implementation of Plan A, but excludes data
with fj2 (square of percent difference between calculated and
observed measurements) that are greater than 50. Data with fj
2 greater than 50 are excluded because the percent differ-ence between calculated and observed data points (that is, (calculated – observed)/observed) is potentially large for data points in which the observed measurement is signifi-cantly smaller than the calculated value. Large values of fj
2
128 ACI Materials Journal/January-February 2015
generate a higher mean square error that does not necessarily represent the evaluated model’s predicting performance. Eliminating data that produce an fj
2 greater than 50 is essen-tial because some prediction models do not have stringent elimination criteria, such as the CEB models. Therefore, this filtering process is necessary.
Plan CPlan C is the third method of analysis which applies Plans
A and B in addition to excluding common outliers found in the residual versus time figures. Outliers are defined as data sets that produce relatively large residuals that do not follow the same trend as the rest of the data in the residual- versus-time graphs. Creep or shrinkage data sets that consis-tently appear as outliers in all the models are known as common outliers, and these are removed for the purpose of Plan C.
DISCUSSION OF RESULTSThe following section will discuss the prediction accuracy
of the shrinkage and creep prediction models according to the five statistical methods described previously. A discus-sion will be provided for the three data elimination plans.
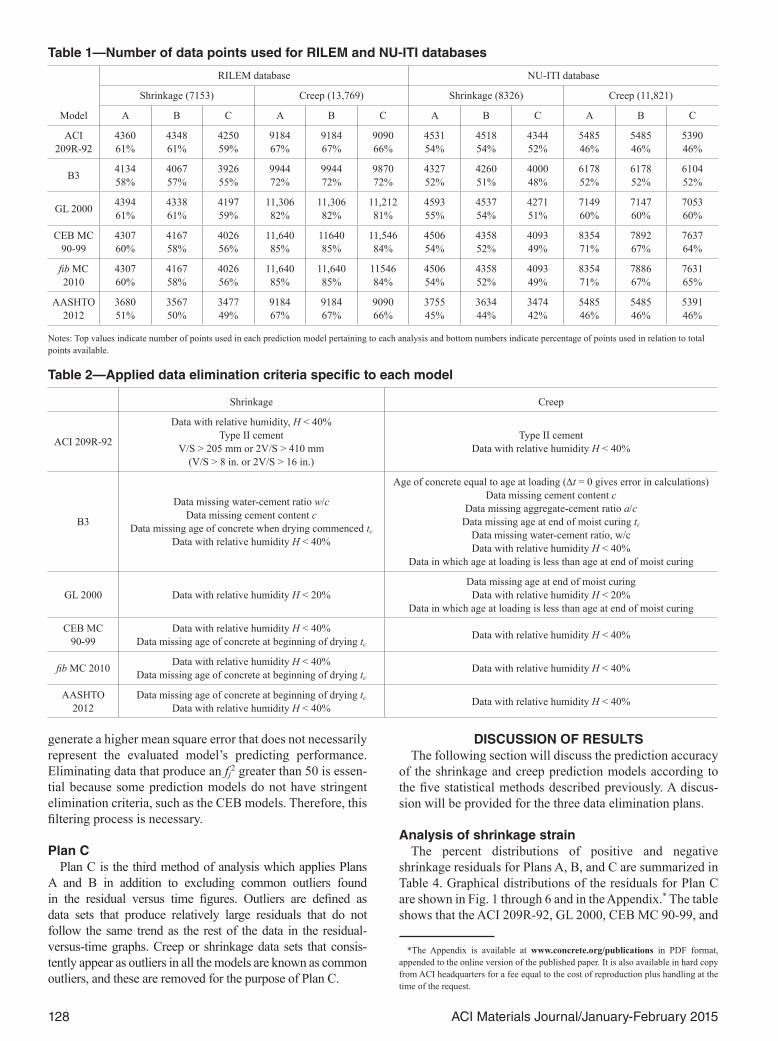
Analysis of shrinkage strainThe percent distributions of positive and negative
shrinkage residuals for Plans A, B, and C are summarized in Table 4. Graphical distributions of the residuals for Plan C are shown in Fig. 1 through 6 and in the Appendix.* The table shows that the ACI 209R-92, GL 2000, CEB MC 90-99, and
*The Appendix is available at www.concrete.org/publications in PDF format, appended to the online version of the published paper. It is also available in hard copy from ACI headquarters for a fee equal to the cost of reproduction plus handling at the time of the request.
Table 1—Number of data points used for RILEM and NU-ITI databases
Model
RILEM database NU-ITI database
Shrinkage (7153) Creep (13,769) Shrinkage (8326) Creep (11,821)
A B C A B C A B C A B C
ACI 209R-92
436061%
434861%
425059%
918467%
918467%
909066%
453154%
451854%
434452%
548546%
548546%
539046%
B3 413458%
406757%
392655%
994472%
994472%
987072%
432752%
426051%
400048%
617852%
617852%
610452%
GL 2000 439461%
433861%
419759%
11,30682%
11,30682%
11,21281%
459355%
453754%
427151%
714960%
714760%
705360%
CEB MC 90-99
430760%
416758%
402656%
11,64085%
1164085%
11,54684%
450654%
435852%
409349%
835471%
789267%
763764%
fib MC 2010
430760%
416758%
402656%
11,64085%
11,64085%
1154684%
450654%
435852%
409349%
835471%
788667%
763165%
AASHTO 2012
368051%
356750%
347749%
918467%
918467%
909066%
375545%
363444%
347442%
548546%
548546%
539146%
Notes: Top values indicate number of points used in each prediction model pertaining to each analysis and bottom numbers indicate percentage of points used in relation to total points available.
Table 2—Applied data elimination criteria specific to each model
Shrinkage Creep
ACI 209R-92
Data with relative humidity, H < 40%Type II cement
V/S > 205 mm or 2V/S > 410 mm(V/S > 8 in. or 2V/S > 16 in.)
Type II cementData with relative humidity H < 40%
B3
Data missing water-cement ratio w/cData missing cement content c
Data missing age of concrete when drying commenced tc
Data with relative humidity H < 40%
Age of concrete equal to age at loading (Δt = 0 gives error in calculations)Data missing cement content c
Data missing aggregate-cement ratio a/cData missing age at end of moist curing tc
Data missing water-cement ratio, w/cData with relative humidity H < 40%
Data in which age at loading is less than age at end of moist curing
GL 2000 Data with relative humidity H < 20%Data missing age at end of moist curing
Data with relative humidity H < 20%Data in which age at loading is less than age at end of moist curing
CEB MC 90-99
Data with relative humidity H < 40%Data missing age of concrete at beginning of drying tc
Data with relative humidity H < 40%
fib MC 2010 Data with relative humidity H < 40%Data missing age of concrete at beginning of drying tc
Data with relative humidity H < 40%
AASHTO 2012
Data missing age of concrete at beginning of drying tc
Data with relative humidity H < 40% Data with relative humidity H < 40%
129ACI Materials Journal/January-February 2015
Table 3—Summary of model limitations
ACI 209R-92 B3 GL 2000 CEB MC90-99 fib MC 2010 AASHTO 2012
fcm28*, MPa (psi) — 17 to 70
(2500 to 10,000)16 to 82
(2320 to 11,900)15 to 120
(2175 to 17,400)20 to 130
(2900 to 18,850)16 to 70
(2320 to 10,000)
a/c — 2.5 to 13.5 — — — —
Cement content, kg/m3 (lb/yd3) — 160 to 720(270 to 1215) — — — —
w/c — 0.35 to 0.85 0.4 to 0.6 — — 0.45 to 0.58
Relative humidity,% 40 to 100 40 to 100 20 to 100 40 to 100 40 to 100 40 to 100
Type of cement European (U.S.) R or RS (I or III) R,SL,RS (I,II,III) R,SL,RS (I,II,III) R,SL,RS (I,II,III) R,SL,RS (I,II,III) R or RS (I or III)
tc† (moist cured) ≥ 1 day ≥ 1 day ≥ 1 day — < 14 days > 7 day
tc† (steam cured) ≥ 1 day — ≥ 1 day — — —
to‡ ≥ 7 days to ≥ tc to ≥ tc ≥ 1 day > 1 day ≥ 1 day > 7 day
*fcm28 is concrete compressive strength at 28 days.†tc is age of concrete at beginning of drying.‡to is age of concrete at loading.
Table 4—Distribution of residuals for creep compliance and shrinkage models for 0 to 10,000 days
Model
RILEM NU-ITI
Shrinkage Creep Shrinkage Creep
A B C A B C A B C A B C
ACI 209R-92Overestimate, % 54 54 55 45 45 46 53 53 55 33 33 33
Underestimate, % 46 46 45 55 55 54 47 47 45 67 67 67
B3Overestimate, % 36 35 36 57 57 57 34 33 35 40 40 40
Underestimate, % 64 65 64 43 43 43 66 67 65 60 60 60
GL 2000Overestimate, % 44 43 45 59 59 60 42 42 44 46 46 47
Underestimate, % 56 57 55 41 41 40 58 58 56 54 54 53
CEB MC 90-99Overestimate, % 53 52 53 37 37 37 52 50 53 33 29 30
Underestimate, % 47 48 47 63 63 63 48 50 47 67 71 70
fib MC 2010Overestimate, % 53 52 53 35 35 35 52 50 53 28 24 25
Underestimate, % 47 48 47 65 65 65 48 50 47 72 76 75
AASHTO 2012Overestimate, % 37 35 35 36 36 36 37 35 36 33 33 33
Underestimate, % 63 65 65 64 64 64 63 65 64 67 67 67
Note: residuals distributed closest to 50% positive and 50% negative perform better.
Fig. 1—NU-ITI shrinkage strain residuals for ACI 209R-92 model for 0 to 10,000 days.
Fig. 2—RILEM shrinkage strain residuals for ACI 209R-92 model for 0 to 10,000 days.

130 ACI Materials Journal/January-February 2015
fib MC 2010 models demonstrate more balanced distribu-tion of residuals. In contrast, the B3 and AASHTO 2012 models tend to underestimate the experimental data. Table 4 also shows that the residual distribution is not significantly affected when elimination of data is conducted according to Plans B and C.
Tables 5 and 6 summarize the statistical values of FCEB, MCEB, VCEB, and ωm for the shrinkage prediction models according to the NU-ITI and RILEM databases. FCEB, MCEB, VCEB, and ωm are compared in accordance to Plans A, B, and C. Table 5 shows that elimination of data with respect to Plans B or C significantly improves the FCEB and MCEB
values when compared with Plan A. The VCEB values are not greatly affected in all three plans. Table 6 shows that the elimination of data according to Plans A, B, or C has less influence on the predicted value of ωm.
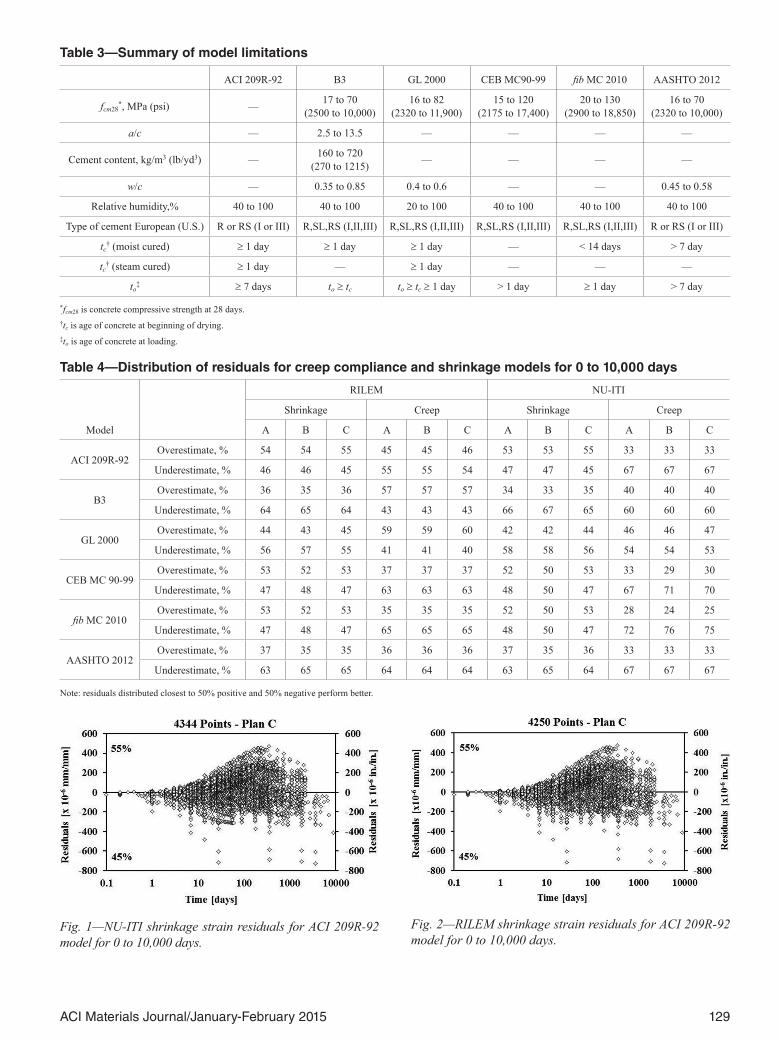
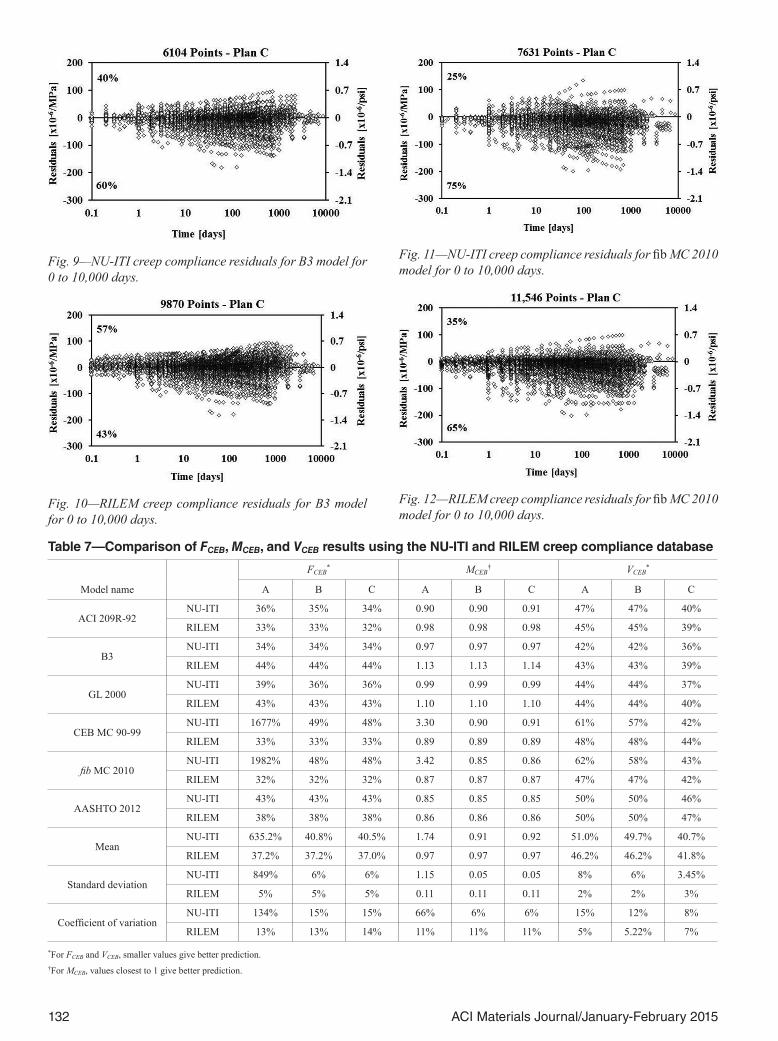
Analysis of creep complianceThe creep compliance residuals for the six prediction
models are shown in Table 4 for Plans A, B, and C. Graph-ical distributions of the residuals for Plan C are shown in Fig. 7 through 12 and in the Appendix. The table shows that for all plans, the ACI 209R-92 and B3 creep compliance prediction models tend to underestimate when analyzed with
Fig. 3—NU-ITI shrinkage strain residuals for B3 model for 0 to 10,000 days.
Fig. 4—RILEM shrinkage strain residuals for B3 model for 0 to 10,000 days.
Fig. 5—NU-ITI shrinkage strain residuals for CEB MC 90-99/ fib MC 2010 model for 0 to 10,000 days.
Fig. 6—RILEM shrinkage strain residuals for CEB MC 90-99/ fib MC 2010 model for 0 to 10,000 days.
Fig. 7—NU-ITI creep compliance residuals for ACI 209R-92 model for 0 to 10,000 days.
Fig. 8—RILEM creep compliance residuals for ACI 209R-92 model for 0 to 10,000 days.

131ACI Materials Journal/January-February 2015
the NU-ITI database, but show more balance when analyzed with the RILEM database. The GL 2000 model appears to be balanced when analyzed with the NU-ITI database, but it tends to overestimate predictions when analyzed with the RILEM database. The CEB MC 90-99, fib MC 2010, and the AASHTO 2012 models consistently underestimate the experimentally measured values in both databases. In summary, different databases can potentially influence a compliance prediction model’s tendency to overestimate or underestimate the experimental measurements. The behavior
is most likely a result of the diversity of concrete specimens and experimental conditions contained within each database.
Table 7 shows the FCEB, MCEB, and VCEB values for creep compliance using the NU-ITI and RILEM databases. The table shows that when the NU-ITI database is used for the analysis, the FCEB and MCEB statistical parameters for the fib MC 2010 and CEB MC 90-99 prediction models are significantly influenced by the application of Plans B and C compared with Plan A. As a result, the means and stan-dard deviations of FCEB and MCEB for the prediction models notably reduce from Plan A to B when analyzed with the
Table 5—Comparison of FCEB, MCEB, and VCEB results using the NU-ITI and RILEM shrinkage database
Model name
FCEB* MCEB
† VCEB*
A B C A B C A B C
ACI 209R-92NU-ITI 100% 72% 71% 1.07 1.05 1.07 50% 50% 45%
RILEM 102% 73% 72% 1.05 1.03 1.04 47% 47% 45%
B3NU-ITI 411% 81% 81% 1.27 1.00 1.04 48% 47% 39%
RILEM 421% 81% 81% 1.31 1.03 1.04 43% 41% 39%
GL 2000NU-ITI 312% 86% 85% 1.22 1.02 1.06 53% 52% 46%
RILEM 319% 86% 85% 1.27 1.05 1.07 49% 48% 46%
CEB MC 90-99NU-ITI 994% 101% 103% 2.01 1.18 1.23 54% 50% 44%
RILEM 1015% 102% 103% 2.05 1.21 1.23 49% 45% 44%
fib MC 2010NU-ITI 994% 101% 103% 2.01 1.18 1.23 54% 50% 44%
RILEM 1015% 102% 103% 2.05 1.21 1.23 49% 45% 44%
AASHTO 2012NU-ITI 2343% 122% 113% 2.07 1.12 1.13 78% 64% 66%
RILEM 601% 112% 113% 1.70 1.12 1.13 78% 66% 66%
MeanNU-ITI 859.0% 93.8% 92.7% 1.61 1.09 1.13 56.2% 52.2% 47.3%
RILEM 578.8% 92.7% 92.8% 1.57 1.11 1.12 52.5% 48.7% 47.3%
Standard deviationNU-ITI 743% 16% 15% 0.43 0.07 0.08 10% 6% 9%
RILEM 342% 14% 14% 0.39 0.08 0.08 12% 8% 8.63%
Coefficient of variationNU-ITI 87% 17% 16% 27% 7% 7% 18% 11% 18%
RILEM 59% 15% 15% 25% 7% 7% 22% 17% 18%
*FCEB and VCEB are smaller values give better prediction.†MCEB are values closest to 1 give better prediction.
Table 6—Comparison of ωm results using the NU-ITI and RILEM database
Model name
NU-ITI RILEM
Shrinkage Creep compliance Shrinkage Creep compliance
A B C A B C A B C A B C
ACI 209R-92 71% 71% 71% 39% 39% 37% 71% 71% 71% 41% 41% 40%
B3 79% 78% 78% 31% 31% 30% 78% 77% 77% 46% 46% 45%
GL 2000 88% 87% 87% 36% 36% 35% 87% 87% 87% 45% 45% 44%
CEB MC 90-99 76% 74% 74% 39% 35% 31% 76% 74% 74% 38% 38% 37%
fib MC 2010 76% 74% 74% 41% 36% 32% 76% 74% 74% 38% 38% 36%
AASHTO 2012 120% 104% 104% 44% 44% 44% 120% 104% 104% 46% 46% 45%
Mean 85% 81% 81% 38% 37% 35% 85% 81% 81% 42% 42% 41%
Standard deviation 16% 11% 11% 4% 4% 5% 17% 11% 11% 3% 3% 4%
Coefficient of variation 19% 14% 14% 11% 11% 13% 20% 14% 14% 8% 8% 9%
Note: Smaller ωm values give better predictions.
132 ACI Materials Journal/January-February 2015
Fig. 9—NU-ITI creep compliance residuals for B3 model for 0 to 10,000 days.
Fig. 10—RILEM creep compliance residuals for B3 model for 0 to 10,000 days.
Fig. 11—NU-ITI creep compliance residuals for fib MC 2010 model for 0 to 10,000 days.
Fig. 12—RILEM creep compliance residuals for fib MC 2010 model for 0 to 10,000 days.
Table 7—Comparison of FCEB, MCEB, and VCEB results using the NU-ITI and RILEM creep compliance database
Model name
FCEB* MCEB
† VCEB*
A B C A B C A B C
ACI 209R-92NU-ITI 36% 35% 34% 0.90 0.90 0.91 47% 47% 40%
RILEM 33% 33% 32% 0.98 0.98 0.98 45% 45% 39%
B3NU-ITI 34% 34% 34% 0.97 0.97 0.97 42% 42% 36%
RILEM 44% 44% 44% 1.13 1.13 1.14 43% 43% 39%
GL 2000NU-ITI 39% 36% 36% 0.99 0.99 0.99 44% 44% 37%
RILEM 43% 43% 43% 1.10 1.10 1.10 44% 44% 40%
CEB MC 90-99NU-ITI 1677% 49% 48% 3.30 0.90 0.91 61% 57% 42%
RILEM 33% 33% 33% 0.89 0.89 0.89 48% 48% 44%
fib MC 2010NU-ITI 1982% 48% 48% 3.42 0.85 0.86 62% 58% 43%
RILEM 32% 32% 32% 0.87 0.87 0.87 47% 47% 42%
AASHTO 2012NU-ITI 43% 43% 43% 0.85 0.85 0.85 50% 50% 46%
RILEM 38% 38% 38% 0.86 0.86 0.86 50% 50% 47%
MeanNU-ITI 635.2% 40.8% 40.5% 1.74 0.91 0.92 51.0% 49.7% 40.7%
RILEM 37.2% 37.2% 37.0% 0.97 0.97 0.97 46.2% 46.2% 41.8%
Standard deviationNU-ITI 849% 6% 6% 1.15 0.05 0.05 8% 6% 3.45%
RILEM 5% 5% 5% 0.11 0.11 0.11 2% 2% 3%
Coefficient of variationNU-ITI 134% 15% 15% 66% 6% 6% 15% 12% 8%
RILEM 13% 13% 14% 11% 11% 11% 5% 5.22% 7%
*For FCEB and VCEB, smaller values give better prediction.†For MCEB, values closest to 1 give better prediction.

133ACI Materials Journal/January-February 2015
NU-ITI database. In contrast, the RILEM database does not show significant change in the results of VCEB, FCEB, or MCEB for all three plans. The reason why the CEB MC 90-99 and fib MC 2010 models produce relatively large errors when analyzed with the NU-ITI database, but produce more accu-rate predictions with the RILEM database, is because the CEB models are calibrated using the RILEM database. The ωm, as shown in Table 6, did not show significant change in either database for the creep compliance prediction models with the application of Plans B or C when compared with Plan A. All statistical methods are significant for the eval-uation of the models, regardless of their sensitivity. Sensi-tive statistical methods assist in finding potentially flawed data, and they demonstrate the effects of removing such information. Statistical methods that are not significantly influenced by the elimination of data are useful because the overall comparison of the models is more consistent despite the appearance of conflicting data. Tables 6 and 7 also show that the selection of the statistical approach is sensitive to the database used for the creep compliance analysis.
RANKING METHODA rating scale of 1 to 5 is used to rank the shrinkage
prediction models in Table 8, where 1 is assigned to best- performing models. For creep compliance, a rating scale of 1 to 6 is used in Table 9 to assess the prediction models, where 1 is also assigned to the best performing models. The two rating scales differ because for shrinkage predic-tion, the CEB MC 90-99 and fib MC 2010 models provide similar predictions that result in only five distinct models, whereas for creep, there are six distinct models. Each of the models is first rated according to the NU-ITI and RILEM databases, respectively. The ratings obtained by each model in each statistical method are then added together for each database, respectively. The total points obtained per model for the NU-ITI and RILEM databases are then averaged together, and an overall rating is performed on the models. Models that obtain a smaller average receive a better rating. In this study, the overall rating of the models was performed on Plan C, as it is the plan that will give the most accurate assessment of all models.
Table 8 summarizes the results and ratings of the shrinkage prediction models. The data shows that the ACI 209R-92 shrinkage prediction model demonstrated the best perfor-
Table 8—Summary of results and rating for shrinkage strain prediction models
Time range
ACI 209R-92 B3 GL 2000 CEB MC 90-99 fib MC 2010 AASHTO 2012
NU* RI* NU RI NU RI NU RI NU RI NU RI
1—Distribution of residuals†
Positive range 0 to 10,000 days 55% 55% 35% 36% 44% 45% 53% 53% 53% 53% 36% 35%
Negative range 0 to 10,000 days 45% 45% 65% 64% 56% 55% 47% 47% 47% 47% 64% 65%
Away from 50-50 ±5 ±5 ±15 ±14 ±6 ±5 ±3 ±3 ±3 ±3 ±14 ±15
Rating 1-5|| 2 2 5 3 3 2 1 1 1 1 4 4
2—RMS coefficient of variation VCEB‡, %
Six time ranges 45% 45% 39% 39% 46% 46% 44% 44% 44% 44% 66% 66%
Rating 1-5|| 3 3 1 1 4 4 2 2 2 2 5 5
3—Mean square error FCEB‡, %
Six time ranges 71% 72% 81% 81% 85% 85% 103% 103% 103% 103% 113% 113%
Rating 1-5|| 1 1 2 2 3 3 4 4 4 4 5 5
4—Mean deviation MCEB§
Six time ranges 1.07 1.04 1.04 1.04 1.06 1.07 1.23 1.23 1.23 1.23 1.13 1.13
Rating 1-5|| 3 1 1 1 2 2 5 4 5 4 4 3
5—Modified coefficient of variation ωm‡, %
Six time ranges 71% 71% 78% 77% 87% 86% 74% 74% 74% 74% 104% 104%
Rating 1-5|| 1 1 3 3 4 4 2 2 2 2 5 5
Added model rating (1 + 2 + 3 + 4 + 5) 10 8 12 10 16 15 14 13 14 13 23 22
Average of NU and RI model rating sum 9 11 15.5 13.5 13.5 22.5
Overall ranking 1 2 4 3 3 5
*NU is NU-ITI database and RI is RILEM database.†Distribution of residuals: residuals distributed closest to 50% positive and 50% negative perform better.‡For VCEB, FCEB, and ωm, smaller values receive better rating.§For MCEB, values closest to 1 receive better rating.||Rating 1-5: models are rated according to the NU-ITI and RILEM databases, respectively (1 = best performing, 5 = worst performing).
134 ACI Materials Journal/January-February 2015
mance, followed by the B3 as second. The CEB MC 90-99 and fib MC 2010 models ranked third. The GL 2000 and AASHTO 2012 models ranked fourth and fifth, respec-tively. All shrinkage prediction models perform better when analyzed with the RILEM database.
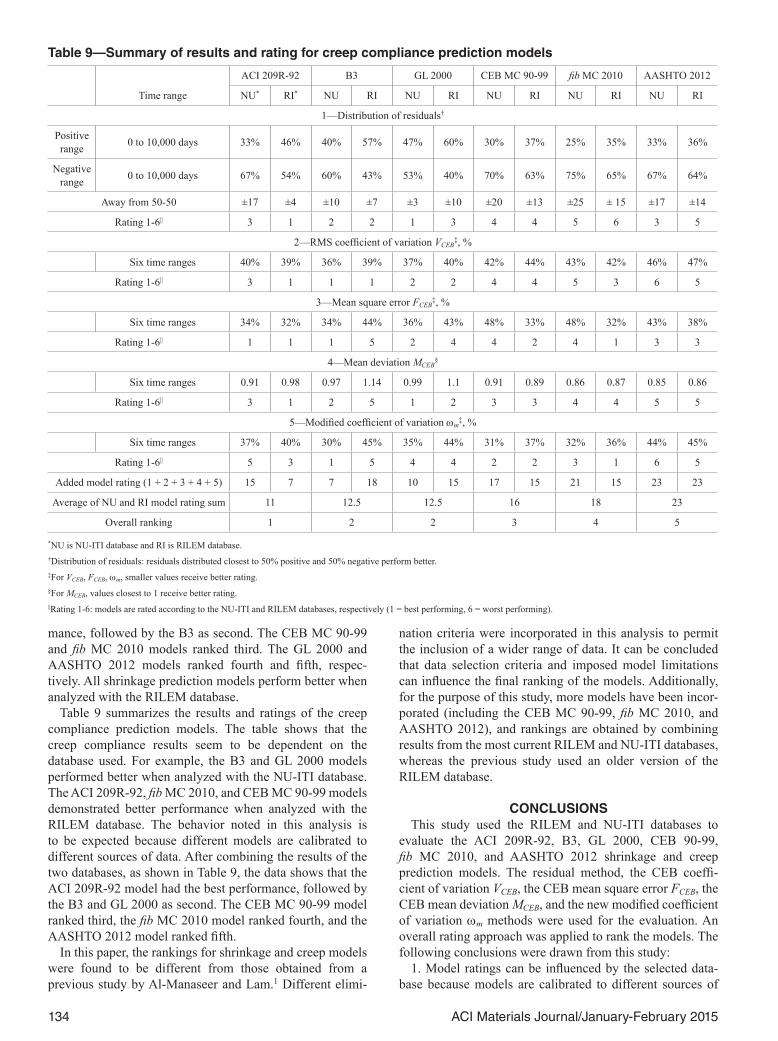
Table 9 summarizes the results and ratings of the creep compliance prediction models. The table shows that the creep compliance results seem to be dependent on the database used. For example, the B3 and GL 2000 models performed better when analyzed with the NU-ITI database. The ACI 209R-92, fib MC 2010, and CEB MC 90-99 models demonstrated better performance when analyzed with the RILEM database. The behavior noted in this analysis is to be expected because different models are calibrated to different sources of data. After combining the results of the two databases, as shown in Table 9, the data shows that the ACI 209R-92 model had the best performance, followed by the B3 and GL 2000 as second. The CEB MC 90-99 model ranked third, the fib MC 2010 model ranked fourth, and the AASHTO 2012 model ranked fifth.
In this paper, the rankings for shrinkage and creep models were found to be different from those obtained from a previous study by Al-Manaseer and Lam.1 Different elimi-
nation criteria were incorporated in this analysis to permit the inclusion of a wider range of data. It can be concluded that data selection criteria and imposed model limitations can influence the final ranking of the models. Additionally, for the purpose of this study, more models have been incor-porated (including the CEB MC 90-99, fib MC 2010, and AASHTO 2012), and rankings are obtained by combining results from the most current RILEM and NU-ITI databases, whereas the previous study used an older version of the RILEM database.
CONCLUSIONSThis study used the RILEM and NU-ITI databases to
evaluate the ACI 209R-92, B3, GL 2000, CEB 90-99, fib MC 2010, and AASHTO 2012 shrinkage and creep prediction models. The residual method, the CEB coeffi-cient of variation VCEB, the CEB mean square error FCEB, the CEB mean deviation MCEB, and the new modified coefficient of variation ωm methods were used for the evaluation. An overall rating approach was applied to rank the models. The following conclusions were drawn from this study:
1. Model ratings can be influenced by the selected data-base because models are calibrated to different sources of
Table 9—Summary of results and rating for creep compliance prediction models
Time range
ACI 209R-92 B3 GL 2000 CEB MC 90-99 fib MC 2010 AASHTO 2012
NU* RI* NU RI NU RI NU RI NU RI NU RI
1—Distribution of residuals†
Positive range 0 to 10,000 days 33% 46% 40% 57% 47% 60% 30% 37% 25% 35% 33% 36%
Negative range 0 to 10,000 days 67% 54% 60% 43% 53% 40% 70% 63% 75% 65% 67% 64%
Away from 50-50 ±17 ±4 ±10 ±7 ±3 ±10 ±20 ±13 ±25 ± 15 ±17 ±14
Rating 1-6|| 3 1 2 2 1 3 4 4 5 6 3 5
2—RMS coefficient of variation VCEB‡, %
Six time ranges 40% 39% 36% 39% 37% 40% 42% 44% 43% 42% 46% 47%
Rating 1-6|| 3 1 1 1 2 2 4 4 5 3 6 5
3—Mean square error FCEB‡, %
Six time ranges 34% 32% 34% 44% 36% 43% 48% 33% 48% 32% 43% 38%
Rating 1-6|| 1 1 1 5 2 4 4 2 4 1 3 3
4—Mean deviation MCEB§
Six time ranges 0.91 0.98 0.97 1.14 0.99 1.1 0.91 0.89 0.86 0.87 0.85 0.86
Rating 1-6|| 3 1 2 5 1 2 3 3 4 4 5 5
5—Modified coefficient of variation ωm‡, %
Six time ranges 37% 40% 30% 45% 35% 44% 31% 37% 32% 36% 44% 45%
Rating 1-6|| 5 3 1 5 4 4 2 2 3 1 6 5
Added model rating (1 + 2 + 3 + 4 + 5) 15 7 7 18 10 15 17 15 21 15 23 23
Average of NU and RI model rating sum 11 12.5 12.5 16 18 23
Overall ranking 1 2 2 3 4 5
*NU is NU-ITI database and RI is RILEM database.†Distribution of residuals: residuals distributed closest to 50% positive and 50% negative perform better.‡For VCEB, FCEB, ωm, smaller values receive better rating.§For MCEB, values closest to 1 receive better rating.||Rating 1-6: models are rated according to the NU-ITI and RILEM databases, respectively (1 = best performing, 6 = worst performing).

135ACI Materials Journal/January-February 2015
data. For the purpose of this study, the results obtained from each database were combined to obtain an overall ranking of the models. Further evaluation of the prediction models under different statistical methods, however, can potentially result in a different conclusion of the ranking of the models;
2. The data selection criteria and imposed model limita-tions can influence the final ranking of the models.
3. This study shows that the ACI 209R-92 shrinkage predic-tion model demonstrated the best predicting performance, followed by the B3 model. The CEB models ranked third, the GL 2000 model ranked fourth, and the AASHTO 2012 model ranked fifth.
4. For creep compliance, this study found that the best-performing model is the ACI 209R-92 model, followed by the B3 and GL 2000 models. The CEB MC 90-99 model ranked third, the fib MC 2010 model ranked fourth, and the AASHTO 2012 model ranked fifth.
5. All shrinkage prediction models demonstrated better performance when analyzed with the RILEM database. All creep compliance prediction models demonstrated better performance when analyzed with the RILEM database, with the exception of the B3 and GL 2000 models.
6. The statistical values FCEB and MCEB for all shrinkage prediction models, calculated from the RILEM and the NU-ITI databases, were significantly influenced when data points with fj
2 (square of percent difference between calculated and observed measurements) greater than 50 were eliminated.
7. For creep compliance, only the CEB MC 90-99 and fib MC 2010 models showed sensitivity to the statis-tical parameters FCEB and MCEB when analyzed with the NU-ITI database after data points with fj
2 greater than 50 were eliminated.
AUTHOR BIOSAkthem Al-Manaseer, FACI, is a Professor of civil engineering at San Jose State University, San Jose, CA. He is a member of ACI Committees 209, Creep and Shrinkage in Concrete; 231, Properties of Concrete at Early Ages; and 552, Cementitious Grouting. He is a past President of the Northern California and Western Nevada Chapter – ACI. His research interests include structural concrete and concrete materials and structures.
Armando Prado is a PhD student in the Department of Civil Engineering at the University of California, Davis, Davis, CA. He received his MS in civil engineering from San Jose State University in 2013.
ACKNOWLEDGMENTSThe authors would like to thank H. S. Muller and R. Breiner for providing
the RILEM database and the new fib MC 2010 model code. The authors also wish to thank Z. P. Bažant for providing the NU-ITI database and for his discussion on the statistical methods.
REFERENCES1. Al-Manaseer, A., and Lam, J.-P., “Statistical Evaluation of Shrinkage
and Creep Models,” ACI Materials Journal, V. 102, No. 3, May-June 2005, pp. 170-176.
2. Al-Manaseer, A., and Lakshmikantan, S., “Comparison between Current and Future Design Code Models for Creep and Shrinkage,” Revue francaise de genie civil, J.-A. Calgaro and F. Darve, eds., V. 3, No. 3-4, 1999, pp. 39-59.
3. Bažant, Z. P., and Li, G. H., “Unbiased Statistical Comparison of Creep and Shrinkage Prediction Models,” ACI Structural Journal, V. 105, No. 6, Nov.-Dec. 2008, pp. 610-621.
4. Burgoyne, C., and Scantlebury, R., “Lessons Learned from the Bridge Collapse in Palau,” Proceedings of the Institution of Civil Engineers, Civil Engineering 161, No. CE 6, Nov. 2008, pp. 28-34.
5. Bažant, Z. P.; Yu, Q.; and Li, G. H., “Excessive Long-Time Deflec-tions of Prestressed Box Girders. I: Record-Span Bridge in Palau and Other Paradigms,” Journal of Structural Engineering, ASCE, V. 138, No. 6, June 2012, pp. 676-686.
6. ACI Committee 209, “Guide for Modeling and Calculating Shrinkage and Creep in Hardened Concrete (ACI 209.2R-08),” American Concrete Institute, Farmington Hills, MI, 2008, pp. 8-13.
7. Hassoun, N. M., and Al-Manaseer, A., “Structural Concrete Theory and Design,” fifth edition, John Wiley & Sons, Hoboken, NJ, 2012, pp. 15-45.
8. Special Activity Group 5, “Model Code 2010-Final Draft,” fib Bulletin, V. 1, No. 65, 2012, pp. 139-148.
9. American Association of State Highway and Transportation Offi-cials (AASHTO), “AASHTO LRFD Bridge Design Specifications,” sixth edition, AASHTO, 2012, pp. 5-15 to 5-17.
10. RILEM Data Bank, provided by Dr. Harald S. Muller, Universitat Karlsruhe (TH), Institute fur Massivbau und Baustofftechnologie, Abtei-lung Baustofftechnologie, Postfach, D-76128 Karlsruhe, Germany.
11. Bažant, Z. P., and Li, G.-H., “NU Database of Laboratory Creep and Shrinkage Data,” available for download from www.civil.northwestern.edu/people/bazant.html or from the website of the Infrastructure Tech-nology Institute of Northwestern University http://iti.northwestern.edu, Evanston, IL.
12. Bažant, Z. P., and Li, G. H., “Comprehensive Database on Concrete Creep and Shrinkage,” Infrastructure Technology Institute, McCormick School of Engineering and Applied Science, Northwestern University, Evanston, IL, Mar. 2008, pp. 1-11.

136 ACI Materials Journal/January-February 2015
NOTES:

1
APPENDIX
Figure 13-NU-ITI shrinkage strain residuals for GL 2000 model for 0-10,000 days
Figure 14-RILEM shrinkage strain residuals for GL 2000 model for 0-10,000 days
Figure 15-NU-ITI shrinkage strain residuals for AASHTO 2012 model for 0-10,000 days

2
Figure 16-RILEM shrinkage strain residuals for AASHTO 2012 model for 0-10,000 days
Figure 17-NU-ITI creep compliance residuals for GL 2000 model for 0-10,000 days
Figure 18-RILEM creep compliance residuals for GL 2000 model for 0-10,000 days

3
Figure 19-NU-ITI creep compliance residuals for CEB MC 90-99 model for 0-10,000 days
Figure 20-RILEM creep compliance residuals for CEB MC 90-99 model for 0-10,000 days
Figure 21-NU-ITI creep compliance residuals for AASHTO 2012 model for 0-10,000 days

4
Figure 22-RILEM creep compliance residuals for AASHTO 2012 model for 0-10,000 days