Embed Size (px)
Citation preview

Los Alamos National Laboratory Report: LA-UR-14-26251
Title: MCNP6.1.1 Beta Test Suite Comparisons to Delayed Neutron Measurements of 233U, 235U, and 239Pu at the Royal Military College of Canada.
Author(s): M.T. Andrews1,2, T.L. Beames-Canivet1, D.G. Kelly1, E.C. Corcoran1, J.T. Goorley2
1 Royal Military College of Canada, P.O. Box 17000 Stn Forces, Kingston, ON, K7K 7B4, 2 Los Alamos National Laboratory, Los Alamos, NM, 87545
Intended for:
An update to LA-UR-14-25702, which compared the MCNP6.1 simulations to measurements.
Inclusion in M.T. Andrew’s RMCC PhD dissertation. Accompanying Materials:
6 updated MCNP input decks simulating delayed neutron emissions from SNM.
Date: August 2014

Los Alamos National Laboratory Report: LA-UR-14-26251
Overview This brief report contains updated delayed neutron (DN) test suite comparisons of MCNP6.1.1Beta to measurements from 233U, 235U, and 239Pu. MCNP simulations recreate the irradiation of milligram quantities of special nuclear materials (SNMs) in aqueous solutions for 60 s. DN magnitudes and temporal behaviors are recorded with F1 tallies and compared to measurements performed at the Royal Military College of Canada. DN emissions of 233U, 235U (contained in Nat. U) and 239Pu were examined up to 3 minutes after the elapse of irradiation, using the three DN options available in MCNP6.1.1 Beta (DN=model, DN=library, and DN=both). This report also demonstrates the improved agreement between measurements and DN=model simulations in MCNP6.1.1 Beta when compared to MCNP6.1 outputs [1]. Experimentation Solutions containing 233U, 239Pu and natural uranium were prepared from certified reference material standards and further diluted with nitric acid and distilled water. Samples were placed in polyethylene vials before pneumatic transport to an inner SLOWPOKE-2 research reactor irradiation site where they were exposed to a predominately thermal neutron flux for 60 s. After irradiation the samples were sent to an array of 3He detectors which recorded the DN emissions as a function of count time for up to 3 minutes. Further details regarding the delayed neutron counting system and these measurements can be found in reference 2. Experimental data has been corrected for dead time effects and neutron background contributions [3]. Measurements have been normalized by fissile mass [g] and detection efficiency (33 %) to obtain DN emission rate, Q(t) [s-1g-1]. Each isotope (233U, 235U, and 239Pu) was irradiated and counted in triplicate; the provided measurements represent their average Q(t). Plots with error bars included represent the 95 % confidence interval on measurements.
MCNP Simulations Atomic Energy of Canada Limited has provided a MCNP input deck containing LEU SLOWPOKE-2 dimension and material specifications, the contents of which are detailed in reference 4. This input deck was modified to include a polyethylene vial within an inner irradiation site to determine a higher fidelity neutron flux spectrum. This flux was recreated within the vial solution of a second input deck, which includes the irradiation of a fissile solution for 60 s and the recording of subsequent DN emissions from the vial. The DN emission rate, Q(t) [s-1g-1], for each MCNP6 simulation was compared to the normalized measurements described in the previous section. Further details on MCNP simulations are included in Reference 5.

Los Alamos National Laboratory Report: LA-UR-14-26251
Comparisons
MCNP6.1.1 beta DN=model, library, and both comparisons
Figure 1 compares the measurements of DN emissions for 233U and MCNP6.1.1 beta simulations using the three DN emission options. The DN=both option is omitted in subsequent comparisons because it is indistinguishable from the DN=library option. Figures 2-4 compare the DN emission rate for 233U, 235U (in Nat. U), and 239Pu, using the DN=model and DN=library options in MCNP6.1.1 beta.
MCNP6.1.1 beta comparisons to MCNP6.1
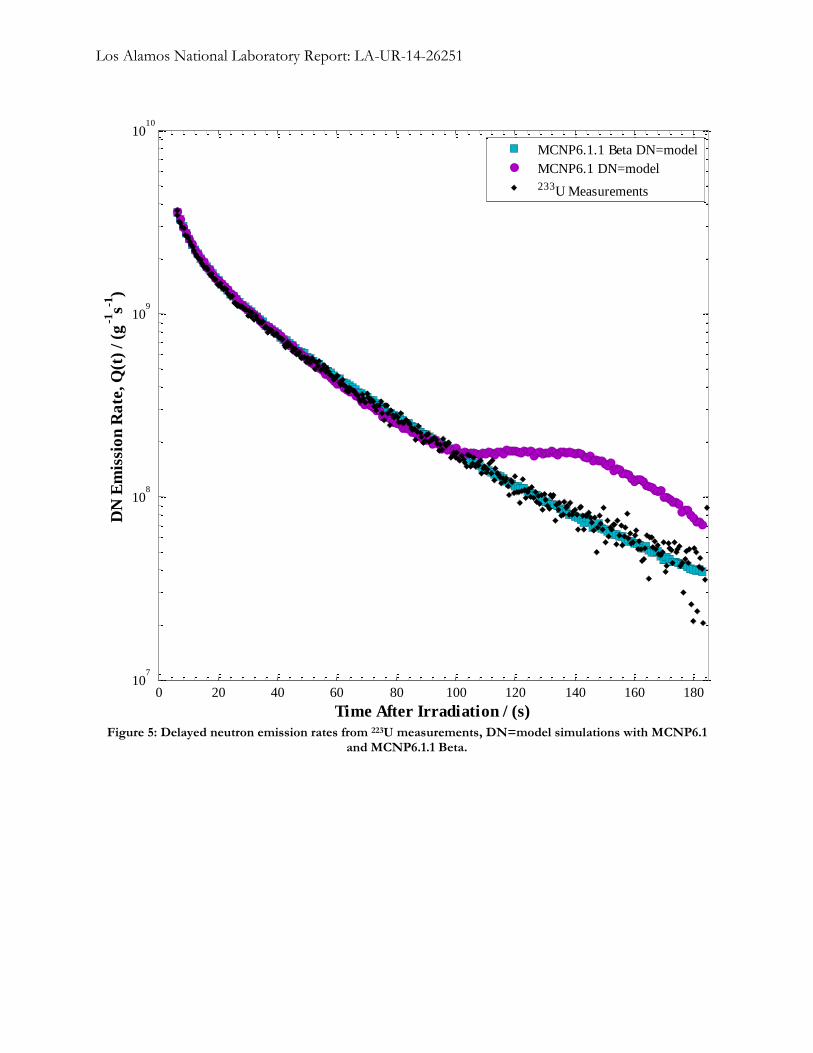
Simulations using MCNP6.1 and the DN=model option resulted in deviations from measurements at approximately 100 s because of the time-bin structure used to sample delayed particle emissions [6]. MCNP6.1.1 beta contains updates to the delayed particle time-bin structure [7], which eliminates the 100 s anomaly, shown in Figures 5-7. Figures 8-10 compare DN emission rates using the DN=library option with MCNP6v1 and MCNP6.1.1 beta, which remained the same between versions.
Summary DN emissions from 233U, 235U, and 239Pu were compared to MCNP61.1 Beta simulations using the DN=model, both, and library options. Significant improvements in the agreement with measurements and the MCNP6.1.1 Beta DN=model option are noted when compared to MCNP6.1 simulations.

Los Alamos National Laboratory Report: LA-UR-14-26251
Figure 1: Delayed neutron emission rates from 233U measurements and three DN options in MCNP6.1.1 Beta simulations.
0 20 40 60 80 100 120 140 160 18010
7
108
109
1010
Time After Irradiation / (s)
DN
Em
issi
on
Ra
te, Q
(t)
/ (g
-1s-1
)
MCNP6.1.1 Beta DN=model
MCNP6.1.1 Beta DN=both
MCNP6.1.1 Beta DN=library
233U Measurements

Los Alamos National Laboratory Report: LA-UR-14-26251
Figure 2: Delayed neutron emission rates from 233U measurements, model and library DN options in MCNP6.1.1 Beta simulations.
0 20 40 60 80 100 120 140 160 18010
7
108
109
1010
Time After Irradiation / (s)
DN
Em
issi
on
Ra
te, Q
(t)
/ (g
-1s-1
)
MCNP6.1.1 Beta DN=model
MCNP6.1.1 Beta DN=library
233U Measurements

Los Alamos National Laboratory Report: LA-UR-14-26251
Figure 3: Delayed neutron emission rates from nat. U measurements, model and library DN options in
MCNP6.1.1 Beta simulations.
0 20 40 60 80 100 120 140 160 18010
7
108
109
1010
Time After Irradiation / (s)
DN
Em
issi
on
Ra
te, Q
(t)
/ (g
-1s-1
)
MCNP6.1.1 Beta DN=model
MCNP6.1.1 Beta DN=library
Nat. U Measurements

Los Alamos National Laboratory Report: LA-UR-14-26251
Figure 4: Delayed neutron emission rates from 239Pu measurements, model and library DN options in
MCNP6.1.1 Beta simulations.
0 20 40 60 80 100 120 140 160 18010
7
108
109
1010
Time After Irradiation / (s)
DN
Em
issi
on
Ra
te, Q
(t)
/ (g
-1s-1
)
MCNP6.1.1 Beta DN=model
MCNP6.1.1 Beta DN=library
239Pu Measurements
Los Alamos National Laboratory Report: LA-UR-14-26251
Figure 5: Delayed neutron emission rates from 223U measurements, DN=model simulations with MCNP6.1
and MCNP6.1.1 Beta.
0 20 40 60 80 100 120 140 160 18010
7
108
109
1010
Time After Irradiation / (s)
DN
Em
issi
on
Ra
te, Q
(t)
/ (g
-1s-1
)
MCNP6.1.1 Beta DN=model
MCNP6.1 DN=model
233U Measurements

Los Alamos National Laboratory Report: LA-UR-14-26251
Figure 6: Delayed neutron emission rates from nat. U measurements, DN=model simulations with MCNP6.1
and MCNP6.1.1 Beta.
0 20 40 60 80 100 120 140 160 18010
7
108
109
1010
Time After Irradiation / (s)
DN
Em
issi
on
Ra
te, Q
(t)
/ (g
-1s-1
)
MCNP6.1.1 Beta DN=model
MCNP6.1 DN=model
Nat. U Measurements

Los Alamos National Laboratory Report: LA-UR-14-26251
Figure 7: Delayed neutron emission rates from 239Pu measurements, DN=model simulations with MCNP6.1
and MCNP6.1.1 Beta.
0 20 40 60 80 100 120 140 160 18010
7
108
109
1010
Time After Irradiation / (s)
DN
Em
issi
on
Ra
te, Q
(t)
/ (g
-1s-1
)
MCNP6.1.1 Beta DN=model
MCNP6.1 DN=model
239Pu Measurements

Los Alamos National Laboratory Report: LA-UR-14-26251
Figure 8: Delayed neutron emission rates from 223U measurements, DN=library simulations with MCNP6.1
and MCNP6.1.1 Beta.
0 20 40 60 80 100 120 140 160 18010
7
108
109
1010
Time After Irradiation / (s)
DN
Em
issi
on
Ra
te, Q
(t)
/ (g
-1s-1
)
MCNP6.1.1 Beta DN=library
MCNP6.1 DN=library
233U Measurements

Los Alamos National Laboratory Report: LA-UR-14-26251
Figure 9: Delayed neutron emission rates from nat. U measurements, DN=library simulations with MCNP6.1
and MCNP6.1.1 Beta.
0 20 40 60 80 100 120 140 160 18010
7
108
109
1010
Time After Irradiation / (s)
DN
Em
issi
on
Ra
te, Q
(t)
/ (g
-1s-1
)
MCNP6.1.1 Beta DN=library
MCNP6.1 DN=library
Nat. U Measurements

Los Alamos National Laboratory Report: LA-UR-14-26251
Figure 10: Delayed neutron emission rates from 239Pu measurements, DN=library simulations with MCNP6.1
and MCNP6.1.1 Beta.
0 20 40 60 80 100 120 140 160 18010
7
108
109
1010
Time After Irradiation / (s)
DN
Em
issi
on
Ra
te, Q
(t)
/ (g
-1s-1
)
MCNP6.1.1 Beta DN=library
MCNP6.1 DN=library
239Pu Measurements

Los Alamos National Laboratory Report: LA-UR-14-26251
Figure 11: Delayed neutron emission rates from 233U measurements, model and library DN options in
MCNP6.1.1 Beta simulations. Error bars represent 95 % confidence intervals.
0 20 40 60 80 100 120 140 160 18010
7
108
109
1010
Time After Irradiation / (s)
DN
Em
issi
on
Ra
te, Q
(t)
/ (g
-1s-1
)
MCNP6.1.1 Beta DN=model
MCNP6.1.1 Beta DN=library
233U Measurements

Los Alamos National Laboratory Report: LA-UR-14-26251
Figure 12: Delayed neutron emission rates from nat. U measurements, model and library DN options in
MCNP6.1.1 Beta simulations. Error bars represent 95 % confidence intervals.
0 20 40 60 80 100 120 140 160 18010
7
108
109
1010
Time After Irradiation / (s)
DN
Em
issi
on
Ra
te, Q
(t)
/ (g
-1s-1
)
MCNP6.1.1 Beta DN=model
MCNP6.1.1 Beta DN=library
Nat. U Measurements

Los Alamos National Laboratory Report: LA-UR-14-26251
Figure 13: Delayed neutron emission rates from 239Pu measurements, model and library DN options in
MCNP6.1.1 Beta simulations. Error bars represent 95 % confidence intervals.
0 20 40 60 80 100 120 140 160 18010
7
108
109
1010
Time After Irradiation / (s)
DN
Em
issi
on
Ra
te, Q
(t)
/ (g
-1s-1
)
MCNP6.1.1 Beta DN=model
MCNP6.1.1 Beta DN=library
239Pu Measurements

Los Alamos National Laboratory Report: LA-UR-14-26251
References
1. M.T. Andrews, T.L. Beames-Canivet, D.G. Kelly, E.C. Corcoran, J.T. Goorley, “Updated Delayed Neutron Counting Test Suite Comparisons from RMCC and MCNP6 Version 1 Release” Los Alamos National Laboratory Technical Report LA-UR-14-25702 (2014),
2. M.T. Sellers, D.G Kelly, and E.C. Corcoran, “An automated delayed neutron counting system for the mass determination of special nuclear materials” Radioanalytical and Nuclear Chemistry 291 2 (2012) 281 – 285. 3. M.T. Sellers, E.C. Corcoran, D.G. Kelly, “The analysis and attribution of the time-dependent neutron background resultant from sample irradiation in a SLOWPOKE-2 reactor” Radioanalytical and Nuclear Chemistry 295 2 (2013) 1221-1228. 4. T.S. Nguyen, G.B. Wilkin, and J.E Atfield “Monte Carlo Calculations Applied to SLOWPOKE Full Reactor Analysis” AECL Nuclear Review, 1 2 (2012) 43-46. 5. M.T. Andrews, J.T. Goorley, E.C. Corcoran, D.G. Kelly, “Modeling the detection of delayed neutron signatures in MCNP6 and comparisons with measurements of 233U, 235U, and 239Pu” Journal of Nuclear Technology 187 3 (2014). 6. J.T. Goorley, “MCNP6 version 1.0 Known Issues” Los Alamos National Laboratory Technical Report, LA-UR-13-22900 (2014). 7. T. Goorley, “MCNP 6.1.1 – Beta Release Notes” Los Alamos National Laboratory Technical Report, LA-UR-14-24680 (2014).

Los Alamos National Laboratory Report: LA-UR-14-26251
Example of an Input Deck Modeling Delayed Neutron Emissions in RMCC's DNC System c c ----------------------------GEOMETRY------------------------------------- c 27 5000 -0.9977 -509 $ top smaller vial solution imp:n=1 c 30 0 509 $ geometry void imp:n=0 c c ----------------------SURFACE CARDS------------------------------------------------------------ c 509 rcc 0 0 17.3 0 0 1.38 0.4826 $ top small vial solution c c --------------------------MATERIAL AND SOURCE CARDS------------------------------------- c mode n c ACT DN=both $ change between DN=model, DN=both and DN=library DNBIas=10 $ biases the # of DNs produced c c -----------------------------MATERIAL DEFINITIONS--------------------------------------- c m5000 94239 -2.14e-3 $ 94239 for Pu239, 92233 for U233, 92235 for U235 1001 -0.10531 8016 -0.87777 7014 -0.01478 mt5000 lwtr.10t c c ------------------------SOURCE DEFINITION---------------------------------------------- c sdef pos=0 0 18.0 par=n cel=27 Rad=D2 Ext=D3 AXS 0 1 0 c To be used when reproducing flux magnitude erg=d4 tme=d1 wgt=1.92e14 $ accounts for flux and mass norms c c Irradiation Time (shakes) si1 H 0 60e8 sp1 D 0 1 c si2 H 0 0.4826 sp2 -21 1 si3 -0.7 0.7 c Particle Time, Weight and Energy Cut-Offs cut:n 243e8 j 0 0 c F1:n (509.1 509.2 509.3) T1: 63e8 179i 243e8 c F44:n 27 $ checking the flux distribution E44: 0.625e-6 0.5 10 T44: 1e8 243e8 c c si4 & sp4 reproduce the 69 energy group neutron flux of the SLOWPOKE-2 (omitted from report).