Embed Size (px)
Citation preview

Title:Highdimensionalsinglecellanalysispredictsresponsetoanti-PD-1immunotherapyAuthors: Carsten Krieg*1, Malgorzata Nowicka2,3, Silvia Guglietta4, SabrinaSchindler5, Felix J.Hartmann1, LukasM.Weber2,3, ReinhardDummer5,MarkD.Robinson2,3,MitchellP.Levesque#*5,BurkhardBecher#*1.
SUPPLEMENTARYINFORMATION-Contentlist
METHODS• Patientsamples• Stimulations,stainings,andmasscytometryacquisition• AntibodyConjugation• CyTOFDataAnalysis• Cytokineanalysisbasedonabimatrix• CellCnnanalysis• Validation by flow cytometry + correlation of PFS with monocyte
frequency• Patientdataandanalysis• Immunohistology
TABLESANDFIGURES• TableS1–Bloodsamplescharacteristicsbiomarkerdiscoverystudy.• TableS2–StainingpanelsforMassCytometryDataSets.• TableS3–Bloodsamplecharacteristicsforthevalidationstudy.• FigureS1–ExperimentaldesignusedfortheCyTOFdata.• FigureS2–SimultaneousdetectionofTcelldifferentiationandactivation
markersinblood.• FigureS3–Immunohistochemicalintensityscoresoflyphocytesand
monocytesmarkersinFFPEmelanomatumorsamples.• FigureS4–DefiningCD8+Tcellssubpopulationsbyusingover-clustering.• FigureS5–SimultaneousdetectionofTHandCTLprofilesinhuman
blood.• FigureS6–Characterizationofthecirculatingmyeloidcompartment.• FigureS7–Comparisonoffrequenciesincellularsub-populationsusing
themyeloidpanel• FigureS8–CorrelationofIFN-γ-producingTcellswithmyeloidcell
expansion.• FigureS9–IndepthanalysisoftheCD14+myeloidcompartment.• FigureS10–IdentificationofamonocytesignaturebyCellCnn• FigureS11–BackprojectionofcellsidentifiedusingCellCnnintotSNE.• FigureS12–CXCL2expressionbyRNA-Seq.• FigureS13–CitrusanalysisoftheTcellpanel.• FigureS14–Citrusanalysisofthemyeloidcompartment• FigureS15–FACSvalidationpanel• FigureS16–Baselineclinicalcharacteristicsofallpatients.• FigureS17–Hazardratesatbaselineofallpatients
REFERENCES
Krieg et al. - HighDimanalysispredictsresponsetoPD-1therapy–supplementarydata
page 1 of 26
SUPPLEMENTARYMETHODSPatientSamples
Ashealthycontrols(n=10),age-andsex-matchedPBMCswereacquiredfromthe
Red Cross Blood Bank, Zurich, Switzerland. Two patient cohorts (total n=51)
wereanalyzed in this study (seeSupplementaryTables1and3).Baselinewas
defined as a sample that was collected within a maximum of 1.5 months of
therapyinitiation,withanaverageof2.27daysbeforethetherapystartedanda
medianof0days,meaningthatthemajorityofbaselinesampleswerecollected
onthedayof treatment initiation.Allhumanbiologicalsampleswerecollected
afterwritten informed consent of the patients andwith approval of the Local
EthicsCommittee(KantonaleEthikkommissionZürich,KEK-ZHauthorizationNr.
2014-0425)inaccordancetoGCPguidelinesandtheDeclarationofHelsinki.
Stimulations,stainings,andmasscytometryacquisition
Cryopreserved PBMCswere thawed, incubated for 10minutes in pre-warmed
complete RPMI (RPMI, 10% FBS, Glutamine, Penicillin and Streptomycin)
containing 200µg/ml DNAse, spun down, washed in cRPMI. Cells from each
samplewerewashed,counted,adjustedto2x10e6lifecells/stainandseededin
96-well plates. For stimulations cells were seeded into 96-well non-tissue
culturetreatedroundbottomplates(BDFalcon)andleftuntreatedorstimulated
for 4 hours with 50ng/ml phorbol-12-myristate-13-acetate (PMA) and 1 mM
ionomycin in thepresenceof10µg/mlBrefeldinA (Sigma)andmonensin (BD).
For live cell barcoding cells were transferred into V-bottom plates (Costar)
washedincoldFACSbuffer(PBS+2%FCS+2mMEDTA+0.05%sodiumazide)
and incubated for 15 minutes at 37°C with a unique combination of metal-
labeledanti-humanCD45antibodies.Cellswerethenwashedtwicewithice-cold
FACSbufferandLive/Deadstainedwith200µMCisplatin-Pt-198(Fluidigm)for
2minutes at room temperature. Cellswerewashed and surfaceproteinswere
stainedwithantibodiesat37°Cfor15minutesandforanadditional10minutes
at4°C.CellswerewashedwithFACSbufferandinordertoperformintracellular
staining,somesampleswerepermeabilizedusingcytofix/cytoperm-buffer(BD)
for 20 minutes on ice and stained with an intracellular antibody cocktail

Krieg et al. - HighDimanalysispredictsresponsetoPD-1therapy–supplementarydata
page 2 of 26
(Supplementary Table 2) for 40min on ice. Finally, cellswere incubated over
night with 250nM iridium intercalator (Fluidigm) to label cellular DNA.
Subsequently, cells were washed with PBS and with distilled water. Mass
cytometry acquisitionwas performed on a CyTOF2.1 (Helios)mass cytometer
(Fluidigm).
AntibodyConjugation
Purifiedantibodieslackingcarrierproteinswerepurchasedfromthecompanies
listed in Supplementary Table 2. Antibody conjugationwas performed using a
metal-labelingkit(Fluidigm).
CyTOFDataAnalysis
CyTOFdata came from2 separatemeasurements (dataset1 anddataset2). In
eachmeasurementbaseline(beforetreatment)andtimepoint(after12weeksof
treatment)sampleswerestainedseparatelyresultingin4experimentalbatches
(dataset1–before,dataset1–after,dataset2–before,dataset2–after).Ineach
batch,HD,NRandRsamplesweremeasured(SupplementaryFigure1).
We approached the dataset unbiased, meaning we did not expect a specific
pattern.Wemixedbaselineandtimepointsampleswiththeideathatprognostic
markersthatareidentifiedat12weeksmaybeusefulforpatientmonitoringor
possiblyforthepredictionofotherendpointssuchasoverallresponse.Thus,the
mathematicalalgorithmbehindour“mixedapproach”estimatesthecorrelation
ofpatientsthatenterwithmorethanonesampleandthealgorithmisawareof
baseline and time point samples. All analyses on CyTOF datawere performed
afterarcsinh(withcofactorequalto5)transformationofmarkerexpression.In
thefollowing,wedevelopedacustomRworkflowinordertodiscoverdifferent
biomarkerswhencomparingmarkerexpressionsbetweenrespondersandnon-
responders(https://github.com/gosianow/carsten_cytof_code).
Further details of the majority of the pipeline, including many additional
visualizations,optionalanalysesandRcode,arepublishedasaworkflowarticle1.
Allmarkerswere included in the analysis and sampleswith less than 50 cells
were excluded. This cutoff was used to balance the identification of relatively

Krieg et al. - HighDimanalysispredictsresponsetoPD-1therapy–supplementarydata
page 3 of 26
rare population while retaining the identities of the main populations.
Differentialmarker expression analysiswas performed by fitting linearmixed
models (LMM) using the lme4 R package2. Here, marker expression either
represents the global values (aggregated over all cells for a sample) or
subpopulation-specific (aggregated over all cells in a cluster). The median
marker expression is a response variable (y) and the explanatory variables
include experimental group response (non-responder, responder or healthy
donor)asafixedeffect.Toaccountforanybatcheffectsamongsamples,weuse
eachindividualexperimentasanadditionalfixedeffect(batch).Weaccountfor
the fact that samples are paired (same sample measured before and after
therapy)byintroducingthepatientIDasarandomeffect.Totestfordifferences
between responders and non-responders, we used the generalized linear
hypothesis (glht) function from the multcomp R package3 to test for the four
followingcontrasts:(1)thedifferenceinmarkerexpressionbetweenresponders
and non-responders before therapy, (2) differences after therapy, (3) overall
differences in both combined and (4) an interaction that is comparing
differencesbeforeandafter therapy.Except for functional components (Figure
3),wenotedthatinalmostallcasesthattherapydidnothaveanimpactonthe
observedsignificantdifferences.Basedonthisobservationandinordertogain
power,wereportresultsoftheoveralldifferencesbetweenrespondersandnon-
responders. To adjust for multiple comparisons, we adjusted the resulting p-
valuesusingtheBenjamini–Hochbergprocedure.
Differential marker expression is visualized using heatmaps as the change
between responders and non-responders for significant markers (adjusted p-
value<0.1).Coloursrepresentnormalizedmedianmarkerexpressionstomean
of0andstandarddeviationof1.
To rank markers according to their importance, we used the feature-scoring
algorithm based on principal component analysis (PCA) from Levine et al.4,
whichidentifiesthenon-redundantmarkersineachpatient,whilecapturingthe
overall diversity. Top scoring (Levine PCA score averaged across samples)
markerswereusedforsubsequentclusteringanddimensionreductionanalysis.
Inordertoclustersinglecelldata,weusedtheSOMfunctionfromtheFlowSOM
R package5 and ConsensusClusterPlus function from ConsensusClusterPlus R

Krieg et al. - HighDimanalysispredictsresponsetoPD-1therapy–supplementarydata
page 4 of 26
package6, a combination of methods that is amongst the best performing
clusteringapproaches7. In the firststep,weusedFlowSOMtoassigncells toa
10x10 grid according to their similarity using the self organizing map (SOM)
algorithm. In the second step, the resulting 100 codes, vectors of marker
expression representing the 100 grid nodes, were clustered using
ConsensusClusterPlus hierarchical clustering with average linkage. Since we
knew the mapping between cells and nodes, we could reconstruct the final
clustering for each individual cell.We applied ConsensusClusterPlus to cluster
the codes into a range of clusters from2 to 20 and to calculate a score (delta
area),whichweusedtodefinetheappropriatenumberofclusterspresentinthe
databasedonthesocalledelbowcriterion.Fordatavisualization,weusedtSNE
dimensionreduction,torepresenttheannotatedcellpopulationsina2Dmap8.
Clustersweremanuallyannotatedbasedontheheatmapswithnormalizedto0-
1medianmarkerexpressionineachclusterandtheaforementionedtSNEmaps.
To our knowledge there are no automatic annotation approaches thus cluster
annotationremainsamanualstepinmanyapproaches,e.g.Citrus,CellCnn.The
recentlyproposedtool,calledMarkerEnrichmentModelling(MEM)9,providesa
consistentcharacterizationofclusters,whichconsistsoflistsofmarkersthatare
positivelyand/ornegativelyenrichedwithrespecttosomepredefinedreference.
Suchnamingagainhastobemanuallyinterpretedinordertoobtainmeaningful
namesof cell types and thus stays subjective.Amoredetaileddescriptionand
discussion of our clustering and labeling/annotating strategy, including its
strengthsandweaknessescanbefoundinourBioconductorworkflow1.
Inordertoanalyzedifferencesinrelativecellpopulationabundance(frequency)
between responders and non-responders to anti-PD-1 therapy, we performed
analysis analogous to differentialmarker expression analysis described above.
Here,theresponsevariable(y)wasthenumberofcellsinagivenclusterineach
sample, and insteadof aLMM,a generalized linearmixedmodel (GLMM)with
thebinomialfamilywasapplied.

Krieg et al. - HighDimanalysispredictsresponsetoPD-1therapy–supplementarydata
page 5 of 26
Cytokineanalysisbasedonabimatrix
Fortheselectedsubpopulations,weinvestigatedchangesincytokineproduction
betweenrespondersandnon-responders.Basedonpublishedcytokineanalysis
algorithmssuchasCOMPASS10,weexploitedanewtypeofanalysisbasedona
so-calledbimatrix.Bimatrixisabinarymatrixwithrowsrepresentingcellsand
columns corresponding to the cytokines of interestwhere each entry encodes
whetheracellispositive(1)ornegative(0)foragivencytokine.Thresholdsfor
defining the positive status of a cell were defined for each batch of data
individually by investigating expression profiles in FlowJo using DMSO or a
biological negative control. Subsequently, we performed two types of
comparisons. First, the differential frequency analysis based on GLMM, which
comparethefrequenciesofpositivecellsinrespondersandnon-respondersfor
each individual cytokine (Figure 3A and 4A). For the second analysis, we
considered an entire cytokine set profile of each cell. Cells described by the
bimatrixwereclusteredusingtheSOMmethodinto49groups(7times7grid)to
generate profiles of the cytokine production, which we refer to as cytokine
combination groups (CCGs) (Figure3B and4B), and the relative abundanceof
theseprofileswascomparedbetweenrespondersandnon-respondersusingthe
GLMMapproachdescribedabove(Figure3Dand4D).
CellCnnanalysis
WeuseddefaultparametersettingstorunCellCnn,includingrandomlysplitting
dataintotrainingandvalidationsetsinordertotrainthemodel.AsCellCnndoes
notprovideanymeasure for thesignificanceof identified filters,wehaveused
ourGLMMapproach(amodelwithobservation-levelrandomeffectsorOLREto
correctlymodelover-dispersedbinomialdata)totestwhethertheidentifiedcell
population is significantly over-represented in responders (Supplementary
Figure10).Ofnote,thep-valuesobtainedwiththisapproachdonotaccountfor
the selection step (only the selected population is tested). However, such p-
valuescanbestillinformativeofthemagnitudeofobserveddifferences.
Validationbyflowcytometry
Afterthawing,cellsuspensionswerestainedinstainingbuffer(PBS,5mMEDTA,
Krieg et al. - HighDimanalysispredictsresponsetoPD-1therapy–supplementarydata
page 6 of 26
0.5%BSA) containing Fc-block (Miltenyi)with the following antibody cocktail
(clones in brackets, all from Biolegend until noted otherwise): CD11b-
BrilliantViolett (BV) 421 (ICRF44), CD14-PE (HCD14), HLA-DR-FITC (L243),
CD4-BV711 (OKT4),CD33-BV605 (WM53),CD3-BV785 (OKT3), andLive/dead-
stain-NearInfraRed. CD56-Pe-Cy7 (NCAM1), CD19-BV605 (1D3), and CD11c-
AlexaFluor700 (B-Ly6) were from BD Biosciences, CD16-APC (3G8) from
ThermoFischer and CD45RO-ECD (2H4LDH11LD89(2H4), from Beckman
Coulter. The frequencies of two cell populations,whichwere CD3+ T cells and
CD14+CD16-HLA-DR+ monocytes, were extracted from the three groups. For
statisticaltesting,weappliedageneralizedlinearmodel(GLM)withbetafamily,
using the glmmADMB R package11, where the response y is an relative
abundance(proportion)ofacellpopulationinthesample.Thecontrastforthe
comparisonbetweenrespondersandnon-responderswastestedusingtheglht
function and a Benjamini–Hochberg procedure was applied to correct the
resultingp-valuesformultiple-testing.
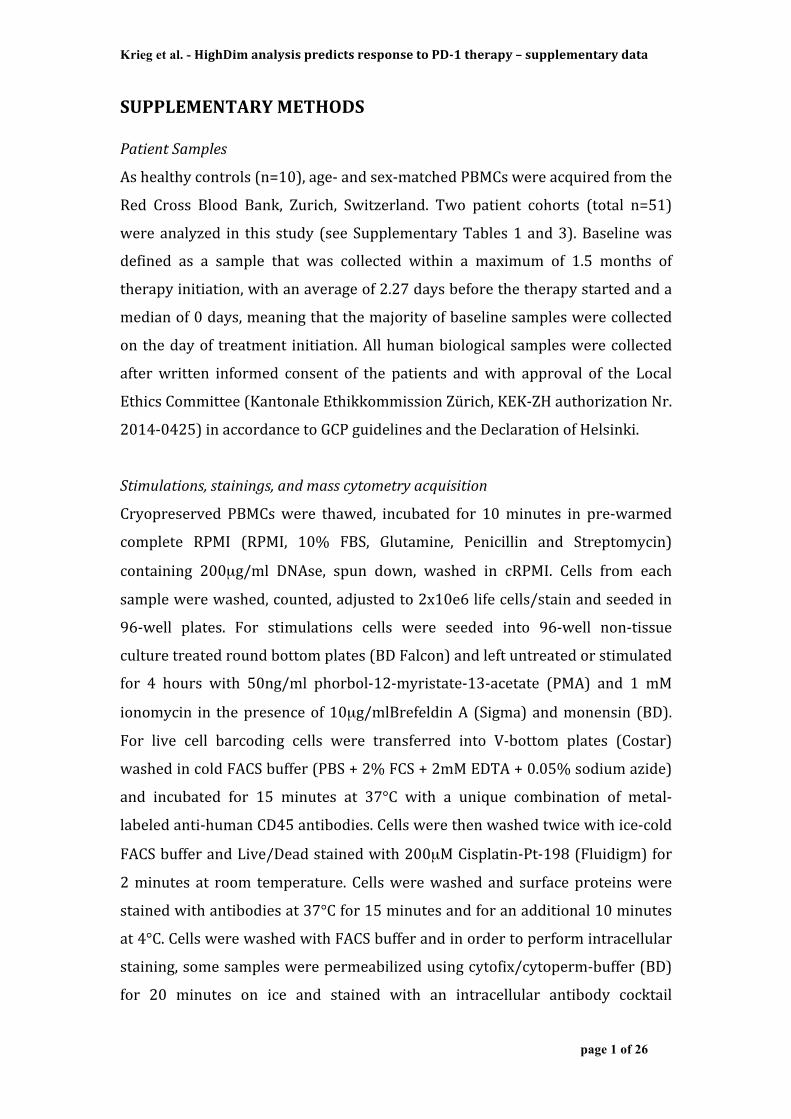
CorrelationofPFSwithmonocytefrequency
InordertovisualizeandquantifythedifferenceinPFSassociatedwithclassical
monocyte frequenciesatbaseline frombothcohorts,weremovedbatcheffects
and calculated the optimal cutoff point in the classical monocytes frequency,
which best dichotomizes responders from non-responders. The calculations
were performed in R, using the OptimalCutpoints package and the Youden
method12. To compute the cumulative hazard functionwe used the previously
calculatedcutoffof19.38%tocreatethe2groups.ThiswasperformedinRusing
the survfit function of the survival package and the ggsurvplot function of the
survminerpackage.
Patientdataandanalysis
Standard clinical parameters (k=53) were collected at baseline for the two
cohorts (n=51). To assess the potential correlation between progression-free
survival (PFS) and any of the clinical variables plus the frequency of classical
monocytes, we performed a Cox proportional-hazards regression. Gender,
previoustreatment,mutationstatus,metastasislocalizationandprimarytumor

Krieg et al. - HighDimanalysispredictsresponsetoPD-1therapy–supplementarydata
page 7 of 26
ulcerationwere considered as binary variables,melanoma-staging parameters
were considered as ordinal variables and the rest as continuous variables
(SupplementaryFigure16).To account for thebatch effects (CyTOFdataset1,
CyTOFdataset2andFACS)onthemeasuredfrequenciesofclassicalmonocytes
wenormalized themperbatch tomeanof zeroandstandarddeviationofone.
Candidate prognostic factorswith p-values smaller than 0.05 in the univariate
analysis (Supplementary Figure17A)were then included into themultivariate
model(SupplementaryFigure17B).Ofnote,p-valuesinthemultivariatemodel
do not account for pre-selection from the univariate step. Calculations were
performed in R using the coxph() function from the survival package and the
forestplotwasgeneratedusingtheforestplot()functionfromthermetapackage.
Thesame53parametersweretestedforassociationwithresponse(NRversus
R) using linearmodels (LM) for continuousparameters and generalized linear
models(GLM)forthebinaryparameters.Inbothcases,inregressionmodels,the
clinicalparametersweretreatedasdependentvariablesy,andresponse(NR,R)
wastreatedastheexplanatoryvariable.Toadjustformultiplecomparisons,we
adjustedtheresultingp-valuesusingtheBenjamini–Hochbergprocedure.
Immunohistology
Immunohistologywasdoneaccordingtopublishedprotocols13.Theassessment
oftumorinfiltratingcellwasperformedon23formalin-fixedparaffin-embedded
tumor samples, sourced from patients previously included in our cohorts (15
respondersand8non-responders).Sampleswithacollectiondatetheclosestto
the treatment initiation date were included (mean=23.22days, median=3days,
range=-212-215days). Tumors were fixed in formalin and subsequently
embedded in paraffin. For immunohistochemistry staining, sections were
deparaffinized,rehydratedandpretreatedwithEDTA(Sigma-Aldrich),TSR9.0or
proteinase-K (Sigma-Aldrich) before performing staining with one of the
followingprimaryantibodies(allantibodiesfromDAKOuntilstatedotherwise):
anti-humanCD3 (cloneF7.2.38,1:50), rabbit anti-humanCD4 (cloneEPR6855,
1:100,Abcam),mouseanti-humanCD8(cloneM7103,1:25),mouseanti-human
CD68(cloneM0814,1:200),mouseanti-humanCD163(clone10D6,Abcam),or
rabbitanti-humanPD-L1(clone13684,CellSignaling).Asassecondaryreagent

Krieg et al. - HighDimanalysispredictsresponsetoPD-1therapy–supplementarydata
page 8 of 26
for the mouse antibodies AP K5005 anti rabbit IgG-biotin for the rabbit
antibodies (Vector Labs) were used. For the anti-PD-L1 stain a blocking step
with goat serumwas added before the secondary antibody. Visualization was
obtainedwithAlkalinePhosphatase/Redreagent,chromogenorAEC(allDako).
After counterstaining with haematoxylin, sections were dehydrated and
prepared for visualization bymountingwithmountingmediumEukitt (Sigma-
Aldrich).

Krieg et al. - HighDimanalysispredictsresponsetoPD-1therapy–supplementarydata
page 9 of 26
SUPPLEMENTARYTABLESANDFIGURES Supplementary Table 1. Characteristics of blood samples from melanoma patients and healthy donors used for the biomarker discovery study. Time point 1 Time point 2 Total
Healthy donors
N dataset 1 5 5 N dataset 2 5 5 N TOTAL 10 10 20 Age in years – mean (range) 60.3 (46-71) Sex – male/female 6/4
Melanoma patients Before therapy After therapy
Responders
N dataset 1 5 5 N dataset 2 6 6 N TOTAL 11 11 22 Age in years – mean (range) 62.0 (42-81) Sex – male/female 9/2
Non-responders
N dataset 1 5 5 N dataset 2 4 4 N TOTAL 9 9 18 Age in years – mean (range) 57.8 (45-75) Sex – male/female 5/4
SupplementaryTable2.StainingpanelsforMassCytometryDataSets.
Supplementary Figure: Staining Panels for Mass cytometry Data Sets
Mass Antigen Clone Distributor Mass Antigen Clone Distributor Mass Antigen Clone Distributor89 CD45 HI30 Fluidigm 89 CD45 HI30 Fluidigm 89 CD45 HI30 Fluidigm104 CD45 HI30 BioLegend 104 CD45 HI30 BioLegend 104 CD45 HI30 BioLegend105 CD45 HI30 BioLegend 105 CD45 HI30 BioLegend 105 CD45 HI30 BioLegend106 CD45 HI30 BioLegend 106 CD45 HI30 BioLegend 106 CD45 HI30 BioLegend108 CD45 HI30 BioLegend 108 CD45 HI30 BioLegend 108 CD45 HI30 BioLegend110 CD45 HI30 BioLegend 110 CD45 HI30 BioLegend 110 CD45 HI30 BioLegend141 CCR6 G034E3/11A9 Fluidigm 143 CD45RA HI100 Fluidigm 142 CD19 HIB19 Fluidigm142 CD11a HI111 Fluidigm 144 IL-4 MP4-25D2 Fluidigm 146 CD64 10.1 Fluidigm143 CD45RA HI100 Fluidigm 145 CD4 RPA-T4/OKT4 Fluidigm 147 CD303 201A BioLegend144 CCR5 NP-6G4/J418F1 BioLegend 146 CD8a RPA-T8 Fluidigm 148 CD34 581 Fluidigm145 CD4 RPA-T4/OKT4 Fluidigm 148 IL-17A BL168 Fluidigm 149 CD141 M80 BioLegend146 CD8a RPA-T8 Fluidigm 149 CD25 2A3 Fluidigm 150 CD61 VI-PL2 Fluidigm149 CD25 2A3 Fluidigm 152 TCRgd 11F2 Fluidigm 151 CD123 6H6 Fluidigm152 TCRgd 11F2 Fluidigm 155 CD27 L128 Fluidigm 152 CD66b 80H3 Fluidigm153 CD62L DREG56 Fluidigm 156 IL-13 JES10-5A2 BioLegend 153 CD62L DREG-56 Fluidigm154 LAG-3 17B4 Enzo 158 IL-2 MQ1-17H12 Fluidigm 154 ICAM-1 14C11 R&D155 CD27 L128 Fluidigm 159 GM-CSF BVD2-21C11 Fluidigm 155 CD1c L161 BioLegend156 CXCR3 G025H7 Fluidigm 160 CD28 CD28.2 Fluidigm 156 CD86 IT.2 Fluidigm158 CCR4 205410 Fluidigm 161 CTLA4 14D3 Fluidigm 160 CD14 M5E2 Fluidigm160 CD28 CD28.2 Fluidigm 162 CD69 FN50 Fluidigm 162 CD11c N418 Fluidigm161 CTLA4 14D3 Fluidigm 164 CD45RO UCHL1 Fluidigm 163 CD7 CD7-6B7 BioLegend162 CD69 FN50 Fluidigm 165 IFN-g B27 Fluidigm 165 CD16 3G8 Fluidigm164 CD95 DX5 Fluidigm 166 IL-10 JES3-907 Fluidigm 166 CD209 DCN46 BD165 CD45RO UCHL1 Fluidigm 167 CCR7 G043H7 Fluidigm 167 CD38 HIT2 Fluidigm166 BTLA J168-540 BD 168 TNF-a MAb11 BioLegend 169 CD33 WM53 Fluidigm167 CCR7 G043H7 Fluidigm 169 CD19 HIB19 Fluidigm 170 CD3 SP34.2 Fluidigm169 CD19 HIB19 Fluidigm 170 CD3 SP34.2 Fluidigm 173 CD56 NCAM16.2 BD170 CD3 SP34.2 Fluidigm 171 Granzyme-B GB11 Fluidigm 174 HLA-DR L243 Fluidigm171 Granzyme-B GB11 Fluidigm 173 CD56 NCAM16.2 BD 175 CD274 (PDL1) 29E.2A3 Fluidigm172 CD57 hCD57 Fluidigm 175 PD-1 EH12.2H7 Fluidigm 209 CD11b ICRF44 Fluidigm173 CD56 NCAM16.2 BD 176 CD127 A019D5 Fluidigm174 HLA-DR L243 Fluidigm175 PD-1 EH12.2H7 Fluidigm176 CD127 A019D5 Fluidigm209 CD16 3G8 Fluidigm
Panel 1 (T cell phenotype) Panel 2 (cytokines) Panel 3 (myeloid)

Krieg et al. - HighDimanalysispredictsresponsetoPD-1therapy–supplementarydata
page 10 of 26
Supplementary Table 3 – Characteristics of melanoma patients and healthy donors used for the validation study. Time point 1
Healthy donors N TOTAL 14 Age in years – mean (range) 63.4 (46-91) Sex – male/female 7/7
Melanoma patients Before therapy
Responders N TOTAL 15 Age in years – mean (range) 58.9 (31-93) Sex – male/female 9/6
Non-responders N TOTAL 16 Age in years – mean (range) 61.9 (27-89) Sex – male/female 8/8
Supplementary Figure 1. Experimental design for the discovery cohort using CyTOF.
Experimental setup for theprocessingof frozenPBMC frommatchedsamplesbeforeandafter
PD-1 immunotherapy. (A)Total samplesn=60weredistributedover2datasets. 20melanoma
patients before (R=11 andNR=9) and after (12weeks treatment) treatment initiation and 10
healthycontrolsusingmetal-labeledantibodiesand(B)subsequentprocessingofsamplesfrom
Afortheacquisitionbymasscytometryandfinalbioinformaticsanalysis.
x5! x5!
x5! x5!
x5! x5!
Before treatment (baseline)!
After treatment!(time point)!
Staining ! Staining !
Treated!
Dat
aset
1
(mea
sure
men
t 1)!
x5! x5!
x4! x4!
x6! x6!
Staining ! Staining !
Treated!
Dat
aset
2
(mea
sure
men
t 2)!
x5! x5!
x5! x5!
x5! x5!
Before treatment (baseline)!
After treatment!(time point)!
Staining! Staining!
Treated!D
atas
et 1
(m
easu
rem
ent 1
)!
x5! x5!
x4! x4!
x6! x6!
Staining! Staining!
Treated!
Dat
aset
2
(mea
sure
men
t 2)!
before after before afterA
B

Krieg et al. - HighDimanalysispredictsresponsetoPD-1therapy–supplementarydata
page 11 of 26
Supplementary Figure 2. Simultaneous detection of T cell differentiation and activation
markers in blood. PBMCs from 5 healthy donors and 10melanoma patients were barcoded,
stainedwithapanelof31antibodiesandanalyzedbymasscytometry.Biaxialmasscytometry
plotsshowthestainingqualitybygatingoncombinedhealthysamplesfromarespectivepositive
andnegativecellpopulationoftheshowndifferentiationandactivationmarker.Eachplotshows
arepresentationoffourindependentexperiments.
Krieg et al. - HighDimanalysispredictsresponsetoPD-1therapy–supplementarydata
page 12 of 26
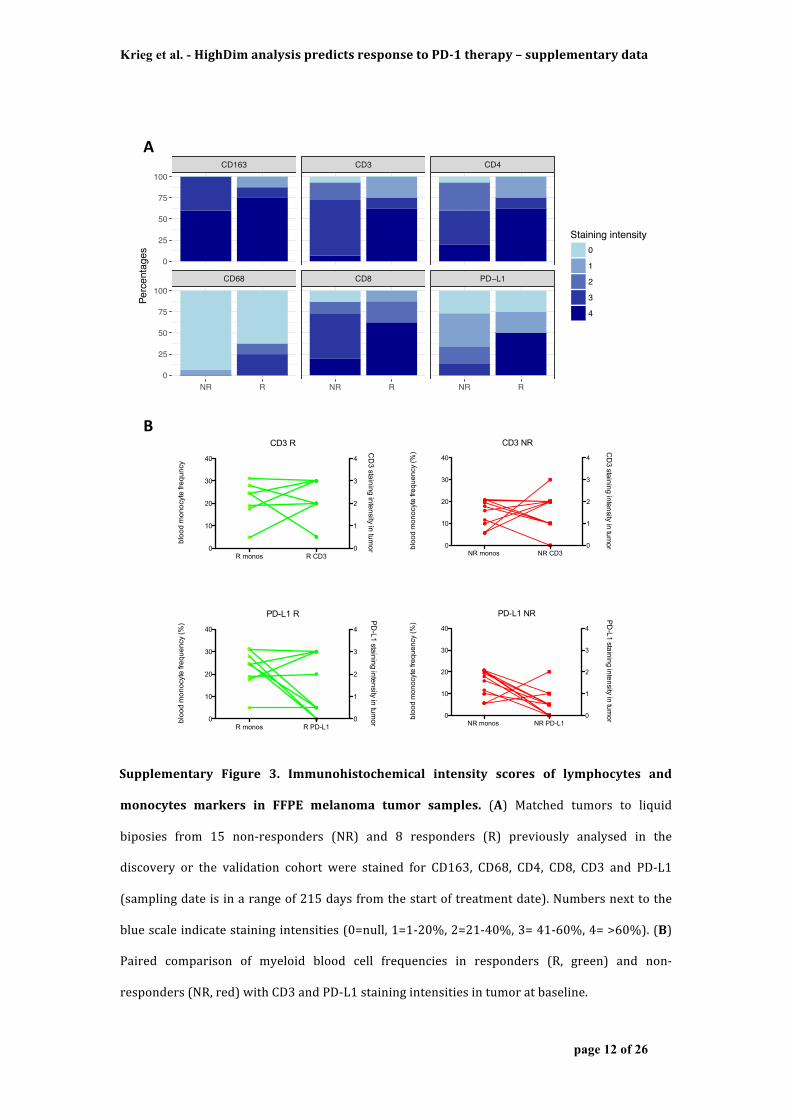
Supplementary Figure 3. Immunohistochemical intensity scores of lymphocytes and
monocytes markers in FFPE melanoma tumor samples. (A) Matched tumors to liquid
biposies from 15 non-responders (NR) and 8 responders (R) previously analysed in the
discovery or the validation cohort were stained for CD163, CD68, CD4, CD8, CD3 and PD-L1
(samplingdateisinarangeof215daysfromthestartoftreatmentdate).Numbersnexttothe
bluescaleindicatestainingintensities(0=null,1=1-20%,2=21-40%,3=41-60%,4=>60%).(B)
Paired comparison of myeloid blood cell frequencies in responders (R, green) and non-
responders(NR,red)withCD3andPD-L1stainingintensitiesintumoratbaseline.
CD68 CD8 PD−L1
CD163 CD3 CD4
NR R NR R NR R
0
25
50
75
100
0
25
50
75
100
Perc
enta
ges
Staining intensity0
1
2
3
4
Statisticalanalysisofthehistology
CD3 R
R monos R CD30
10
20
30
40
0
1
2
3
4
bloo
d m
onoc
yte
frequ
ncy
CD
3 staining intensity in tumor
PD-L1 R
R monos R PD-L10
10
20
30
40
0
1
2
3
4
bloo
d m
onoc
yte
frequ
ency
(%)
PD
-L1 staining intensity in tumor
CD3 NR
NR monos NR CD30
10
20
30
40
0
1
2
3
4
bloo
d m
onoc
yte
frequ
ency
(%) C
D3 staining intensity in tum
or
PD-L1 NR
NR monos NR PD-L10
10
20
30
40
0
1
2
3
4
bloo
d m
onoc
yte
frequ
ency
(%)
PD
-L1 staining intensity in tumor
A
B

Krieg et al. - HighDimanalysispredictsresponsetoPD-1therapy–supplementarydata
page 13 of 26
Complexheatmap supportingfigure2D
ABeforetherapy
Legend:
CD57
CD28
CD27
Granzym
e−B
CD95
HLA−D
R
CXC
R3
CCR4
CTLA4
BTLA
LAG−3
CD11a
CD69
PD−1
CCR5
CCR6
adjp_N
RvsR_base
346789101314151617181920242526272829303536373839404546474849505657585960666970761251112212231323334414243445152536162636471727374758182838491929394545565787980858687899095969798991002367687788
cluster_mergingnaiveCMEMTE
cluster12345
in
00.250.50.751
out
00.250.50.751
apvsup(0.01,0.05]up(0.1,1]down(0,0.01]down(0.1,1]
merged
5clu
sters
adjustedp-value
CD11b
HLA−D
R
ICAM
−1
CD33
CD38
CD86
CD141
CD274_PD
L1
CD64
CD56
CD62L
CD1c
CD209
CD34
CD11c
CD303
CD45
CD14
CD61
CD16
CD123
adjp_N
RvsR_base
5671738394849505860891819202829304025273637471415344243536364656667747576777879838485868788899094959697989910035454654555644575968697080101626
cluster_mergingCD14+_monosCD33lo_monoDCpDCdrop
cluster1234567891011121314151617181920
in
00.250.50.751
out
00.250.50.751
apvs(0,0.05](0.05,0.1](0.1,1]
CD11b
HLA−D
R
ICAM
−1
CD33
CD38
CD86
CD141
CD274_PD
L1
CD64
CD56
CD62L
CD1c
CD209
CD34
CD11c
CD303
CD45
CD14
CD61
CD16
CD123
adjp_N
RvsR_base
5671738394849505860891819202829304025273637471415344243536364656667747576777879838485868788899094959697989910035454654555644575968697080101626
cluster_mergingCD14+_monosCD33lo_monoDCpDCdrop
cluster1234567891011121314151617181920
in
00.250.50.751
out
00.250.50.751
apvsup(0,0.01]up(0.01,0.05]up(0.05,0.1]up(0.1,1]down(0,0.01]down(0.01,0.05]down(0.05,0.1]down(0.1,1]
normalizedmedianexpression
Krieg et al. - HighDimanalysispredictsresponsetoPD-1therapy–supplementarydata
page 14 of 26
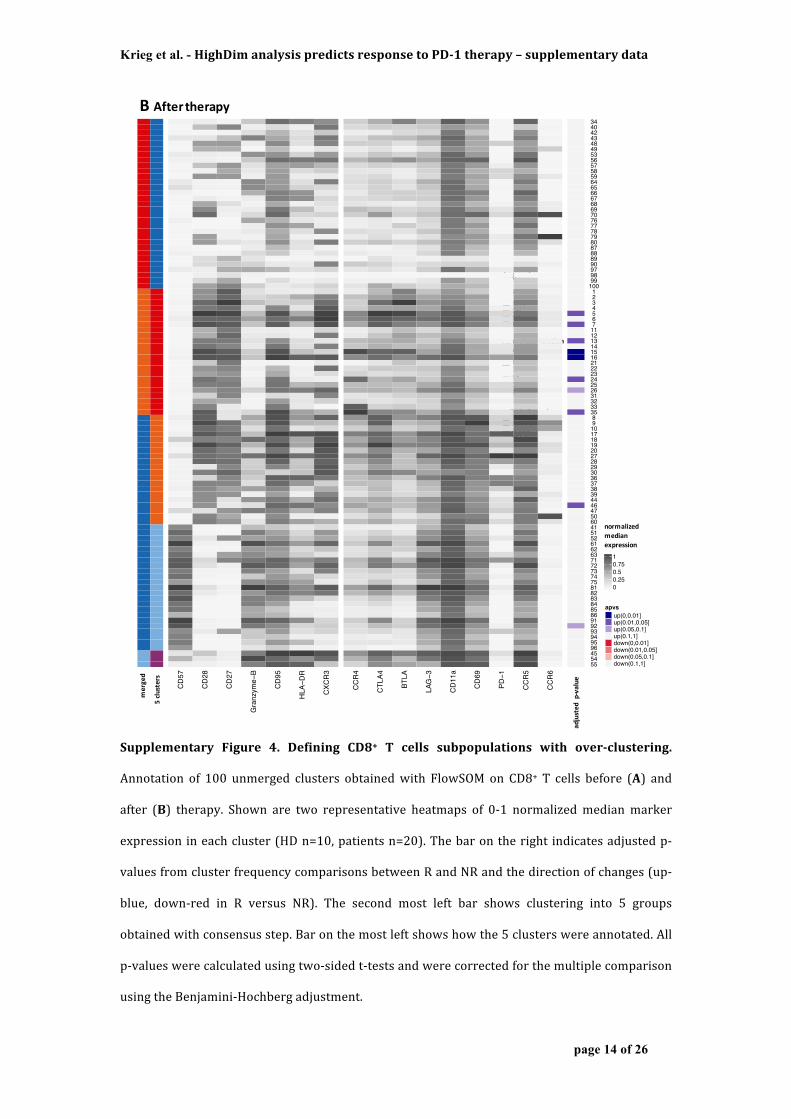
Supplementary Figure 4. Defining CD8+ T cells subpopulations with over-clustering.
Annotation of 100 unmerged clusters obtainedwith FlowSOM on CD8+ T cells before (A) and
after (B) therapy. Shown are two representative heatmaps of 0-1 normalizedmedianmarker
expressionineachcluster(HDn=10,patientsn=20).Thebarontheright indicatesadjustedp-
valuesfromclusterfrequencycomparisonsbetweenRandNRandthedirectionofchanges(up-
blue, down-red in R versus NR). The second most left bar shows clustering into 5 groups
obtainedwithconsensusstep.Baronthemostleftshowshowthe5clusterswereannotated.All
p-valueswerecalculatedusingtwo-sidedt-testsandwerecorrectedforthemultiplecomparison
usingtheBenjamini-Hochbergadjustment.
Complexheatmap supportingfigure2D
merged
5clu
sters
CD57
CD62L
CCR7
CD28
CD27
CD127
Granzym
e−B
CD95
CD45RO
HLA−D
R
CD45RA
CXC
R3
CCR4
CTLA4
BTLA
LAG−3
CD11a
CD69
PD−1
CCR5
CD25
CCR6
adjp_N
RvsR_base
346789101314151617181920242526272829303536373839404546474849505657585960666970761251112212231323334414243445152536162636471727374758182838491929394545565787980858687899095969798991002367687788
cluster_mergingnaiveCMEMTE
cluster12345
in
00.250.50.751
out
00.250.50.751
apvs(0,0.05](0.05,0.1](0.1,1]
CD57
CD62L
CCR7
CD28
CD27
CD127
Granzym
e−B
CD95
CD45RO
HLA−DR
CD45RA
CXCR
3
CCR4
CTLA4
BTLA
LAG−3
CD11a
CD69
PD−1
CCR5
CD25
CCR6
adjp_N
RvsR_base
346789101314151617181920242526272829303536373839404546474849505657585960666970761251112212231323334414243445152536162636471727374758182838491929394545565787980858687899095969798991002367687788
cluster_mergingnaiveCMEMTE
cluster12345
in
00.250.50.751
out
00.250.50.751
apvs(0,0.05](0.05,0.1](0.1,1]
cluster name
normalized medianexpression
adjusted p-value
BAftertherapy
Legend:
CD57
CD28
CD27
Granzym
e−B
CD95
HLA−D
R
CXC
R3
CCR4
CTLA4
BTLA
LAG−3
CD11a
CD69
PD−1
CCR5
CCR6
adjp_N
RvsR_tx
344042434849535657585964656667686970767778798087888990979899100123456711121314151621222324252631323335891017181920272829303637383944464750604151526162637172737475818283848586919293949596455455
cluster_mergingnaiveCMEMTE
cluster12345
in
00.250.50.751
out
00.250.50.751
apvsup(0,0.01]up(0.01,0.05]up(0.05,0.1]up(0.1,1]down(0.1,1]
adjustedp-value
CD11b
HLA−D
R
ICAM
−1
CD33
CD38
CD86
CD141
CD274_PD
L1
CD64
CD56
CD62L
CD1c
CD209
CD34
CD11c
CD303
CD45
CD14
CD61
CD16
CD123
adjp_N
RvsR_base
5671738394849505860891819202829304025273637471415344243536364656667747576777879838485868788899094959697989910035454654555644575968697080101626
cluster_mergingCD14+_monosCD33lo_monoDCpDCdrop
cluster1234567891011121314151617181920
in
00.250.50.751
out
00.250.50.751
apvs(0,0.05](0.05,0.1](0.1,1]
CD11b
HLA−D
R
ICAM
−1
CD33
CD38
CD86
CD141
CD274_PD
L1
CD64
CD56
CD62L
CD1c
CD209
CD34
CD11c
CD303
CD45
CD14
CD61
CD16
CD123
adjp_N
RvsR_base
5671738394849505860891819202829304025273637471415344243536364656667747576777879838485868788899094959697989910035454654555644575968697080101626
cluster_mergingCD14+_monosCD33lo_monoDCpDCdrop
cluster1234567891011121314151617181920
in
00.250.50.751
out
00.250.50.751
apvsup(0,0.01]up(0.01,0.05]up(0.05,0.1]up(0.1,1]down(0,0.01]down(0.01,0.05]down(0.05,0.1]down(0.1,1]
normalizedmedianexpression
Krieg et al. - HighDimanalysispredictsresponsetoPD-1therapy–supplementarydata
page 15 of 26
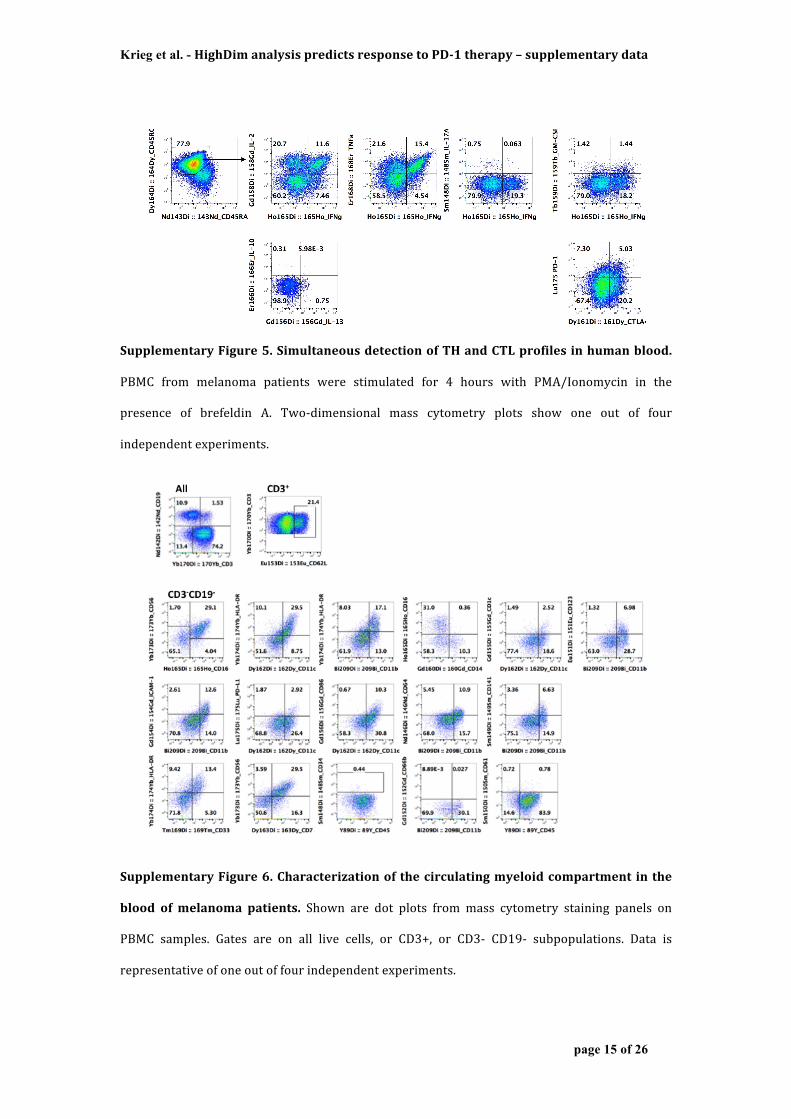
SupplementaryFigure5.SimultaneousdetectionofTHandCTLprofilesinhumanblood.
PBMC from melanoma patients were stimulated for 4 hours with PMA/Ionomycin in the
presence of brefeldin A. Two-dimensional mass cytometry plots show one out of four
independentexperiments.
SupplementaryFigure6.Characterizationofthecirculatingmyeloidcompartment inthe
blood of melanoma patients. Shown are dot plots from mass cytometry staining panels on
PBMC samples. Gates are on all live cells, or CD3+, or CD3- CD19- subpopulations. Data is
representativeofoneoutoffourindependentexperiments.

Krieg et al. - HighDimanalysispredictsresponsetoPD-1therapy–supplementarydata
page 16 of 26
SupplementaryFigure7.Comparisonoffrequenciesincellularsub-populationsusingthe
myeloidpanel. Cluster frequencies in healthy donors (HD, black), non-responders (NR, pink)
and responders (R, green) in dataset 1 and 2. Asterisks indicate the significance level of
differences in cell frequencies between NR and R before and after treatment (numbers show
adjustedp-values,HDn=20,NRn=18,Rn=22).Boxplotsrepresenttheinterquartilerange(IQR)
withthehorizontallineindicatingthemedian.Whiskersextendtothefarthestdatapointwithin
amaximumof1.5IQR.Allp-valueswerecalculatedusingtwo-sidedt-testsandwerecorrected
forthemultiplecomparisonusingtheBenjamini-Hochbergadjustment.
T_cells B_cells CD14− CD14+ NK_cells cDC pDC
0
1
2
3
0
1
2
4
6
8
10
0
10
20
30
2.55.07.5
10.012.5
7.5
10.0
12.5
15.0
4050607080
Freq
uenc
y (%
) HDNRR
data23data29dataset1dataset2
T_cells B_cells CD14− CD14+ NK_cells cDC pDC
0
1
2
3
0
1
2
4
6
8
10
0
10
20
30
2.55.07.5
10.012.5
7.5
10.0
12.5
15.0
4050607080
Freq
uenc
y (%
) HDNRR
data23data29
T_cells B_cells CD14− CD14+ NK_cells cDC pDC
0
1
2
3
012345
4
6
8
10
0
10
20
30
0
5
10
15
7.5
10.0
12.5
15.0
4050607080
Freq
uenc
y (%
) HDNRR
data23data29
T_cells B_cells CD14− CD14+ NK_cells cDC pDC
0
5
10
15
0
1
2
3
2.5
5.0
7.5
10.0
12.5
0
20
40
60
0
5
10
15
20
6
9
12
15
20
40
60
80
Freq
uenc
y (%
) HDNRR
data23data29
Before
After
3.50e-03
1.88e-02
1.88e-023.50e-03
FrequencyinPBM
C(%)
SupplementaryFigure7
1.40e-02
1.40e-02

Krieg et al. - HighDimanalysispredictsresponsetoPD-1therapy–supplementarydata
page 17 of 26
Supplementary Figure 8. Relationship between the frequency of IFN-γ-producing T cells
withmyeloidcellfrequencyandmedianPD-L1expressiononmyeloidcells.Presentedare
resultsforafter-treatmentsamplesfromdataset2(n=15).RindicatestheSpearmancorrelation.
10
20
30
10 20 30CD14pos_monos
IFN_gpos data29.tx
txHDtxNRtxR
0.87
4
8
12
16
10 20 30CD14pos_monos
IFN_gpos data29.tx
txHDtxNRtxR
CD4 CD8
Freq
uencyofIFN-γ
+ (%)
FrequencyofCD14+myeloidcells(%)
MedianPD-L1expressiononallmyeloidcells
0
10
20
30
40
50
20 30 40 50CD4
myeloid
data23.base
data23.tx
data29.base
data29.tx
baseHDbaseNRbaseRtxHDtxNRtxR
HDNRR
R=0.94 R=0.87
4
8
12
16
0.1987 0.1988 0.1989 0.1990CD274_PDL1
IFN_gpos data29.tx
txHDtxNRtxR
0.93
R=0.93
20
30
0.1987 0.1988 0.1989 0.1990CD274_PDL1
IFN_gpos data29.tx
txHDtxNRtxR
0.87
R=0.87

Krieg et al. - HighDimanalysispredictsresponsetoPD-1therapy–supplementarydata
page 18 of 26
Supplementary Figure 9. In depth analysis of the CD14+ myeloid compartment before
therapy.Initially,over-clusteringinto100groupswasperformedwithFlowSOMonallcellsfrom
HD,NR andR, before therapy and under therapy for each dataset (1 and 2) separately. Using
consensus clustering, 100 clusters were merged into 20 groups, which were then manually
annotated.Shownaremarkerprofiles(medianmarkerexpressionnormalizedto0-1range,HD
n=10,patientsn=20)forclusters(atthe100resolution)thatcorrespondtoCD14+cells(redbar
ontheleft).Columnontherightshowsadjustedp-valuesanddirectionofchange(upordown)of
individualclusterswhencomparingRtoNRbeforetherapy(base).
CD11b
HLA−D
R
ICAM
−1
CD33
CD38
CD86
CD141
CD274_PD
L1
CD64
CD56
CD62L
CD1c
CD209
CD34
CD11c
CD303
CD45
CD14
CD61
CD16
CD123
adjp_N
RvsR_base
5671738394849505860891819202829304025273637471415344243536364656667747576777879838485868788899094959697989910035454654555644575968697080101626
cluster_mergingCD14+_monosCD33lo_monoDCpDCdrop
cluster1234567891011121314151617181920
in
00.250.50.751
out
00.250.50.751
apvs(0,0.05](0.05,0.1](0.1,1]
Complexheatmap supporting figure4D
CD11b
HLA−D
R
ICAM
−1
CD33
CD38
CD86
CD141
CD274_PD
L1
CD64
CD56
CD62L
CD1c
CD209
CD34
CD11c
CD303
CD45
CD14
CD61
CD16
CD123
adjp_N
RvsR_base
5671738394849505860891819202829304025273637471415344243536364656667747576777879838485868788899094959697989910035454654555644575968697080101626
cluster_mergingCD14+_monosCD33lo_monoDCpDCdrop
cluster1234567891011121314151617181920
in
00.250.50.751
out
00.250.50.751
apvsup(0,0.01]up(0.01,0.05]up(0.05,0.1]up(0.1,1]down(0,0.01]down(0.01,0.05]down(0.05,0.1]down(0.1,1]
normalizedmedianexpression
adjustedp-value
CD11b
HLA−D
R
ICAM−1
CD33
CD38
CD86
CD141
CD274_PDL1
CD64
CD56
CD62L
CD1c
CD209
CD34
CD11c
CD303
CD45
CD14
CD61
CD16
CD123
adjp_N
RvsR_base
adjp_N
RvsR_tx
313241425152536263617273747181828393949192123456781112131415161723242526273536373848582122333443448645464755565766765464657584859596
cluster_mergingCD14+_monosCD33lo_monoDCpDC
cluster1346791011131415171819
in
00.250.50.751
out
00.250.50.751
apvsup(0,0.01]up(0.01,0.05]up(0.05,0.1]up(0.1,1]down(0,0.01]down(0.01,0.05]down(0.05,0.1]down(0.1,1]
SupplementaryFigure9
adjustedp-valuebase
adjustedp-valueth
erapy
CD14+clu
ster
20cluster
Therapy
42 61 83 93 94 91 920
2
4
6HDNRR
cluster
Clu
ster
freq
uenc
y (%
)Base
42 61 83 93 94 91 920
2
4
6
cluster
Clu
ster
freq
uenc
y (%
)

Krieg et al. - HighDimanalysispredictsresponsetoPD-1therapy–supplementarydata
page 19 of 26
Supplementary Figure10. Identificationof amonocyte signaturebyCellCnn. Frequency of
cells discovered using CellCnn in non-responders (NR) and responders (R) from dataset 1 (left panel)
and relative marker distributions, shown as scaled histograms of arcsinh-transformed marker
expression, for all cells (blue) and the detected population (red) (right panel).
Supplementary Figure 11. Back projection of cells identified using CellCnn into tSNE.
Shownare tSNEplots corresponding toFigure3A.Cells identifiedbyCellCnnaremarkedwith
blackcircles(arrow).
Filtering using CellCnn
***
CD45KS=0.34
CD19KS=0.09
CD64KS=0.45
CD303KS=0.27
CD34KS=0.28
CD141KS=0.58
CD61KS=0.40
CD123KS=0.44
CD66bKS=0.58
CD62LKS=0.19
ICAM-1KS=0.84
CD1cKS=0.49
CD86KS=0.64
CD14KS=0.85
CD11cKS=0.82
CD7KS=0.26
CD16KS=0.16
CD209KS=0.18
CD38KS=0.37
CD33KS=0.56
CD3KS=0.24
CD56KS=0.13
HLA-DRKS=0.51
PD-L1KS=0.45
CD11bKS=0.48
●
●
●
●
●
●
●
●
●
●
●
●
●
●
●
●
●
●
●●
●
●
●
●
●
●
●
●
●
●
●
●
●
●
●
●●
●
●
●
●
●
●
●
●
●● ●
●
●
●
●
●
●
●
●
●
●
●●
●
●
●
●
●
●
●
●
●
●
●
● ●
●
●
●●
●
●
●
●
●
●
●
●
●
●
●
●
●
●
●
●
●
●
●●
●
●
●
●
●
●
●
●
●
●
●
●
●
●
●
●
●●
●
●
●
●
●
●●
●
●
●
●
●
●
●
●
●
●
●
●
●
●
●
●
●
●
●
●
●
●
●
●
●
●●
●
●
●
●
●
●
●
●
●
●
●
●
●
●
●
●
●
●
●
●
●
●
●
●
●
●
●
●
●
●
●
●
●
●
●
●
●
●
●
●
●
●
●
●● ●
●
●
●
●
●
●
●
●
●
●
●
●
●
●
●
●
●●
●
●
●
●
●
●
●
●
●
●
●
●
●
●
●
●
●
●
●
●
●
●
●
●
●
●
●
●
●
●
●
●
●
●
●
●
●
●
●
●
●
●
●
●
●
●
●
●
●
●
●
●
●
●●
●
●
●
●
●
●
●
●
●
●
●
●
●
●
●
●
●
●
●
●
●
●
●
●
●
●
●
●
●
●
●
●
●
●
●
●
●
●
●
●
●
●
●
●
●
●
●
●●
●
●
●
●
●
●
●
●
●
●
●
●
●
●
●
●
●
●●
●
●
●
●
●
●
●
●
●
●
●
●
●
●
●
●
●
●
●
●
●
●
●
●
●
●
●
●
●
●
●
●
●
●●
●
●
●
●
●
●
●
●
●
●
●
●
●
●
●
●●
●
●
●
●
●
●
● ●
●
●
●
●
● ●
●
●
●
●
●
●
●
●
●
●
●
●
●
●
●
●
●
●
●
●
●
●●
●
●
●
●
●●
●●
●
●
●
●
●
●
●
●
●
●
●
●
●
●
●
●
●
●
●
●
●
●
●
●
●
●
●
●
●
●
●
●
●●
●
●
●
●
●
●
●
●
●
●
●
●
●
●
●
●
●
●
●
●
●
●
●
●
●
●
●
●
●
●
●
●●
●●
●
●
●
●
●
●
●
●
●
●
●
●
●
●
●
●
●
●
●
●
●
●
●
●
●
●
●
●
●
●
●
●
●
●
●
●
●
●
●
●
●
●
●
●
●
●
●
●
●
●
●
●
●
●
●
●
●●
●
●
●
●
●
●
●
●
●
●
●
●
●
●
●
●
●
●
●
●
●
●
●
●
●
●
●
●
●
●
●
●
●
●
●
●
●
●
●
●
●
●
●
●
●
●
●
●
●
●
●
●
●●
●
●
●
●
●
●
●●
●
●
●
●
●
●●●
●
●
●
●
●
●
●
●
●
●
●
●
●
●
●
●●
●
●
● ●
●
●
●
●
●
●
●
●
●
●
●
●
●
●
●
●
●
●
●
●●
●
●
●
●
●
●
●
●
●
●
●
●
●
● ●
●
●
●
●
●
●
●
●
●●
●
●
●
●
●
●
●
●
●
●
●
●
●
●
●
●
●
●
●
●
●
●
●
●
●
●
●
●
●
●
●
●
●
●
●
●
●
●
●
●
●
●
●
●
●
●
●
●
●
●
●
●●
●
●
●
●
●
●
●
●
●
●
●
●
●
●
●
●
●
●
●
●
●
●
●
●
●
●
●
●
●
●
● ●
●
●
●
●
●●●
●
●
●
●
●
●
●
●
●
●
●
●
●
●
●
●
●
●●
●
●
●
●
●
●
●
●
●
●
●
●
●
●
●
●
●
●
●
●
●
●
●
●
●
●
●
●
●
●
●
●
●
●
●●
●
●
●
●
●
●
●
●
●
●
●
●
●
●
●
●
●
●
●●
●
●
●●
●
●
●
●
●
●
●
●
●
●
●
●●
●
●
●
●
●
●
●
●
●
●
●
●
●
●
●●
●●
●
●
●
●
●
●
●
●
●
●
●
●
●●
●
●
●
●
●
●
●
●
●
●
●
●
●
●
●
●
●
●
●
●●
●
●
●
●
●
●
●
●
●
●
●
●
●
●
●
●●
●
●
●●
●
●
●
●
●
●
●
●
●
●
●
●
●
●
●
●
●
●
●
●
●
●
●
●
●
●
●
●
●
●
●
●
●
●
● ●
●
●
●
●
●
●
●
●
●
●
● ●
●
●
●
●
●
●
●
●
●●
●
●
●
●
●
●
●
●
●
●
●
●
●
●
●
●
●
●
●
●
●
●
●
●●
●
●
●
●
●
●
●
●●
●
●
●
●
●
●●
●
●
●
●
●
●●
●
●
●
●
●
●
●
●●
●
●
●
●
●
●
●
●
●
●
●
●
●
●
●
●
●
●
●
●
●●
●
●
●
●
●
●
●
●
●
●
●
●
●
●●
●
●
●
●
●
●
●
●
●
●
●
●
●
●
●
●●
●
●
●
●
●
●
●
●
●
●
●
●
●
●
●
●
●
●
●
●
●
●
●●
●
●
●
●
●
●
●
●
●
●
●
●
●
●
●
●
●●
●
●
●
●
●
●
●
● ●
●
●
●
●
●
●
●
●
●
●
●●
●
●
●
●
●
●
●
●
● ●
●
●
●
●
●
●
●
●
●
●
●
●
●
●
●
●
●
●
●
●
●
●
●● ●
●
●
●
●
●
●
●
●
●
●
●
●
●
●
●
●
●
●
●
●
●
●
●
●
●
●
●
●
●
●
●
●●
●
●
●
●
●
●
●
●
●
●
●
●
●
●
●
●●
●
●
●
●
●
●
●
●
●
●
●
●
●
●
●
●
●
●
●
●
●
●
●
●
●
● ●
●
●
●●
●
●
●
●
●
●
●
●
●
●
●
●
●
●
●
●
●
●
●
●
●
●
●
●
●
●
●
●
●
●
●
●
●
●
●
●
●
●
●
●
●
●●
●
●
●
●
●
●
●
●
●
●●
●
●
●
●
●
●
●
●
●
●
●
●
●
●
●
●
●
●
●
●●
●
●
●
●
●
●
●
●
●
●
●
●
●
●
●
●
●
●
●
●
●
●
●
●
●
●
●
●
●
●
●
●
●
●
●
●
●
●
●
●
●
●
● ●
●
●
●
●
●
●
●
●
●
●
●
●
●
●
●
●
●
●
●
●
●
●
●
●
●
●●
●
●
●
●
●
●
●
●
●
●
●
●
●
●
●
●
●
●
●
●
●
●
●
●
●
●
●
●
●
●
●
●
●
●
●
●
●
●
●
●
●
●
●
●
●
●
●
●
●
●
●
●
●
●
●
●●
●
●
●
●
●
●
●
●
●
● ●
●
●
●
●
●
●
●
●
●
●
●
●
●
●
●
●
●
●
●
●
●
●
●
●
●
●
●
●
●
●
●
●
●
●
●
●
●
●
●●
●
●
●
●
●
●
●
●
●
●
●
●
●
●
●
●
●
●
●
●
●
●
●
●
●
●
●
●
●
●
●
●
●
●
●
●
●
●
● ●
●
●
●
●
●
●
●
●
●
●
●
●
●
●
●
●
●
●
●
●
●
●
●
●
●
●
●
●
●
●
●
●
●
●
●
●
●
●
●
●
●●
●
●
●
●
●
●
●
●
●
●
●
●
●
●
●
●
●
●
●
●
●
●
●
●
●
●
●
●
●
●
●
●
●
●
●
●
●
●
●
●
●
●
●
●
●
●
●
●
●
●
●
●
●
●
●
●●
●
●
●
●
●
●
●
●
●
●
●
●
●●
●
●
●
●
●
●●
●
●
●
●
●
●
●●
●
●
●
●●●
●
●
●
●
●
●
●
●
●
●
●
●
●
●
●
●
●
●
●
●
●
●
●
●
●
●
●
●
●
●
●
●
●
●
●
●
●
●
●
●
●
●
●
● ●
●
●
●
●
●
●
●
●
●
●
●
●
●
●
●
●●
●
●
●
●
●
●
●
●
●
●
●
●
●
●
●
●
●
●
●
●
●
●
●
●
●
●
●
●
●
●
●
●
●
●
●
●
●
●
●
●
●
●
●
●
●
●
●
●
●
●
●
●
●
●
●
●
●
●
●
●
●
●
●
●
● ●
●
●
●
●
●
●
●
●
●
●
●
●
●
●●
●
●
●
●
●
●
●
●
●
●
●
●
●
●
●
●
●
●
●
●
●
●
●
●
●
●
●
●●
●
●
●
●
●
●
●
●
●
●
●
●
●
●
●
●●
●
●
● ●
●
●
●
●
●
●
●
●
●
●
●
●
●
●
●
●
●
●
●
●
●
●
●
●
●
●
●
●
●
●
●
●
●
●
●
●
●
●
●
●
●
●
●
●
●
●
●
●
●
●
●
●
●
●
●
●
●
●
●
●
●
●
●
●
●
●●
●
●
●
●
●
●
●
●
●
●
●
●●
●
●
●
●
●
●●
●
●
●
●
●
●
●
●
●
●
●
●
●
●
●
●
●
●
●
●
●
●
●
●
●
●
●
●
●
●
●
●
●
●
●
●
●
●
●
●
●
●
●
●
●
●
●
●
●
●
●
●
●
●
●
●
●
●
●
●
●●
●
●
●
●
●
●
●
●
●
●
●
●
●
●
●
●
●
●
●
●
●
●
●
●●
●
●
●
●●
●
●
●
●
●
●
●
●
●
●
●
●
●
●
●
●
●
●●
●
●
●
●
●
●
●
●
●
●●●
●
●
●
●
●
●
●
●
●
●
●
●●
●
●
●
●
●
●
●
●
●
●●
●
●
●
●
●
●
●
●
●●
●
●
●
●
●
●
●
●●
●
●
●
●
● ●
●
●
●
●
●
●
●
●
●
●
●
●
●●
●
●
●
●
●
●
●
●
●
●
●
●
●
●
●
●
●
●
●
●
●
●
●
●
●
●
●
●
●
●
●
●●
● ●
●
●
●
●
●
●
●
●
●
●
●
●
●
●
●
●
●
●
●
●●
●
●
●
●
●
●
●
●
●
●
●
●
●
●
●
●
●
●
●
●
●
●
●
●
●
●
●
●
●
●●
●
●
●
●
●●
●
●
●
●
●
●
●
●
●
●
●
●
●
●
●
●
●
●
●
●
●
●
●
●
●
● ●
●
●
●
●
●
●
●
●
●
●
●
●
●
●
●
●
●
●
●
●
●
●
●
●●
●
●
●
●
●
●
●
●
●
●
●
●
●
●
●
●
●
●
●
●
●
●
●
●
●
●
●
●
●
●
●
●
●
●
●
●
●●
●
●
●
●
●
●
●
●
●
●
●
●
●
●
●
●
●
●
●
●
●
●●
●
●
●
●
●
●
●
●
●
●
●
●
●
●
●
●
●
●
●
●
●
●
●
●
●
●
●
●
●
●
●
●
●
●
●
●
●
●
●
●
●
●
●
●
●
●
●
●
●
●
●
●
●
●
●
●●
●
●
●
●
●
●
●
●
●
●
●
●
●
●
●
●
●
●●
●
●
●
●
●
●
●
●
●●
●
●
●
●
●
●
●
●●
●
●
●
●
●
●
●
●
●
●
●
●
●
●
●
●
●
●
●
●
●
●
●
●●
●
●
●
●●
●
●
●
●
●
●●
●
●
●
●
●
●
●
●
●
●
●
●
●
●
●
●
●
●
●
●
●
●●
●
●
●
●
●
●
●
●
●
●
●
●
●
●
●
●
●
●
●
●
●
●
●
●
●
●
●
●
●
●
●
●
●
●
●
●●
●
●
●
●
●
●
●
●
●
●
●
●
●
●
●
●
●
●
●
●
●
●
●●
●
●
●
●
●
●
●
●
●
●
●
●
●
●
●
●
●
●
●
●
●
●●
●
●
●
●
●
●
●●
●
●●
●
●
●
●
●
●
●
●
●
●
●
●
●
●
●
●
●
●
●
●
●
●
●
●
●
●
●
●
●
●
●
●
●
●
●
●●
●
●
●
●
●●
●
●
●
●
●
●
●
●
●●
● ●
●
●
●
●
●
●●
●
●
●●
●
●
●
●
●
●●
●
●
●
●●
● ●
●
●
●
●
●
●
●
●
●
● ●
●
●
●
●
●●
●
●
●●
●
●
●
●
●
●
●
●
●●
●
●
●
●
●
●
●
●
●
●
●
●
●
●
●●
●
●
●
●
●
●
●
●
●
●
●
●
●
●
●
●
●
●
●
●
●
●
●
●
●
●
●
●
●
●
●
●
●
●
●
●●
●
●
●
●
●
●
●
●
●
●
●
●
●
●●
●
●
●
●
●
●
●
●
●
●
●
●
●
●
●
●
●
●
●
●
●
●
●
●
●
●
●
●
●
●
●
●
●
●
●
●
●
●
●
●
●
●●
●
●
●
●
●
●
●
●
●
●●
●
●
●
●
●●
●
●
●
●
●
●
●
●
●
●
●
●
●
●
●
●
●
●
●
●
●
●
●
●
●
●
●
●
●
●
●
●
●
●
●
●
●
●
●
●
●
●
●
●
●
●●●
●
●
●
●
●●
●
●
● ●
●
●
●
●
●
●
●
●
●
●
●
●
●
●
●
●
●
●
●
●
●
●
●
●
●
●
●
●
●
●
●
●
●
●
●
●
●
●
●
●●
●
●
●
●
●
●
●
●
●
●
●
●
●
●
●
●
●
●
●
●
●
●
●
●
●
●
●
●
●
●
●
●
●
●
●
●
●
●
●
●
●
●
●
●
●
●
●
●
●
●
●
●
●
●
●
●
●
●●
●
●
●
●
●
●
●
●
●
●
●
●
●
●
●
●
●
●
●
●
●
●
●
●
●
●
●
●
●
●
●
●
●
●●
●
●
●
●
●
●
●
●
● ●
●
●
●
●
●
●
●
●
●
●
●
●
●
●
●
●
●
●
●
●
●
●
●
●
●
●
●
●
●
●●
●
●
●
●
●
●
●
●
●
●
●
●
●●
●
●
● ●
●
●●
●
●
●
●
●
●
●
●
●●
●●
●
●
●
●
●
●
●
●
●
●
●
●
●●
●
●
●
●
●
●
●
●
●
●
●
●
●
●
●
●
●
●
●
●
●
●
●●
●
●
●
●
●
●
●
●
●
●
●
●
●
●
●
●
●
●
●
●
●
●
●
●
●
●
●●
●
●
●
●
●
●
●
●
●
●
●
●
●
●
●
●
●
●
●●
●
●
●
●
●
●
●
●
●
●
●
●
●
●
●
●
●
●
●
●
●
●
●●
●
●
●
●
●
●
●
●
●
●●
●
●
●
●
●
●
●
●
●
●
●
●
●
●
●
●●
●
●
●
●●
●
●
●
●
●
●
●
●
●
●
●
●
●
●
●
●
●●
●
●
●
●
●
●
●
●
●
●
●
●
●
●
●
●
●
●
●
●
●
●
●
●
●
●
●
●
●
●
●
●
●
●
●
●
●
●
●
●
●
●
●
●
●
●
●
●
●
●
●
●
●
●
●
●
●
●
●
●
●
●●
●
●
●
●
●
●
●●
●
●
●
●
●
●
●
●
●
●
●●
●
●
●
●
●
●
●
●
●
●
●
●
●
●
●
●
●
●
●
●
●
●
●
●
●
●
●
●●
●
●
●
● ●
●
●
●
●●●
●
●●
●
●
●
●
●
●
●
●
●
●
●
●
●
●
●
●
●
●
●
●
●
●
●
●
●
●
●
●
●
●
●●
●
●
●
●
●●
●
●
●
●
●
●
●
●
●
●
●
●
●
●
●●
●
●
●
●
●
●
●
●
●
●
●
●
●
●
●
●
●
●
●
●
●
●
●
●
●
●
●
●●
●
●
●
●
●●
●
●
●
●
●
●
●
●
●
●
●
●
●
●
●
●
●
●
●
●
●
●
●
●●
●
●
●
●
●
●
●
●
●
●
●
●
●
●
●
●
●
●
●
●●
●
●
●
●
●
● ●
●
●
●
●
●
●
●
●
●
●
●
●
●
●●
●
●
●
●
● ●
●
●
●
●
●
●
●
●
●
●
●
●
●
●
●●
●
●
●
●
●
●
●
●
●
●
●
●
●
●
●
●
●
●
●
●
●
●
●
●
●
●
●●
●
●
●
●
●
●
●
●
●
●
●
●
●● ●
●
●
●
●
●
●
●
●
●
●
●
●
●
●
●
● ●
●
●
●
●
●
●
●
●
●
●
●
●
●
●
●
●
●
●
●
●
●
●
●
●
●
●
●
●
●
● ●
●
●
●
●
●
●
●
●
●
●
● ●
●
●
●
●
●
●
●
●
●
●
●
●
●
●
●
●
●
●
●
●
●
●
●
●
●●
●
●
●
●
●
●
●
● ●
●
●
●
●
●
●
●
●
●
●
●
●
●
●
●
●
●
●
●
●
●
●
●
●
●
●
●
●
●
●
●
●
●
●
●
●
●
●
●
●
●
●
●
●
●
●
●
●
●
●
●
●
●
● ●
●
●
●
●
●
●
●
●
●
●
●
●
●
●
●
●
● ●
●
●
●
●
●
●
●
●
●
●
● ●
●
●
●
●
●
●
●
●
●
●
●
●●
●
●
●
●
●
●
●
●
●
●
●
●
●
●
●
●
●
●
●
●
● ●
●
●
●
●
●
●
●
●
●
●
●
●
●
●
●
●
●
●
●
●
●
●
●
●
●
●
●
●
●
●
●
●
●
● ●
●
●
●
●
●
●
●
●
●
●
●
●
●●
●
●
●
●
●
●
●
●
●
●
●
●
●
●
●
●
●
●
●
●
●
●
●
●
●
●
●
●
●
●
●
●
●
●●
●
●
●
●
●
●
●
●
●
●
●
●●●
●
●
●●
●
●
●
●
●
●
●
●
●●
●
●
●
●
●
●
●
●
●
●
●
●
● ●
●
●
●
●
●
●
●
●
●
●
●
●
●
●
●
●
●
●
●
●
●
●
●●
●
●
●
●
●
●
●
●
●
●
●
●
●
●
●
●
●
●
●
●●
●
●
●
●
●
●●
●
●
●
●
●
●
●
●
●
●
●●
●
●
●
●
●
●
●
●
●
●
●
●
●
●
●
●
●●
●
●
●
●
●
●
●
●
●●
●
●
●
●
●
●
●●
●
●
●
●
●
●
●
●
●
●
●
●
●
●
●
●
●
●
●
●
●
●
●
●
●
●
●
●
●●
●
●
●
●
●
●
●
●
●
●
●
●
●
●
●
●
●
●
●
●
●
●
●
●
●
●
●
●
●
●
●
●
●
●
●
●
●
●
●
●
●
●
●
●
●
●
●
●
●
●
●
●
●
●
●
●
●
●
●
●
●
●
●
●●
●
●
●
●
●
●
●
●
●
●
●
●
●
●
●
●
●
●
●●
●
●
●
●
●
●
●
●
●
●
●
●
●
●
●
●
●
●
●
●
●
●
●●
●
●
●
●
●
●
●
●
●
●
● ●●
●
●
●
●
●
●
●
●
●
●
● ●
●
●
●
●
●
●
●
●
●
●
●
●
●
●
●
●
●
●
●
●
●
●
●
●
●
●
●
●
●
●
●
●
●
●
●
●
●
●
●
●
●
●
●
●
●
●
●
●
●
●
●
●
●
●
●
●
●
●
●
●
●
●
●
●
●
●
●
●
●
●
●
●
●
●
●
●
●
●
●
●●
●
●
●
●
●
●
●
●
●
●
●
●
●
●
●
●
●
●
●●
●●
●
●
●
●
●
●
●
●
●
●
●
●
● ●
●
●
●
●
●
●
●
●
●
●
●
●
●
●
●●
●
●
●
●
●
●
● ● ●
●
●
●
●
●
●
●
●
●
●●
●●
●
●
●●
●
●
●
●
●
●
●
●
●
●
●
●
●
●
●
●
●
●
●
●
●
●
●●
●
●
●
●
●
●
●
●
●
●
●
●
●
●
●
●
●
●
●
●
●
●
●
●
●
●
●
●
●
●
●
●
●
●
●
●
●
●
●
●
●
●
●
●
●
●
●
●
●
●
●
●
●
●
●
●
●
●
●
●
●
●
●
●
●
●●
●
●
●
●
●
●
●
●
●
●
●
●
●
●
●
●
●
●
●
●
●
●
●
●
●
●
●
●
●
●
●
●
●
●
●
●
●
●
●
●
●
●
●
●
●
●
●
●
●
●
●
●
●
●
●
●
●
●
●
●
●
●
●
●
●
●
●
●
●
●
●
●
●●
●
●
●
●
●
●
●
●
●
●
●
●
●
●
●
●●
●
●
●
●
●
●
●
●●
●
●
●
●
●
●
●
●
●
●
●
●
●●
●
●
●
●
●
●
●
●
●●
●
●
●
●
●●
●
●
●
●
●
●
●●
●
●
●
●
●
●
●
●
●
●
●
●
●
●
●
●
●
●
●
●
●
●
●
●
●
●
●
●
●
●
●
●
●
●
●
●
●
●
●
●
●
●
●
●
●
●
●
●
●
●
●
●
●
●
●
●
●
●●
●
● ●
●
●
●
●
●
●
●
●
●
●
●
●
●
●●
●
●
●
●
●●
●●
●
●
●
●
●
●●
●
●
●
●
●
●
●
●
●
●
●
●
●
●
●
●
●
●
●
●
●●
●
●
●
●
●
●
●
●
●
●
●
●
●
●
●
●
●
●
●●
●
●
●●
●
●
●
●
●
●●
●
●
●
●
●
●
●
●
●
●
●
●
●
●
●
●
●
●
●
●
●
●
●
●
●●
●
●
●
●
●
●
●
●
●
●
●
●●
●
●
●
●
●
●
●
●
●
●
●
●
●
●
●
●
●● ●
●
●
●
●
●
●
●●
●
●
●
●
●
●
●
●
●
●
●
●
●
●
●
●
●
●
●
●
● ●
●
●
●
●
●●
●
●
●
●
●
●
●
●
●
●
●
●
●
●
●
●
●
●
●
●
●
●
●
●
●
●
●
●
●
●
●
●
●
● ●
●
●
●
●
●
●
●
●
●
●
●
●
●
●
●
●
●
●
●
●
●
●●●
●
●
●
●
●
●
●
●
●
●
●
●
●
●
●
●
●
●
●
●
●
●
●
●
●
●
●
●
●
●
●
●
●
●
●
●
●
●
●
●
●
●
●
●
●
●●
●
●
●
●
●
●
●
●
●
●
●
●
●
●
●
●
●
●
●
●
●
●
●
●
●
●
●
●
●
●
●
●
●
●
●
●
●
●
●
●
●
●
●
●●
●
●
●
●
●
●
●
●
●
●
●
●
●
●
●
●
●
●
●
●
●
●
●
●
●
●
●
●
●●●
●
●
●
●
●
●
●
●
●
●
●
●
●
●
●
●
●
●
●
●
●
●
●
●
●
●
●●
●●
●
●
●
●
●●
●
●
●
●
●
●
●
●
●
●
●
●
●
●
●
●
●
●
●
●
●
●
●
●
●
●
●
●
●●
●
●
●
● ●
●
●
●
●
●
●
●
●
●
●
●
●
●
●
●
●
●
●
●
●
●
●
●
●
●
●
●
●
●●
●
●
●
●
●
●
●
●
●
●
●
●
●
● ●
●●●
●
●
●
●
●●
●
●
●
●
●
●
●
●
●
●●
●
●
●
●
●
●
●
●
●
●
●
●
●
●
●
●●
●
●
●
●
●
●
●
●
●
●
●
●
●
●
●
●
●
●
●
●
●
●
●
●
●
●
●
●
●
●
●
●
●
●
●
●
●
●
●●
●
●
●
●
●
●
●
●●
● ●
●
●
●
●
●
●
●
●
●
●
●●
●
●
●
●
●
●
● ●
●
●
●
●
●
●
●
●
●
●
●
●
●
●
●
●
●
●
●
●●
●
●
●
●
●
●
●
●
●
●
●
● ●
●
●
●
●
●
●
●
●
●
●
●
●
●
●
●
●
●
●
●
●
●
●
●
●
●●
●
●
●
●
●
●
●
●
●
●
●
●
●
●
●
●
●
●
●
●
●
●
●
●
●
●
●
●
●
●
●
●
●
●
●
●
●
●
●
●
●
●
●
●
●
●
●
●
●
●
●
●
●
●
●
●
●
●
●
●
●
●
●
●
●
●
●
●
●
●
●
●
●
●
●
●
●
●
●
●
●
●
●
●
●
●
●
●
●
●
●
●
●
●
●
●●
●
●
●
●
●
●
●
●
●
●
●
●
●
●
●
●
●
●
●
●
●
●
●
●●
●
●
●
●
●
●
●
●
●
●●
●
●
●
●
●
● ●
●
●
●
●
●
●●
●
●
●
●
●
●
●
●
●
●
●
●
●
●
● ●
●
●
●
●
●
●
●
●
●
●
●
●
●
●
●
●
●●
●
●
●
●
●
●
●
●
●
●
●
●
●
●
●
●
●
●
●
●
●
●
●
●
●
●
●
●
●
●
●
●
●
●
●
●
●
●
●
●
●
●
●
●
●
●
●
●
●
●
●
●
●
●
●
●
●
●
●
●
●
●
●
●
●
●
●
●
●
●
●
●
●
●
●
●
●
●
●
●
●
●
●
●
●
●
●
●
●
●
●
●
●
●
●
●
●
●
●
●
●
●
●
●
●
●
●
●
●
●●
●
●
●
●
●
●
●
●
●
●
●
●
●
●
●
●
●
●
●
●
●
●
●
●
●
●
●
●
●
●
●
●
●
●
●
●
●
●
●
●
●
●
●●
●
●
●
●
●
●
●
●
●
●
●
●
●
●
●
●
●
●
●
●
●
●
●
●
●
●
●
●
●
●
●
●
●
●
●
●
●
●
●
●
●
●
●
●
●
●
●
●
●
●
●
●
●●
●
●
●
●
●
●
●
●
●
● ●
●
●
●●
●
●
●
●
●
●
● ●
●
●
●
●
●
●
●
●
●
●
●
●
●
●
●
●
●
●
●
●●
●
●
●
●
●
●
●
●
●
●
●
●
●
●●
●
●
●
●
●
●
●
●
●
●
●
●
●
●
●
●
●
●
●
●
●
●
●
●
●
●
●
●
●●
●
●
●
●
●
●
●
●
●
●
●
●
●
●
●
●
●
●
●
●
●
●
●
●
●
●
●
●
●
●
●
●
●
●
●
●
●
●
●
●
●
●●
●
●
●
●
●
●
●
●
●
●
●
●
●
●
●
●
●
●
●
●
●
●
●
●
●
●
●
●
●
●
●
●
●
●
●
●
●
● ●
●
●
●
●
●
●
●
●
●
●
●
●
●
●
●
●
●
●
●
●
●
●
●
●
●
●
●
●
●
●
●
●● ●
●
●
●
●●
●
●
●
●
●
●
●
●
●
●
●
●
●
●
●●
●
●
●
●
●
●
●
●
● ●
●
●
●
●●
●
●
●
●
●●
●
●
●
●
●
●
●
●
●
●
●
●
●
●
●
●
●
●
●
●
●
●
●
●
●
●
●
●●
●●
●
●
●
●
●
●
●
●
●
●
●
●
●
●
●
●
●
●
●
●
● ●
●
●
● ●
●
●
●
●
●
● ●●
●
●
●
●
●●
●
●
●
●
●
●
●
●
●
●
●
●
●
●●
●
●
●
●
●
●
●
●
●
●
●
●
●
●●
●
●
●
●●
●
●
●
●
●
●
●
●
●
●
●
●
●●
●
●
●
●
●
●
●
●
●
●
●
●
●
●
●
●
●
●
●
●
●
●
●
●
●
●
●
●
●
●
●
●
●●
●
●
●
●
●
●
●
●
●
●
●
●
●
●
●
●
●
●
●
●
●
●
●
●
●
●
●
●
●
●
●
●
●
●
●
●
●
●
●
●
●●
●
●●
●
●
●
●
●
●
●
●
●
●
●
●
●
●
●
●
● ●
●
●
●
●
●
●
●
●
●
●
●
●●
●
●
●
●
●
●
●
●
●
●
●
●
●
●
●
●
●
●
●
●
●
●
●
●
●
●
●
●
●
●
●
●
●
●
●
●
●
●●
●
●
●
●
●●
●
●
●
●
●
●
●●
●
●
●
●
●
●
●
●
●
●
●
●
●
●
●
●
●
●
●
●
●
●
●
●
●
●
●
●
●
●
●
●
●
●
●
●
●
●
●
●●
●
●
●
●
●
●●
●
●
●
●
●
●
●
●
●
●
●
● ●
●
●
●
●
●
●
●
●
●
●
●
●
● ●
●
●
●
●
●
●
●
●
●
●
●
●
●
●
●
●
●
●
●
●
●
●
●
●●
●
●
●
●
● ●
●
●
●
●
●
●
●
●
●
●
●
●
●
●
●
●
●●
●
●
●
●
●
●
●
●
●
●
●
●
●
●
●
● ●
●
●
●
●
●
●
●
●
●
●
●
●
●
●
●
●
●
●
●
●
●
●
●
●
●
●
●
●
●
●
●
●
●
●
●
● ●
●
●
●
●
●
●
●
●
●
●
●
●
●
●
●
●
●
●
●
●
●
●
●
●
●
●
●
●
●
●
●
●
●
●
●
●
●●
●
●
●
●
●
●
●
●
●
●
●
●
●
●
●
●
●
●
●
●
●
●
●
●
●
●
●
●
●
●
●
●
●
●
●
●
●
●
●
●
●
●
●
●
●
●
●
●
●
●
●
●
●
●
●
●
●●
●
●
●
●
●
●
●
●
●
●
●
●
●
●
●
●
●
●
●
●
●
●
●
●
●
●●
●
●
●
●
●
●
●
●
●
●
●
●
●
●
●
●
●
●
●
●
●
●
●
●
●
●
●●
●
●
●
●
●
●
●
●
●
●
●
●
●
●
●
●
●
●
●
●
●
●
● ●
●
●
●
●
●
●
●
●
●
● ●
●
●
●
●●
●
●
●
●
●
●
●
●
●
●
●
●
●
●
●
●
●
●
●
●
●
●
●
●
●
●
●
●
●
●
●
●
●
●
●
●
●
●
●
●
●
●
●●
●●
●
● ●
● ●
●
●
●
●
●
●
●
●
●
●
●
●
●
●
●
●
●
●
●
●
●
●
●
●
●
●
●
●
●
●
●
●
●
●
●
●
●
●
●
●
●
●●
●
●
●
●
●●
●
●
●
●
●
●
●
●
●
●
●
●
●
●
●
●
●
●
●
●
●
●●
●
●
●
●
●
●
●
●
●
●
●
●
●
●
●
●
●
●
●
●
●
●
●
●
●
●
●
●
●
●
●
●
●
●
● ●
●
●
●
●
●
●
●
●
●
●
●
●
●
●
●
●
●
●
●
●
●
●
●
●
●
●
●
●
●
●
●
●
●
●
●●
●
●
●
●
●
●
●
●
●
●
●
●
●
●
●
●
●
●
●
●
●
●
●
●
●
●
●
●
●
●
●
●
●●
●
●
●
●
●●
●
●
●
●
●
●
●
●
●
●
●
●
●
●
●
●
●
●
● ●
●
●
●
●
●
●●
●
●
●
●
●
●
●
●
●
●
● ●
●
●
●
●
●
●
●
●
●
●
●
●
●
●
●
●
●
●
●
●
●
●
●
●
●
●
● ●●
●
●
●
●
●
●
●
●
●
●
●
●
●
●
●
●
●
●
●
●
●
●
●
●
●
●
●
●
●
●
●
●
●
●
●
●
●
●
●
●●
●
●
●
●
●
●
●●
●●●
●●
● ●
●
●
●
●
●
●
●
●
●
●
●
●
●
●
●
● ●
●●
●●
●
●●
●
●●
●
●
●
● ●
●
●
●
●
●
●
●
●
●
●
●
●
●
●
●
●
●
●
●
●●
●
●
●●
●●
●
●
●
●
●
●●
●
●●
●
●
●
●
●●
●
●
●
●
●
●
●
●
●●
●
●
●
●
●
●
●
●
●
●
●
●
●
●
●
●
●
●●
●
●
●● ●
●
●●
●●●
●
●
●
●
●
●
●
●
●
●●
●
●
●●
●
●
●
●
●●
●● ●
●●
●
●
●
●
●
●
●
●
●
●
●
●
●
●
●●● ●
●
●
●
●●
● ●
●
●
●
●
●
●
●
●●●
●
●
●
●
●
●●
●
● ●●●
●
●
●
●
●
●
●●
●
●
●
●
●
●
●
●
●
●
●
●
●
●
●●
●
●
●
●
●
●
●
●
●
●
●
●
●●
●
●
●
●●
●
●●
●●
●
●
●
●
●
●
●
●
●
●
●
● ●
●
●
●
●
●
●
●
●
●
●
●
●
●
●
●
●
●
●
●
●
●●
●
●●
●
●
●
●
●
●
●
●
●
●
●
●
●
●
●
●
●
●
●●
●
●
●
●
●
●
●
●
●
●
●
●
●
●
●
●
●
●
●
●
●
●●
●
●
●
●
●
●●
●
●
● ●
●
●
●
●
●
●
●●
●
●
●
●
●
●
●
●
●
●
●●
●
●
●
●
●●
●
●
●
●
●●
●
●
●
●
●
●
●●
●
●
●
●
●
●
●
●
●
●
●
●
●
●●
●
●
●
●
●
●
●
●
●
●
●
●
●
●
●
●
●
●
●
●
●
●
●
●
●
●
●
●
●
●
●
●
●
●
●
●
●
●
●
●
●
●
●
●
●
●●
●
●
●
●
●
●
●
● ●
●
●
●
●
●
● ●
●●
●
●
●●
●
●
●
●
●
●
●
●
●
●
●●
●
●
●
●
●
●
●
●
●
●
●
●
●
●
●
●
●●
●
●
●
●
●
●
●
●
●
●
●
●
●
●
●
●
●
●
●
●
●
●
●
●
●
●
●
●
●
●
●
●
●
●
●
●
●
●
●
●
●
●
●
●
●
●
●
●
●
●
●
●
●
●
●
●
●
●
●
●
● ●
●
●
●
●
●
●
●
●
●
●
●
●
●
●
●
●
●
●
●
●
●
●
●
●
●
●
●
●
●
●
●
●
●
●
●
●
●
●
●
●
●
●
●●
●
●
●
●
●
●
●
●
●
●
●
●
●
●
●
●
●
●
●
●
●
●
●
●
●●
●
●
●
●
●
●
●
●
●
●
●
●
●
●
●
●
●
●●
●
●
●
●
●
●
●
●
●●
●
●
●
●
●
●
●
●
●●
●
●
●
●
●
●
●
●
●
●
●
●
●
●
●
●
●
●
●
●
●
●
●
●
●
●
●
●
●
●
●
●
●
●
●
●
●
●
●
●
●
●
●
●
●
●
●
●
●
●
●
●
●
●
●
●
●
●
●
●
●
●
●
●
●
●
●
●
●
●
●
●
●
●●
●
●
●●
●
●
●
●
●
●
●
●
●
●
●
●
●
●
●
●
●
●
●
●
●
●
●
●
●
●
●
●
●
●
●
●
●
●
●
●
●●
●●
●
●
●
●
●
●
●
●
●
●
●
●
●
●
●
●
●
●
●●
●
●
●
●
●
●
●
●
●
●
●
●
●
●
●●
●
●
●
●
●
●
●
●
●
●
●
●
●
●
●
●
●
●
● ●
●
●
●
●
●
●
●
●
●
●
●
●
●
●
●
●
●
●
●
●●
●
●
●
●
●
●
●
●
●
●
●
●
●
●
●
●
●
●
●
●
●
●
●
●
●
●
●
●
●
●
●
●
● ●
●
●
●
●
●
●
●
●
●
●
●
●
●
●
●
●
●
●
●●
●
●
●●
●
●
●
●
●
●
●
●
●
●
●
●
●
●
●
●
●
●
●
●
●
●
●
●
●
●
●
●
●
●
●
●●
●
●
●
●
●
●●
●
●
●
●
●
●
●
●
●
●
●●
●
●
●
●
●
●
●
●
●
●
●
●
●
●
●
●
●
●
●
●
●
●
● ●
●
●
●
●
●●
●
●
●
●
●
●
●
●
●
●
●
●
●
●
●
●
●
●
●
●
●
●●
●
●
●
●
●
●
●
●
●
●
●
●
●
●
●
●
●
●
●
●
●
●●
●
●
●
●
●
●
●
●
●
●
●
●
●
●
●
●
●
●●
●
●
●
●
●
●
●
●
●
●
●
●
●
●
●
●
●
●
●●
●
●
●
●
●
●●
●
● ●
●
●
●
●
●
●
●
●
●
●
●
●
●
●
●
●
●
●
●
●
●
●
●
●
●
●
●
●
●●
●
●
●
●
●
●
●
●
●
●
●
●
●
●
●
●
●
●
●
●
●
●
●
●
●
●
●
●
●
●
●
●
●
●
●
●
●
●
●
●
●
●
●
●
●●
●
●
●
●
●
●
●
●
●
●
●
●
●
●●
●
●
●
●
●
●
●
●●●
●
●
●
●
●
●
●●
●
●
●
●
●
●
●
●
●
●
●
●
●
●
●
●
●
●
●
●
●
●
●
●
●
●
●
●
●
●
● ●●
●
●
●
●
●
●
●
●
●
●
●
●
●
●
●
●
●
●
●
●
●
●
●
●
●
●
●
●
●
●
●
●
●
●
●
●
●
●
●
●
●
●
●
●
●
●
●
●
●
●
●
●
●
●
●
●
●
●
●
●
●
●
●
●
●
●
●
●
●
●
●
●
●
●
●●
●
●
●
●
●
●
●
●
●
●
●
●
●
●
●
●
●
●
●
●
●
●
●
●
●
●
●
●
●
●
●
●
●
●
●
●
●
●
●
●
●
●
●
●
●
●
●
●
●
●
●
●
●
●
●
●
●
●
● ●
●
●
●
●
●
●
●
●
●
●
●
●
●
●
●
●
●
●
●
●
●
●
●
●
●●
●
●
●
●
●
●
●●
●
●
●
●
●
●●
●
●
●
●
●
●
●
●
●
●
●
●
●
●
●
●
●
●
●
●
●
●
●
●
●
●
●
●
●
●
●
●
●
●
●
●
●
●
●●
●
●
●
●
●
●
●
●
●
●
●
●
●
●
●
●
●
●
●
●
●
●
●
●●
●
●
●
●
●
●
●
●
●
●
●●
●
●
●
●
●
●
●
●●
●
●
●
●●
●
●
●
●
●
●
●
●
●
●
●
●
●
●
●
●
●
●
●
●
●
●
●
●
●
●
●
●
●
●
●
●
●
●
●
●
●
●
●
●
●
●
●
●
●
●
●
●
●
●
●
●
●
●
●
●
●
●
●
●
●
●
●
●
●
●
●
●
●
●
●
●
●
●
●
●
●
●
●
●
●
●●
●
●
●
●
●
●
●
●●
●
●
●
●
●
●
●
●
●●
●
●
●
●
●
●
●
●
●
●
●
●
●
●
●
●
●
●
●
●
●
●
●
●
●
●
●
●
●
●
●
●●
●
●
●
●
●
●
●
●
●
●
●
●
●
●
●
●
●
●
●
●
●
●
●
●
●
●
●
●
●●
●
●
●
●
●
●
●
●
●
●
●
●
●
●●
●
●
●
●
●
●
●
●
●
●
●
●
●
●
●
●●
●
●
●●
●
●
●
●
●
●
●
●
●
●●
●
●
●
●
●
●
●
●
●
●●
●
●
●
●
●
●
●
●
●
●
●
●
●
●
●
●
●
●
●
●●
●
●
●
●
●
●
●
●
●●
●
●
●
●
●
●
●
●
●
●
●
●
●
●
●
●
●
●
●
●
●●
●
●
●
●
●
●
●
●
●
●
●
●
●
●
●
●
●
●
●
●
●
●
●
●
●
●
●
●
●
●
●
●
●
●
●
●
●
●
●
●
●
●
●
●
●●
●
●
●
●
●
●
●
●
●
●
●
●
●
●
●
●
●
●
●
●
●
●
●
●
●
●
●
●
●
●
●
●
●
●
●
●
●
●
●
●
●
●
●
●
● ●
●
●
●
●
●
●
●
●
●
●
●
●
●
●
●
●
●
●
●
●
●
●
●
●
●
●
●
●
●
●
●
●
●
●
●
●
●
●
●
●
●
●
●
●
●
●
●
●
●
●
●
●
●
●
●
●
●
●
●
●
●
●
●
●
●
●
●
●
●
●
●
●
●
●
●
●
●
●
●
●
●
●
●
●
●
●
●
●
●
●
●
●
●
●
●
●●
●
●
●
●
●
●
●
●
●
●
●
●
●
●
●
●
● ●
●
●
●
●
●
●
●
●
●
●
●
●
●
●
●
●
●
●
●
●
●
●
●
●
●
●
●
●
●
●●
●
●
●
●
●
●
●
●
●
●
●
●
●
●
●
●
●
●
●
●
●
●
●
●
●
●
●
● ●
●
●
●
●
●
●
●
●
●
●
●
●
●
●
●
●
●
●
●
●
●
●
●
●
●
●
●
●
●
●
●
●
●
●
●
●
●
●
●
●
●
●
●
●
●
●
●
●
●
●
●
●
●
●
●
●
●
●
●
●
●
●
●
●
●
●
●
●
●
●
●
●
●
●
●
●
●
●
● ●
●
●
●
●
●
●
●
●
●
●
●
●
●
●
●
●
●
●
●
●
●
●
●
●
●
●
●
●
●
●
●
●
●
●
●
●
●
●
●
●
●
●
●
●
●
●
●
●●
●
●
●
●
●
●
●
●
●
●
●
●
●
●
●
●
●
●
●
●
●
●
●●
●
●
●
●
●●
●
●
●
●
●
●
●
●
●
●
●
●
●
●
●
●
●
●
●
●
●
●
●
●
●
●
●
●
●
●
●
●●
●
●
●
●
●
●
●
●
●
●
●
●
●
●
●
●
●
●
●
●
●
●
●
●
●
●
●
●
●
●
●
●
●
●
●
●
●
●
●
●
●
●
●
●
●
●
●
●
●
●
●
●
●
●
●
●
●
●
●
●
●
●
●
●
●
●
●
●
●
●
●
●
●
●
●
●
●
●
●
●
●
●
●
●
●
●
●
●
●
●
●
●
●
●
●
●
●
●
●
●
●
●
●
●
●
●
●
●
●
●
●
●
●
●
●
●
●●
●
●
●
●
●
●
●
●●
●
●
●
●
●
●
●
●
●
●
●
●
●
●
●
●
●
●
●
●
●●
●
●
●●
●
●
●
●
●
●
●
●
●
● ●
●
●
●
●
●
●
●
●
●
●
●
●
●
●
●●
●
●
●
●
●
●
●
●
●
●
●
●
●
●
●
●
●
●
●
●
●
●
●
●
●
●
●
●
●
●
●
●
●
●
●
●
●
●
●
●
●
●
●
●
●
●
●
●
●
●
●
●
●
●
●
●
●
●
●
● ●
●
●
●
●
●
●
●
●
●
●
●
●
●
●
●
●
●
●
●
●
●
●
●
●
●
●
●
●
●
●
●
●
●
●
●
●
●
●
●
●
●
●
●●
●
●
●
●
●
●
●
●
●
●
●
●
●
●
●
●
●
●
●
●
●
●
●
●
●
●
●
●
●
●
●
●
●
●
●
●
●
●
●
●
●
●
●
●
●
●
●
●
●
●
●
●
●
● ●
●
●
●
●
●
●
●
●
●
●●
●
●●
●
●
●
●
●
●
●
●
●
●
● ●
●
●●
●
●
●
●
●
●
●
●
●
●
●
●
●
●
●
●
●
●
●
●
●
●
●
●
●
●
●
●
●
●
●
●
●
●
●
●
●
●
● ●
●
●
●
●
●
●
●
●
●●
●
●
●
●
●
●
●●
●
●
●
●
●
●
●
●
●
●
●
●
●
●
●
●●
●
●
●
●
●
●
●
●
●
●
●
●
●
●
●
●
●
●
●
●
●
●
●
●
●
●
●
●
●
●
●
●
●
●
●
●
●
●
●
●
●
●
●
●
●
●
●
●
●
●
●
●
●
●
● ●
●
●
●
●
●
●
●
●
●
●
●
●
●
●
●
●
●
●
●
●
●
●
●
●
●●
●
●
●
●
●
●
●
●
●
●
●
●
●
●
●
●
●●
●
●
●
●
●
●
●
●
●
●
●
●
●
●
●
●
●
●
●
●
●
●
●
●
●●
●
●
●
●
●
●
●
●
●
●
●
●
●
●
●
●
●
●
●
●
●
●
●
●
●
●
●
●
●
●
●
●
●
●
●
●
●
●
●
●
●
●
●
●
●
●
●
●
●
●
●
●
●
●
●
●
●
●
●
●
●
●
●
●
●
●
●
●
●
●
●
●
●
●
●
●
●
●
●
●
●
●
●
●
●
●
●
●
●
●
●
●
●
●
●
●
● ●
●
●
●
●
●
●
●
●
●
●
●
●
●
●
●
●
●
●
●
●
●
●
●
●
●
●
●
●
●
●
●
●
●
●
●
●
●
●
●
●
●
●
●
●
●
●
● ●
●
●
●
●
●
●
●
●
●●
●
●
●
●
●
●
●
●
●
●
●
●
●
●
●
●
●●
●
●
●
●
●
●
●
●
●
●
●
●
●
●
●
●
●
●
●
●
●
●
●
●
●
●
●
●
●
●
●
●
●
●
●●
●
●
●
●
●
●
●
●●
●
●
●
●
●
●
●
●
●
●
●
●
●
●
●
●
●
●
●
●
●
●
●
●●
●
●
●
●
●
●
●
●
●
●
●
●
●
●
●
●
●
●
●
●
●
●
●
●
●
●
●
●
●
●
●
●
●
●
●
●
●
●
●
●
●
●
●
● ●
●
●
●
●
●
●
●
●
●
●
●
●
●
●
●
●
●
●
●
●
●
●
●
●●
●
●
●
●
●
●
●
●
●
●
●●
●
●
●
●
●
●
●
●
●
●
●
●
●
●
●
●
●
●
●
●
●
●
●
●
●
●
●
●
●
●
●
●
●
●
●
●
●
●
●
●
●
●
●
●
●
●
●
●
●●
●
●
●
●
●
●
●
●●
●
●
●●
●
●
●
●
●
●
●
●
●
● ●
●
●
●
●
●
●
●
●
●
●
●
●
●
●
●
●
●
●
●
●
●
●
●
●
●
●
●
●
●
●
●
●●
●
●
●
●
●
●
●
●
●
●
●
●
●
●
●
●
●●
●
●
●
●
●
●
●
●●
●
●
●
●
●
●
●
●
●
●
●
●
●
●
●
●
●
●
●
●
●
●●
●
●
●
●
●
●
●
●
●
●
●
●
●
●
●
●
●
●
●
●
●● ●
●
●
●
●
●●
●
●
●
●
●
●
●
●
●
●
●
●
●
●
●
●
●
●
●
●
●
●
●
●
●
●
●
●
●
●
●
●
●
●
●
●
●
●
●
●
●
●
●
●
●
●
●
●
●
●
●
●
●
●
●
●
●
●
●
●
●
●
●
●
●
●
●
●
●
●
●
●
●
●
●
●
●
●
●
●
●
●
●
●
●
●
●
●
●
●
●
●
●
●
●
●
●
●
●
●
●●
●
●
●
●
●
●
●
●
●
●
●
●
●
●
●●
●
●
●
●
●
●
●
●
●
●
●
●
●
●
●
●
●
●
●
●
●
●
●
●
●
●
●
●
●
●
●
●
●
●
●●
●
●
●
●
●
●
●
●
●
●
●
●
●
●●
●
●
●
●
●
●
●
●
●●
●
●
●
●
●
●
●
●
●
●
●
●
●
●
●●
●
●
●
●
●
●
●
●
●
●
●
●
●
●
●
●
●
●
●
●
●
●
●
●
●
●
●
●●
●
●
●
●
●
●
●
●
●
●
●
●
●
●
●
●
●
●
●
●
●
●
●
●
●●
●
●
●
●
●
●
●
●
●
●
●
●●
●
●
●
●
●
●●
●
●● ●
●
●
●
●
●
●
●
●
●
●
●
●
●
●
●
●
●
●
●
●
●
●
●
●
●
●
●
●
●
●
●
● ●
●
●
●
●
●
●
●
●
●
●
●
●
●
●
●
●
●
●
●
●
●
●
●
●
●
●
●
●
●
●
●
●
●
●
●
●
●
●
●●
●
●
●
●
●
●
●
●
●
●
●
●
●
●
●
●
●
●
●
●
●
●
●●
●
●
●
●
●●
●
●
●●
●
●
●
●
●
●
●
●●
●
●
●
●
●
●●
●
●●
●
●
●
●
●
●
●
●
●
●
●
●
●
●
●
●
●
●
●
●●
●
●
●
●
●
●
●
●
●
●
●
●
●
●
●
●
●
●
●
●
●
●
●
●
●
●
●
●
●
●
●
●
●
●
●
●
●
●
●
●
●
●
●
●
●
●
●
●
●
●
●
●
●
●
●
●
●
●
●●
●
●
●
●●
●
●
●
●
●
●
●
●
●
●
●
●
●
●
●
●
●
●
●
●
●
●
●
●
●
●
●
●
●
●
●
●
●
●
●
●
●
●
●
●
●
●
●
●
●
●
● ●
●
●
●
●
●
●●
●
●
●
●
●
●
●
●
●
●
●
●
●
●
●
●●
●
●
●
●
●
●
●
●
●
●
●
●
●
●
●
●
●
●
●●
●
●
●
●
●
●
●
●
●
●
●
●
●
●
●
●
●
●
●
●
●
●
●
●
●
●
●
●
●
●
●
●
●
●
●●
●
●
●
●
●
●
●
●
●
●
●
●●
●
●
●
●
●
●
● ●
●
●
●
●
●
●
●
●
●
●
●
●
●
●
●
●
●
●
●
●
●
●
●
●
●
●
●
●
●
●
●
●
●
●
●
●
●
●
●
●
●
●
●
●
●
●
●
●
●
●
●
●
●
● ●
●
●
●
●
●
●
●
●
●
●
●
●
●
●
●
●
●
●
●
●
●
●
●
●
●
●
●
●
●
●
●
●
●
●
●
●
●
●●
●
●
●
●
●
●
●
●
●
●
●
●
●
●
●
●
●
●
●
●
●●
●
●
●
●
●
●
●
●●
●
●
●
●
●
●
●
●
●
●
●
●
●
●
●
●
●
●
●
●
●
●
●
●●
●
●
●
●
●
●
●
●
●
●
●
●
●
●
●
●
●
●
●
●
●
●
●
●
●
●
●
●
●
●
●
●
●
●
●
●
●
●
●
●
●
●
●
●
●
●
●
●
●
●
●
●
●
●
●
●
●
●
●
●
●
● ●
●
●
●
●
●
●
●
●
●
●
●
●●
●
●
●
●
●
●
●
●
●
●
●
●
●
●
●
●
●
●
●
●
●
●
●
●
●
●
●
●
●
●
●
●
●
●
●
●
●
●
● ●
●
●
●
●
●
●
●
●
●
●●
●
●
●
●
●
●●
●
●
●
●
●
●
●
●
●
●
●
●
●
●
●
●
●
●
●
●
●
●
●
●
●
●
●
●
●
●
●
●
●
●
●
●
●
●
●
●
●
●
●
●
●
●
●
●
●
●
●
●
●
●●
●
●
●●
●
●
●
●
●
●
●
●
●
●
●
●
●
●
●
●
●
●
●
●
●
●●
●
●
●
●
●
●
●
●
●
●
●
●
●
●
●
●
●
●
●
●
●
●
●
●
●●
●
●
●
●
●
●
●
●
●
●
●
●
●
●
●●
●
●
●
●
●
●
●
●
●
●
●
●
●
●
●
●
●
●
●
●
●
●
●
●
●
●
●
●
●
●
●
●
●
●
●
●
●
●
●
●
●
●
●
●
●
●
●
●
●
●
●
●
●
●
●
●
●
●
●
●
●
●
●
●●
●●
●
●
●
●
●
●
●
●
●
●
●
●
●
●
●
●
●
●
●
●
●
●
●
●
●
●
●
●
●
●
●
●
●
●
●
●
●
●
●
●
●
●
●
●
●
●
●
●
●
●
●
●
●
●
●
●
●
●
●
●
●
●●
●
●
●
●
●
●
●
●●
●
●
●
●
●
●
●
●
●
●
●
●
●
●
●
●
●●
●
●
●
●
●
●
●
●
●
●
●
●
●
●
●
●
●
●
●
●
●
●
●
●
●
●
●
●
●
●
●
●
●
●
●
●●
●
●
●
●
●
●
●
●
●
●
●
●
●
●
●
●
●
●
●
●
●
●
●
●
●
●
●
●●
●
●●
●
●
●
●
●
●
●
●
●
●
●
●
●
●
●
●
●
●
●●
●
●
●
●
●
●
●
●
●
●
●●
●
●●●
●
●
●
●
●
●
●
●
●
●●
●
●
●
●
●
●
●
●
●
●
●●
●
●
●
●
●
●
●
●
●
●
●
●
●
●
●
● ●
●
●●
●
●
●
●
●●●
●
●
●
●
●
●
●
●
●
●
●
●
●
●
●
●
●
●
●
●
●
●
●
●
●
●
●
●
●
●
●
●
●
●
●
●
●
●
●
●
●
●
●
●
●
●
●
●
●
●
●
●
●
●
●
●
●
●
●
●
●
●
●
●
●
●
●
●
●
●
●
●
●
●
●●
●
●
●
●
●
●
●
●
●
●
●
●
●
●
●
●
●
●●
●
● ●
●
●
●●
●
●
●
●
●●
●
●
●●
●
●
●
●
●
●
●●
●
●
●
●
●●
●
●
●
●
●
●
●
●
●
●
●
●
●
●
●
●
●
●
●
●
●
●
●
●
●
●
●
●
●
●
●
●
●
●
●
●
●
●
●
●
●
●
●
●
●
●
●
●
●
●
●
●
●
●
●
●
●
●
●
●
●
●
●
●
●
●
●
●
●
●
●
●
●
●
●
●●
●
●
●
●
●
●
●
●
●
●
●
●
●
●●
●
●
●
●●
●
●
●
●
●●
●
●
●
●
●
●
●
●
●
●
●
●
●
●
●
●
●
●
●
●
●● ●
●
●
●
●
●●
●
●
●
●
●●
●
●
●
●
●
●
●
●
●
●
●
●
●
●
●
●
●
●
●●
●
●
●
●
●
●
●
●
●
●
●
●
●
●
●
●
●
●
●
●
●
●
●
●
●
●
●
●
●
●
●
●
●
●
●
●
●
●
●
●
●
●
●
●
●
●
●
●
●
●
●
●
●
●
●
●
●
●●
●
●
●
●
●
●
●
●
●
●
●
●
●
●
●
●
●
●
●
●
●
●
●
●●
●
●
●
●
●
●
●
●
●
●
●
●
●
●
●
●
●
●
●
●
●
●
●
●
●
●
●
●●
●
●
●
●
●
●
●
●
●
●
●
●
●
●
●
● ●
●
●
●
●
●
●
●
●
●
●
●
●●
●
●
● ●
●
●
●
●
●
●
●
●
●
●
●
●
●
●
●
●
●
●
●
●
●
●
●
●
●
●
●
●
●
●
●
●
●
●
●
●
●
●
●
●
●
●
●
●
●
●
●
●
●
●
●
●
●
●
●
●
●
●
●
●
●
●
●
●
●
●
●
●●
●
●
●
●
●
●
●
●
●
●
●
●
●
●●
●
●
●
●
●
●
●
●
●
●
●
●
●
●
●
●
●
●
●
●
●●
●
●
●
●
●
●
●
●
●
●
●
●
●
●
●
●
●
●
●
●
● ●●●
● ●
●
● ●
●
●
●
●
●
●
●
●
●
●
●
●
●
●
●
●
●
●
●
●
●
●
●●
●
●
●
●
● ●
●
●
●
●●
●●
●
●
●●
●
●
●
●
●
●
●
● ●
●
●
●
●
●
●
●
●
●
●
●
●
●
●
●
●
●
●
●
●
●
●
●
●
●
●
●
●●
●
●
●
●●
●
●
●
●
●
●
●
●
●
●
●
●
●
●
●
●
●
●
●
●
●
●
●
●●
●
●
●
●●
●
●
●
●
●
●
●●
●
●
●
●
●
●
●
●
●
●
●
●
●●●
●
●●
●
●
●
●
●
●
●
●
●
●
●
●
●
●
●
●
●
●
●
●
●
●
●
●
●
●
●●
●
●
●
●
●
●
●
●
●
●
●
●
●
●
●
●
●
●●
●
●
●
●
●
●
●
●
●
●
●
●
●
●
●
●
●
●
●
●
●
●●
●
●
●
●
●
●
●
●
●
●
●
●
●
●
● ●
●
●
●
●●
●
●
●
●
●
●
●
●
●
●
●
●
●
●
● ●
●
●
●
●
●
●
●●
●
●
●
●
●
●
●
●
●
●
●
●
●
●
●
●
●
●
●
●
●
●
●
●
●
●
●
●
●
●
●
●
●
●
●
●
●
●
●
●
●
●
●
●
●
●
●●
●
●
●●
●
●
●
●
●
●
●
●
●
●
●
●
●
●
●
●
●
●
●
●
●
●
●
●
●
●
●
●
●
●
●
●
●
●
●
●
●
●
●
●●
●
●
●
●
●
●
●
●
●
●
●
●
●
●
●
●
●
●
●
●
●
●
●
●
●
●
●
●
●
●
●
●
●
●
●
●
●
●
●
●
●
●
●
●
●
●
●
●
●
●
●
●
●
●
●
●
●
●
●
●
●
●
●
●
●
●
●
●
●
●
●
●
●
●
●
●
●
●
●
●
●
●●
● ●
●
●
●
●
●
●
●
●
●
●
●●
●
●
●
● ●
●
●
●
●
●
●
●
●
●
●
●
●
●
●
●
●
●
●
●
●
●
●
●
●
●
●
●
●●
●
●
●
●
●
●
●
●
●
●
●
●
●
●
●
●
●
●
●
●
●
●
●●
●
●
●
●
●
●
●
●
●
●
●
●
●
●
●
●
●
●
●
●
●
●
●
●
● ●
●
●
●
●
●
●
●
●
●
●
●
●
●
●
●
●
●
●
●
●
●
●
●
●
●
●
●
●
●
●
●
●
●
●
●
●
●
●
●
●
●
●
●
●
●●
●
●
●●
●
●
●
●
●●
●
●
●
●
●
●
●
●
●
●
●
●
●
●
●
●
●
●
●
●
●
●
●
●
●
●
●
●
●
●
●
●
●
●
●
●
●
●
●
●
●
●
●
●
●
●
●
●
●
●
●●
●
●
●
●●
●
●
●
●
●
●
●
●
●
●
●●
●●
●●
●●
●
●
●
●
●
●
●
●
●
●
●
●
●
●
●
●
●
●
●
●
●
●
●
●
●
●
●
●
●
●
●
●
●
●
●
●
●
●
●
●
●
●
●
●
●
●
●
●
●
●
●
●
●
●
●
●
●
●
●
●
●
●
●
●
●
●
●
●
●
●
●
●
●
●
●
●
●
●
●
●
●
●
●
●
●
●
●
●
●
●
●
●
●●
●
●
●
●
●
●
●
●
●
●
●
●
●
●
●
●
●
●
●●
●
●
●
●
●
●
●
●
●
●
●
●
●
●
●
●
●
●
● ●
●●
●
●
●
●
●
●
●
●
●
●
●
●
●
●
●
●
●
●
●
●
●
●
●
●
●
●
●
●
●
●
●
●
●
●
●●●
●
●
●
●
●
●
●
●
●
●
●
●
●
●
●
●
●
●
●
●
●
●
●●
●
●
●
●
●●
●
●
●
●
●
●
●
●
●
●
●
●
●
●
●
●
●
●
●
●
●
●
●
●
●
●
●
●
●
●
●
●
●
●
●
●
●
●
●
●
●
●
●
●
●
●
●
●
●
●
●
●
●
●
●
●
●
●
●
●
●
●
●
●
●
●
●
●
●
●
●●
●
●
●
●
●
●
●
●
●●
●
●
●
●
●
●
●
●
●
●●
●
●
●
●
●
●
●
●
●
●●
●
●
●
●
●
●
●●
●
●
●
●
●
●
●
●
●
●
●
●
●
●
●
●
●
●
●
●
●
●
●
●
●
●
●
●
●
●
●●
●
●
●
●
●
●
●
●
●
●
●
●
●
●
●
●
●
●
●
●
●
●
●
●
●
●
●
●
●
●
●
●●
●
●
●
●
●
●
●
●
●
●
●
●
●
●
●●
●
●
●
●
●
●
●
●
●
●
●
●
●
●
●
●
●
●
●
●
●
●●
●
●
●
●
●
●
●
●
●
●
●
●
●
●
●
●
●
●
●
●
●
●
●
●
●
●
●
●
●●
●
●
●
●
●
●
●
●
●
●
●
●
●
●
●
●
●
●
●
●
●
●
●
●
●
●
●
●
●
●
● ●
●
●
●
●
●
●
●
●
●
●
●
●●
●
●
●
●
●
●
●
●
●
●●
●
●
●
●
●
●
●
●
●
●
●
●
●
●
●
●
●
●
●
●
●
●
●
●
●
●
●
●
●
●
●
●
●
●
●
●
●
●
●
●
●
●
●
●
●
●
●
●
●
●
●
●
●
●
●
●
●●
●
●
●
●
●
●
●
●●
●
●
●
●
●
●
●
●
●
●
●
●
●
●
●
●
●
●
●
●
●
● ●
●
●
●
●●
●
●
●
●
●
●
●
●●
●
●
●
●
●
●
●
●
●
●
●
●
● ●
●
●
●
●
●
●
●
●
●
●
●
●
●
●
●
●
●
●
●
●
●
●
●
●
●
●
●
●
●●
●
●
●
●
●
●
●
●
●
●
●
●
●
●
●
●
●
●
●
●●
●
●
●
●
●
●
●
●
●
●
●
●
●
●
●
●
●
●
●
●
●
●
●
●●
●●
●
●
●
●
●
●
●
●
●
●
●●●
●
●
●
●
●
●
●
●
●
●
●
●
●
●
●
●
●
●
● ●
●
●
●
●
●
●
●
●
●
●
●
●
●
●
●
●
●
●
●
●
●
●
●
●
●
●
●
●
●
●
●
●
●
●
●
●
●
●
●
●
●
●
●
●
●
●
●
●●
●
●
●
●
●
●
●
●
●
●
●
●
●
●●
●
●●
●
●●
●
●●
●
●●
●
●
●
●
●
●
●
●
●
● ●
●
●
●
●
●●
●
●●●
●
● ●●
●
●
● ●
●
●
●●●
●
●●
●●
●
●
●
●
●●
●●
●
●
●
●
●
●
●
●
●●
●
●
●
●
●
●
●
●
●
●
●
●●
●●
●●
●●
●
●
●
●
●
● ●●
●
●●
●●●
●
●
●
●●
●
●
●
●●
●
●
●
●
●
●
●
●
●●
●
●●
●
●
●
●
●
●
●
●
●
●
●
●
●
●
●
●
●
●●
●
●
●
●● ● ●
●
●
●
●
●
●
●
●●●●
●
●
●
●
●
●
●
●
●
●
●
●
●
●
●
●
●
●
●
●
●
●
●●
●
●
●
●
●
●
●●
●●
●
●
●
●
●
●
●
●
●
●
●
●
●
●
●
●
●
●
●
●
●
●
●● ●
●
●
●
●
●
●
●
●
●
●
●
●
●
●
●
●
●●
●
●●●
●
●●
●
●
●
●
●● ●
●
●
●
●
●
●
●
●● ●
●
●
●●
●
●
●
●
●
●
●
●
●
●
●
●●
●
●●
●
●
●
●● ●
●
●
●●
●
●
●
●
●
●
●
●
● ●●●●
●
●● ●
●
●
●
●●●
●●
●
●●
●
●●●
●
●
●● ●
●
●
●●
●
●
●●
●
● ●●
●
●
●
●
●
●
●
●
●
●
●
●●
●
●
●
●
●
●
●
●
●●
●
●
●
●
●
●
●
●
●
●
●
●
●
●
●●
●
●
●
●
●
●
●
●
●
●●
●
●
●
●
●
●
●
●
●
●
●
●
●●
●
●
●●
●●
●
●
●
●
●
●
●●
●
●●
●
●
●
●
●
●
●
●
●
●
●
●
●
● ●●
●
● ●●●
●
●●
●
●
●
●●●
●
●
●●
●
●
●●
●
●●
● ●
●
●
●
●
●
●
●
●
●●
●
●
●●
●
●
●
●
●
●
●
●
●
●
●
●
●
●●
●
●
●
●
●●
●
●
●
●●
●
●
●
●
●
●● ●
●
●
●●
●
●
●
●●
●● ●
●●
●
●
●
●
●
●
●
●●●
●
●●
●
●
●●
●●
●●
●
●
●
●
●
●
●●
●
●
●
●●
●
●
●●
●●
●
●● ●●
●
●
●●
●
●
●●
●
●
●
●
●
●●
● ●
●
●
●●
●
●
●●
●
●
●
●
●
●
●
●
●
●
●
●●●
●
●
●
●
●
●
●
●
●
●
● ●
●
●
●
●
●
●●
●●
●
●
●
●
●
●
●
●
●
●
●
●
●
●
●
●
●
●
●
●
●
●
●
●
●●
●
●
●
●
●●● ●
●
●
●
●
●
●
●
●
●
●
●
●●
●
●
●●
●
●●
●
●
●
●
●
●
●
●
●
●
●●●
●
●
●
●
●
● ●
●
●
●
●
●
●●
●●
●●
●
●
●
●
●
●
●
●
● ●
●●
●
● ●
●
●
●
●
●●
●
●
●●
●
●
●
●●
●
●
●
●
●●
●
●●
●
●
●
●
●
●
●●●●
●
●
●
●
●
●
●●
●
●
●
●
●
●
●
●
●
●
●●
●
●
●●
●
●
●
●
●
●
●
●
●
●
●
●
●
●●
●
●
●
●
●
●
●●
●
●
●
●
●
●
● ●●
●
●
●
●
●
●
●
●
●●
●
●
●●
●
●
● ●●
●
●
●
● ●
●
●
●
●
● ●
●
●●
●● ●●
●●
●
●
●
●
●
● ●
●
●
●
●
●
●
●
●●
●
●●
●●
●●
●
●
●
●
●
●
●
●
●
●
●
●
●
●
●
●
●
●●
●
●
●
●
●
●
●
●
●
●
●
●
●
●
●
●
●●
●
●
●●●
●
●
●
●●
●●
●
●
●
●
●
●
●
●
●
●
●
●
●
●
●
●
●●
●
●
●
●
●●
●●
●
●
●
●
●
●
●
●
●
●
●
●
●
●●
●
●
●
●
●
●
●
●
●
●●
●
●
●
●
●
●
●
●
●
●
●
●
●
●
●
●
●
●●
●●
●
●
●
●
●
●
●
●
●
●
●
●
●
●
●
●
●●
●
●
●
●●
●●
●
●
●
●
●
●
●●
● ●
●
●
●
●
●●
●
●●●
●
●
●
●
●
●
●
●
●
●
●
●●●
●
●
● ●● ●
●
●
●
●
●
●
●
●
●
●
●●
●
●
●
●
●
●
●
●
●●
●
●
●
●
●
●●
●●
● ●●
●●● ●
●
●
●
●
●
●●
●
●
●
●●
●
●
●
●
● ●
●
●
●
●
●●
●
●
●●
●
●
●
●
●
●
●●
●
●
●
●
●●
●
●
●
●
●
●
●
●
●
●
●
●
●
●
●
●
●
●
●
●
●●
●
●
●
●
●
●
●●
●
●
●
●
●
●
●●
●
●
●
●
●
●
●●
●
● ●
●
●
●
● ●
●
●●
●
●
●
●
●●
●
●
●
●
●●●
●
●
● ●
●
●●
●
●● ●
● ●
●
●
●●
●
●
●
●
●
●
●
●
●
● ●●
●
●
●
●●
●
●
●
●
●
●
●
●
●
●
●
●
●
●
●
●●
●
●
●
●
●
●
●
●
●
●
●
●
●
●
●
●●
●
●
●
●
●
●
NR R
−20 0 20 −20 0 20
−20
0
20
40
t−SNE1
t−SN
E2
●●●●●●●
T_cells
B_cells
CD14−
CD14+
NK_cells
cDC
pDC
SupplementaryFigure11NR R
tSNE1
tSNE
2
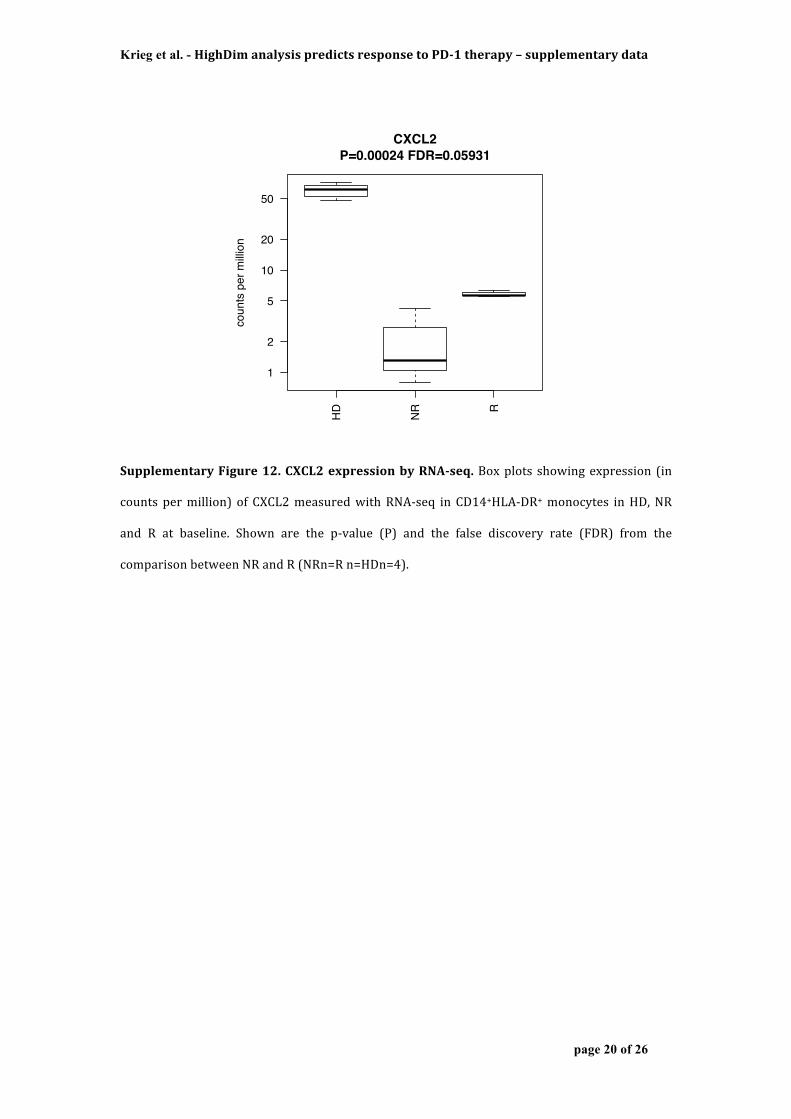
Krieg et al. - HighDimanalysispredictsresponsetoPD-1therapy–supplementarydata
page 20 of 26
SupplementaryFigure12.CXCL2expressionbyRNA-seq.Boxplots showingexpression (in
counts permillion) of CXCL2measuredwithRNA-seq in CD14+HLA-DR+monocytes inHD,NR
and R at baseline. Shown are the p-value (P) and the false discovery rate (FDR) from the
comparisonbetweenNRandR(NRn=Rn=HDn=4).
HD
NR R
1
2
5
10
20
50
CXCL2P=0.00024 FDR=0.05931
coun
ts p
er m
illion

Krieg et al. - HighDimanalysispredictsresponsetoPD-1therapy–supplementarydata
page 21 of 26
Supplementary Figure 13. Citrus analysis of the T cell panel. Using a predictive model
(pamr)Citrusidentifiedclustersforwhichabundancewasthebestpredictoroftheresponseto
the PD-1 treatment. (A) Cross validation results presenting estimated error rates of models
consideredbyCitrus.Reportedareresults for theminimumerrorratemodel (cv.min). (B)Cell
abundanceinclustersidentifiedbyCitrusasassociatedwiththeresponse,stratifiedbyresponse
(responder R and non-responderNR). (C) Clustering hierarchy of clusters generated by Citrus
that contain at least 5% of total cells. (D) Heatmap representing overallmarker expression in
clustersidentifiedbyCitrusasassociatedwithresponse.
●●
●●
●●●●●●●●●●●●●●●●●●●●●●●●●●●●●●●●●●●●●●●●●●●●●●●●●●●●●●●●●●●●●●●●●●●●●●●●●●●●●●●●●●●●●●●●●●●●●●●●
Number of model features
Regularization Threshold
Mod
el C
ross
Val
idat
ion
Erro
r Rat
e
3.95 3.51 3.07 2.63 2.19 1.76 1.32 0.88 0.44 0.00
025
5075
100
0 2 5 6 7 7 8 8 10 11 14 16 18 24 29
●●●●●●●●●●●●●●●●●●●●●●●●●●●●●●●●●●●●●●●●●●●●●●●●●●●●●●●●●●●●●●●●●●●●●●●●●●●●●●
●●●●●●●●●●●●●●●●●●●●●●
●●
●
●
●
Cross Validation Error RateFeature False Discovery Ratecv.mincv.1secv.fdr.constrained
abundance
9905
9915
99389948
9949
9955
9969
9972
9976
9977
9978
9979
9980
9981
9982
9983
9984
9986
99879988
9989
9990
9991
9992
9993
9994
9995
9996
9997
99989999
5.34
1.77
0.55
3.80
0.12
3.24
1.88
4.35
1.98
2.22
0.51
3.21
0.29
1.39
0.36
2.95
0.32
0.21
4.11
4.34
0.12
0.00
0.00
0.00
1.79
1.64
174Yb_HLA−DR170Yb_CD3155G
d_CD27145Nd_CD4.CD4146Nd_CD8a160G
d_CD28153Eu_CD62L176Yb_CD127172Yb_CD57165Ho_CD45RO209Bi_CD16169Tm
_CD19171Yb_G
ranzymeB
9990 (22%)9994 (24.52%)
0
1
2
3
4
5
cluster 9990 abundance
cluster 9994 abundance
NR
R
NR
R
0.1Log10 scale
MyeloidTcell
A B
C
D
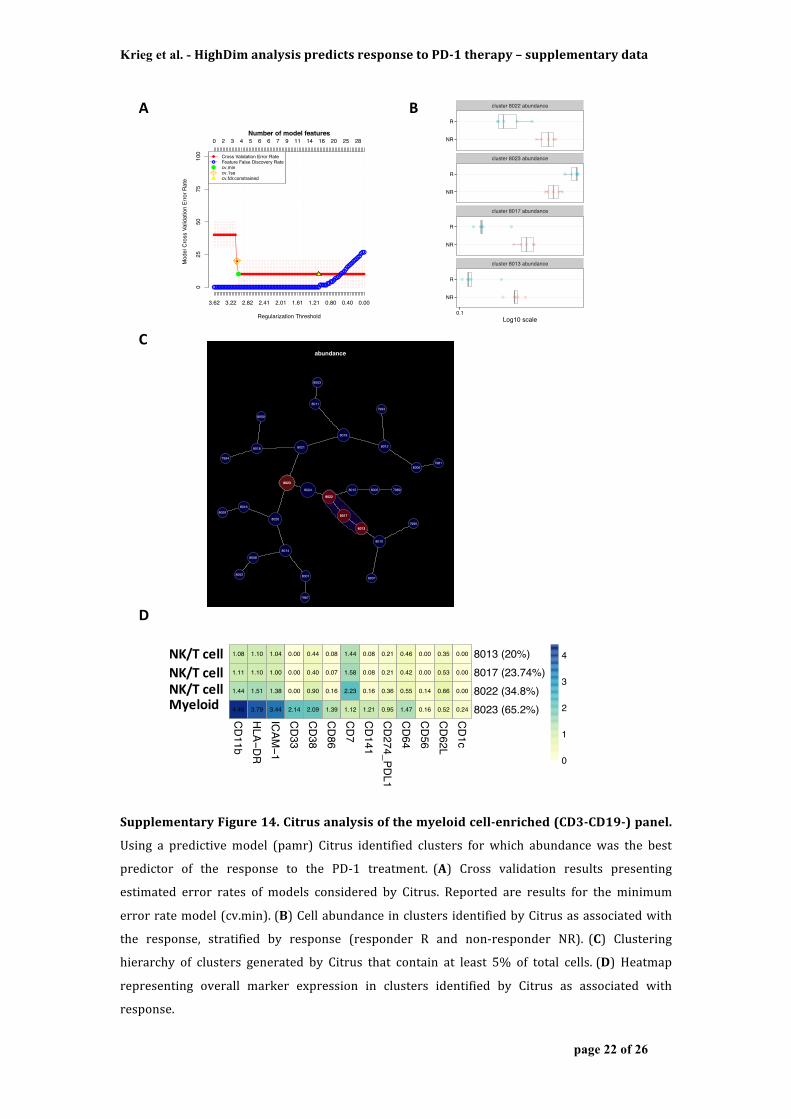
Krieg et al. - HighDimanalysispredictsresponsetoPD-1therapy–supplementarydata
page 22 of 26
SupplementaryFigure14.Citrusanalysisofthemyeloidcell-enriched(CD3-CD19-)panel.
Using a predictive model (pamr) Citrus identified clusters for which abundance was the best
predictor of the response to the PD-1 treatment. (A) Cross validation results presenting
estimated error rates of models considered by Citrus. Reported are results for the minimum
errorratemodel(cv.min). (B)Cellabundanceinclusters identifiedbyCitrusasassociatedwith
the response, stratified by response (responder R and non-responder NR). (C) Clustering
hierarchy of clusters generated by Citrus that contain at least 5% of total cells. (D) Heatmap
representing overall marker expression in clusters identified by Citrus as associated with
response.
●●●●●●●●●●●●●●●
●
●●●●●●●●●●●●●●●●●●●●●●●●●●●●●●●●●●●●●●●●●●●●●●●●●●●●●●●●●●●●●●●●●●●●●●●●●●●●●●●●●●●●
Number of model features
Regularization Threshold
Mod
el C
ross
Val
idat
ion
Erro
r Rat
e
3.62 3.22 2.82 2.41 2.01 1.61 1.21 0.80 0.40 0.00
025
5075
100
0 2 3 4 5 6 6 7 9 11 14 16 20 25 28
●●●●●●●●●●●●●●●●●●●●●●●●●●●●●●●●●●●●●●●●●●●●●●●●●●●●●●●●●●●●●●●●●●●●●●●●●●●●●●●
●●●●●●●●●●●●●●●●●●●●●
●●
●
●
●
Cross Validation Error RateFeature False Discovery Ratecv.mincv.1secv.fdr.constrained
abundance
7981
7987
7989
7993
7994
7995
8000
80018002
8003
8005
8006
8007
8008
8009
8010
8011
8012
8013
8014
8015
8016
8017
8018
8019
8020
8021
8022
8023
8024
cluster 8022 abundance
cluster 8023 abundance
cluster 8017 abundance
cluster 8013 abundance
NR
R
NR
R
NR
R
NR
R
0.1Log10 scale
1.08
1.11
1.44
4.40
1.10
1.10
1.51
3.79
1.04
1.00
1.38
3.44
0.00
0.00
0.00
2.14
0.44
0.40
0.90
2.09
0.08
0.07
0.16
1.39
1.44
1.58
2.23
1.12
0.08
0.08
0.16
1.21
0.21
0.21
0.36
0.95
0.46
0.42
0.55
1.47
0.00
0.00
0.14
0.16
0.35
0.53
0.66
0.52
0.00
0.00
0.00
0.24
CD
11bH
LA−DR
ICAM
−1C
D33
CD
38C
D86
CD
7C
D141
CD
274_PDL1
CD
64C
D56
CD
62LC
D1c
8013 (20%)8017 (23.74%)8022 (34.8%)8023 (65.2%)
0
1
2
3
4
MyeloidNK/Tcell
NK/TcellNK/Tcell
A B
C
D

Krieg et al. - HighDimanalysispredictsresponsetoPD-1therapy–supplementarydata
page 23 of 26
Supplementary Figure15. FACS validationpanel.PBMC from an independent, randomized,
blinded patient cohortwere stained for CD3, CD4, CD11b, CD14, CD19, CD16, CD33, CD45RO,
CD56,andHLA-DR,acquiredandanalyzedusingtheabovegatingstrategy.Notethepositionof
thelymphocytesandmonocytesgate(arrow).
Exclude!

Krieg et al. - HighDimanalysispredictsresponsetoPD-1therapy–supplementarydata
page 24 of 26
Supplementary Figure 16. Baseline clinical parameters of patients.Clinical parameters of
the patients included in the discovery mass cytometry (N=20) and FACS validation (N=31)
approaches. Parameters were categorized according to standard clinical cutoffs (e.g. LDH >
480U/l). The percentages are calculated on the total number of patients in the cohort and
thereforeaccountformissingvalues.
N % N %Age
< 40 years old 0 0.0% 4 12.9%40-55 years old 7 35.0% 10 32.3%56-70 years old 7 35.0% 6 19.4%> 70 years old 6 30.0% 11 35.5%
GenderMale 13 65.0% 17 54.8%Female 7 35.0% 14 45.2%
Progression-free survival (PFS)< 3 months 6 30.0% 12 38.7%3-9 months 5 25.0% 13 41.9%> 9 months 9 45.0% 6 19.4%
Lactate dehydrogenase (LDH)< 480 U/l 18 90.0% 26 89.7%≥ 480 U/l 2 10.0% 3 10.3%
S100< 0.2 μg/l 9 45.0% 17 56.7%≥ 0.2 μg/l 11 55.0% 13 43.3%
Neutrophils (ANC)< 8 G/l 18 90.0% 30 96.8%≥ 8 G/l 2 10.0% 1 3.2%
Lymphocytes (ALC)< 1.5 G/l 11 55.0% 20 64.5%≥ 1.5 G/l 9 45.0% 11 35.5%
Leukocytes< 9.6 G/l 17 85.0% 30 96.8%≥ 9.6 G/l 3 15.0% 1 3.2%
Monocytes< 0.95 G/l 17 85.0% 30 96.8%≥ 0.95 G/l 3 15.0% 1 3.2%
Thrombocytes< 143 G/l 1 5.0% 0 0.0%143 - 400 G/l 18 90.0% 28 90.3%> 400 G/l 1 5.0% 3 9.7%
Eosinophils< 0.7 G/l 4 20.0% 31 100.0%≥ 0.7 G/l 16 80.0% 0 0.0%
Basophils< 0.15 G/l 20 100.0% 31 100.0%≥ 0.15 G/l 0 0.0% 0 0.0%
Haemoglobin< 134 g/l 11 55.0% 15 48.4%≥ 134 g/l 9 45.0% 16 51.6%
Hematocrit< 0.4 l/l 7 35.0% 11 35.5%≥ 0.4 l/l 13 65.0% 20 64.5%
Erythrocytes< 4.2 T/l 6 30.0% 7 22.6%≥ 4.2 T/l 14 70.0% 24 77.4%
Mean corpuscular volume (MCV)< 80 fl 0 0.0% 1 3.2%≥ 80 fl 20 100.0% 30 96.8%
Mean corpuscular haemoglobin (MCH)< 34 pg 20 100.0% 29 93.5%≥ 34 pg 0 0.0% 2 6.5%
Mean corpuscular haemoglobin concentration (MCHC)
< 310 g/l 1 5.0% 1 3.2%≥ 310 g/l 19 95.0% 30 96.8%
Red blood cell distribution width (RDW)< 14.8 % 12 85.7% 22 78.6%≥ 14.8 % 2 14.3% 6 21.4%
Immature granulocytes absolute< 0.03 G/l 15 78.9% 26 83.9%≥ 0.03 G/l 4 21.1% 5 16.1%
Immature granulocytes< 0.5 % 17 89.5% 28 90.3%≥ 0.5 % 2 10.5% 3 9.7%
Sodium< 136 mmol/l 3 15.0% 1 3.2%≥ 136 mmol/l 17 85.0% 30 96.8%
Potassium< 3.3 mmol/l 0 0.0% 0 0.0%3.3 - 4-5 mmol/l 17 94.4% 29 96.7%> 4.5 mmol/l 1 5.6% 1 3.3%
Urea< 7.14 mmol/l 15 78.9% 27 87.1%≥ 7.14 mmol/l 4 21.1% 4 12.9%
Creatinin< 62 μmol/l 4 20.0% 8 26.7%62 - 106 μmol/l 16 80.0% 18 60.0%> 106 μmol/l 0 0.0% 4 13.3%
Estimated glomerular filtration rate (eGFR)< 90 ml/min 9 45.0% 17 56.7%≥ 90 ml/min 11 55.0% 13 43.3%
Bilirubin< 21 μmol/l 16 94.1% 27 93.1%≥ 21 μmol/l 1 5.9% 2 6.9%
Protein< 66 g/l 1 7.1% 2 11.8%≥ 66 g/l 13 92.9% 15 88.2%
Albumin< 40 g/l 3 23.1% 3 12.0%≥ 40 g/l 10 76.9% 22 88.0%
Aspartate aminotransferase (AST)< 50 U/l 16 94.1% 25 92.6%≥ 50 U/l 1 5.9% 2 7.4%
Alanine aminotransferase (ALT)< 50 U/l 18 94.7% 30 96.8%≥ 50 U/l 1 5.3% 1 3.2%
Gamma-glutamyl transpeptidase (GGT)< 60 U/l 10 100.0% 25 83.3%≥ 60 U/l 0 0.0% 5 16.7%
Alkaline phosphatase< 40 U/l 2 10.5% 2 6.5%40 - 129 U/l 16 84.2% 27 87.1%> 129 U/l 1 5.3% 2 6.5%
C-reactive protein (CRP)< 5 mg/l 12 66.7% 19 67.9%≥ 5 mg/l 6 33.3% 9 32.1%
Thyroid-stimulating hormone (TSH)< 3.18 mg/l 13 81.3% 26 83.9%≥ 3.18 mg/l 3 18.8% 5 16.1%
PATIENT CHARACTERISTICS Discovery cohort Validation cohort

Krieg et al. - HighDimanalysispredictsresponsetoPD-1therapy–supplementarydata
page 25 of 26
Supplementary Figure17.Hazard rates according to baseline characteristics of patients
included the discovery mass cytometry and validation conventional flow cytometry
approaches. (A) Univariate Cox regression analysis of progression-free survival (PFS). (B)
MultivariateCoxregressionanalysisincludedvariableswithp-values<0.05fromtheunivariate
analysis. The columns next to the variables in the table show the coefficients Hazard Rate
(HRate),thelower(LCL)andupper(UCL)95%confidenceintervals,andtheassociatedp-value
(Pvalue) derived from theCox regression.Missing values for baseline characteristicswerenot
inputed.Redsquaresrepresenthazardrates.Barsrepresent95%confidenceinterval(n=51).
A
B
SupplementaryFigure17
UNIVARIATE Cox regression model − BOTH COHORT, baseline samples only
variablesThrombocytesClassical monocytes (CD14+CD16−)Lactate dehydrogenase (LDH)Liver metastasisAlkaline phosphataseImmature granulocytes (%)M classification = 1PotassiumHematocritAlbuminMelanoma stage IVN classification = 3HemoglobinAspartate aminotransferaseBrain metastasisSex (Male)ErythrocytesGamma−glutamyl transpeptidaseTyroid−stimulating hormonePrevious targeted therapycKIT mutatedN classification = 2MonocytesN classification = 1C−reactive proteinS100Previous chemo treatmentPrevious radio treatmentBasophilsBone metastasisLymphocytes (ALC)Mean corpuscular hemoglobinEstimated glomerular filtration rateLung metastasisUlcerated primary tumorBRAF mutatedMean corpuscular hemoglobin conc.Total proteinAlanine aminotransferaseNRAS mutatedPrimary tumor classification = 3EosinophilsBilirubinUreaRed cell distribution widthAge at samplingPrimary tumor classification = 4Number of days since last ipi treatmentSodiumLeukocytesPrevious ipi treatmentCreatinineANC/ALCMean corpuscular volumeNeutrophils (ANC)Primary tumor classification = 2Nodal metastatic mass = macrometastasisNodal metastatic mass = in transit metastasis
HRate 0.009−0.786 0.001 1.070 0.011 0.801−1.440−1.180−7.440−0.113−1.200−0.861−0.016 0.015−0.890−0.513−0.526 0.001 0.152 0.598 1.170−0.738 0.929−0.781 0.010 0.082 0.382−0.293 8.300−0.300−0.204−0.061−0.006−0.190−0.210−0.178 0.007 0.021 0.006 0.177−0.238−0.386−0.005 0.026−0.060−0.002−0.116 0.000−0.006−0.007−0.026 0.000 0.002 0.000−0.001−0.00719.20019.200
LCL(95%) 4.33e−03−1.19e+00 3.00e−04 3.49e−01 3.15e−03 1.30e−01−2.71e+00−2.27e+00−1.53e+01−2.38e−01−2.69e+00−1.94e+00−3.69e−02−4.70e−03−2.08e+00−1.21e+00−1.26e+00−4.96e−04−7.51e−02−2.96e−01−6.53e−01−1.89e+00−6.11e−01−2.22e+00−9.87e−03−8.79e−02−4.58e−01−9.88e−01−1.23e+01−1.14e+00−7.96e−01−2.44e−01−2.54e−02−8.79e−01−1.07e+00−9.11e−01−2.35e−02−7.13e−02−2.05e−02−6.78e−01−1.75e+00−2.86e+00−3.57e−02−1.70e−01−6.04e−01−2.57e−02−1.39e+00−3.02e−03−1.52e−01−1.91e−01−9.22e−01−1.73e−02−1.68e−01−4.75e−02−2.14e−01−1.51e+00
−Inf −Inf
UCL(95%) 0.01310−0.38400 0.00136 1.78000 0.01920 1.47000−0.16300−0.09130 0.37200 0.01210 0.28600 0.21700 0.00487 0.03500 0.29800 0.18000 0.20800 0.00256 0.37900 1.49000 2.99000 0.41500 2.47000 0.65700 0.02960 0.25300 1.22000 0.4010028.90000 0.54200 0.38800 0.12100 0.01380 0.49900 0.64900 0.55600 0.03760 0.11300 0.03190 1.03000 1.27000 2.09000 0.02640 0.22300 0.48300 0.02120 1.16000 0.00257 0.14000 0.17800 0.87000 0.01650 0.17200 0.04670 0.21100 1.50000
Inf Inf
Pvalue9.82e−051.26e−042.14e−033.59e−036.28e−031.93e−022.71e−023.36e−026.20e−027.67e−021.13e−011.17e−011.33e−011.34e−011.42e−011.47e−011.60e−011.85e−011.89e−011.90e−012.09e−012.10e−012.37e−012.87e−013.27e−013.43e−013.73e−014.08e−014.29e−014.85e−014.99e−015.10e−015.60e−015.88e−016.32e−016.35e−016.51e−016.59e−016.70e−016.85e−017.58e−017.60e−017.67e−017.91e−018.28e−018.52e−018.59e−018.74e−019.34e−019.43e−019.55e−019.65e−019.81e−019.87e−019.91e−019.92e−019.99e−019.99e−01
−10 −8 −6 −4 −2 0 2 4 6 8 10
Hazard Rate
MULTIVARIATE Cox regression model − BOTH COHORT, baseline samples only
variablesClassical monocytes (CD14+CD16−)Immature granulocytes (%)Lactate dehydrogenase (LDH)M classification = 1Alkaline phosphataseThrombocytesPotassiumLiver metastasis
HRate−1.180 1.180 0.001 1.860 0.008 0.005−1.180 0.323
LCL(95%)−2.020 0.237 0.000−0.195−0.003−0.003−3.330−0.794
UCL(95%)−0.344 2.130 0.002 3.910 0.018 0.013 0.963 1.440
Pvalue0.0060.0140.0660.0760.1380.1970.2800.571
−5 −4 −3 −2 −1 0 1 2 3 4 5
Hazard Rate

Krieg et al. - HighDimanalysispredictsresponsetoPD-1therapy–supplementarydata
page 26 of 26
REFERENCES
1. Nowicka,M.etal.CyTOFworkflow:differentialdiscoveryinhigh-throughputhigh-
dimensionalcytometrydatasets.F1000Research6,748(2017).2. Bates,D.,Mächler,M.,Bolker,B.&Walker,S.FittingLinearMixed-EffectsModelsUsing
lme4.JournalofStatisticalSoftware67,1–48(2015).3. Hothorn,T.,Bretz,F.&Westfall,P.SimultaneousInferenceinGeneralParametricModels.
BiometricalJournal50,346–363(2008).4. Levine,J.H.etal.Data-DrivenPhenotypicDissectionofAMLRevealsProgenitor-likeCells
thatCorrelatewithPrognosis.Cell162,184–197(2015).5. VanGassen,S.etal.FlowSOM:Usingself-organizingmapsforvisualizationand
interpretationofcytometrydata.CytometryPartA87,636–645(2015).6. Wilkerson,M.D.&Hayes,D.N.ConsensusClusterPlus:aclassdiscoverytoolwith
confidenceassessmentsanditemtracking.Bioinformatics26,1572–1573(2010).7. Weber,L.M.&Robinson,M.D.ComparisonofClusteringMethodsforHigh-Dimensional
Single-CellFlowandMassCytometryData.(2016).doi:10.1101/0476138. Maaten,L.V.D.&Hinton,G.VisualizingDatausingt-SNE.JournalofMachineLearning
Research9,2579–2605(2008).9. Diggins,K.E.,Greenplate,A.R.,Leelatian,N.,Wogsland,C.E.&Irish,J.M.Characterizing
cellsubsetsusingmarkerenrichmentmodeling.Nat.Methods14,275–278(2017).10. Lin,L.etal.COMPASSidentifiesT-cellsubsetscorrelatedwithclinicaloutcomes.Nat.
Biotechnol.33,610–616(2015).11. glmmADMBRpackage.Linkhttpglmmadmb.r-forge.r-project.orgAvailableat:(Accessed:
12December2016)12. López-Ratón,M.,Rodríguez-Álvarez,M.X.,Suárez,C.C.&Sampedro,F.G.
OptimalCutpoints:AnRPackageforSelectingOptimalCutpointsinDiagnosticTests.JournalofStatisticalSoftware61,1–36(2014).
13. Guglietta,S.etal.CoagulationinducedbyC3aR-dependentNETosisdrivesprotumorigenicneutrophilsduringsmallintestinaltumorigenesis.NatCommun7,11037(2016).