Embed Size (px)
Citation preview

1
Title: Effective Programs in Elementary Mathematics: A Best Evidence-Synthesis Authors and Affiliations: Marta Pellegrini, University of Florence, Italy – Presenting Author
Cynthia Lake, Johns Hopkins University ([email protected]) Amanda Inns, Johns Hopkins University ([email protected]) Robert E. Slavin, Johns Hopkins University ([email protected])
2
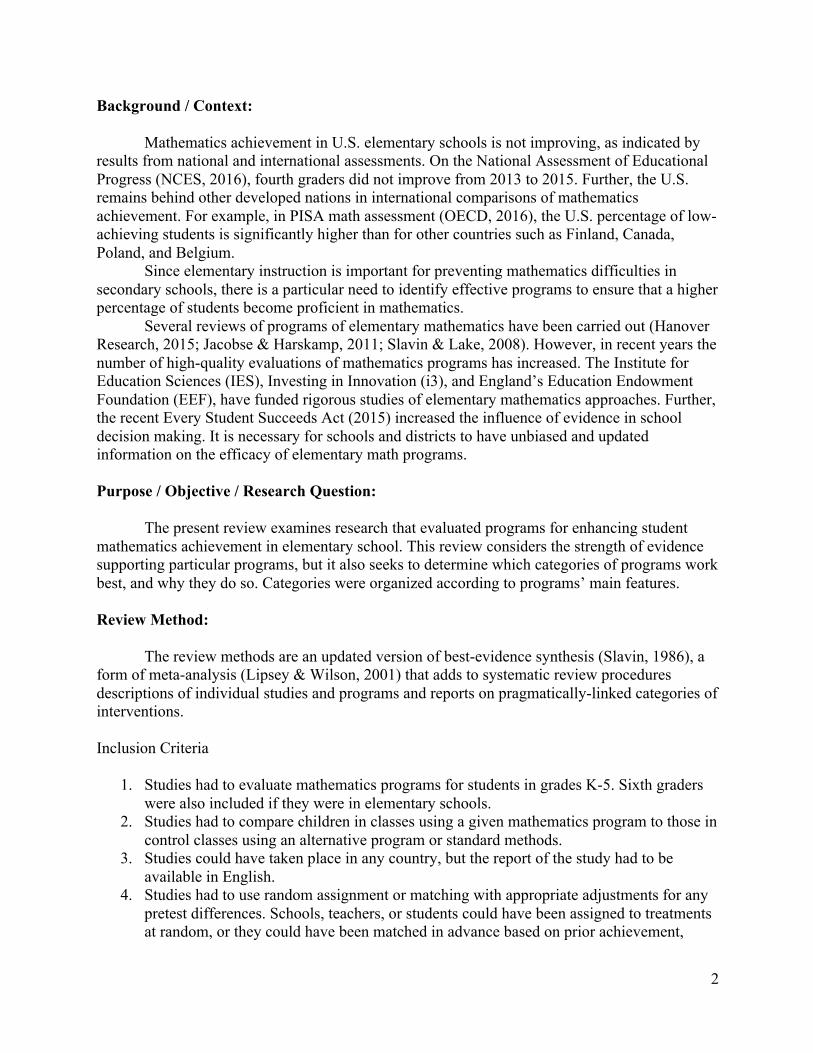
Background / Context: Mathematics achievement in U.S. elementary schools is not improving, as indicated by results from national and international assessments. On the National Assessment of Educational Progress (NCES, 2016), fourth graders did not improve from 2013 to 2015. Further, the U.S. remains behind other developed nations in international comparisons of mathematics achievement. For example, in PISA math assessment (OECD, 2016), the U.S. percentage of low-achieving students is significantly higher than for other countries such as Finland, Canada, Poland, and Belgium. Since elementary instruction is important for preventing mathematics difficulties in secondary schools, there is a particular need to identify effective programs to ensure that a higher percentage of students become proficient in mathematics. Several reviews of programs of elementary mathematics have been carried out (Hanover Research, 2015; Jacobse & Harskamp, 2011; Slavin & Lake, 2008). However, in recent years the number of high-quality evaluations of mathematics programs has increased. The Institute for Education Sciences (IES), Investing in Innovation (i3), and England’s Education Endowment Foundation (EEF), have funded rigorous studies of elementary mathematics approaches. Further, the recent Every Student Succeeds Act (2015) increased the influence of evidence in school decision making. It is necessary for schools and districts to have unbiased and updated information on the efficacy of elementary math programs. Purpose / Objective / Research Question: The present review examines research that evaluated programs for enhancing student mathematics achievement in elementary school. This review considers the strength of evidence supporting particular programs, but it also seeks to determine which categories of programs work best, and why they do so. Categories were organized according to programs’ main features. Review Method: The review methods are an updated version of best-evidence synthesis (Slavin, 1986), a form of meta-analysis (Lipsey & Wilson, 2001) that adds to systematic review procedures descriptions of individual studies and programs and reports on pragmatically-linked categories of interventions. Inclusion Criteria
1. Studies had to evaluate mathematics programs for students in grades K-5. Sixth graders were also included if they were in elementary schools.
2. Studies had to compare children in classes using a given mathematics program to those in control classes using an alternative program or standard methods.
3. Studies could have taken place in any country, but the report of the study had to be available in English.
4. Studies had to use random assignment or matching with appropriate adjustments for any pretest differences. Schools, teachers, or students could have been assigned to treatments at random, or they could have been matched in advance based on prior achievement,

3
demographics, and other factors. However, studies that matched after posttesting (post-hoc quasi-experiments) were not included.
5. Studies had to have provided pretest data based on the final sample (after attrition). Studies with pretest differences of more than 25% of a standard deviation were excluded.
6. Studies’ dependent measures had to have included quantitative measures of mathematics performance such as standardized mathematics measures. Studies involving experimenter-made measures or measures of mathematics objectives that were inherent to the intervention were excluded.
7. Studies had to have had a minimum duration of 12 weeks. 8. Studies had to evaluate programs that could, in principle, be replicated. Studies in which
the treatments were delivered by the developers themselves or their graduate students, for example, were excluded.
Literature Search Procedures A broad literature search was carried out in an attempt to locate every study that might possibly meet the inclusion requirements. Electronic searches were conducted in educational databases (JSTOR, ERIC, EBSCO, PsycINFO, and Dissertation Abstracts International) using different combinations of key words (e.g., “elementary students,” “mathematics,” and “achievement”). Search results were limited to studies published between 1990 and 2017. Studies of technology approaches had to fall between 2000 and 2017. We looked for studies using Internet search engines and indexes of educational journals, examined the websites of educational publishers, and attempted to contact producers and developers of mathematics programs. Further, we investigated citations from previous reviews of research on elementary mathematics programs. Effect Sizes In general, effect sizes were computed as the difference between the posttest scores for individual students in the experimental and control groups after adjustment for pretests and other covariates, divided by the unadjusted standard deviation of the control group’s posttest scores. Procedures described by Lipsey and Wilson (2001) were used to estimate effect sizes when unadjusted standard deviations were not available. Effect sizes were pooled across studies for each program and for various categories of programs, weighting by inverse variance. Findings / Results: The following preliminary results are based on 60 studies of 46 programs. The full paper will include additional studies that meet the inclusion criteria. Programs were organized into seven categories: tutoring, professional development, whole-school reform, technology, mathematics curricula, benchmark assessments and social-emotional interventions. All categories had positive effects on average (Table 8). The category with the largest positive effects was tutoring programs (see Table 1). One-to-one tutoring interventions (ES = +0.26) had effect sizes that were somewhat lower than small

4
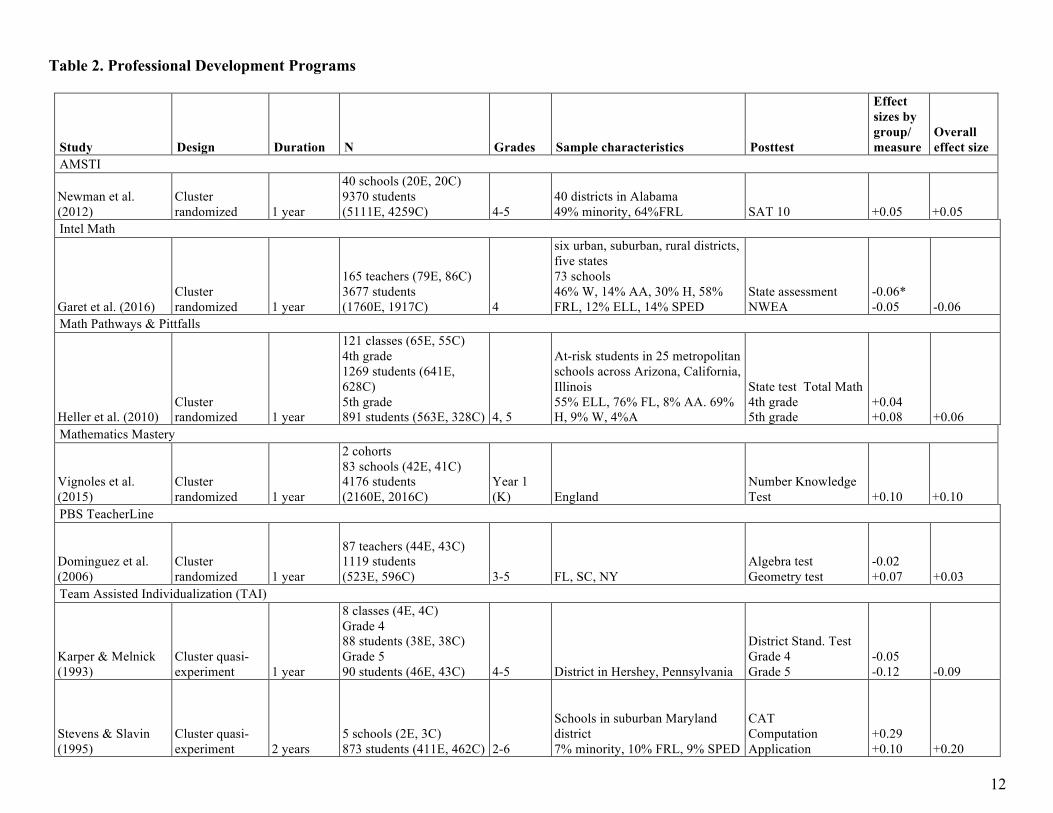
group tutoring programs (ES = +0.34). One study of cross-age tutoring had the smallest impact of any tutoring study (ES = +0.02, n.s.). The category of professional development found a small effect for all programs (ES = +0.03) (Table 2). Interventions of this category focused on formative assessment had an average effect close to zero (ES = +0.01). Programs focused on whole school reform found small effects with a mean effect size of +0.01 (Table 3). On average, studies incorporating technology (Table 4) found small effects (ES = +0.07). The one exception was DreamBox Learning (mean ES = +0.11). Studies of mathematics curricula had a weighted mean effect size of +0.07 (Table 5), but there were positive effects on at least some measures for Jump Math (ES = +0.23), Math Expressions (ES = +0.11) and Math in Focus (ES = +0.19). Studies of benchmark assessments (Table 6) found small effects (ES = +0.01), although one study of Acuity had positive significant effects (ES = +0.19). A category with moderate positive effects was social-emotional interventions, with an average effect size of +0.20 (Table 7). Two studies of PAX Good Behavior Game and Positive Action found significant positive effects on math achievement (ES = +0.32, +0.27, respectively). However, mean effect sizes for Responsive Classroom and INSIGHTS were near zero. According to ESSA evidence standards, 13 programs met the strong level and 2 programs the moderate level (Table 9). Conclusion: The evidence from this review supports the use of one-to-one and small group tutoring. Technology, social-emotional strategies, and math curricula had small impacts overall, and some individual programs in other categories had promising outcomes.

5
References:
Agodini, R., Harris, B., Thomas, M., Murphy, R., & Gallagher, L. (2010). Achievement effects of four early elementary school math curricula: Findings for first and second graders. NCEE 2011-4001. National Center for Education Evaluation and Regional Assistance.
Bavarian, N., Lewis, K. M., DuBois, D. L., Acock, A., Vuchinich, S., Silverthorn, N., … & Flay, B. R. (2013). Using social emotional and character development to improve academic outcomes: A matched‐pair, cluster‐randomized controlled trial in low‐income, urban schools. Journal of School Health, 83(11), 771-779.
Cavalluzzo, L., Geraghty, T. M., Steele, J. L., Holian, L., Jenkins, F., Alexander, J. M., & Yamasaki, K. Y. (2014). “Using data” to inform decisions: How teachers use data to inform practice and improve student performance in mathematics. Results from a randomized experiment of program efficacy. Arlington, VA: CNA Corporation.
Clarke, B., Baker, S., Smolkowski, K., Doabler, C., Strand Cary, M., & Fien, H. (2015). Investigating the efficacy of a core kindergarten mathematics curriculum to improve student mathematics learning outcomes. Journal of Research on Educational Effectiveness, 8(3), 303-324.
Clarke, B., Doabler, C. T., Strand Cary, M., Kosty, D., Baker, S., Fien, H., & Smolkowski, K. (2014). Preliminary evaluation of a tier 2 mathematics intervention for first-grade students: Using a theory of change to guide formative evaluation activities. School Psychology Review, 43(2), 160-178.
Doabler, C. T., Clarke, B., Stoolmiller, M., Kosty, D. B., Fien, H., Smolkowski, K., & Baker, S. K. (2017). Explicit Instructional Interactions: Exploring the Black Box of a Tier 2 Mathematics Intervention. Remedial and Special Education, 38(2), 98-110.
Dominguez, P. S., Nicholls, C., & Storandt, B. (2006). Experimental Methods and Results in a Study of PBS TeacherLine Math Courses. Hezel Associates (NJ1).
Eddy, R. M., Hankel, N., Hunt, A., Goldman, A., & Murphy, K. (2014). Houghton Mifflin Harcourt GO Math! efficacy study year two final report. La Verne, CA: Cobblestone Applied Research & Evaluation, Inc.
Educational Research Institute of America (2010). A study of the Singapore math program, Math in Focus, state test results. Houghton Mifflin Harcourt: Report Number 404.
Educational Research Institute of America (2013). A study of the instructional effectiveness of Math in Focus. Houghton Mifflin Harcourt: Report Number 466.
Fuchs, L. S., Geary, D. C., Compton, D. L., Fuchs, D., Schatschneider, C., Hamlett, C. L., ... & Bryant, J. D. (2013). Effects of first-grade number knowledge tutoring with contrasting forms of practice. Journal of Educational Psychology, 105(1), 58-77.
Fuchs, L. S., Malone, A. S., Schumacher, R. F., Namkung, J., Hamlett, C. L., Jordan, N. C., ... & Changas, P. (2016b). Supported self-explaining during fraction intervention. Journal of Educational Psychology, 108(4), 493-508.
Fuchs, L. S., Powell, S. R., Seethaler, P. M., Cirino, P. T., Fletcher, J. M., Fuchs, D., & Hamlett, C. L. (2010). The effects of strategic counting instruction, with and without deliberate practice, on number combination skill among students with mathematics difficulties. Learning and individual differences, 20(2), 89-100.
Fuchs, L. S., Sterba, S. K., Fuchs, D., & Malone, A. S. (2016a). Does evidence-based fractions intervention address the needs of very low-performing students?. Journal of Research on Educational Effectiveness, 9(4), 662-677.

6
Garet, M. S., Heppen, J. B., Walters, K., Parkinson, J., Smith, T. M., Song, M., ... & Borman, G. D. (2016). Focusing on Mathematical Knowledge: The Impact of Content-Intensive Teacher Professional Development. NCEE 2016-4010. National Center for Education Evaluation and Regional Assistance.
Gersten, R., Rolfhus, E., Clarke, B., Decker, L. E., Wilkins, C., & Dimino, J. (2015). Intervention for first graders with limited number knowledge large-scale replication of a randomized controlled trial. American Educational Research Journal, 52(3), 516-546.
Gatti, G. G. (2009). Pearson Successmaker Math Pilot Study. 2008-09 final report. Pittsburgh, PA: Gatti Evaluation Inc.
Gatti, G. G., & Petrochenkov, K. (2010). Pearson successmaker math efficacy study: 2009–10 final report. Pittsburgh, PA: Gatti Evaluation Inc.
Gatti, G. (2013). Pearson SuccessMaker response to intervention study: Final report. Pittsburgh, PA: Gatti Evaluation. Inc.
Hanover Research (2014). Best Practices in Math Interventions. Washington, DC: Author. Heller, J. I. (2010). The impact of Math Pathways & Pitfalls on students’ mathematics
achievement and mathematical language development: A study conducted in schools with high concentrations of Latino/a students and English learners. U.S. Department of Education, Institute of Education Sciences.
Jaciw, A. P., Hegseth, W. M., Lin, L., Toby, M., Newman, D., Ma, B., & Zacamy, J. (2016). Assessing impacts of Math in Focus, a “Singapore Math” Program. Journal of Research on Educational Effectiveness, 9(4), 473-502.
Jacob, R., Goddard, R., Kim, M., Miller, R., & Goddard, Y. (2015). Exploring the causal impact of the McREL Balanced Leadership Program on leadership, principal efficacy, instructional climate, educator turnover, and student achievement. Educational Evaluation and Policy Analysis, 37(3), 314-332.
Jacobse, A. E., & Harskamp, E. (2011). A meta-analysis of the effects of instructional interventions on students’ mathematics achievement. Groningen: University of Groningen, GION.
Jordan, J. (2009). Math Connects: National field study: Student learning, student attitudes and teachers’ reports on program effectivness: Evaluation report. Cincinnati, OH. University of Cincinnati Evaluation Services Center.
Karper, J., & Melnick, S. A. (1993). The effectiveness of team accelerated instruction on high achievers in mathematics. Journal of Instructional psychology, 20(1), 49-54.
Konstantopoulos, S., Miller, S. R., & van der Ploeg, A. (2013). The impact of Indiana’s system of interim assessments on mathematics and reading achievement. Educational Evaluation and Policy Analysis, 35(4), 481-499.
Konstantopoulos, S., Miller, S. R., van der Ploeg, A., & Li, W. (2016). Effects of interim assessments on student achievement: Evidence from a large-scale experiment. Journal of Research on Educational Effectiveness, 9(sup1), 188-208.
Lambert, R., Algozzine, B., & McGee, J. (2014). Effects of progress monitoring on math performance of at-risk students. British Journal of Education, Society and Behavioural Science, 4(4), 527-540.
Lehmann, R. H., & Seeber, S. (2005). Accelerated Math in grades 4 through 6: Evaluation of an experimental program in 15 schools in North Rhine-Westphalia. Berlin: Humboldt University.
Lipsey, M. W., & Wilson, D. B. (2001). Practical meta-analysis. Thousand Oaks, CA: Sage.

7
Lloyd, C., Edovald, T., Morris, S., Kiss, Z., Skipp, A., & Haywood, S. (2015). Durham Shared Maths Project. London: Education Endowment Foundation.
Magnolia Consulting (2012). A final report for the evaluation of Pearson’s Waterford Early Learning Program: Year 2. Magnolia Consulting.
National Center for Education Statistics (NCES) (2016). National Assessment of Educational Progress. Washington, DC: Author.
Newman, D., Finney, P. B., Bell, S., Turner, H., Jaciw, A. P., Zacamy, J. L., & Gould, L. F. (2012). Evaluation of the Effectiveness of the Alabama Math, Science, and Technology Initiative (AMSTI). National Center For Education Evaluation and Regional Assistance.
O’Connor, E. E., Cappella, E., McCormick, M. P., & McClowry, S. G. (2014). An examination of the efficacy of INSIGHTS in enhancing the academic and behavioral development of children in early grades. Journal of Educational Psychology, 106(4), 1156-1169.
OECD (2016). PISA 2015 Results (Volume I): Excellence and Equity in Education. Paris: OECD Publishing.
Randel, B., Apthorp, H., Beesley, D., Clark, F., & Wang, X. (2016). Impacts of professional development in classroom assessment on teacher and student outcomes. The Journal of Educational Research, 109(5), 491-502.
Resendez, M., & Azin, M. (2006). 2005 Scott Foresman–Addison Wesley Elementary Math randomized control trial: Final report. Jackson, WY: PRES Associates, Inc.
Resendez, M., Azin, M., & Strobel, A. (2009). A study on the effects of Pearson’s 2009 enVision math program: Final summative report. Jackson, WY: Pres Associates.
Resendez, M., & Manley, M. A. (2005). Final report: A study on the effectiveness of the 2004 Scott Foresman–Addison Wesley Elementary Math program. Jackson, WY: PRES Associates, Inc
Resendez, M., & Sridharan, S. (2005). Technical report: A study on the effectiveness of the 2004 Scott Foresman–Addison Wesley Elementary Math program. Jackson, WY: PRES Associates, Inc
Resendez, M., & Sridharan, S. (2006). Technical report: A study on the effectiveness of the 2005 Scott Foresman–Addison Wesley Elementary Math program. Jackson, WY: PRES Associates, Inc.
Rimm-Kaufman, S. E., Fan, X., Chiu, Y. J., & You, W. (2007). The contribution of the Responsive Classroom Approach on children's academic achievement: Results from a three year longitudinal study. Journal of School Psychology, 45(4), 401-421.
Rimm-Kaufman, S. E., Larsen, R. A. A., Baroody, A. E., Curby, T. W., Ko, M., Thomas, J. B., … & DeCoster, J. (2014). Efficacy of the “Responsive Classroom” approach: Results from a 3-year, longitudinal randomized controlled trial. American Educational Research Journal, 51(3), 567-603.
Rosen, Y., & Beck-Hill, D. (2012). Intertwining digital content and a one-to-one laptop environment in teaching and learning: Lessons from the Time to Know program. Journal Of Research On Technology In Education, 44(3), 225-241.
Rutherford, T., Farkas, G., Duncan, G., Burchinal, M., Kibrick, M., Graham, J., … Martinez, E. (2014). A randomized trial of an elementary school mathematics software intervention: Spatial-Temporal Math. Journal of Research on Educational Effectiveness, 7(4), 358-383.
Rutt, S., Easton, C., & Stacey, O. (2014). Catch Up ® Numeracy: Evaluation Report and Executive Summary. London: Education Endowment Foundation.
8
Slavin, R. E. (1986). Best-evidence synthesis: An alternative to meta-analytic and traditional reviews. Educational Researcher, 15(9), 5-11.
Slavin, R. E., & Lake, C. (2008). Effective programs in elementary mathematics: A best-evidence synthesis. Review of Educational Research, 78(3), 427-515.
Smith, T. M., Cobb, P., Farran, D. C., Cordray, D. S., & Munter, C. (2013). Evaluating Math Recovery: Assessing the causal impact of a diagnostic tutoring program on student achievement. American Educational Research Journal, 50(2), 397-428.
Snyder, F., Flay, B., Vuchinich, S., Acock, A., Washburn, I., Beets, M., & Li, K. K. (2010). Impact of a social-emotional and character development program on school-level indicators of academic achievement, absenteeism, and disciplinary outcomes: A matched-pair, cluster-randomized, controlled trial. Journal of Research on Educational Effectiveness, 3(1), 26-55.
Solomon, T., Martinussen, R., Dupuis, A., Gervan, S., Chaban, P., Tannock, R., & Ferguson, B. (2011). Investigation of a cognitive science based approach to mathematics instruction. Paper presented at the Society for Research in Child Development Biennial Meeting, 2011, Montreal, Canada.
Stevens, R. J., & Slavin, R. E. (1995). The cooperative elementary school: Effects on students’ achievement, attitudes, and social relations. American educational research journal, 32(2), 321-351.
Styers, M. & Baird-Wilkerson, S. (2011). A final report for the evaluation of Pearson's focusMATH Program. Magnolia Consulting.
Suppes, P., Holland, P. W., Hu, Y., & Vu, M.T. (2013). Effectiveness of an individualized computer-driven online math K-5 course in eight California title I elementary schools. Educational Assessment, 18(3), 162-181.
Torgerson, C. J., Wiggins, A., Torgerson, D., Ainsworth, H., & Hewitt, C. (2013). Every Child Counts: Testing policy effectiveness using a randomised controlled trial, designed, conducted and reported to CONSORT standards. Research In Mathematics Education, 15(2), 141-153.
Vaden-Kiernan, M., Borman, G., Caverly, S., Bell, N., de Castilla, V. R., & Sullivan, K. (2015). Preliminary Findings from a Multi-Year Scale-Up Effectiveness Trial of Everyday Mathematics. Society for Research on Educational Effectiveness (SREE), 2015, Conference.
Vignoles, A., Jerrim, J., & Cowan, R. (2015). Mathematics Mastery: Primary Evaluation Report. London: Education Endowment Foundation.
Wang, H., & Woodworth, K. (2011a). Evaluation of Rocketship Education's use of DreamBox Learning's online mathematics program. Menlo Park, CA: SRI International.
Wang, H., & Woodworth, K. (2011b). A randomized controlled trial of two online mathematics curricula. Society for Research on Educational Effectiveness (SREE), 2011, Conference.
Weis, R., Osborne, K. J., & Dean, E. L. (2015). Effectiveness of a universal, interdependent group contingency program on children's academic achievement: A countywide evaluation. Journal of Applied School Psychology, 31(3), 199-218.
West, M. R., Morton, B. A., & Herlihy, C. M. (2016). Achievement Network’s Investing in Innovation expansion: Impacts on educator practice and student achievement. Center for Educational Policy Research. Harvard University.
Wijekumar, K., Hitchcock, J., Turner, H., Lei, P. W., & Peck, K. (2009). A Multisite Cluster Randomized Trial of the Effects of CompassLearning Odyssey® Math on the Math

9
Achievement of Selected Grade 4 Students in the Mid-Atlantic Region (NCEE 2009-4068). Washington, DC: National Center for Education Evaluation and Regional Assistance, Institute of Education Sciences, U.S. Department of Education.
Wilkerson, S. B., Shannon, L. C., Styers, M. K., & Grant, B. J. (2012). A study of the effectiveness of a school improvement intervention (Success in Sight). Final Report. NCEE 2012-4014. National Center for Education Evaluation and Regional Assistance.
Ysseldyke, J., & Bolt, D. M. (2007). Effect of technology-enhanced continuous progress monitoring on math achievement. School Psychology Review, 36(3), 453-467.

10
Table 1. Tutoring Programs
One-to-One tutoring
Study Design Duration N Grades Sample characteristics Posttest
Effect sizes by group/ measure
Overall effect size
Catch Up® Numeracy
Rutt et al. (2014) Student randomized 30 weeks
216 students (108E, 108C)
Year 2-6 (grade 1-5)
54 schools in Oxford, Southend and Thurrock, UK
Basic Number Screening Test +0.21* +0.21
Galaxy Math
Fuchs et al. (2013) Student randomized 16 weeks 591 students (385E, 206C) 1
Students at risk in a Southeast school district 69% AA, 7% H, 83% FRL
Number Knowledge Word Problems
+0.26* +0.23* +0.24
Math Recovery Intervention
Smith et al. (2013) Quasi-experiment
1 year (2 cohorts) 775 students (343E, 684C) 1
Low achieving students from 5 urban, suburban, and rural districts 48% minority, 15% ELL, 65% FRL
WJ-III Math Fluency Applied Problems Quant Concepts Math Reasoning
+0.15* +0.28* +0.24* +0.30* +0.24
Numbers Count
Torgerson et al. (2013) Student randomized 12 weeks 418 students (144E, 274C)
6-7 years old
Low performing students in 44 schools across England, 48% FRL
Progress in Math (PIM 6) +0.33 +0.33
Pirate Math
Fuchs et al. (2010) Student randomized 16 weeks 150 students (100E, 50C) 3
2 urban school districts in Nashville an Houston 35% SPED, 19% ELL, 56% AA, 29% H KeyMath +0.37* +0.37
Small Group Tutoring FocusMATH
Styers & Baird-Wilkerson (2011)
Student randomized 1 year 341 students (166E, 175C) 3, 5
Low achieving students from 7 districts in the Southwest, Southeast, Midwest, Northeast 23% AA, 33% H, 24% LEP, 12% SPED, 71% FRL KeyMath 3 +0.24* +0.24
Fraction Face-Off!
Fuchs et al. (2016a) Student randomized 12 weeks 213 students (143E, 70C) 4 Students at risk from 14 schools NAEP +0.39* +0.39
Fuchs et al. (2016b) Student randomized 12 weeks 212 students (142E, 70C) 4
Students at risk 49% AA, 27% H, 18% ELL, 90% FRL NAEP +0.64* +0.64

11
Fusion Math
Clarke et al. (2014) Student randomized 19 weeks 78 students (38E, 40C) 1
Students at risk from 2 districts in the Pacific Northwest 20% H, 18% ELL, 70%FRL SAT +0.11 +0.11
Number Rockets
Gersten et al. (2015) Cluster randomized 6 months
76 schools (38E, 38C) 994 students (615E, 379C) 1
4 districts across 4 southwestern states 44% AA, 46% H, 34% FRL TEMA-3 +0.34* +0.34
ROOTS
Doabler et al. (2016) Student randomized 5 months 292 students (208E, 82C) K
9 schools from metropolitan area of Boston Students at risk 50% H, 26% ELL
TEMA-3 NSB SESAT
+0.31* +0.40* +0.24 +0.32
Cross-Age Tutoring Durham Shared Maths Project
Lloyd et al. (2015) Cluster randomized
16 weeks + 16 weeks
79 schools (39E, 40C) Year 3 (tutees) 2786 students (1426E, 1360C) Year 5 (tutors) 2683 students (1380E, 1303C)
Year 3, 5 (grade 2, 4)
UK 22% FRL, 86% W
Interactive Computerised Assessment System Year 3 Year 5
+0.01 +0.02 +0.02
CMT: Connecticut Mastery Test, CST: California Standards Test, CRCT: Criterion - Referenced Competency Test, CRT: Calculus Readiness Test, CSAP: Colorado Student Assessment Program, ECLS-K: Early Childhood Longitudinal Program, FCAT: Florida Comprehensive Assessment Test, GMADE: Group Mathematics Assessment and Diagnostic Evaluation, HCPS: Harford County Public Schools, ISAT: Stanford Achievement Test, ISTEP: Indiana Statewide Testing for Educational Progress, ITBS: Iowa Test of Basic Skills, MAP: Measure of Academic Progress, MAT; Metropolitan Achievement Test, MEAP: Michigan Educational Assessment Program, NAEP: National Assessment of Educational Progress, NJ ASK: New Jersey Assessment of Skills and Knowledge, NWEA: Northwest Evaluation Association, SAT 10: Stanford Achievement Test 10, SESAT: Stanford Early School Achievement Test, SOL: Virginia Standards of Learning, TAKS: Texas Assessment of Knowledge and Skills, TEMA-3: Test of Early Mathematics Ability - Third Edition, WJ III: Woodcock-Johnson III. AA: African-American, H: Hispanic, W: White, FRL: Free/Reduced Lunch, SPED: Special Education, ELL: English language learner,
12
Table 2. Professional Development Programs
Study Design Duration N Grades Sample characteristics Posttest
Effect sizes by group/ measure
Overall effect size
AMSTI
Newman et al. (2012)
Cluster randomized 1 year
40 schools (20E, 20C) 9370 students (5111E, 4259C) 4-5
40 districts in Alabama 49% minority, 64%FRL SAT 10 +0.05 +0.05
Intel Math
Garet et al. (2016) Cluster randomized 1 year
165 teachers (79E, 86C) 3677 students (1760E, 1917C) 4
six urban, suburban, rural districts, five states 73 schools 46% W, 14% AA, 30% H, 58% FRL, 12% ELL, 14% SPED
State assessment NWEA
-0.06* -0.05 -0.06
Math Pathways & Pittfalls
Heller et al. (2010) Cluster randomized 1 year
121 classes (65E, 55C) 4th grade 1269 students (641E, 628C) 5th grade 891 students (563E, 328C) 4, 5
At-risk students in 25 metropolitan schools across Arizona, California, Illinois 55% ELL, 76% FL, 8% AA. 69% H, 9% W, 4%A
State test Total Math 4th grade 5th grade
+0.04 +0.08 +0.06
Mathematics Mastery
Vignoles et al. (2015)
Cluster randomized 1 year
2 cohorts 83 schools (42E, 41C) 4176 students (2160E, 2016C)
Year 1 (K) England
Number Knowledge Test +0.10 +0.10
PBS TeacherLine
Dominguez et al. (2006)
Cluster randomized 1 year
87 teachers (44E, 43C) 1119 students (523E, 596C) 3-5 FL, SC, NY
Algebra test Geometry test
-0.02 +0.07 +0.03
Team Assisted Individualization (TAI)
Karper & Melnick (1993)
Cluster quasi-experiment 1 year
8 classes (4E, 4C) Grade 4 88 students (38E, 38C) Grade 5 90 students (46E, 43C) 4-5 District in Hershey, Pennsylvania
District Stand. Test Grade 4 Grade 5
-0.05 -0.12 -0.09
Stevens & Slavin (1995)
Cluster quasi-experiment 2 years
5 schools (2E, 3C) 873 students (411E, 462C) 2-6
Schools in suburban Maryland district 7% minority, 10% FRL, 9% SPED
CAT Computation Application
+0.29 +0.10 +0.20

13
Professional Development Focused on Formative Assessment CASL
Randel et al. (2016) Cluster randomized 1-2 years
67 schools (33E, 34C) 9596 students (4420E, 5176C) 4, 5
Public schools in Colorado 56% W, 27% H, 47% FRL CSAP +0.01 +0.01
Using Data
Cavalluzzo et al. (2014)
Cluster randomized 2 years
59 schools (30E, 29C) 10877 students (5384E, 4903C) 4, 5
Large urban district in Jacksonville, Florida 47% AA, 9% H, 66% FRL, 10% SPED FCAT +0.01 +0.01

14
Table 3. Whole-School Reform
Study Design Duration N Grades Sample characteristics Posttest
Effect sizes by group/ measure
Overall effect size
McREL Balanced Leadership
Jacob et al. (2015) Cluster randomized 3 years
119 schools (60E, 59C) 3-5
Michigan’s rural schools 47% FRL, 90% W MEAP +0.03 +0.03
Success in Sight
Wilkerson, Shannon, Styers, & Grant (2012)
Cluster randomized 2 years
52 schools (26E, 26C) 8213 students (4413E, 3800C) 3-5
8 rural, urban and suburban districts in Minnesota, Missouri 40% W, 33% AA, 10% H, 16% A, 70% FRL State tests -0.06 -0.06

15
Table 4. Programs Incorporating Technology
Study Design Duration N Grades Sample characteristics Posttest
Effect sizes by group/ measure
Overall effect size
Accelerated Math
Lehmann & Seeber (2005)
Cluster quasi-experiment 4 months
47 classes (22E, 25C) 1243 students (577E, 666C) 4th grade (92E, 105C) 5th grade (239E, 241C) 6th grade (246E, 320C) 4-6
14 schools in North Rhine-Westphalia, Germany approx. 18% immigrants
Humburger Schulleistungstest Grade 4 Grade 5 Grade 6
-0.03 +0.16 -0.003 +0.06
Ysseldyke & Bolt (2007)
Cluster randomized 1 year
36 classes (18E, 18C) 723 students (368E, 355C) 2-5
7 districts in AL, FL, SC, TX, MS, MI, NC 44%AA, 45%H TerraNova 0.00 0.00
Lambert, Algozzine & Mc Gee (2014) Randomized 1 year
36 classes (18E, 18C) 504 students (256E, 248C) 2-5
3 schools in Midwestern US 40% minority, 76% FRL, 18% SPED TerraNova +0.15 +0.15
DreamBox Learning
Wang & Woodworth (2011a)
Student randomized 4 months 557 students (446E, 111C) K, 1
San Francisco Bay Area 87% H, 81% ELL, 88% FRL
NWEA Math overall Problem solving Number sense Computation Geometry Statistics
+0.14* +0.06 +0.08 +0.13 +0.16* +0.12 +0.11
EPGY Stanford Math Program
Suppes et al. (2013) Student randomized 1 year
1484 students (742E, 742C) 2-5
8 Title I schools in California 55%AA, 31% H CST -0.01 -0.01
Odyssey Math
Wijekumar et al. (2009)
Cluster randomized 1 year
122 teachers (60E, 62C) 2,456 students (1,223E, 1,233C) 4
32 schools in Delaware, New Jersey, and Pennsylvania 18% FL, 25% minority, 7% ELL TerraNova +0.02 +0.02
Reasoning Mind
Wang & Woodworth (2011b)
Student randomized 4 months 651 students (521E, 130C) 2-5
San Francisco Bay Area 87% H, 81% ELL, 88% FRL
NWEA Math Overall Number Sense Algebra and Function Measurement and Geometry Statistics and Probability Math Reasoning
-0.02 -0.05 +0.02 -0.08 +0.11 -0.02 -0.02
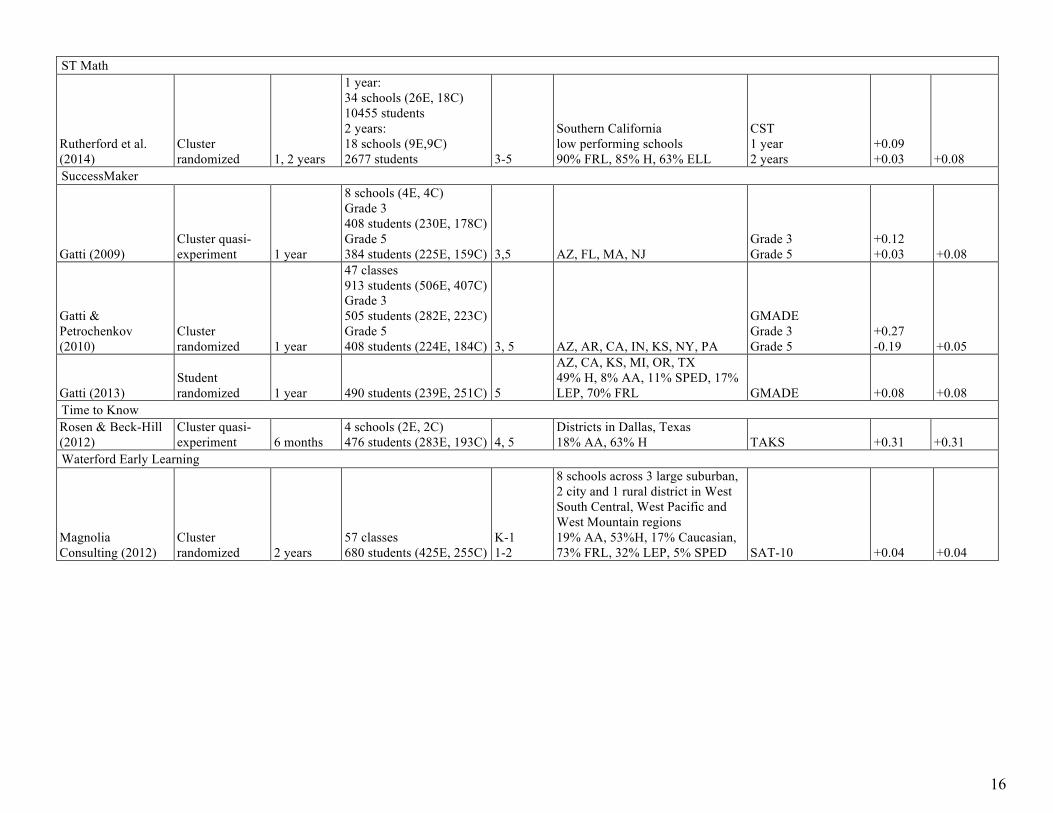
16
ST Math
Rutherford et al. (2014)
Cluster randomized 1, 2 years
1 year: 34 schools (26E, 18C) 10455 students 2 years: 18 schools (9E,9C) 2677 students 3-5
Southern California low performing schools 90% FRL, 85% H, 63% ELL
CST 1 year 2 years
+0.09 +0.03 +0.08
SuccessMaker
Gatti (2009) Cluster quasi-experiment 1 year
8 schools (4E, 4C) Grade 3 408 students (230E, 178C) Grade 5 384 students (225E, 159C) 3,5 AZ, FL, MA, NJ
Grade 3 Grade 5
+0.12 +0.03 +0.08
Gatti & Petrochenkov (2010)
Cluster randomized 1 year
47 classes 913 students (506E, 407C) Grade 3 505 students (282E, 223C) Grade 5 408 students (224E, 184C) 3, 5 AZ, AR, CA, IN, KS, NY, PA
GMADE Grade 3 Grade 5
+0.27 -0.19 +0.05
Gatti (2013) Student randomized 1 year 490 students (239E, 251C) 5
AZ, CA, KS, MI, OR, TX 49% H, 8% AA, 11% SPED, 17% LEP, 70% FRL GMADE +0.08 +0.08
Time to Know Rosen & Beck-Hill (2012)
Cluster quasi-experiment 6 months
4 schools (2E, 2C) 476 students (283E, 193C) 4, 5
Districts in Dallas, Texas 18% AA, 63% H TAKS +0.31 +0.31
Waterford Early Learning
Magnolia Consulting (2012)
Cluster randomized 2 years
57 classes 680 students (425E, 255C)
K-1 1-2
8 schools across 3 large suburban, 2 city and 1 rural district in West South Central, West Pacific and West Mountain regions 19% AA, 53%H, 17% Caucasian, 73% FRL, 32% LEP, 5% SPED SAT-10 +0.04 +0.04

17
Table 5. Mathematics Curricula
Study Design Duration N Grades Sample characteristics Posttest
Effect sizes by group/ measure
Overall effect size
Early Learning in Mathematics
Clarke et al. (2015) Cluster randomized 1 year
129 classes (68E, 61C) 2116 students (1134E, 982C) K
46 urban, suburban, charter schools in Oregon and Texas 56% FRL, 38% ELL, 36% H, 8% SPED TEMA-3 +0.11 +0.11
enVisionMATH/Scott Foresman-Addison Wesley Elementary Math
Resendez, Azin & Strobel (2009)
Cluster randomized 2 years
50 classes (26E, 24C) 659 students (349, 310C)
2-3 4-5
6 schools in MT, OH, MH, MA, KY, TN, 95%W, 19% FRL
MAT Concepts and Problem solving Math Computation GMADE BAM
-0.13 +0.06 -0.06 -0.05 -0.06
Resendez & Manley (2005); Resendez & Sridharan (2005)
Cluster randomized 1 year
35 teachers (18E, 17C) 645 students (352E, 293C) 2, 4
6 schools in Washington, Wyoming, Virginia, Kentucky 20% AA, 9% H, 10%ELL, 46% FRL
TerraNova CTBS Math Total Computation Total
+0.10 -0.21 -0.04
Resendez & Azin (2006); Resendez & Sridharan (2006)
Cluster Randomized 1 year
39 classes (20E, 19C) 863 students (445E, 418C) 3, 5
4 schools in Ohio and New Jersey 9%AA, 18%FRL
TerraNova CTBS Math Total Computation Total
-0.03 +0.16 +0.07
Everyday Mathematics Vaden-Kiernan et al. (2015)
Cluster randomized 2 years
48 schools (24E, 24C) 4520 students K-4 51% AA, 73% FRL GMADE -0.02 -0.02
Go Math!
Eddy et al. (2014) Cluster randomized 1 year
79 teachers (45E, 34C) 1363 students (754E, 609C) 1-3
9 schools in Arizona, Idaho, Illinois, Michigan, Ohio, Pennsylvania, Utah 36% AA, 35% H, 31% ELL, 35% FRL ITBS +0.01 +0.01
JUMP Math Solomon et al. (2011)
Cluster randomized 5 months
29 teachers (18E, 11C) 265 students (163E, 102C) 5 Rural Canadian schools WJ-III +0.23* +0.23
Investigations in Number, Data, and Space
Agodini et al. (2010)
Cluster randomized 1 year
1st grade 57 schools (28E, 29C) 2396 students (1127E, 1269C) 2nd grade 36 schools (18E, 18C) 1,2
Disadvantaged schools in 12 districts across Connecticut, Florida, Kentucky, Minnesota, Mississipi, Missouri, New York, Nevada, South Carolina, Texas 23% AA, 32%H. 13% ELL
ECLS-K grade 1 grade 2
0.00 +0.09 +0.04

18
1623 students (814E, 809C)
Math Connects
Jordan (2009) Cluster quasi-experiment 1 year
139 teachers (68E, 71C) 2nd grade 908 students (374E, 534C) 4th grade 989 students (470E, 519C) 2, 4
A mix of urban and suburban schools across 11 states. 61% W, 14% AA, 16% H
TerraNova 2nd grade 4th grade
+0.08 -0.04 +0.02
Math Expressions
Agodini et al. (2010)
Cluster randomized 1 year
1st grade: 55 schools (26E, 29C) 2481 students 2nd grade: 35 schools (17E, 18C) 1633 students 1, 2
Disadvantaged schools in 12 districts across Connecticut, Florida, Kentucky, Minnesota, Mississipi, Missouri, New York, Nevada, South Carolina, Texas 26% AA, 30% H, 10% ELL
ECLS-K grade 1 grade 2
+0.11* +0.12* +0.11
Math in Focus Educational Research Institute of America (2010)
Quasi-experiment 1 year 678 students (125E, 553C) 4
Suburban district in New Jersey 15% FRL, 30% minority, 12% SPED NJ ASK +0.25* +0.25
Educational Research Institute of America (2013)
Cluster Quasi-experiment 1 year
3rd grade: 33 classes (19E, 14C) 679 students 2nd grade: 28 classes (18E, 10C) 544 students 2, 3
Urban schools 59% minority, 58% FRL, 9% ELL
ITBS grade 2 grade 3
+0.29* +0.29* +0.29
Jaciw et al. (2016) Cluster randomized 1 year
18 teams (9E, 9C) 1641 students (784E, 857C) 3-5
Clark County Nevada 47% H, 10% AA, 56% FRL, 11% SPED
SAT-10 Problem solving Procedures Nevada CRT
+0.12* +0.14* +0.05 +0.10
Saxon Math
Agodini et al. (2010)
Cluster randomized 1 year
1st grade 55 schools (26E, 29C) 2377 students 2nd grade 36 schools (18E, 18C) 1706 students 1,2
Disadvantaged schools in 12 districts across Connecticut, Florida, Kentucky, Minnesota, Mississipi, Missouri, New York, Nevada, South Carolina, Texas 21% AA, 40% H, 12%ELL
ECLS-K grade 1 grade 2
+0.07 +0.17 +0.11

19
Table 6. Benchmark Assessments
Study Design Duration N Grades Sample characteristics Posttest
Effect sizes by group/ measure
Overall effect size
Achievement Network ANet
West, Morton & Herlihy (2016)
Cluster randomized 2 years
89 schools (45E, 44C) 13233 students 3-5
5 districts: Boston, Chelsea, Springfield (MA), Jefferson Parish (LA), Chicago (IL) 87% AA, 15%ELL, 87% FRL State tests -0.09* -0.09
Acuity
Konstantopoulos et al. (2016)
Cluster randomized 1 year
55 schools (28E, 27C) 24868 students 3-8
Schools in Indiana 53% W, 27% AA, 12% H, 57% FRL 19% SPED ISTEP+ +0.04 +0.04
Konstantopoulos, Miller, & van der Ploeg (2013)
Cluster randomized 1 year
57 schools (31E, 18C) 11632 students 3-6
Rural, urban, and suburban schools in Indiana ISTEP+ +0.19* +0.19
mClass Konstantopoulos et al. (2016)
Cluster randomized 1 year
55 schools (28E, 27C) 6249 students K-2
Schools in Indiana 27%AA, 12% H, 57% FRL, 19% SPED TerraNova -0.22* -0.22

20
Table 7. Social-Emotional Interventions
Study Design Duration N Grades Sample characteristics Posttest
Effect sizes by group/ measure
Overall effect size
INSIGHTS O’Connor et al. (2014)
Cluster randomized 1, 2 years
22 schools (11E, 11C) 435 students (225E, 210C) K-1
Low-income urban schools 75% AA, 16%H, 90% FRL
WJ-III Applied Problems +0.04 +0.04
PAX Good Behavior Game Weis, Osborne & Dean (2015)
Cluster quasi-experiment 1 year
49 classes (27E, 22C) 703 students (402E, 301C) 1, 2
6 rural and urban districts in Ohio 82% W MAP +0.32* +0.32
Positive Action
Snyder et al. (2010) Cluster randomized 4 years 20 schools (10E, 10C) 5, 6
Schools in Hawai'i 5% AA, 14% Filipino, 15% W, 57% FRL, 14% ELL, 10% SPED HCPS II +0.27* +0.27
Bavarian et al. (2013)
Cluster randomized 6 years
14 schools (7E, 7C) 1140 students (570E, 570C) 3-8 Low income urban schools ISAT +0.17 +0.17
Responsive Classroom
Rimm-Kaufman et al. (2014)
Cluster randomized 3 years
24 schools (13E, 11C) 2904 students (1049E, 993C) 3-5
Schools from large, ethnically diverse district in mid-atlantic state 41% W, 11% AA, 19% A, 24% H, 28% ELL SOL -0.13 -0.13
Rimm-Kaufman et al. (2007)
Cluster quasi-experiment 1-3 years
6 schools (3E,3C) 1401 (769E, 632C) 2-4
Public schools in an urban district in the Northeast 52% W, 22% AA, 21% H, 35% FRL
CMT-Math Year 1 Year 2 Year 3
+0.39 +0.16 +0.06 +0.21

21
Table 8. Mean Weighted Effect Sizes of Program Categories
Category Table Mean ES N. studies Tutoring Programs 1 +0.14 12 One-to-one Tutoring 1 +0.26 5 Small Group Tutoring 1 +0.34 6 Cross-Age Tutoring 1 +0.02 1 Professional Development Programs 2 +0.03 9 Focused on Formative Assessment 2 +0.01 2 Whole-School Reform 3 +0.01 2 Programs Incorporating Technology 4 +0.07 13 Mathematics Curricula 5 +0.07 14 Benchmark Assessments 6 +0.01 4 Social-Emotional Interventions 7 +0.20 6

22
Table 9. Programs Meeting ESSA Evidence Standards for Strong and Moderate Ratings.
Number of Studies
Average Effect Sizes
ESSA Rating
One-to-one Tutoring Catch Up® Numeracy 1 +0.21 Strong Galaxy Math 1 +0.24 Strong Pirate Math 1 +0.37 Strong Math Recovery Intervention 1 +0.24 Moderate Small Group Tutoring FocusMATH 1 +0.24 Strong Fraction Face-Off! 2 +0.51 Strong Number Rockets 1 +0.34 Strong ROOTS 1 +0.32 Strong Programs Incorporating Technology DreamBox Learning 1 +0.11 Strong Mathematics Curricula JUMP Math 1 +0.23 Strong Math Expressions 1 +0.11 Strong Math in Focus 3 +0.19 Strong Benchmark Assessments Acuity 2 +0.09 Strong Social-Emotional Interventions Positive Action 2 +0.23 Strong PAX Good Behavior Game 1 +0.32 Moderate