Embed Size (px)
Citation preview

Title Domestic energy prepayment and fuel poverty: Induced self-selection influencing the welfare of fuel-poor households
Sotirios Thanos, Maria Kamargianni, Ian HamiltonUCL Energy Institute, The Bartlett, London

Conte
xt Thanos and Dunse (2012) found £91/year more for prepayment

Objectives• Investigate the factors affecting Payment-Method selection
– Initial results only for domestic heating in this presentation
• Specify latent class discrete choice model (LCM) that identifies unobservable subgroups within the data – Allowing better understanding:
• the impact of Payment-Method to patterns of multiple risks, fuel poverty being one of those
• the antecedents and consequences of complex behaviours– Estimate price, quantity, socioeconomic, and housing characteristic
effects on Payment-Method selection
• Provide policy recommendations tailored to target the subgroups that are affected most
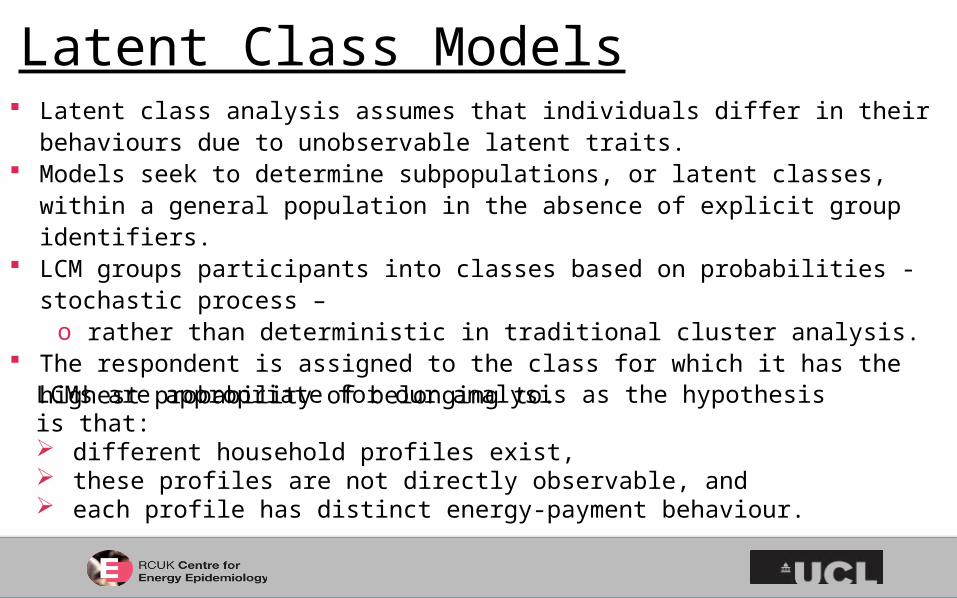
Latent Class Models Latent class analysis assumes that individuals differ in their behaviours due to
unobservable latent traits. Models seek to determine subpopulations, or latent classes, within a general
population in the absence of explicit group identifiers. LCM groups participants into classes based on probabilities - stochastic process –
o rather than deterministic in traditional cluster analysis. The respondent is assigned to the class for which it has the highest probability of
belonging to.
LCMs are appropriate for our analysis as the hypothesis is that: different household profiles exist, these profiles are not directly observable, and each profile has distinct energy-payment behaviour.

Model Specification
Observable Variables Unobservable Variables
Latent Class - Multinomial Logistic Regression
i = individualh = subset yih = choice set m = particular category of yih x, zi = explanatory variables
Explanatory Variables
Household Profile
Choice of Energy Payment Method
Utility for Energy-Payment method
= probability of giving response m given x and zi
= term giving the multinomial logistic regression

Data Sources 2011 Energy Follow-Up Survey
(EFUS), a cross-sectional sub-sample survey of households in the English Housing Survey (EHS) 2010-2011
Carried out by the Building Research Establishment on behalf of the UK Dept. of Energy and Climate Change
The respondent is assigned to the class for which it has the highest probability of belonging to.
Questionnaire A self-completion survey about
dwelling and heating practices. Gas and electricity meter readings
obtained in a subsample of homes All households in the survey had also
participated in the English Housing Survey (EHS) which collects detailed information about the English building stock.
Sample size => EHS 2011=2616 households EHS – EFUS – Missing data = 1336 households

Model ComponentsExplanatory Variables
Household size (cont.)
Annual household income (£ | cont.)
Aver. age of partners (cont.)
Length of residence (years | cont.)
Tenure (Dummy: Rental, RSL, Local Authority)
Price implied (cont.)
KWH heating from main fuel (cont.)
House Type (Dummy: Flat, Terrace, Detached)
Energy supplier change in the last semester (Dummy)
London (Dummy)
Covariates (Basis for Classes)
Rural vs. Non-rural areas
Fuel poor* vs. Non-fuel poor
Choice Set Percent
1: Direct Debit 61.552: Standard Credit 19.763: Prepayment Meter 12.134: Other (Communal heating, Oil) 6.59
*Fuel poor if household spends more than 10% of income on fuel
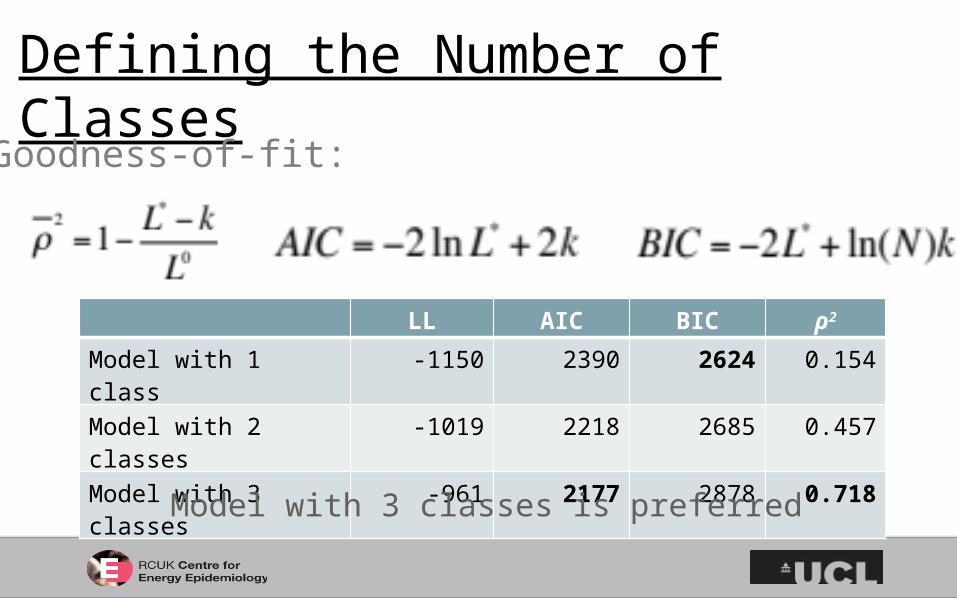
Defining the Number of Classes
Goodness-of-fit:
LL AIC BIC ρ2
Model with 1 class -1150 2390 2624 0.154
Model with 2 classes -1019 2218 2685 0.457
Model with 3 classes -961 2177 2878 0.718
Model with 3 classes is preferred
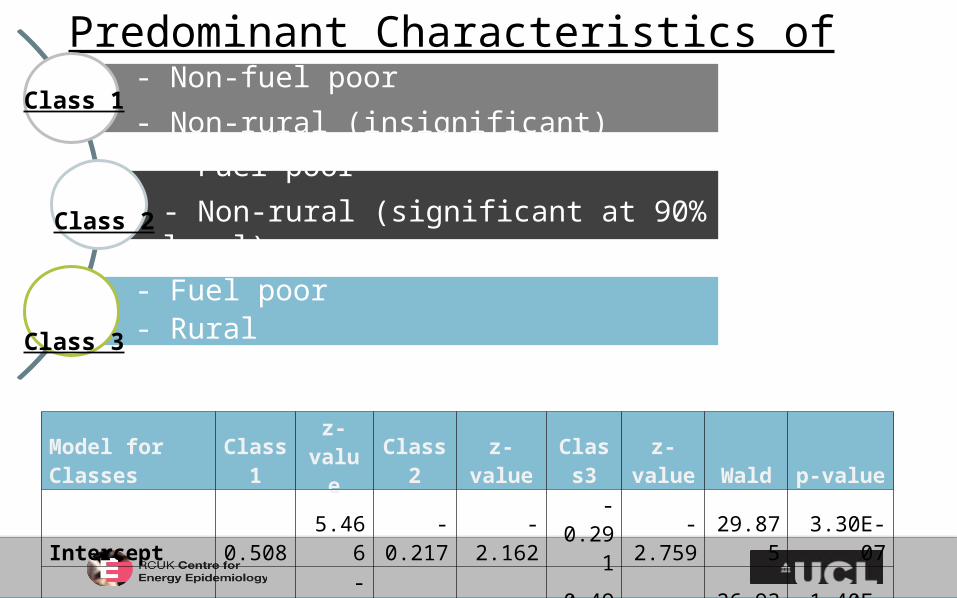
Predominant Characteristics of Classes- Non-fuel poor
- Non-rural (insignificant)
- Fuel poor
- Non-rural (significant at 90% level)
- Fuel poor- Rural
Class 1
Class 2
Class 3
Model for Classes Class1 z-value Class2 z-value Class3 z-value Wald p-valueIntercept 0.508 5.466 -0.217 -2.162 -0.291 -2.759 29.875 3.30E-07Fuel poverty -1.386 -4.853 0.890 4.743 0.496 2.462 26.939 1.40E-06Rural -0.610 -1.377 -0.794 -1.702 1.404 6.117 37.624 6.80E-09

Classes and Choices

Result Highlights
Predictors Choice
Class1: Non-fuel
poor/urban z-valueClass2: Fuel poor/urban z-value
Class3: Fuel poor/Rural z-value
HouseholdSize
1: DD -5.2216 -3.1828 0.6681 0.9112 0.0881 0.42542: SC -4.89 -2.975 0.9053 0.9871 -0.411 -1.3383
3: Pre 9.3881 2.3426 2.9446 3.0672 0.2924 1.52454:Other 0.7235 0.2249 -4.518 -2.1614 0.0306 0.1549
Income
1: DD 0.0004 2.9181 0.0007 3.4672 0.0001 3.93172: SC 0.0004 2.9808 -0.0009 -2.7261 -0.0001 -2.641
3: Pre -0.0006 -1.9395 -0.0008 -2.9169 -0.00001 -0.23664:Other -0.0002 -0.7514 0.0009 3.7141 0.00001 1.2579
ImpliedPrice
1: DD 96.7326 2.4604 31.5089 2.3235 -62.774 -5.2242: SC 97.1593 2.4717 -60.1519 -2.2048 14.6724 3.2172
3: Pre -287.87 -2.5573 26.7952 2.3804 11.9838 2.59954:Other 93.9785 1.8136 1.8478 0.1046 36.1178 6.1808
RentedHouse
1: DD 9.2487 1.7936 0.9526 0.4076 -1.9584 -2.35842: SC 10.744 2.0871 -22.8153 -2.9582 0.0384 0.0587
3: Pre -22.2451 -1.491 17.2051 3.1453 2.0948 3.56694:Other 2.2523 0.3486 4.6576 1.1253 -0.1748 -0.3006

Additional Findings KWh
Counterintuitively, high fuel consumption increases prepayment in urban areas Age
Urban fuel-poor of lower age tend to prepay, in contrast to rural fuel-poor of higher age who tend to prepay
House type Flats and terrace houses tend to prepayment more than semis and detached
Energy Supplier change Recent supplier change has no significant effect for fuel “rich” Recent supplier change has significant effects for the fuel poor, which are negative only
for standard credit payment Length of Residence
No significant effect for fuel “rich”, it reduces prepayment in rural areas and increases DD in urban.
London Increased prepayments for urban fuel “rich” and reduced prepayment for urban fuel
poor
ConclusionsPrepayment in its current form distorts market conditions
Non-fuel poor move away from prepayment as price increases Fuel poor become increasingly trapped in prepayment when price increases Higher fuel consumption increases prepayment
o Rather than prepayment helping manage it as “Energy UK” suggest
Households that tend to be fuel poor suffer the bulk of this distortion This is also exacerbated by household size, at certain house types, age, private and
social rental tenures.
Policy Implications: Forcing higher fuel prices to the fuel poor creates a vicious circle for households that
struggle to sufficiently heat their home High fuel consumption increases prepayment, hence energy-efficiency/insulation may
also contribute to taking people out of the fuel poverty trap Smart meters and competitive price structuring available to all, should nullify this
distortion and price-discrimination
Further Research
Finalize current specification
Look at more spatial, building and behavioral characteristics
Extend the analysis to all domestic energy consumption
Enable welfare change estimation for range of policy initiatives to different
household profiles
Attempt to incorporate external temperatures
Estimate an unbiased energy demand model
There is obvious self-selection with regard to payment methods
Estimate a two step model that employs the logistic regression results