Embed Size (px)
Citation preview
1
Title:
Determining major factors controlling phosphorus removal by promising
adsorbents used for lake restoration: a linear mixed model approach
Authors: A. Funesa,b*
, F. J. Martíneza, I. Álvarez-Manzaneda
a,b, J.M. Conde-Porcuna
a,b,
J. de Vicente c, F. Guerrero
d,e and I. de Vicente
a,b
Affiliations:
(a) Departamento de Ecología, Facultad de Ciencias, Universidad de Granada, 18071,
Granada (Spain)
(b) Instituto del Agua, Universidad de Granada, 18071, Granada (Spain)
(c) Departamento de Física Aplicada, Facultad de Ciencias, Universidad de Granada,
18071, Granada (Spain)
(d) Departamento de Biología Animal, Biología Vegetal y Ecología, Universidad de
Jaén, 23071 Jaén (Spain)
(e) Centro de Estudios Avanzados en Ciencias de la Tierra, Universidad de Jaén, 23071
Jaén (Spain)
Full address for correspondence:
*Corresponding author:
Departamento de Ecología, Facultad de Ciencias, Universidad de Granada, 18071,
Granada (Spain)
Phone: (+34) 958 248323; Fax: (+34) 958 243093; email: [email protected]

2
Abstract
Phosphorus (P) removal from lake/drainage waters by novel adsorbents may be affected
by competitive substances naturally present in the aqueous media. Up to date, the effect
of interfering substances has been studied basically on simple matrices (single-factor
effects) or by applying unsuitable statistical approaches when using natural lake water.
In this study, we determined major factors controlling P removal efficiency in 20
aquatic ecosystems in the southeast Spain by using linear mixed models. Two non-
magnetic -CFH-12®
and Phoslock®- and two magnetic materials -hydrous lanthanum
oxide loaded silica-coated magnetite (Fe-Si-La) and commercial zero-valent iron
particles (FeHQ)- were tested to remove P at two adsorbent dosages. Results showed
that the type of adsorbent, the adsorbent dosage and color of water (indicative of humic
substances) are major factors controlling P removal efficiency. Differences in physico-
chemical properties (i.e. surface charge or specific surface), composition and structure
explain differences in maximum P adsorption capacity and performance of the
adsorbents when competitive ions are present. The highest P removal efficiency,
independently on whether the adsorbent dosage was low or high, were 85-100% for
Phoslock and CFH-12®, 70-100% for Fe-Si-La and 0-15% for FeHQ. The low dosage of
FeHQ, compared to previous studies, explained its low P removal efficiency. Although
non-magnetic materials were the most efficient, magnetic adsorbents (especially Fe-Si-
La) could be proposed for P removal as they can be recovered along with P and be
reused, potentially making them more profitable in a long-term period.
Keywords: phosphorus, magnetic particles, Phoslock®, CFH-12
®, linear mixed model,
lake restoration.
3
Introduction
Sewage, industrial discharge and agricultural runoff are the main sources of phosphorus
(P) inputs into freshwater bodies, being the main cause of eutrophication (Burkholder,
2000; Carpenter, 2005). At global scale, the accumulation of P in terrestrial and
freshwater aquatic ecosystems is 75% greater than pre-industrial levels (Bennett et al.,
2001). In-lake addition of adsorbents, with the main objective of reducing lake water P
concentration, is a recommendable lake management tool when the external P load has
been previously reduced or the diffuse P sources are dominant (Deppe and Benndorf,
2002; Cooke et al., 2005). A wide variety of P adsorbents with different physico-
chemical characteristics are commercially available. Aluminum (Al), iron (Fe) and
calcium (Ca) salts (Hupfer and Hilt, 2008), modified zeolites (Phoslock®, Bephos
® and
Aqual-P®) or Fe oxy-hydroxides (CFH-12
®) are some examples of non-magnetic
materials proposed for P adsorption in natural systems (Gibbs and Özkundakci, 2011;
Zamparas et al., 2013; Copetti et al., 2016). An important downside of non-magnetic
materials is that their effectiveness and longevity may depend on the physic-chemistry
and the stability of the water column, ageing and crystallization of flocs or bioturbation,
among others factors (Huser et al., 2016). Bare and coated magnetic nano/microparticles
such as magnetite (Fe3O4) or zero valent Fe (ZVI) have been recently proposed for P
removal from freshwater bodies (de Vicente et al., 2010a; Funes et al., 2017). The
recovery of the P-loaded adsorbents by applying a magnetic separation gradient is the
main novelty of using magnetic adsorbents. This implies a short contact time of the
adsorbent with biota, cost savings when reusing it and the possibility of recovering P for
further use as potential fertilizer, which is a challenge that deserves attention given the
future scarcity of rock P reserves (Cordell et al., 2009).

4
Apart from the physic-chemical characteristics of the adsorbent (e.g. particle size,
specific surface area, surface charge, surface functional groups and dosage),
environmental conditions (e.g. pH, ionic strength and competitive ions) play an
important role in the P removal efficiency (Li et al., 2016). Berkowitz et al. (2005)
reported a high affinity of reactive silicate (Si) for Al. The potential interference of Si
and humic acids in the adsorption of P by Al hydroxide (de Vicente et al., 2008) and Fe
oxy-hydroxides (goethite) (Sigg and Stumm, 1981; Antelo et al., 2007) has been
previously suggested. Humic substances also interfere with the P adsorption on
Phoslock® (Lürling et al., 2014; Dithmer et al., 2016) and present high affinity for the
adsorption on magnetite surface (Illés and Tombácz, 2004). Reitzel et al. (2013) found a
negative correlation between P adsorption capacity of Phoslock® and alkalinity. Apart
from Dissolved Organic Carbon (DOC) and Si, major cations (Mg2+
, Na+, K
+) and
anions (SO42-
, Cl-) are negatively related to P removal by ZVI magnetic microparticles
(grade HQ; hereafter FeHQ) (de Vicente et al., 2011). Funes et al. (2017) also reported a
reduction in DOC and Si concentration when applying the same magnetic particles
(FeHQ) to microcosms containing lake water and surface sediment from a hypertrophic
lake. The high affinity of heavy metals for bentonite, Fe3O4, Fe oxides and ZVI
magnetic particles is widely documented in the literature (Veli and Alyüz, 2007; Feng et
al., 2012; Hua et al., 2012; Funes et al., 2014).
The majority of laboratory P adsorption studies are focused on determining P removal
efficiency in different matrices (i.e. Auvray et al., 2006; de Vicente et al., 2010a).
Actually, the number of studies that assess the effect of interfering substances on the
removal process by carrying out, either single-ion experiments (Borggaard et al., 2005;
de Vicente et al., 2008; Merino-Martos et al., 2015), or adsorption experiments with
natural lake water (de Vicente et al., 2008; de Vicente et al., 2011; Reitzel et al., 2013)

5
is growing. Single-ion experiments aim at evaluating the individual effect of each
substances/ions on the performance of the adsorbents to remove P. Given the simplicity
of this approach (single factor), the simple linear regression has been previously applied
to study the relationship between an independent variable and P removal (de Vicente et
al., 2008, 2011). However, natural lake waters are complex matrices in which the P
removal efficiency is finally controlled by the interactions between coexisting
substances/ions, the adsorbate and the adsorbent. Up to now, the statistical approaches
applied in experiments with lake water are correlation analysis (Reitzel et al., 2013),
simple linear regression (de Vicente et al., 2011) and principal component analysis (de
Vicente et al., 2008). Unfortunately, correlation analysis and simple linear regression do
not allow to distinguish if each factor by itself is interfering on P removal or if it is a
consequence of the high correlation with other factors. Instead, the linear mixed models
(LMMs) approach would be more suitable in these complex systems although they have
not been previously used in similar studies.
Mediterranean ponds are ecosystems characterized by a high catchment area to volume
ratio (Álvarez-Cobelas et al., 2005). This circumstance causes that the effect of the
human activities generated in its drainage basin is of greater influence than in temperate
lakes. Therefore, this “diffuse pollution” is responsible for the high concentrations of
nutrients, heavy metals, DOC and other ions in these Mediterranean shallow ecosystems
(Smith, 2009). These high concentrations make that, in a context of lake restoration, it is
crucial to evaluate the main drivers controlling P adsorption in natural lake waters. In
this work, we hypothesize that the chemical composition of lake water would affect P
removal efficiency by different P adsorbents. To test this hypothesis, in this manuscript
we run laboratory experiments by using four different P adsorbents -two non-magnetic
(CFH-12® and Phoslock
®) and two magnetic [FeHQ and hydrous lanthanum (La) oxide
6
loaded silica-coated magnetite, hereafter, Fe-Si-La]- in water samples from 20
Mediterranean aquatic ecosystems at two adsorbent dosages. All these adsorbents have
been previously used to efficiently remove P in laboratory/microcosms experiments
(e.g. de Vicente et al., 2010a; Reitzel et al., 2013; Lyngsie et al., 2014; Lai et al., 2016;
Funes et al., 2017) and, specifically Phoslock®, at field scale (e.g. Robb et al., 2003;
Meis et al., 2012). Finally, our objective was to determine the major drivers (e.g. humic
substances, Si, major cations/anions) affecting P removal efficiency when using the
above mentioned adsorbents by using linear mixed models.
2. MATERIALS AND METHODS
2.1 Sampling and chemical analysis of lake water
In March 2017, water samples with different chemical composition (Table 1) were
collected from 20 inland aquatic ecosystems in southern Spain (see supplementary
information SI Fig. S1). Once in the laboratory, pH and conductivity were measured
with a pH meter (pH 196, WTW, Germany) and a conductivity meter (InoLab Con
Level 1, WTW, Germany), respectively. Water samples were filtered through glass
microfiber filters (GF/F, 0.7 µm) and the dissolved reactive P (Murphy and Riley,
1962), total dissolved Fe (Fe2+
and Fe3+
; Gibbs, 1979), Si (APHA, 1995) and color were
spectrophotometrically analysed (Biochrom Libra S50). Color was determined at 440
nm in 1-cm cuvettes. Water color was expressed as absorption coefficient in
units of inverse meters (m−1
) according to the following equation (Reche and Pace,
2002):
where is the measured absorbance at 440 nm and is the optical path length (in
m). Lake water used for measuring major cations [sodium (Na+), potassium (K
+),
7
magnesium (Mg2+
) and calcium (Ca2+
)], major anions [nitrates (NO3-), sulphates (SO4
2-)
and chlorides (Cl-)] and heavy metals [manganese (Mn
2+), arsenic (As
2-), copper (Cu
2+)
and nickel (Ni2+
)] was filtered through Millipore 0.22 µm filters. Major cations and
anions were measured by Ion Cromatography (IC; 940 Professional IC Vario, Metrohm)
and heavy metals were analysed by inductively coupled plasma-mass spectroscopy
(ICP-MS; Perkin Elmer NexION 300D). All physic-chemical parameters above
mentioned were measured in the water samples four times along the experiment (six
weeks): once at the beginning, twice during the experiment and the last one at the end of
the experiment. Salinity of the systems was estimated by using conductivity
measurements and the equation proposed by Alcorlo et al. (1996) for lakes located in
the Guadalquivir Depression in southern Spain [salinity (g L-1
) = 0.8211 conductivity
(mS cm-1
) = 0.18389]. Finally, DOC concentration was estimated from the relationship
between DOC (measured with a Shimadzu TOC analyzer) and color (expressed as
absorption coefficient, a440; r2 = 0.61; de Vicente et al., 2010b).
2.2 Synthesis of hydrous lanthanum oxide loaded silica-coated magnetite (Fe-Si-
La)
Fe-Si-La particles were synthesized following the procedure of Lai et al. (2016) with
slight modifications. Briefly, 10 g of commercial bare Fe3O4 (Sigma Aldrich; 50-100
nm) was dispersed in a mixture of ethanol (1.6 mL) and distilled water (400 mL). The
suspension was horizontally shaked for 10 min at 200 rpm. Afterwards, 100 mL of
ammonia (28%) and 3.26 mL of tetraethyloxysilane (TEOS, 98.6%) were added to the
suspension and left for shaking for 6 h at 200 rpm. The Si coated Fe3O4 was
magnetically separated and the supernatant was removed. Then, 500 mL of LaCl3 (0.02
M) was added to the Si coated Fe3O4 and the pH of the suspension was raised to 10 by

8
adding 3M NaOH. After magnetic separation for 5 min, the Fe-Si-La particles were
washed twice with distilled water, twice with absolute ethanol and the last time with
acetone. In each washing step, the particles were sonicated for 15 min. Then, particles
were air dried and stored at 4 ºC until used.
2.3 Characterization of the adsorbents
CFH-12®
(Kemira, Finland) is a dry, granular and amorphous ferric oxy-hydroxide with
a Fe content of ~ 44% w/w. As specified by the manufacturer (CSIRO, Australia),
Phoslock® is a dry and granular compound consisting of La-modified clay (~ 5 % ww
La). To obtain a homogenized fine powder (~250 nm), CFH-12® and Phoslock
® were
crushed in a mortar.
Fe-Si-La and commercial bare Fe3O4 particles were characterized with the following
techniques. Surface morphology and particle size were determined by focus ion beam
field-emission scanning electron microscopy (FIB-FESEM, AURIGA, Carl Zeiss SMT
Inc.). A SQUID magnetometer (Quantum Design MPMS XL) was used to determine
the magnetization curves of the powders at 293 K. Quantitative chemical composition
of the surface was determined by X-ray photoelectron spectroscopy (XPS; Kratos Axis
Ultra-DLD) with monochromatic Al Kα radiation. The wide spectrum (pass energy 160
eV) and spectra of the detected elements (pass energy 20 eV) were obtained using an
electrostatic lens. The La content in Fe-Si-La was analysed by inductively coupled
plasma-mass spectroscopy (ICP-MS; Perkin Elmer NexION 300D) following sample
digestion with HNO3 + HF.
FeHQ magnetic particles were supplied by BASF (Germany). According to the
manufacturer, the composition of this powder is 97.5% iron, 0.9% carbon, 0.5%
9
oxygen, and 0.9% nitrogen. These particles are spherical in shape with an average
diameter of 800 nm [see de Vicente et al. (2010a) for further characterization details].
2.4 Adsorption isotherms
The adsorption isotherms of the four adsorbents were conducted at room temperature
(25 ºC) using the batch technique. The stock magnetic suspensions (50 g L-1
) were
prepared by adding 2.5 grams of Fe-Si-La or FeHQ in a final volume of 50 mL. Prior to
their use, stock magnetic suspensions were sonicated for 5 min. A volume of 1 mL of
the stock magnetic suspensions was mixed with 40 mL of 3 mM NaHCO3 in a
polyethylene container and agitated for 24 h at 150 rpm. In the case of non-magnetic
adsorbents (CFH-12® and Phoslock
®), 0.05 g were added as dry material to
polyethylene containers along with 40 mL of 3mM NaHCO3 and agitated under the
same conditions. 1 mL of different P stock solutions ranging from 5 to 60 mM P was
added to the containers and the pH was adjusted to 7. Suspensions were agitated again
for 24 h at 150 rpm. After 24 h of agitation, pH was readjusted to 7 and suspensions
were made up to 50 mL to give final P concentrations ranging from 0.1 mM to 1.2 mM.
The final adsorbent concentration in the adsorption experiments was 1 g L-1
for all the
adsorbents. Adsorbents were then separated from the supernatant by centrifugation (10
min, 3000 rpm) or using a variable gap magnet (5 min; PASCO scientific; EM-8641).
Supernatant was filtered through glass microfiber filters (GF/F, 0.7 µm) and dissolved
reactive P was spectrophotometrically determined (Murphy and Riley, 1962). The
equilibrium adsorption capacity was calculated as follows:
[1]
being the P concentration in the control treatment, that is, the P concentration in
lake water 24 h after the addition of P and without adsorbent; the equilibrium P

10
concentration (mg L-1
); the mass of adsorbent (g) and the total volume of the
suspension (L). was different across the lakes. We used to calculate
instead of the starting P concentration (20 µM) to avoid including the interaction of P
with water chemistry in the calculation.
2.5 Adsorption experiments with lake water
The standard suspensions (25 g L-1
) of magnetic adsorbents (Fe-Si-La and FeHQ) were
prepared as follows: (i) 625 mg of magnetic adsorbent were mixed with distilled water
in a polypropylene container (25 mL); (ii) To ensure homogeneity of the sample, the
suspension was sonicated for 5 min prior to its use in the adsorption experiments. A
standard solution of 5 mM P was prepared by adding 136 mg of KH2PO4 to distilled
water (200 mL).
For the batch adsorption experiments, nine different treatments were applied in which
four adsorbents -CFH-12®, Phoslock
®, Fe-Si-La and FeHQ- were tested at two dosages
and one treatment, with no adsorbent addition, served as control. Each treatment was
performed with six replicates, measuring one replicate of each treatment per week (six
weeks in total). Depending on the P concentration measured in water samples, different
volumes of a standard solution (5 mM P) were added to obtain a fixed concentration of
20 µM P in all systems in a volume of 25 mL. The adsorbents were then added to 25
mL of lake water as follows: 3.3 and 7.8 mg of non magnetic adsorbents (CFH-12® and
Phoslock®) were weighed and added to the lake water in order to test a low and high
adsorbent:P ratio, respectively, for each adsorbent. The magnetic adsorbents (Fe-Si-La
and FeHQ) were added as suspensions by using a volume of 124 or 310 µL from the
standard magnetic suspension (25 g L-1
) to obtain the low and high adsorbent:P ratio,
respectively. Samples were then agitated for 20 h in a horizontal shaker (150 rpm).

11
After this time, the supernatant was separated from the adsorbents by centrifugation (3
min, 3000 rpm) or by using the variable gap magnet for 1 min (PASCO scientific; EM-
8641). Finally, the supernatant was filtered for dissolved reactive P analysis ). P
removal efficiency (Pr, %) was calculated as follows:
[2]
Likewise, adsorbed P (µmol) was calculated as ( - V [3], where the terms in both
equations are the same as in equation but here the units of and are µmol L-1
[1].
The adsorbent dosages (low and high) were established according to the adsorption
isotherms represented in Fig. 1. As seen in Fig. 1, P adsorption capacity of the four
adsorbents ranges between 1.6 and 2.6 mg P g-1
adsorbent (adsorbent:P ratio of 0.38 g
mg-1
) when testing them at P concentrations below 0.1 mM (which is a more similar
concentration to eutrophicated waters). Accordingly, a lower (0.2 g mg-1
) and a higher
(0.5 g mg-1
) adsorbent:P ratio were tested in order to study the effect of adsorbent
dosage on P removal efficiency.
2.6 Data analysis
The aim of the statistical analysis was to identify major factors affecting P removal
efficiency by different adsorbents. A LMM was performed considering the replicates
and the lakes (location) as random factors. In consequence, replicates and lakes are
considered a random sample of all possible replicates and all possible lakes,
respectively. The adsorbed P data were power-transformed (x2) prior to analysis to meet
the assumption of normality of residuals. The absence of outliers and multicollinearity
(vif function) were fulfilled. At the initial stage, the variables studied were selected
according to the following criteria: (1) potential interference of the variable in P
removal according to the literature (see introduction) and (2) high enough

12
value/concentration to cause interferences. The variables initially studied were: type of
adsorbent, adsorbent dosage, conductivity, major cations and anions, pH, color, Si,
heavy metals (Mn2+
, As2-
, Cu2+
and Ni2+
) and . Aiming at avoiding redundancy
between independent variables, Spearman's correlation test with the Holm´s correction
was firstly accomplished. As a result, major cations, major anions and Ni were not
included in the global model due to their high correlation with conductivity (Na+ r =
0.70; K+ r = 0.92; Mg
2+ r = 0.92; Ca
2+ r = 0.96; Cl
- r = 0.96; SO4
2- r = 0.82; Ni
2+ r =
0.73; p values for all correlations < 0.0001). A global model containing the factors (1)
type of adsorbent, (2) adsorbent dosage, (3) conductivity, (4) pH, (5) color, (6) Si, (7)
NO3-, (8) Mn
2+, (9) As
2- and (10) Cu
2+ and (11) (P in lake water after 24 h without
adsorbent) was finally analysed by using lme4 package (Bates et al., 2015). Model
selection was conducted using MuMIn package (Bartoń, 2012). The Akaike information
criterion (AICc) values allow to establish a ranking of candidate models. Models with a
∆AICc (differences in AICc values of the model and the model with the smallest AICc)
less than 2 were given similar support (Posada and Buckley, 2004). The best model was
the model with the minimum AICc value showing a difference higher than 2 AICc units
with other models (Burnham and Anderson, 1998; Posada and Buckley, 2004). A final
model including all variables retained in the selected models was performed. The
Tukey's post hoc test was done with multcomp package (Hothorn et al., 2013). The
significant interactions between factors were studied by testing the simple main effects
and performing contrasts across the levels of one factor when the values for other
factors are fixed at a certain level with phia package (de Rosario-Martínez, 2015). We
also tested the contribution of random effects using the likelihood ratio test (Bolker et
al. 2009). The model analyses were performed in R software (R Development Core
Team, 2017). Significant differences were considered when p < 0.05.
13
3. RESULTS AND DISCUSSION
3.1 Characterization of hydrous lanthanum oxide loaded silica-coated magnetite
(Fe-Si-La)
A SEM image of the Fe-Si-La particles is shown in Fig. 2. As observed, particles are
quasi-spherical in shape and polydisperse in size with a mean particle size of ~100 nm.
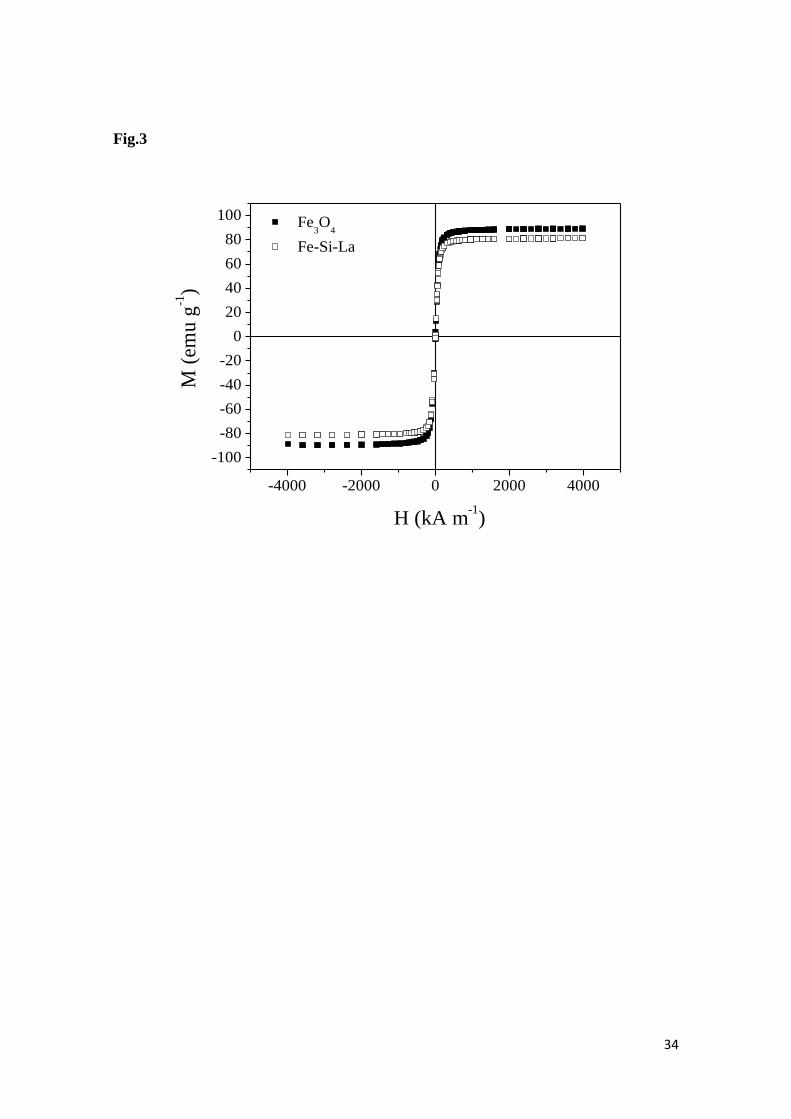
Fig. 3 shows the magnetic hysteresis curve of commercial bare Fe3O4 and Fe-Si-La
particles at 293 K. Both particles behave as soft magnetic materials with negligible
coercitive field and remnant magnetization, which means that magnetization becomes
zero when removing the field. The saturation magnetization (Ms) of Fe-Si-La (81 emu
g-1
) is slightly lower than bare Fe3O4 (89 emu g-1
) due to the presence of the non-
magnetic inorganic coating. Table 2 shows their surface chemical composition as
obtained by XPS. This analysis evidenced a significant presence of Si (13.0%) and La
(5.3%) at the surface of the Fe-Si-La particles. The lower bulk La content in Fe-Si-La
(0.9%) determined by ICP-MS demonstrates that La is mainly located on the particle
surface.
3.2 Maximum phosphorus adsorption capacity of the adsorbents
P adsorption capacity of CFH-12®
, Phoslock® and Fe-Si-La (also bare commercial
Fe3O4 is studied) were assessed by modelling the adsorption data. Experimental data
were fit to Langmuir and Dubinin–Radushkevich (DR) adsorption isotherms (see solid
lines in Fig. 1). Langmuir isotherm model assumes a homogeneous adsorption surface
in which a monolayer of adsorbate is formed and is defined by the equation [4]:
[4]

14
where is the amount of adsorbed adsorbate at equilibrium (mg g-1
), (L g-1
) is an
adsorption constant related to the energy of adsorption, (mg g-1
) is an empirical
saturation constant that represents the maximum adsorption capacity and is the same
as in equation [1]. The DR equation is widely used to describe the pore filling
adsorption mechanism on microporous surfaces such as activated carbon, zeolites and
clays and it is represented by the equations [5] and [6] (Nguyen and Do, 2001;
Brezovska et al., 2004; Chen, 2015):
- [5]
[6]
where qs (mg P g-1
) is a constant representing the maximum adsorption capacity, KDR
(mol2 kJ
-2) is a constant related to the free energy of adsorption, R is the universal gas
constant (8.314 J mol-1
K-1
) and T (K) is the absolute temperature. Attending to r2
values, Phoslock® (a modified bentonite) showed a better fit to DR isotherm. These
results were expected as bentonite is a microporous material (Brezovska et al., 2004)
and accordingly, the adsorption process is well explained by the pore filling mechanism
described by DR isotherm. In contrast, CFH-12®
and Fe-Si-La (also Fe3O4) fit better to
Langmuir isotherm (SI Table S1). Comparison of the four adsorbents evidenced that
FeHQ had the highest adsorption capacity (18.8 mg g-1
; see de Vicente et al., 2010a),
followed by CFH-12® (15.1 mg g
-1), Phoslock
® (13.6 mg g
-1) and Fe-Si-La (6.7 mg g
-1).
As seen, Fe-Si-La showed higher adsorption capacity compared to bare Fe3O4 (5.85 mg
g-1
). In general, similar values were obtained in previous works for the same adsorbents.
The manufacturer reported a of 10.0 mg P g-1
for Phoslock® (CSIRO, Australia).
Fuchs et al. (2018) obtained a of 30.6 mg P g-1
for CFH-12® which is twice the
value of this work presumably due to longer contact time [3 months of exposure to 50

15
µM of dissolved inorganic P (DIP)]. However, the maximum P adsorption capacity of
our Fe-Si-La particles was much lower than that reported by Lai et al. (2016) with
similar particles (27.8 mg g-1
). This discrepancy may arise from differences in the
preparation method. In fact, a much lower La content is present in our Fe-Si-La particles
as indicated by ICP-MS (0.9% total La) and by XPS (5.3% of surface La content)
compared to Lai et al. (2016).
3.3 Factors affecting phosphorus adsorption
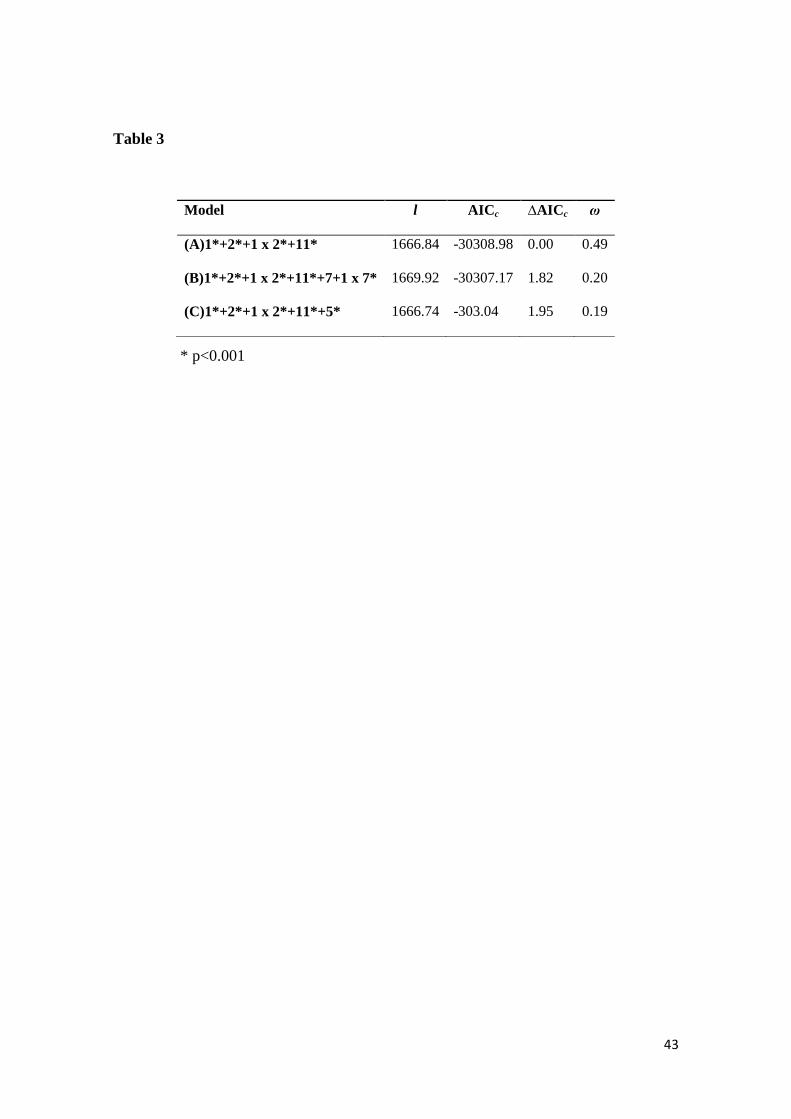
According to the AICc values and the Akaike weights (ω, conditional probabilities of
each model) of the models, three models received noticeable support and were
considered plausible to identify factors controlling P adsorption (Table 3). Model A had
the smallest AICc value (best model) and contained as independent variables: type of
adsorbent, adsorbent dosage, their interaction term (type of adsorbent x adsorbent
dosage) and . Additionally to the variables present in model A, model B included
NO3- concentration and the interaction NO3
- x type of adsorbent whereas model C added
color as independent variables. As a result, a final model containing all the variables
present in the three selected models was obtained. Results of the LMM are shown in
Table 4. As seen, all parameters except for NO3- (type of adsorbent, adsorbent dosage,
color and ) and the interactions included in the model had a significant effect (p <
0.05) on P adsorption. In the following sections the effect of each parameter is studied
in detail.
Results showed that none of the random factors showed a significant effect on P
adsorption (replicate: p = 0.813; lake: p = 1). These results allow us to extrapolate the
results obtained in the model to other lakes.

16
3.3.1 Effect of the type of adsorbent
As seen in Table 4, the type of adsorbent had a significant effect on P adsorption. P
removal efficiencies at low and high adsorbent dosage are represented for all the
adsorbents in Fig. 4. Data represent the average for all aquatic ecosystems. As expected,
those adsorbents with the highest maximum P adsorption capacities, CFH-12® and
Phoslock® (SI Table S1), showed the highest P removal efficiencies (> 85%). Fe-Si-La
was also very efficient with P removal efficiencies greater than 70% whereas FeHQ
showed the lowest (≤ 15%). Tukey's post hoc test (data not shown) showed that
Phoslock® removed significantly more P than CFH-12
®, Fe-Si-La and FeHQ (p = 0.037,
p = 0.01, p < 0.001, respectively). P removal was significantly lower for FeHQ
compared to the rest of the adsorbents (p < 0.001). This result is especially striking in
view of the high maximum P adsorption capacity of FeHQ (de Vicente et al., 2010a);
however different explanations can be suggested. First, the low adsorption capacity of
FeHQ (0.5 mg g-1
; de Vicente et al., 2010a) at low P concentrations (< 0.1 mM P)
compared to the rest of the adsorbents (1.6-2.5 mg g-1
; see Fig. 1). Second, the
adsorbent:P ratios used in this work (0.2 and 0.5 g mg-1
) are seven and three fold lower,
respectively, than the optimum adsorbent dosage (1.5 g mg-1
) calculated by Merino-
Martos et al. (2011) to efficiently remove P from solution. Even more, de Vicente et al.
(2011) applied much higher adsorbent dosages (6.45 and 25.81 g mg-1
) when using the
same particles to remove P from different natural aquatic ecosystems. Given the low P
removal by FeHQ, a complementary model was run in which FeHQ was removed,
determining that the type of adsorbent was not significant (p = 0.793) for the overall
model (data not shown). In this case, differences between the three other adsorbents are
not relevant as determined by Tukey's test (p = 0.622, p = 0.514, p = 0.877).

17
3.3.2 Effect of the adsorbent dosage
The adsorbent dosage is, as expected, a significant factor explaining the mass of
adsorbed P (Table 4). As seen in Fig. 4, the high adsorbent dosage led to higher P
removal efficiencies. Likewise, there is an interactive effect of the factors type of
adsorbent x adsorbent dosage on adsorbed P (Table 4). As a result, a post hoc analysis
of this interaction was carried out. Table 5 shows the results of simple main effects
interaction analysis for type of adsorbent x adsorbent dosage. In consequence, the effect
of adsorbent dosage at the different types of adsorbents was tested, and it was found that
the adsorbent dosage has a significant effect on adsorbed P (p < 0.001) when using
CFH-12®
and Fe-Si-La but not when using Phoslock® and FeHQ (p > 0.05).
Specifically, when comparing adsorbent dosages for CFH-12® (Fig. 4), we observed
that the high adsorbent dosage removed significantly more P (> 99% on average for all
the systems) than the low adsorbent dosage (86.1%). Similarly, when adding Fe-Si-La P
removal efficiencies were significantly higher for the high dosage (> 99%) than for the
low dosage (71.2%; Fig. 4). However, no differences in adsorbed P were found between
the high and low adsorbent dosage for the case of Phoslock® (97.5-99.1%) and FeHQ
(12.0-15.5%). Differences in the effect of adsorbent dosage on adsorbed P among the
studied adsorbents explain the significant interaction between the factors type of
adsorbent x adsorbent dosage obtained in the model.
3.3.3 Effect of the matrix
Among all the variables included in the model, and color in lake water were the
only ones related to water chemical composition that significantly affect adsorbed P
(Table 4). On the one hand, the coefficient for is positive, pointing out a positive
relationship between and the mass of adsorbed P. In particular, Phoslock®
showed
18
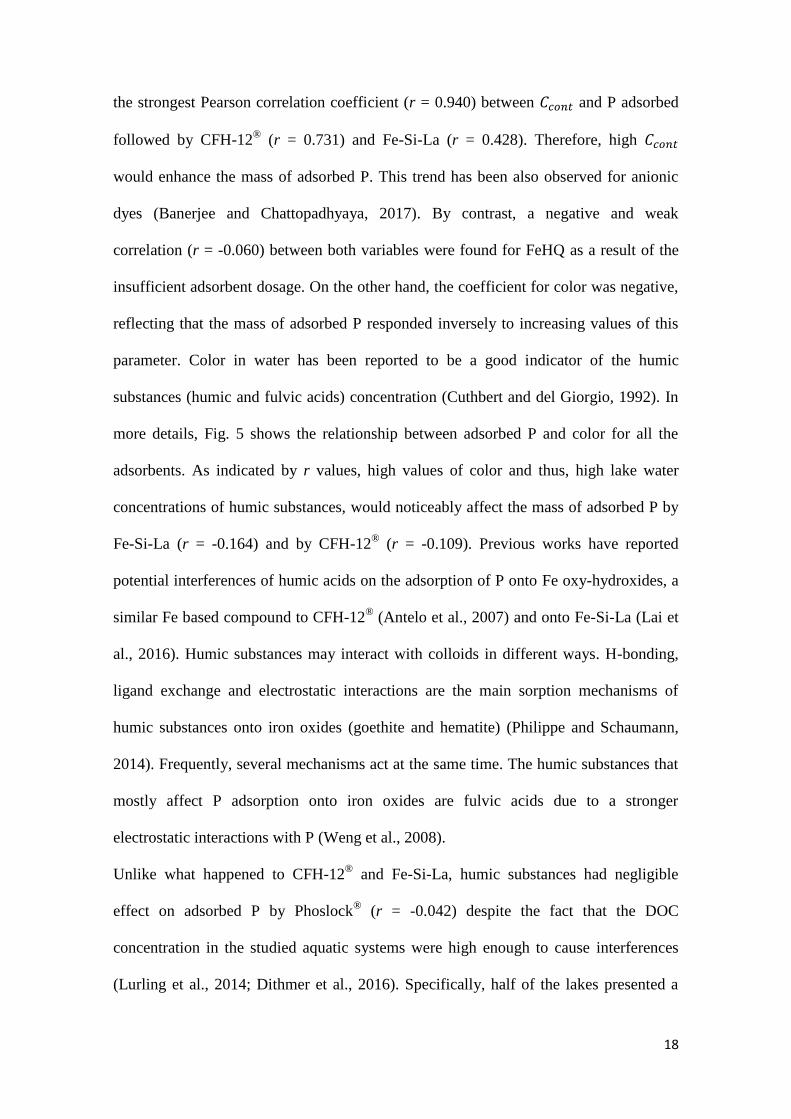
the strongest Pearson correlation coefficient (r = 0.940) between and P adsorbed
followed by CFH-12® (r = 0.731) and Fe-Si-La (r = 0.428). Therefore, high
would enhance the mass of adsorbed P. This trend has been also observed for anionic
dyes (Banerjee and Chattopadhyaya, 2017). By contrast, a negative and weak
correlation (r = -0.060) between both variables were found for FeHQ as a result of the
insufficient adsorbent dosage. On the other hand, the coefficient for color was negative,
reflecting that the mass of adsorbed P responded inversely to increasing values of this
parameter. Color in water has been reported to be a good indicator of the humic
substances (humic and fulvic acids) concentration (Cuthbert and del Giorgio, 1992). In
more details, Fig. 5 shows the relationship between adsorbed P and color for all the
adsorbents. As indicated by r values, high values of color and thus, high lake water
concentrations of humic substances, would noticeably affect the mass of adsorbed P by
Fe-Si-La (r = -0.164) and by CFH-12® (r = -0.109). Previous works have reported
potential interferences of humic acids on the adsorption of P onto Fe oxy-hydroxides, a
similar Fe based compound to CFH-12® (Antelo et al., 2007) and onto Fe-Si-La (Lai et
al., 2016). Humic substances may interact with colloids in different ways. H-bonding,
ligand exchange and electrostatic interactions are the main sorption mechanisms of
humic substances onto iron oxides (goethite and hematite) (Philippe and Schaumann,
2014). Frequently, several mechanisms act at the same time. The humic substances that
mostly affect P adsorption onto iron oxides are fulvic acids due to a stronger
electrostatic interactions with P (Weng et al., 2008).
Unlike what happened to CFH-12® and Fe-Si-La, humic substances had negligible
effect on adsorbed P by Phoslock® (r = -0.042) despite the fact that the DOC
concentration in the studied aquatic systems were high enough to cause interferences
(Lurling et al., 2014; Dithmer et al., 2016). Specifically, half of the lakes presented a

19
DOC concentrations between 1 to 10 mg L-1
and half presented values ranging from 10
to 30 mg L-1
except for Charca Suárez which showed much higher value (118 mg DOC
L-1
). Contrarily to our results, the competition of humic substances and P for the
adsorption sites on Phoslock® has been previously reported (Dithmer et al., 2016).
Similarly, Lurling et al. (2014) reported a reduced P binding by Phoslock (actually by
La which is the active ingredient) when DOC concentrations were as low as 2 mg L-1
and the effect became stronger when increasing up to 14 mg DOC L-1
. The stronger
effect of humic substances on P adsorption by CFH-12® and Fe-La-Si than by
Phoslock® may be explained by several reasons. Firstly, the high adsorption capacity of
Phoslock® compared to the others adsorbents (see SI Table S1). According to the
results, P removal by Phoslock® was not affected by coexisting ions and substances
(almost 100% of P removal whatever the adsorbent dosage and lake water) because
there are still free adsorption sites for P. However, in Fe-Si-La and CFH-12®, the
adsorption sites (OH functional groups) could be blocked by the presence of humic
substances and not available for P adsorption, thus reducing P removal efficiency (Lai
et al., 2016; Borggaard et al., 2005). A second explanation would be the lower affinity
of humic substances for clays compared to iron oxides due to the unfavourable
electrostatic pattern (Philippe and Schaumann, 2014). Another reason maybe that the
adsorption of humic substances on CFH-12®
and on Fe-Si-La could reduce their point
of zero charge (pzc) and increase electrostatic repulsion for the adsorption of anionic
phosphate (Antelo et al., 2007).
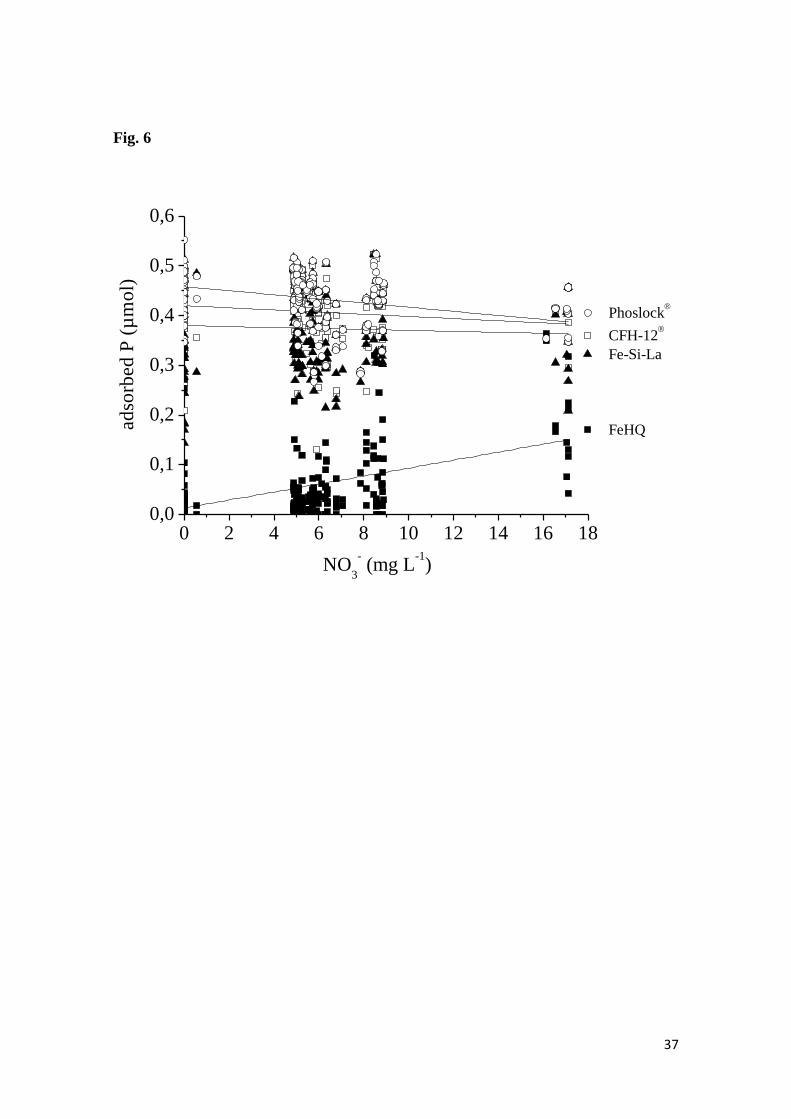
As seen in Table 4, there are not significant main effects of NO3- on the adsorbed P.
However, there is a significant effect of the interaction type of adsorbent x NO3-. This
means that the effect of NO3- on the adsorbed P depends on the type of adsorbent. Table
6 shows the post hoc analysis of this interaction in which the adjusted values of the

20
slope with respect to the adsorbed P for the level and contrasts of the type of adsorbent
are indicated. According to it, the proportional relation between NO3- and adsorbed P is
significantly greater (and direct, see Fig. 6) for FeHQ compared to the rest of adsorbents
(p < 0.001). Likewise, this proportional relation is significantly different (and negative,
see Fig. 6) for Phoslock® compared to CFH-12
® and Fe-Si-La (p < 0.05 and p < 0.01,
respectively). In fact, Table 7 points out that the relation between adsorbed P and NO3-
is only significant for FeHQ and Phoslock®. This result may have implications in lake
restoration. The efficiency of Phoslock in removing P could be reduced in lakes with
high NO3-
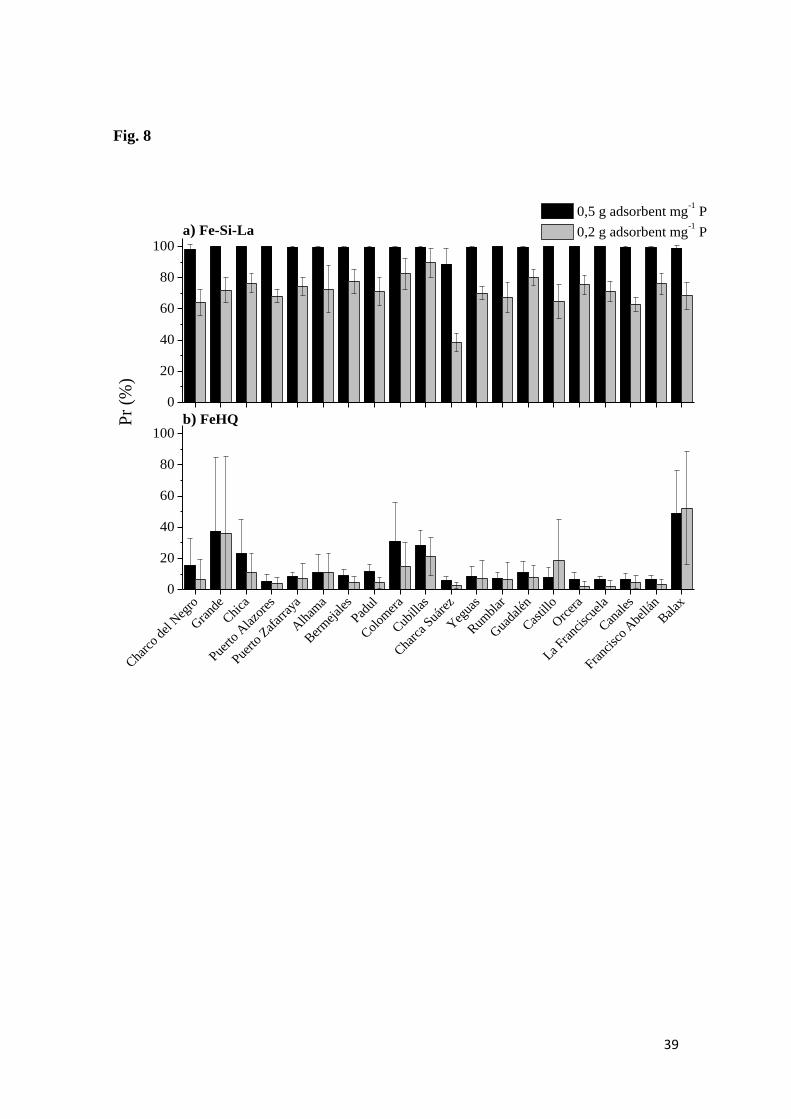
concentration whereas the efficiency of FeHQ would increase. Pr in each
aquatic ecosystem is shown in Fig. 7 and Fig. 8 for non-magnetic and magnetic
adsorbents, respectively. For CFH-12®, Pr was similar between lakes at low adsorbent
dosage. At high adsorbent dosage of CFH-12®, Charca Suárez showed the lowest Pr
(94.2%) compared to the highest value found in Grande, Padul and Cubillas (99%). For
Phoslock® and Fe-Si-La, Pr was similar across lakes at high adsorbent dosage but the
values were different at low adsorbent dosage. Pr by Phoslock® was slightly lower in
Charca Suárez (81.3%) compared to Balax (99.9%). Pr by Fe-Si-La was notably lower
in Charca Suárez (38.3%) and Canales (63.0%) compared to Colomera (82.6%),
Cubillas (89.5%) and Guadalén (80.0%). For the case of FeHQ, Pr was similar between
lakes at low adsorbent dosage whereas it was different at high adsorbent dosage, being
Pr much lower in Puerto de los Alazores (5.3%) compared to Balax (49.0%).
The lower Pr reported in Charca Suárez for all the adsorbents could be attributed to its
extremely high color value (10.31 m-1
), which ultimately reflects high humic substances
concentration (Cuthbert and del Giorgio, 1992). Similarly, and although As was not
selected in the model as explanatory variable for P adsorption, the high concentration of
this metal in Charca Suárez (11.7 µg L-1
) may have reduced adsorbed P by CFH-12®

21
due to competition. In fact, P and As have been reported to have a similar structure,
chemical reactivity and adsorption kinetic onto iron oxides (Luengo et al., 2007;
Lukkari et al., 2007).
4. Conclusions
For the practical application of novel P adsorbents used for lake restoration, it is
essential to assess the effects that natural substances/ions have on P removal efficiency.
In this study, adsorption experimental data from 20 aquatic ecosystems, have been used
for obtaining a linear mixed model. This novel methodological approach has determined
that the major drivers controlling P removal are: type of adsorbent, the adsorbent dosage
and the concentration of humic substances. The studied adsorbents showed the
following P removal efficiency order: Phoslock®
(~100%) > CFH-12®
(85-100%) > Fe-
Si-La (70-100%) > FeHQ (0-15%) for both adsorbent:P ratios 0.2 and 0.5 g mg-1
.
Phoslock® was the most efficient P adsorbent independently of adsorbent dosage and
water chemical composition. Contrarily to previous studies, FeHQ showed a low P
uptake due to a notable underdosing. P removal efficiency of CFH-12® and Fe-Si-La
was negatively affected by high color values (high humic substances). With regards to
the P removal efficiency, the non-magnetic adsorbents employed in this work were
more efficient than their magnetic counterparts. However, it is important to remark that
the former cannot be reused. All in all, differences in chemical properties -adsorption
capacity or surface charge- and the affinity to the adsorbate and to other substances/ions
play an important role in the performance of each adsorbent to remove P.
5. Acknowledgments

22
This work was supported by Junta de Andalucía project P10-RNM-6630 [Proyectos de
Excelencia, Spain]; MINECO CTM 2013-46951-R project; and MAT 2016-78778-R project
[Spain]. Authors would also like to thank Fernando Ortega for helping in the sampling
procedure.
6. References
Alcorlo, P., Baltanás, A., Montes, C., 1996. Is it possible to predict the salinity of
Iberian salt lakes from their conductivity ? Hydrobiologia 330, 137–142.
Álvarez-Cobelas, M., Rojo, C., Angeler, D.G., 2005. Mediterranean limnology: current
status, gaps and the future. Journal of Limnology 64, 13-29.
doi.org/10.4081/jlimnol.2005.13
Antelo, J., Arce, F., Avena, M., Fiol, S., López, R., Macías, F., 2007. Adsorption of a
soil humic acid at the surface of goethite and its competitive interaction with
phosphate. Geoderma 138, 12–19. doi:10.1016/j.geoderma.2006.10.011
APHA, 1995. Standard Methods for Examination of Water and Wastewater. 19th ed.
APHA-AWWA-WPCF, Washington, DC, USA.
Auvray, F., van Hullebusch, E.D., Deluchat, V., Baudu, M., 2006. Laboratory
investigation of the phosphorus removal (SRP and TP) from eutrophic lake water
treated with aluminium. Water Res. 40, 2713–2719.
doi:10.1016/j.watres.2006.04.042
Banerjee, S., Chattopadhyaya, M.C., 2017. Adsorption characteristics for the removal of
a toxic dye , tartrazine from aqueous solutions by a low cost agricultural by-
product. Arab. J. Chem. 10, S1629–S1638. doi:10.1016/j.arabjc.2013.06.005
Bartoń, K., 2012. MuMIn: Multi-model inference. R package version 1.7.2.
http://CRAN.R-project.org/package=MuMIn
Bates, D., Mächler, M., Bolker, B., Walker, S., 2015. Fitting linear mixed-effects

23
models using lme4. J. Stat. Soft. 67, 1–48. doi:10.18637/jss.v067.i01
Bennett, E.M., Carpenter, S.R., Caraco, N.F., 2001. Human Impact on Erodable
Phosphorus and Eutrophication : A Global Perspective. BioScience 51, 227–234.
Berkowitz, J., Anderson, M. A., Graham, R.C., 2005. Laboratory investigation of
aluminum solubility and solid-phase properties following alum treatment of lake
waters. Water Res. 39, 3918–3928. doi:10.1016/j.watres.2005.06.025
Bolker, B. M., Brooks, M. E., Clark, C. J., Geange, S. W., Poulsen, J. R., Stevens, M.
H. H., White, J. S. S., 2009. Generalized linear mixed models: a practical guide
for ecology and evolution. Trends Ecol. Evol. 24, 127-135.
Borggaard, O.K., Raben-Lange, B., Gimsing, A.L., Strobel, B.W., 2005. Influence of
humic substances on phosphate adsorption by aluminium and iron oxides.
Geoderma 127, 270–279. doi:10.1016/j.geoderma.2004.12.011
Brezovska, S., Marina, B., Panova, B., Burevski, D., Bosevska, V., Stojanovska, L.,
2004. The adsorption characteristics and porous structure of bentonite adsorbents
as determined from the adsorption isotherms of benzene vapor. J.Serb.Chem.Soic.
69, 145–151.
Burkholder, J. M. 2000. Eutrophication and oligotrophication, p. 649–670. In S. Levin
(ed.), Encyclop. Biodivers. Volume 2. Academic Press, New York.
Burnham, K. P., Anderson, D. R., 1998. Model selection and inference. A Practical
information-theoretic approach. 2nd edition. New York: Springer.
Carpenter, S.R., 2005. Eutrophication of aquatic ecosystems: bistability and soil
phosphorus. Proc. Natl. Acad. Sci. U. S. A. 102, 10002–10005.
doi:10.1073/pnas.0503959102
Chen, X., 2015. Modeling of experimental adsorption isotherm data. Information 6, 14–
22. doi:10.3390/info6010014

24
Cooke, G.D., Welch, E.B., Peterson, S.A., Nichols, S.A., 2005. Restoration and
Management of Lakes and Reservoirs, third ed. CRC Press, Boca Raton, FL, p.
548.
Copetti, D., Finsterle, K., Marziali, L., Stefani, F., Tartari, G., Douglas, G., Reitzel, K.,
Spears, B.M., Winfield, I.J., Crosa, G., D’Haese, P., Yasseri, S., Lürling, M.,
2016. Eutrophication management in surface waters using lanthanum modified
bentonite: a review. Water Res. 97, 162-174. doi:10.1016/j.watres.2015.11.056
Cordell, D., Drangert, J.O., White, S., 2009. The story of phosphorus: Global food
security and food for thought. Glob. Environ. Chang. 19, 292–305.
doi:10.1016/j.gloenvcha.2008.10.009
Cuthbert, I. D., del Giorgio, P., 1992. Towards a standard method of measuring color in
freshwater. Limnol. Oceanogr. 37, 1319–1326.
de Rosario-Martínez, HDR (2015). Analysing interactions of fitted models.
https://cran.r-project.org/web/packages/phia/vignettes/phia.pdf
de Vicente, I., Jensen, H.S., Andersen, F.Ø., 2008. Factors affecting phosphate
adsorption to aluminum in lake water: Implications for lake restoration. Sci. Total
Environ. 389, 29–36. doi:10.1016/j.scitotenv.2007.08.040
de Vicente, I., Merino-Martos, A., Cruz-Pizarro, L., de Vicente, J., 2010a. On the use of
magnetic nano and microparticles for lake restoration. J. Hazard. Mater. 181, 375–
381. doi:10.1016/j.jhazmat.2010.05.020
de Vicente, I., Ortega-Retuerta, E., Mazuecos, I., Pace, M., Cole, J., Reche, I., 2010b.
Variation in transparent exopolymer particles in relation to biological and
chemical factors in two contrasting lake districts. Aquat. Sci. 72, 443–453 443–
453. doi:10.1007/s00027-010-0147-6
de Vicente, I., Merino-Martos, A., Guerrero, F., Amores, V., de Vicente, J., 2011.

25
Chemical interferences when using high gradient magnetic separation for
phosphate removal: Consequences for lake restoration. J. Hazard. Mater. 192,
995–1001. doi:10.1016/j.jhazmat.2011.05.090
Deppe, T., Benndorf, J., 2002. Phosphorus reduction in a shallow hypereutrophic
reservoir by in-lake dosage of ferrous iron. Water Res. 36, 4525–4534.
doi:10.1016/S0043-1354(02)00193-8
Dithmer, L., Nielsen, U.G., Lundberg, D., Reitzel, K., 2016. Influence of dissolved
organic carbon on the efficiency of P sequestration by a lanthanum modified clay
97, 39–46. doi:10.1016/j.watres.2015.07.003
Feng, L., Cao, M., Ma, X., Zhu, Y., Hu, C., 2012. Superparamagnetic high-surface-area
Fe3O4 nanoparticles as adsorbents for arsenic removal. J. Hazard. Mater. 217,
439–446.Funes, A., Arco, A., Álvarez-Manzaneda, I., de Vicente, J., de Vicente,
I., 2017. A microcosm experiment to determine the consequences of magnetic
microparticles application on water quality and sediment phosphorus pools. Sci.
Total Environ. 579, 245–253. doi:10.1016/j.scitotenv.2016.11.120
Fuchs, E., Funes, A., Saar, K., Reitzel, K., Jensen, H.S., 2018. Evaluation of dried
amorphous ferric hydroxide CFH-12®
as agent for binding bioavailable
phosphorus in lake sediments. Sci. Total Environ. 628–629, 990–996.
doi:10.1016/j.scitotenv.2018.02.059
Funes, A., de Vicente, J., Cruz-Pizarro, L., de Vicente, I., 2014. The influence of pH on
manganese removal by magnetic microparticles in solution. Water Res. 53, 110–
122. doi:10.1016/j.watres.2014.01.029
Gibbs, M.M., 1979. A simple method for the rapid determination of iron in natural
waters. Water Res. 13, 295–297. doi:10.1016/0043-1354(79)90209-4
Gibbs, M., Özkundakci, D., 2011. Effects of a modified zeolite on P and N processes

26
and fluxes across the lake sediment-water interface using core incubations.
Hydrobiologia 661, 21–35. doi:10.1007/s10750-009-0071-8
Hothorn, T., Bretz, F., Westfall, P., Heiberger, R.M., Schuetzenmeister, A. 2013.
Package “multcomp”.
http://cran.rproject.org/web/packages/multcomp/multcomp.pdf
Hua, M., Zhang, S., Pan, B., Zhang, W., Lv, L., Zhang, Q., 2012. Heavy metal removal
from water/wastewater by nanosized metal oxides: a review. J. Hazard. Mater.
211, 317–331.
Hupfer, M., Hilt, S., 2008. Lake restoration. Encycl. Ecol. 2080–2093.
Huser, B.J., Egemose, S., Harper, H., Hupfer, M., Jensen, H., Pilgrim, K.M., Reitzel,
K., Rydin, E., Futter, M., 2016. Longevity and effectiveness of aluminum addition
to reduce sediment phosphorus release and restore lake water quality. Water Res.
97, 122–132. doi:10.1016/j.watres.2015.06.051
Illés, E., Tombácz, E., 2004. The role of variable surface charge and surface
complexation in the adsorption of humic acid on magnetite. Colloids Surfaces A
Physicochem. Eng. Asp. 230, 99–109. doi:10.1016/j.colsurfa.2003.09.017
Lai, L., Xie, Q., Chi, L., Gu, W., Wu, D., 2016. Adsorption of phosphate from water by
easily separable Fe3O4@SiO2 core/shell magnetic nanoparticles functionalized
with hydrous lanthanum oxide. J. Colloid Interface Sci. 465, 76–82.
doi:10.1016/j.jcis.2015.11.043
Li, M., Liu, J., Xu, Y., Qian, G., 2016. Phosphate adsorption on metal oxides and metal
hydroxides : A comparative review. Environ. Rev. 24, 1–14. doi:10.1139/er-2015-
0080
Luengo, C., Brigante, M., Avena, M., 2007. Adsorption kinetics of phosphate and
arsenate on goethite. A comparative study 311, 354–360.
27
doi:10.1016/j.jcis.2007.03.027
Lukkari, K., Hartikainen, H., Leivuori, M., 2007. Fractionation of sediment phosphorus
revisited. I : Fractionation steps and their biogeochemical basis. Limnol.
Oceanogr. Methods 5, 433–444.
Lürling, M., Waajen, G., Van Oosterhout, F., 2014. Humic substances interfere with
phosphate removal by lanthanum modified clay in controlling eutrophication.
Water Res. 54, 78–88. doi:10.1016/j.watres.2014.01.059
Lyngsie, G., Borggaard, O.K., Hansen, H.C.B., 2014. A three-step test of phosphate
sorption efficiency of potential agricultural drainage filter materials. Water Res.
51, 256–265. doi:10.1016/j.watres.2013.10.061
Meis, S., Spears, B.M., Maberly, S.C., O’Malley, M.B., Perkins, R.G., 2012. Sediment
amendment with Phoslock® in Clatto Reservoir (Dundee, UK): Investigating
changes in sediment elemental composition and phosphorus fractionation. J.
Environ. Manage. 93, 185–193. doi:10.1016/j.jenvman.2011.09.015
Merino-Martos, A., de Vicente, J., Cruz-Pizarro, L., de Vicente, I., 2011. Setting up
High Gradient Magnetic Separation for combating eutrophication of inland
waters. J. Hazard. Mater. 186, 2068–2074. doi:10.1016/j.jhazmat.2010.12.118
Merino-Martos, A., de Vicente, J., Cruz-Pizarro, L., de Vicente, I., 2015. Single-ion
interferences when using magnetic microparticles for phosphorus removal in
aquatic ecosystems. Limnetica 34, 17–28.
Murphy, J., Riley, J.P., 1962. A modified single solution method for the determination
of phosphate in natural waters. Anal. Chim. Acta 27, 31–36. doi:10.1016/S0003-
2670(00)88444-5
Nguyen, C., Do, D.D., 2001. The Dubinin – Radushkevich equation and the underlying
microscopic adsorption description. Carbon 39, 1327–1336.

28
Philippe, A., Schaumann, G.E., 2014. Interactions of dissolved organic matter with
natural and engineered inorganic colloids : A Review. Environ. Sci. Technol. 48,
8946-8962. dx.doi.org/10.1021/es502342r
Posada, D., Buckley, T.R., 2004. Model selection and model averaging in
phylogenetics: advantages of Akaike Information Criterion and bayesian
approaches over likelihood ratio tests. Syst. Biol., 53, 793-808.
R Core Team, 2017. R: A language and environment for statistical computing. R
Foundation for Statistical Computing, Vienna, Austria. https://www.R-
project.org/.
Reche, I., Pace, M.L., 2002. Linking dynamics of dissolved organic carbon in a forested
lake with environmental factors. Biogeochemistry 61, 21–36.
doi:10.1023/A:1020234900383
Reitzel, K., Andersen, F.Ø., Egemose, S., Jensen, H.S., 2013. Phosphate adsorption by
lanthanum modified bentonite clay in fresh and brackish water. Water Res. 47,
2787–2796. doi:10.1016/j.watres.2013.02.051
Robb, M., Greenop, B., Goss, Z., Douglas, G., Adeney, J., 2003. Application of
PhoslockTM
, an innovative phosphorus binding clay, to two Western Australian
waterways: Preliminary findings. Hydrobiologia 494, 237–243.
http://doi.org/10.1023/A:1025478618611
Schindler, D.W., 2006. Recent advances in the understanding and management of
eutrophication. Limnology and Oceanography 51, 356-363.
10.4319/lo.2006.51.1_part_2.0356
Sigg, L., Stumm, W., 1981. The interaction of anions and weak acids with the hydrous
goethite (α-FeOOH) surface. Coll. Surf. 2, 101–117. doi:10.1016/0166-
6622(81)80001-7

29
Smith, V H., 2009. Eutrophication. In: Gene E. Likens, (Editor) Encyclopedia of Inland
Waters. Volume 3, pp. 61–73 Oxford: Elsevier.
Veli, S., Alyüz, B., 2007. Adsorption of copper and zinc from aqueous solutions by
using natural clay. J. Hazard. Mater. 149(1), 226–233.
Weng, L., van Riemsdijk, W.H., Hiemstra, T., 2008. Humic nanoparticles at the oxide -
water interface : interactions with phosphate ion adsorption. Environ. Sci.
Technol. 42, 8747–8752.
Zamparas, M., Drosos, M., Georgiou, Y., Deligiannakis, Y., Zacharias, I., 2013. A
novel bentonite-humic acid composite material Bephos® for removal of phosphate
and ammonium from eutrophic waters. Chem. Eng. J. 225, 43–51.
doi:10.1016/j.cej.2013.03.064

30
Figures
Fig. 1. Adsorption isotherms of the four adsorbents. Adsorbent concentration 1 g L-1
;
pH =7. Standard deviation is represented by vertical bars.
Fig. 2. SEM image of Fe-Si-La particles.
Fig. 3. Magnetization curves of bare Fe3O4 and Fe-Si-La particles at 293K.

31
Fig. 4. P removal efficiency (Pr in %) for the merged data of all studied systems as a
function of type of adsorbent and adsorbent dosage. Standard deviation is represented
by vertical bars.
Fig. 5. Relation between adsorbed P and color for the four studied adsorbents. r is the
Pearson correlation coefficient. The y-axis values are power-transformed (x2).
Fig. 6. Relation between adsorbed P and NO3- for the four studied adsorbents. r is the
Pearson correlation coefficient. The y-axis values are power-transformed (x2).
Fig. 7. P removal efficiency (Pr in %) of non magnetic adsorbents (CFH-12® and
Phoslock®) for each lake. High adsorbent dosage in black and low in grey. Standard
deviation is represented by vertical bars.
Fig. 8. P removal efficiency (Pr in %) of magnetic adsorbents (Fe-Si-La and FeHQ) for
each lake. High adsorbent dosage in black and low in grey. Standard deviation is
represented by vertical bars.

32
Fig. 1
0 5 10 15 20 25 30 35 40
0
3
6
9
12
15 CFH-12
Phoslock
Fe-Si-La
Fe3O
4
q (
mg
P g
-1)
Ce (mg P L
-1)

33
Fig.2
34
Fig.3
-4000 -2000 0 2000 4000
-100
-80
-60
-40
-20
0
20
40
60
80
100 Fe3O
4
Fe-Si-La
M (
emu
g-1
)
H (kA m-1)

35
Fig. 4
Low High0
20
40
60
80
100 CFH-12
Phoslock
Fe-Si-La
FeHQ
Pr
(%)

36
Fig. 5
0 2 4 6 8 10 120,00
0,05
0,10
0,15
0,20
0,25
0,30
CFH-12
Phoslock
Fe-La-Si
FeHQ
Color (m-1
)
ad
sorb
ed
P (
mo
l)
r = -0,164
r = -0,109
r = -0,042
r = 0,057
37
Fig. 6
0 2 4 6 8 10 12 14 16 180,0
0,1
0,2
0,3
0,4
0,5
0,6
NO3
- (mg L
-1)
ad
sorb
ed
P (
µm
ol)
Phoslock
CFH-12
Fe-Si-La
FeHQ

38
Fig. 7
0
20
40
60
80
100
b) Phoslock
a) CFH-12
Pr
(%)
0,5 g adsorbent mg-1 P
0,2 g adsorbent mg-1 P
Cha
rco
del N
egro
Gra
nde
Chi
ca
Puerto
Ala
zore
s
Puerto
Zaf
arra
ya
Alh
ama
Ber
mej
ales
Padul
Col
omer
a
Cub
illas
Cha
rca Suá
rez
Yeg
uas
Rum
blar
Gua
dalé
n
Cas
tillo
Orc
era
La Fra
nciscu
ela
Can
ales
Franc
isco
Abe
llán
Bal
ax0
20
40
60
80
100
39
Fig. 8
0
20
40
60
80
100a) Fe-Si-La
b) FeHQ
0,5 g adsorbent mg-1 P
0,2 g adsorbent mg-1 P
Cha
rco
del N
egro
Gra
nde
Chi
ca
Puerto
Ala
zore
s
Puerto
Zaf
arra
ya
Alh
ama
Ber
mej
ales
Padul
Col
omer
a
Cub
illas
Cha
rca Suá
rez
Yeg
uas
Rum
blar
Gua
dalé
n
Cas
tillo
Orc
era
La Fra
nciscu
ela
Can
ales
Franc
isco
Abe
llán
Bal
ax0
20
40
60
80
100
Pr
(%)

40
Tables
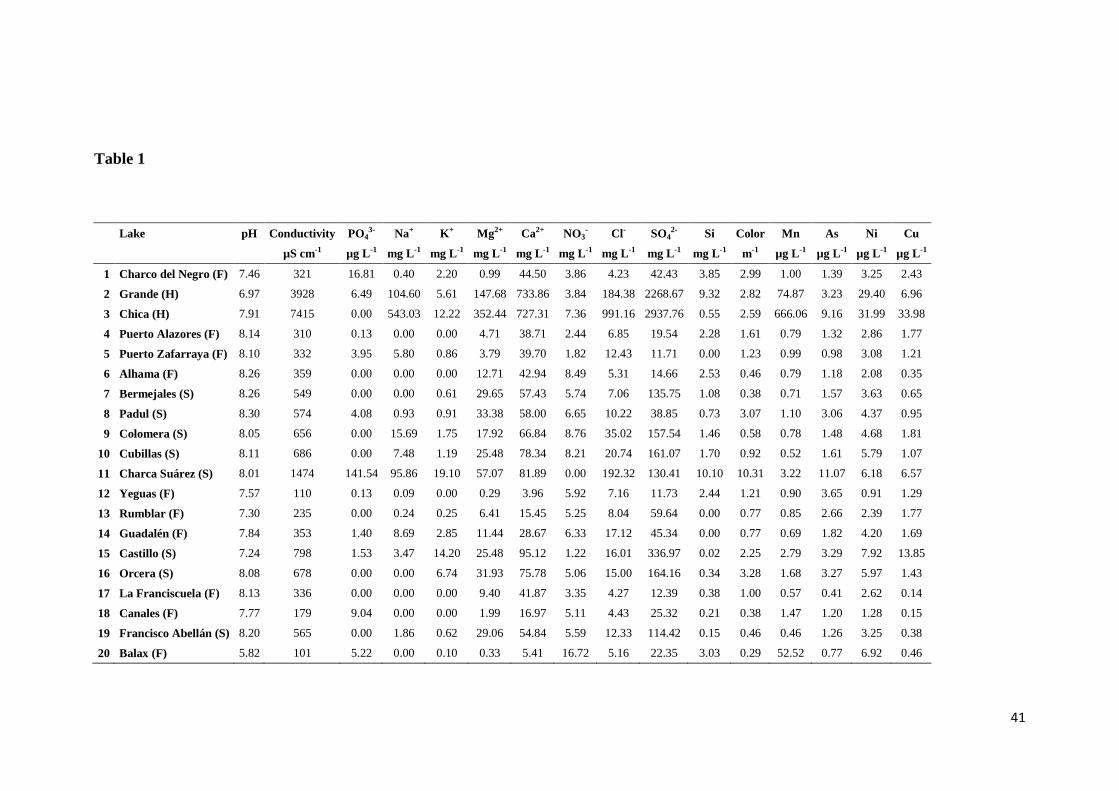
Table 1. Chemical characterization of the studied lakes (average values of four
analysis). The aquatic systems were classified according to Hammer et al. (1986) as
freshwater (F), subsaline (S) or hyposaline (H) systems.
Table 2. Surface chemical composition (%) of bare Fe3O4 and Fe-Si-La particles by
XPS.
Table 3. Best models predicting P adsorption obtained through model selection (∆AICc
< 2). AICc values, AICc differences (∆) and Akaike weights (ω) of the subset of models
generated. l is the maximized log likelihood. (1) type of adsorbent, (2) adsorbent dose,
(5) color, (7) NO3- and (11) Ccont.
Table 4. Model coefficients. Estimate (the model-based estimate for the coefficient for
each parameter without weighting), standard error (SE), associated Wald's z score (z)
and significance level (p) for the fixed factors explaining P adsorption.
Table 5. Post hoc analysis of the simple main effects for the interaction type adsorbent x
adsorbent dosage. The Holm's method correction of p was used to protect the family-
wise error rate.
Table 6. Post hoc analysis of the pairwise comparisons between the types of adsorbent
for the interaction type adsorbent x NO3-. The Holm's method correction of p was used
to protect the family-wise error rate.
Table 7. Relationships of each type of adsorbent with NO3- concentration for the
interaction type adsorbent x NO3-.
41
Table 1
Lake pH Conductivity PO43- Na+ K+ Mg2+ Ca2+ NO3
- Cl- SO42- Si Color Mn As Ni Cu
µS cm-1 µg L-1 mg L-1 mg L-1 mg L-1 mg L-1 mg L-1 mg L-1 mg L-1 mg L-1 m-1 µg L-1 µg L-1 µg L-1 µg L-1
1 Charco del Negro (F) 7.46 321 16.81 0.40 2.20 0.99 44.50 3.86 4.23 42.43 3.85 2.99 1.00 1.39 3.25 2.43
2 Grande (H) 6.97 3928 6.49 104.60 5.61 147.68 733.86 3.84 184.38 2268.67 9.32 2.82 74.87 3.23 29.40 6.96
3 Chica (H) 7.91 7415 0.00 543.03 12.22 352.44 727.31 7.36 991.16 2937.76 0.55 2.59 666.06 9.16 31.99 33.98
4 Puerto Alazores (F) 8.14 310 0.13 0.00 0.00 4.71 38.71 2.44 6.85 19.54 2.28 1.61 0.79 1.32 2.86 1.77
5 Puerto Zafarraya (F) 8.10 332 3.95 5.80 0.86 3.79 39.70 1.82 12.43 11.71 0.00 1.23 0.99 0.98 3.08 1.21
6 Alhama (F) 8.26 359 0.00 0.00 0.00 12.71 42.94 8.49 5.31 14.66 2.53 0.46 0.79 1.18 2.08 0.35
7 Bermejales (S) 8.26 549 0.00 0.00 0.61 29.65 57.43 5.74 7.06 135.75 1.08 0.38 0.71 1.57 3.63 0.65
8 Padul (S) 8.30 574 4.08 0.93 0.91 33.38 58.00 6.65 10.22 38.85 0.73 3.07 1.10 3.06 4.37 0.95
9 Colomera (S) 8.05 656 0.00 15.69 1.75 17.92 66.84 8.76 35.02 157.54 1.46 0.58 0.78 1.48 4.68 1.81
10 Cubillas (S) 8.11 686 0.00 7.48 1.19 25.48 78.34 8.21 20.74 161.07 1.70 0.92 0.52 1.61 5.79 1.07
11 Charca Suárez (S) 8.01 1474 141.54 95.86 19.10 57.07 81.89 0.00 192.32 130.41 10.10 10.31 3.22 11.07 6.18 6.57
12 Yeguas (F) 7.57 110 0.13 0.09 0.00 0.29 3.96 5.92 7.16 11.73 2.44 1.21 0.90 3.65 0.91 1.29
13 Rumblar (F) 7.30 235 0.00 0.24 0.25 6.41 15.45 5.25 8.04 59.64 0.00 0.77 0.85 2.66 2.39 1.77
14 Guadalén (F) 7.84 353 1.40 8.69 2.85 11.44 28.67 6.33 17.12 45.34 0.00 0.77 0.69 1.82 4.20 1.69
15 Castillo (S) 7.24 798 1.53 3.47 14.20 25.48 95.12 1.22 16.01 336.97 0.02 2.25 2.79 3.29 7.92 13.85
16 Orcera (S) 8.08 678 0.00 0.00 6.74 31.93 75.78 5.06 15.00 164.16 0.34 3.28 1.68 3.27 5.97 1.43
17 La Franciscuela (F) 8.13 336 0.00 0.00 0.00 9.40 41.87 3.35 4.27 12.39 0.38 1.00 0.57 0.41 2.62 0.14
18 Canales (F) 7.77 179 9.04 0.00 0.00 1.99 16.97 5.11 4.43 25.32 0.21 0.38 1.47 1.20 1.28 0.15
19 Francisco Abellán (S) 8.20 565 0.00 1.86 0.62 29.06 54.84 5.59 12.33 114.42 0.15 0.46 0.46 1.26 3.25 0.38
20 Balax (F) 5.82 101 5.22 0.00 0.10 0.33 5.41 16.72 5.16 22.35 3.03 0.29 52.52 0.77 6.92 0.46
42
Table 2
Fe O C Si La
Fe3O4 9.63 31.41 58.96 - -
Fe-Si-La 3.54 49.52 28.59 13.00 5.34
43
Table 3
* p<0.001
Model l AICc ∆AICc ω
(A)1*+2*+1 x 2*+11* 1666.84 -30308.98 0.00 0.49
(B)1*+2*+1 x 2*+11*+7+1 x 7* 1669.92 -30307.17 1.82 0.20
(C)1*+2*+1 x 2*+11*+5* 1666.74 -303.04 1.95 0.19

44
Table 4
Fixed Factors df χ2 p
Intercept
Type of adsorbent 3 2663.60 < 0.001
Adsorbent dosage 1 156.66 < 0.001
Ccont 1 794.28 < 0.001
Color 1 39.36 < 0.001
NO3- 1 0.21 0.6
Type of adsorbent x NO3- 3 50.26 < 0.001
Type of adsorbent x adsorbent dosage 3 509.95 < 0.001

45
Table 5
Value df χ2 p
CFH-12®
0.0416 1 156.66 < 0.001
Phoslock® 0.0063 1 3.80 0.102
Fe-Si-La 0.0949 1 807.43 < 0.001
FeHQ 0.0008 1 0.05 0.819

46
Table 6
Value df χ2 p
CFH-12®
- Fe-Si-La -0.0006 1 0.78 0.376
CFH-12®
- FeHQ -0.0030 1 21.33 < 0.001
CFH-12®
- Phoslock® 0.0014 1 5.22 < 0.050
Phoslock®
- FeHQ 0.0044 1 48.79 < 0.001
Phoslock®
- Fe-Si-La 0.0020 1 10.14 < 0.010
Fe-Si-La - FeHQ 0.0024 1 13.92 < 0.001

47
1
Table 7 2
Value df χ2 p
CFH-12®
-0.0002 1 0.21 0.936
Phoslock® -0.0017 1 12.83 < 0.010
Fe-Si-La 0.0003 1 0.53 0.936
FeHQ 0.0028 1 32.41 < 0.001
3
4
5
6